Embed Size (px)
Citation preview
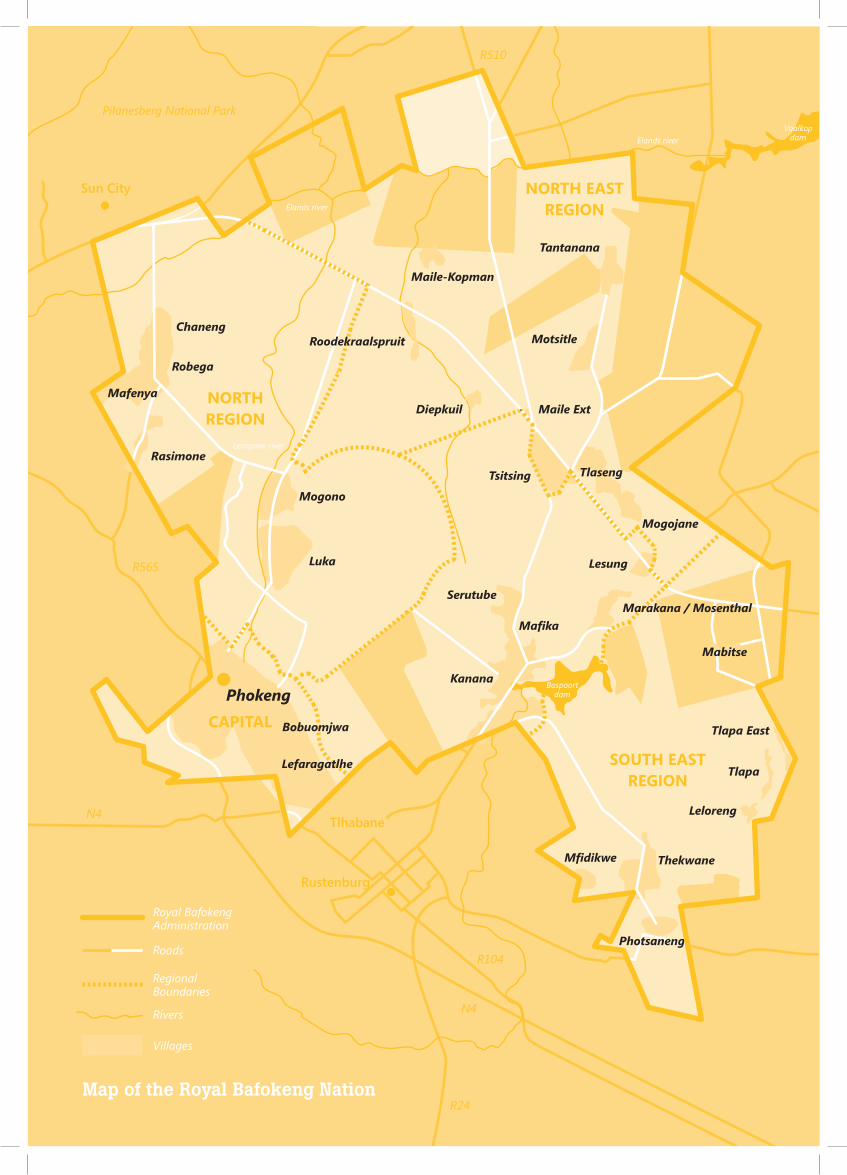
Sun City
Pilanesberg National Park
Chaneng
Robega
Maile-Kopman
Tantanana
Motsitle
Diepkuil Maile Ext
Tsitsing Tlaseng
Mogojane
Lesung
Serutube
Mafika
Kanana
Mabitse
Tlapa East
Leloreng
Thekwane
Photsaneng
Mfidikwe
Rustenburg
Tlhabane
Royal BafokengAdministration
Roads
Regional Boundaries
Rivers
Villages
Phokeng
Luka
Mogono
Tlapa
NORTH EAST REGION
SOUTH EAST REGION
CAPITAL
Rasimone
NORTHREGION
Vaalkop damElands river
Elands river
Leragane river
N4
N4
R24
R104
R565
R510
Map of the Royal Bafokeng Nation
Bobuomjwa
Bospoort dam
Marakana / Mosenthal
Lefaragatlhe
Mafenya
Roodekraalspruit
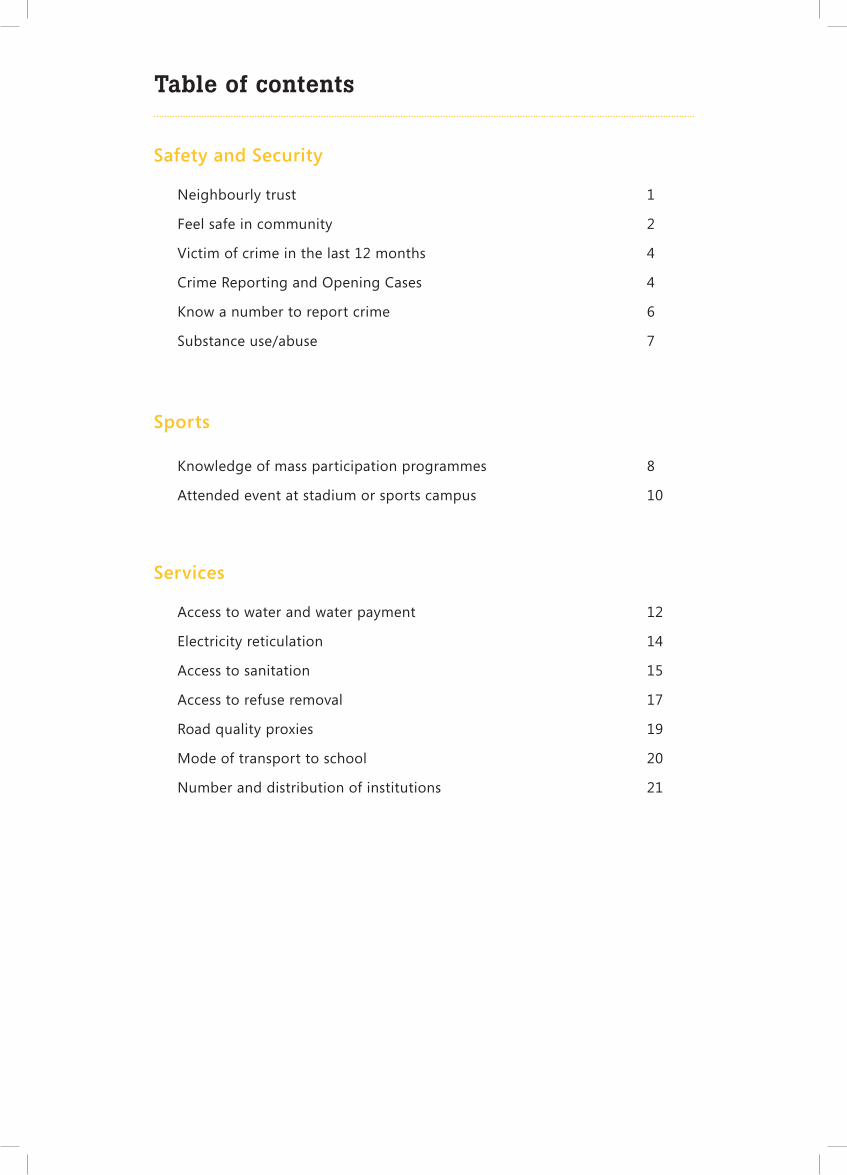
Table of contents
Access to water and water payment 12
Electricity reticulation 14
Access to sanitation 15
Access to refuse removal 17
Road quality proxies 19
Mode of transport to school 20
Number and distribution of institutions 21
Services
Neighbourly trust 1
Feel safe in community 2
Victim of crime in the last 12 months 4
Crime Reporting and Opening Cases 4
Know a number to report crime 6
Substance use/abuse 7
Knowledge of mass participation programmes 8
Attended event at stadium or sports campus 10
Safety and Security
Sports
Perceptions of households’ financial situation 22
Perceptions of the local school system 23 Perceptions of the health care system available to RBN residents 24
Perceptions of the medication available to rape victims 25
Perceptions of sexual risk behaviours 26
Importance of the natural environment 28
Perceptions and opinions of the value of the flagship assets of the RBN, and the appropriateness of these investments 29
General Perceptions
Question wording
Findings / Answer
Comparison
Definition / Explanation
Caveat / Take note
Icon identification
1
Neighbourly trust
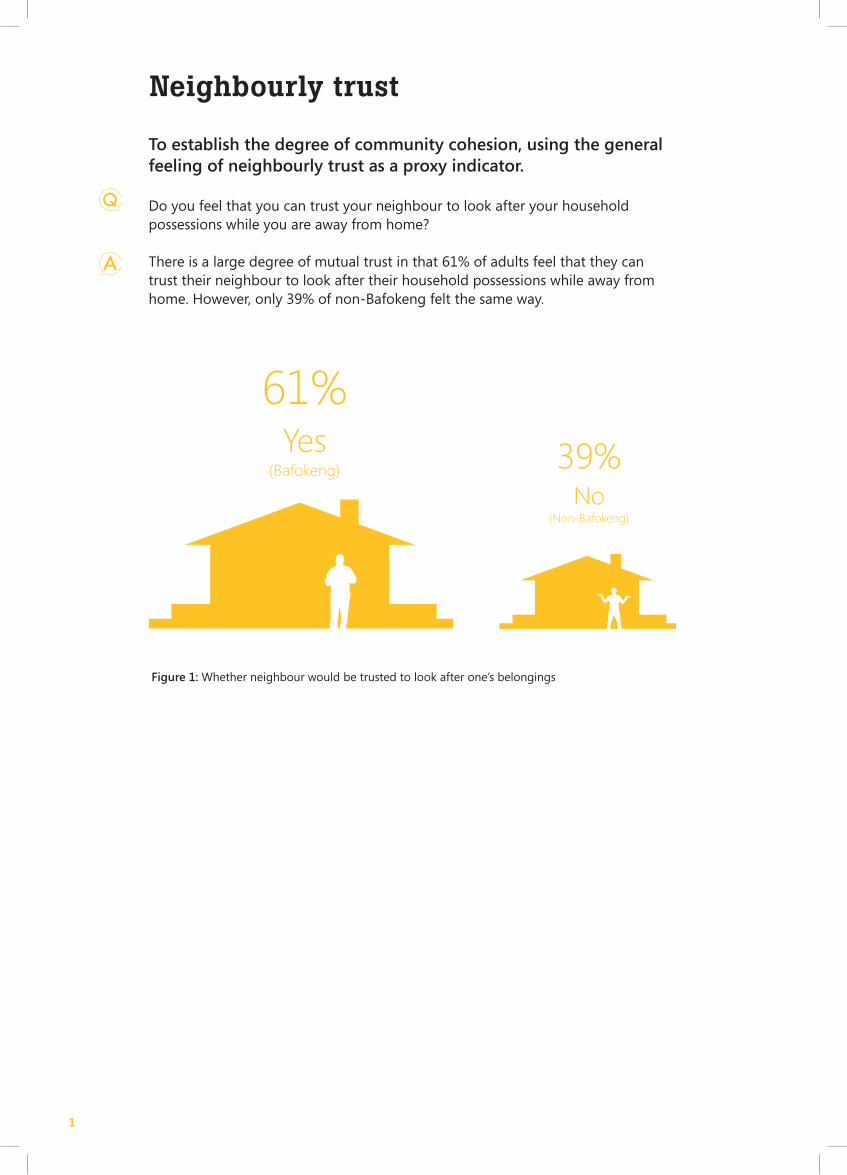
To establish the degree of community cohesion, using the general feeling of neighbourly trust as a proxy indicator.
Do you feel that you can trust your neighbour to look after your household possessions while you are away from home?
There is a large degree of mutual trust in that 61% of adults feel that they can trust their neighbour to look after their household possessions while away from home. However, only 39% of non-Bafokeng felt the same way.
Figure 1: Whether neighbour would be trusted to look after one’s belongings
61%
Yes(Bafokeng) 39%
No
(Non-Bafokeng)
2
Ser
vice
s //
/ N
eig
hb
ou
rly
tru
st &
Fee
l sa
fe i
n t
he
com
mu
nit
y
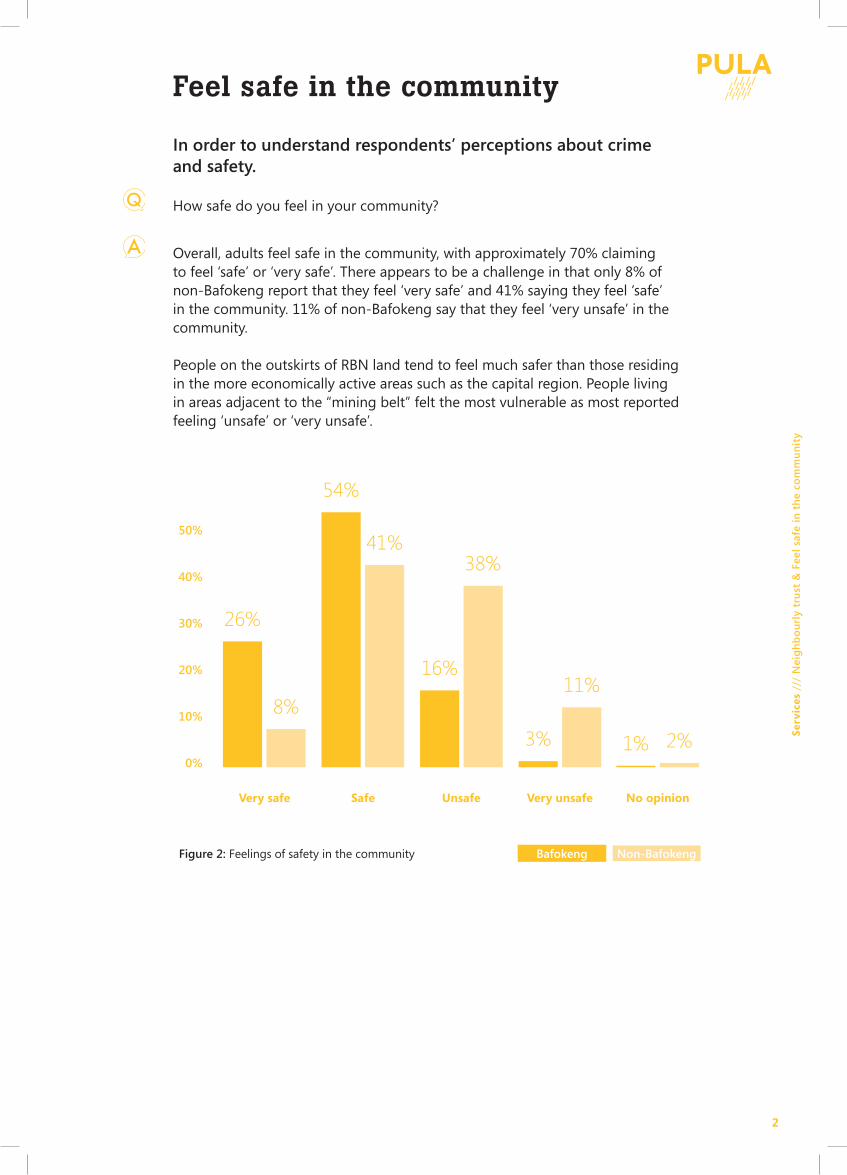
Overall, adults feel safe in the community, with approximately 70% claiming to feel ‘safe’ or ‘very safe’. There appears to be a challenge in that only 8% of non-Bafokeng report that they feel ‘very safe’ and 41% saying they feel ‘safe’ in the community. 11% of non-Bafokeng say that they feel ‘very unsafe’ in the community.
People on the outskirts of RBN land tend to feel much safer than those residing in the more economically active areas such as the capital region. People living in areas adjacent to the “mining belt” felt the most vulnerable as most reported feeling ‘unsafe’ or ‘very unsafe’.
Feel safe in the community
In order to understand respondents’ perceptions about crime and safety.
How safe do you feel in your community?
Figure 2: Feelings of safety in the community
50%
40%
30%
20%
10%
0%
26%
8%
54%
41%
16%
38%
3%
11%
1% 2%
Very safe Safe Unsafe Very unsafe No opinion
Bafokeng Non-Bafokeng
3
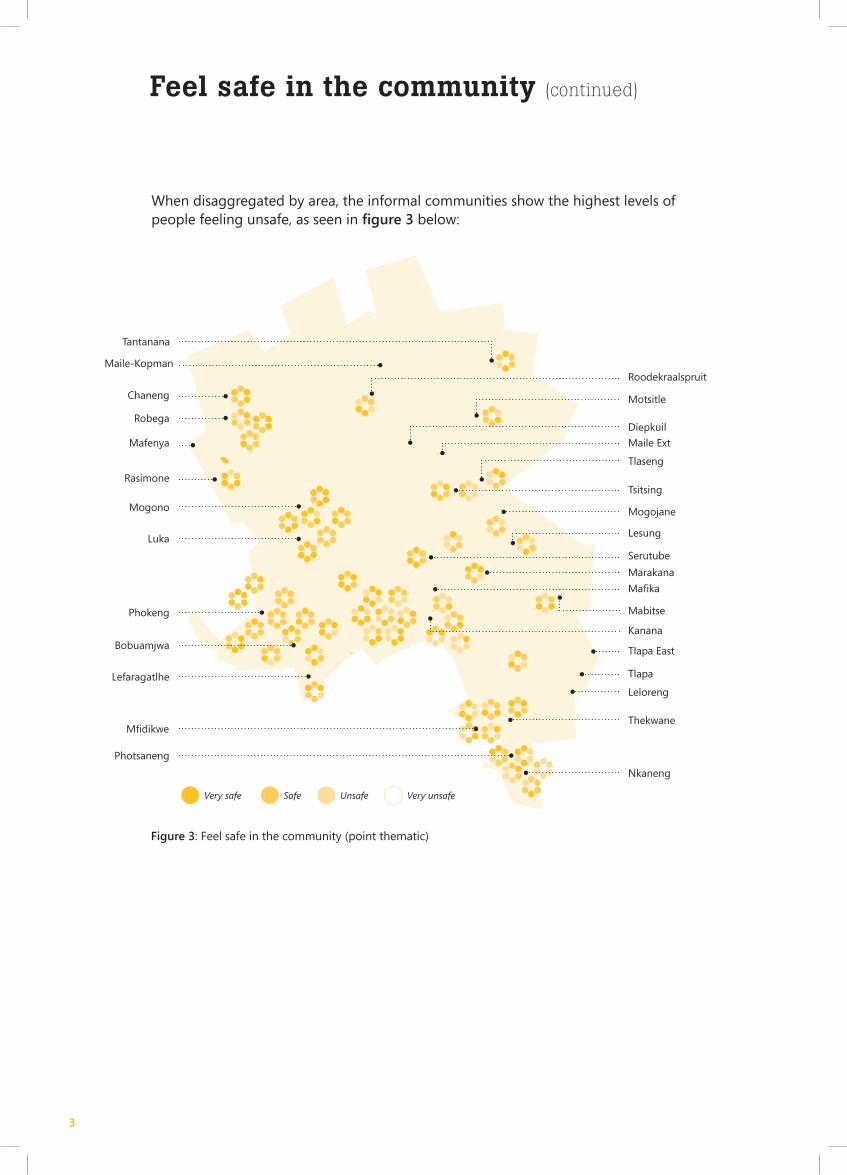
When disaggregated by area, the informal communities show the highest levels of people feeling unsafe, as seen in figure 3 below:
Figure 3: Feel safe in the community (point thematic)
Tantanana
Chaneng
Lefaragatlhe
Bobuamjwa
Phokeng
Luka
Mogono
Mafenya
Rasimone
RoodekraalspruitMaile-Kopman
Motsitle
Diepkuil
Maile Ext
Tsitsing
Tlaseng
Mogojane
Lesung
Serutube
Mafika
Kanana
Marakana
Mabitse
Tlapa East
Leloreng
Thekwane
Nkaneng
Photsaneng
Mfidikwe
Tlapa
Robega
Very safe Safe Unsafe Very unsafe
Feel safe in the community (continued)
4
Go
vern
ance
, H
erit
age
and
Cu
ltu
re /
// V
icti
m o
f cr
ime
& C
rim
e re
po
rtin
g a
nd
op
enei
ng
cas
es
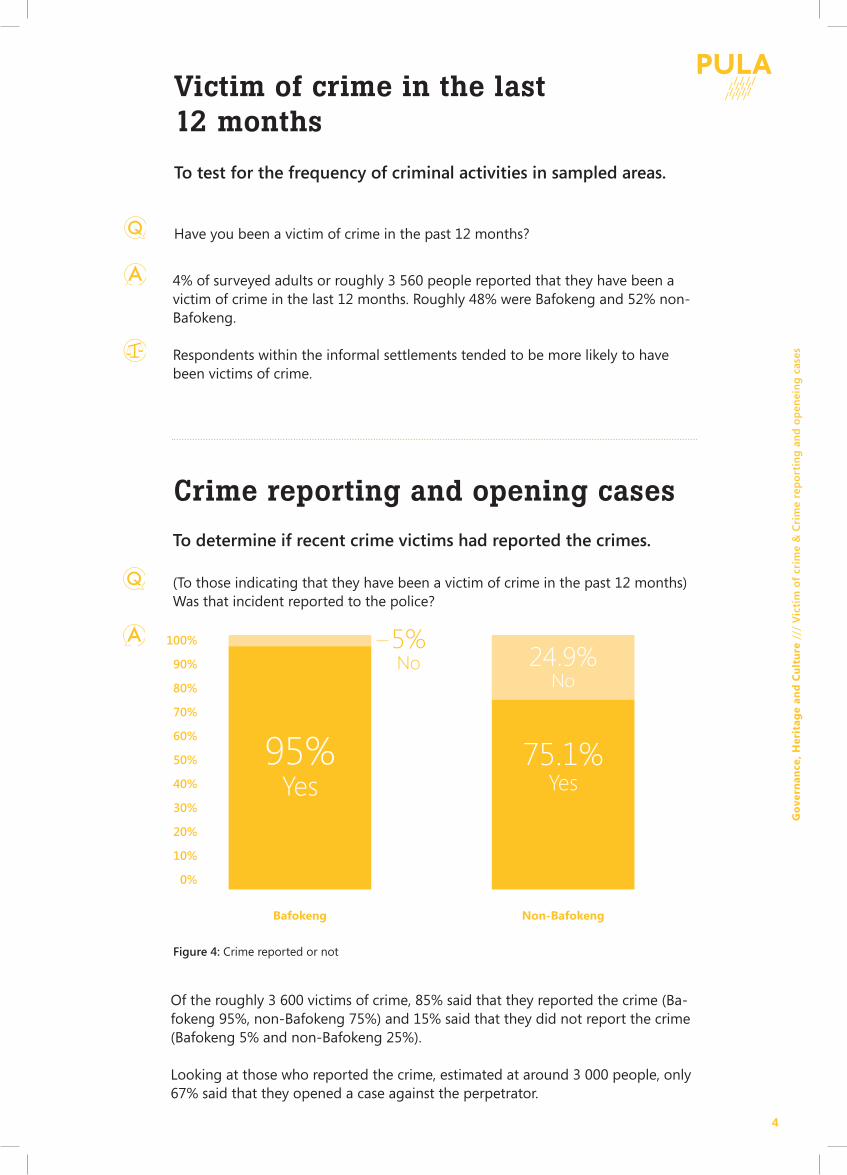
4% of surveyed adults or roughly 3 560 people reported that they have been a victim of crime in the last 12 months. Roughly 48% were Bafokeng and 52% non-Bafokeng.
Respondents within the informal settlements tended to be more likely to have been victims of crime.
Victim of crime in the last 12 months
To test for the frequency of criminal activities in sampled areas.
Have you been a victim of crime in the past 12 months?
5%No 24.9%
No
95%Yes
75.1%Yes
100%
90%
80%
70%
60%
50%
40%
30%
20%
10%
0%
Bafokeng Non-Bafokeng
Crime reporting and opening cases
To determine if recent crime victims had reported the crimes.
(To those indicating that they have been a victim of crime in the past 12 months) Was that incident reported to the police?
Figure 4: Crime reported or not
Of the roughly 3 600 victims of crime, 85% said that they reported the crime (Ba-fokeng 95%, non-Bafokeng 75%) and 15% said that they did not report the crime (Bafokeng 5% and non-Bafokeng 25%).
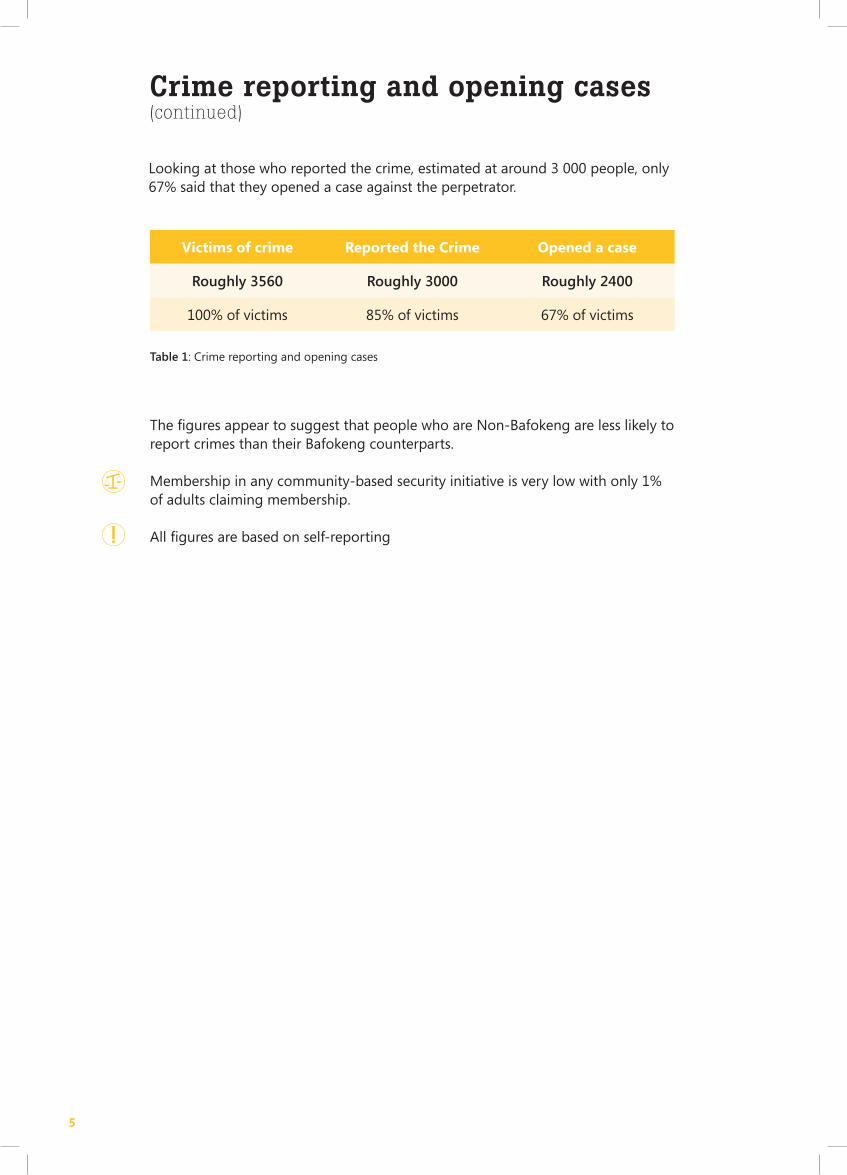
Looking at those who reported the crime, estimated at around 3 000 people, only 67% said that they opened a case against the perpetrator.
5
The figures appear to suggest that people who are Non-Bafokeng are less likely to report crimes than their Bafokeng counterparts.
Membership in any community-based security initiative is very low with only 1% of adults claiming membership.
All figures are based on self-reporting
Victims of crime Reported the Crime Opened a case
Roughly 3560 Roughly 3000 Roughly 2400
100% of victims 85% of victims 67% of victims
Looking at those who reported the crime, estimated at around 3 000 people, only 67% said that they opened a case against the perpetrator.
Crime reporting and opening cases(continued)
Table 1: Crime reporting and opening cases
6
Go
vern
ance
, H
erit
age
and
Cu
ltu
re /
// K
no
w a
nu
mb
er t
o r
epo
rt c
rim
e
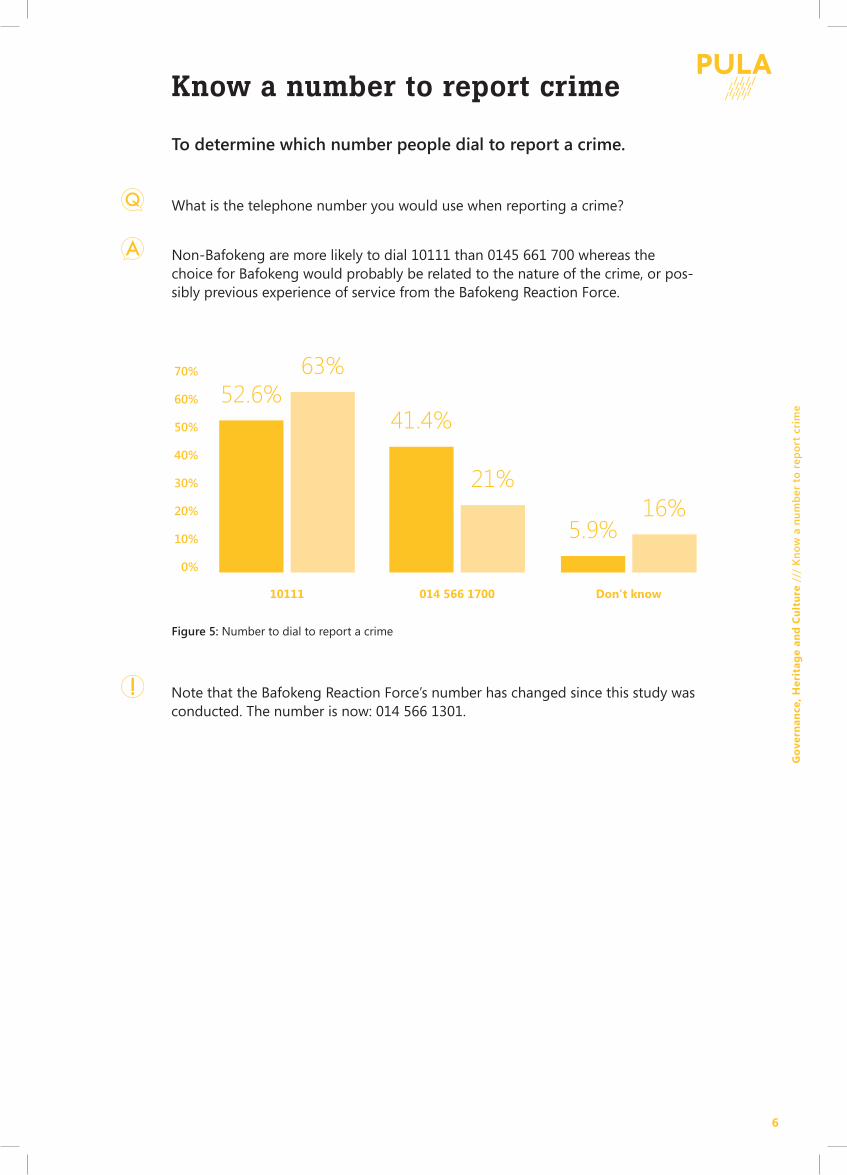
Non-Bafokeng are more likely to dial 10111 than 0145 661 700 whereas the choice for Bafokeng would probably be related to the nature of the crime, or pos-sibly previous experience of service from the Bafokeng Reaction Force.
Know a number to report crime
To determine which number people dial to report a crime.
What is the telephone number you would use when reporting a crime?
70%
60%
50%
40%
30%
20%
10%
0%
52.6%63%
41.4%
21%
5.9%16%
Note that the Bafokeng Reaction Force’s number has changed since this study was conducted. The number is now: 014 566 1301.
10111 014 566 1700 Don’t know
Figure 5: Number to dial to report a crime
7
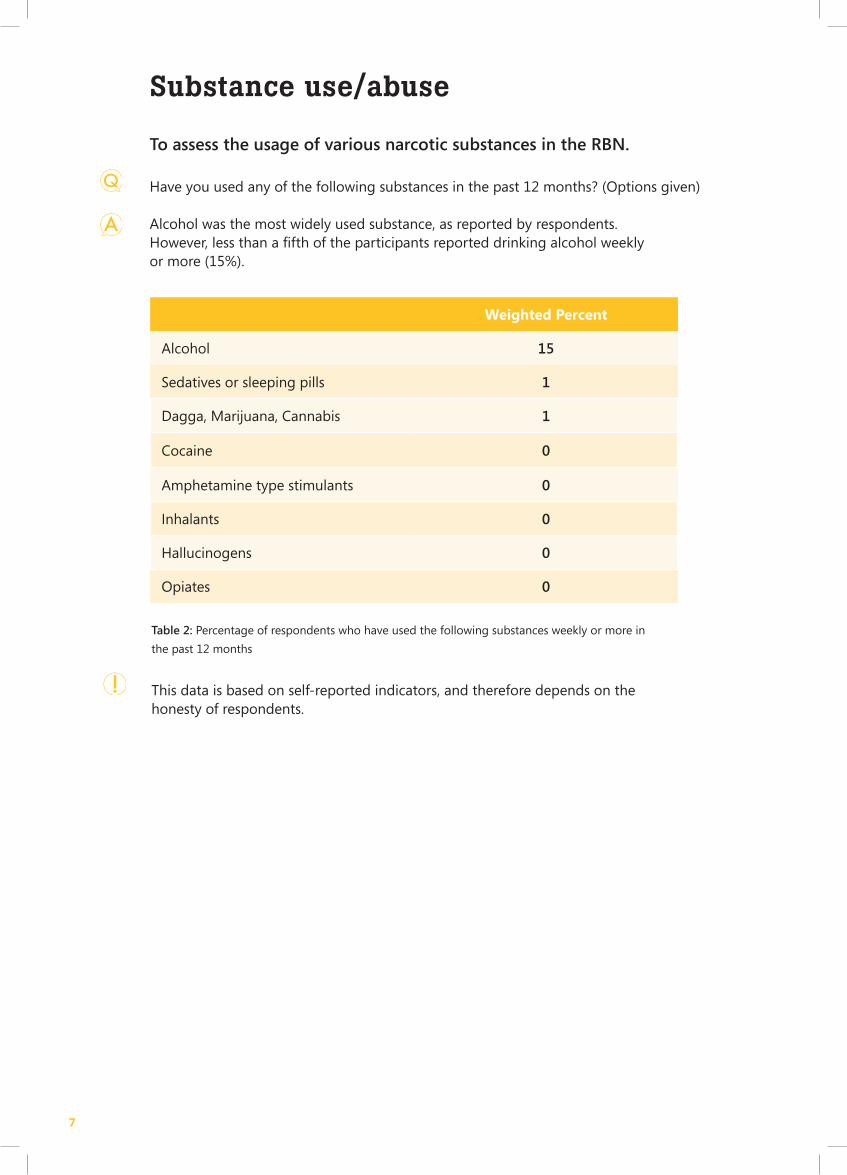
Substance use/abuse
To assess the usage of various narcotic substances in the RBN.
Have you used any of the following substances in the past 12 months? (Options given)
Alcohol was the most widely used substance, as reported by respondents. However, less than a fifth of the participants reported drinking alcohol weekly or more (15%).
This data is based on self-reported indicators, and therefore depends on the honesty of respondents.
Weighted Percent
Alcohol 15
Sedatives or sleeping pills 1
Dagga, Marijuana, Cannabis 1
Cocaine 0
Amphetamine type stimulants 0
Inhalants 0
Hallucinogens 0
Opiates 0
Table 2: Percentage of respondents who have used the following substances weekly or more in
the past 12 months
8
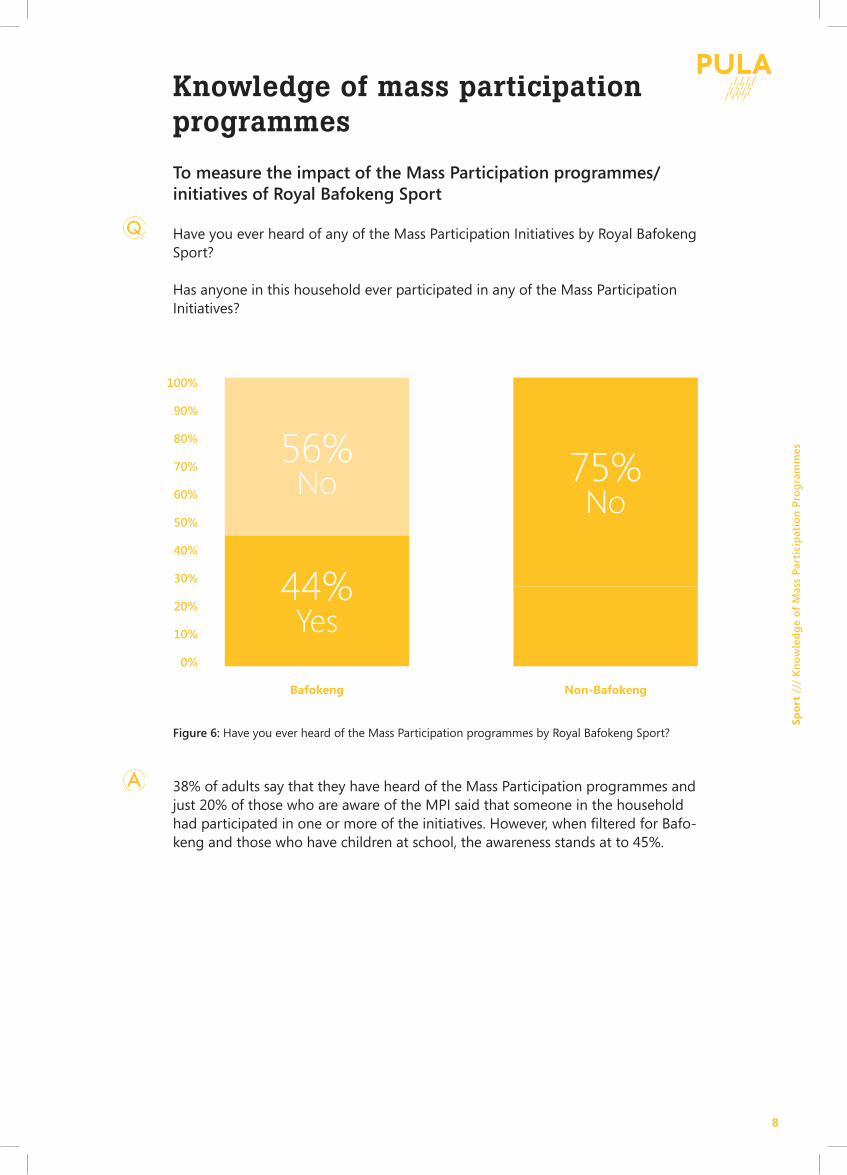
38% of adults say that they have heard of the Mass Participation programmes and just 20% of those who are aware of the MPI said that someone in the household had participated in one or more of the initiatives. However, when fi ltered for Bafo-keng and those who have children at school, the awareness stands at to 45%.
Knowledge of mass participation programmes
To measure the impact of the Mass Participation programmes/initiatives of Royal Bafokeng Sport
Have you ever heard of any of the Mass Participation Initiatives by Royal Bafokeng Sport?
Has anyone in this household ever participated in any of the Mass Participation Initiatives?
100%
90%
80%
70%
60%
50%
40%
30%
20%
10%
0%
Figure 6: Have you ever heard of the Mass Participation programmes by Royal Bafokeng Sport?
Bafokeng Non-Bafokeng
44%Yes
56%No
Sp
ort
///
Kn
ow
led
ge
of
Mas
s P
arti
cip
atio
n P
rog
ram
mes
75%No
9
60%
50%
40%
30%
20%
10%
0%
80%
70%
60%
50%
40%
30%
20%
10%
0%
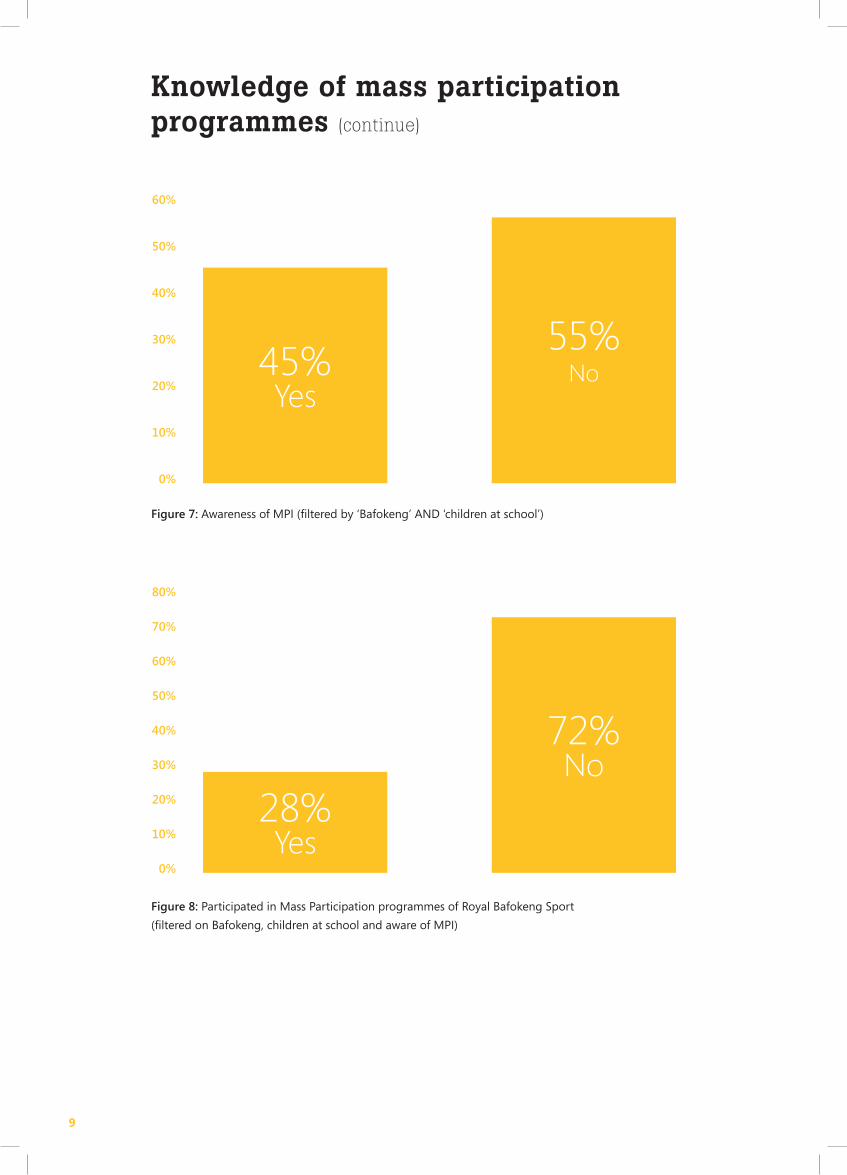
Figure 7: Awareness of MPI (filtered by ‘Bafokeng’ AND ‘children at school’)
Figure 8: Participated in Mass Participation programmes of Royal Bafokeng Sport
(filtered on Bafokeng, children at school and aware of MPI)
45%Yes
Knowledge of mass participation programmes (continue)
28%Yes
72%No
55% No
10
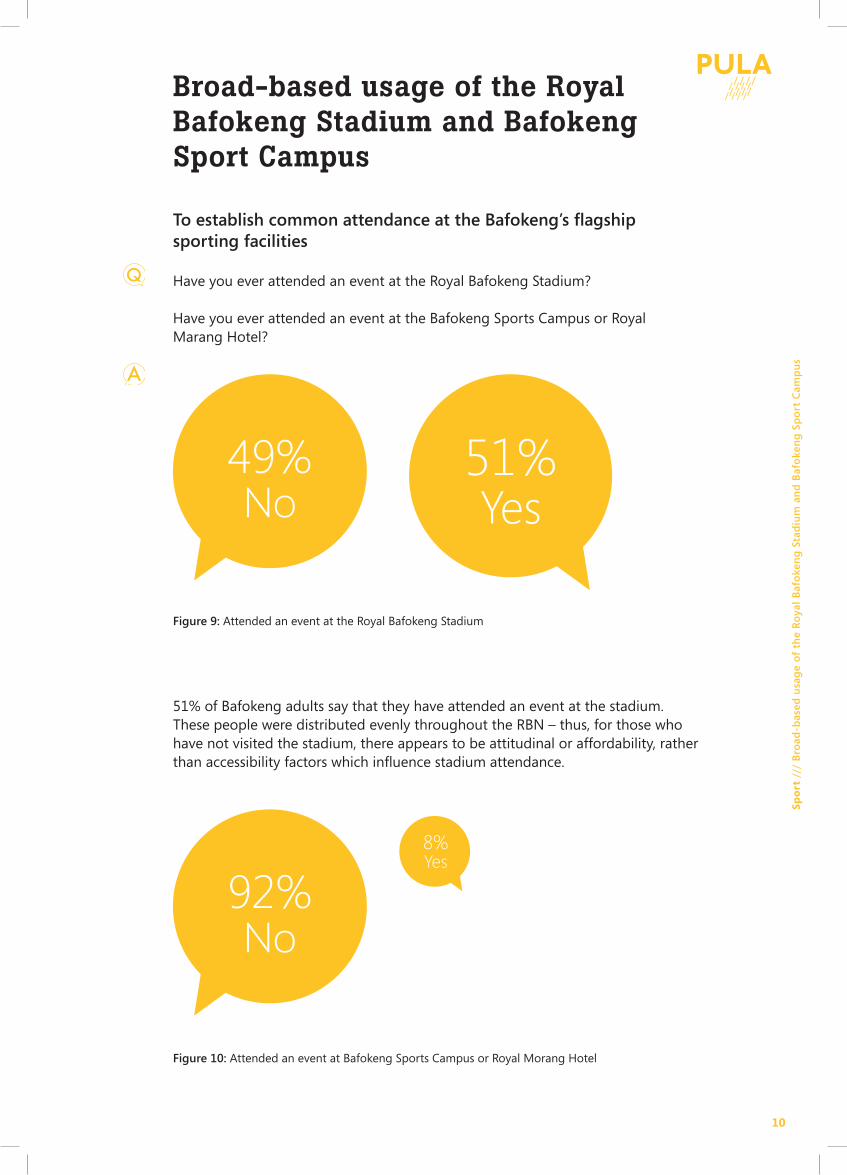
51% of Bafokeng adults say that they have attended an event at the stadium. These people were distributed evenly throughout the RBN – thus, for those who have not visited the stadium, there appears to be attitudinal or affordability, rather than accessibility factors which infl uence stadium attendance.
Broad-based usage of the Royal Bafokeng Stadium and Bafokeng Sport Campus
To establish common attendance at the Bafokeng’s fl agship sporting facilities
Have you ever attended an event at the Royal Bafokeng Stadium?
Have you ever attended an event at the Bafokeng Sports Campus or Royal Marang Hotel?
Figure 9: Attended an event at the Royal Bafokeng Stadium
Figure 10: Attended an event at Bafokeng Sports Campus or Royal Morang Hotel
49%No
92%No
51%Yes
8%Yes
Sp
ort
///
Bro
ad-b
ased
usa
ge
of
the
Ro
yal
Baf
oke
ng
Sta
diu
m a
nd
Baf
oke
ng
Sp
ort
Cam
pu
s
11
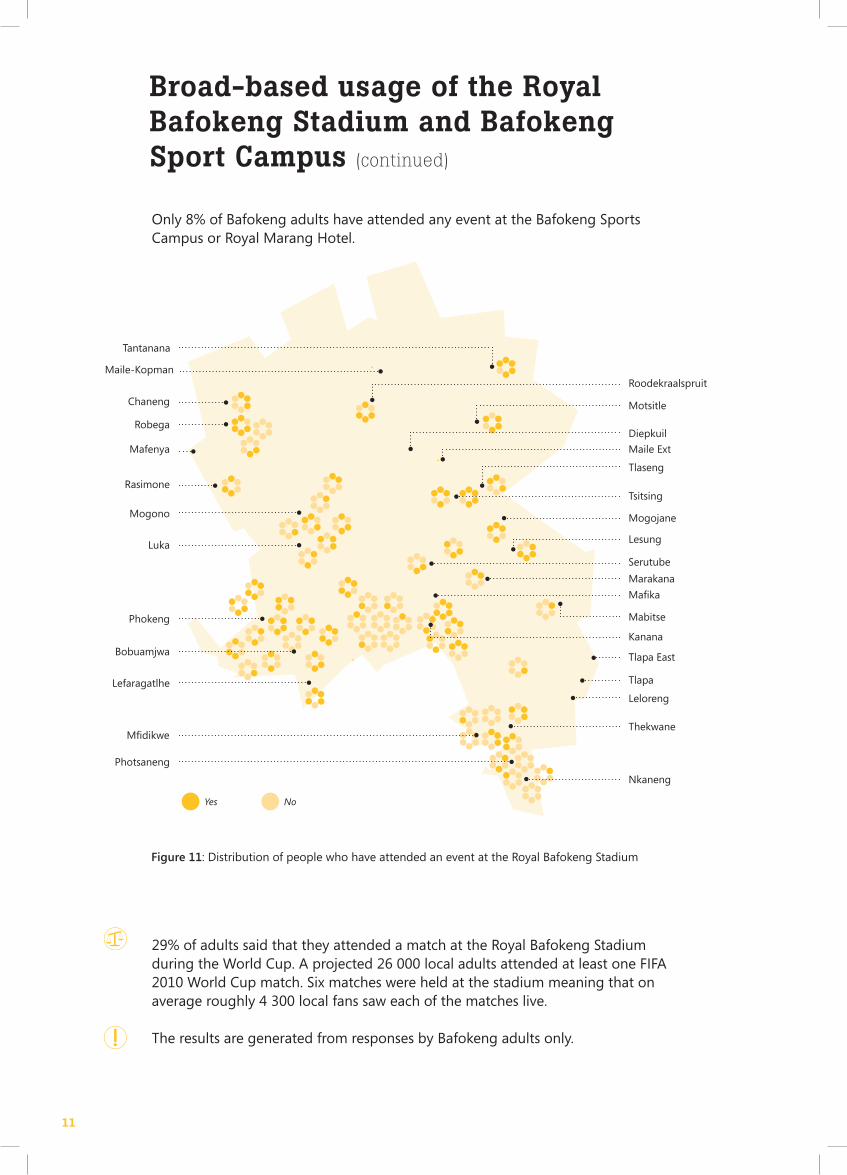
Only 8% of Bafokeng adults have attended any event at the Bafokeng Sports Campus or Royal Marang Hotel.
29% of adults said that they attended a match at the Royal Bafokeng Stadium during the World Cup. A projected 26 000 local adults attended at least one FIFA 2010 World Cup match. Six matches were held at the stadium meaning that on average roughly 4 300 local fans saw each of the matches live.
The results are generated from responses by Bafokeng adults only.
Figure 11: Distribution of people who have attended an event at the Royal Bafokeng Stadium
Tantanana
Chaneng
Lefaragatlhe
Bobuamjwa
Phokeng
Luka
Mogono
Mafenya
Rasimone
RoodekraalspruitMaile-Kopman
Motsitle
Diepkuil
Maile Ext
Tsitsing
Tlaseng
Mogojane
Lesung
Serutube
Mafika
Kanana
Marakana
Mabitse
Tlapa East
Leloreng
Thekwane
Nkaneng
Photsaneng
Mfidikwe
Tlapa
Robega
Yes No
Broad-based usage of the Royal Bafokeng Stadium and Bafokeng Sport Campus (continued)
12
Ser
vice
s //
/ A
cces
s to
wat
er a
nd
wat
er p
ayem
ent
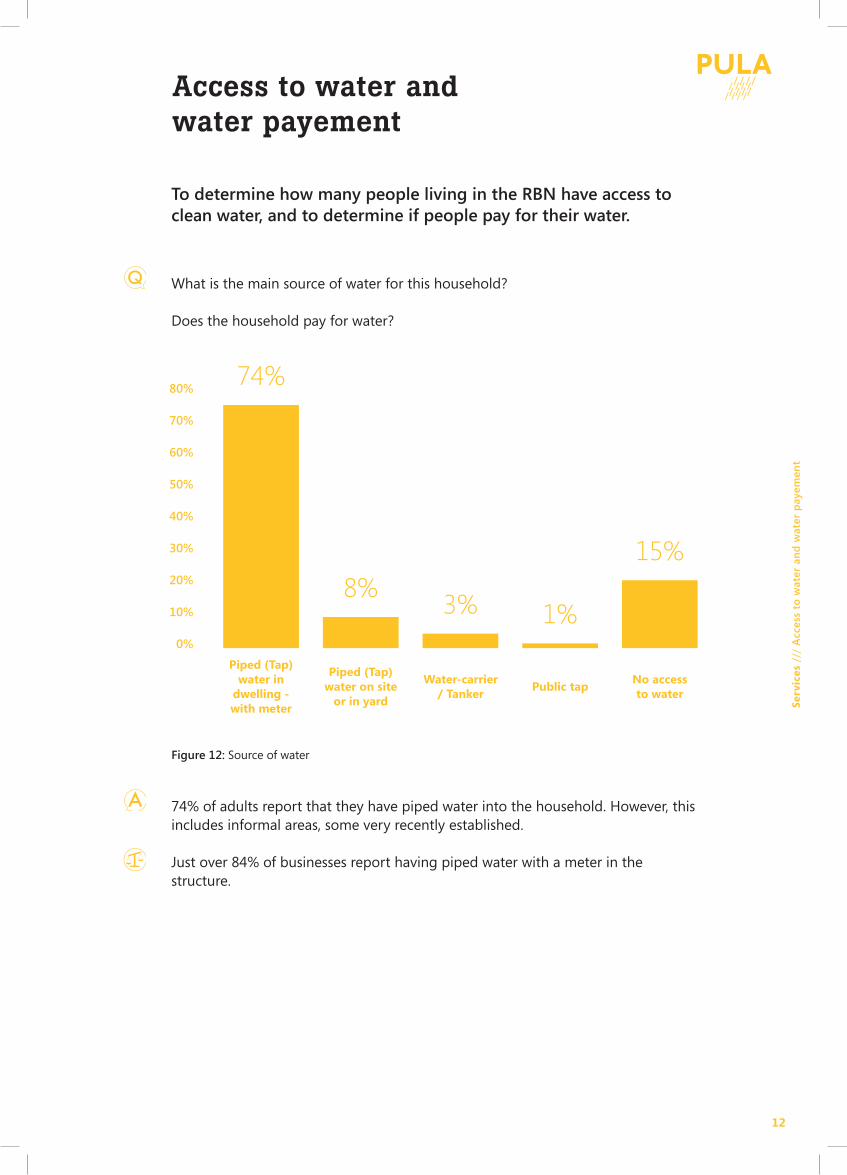
Access to water and water payement
To determine how many people living in the RBN have access to clean water, and to determine if people pay for their water.
What is the main source of water for this household?
Does the household pay for water?
74% of adults report that they have piped water into the household. However, this includes informal areas, some very recently established.
Just over 84% of businesses report having piped water with a meter in the structure.
Figure 12: Source of water
80%
70%
60%
50%
40%
30%
20%
10%
0%
74%
8%3% 1%
15%
Piped (Tap)water in
dwelling - with meter
Piped (Tap) water on site
or in yard
Water-carrier/ Tanker
Public tapNo accessto water
13
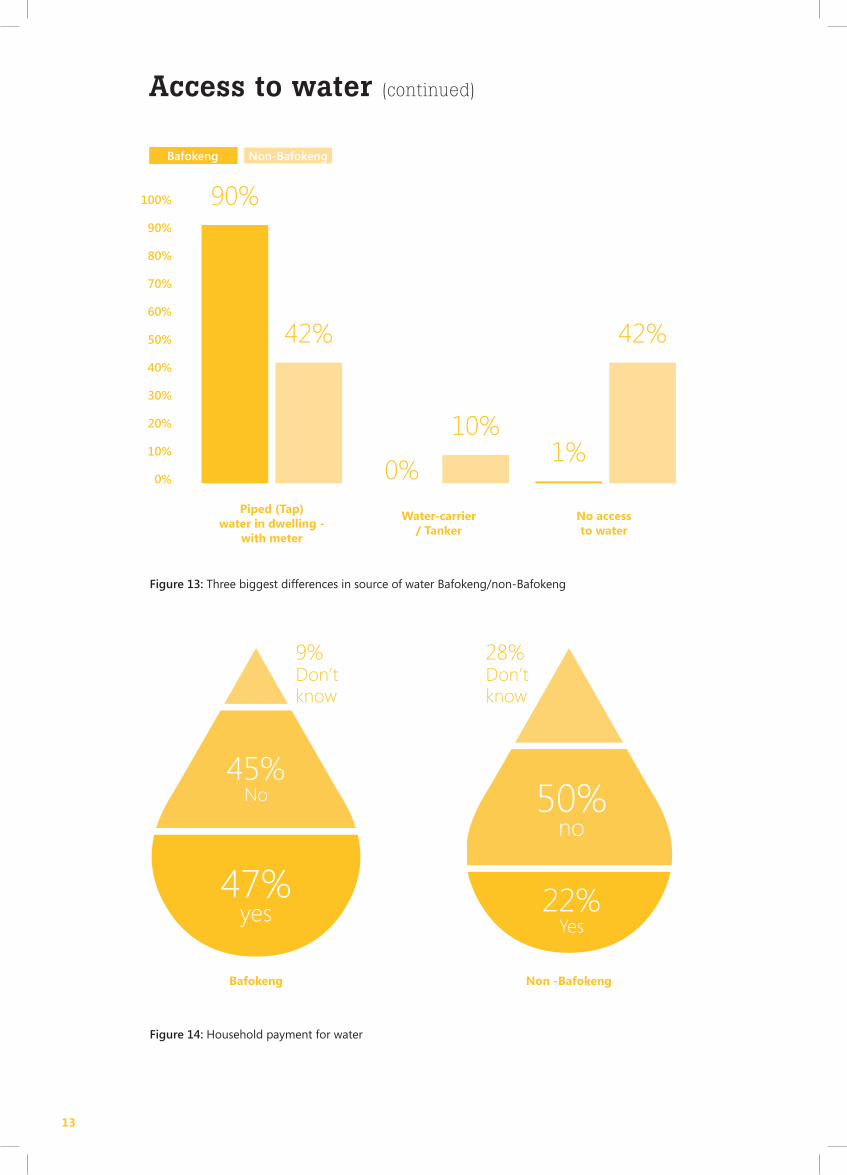
Access to water (continued)
Figure 13: Three biggest differences in source of water Bafokeng/non-Bafokeng
Figure 14: Household payment for water
50%no
28%Don’t know
9%Don’t know
45%No
22%Yes
100%
90%
80%
70%
60%
50%
40%
30%
20%
10%
0%
90%
0%1%
42%
10%
42%
Piped (Tap)water in dwelling -
with meter
Bafokeng Non -Bafokeng
Water-carrier/ Tanker
No accessto water
Bafokeng Non-Bafokeng
47%yes
14
Ser
vice
s //
/ A
cces
s to
Wat
er &
Ele
ctri
city
Ret
icu
lati
on
There are large differences in those who pay for water and those who do not when disaggregated by Bafokeng and non-Bafokeng
Of formal households on RBN land, 95.14% report having access to piped water (both metered and pre-paid) per stand. This is much higher than the provincial av-erage of 89%. The lower rates of access to piped water within informal areas and among backward dwellers lowers the average for the region.
If one considers that 88% of informal structures have access to a tap on the stand, their access to available piped water is similar to that of the formal residences. However, 8% of households in informal areas indicate that they have no access to water.
Considering ‘institutions’, Just over 80% say that their main form of water supply is piped water with a meter. Another 11% of institutions indicated that they have piped water supplied from a tap on site or on the stand. Five institutions indicated that they have no access to water: one community hall, two education facilities and two religious institutions.
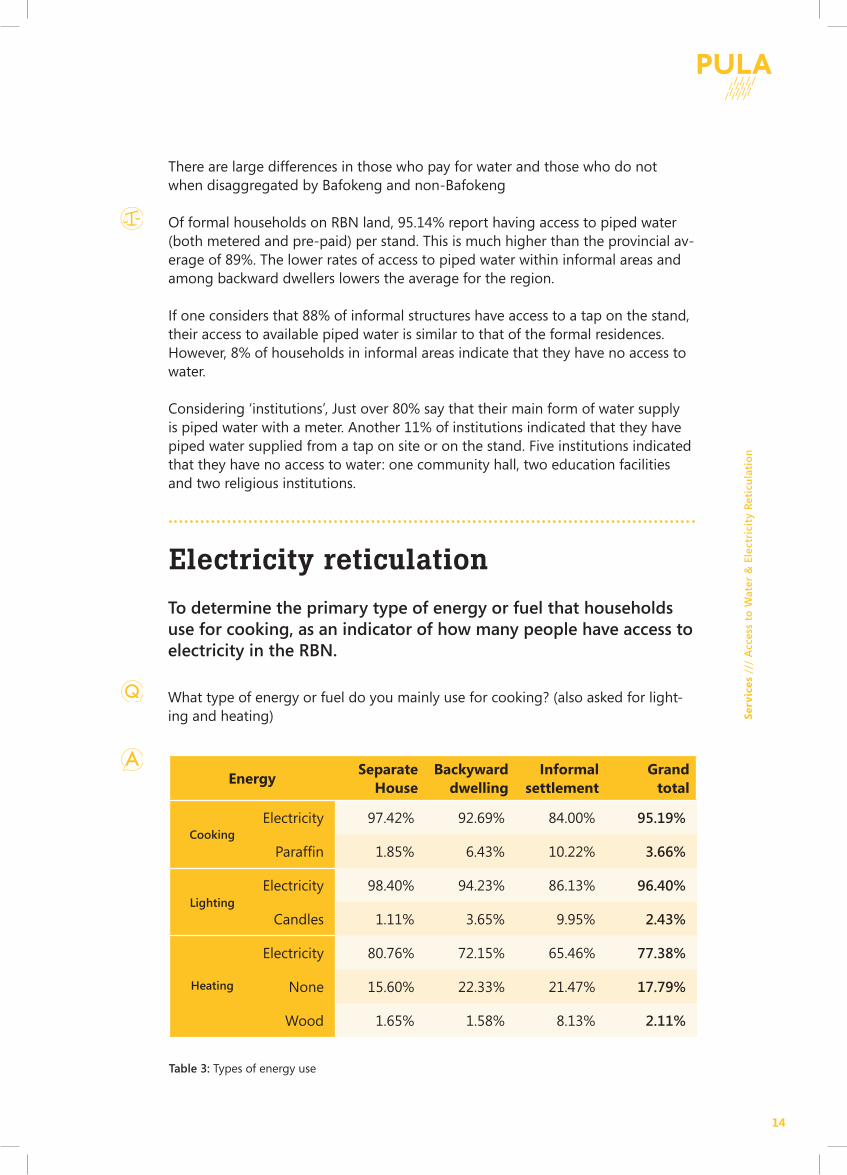
Electricity reticulation
To determine the primary type of energy or fuel that households use for cooking, as an indicator of how many people have access to electricity in the RBN.
What type of energy or fuel do you mainly use for cooking? (also asked for light-ing and heating)
Energy Separate
HouseBackyward
dwellingInformal
settlementGrand
total
Electricity 97.42% 92.69% 84.00% 95.19%
Paraffi n 1.85% 6.43% 10.22% 3.66%
Electricity 98.40% 94.23% 86.13% 96.40%
Candles 1.11% 3.65% 9.95% 2.43%
Electricity 80.76% 72.15% 65.46% 77.38%
None 15.60% 22.33% 21.47% 17.79%
Wood 1.65% 1.58% 8.13% 2.11%
Table 3: Types of energy use
Cooking
Lighting
Heating
15
Electricity reticulation (continued)
For cooking, lighting and heating, the main source of energy is electricity (Table 3). A review of the energy uses within the different dwelling types shows some variation. Most backyard dwellings are able to access the energy source of the main building on the stand where they are built. Informal areas also have good access to electricity but are more dependent on paraffin for cooking, candles for lighting and wood for heating. Just over 17% of households indicated that they did not use any energy source for heating.
The provision of electricity in the RBN is well above the national average. For ex-ample, in South Africa and the North West province, respectively 80% and 82% of households use electricity for lighting.
For those who said that they use wood for cooking, respondents were asked how they obtained the wood. 72% said that they gathered the wood from the surrounding areas.
81% of adults say that they mainly use electricity for cooking. The percentages in the table add up to greater than 100% because multiple responses were allowed – in other words some people use more than one source of energy for cooking.
Access to sanitation
To determine the extent to which people in the RBN have access to sanitation.
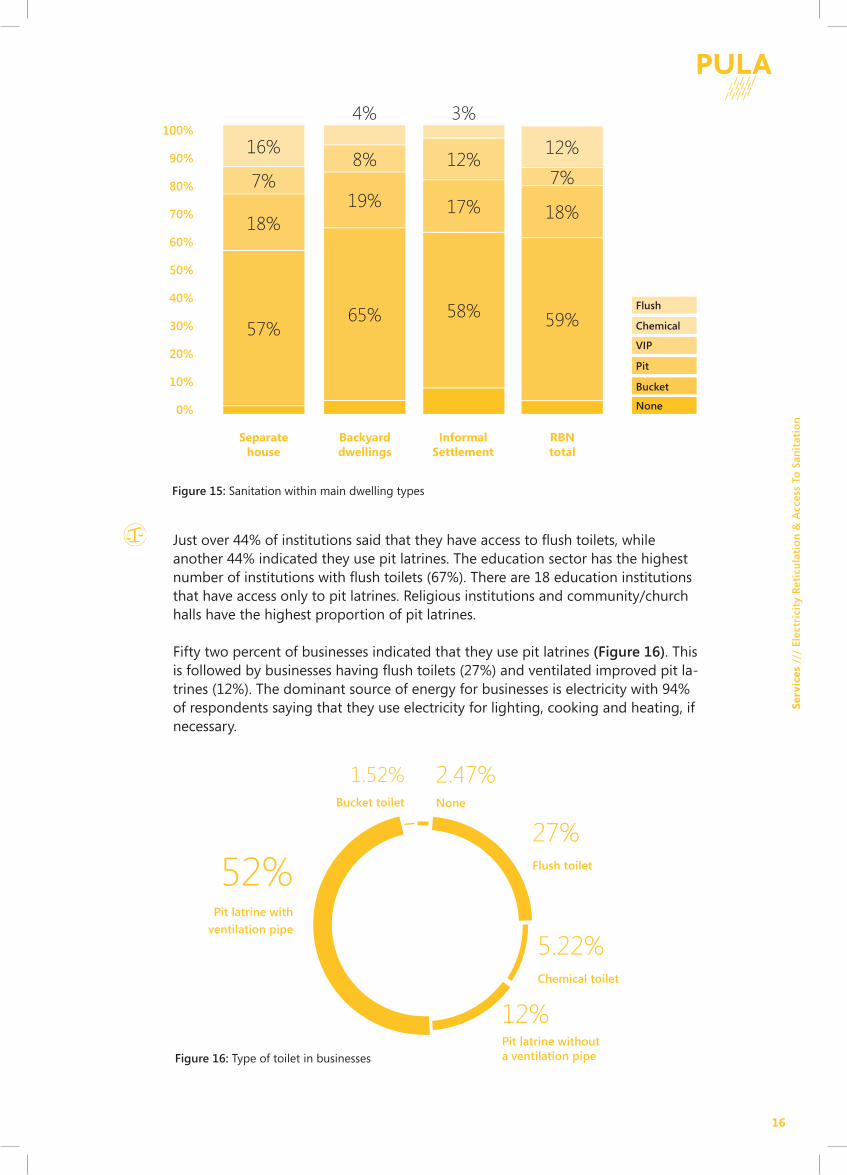
The (unventilated) pit latrine is the main form of sanitation on RBN land, with 59% of households using these (Figure 15). Access to different types of toilets var-ies with dwelling types. Although the formal residential areas still largely use pit latrines, 41% of the households have access to flush, chemical or ventilated pit toilets.
Backyard dwellings also mainly use pit latrines but some also have access to flush, chemical and ventilated pit latrines probably through accessing them in the main dwelling on the stand. Similarly the informal areas mainly use unventilated pit latrines, while 8% of households indicated that they had no access to sanitation.
16
Ser
vice
s //
/ El
ectr
icit
y R
etic
ula
tio
n &
Acc
ess
To S
anit
atio
n
Just over 44% of institutions said that they have access to fl ush toilets, while another 44% indicated they use pit latrines. The education sector has the highest number of institutions with fl ush toilets (67%). There are 18 education institutions that have access only to pit latrines. Religious institutions and community/church halls have the highest proportion of pit latrines.
Fifty two percent of businesses indicated that they use pit latrines (Figure 16). This is followed by businesses having fl ush toilets (27%) and ventilated improved pit la-trines (12%). The dominant source of energy for businesses is electricity with 94% of respondents saying that they use electricity for lighting, cooking and heating, if necessary.
100%
90%
80%
70%
60%
50%
40%
30%
20%
10%
0%
16%
7%
18%
57%65%
19%
8%
4% 3%
12%12%
18%
7%
59%
17%
58%
Separate house
Backyarddwellings
InformalSettlement
RBNtotal
Pit
VIP
Chemical
Flush
Bucket
None
Flush toilet
None
Chemical toilet
Pit latrine without a ventilation pipe
Pit latrine with ventilation pipe
Figure 15: Sanitation within main dwelling types
Figure 16: Type of toilet in businesses
52%27%
5.22%
12%
2.47%Bucket toilet
1.52%
17
Access to sanitation (continued)
While the desirability of flush toilets is an open discussion, a comparison with the national situation in 2007 shows that the RBN is ostensibly lagging behind certain national and provincial levels of access to sanitation.
Sixty percent nationally and 73% of households in the North West province had access to flush toilets compared to 12% in the RBN. VIP latrines are in 7% of households nationally and in 8% of households in the North West. While the RBN is rural, with some amenities following rural patterns, the 59% of households hav-ing access only to unventilated pit latrines, is rather high.
Improved sanitation - use of any of the following facilities: flush or pour-flush to a piped sewer system, septic tank or pit latrine; ventilated improved pit (VIP) latrine; pit latrine with slab; or a composting toilet.
Unimproved sanitation - use of any of the following facilities: flush or pour-flush not piped to a sewer system, septic tank or pit latrine; pit latrine without a slab or open pit; bucket; hanging toilet or hanging latrine; shared facilities of any type; no facilities; or bush or field.
“VIP” - Ventilated Improved Pit latrine
Access to refuse removal
To find out how people in the community dispose of their refuse and to determine the percentage of people who make use of the RBN refuse removal service.
What type of refuse removal is available to this household?
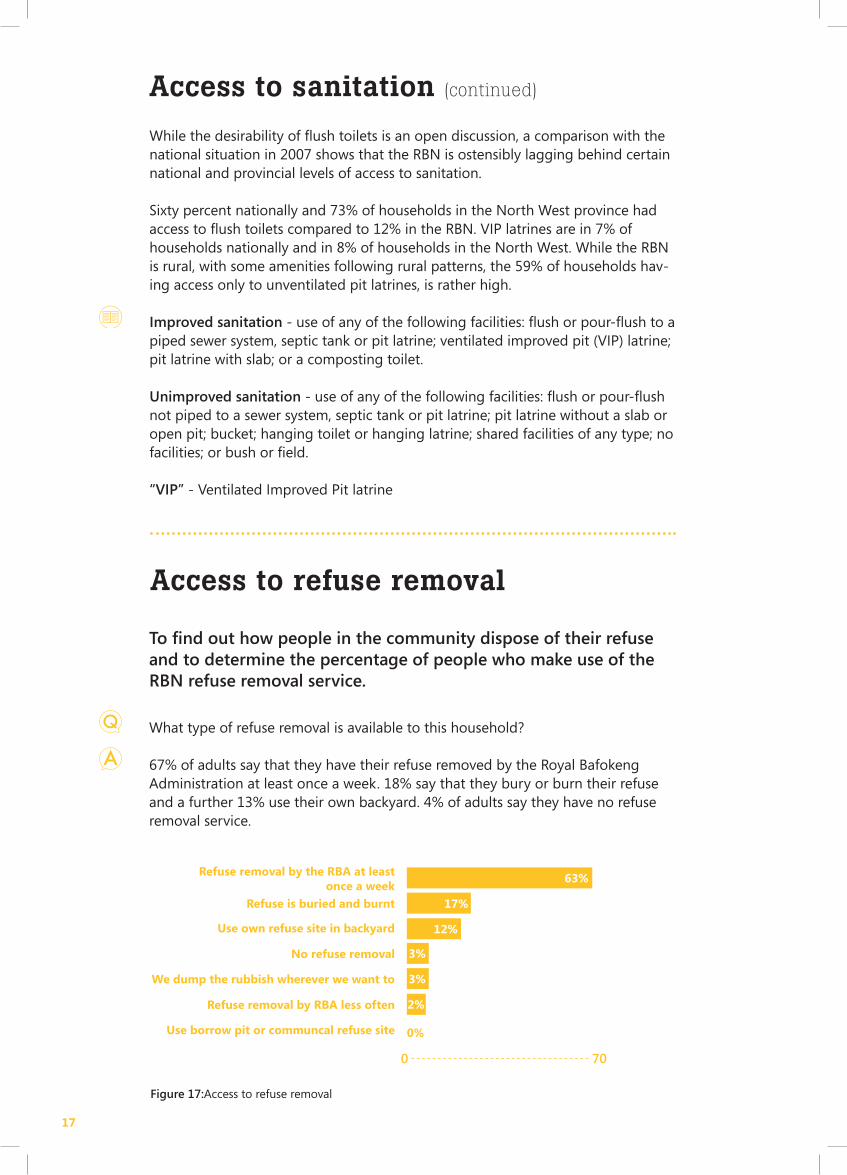
67% of adults say that they have their refuse removed by the Royal Bafokeng Administration at least once a week. 18% say that they bury or burn their refuse and a further 13% use their own backyard. 4% of adults say they have no refuse removal service.
Refuse removal by the RBA at least once a week
Refuse is buried and burnt
Use own refuse site in backyard
No refuse removal
We dump the rubbish wherever we want to
Refuse removal by RBA less often
Use borrow pit or communcal refuse site
0 70
63%
17%
12%
3%
3%
2%
0%
Figure 17:Access to refuse removal
18
Ser
vice
s //
/ A
cces
s To
San
itat
ion
& A
cces
s to
Ref
use
Rem
ova
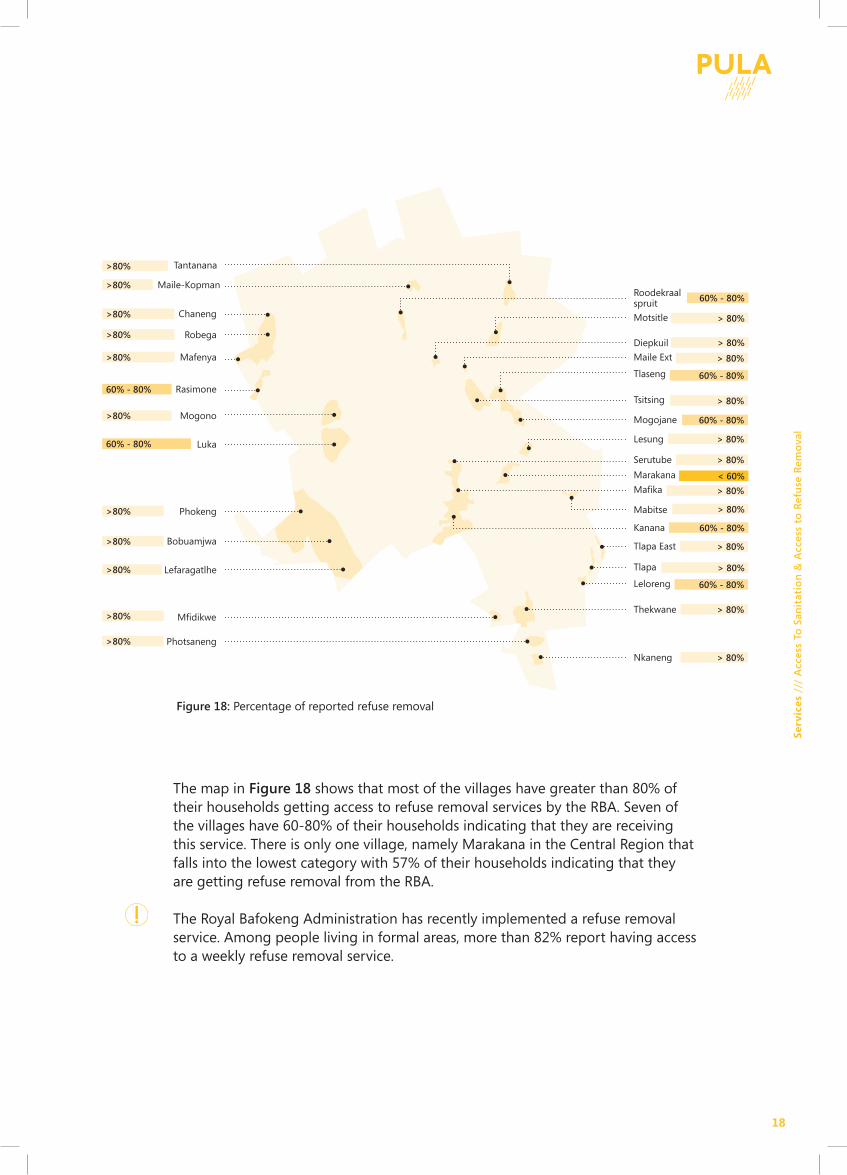
lThe map in Figure 18 shows that most of the villages have greater than 80% of their households getting access to refuse removal services by the RBA. Seven of the villages have 60-80% of their households indicating that they are receiving this service. There is only one village, namely Marakana in the Central Region that falls into the lowest category with 57% of their households indicating that they are getting refuse removal from the RBA.
The Royal Bafokeng Administration has recently implemented a refuse removal service. Among people living in formal areas, more than 82% report having access to a weekly refuse removal service.
Tantanana
Chaneng
Robega
Lefaragatlhe
Bobuamjwa
Phokeng
Luka
Mogono
Mafenya
Rasimone
Roodekraalspruit
>80%
>80%60% - 80%
>80%
>80%
>80%
60% - 80%
>80%
>80%
>80%
>80%
60% - 80%
>80%
>80%
> 80%
> 80%
< 60%
Maile-Kopman
Motsitle
Diepkuil
Maile Ext
Tsitsing
Tlaseng
Mogojane
Lesung
Serutube
Mafi ka
Kanana
Marakana
Mabitse
Tlapa East
Leloreng
Thekwane
Nkaneng
Photsaneng
Mfi dikwe
Tlapa
> 80%
60% - 80%
> 80%
> 80%
> 80%
60% - 80%
> 80%
> 80%
60% - 80%
> 80%
> 80%
60% - 80%
> 80%
> 80%
Figure 18: Percentage of reported refuse removal
19
Road quality proxies
To observe a combination of road quality and institutions’ appro-priate location in the RBN by asking community members various travel-related questions
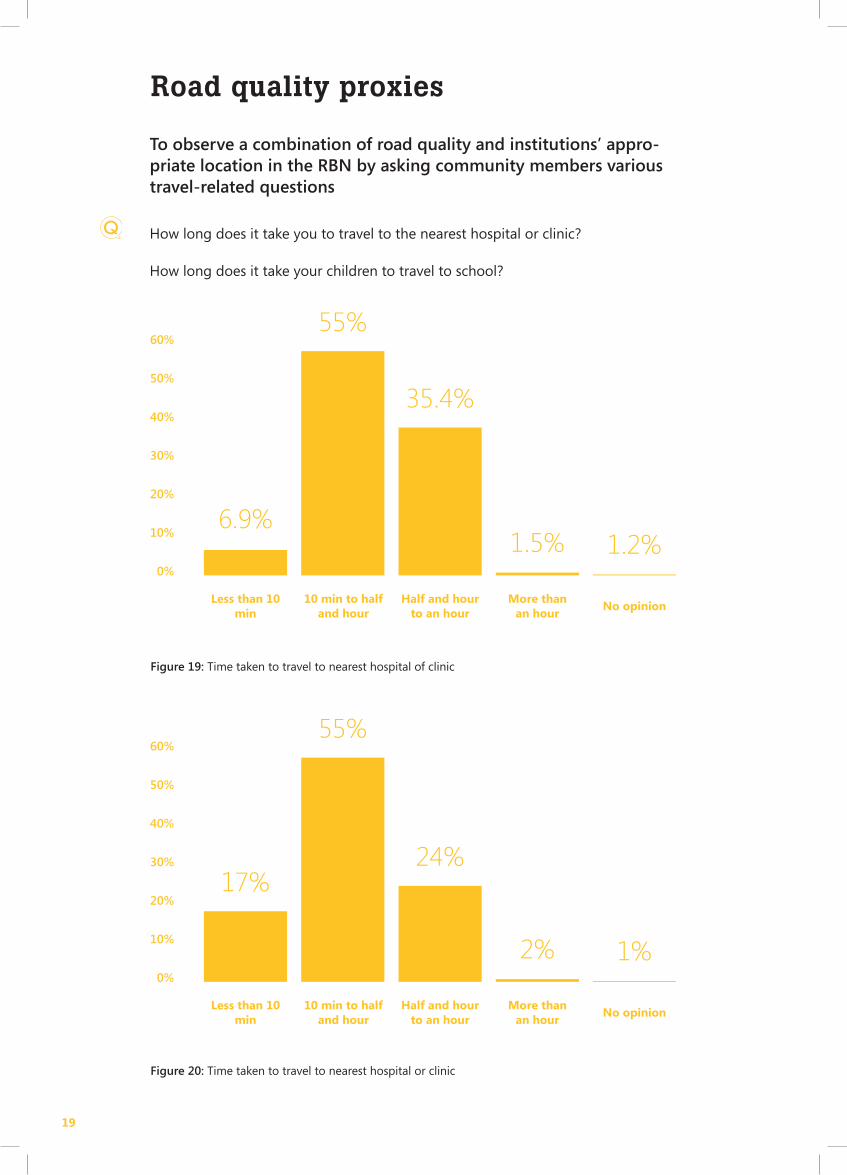
How long does it take you to travel to the nearest hospital or clinic?
How long does it take your children to travel to school?
Figure 19: Time taken to travel to nearest hospital of clinic
Figure 20: Time taken to travel to nearest hospital or clinic
60%
50%
40%
30%
20%
10%
0%
17%
55%
24%
2% 1%
Less than 10 min
10 min to half and hour
Half and hour to an hour
More than an hour
No opinion
60%
50%
40%
30%
20%
10%
0%
6.9%
55%
35.4%
1.5% 1.2%
Less than 10 min
10 min to half and hour
Half and hour to an hour
More than an hour
No opinion
20
Ser
vice
s //
/ R
oad
Qu
alit
y P
roxi
es &
Mo
de
of
Tran
spo
rt t
o S
cho
ol
The tables (pg 19) show the time taken to travel to reach the nearest hospital and the time taken for children to reach school, respectively. Notably, in both cases well more than half of the population, 55% say that they are able to reach the needed institutions in half an hour or less, when using the mode of transport they usually do. This suggests that, in general, the rural network of roads is in an ac-ceptable state, (although in many cases and locations it can be improved greatly).
Women (29.8%) were more likely than men (19.5%) to walk to a hospital or clinic, while men (16.9%) were more likely to take a private car than women (9.5%). Nearly two-thirds (62%) take half an hour or less to reach their nearest hospital.
The ‘health facility’ data was fi ltered by adults who indicated that they have made use of health facilities in the past. The school data was fi ltered by those who say they have children/dependents at school, and was answered by the parents, not the children, which may imply a measure of ignorance.
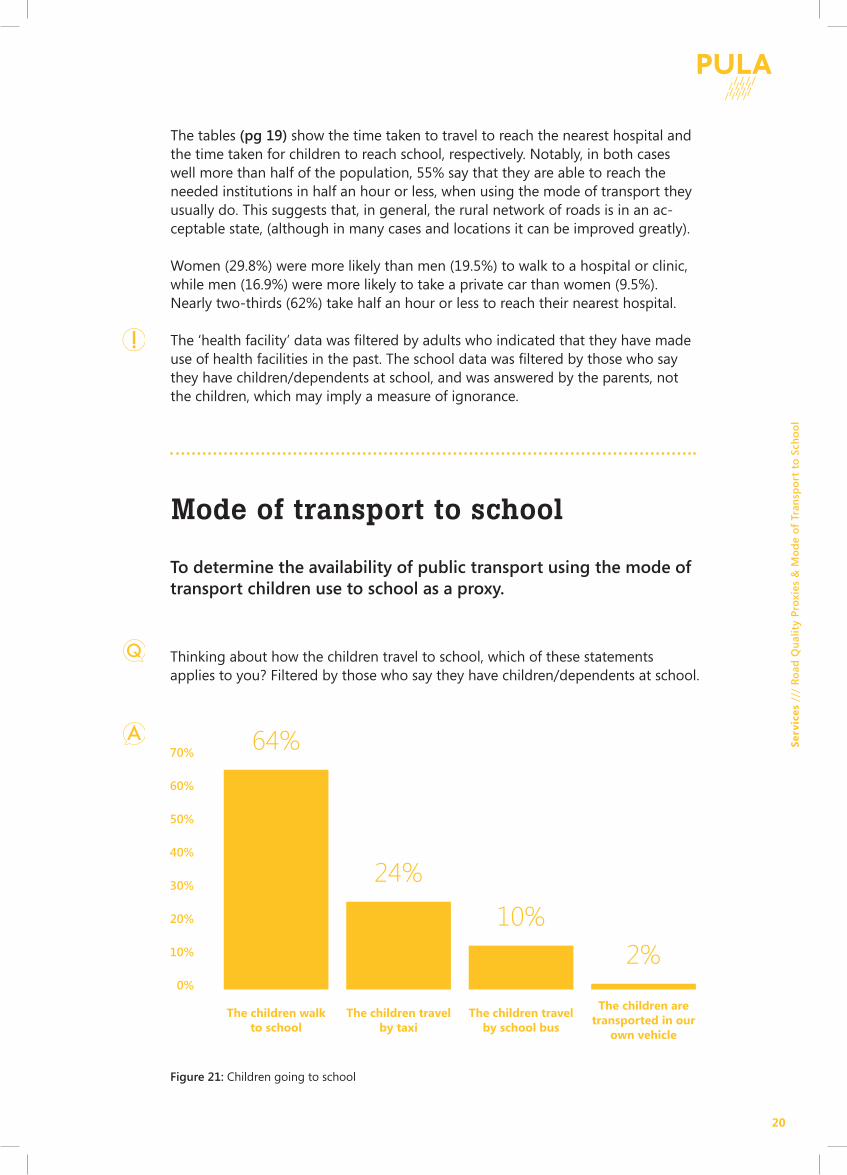
Figure 21: Children going to school
70%
60%
50%
40%
30%
20%
10%
0%
64%
24%
10%2%
The children walk to school
The children travel by taxi
The children travel by school bus
The children are transported in our
own vehicle
Mode of transport to school
To determine the availability of public transport using the mode of transport children use to school as a proxy.
Thinking about how the children travel to school, which of these statements applies to you? Filtered by those who say they have children/dependents at school.
21
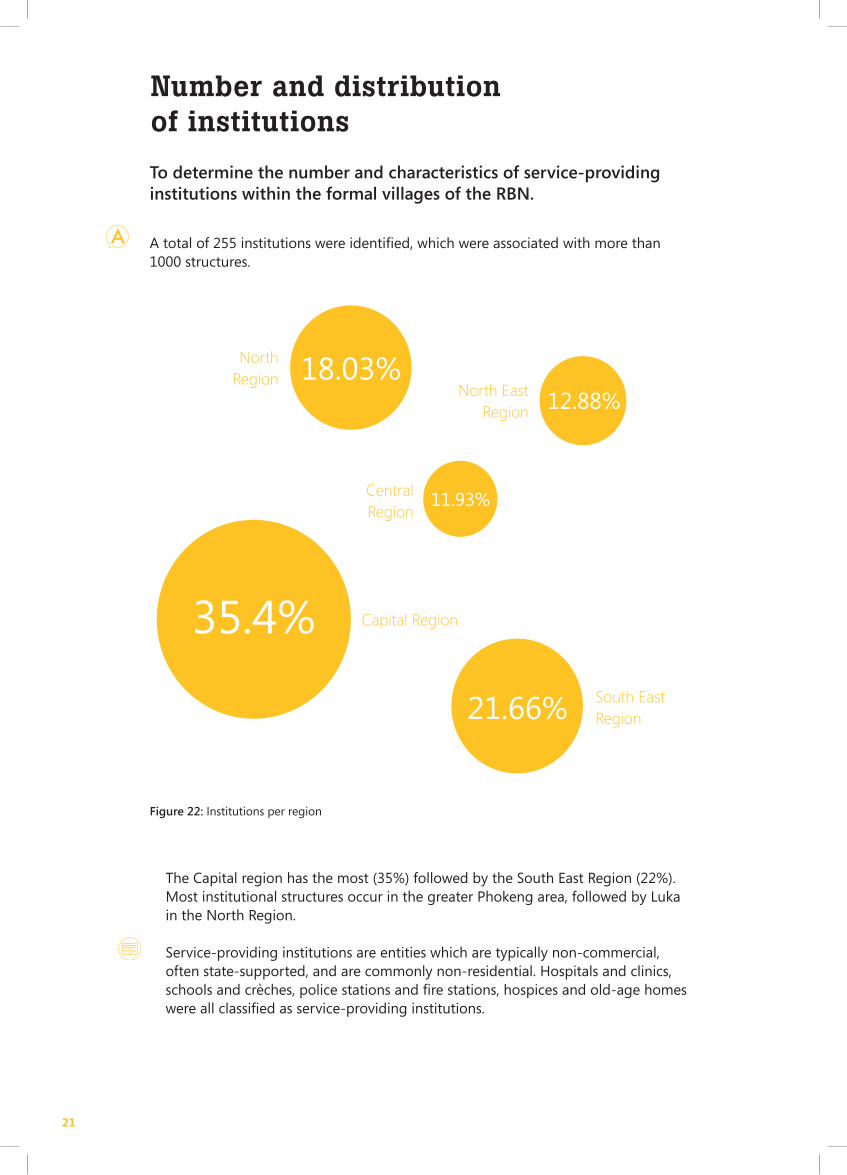
Figure 22: Institutions per region
Number and distribution of institutions
To determine the number and characteristics of service-providing institutions within the formal villages of the RBN.
A total of 255 institutions were identified, which were associated with more than 1000 structures.
The Capital region has the most (35%) followed by the South East Region (22%). Most institutional structures occur in the greater Phokeng area, followed by Luka in the North Region.
Service-providing institutions are entities which are typically non-commercial, often state-supported, and are commonly non-residential. Hospitals and clinics, schools and crèches, police stations and fire stations, hospices and old-age homes were all classified as service-providing institutions.
35.4% Capital Region
South EastRegion21.66%
North Region 18.03%
North East Region 12.88%
Central Region
11.93%
22
Ser
vice
s //
/ N
um
ber
an
d d
istr
ibu
tio
n o
f in
stit
uti
on
s
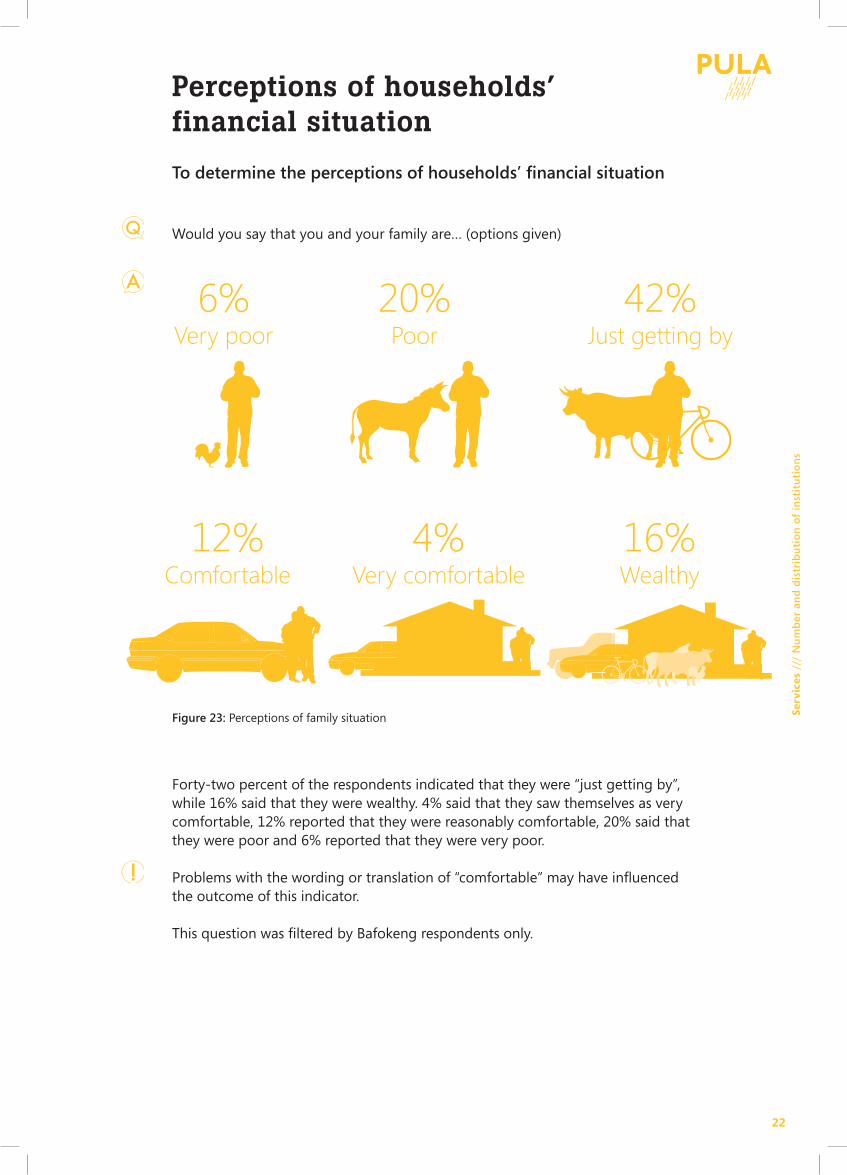
Perceptions of households’ financial situation
To determine the perceptions of households’ fi nancial situation
Would you say that you and your family are… (options given)
Forty-two percent of the respondents indicated that they were “just getting by”, while 16% said that they were wealthy. 4% said that they saw themselves as very comfortable, 12% reported that they were reasonably comfortable, 20% said that they were poor and 6% reported that they were very poor.
Problems with the wording or translation of “comfortable” may have infl uenced the outcome of this indicator.
This question was fi ltered by Bafokeng respondents only.
Figure 23: Perceptions of family situation
6%Very poor
12%Comfortable
20%Poor
4%Very comfortable
42%Just getting by
16%Wealthy
23
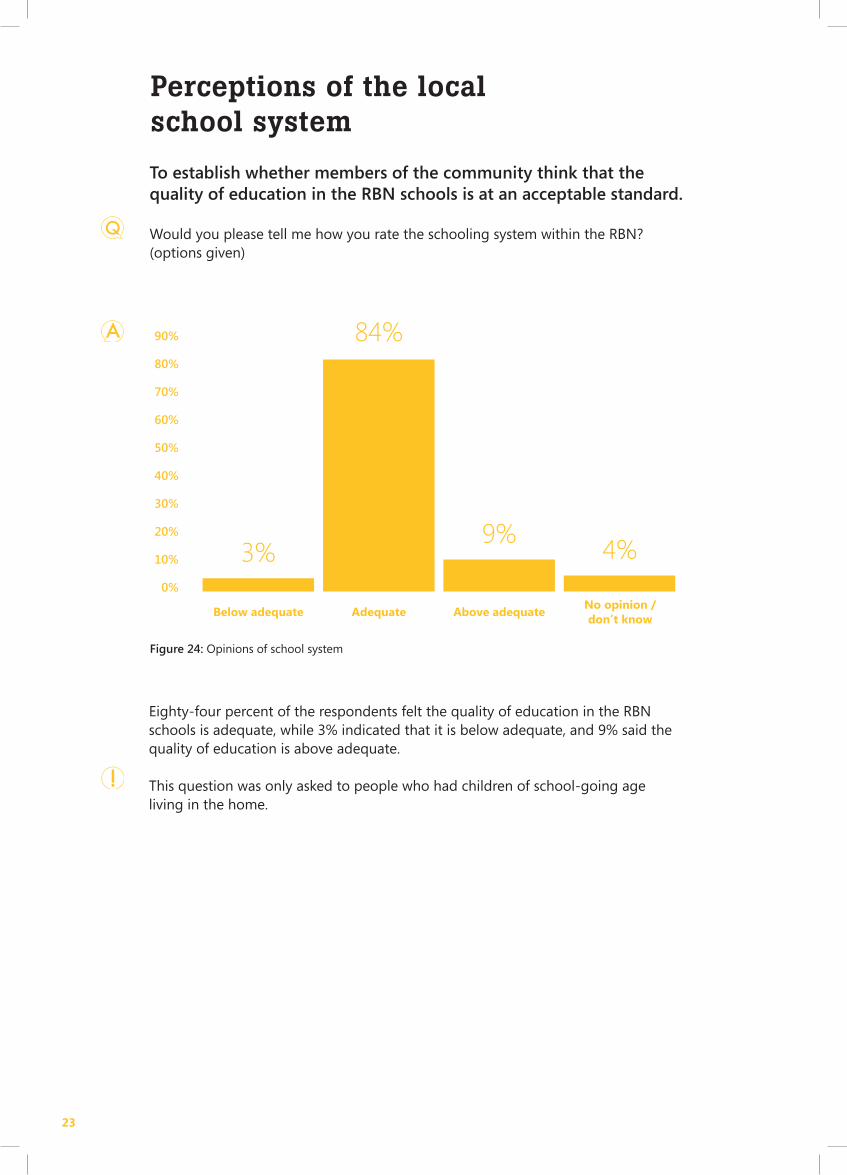
Perceptions of the local school system
To establish whether members of the community think that the quality of education in the RBN schools is at an acceptable standard.
Would you please tell me how you rate the schooling system within the RBN? (options given)
Eighty-four percent of the respondents felt the quality of education in the RBN schools is adequate, while 3% indicated that it is below adequate, and 9% said the quality of education is above adequate.
This question was only asked to people who had children of school-going age living in the home.
Figure 24: Opinions of school system
90%
80%
70%
60%
50%
40%
30%
20%
10%
0%
3%9%
4%
84%
Below adequate Adequate Above adequateNo opinion / don’t know
24
Gen
eral
Per
cep
tio
n /
// P
erce
pti
on
s o
f h
ou
seh
old
s’ f
inan
cial
sit
uat
ion
& P
erce
pti
on
s o
f th
e lo
cal
sch
oo
l sy
stem
Health Care system available to RBN residents
The aim was to determine the perceptions of the health care system in the RBN.
What is your perception of the health care system in the RBN?
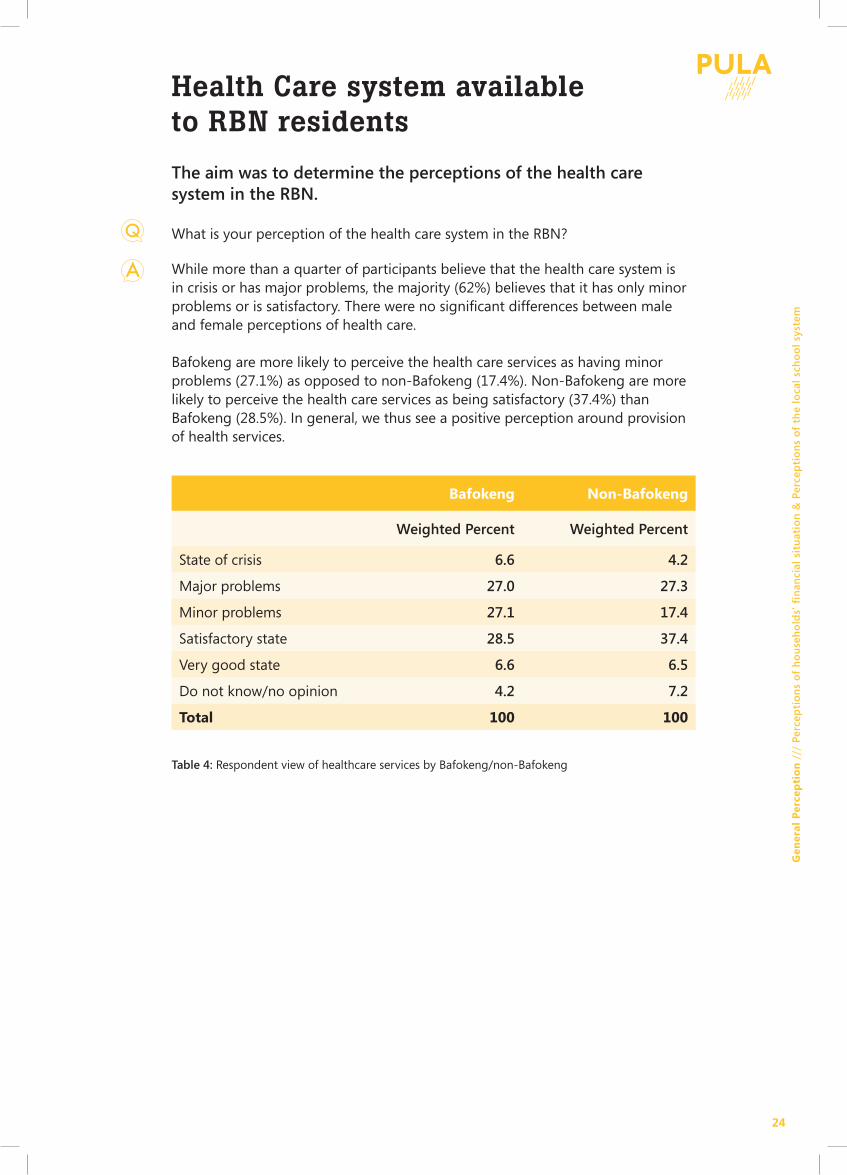
While more than a quarter of participants believe that the health care system is in crisis or has major problems, the majority (62%) believes that it has only minor problems or is satisfactory. There were no signifi cant differences between male and female perceptions of health care.
Bafokeng are more likely to perceive the health care services as having minor problems (27.1%) as opposed to non-Bafokeng (17.4%). Non-Bafokeng are more likely to perceive the health care services as being satisfactory (37.4%) than Bafokeng (28.5%). In general, we thus see a positive perception around provision of health services.
Table 4: Respondent view of healthcare services by Bafokeng/non-Bafokeng
Bafokeng Non-Bafokeng
Weighted Percent Weighted Percent
State of crisis 6.6 4.2
Major problems 27.0 27.3
Minor problems 27.1 17.4
Satisfactory state 28.5 37.4
Very good state 6.6 6.5
Do not know/no opinion 4.2 7.2
Total 100 100
25
Perceptions of the availability of medication to rape victimsTo determine how women in the community perceive the availability of medication available to rape victims.
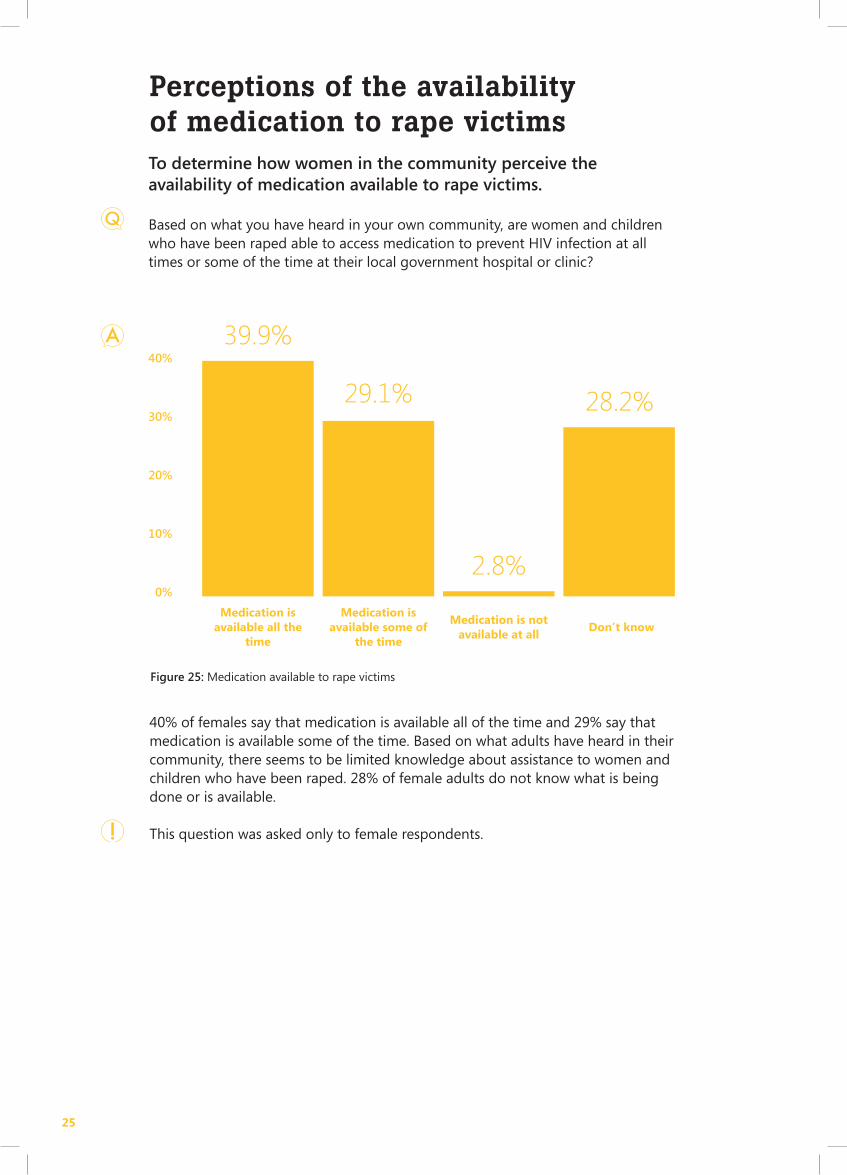
Based on what you have heard in your own community, are women and children who have been raped able to access medication to prevent HIV infection at all times or some of the time at their local government hospital or clinic?
40% of females say that medication is available all of the time and 29% say that medication is available some of the time. Based on what adults have heard in their community, there seems to be limited knowledge about assistance to women and children who have been raped. 28% of female adults do not know what is being done or is available.
This question was asked only to female respondents.
Figure 25: Medication available to rape victims
40%
30%
20%
10%
0%
39.9%
2.8%
28.2%29.1%
Medication is available all the
time
Medication is available some of
the time
Medication is not available at all
Don’t know
26
Gen
eral
Per
cep
tio
n /
// H
ealt
h C
are
syst
em a
vail
able
to
RB
N r
esid
ents
& M
edic
atio
n a
vail
able
to
rap
e vi
ctim
s
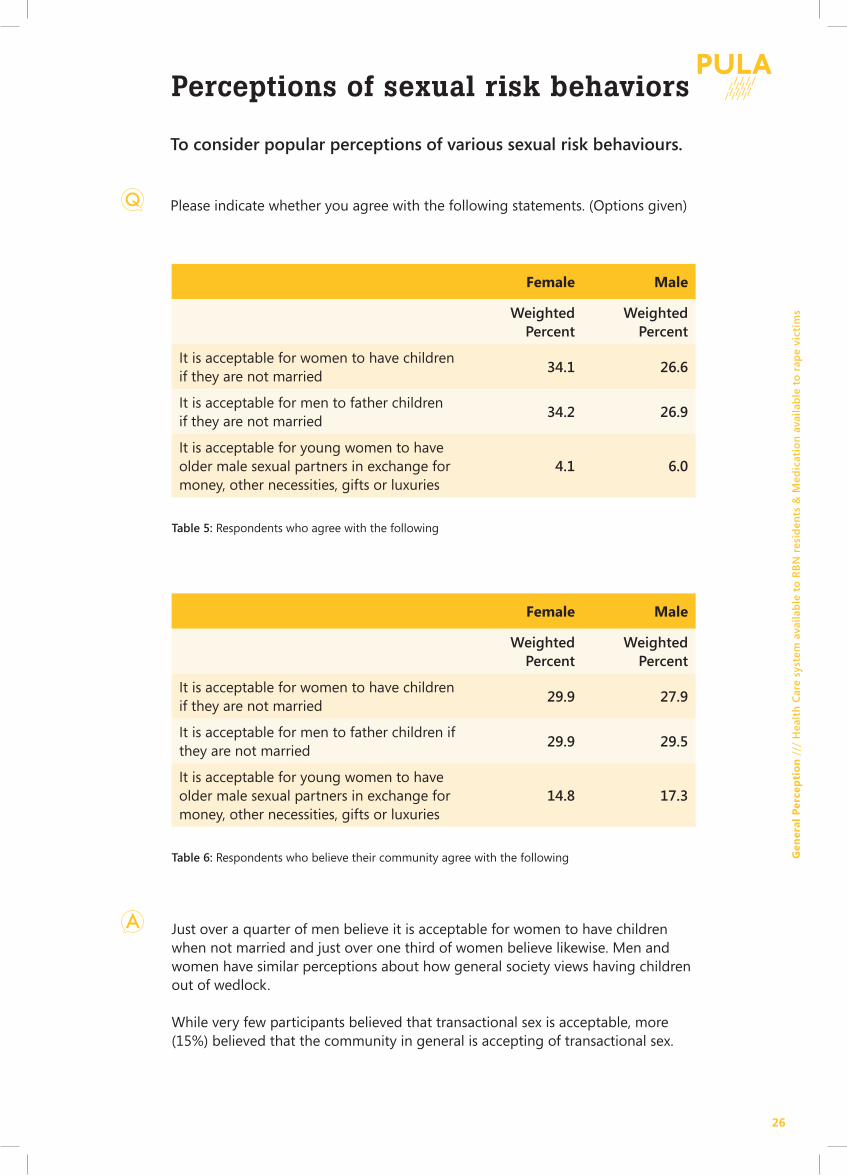
Just over a quarter of men believe it is acceptable for women to have children when not married and just over one third of women believe likewise. Men and women have similar perceptions about how general society views having children out of wedlock.
While very few participants believed that transactional sex is acceptable, more (15%) believed that the community in general is accepting of transactional sex.
Perceptions of sexual risk behaviors
To consider popular perceptions of various sexual risk behaviours.
Please indicate whether you agree with the following statements. (Options given)
Table 5: Respondents who agree with the following
Table 6: Respondents who believe their community agree with the following
Female Male
Weighted Percent
Weighted Percent
It is acceptable for women to have children if they are not married
34.1 26.6
It is acceptable for men to father children if they are not married
34.2 26.9
It is acceptable for young women to have older male sexual partners in exchange for money, other necessities, gifts or luxuries
4.1 6.0
Female Male
Weighted Percent
Weighted Percent
It is acceptable for women to have children if they are not married
29.9 27.9
It is acceptable for men to father children if they are not married
29.9 29.5
It is acceptable for young women to have older male sexual partners in exchange for money, other necessities, gifts or luxuries
14.8 17.3
27
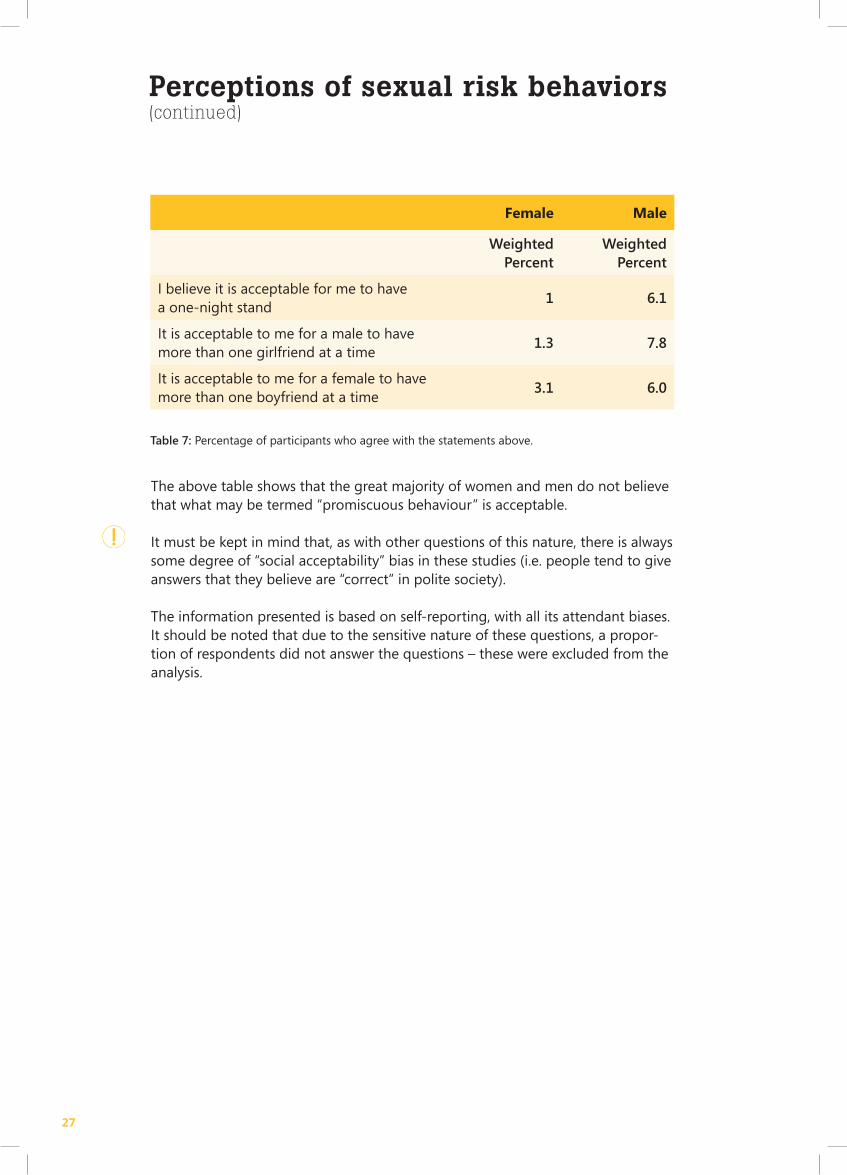
The above table shows that the great majority of women and men do not believe that what may be termed “promiscuous behaviour” is acceptable.
It must be kept in mind that, as with other questions of this nature, there is always some degree of “social acceptability” bias in these studies (i.e. people tend to give answers that they believe are “correct” in polite society).
The information presented is based on self-reporting, with all its attendant biases. It should be noted that due to the sensitive nature of these questions, a propor-tion of respondents did not answer the questions – these were excluded from the analysis.
Table 7: Percentage of participants who agree with the statements above.
Female Male
Weighted Percent
Weighted Percent
I believe it is acceptable for me to have a one-night stand
1 6.1
It is acceptable to me for a male to have more than one girlfriend at a time
1.3 7.8
It is acceptable to me for a female to have more than one boyfriend at a time
3.1 6.0
Perceptions of sexual risk behaviors(continued)
28
Gen
eral
Per
cep
tio
n /
// P
erce
pti
on
s o
f se
xual
ris
k b
ehav
ior
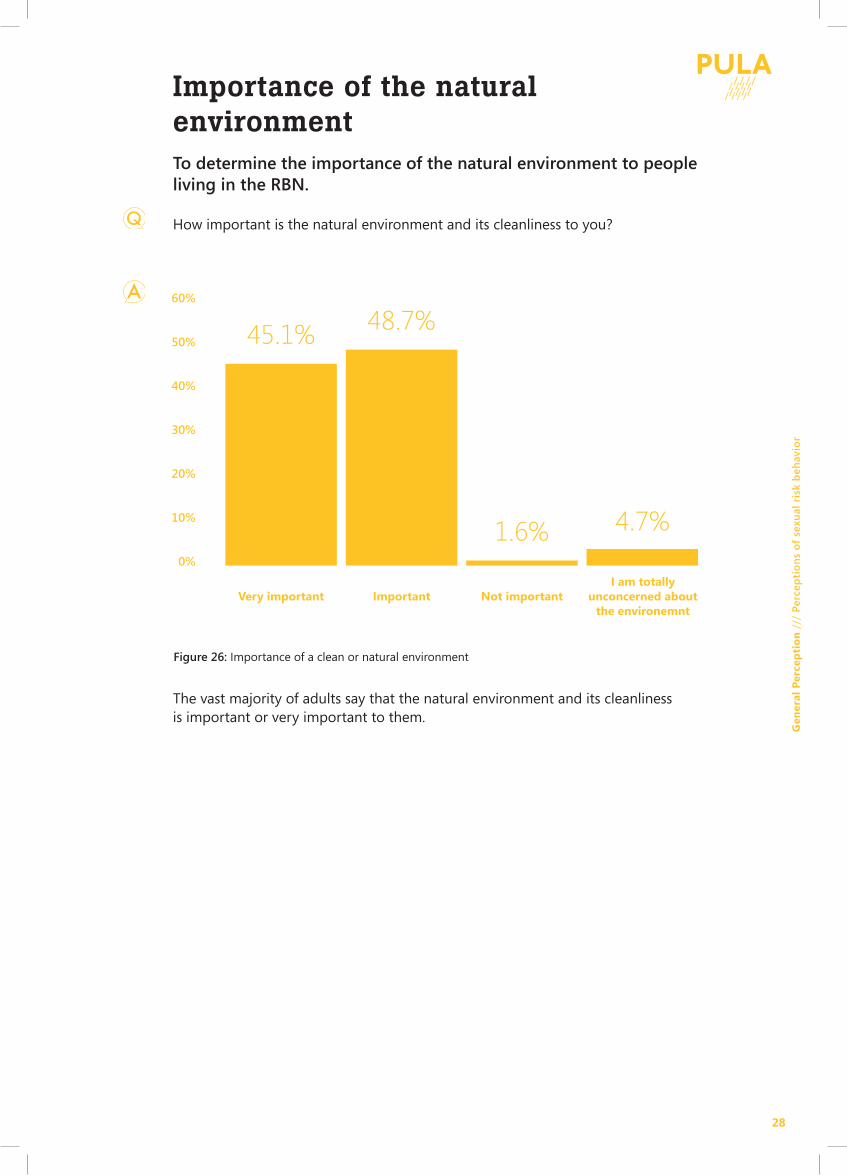
Importance of the natural environmentTo determine the importance of the natural environment to people living in the RBN.
How important is the natural environment and its cleanliness to you?
The vast majority of adults say that the natural environment and its cleanliness is important or very important to them.
Figure 26: Importance of a clean or natural environment
60%
50%
40%
30%
20%
10%
0%
45.1%
1.6% 4.7%
48.7%
Very important Important Not importantI am totally
unconcerned about the environemnt
29
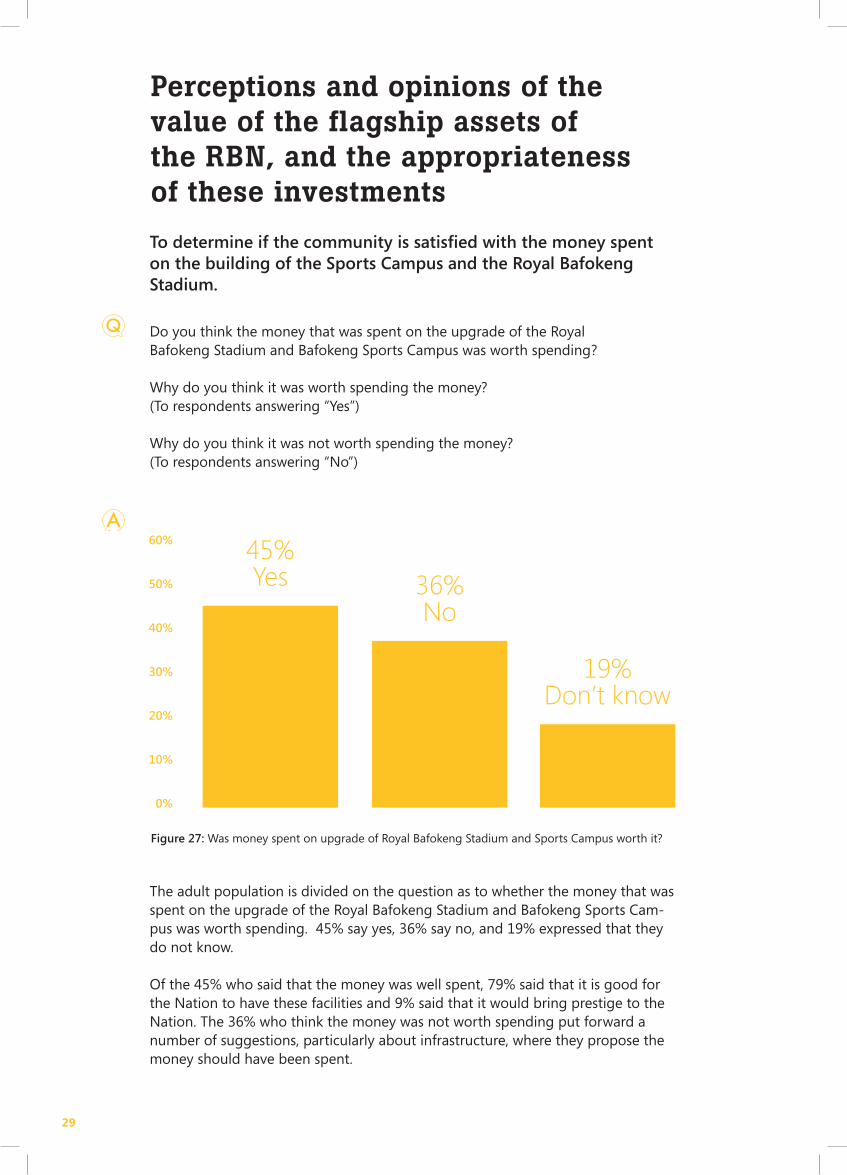
Perceptions and opinions of the value of the flagship assets of the RBN, and the appropriateness of these investments
To determine if the community is satisfied with the money spent on the building of the Sports Campus and the Royal Bafokeng Stadium.
Do you think the money that was spent on the upgrade of the Royal Bafokeng Stadium and Bafokeng Sports Campus was worth spending?
Why do you think it was worth spending the money? (To respondents answering “Yes”)
Why do you think it was not worth spending the money?(To respondents answering “No”)
The adult population is divided on the question as to whether the money that was spent on the upgrade of the Royal Bafokeng Stadium and Bafokeng Sports Cam-pus was worth spending. 45% say yes, 36% say no, and 19% expressed that they do not know.
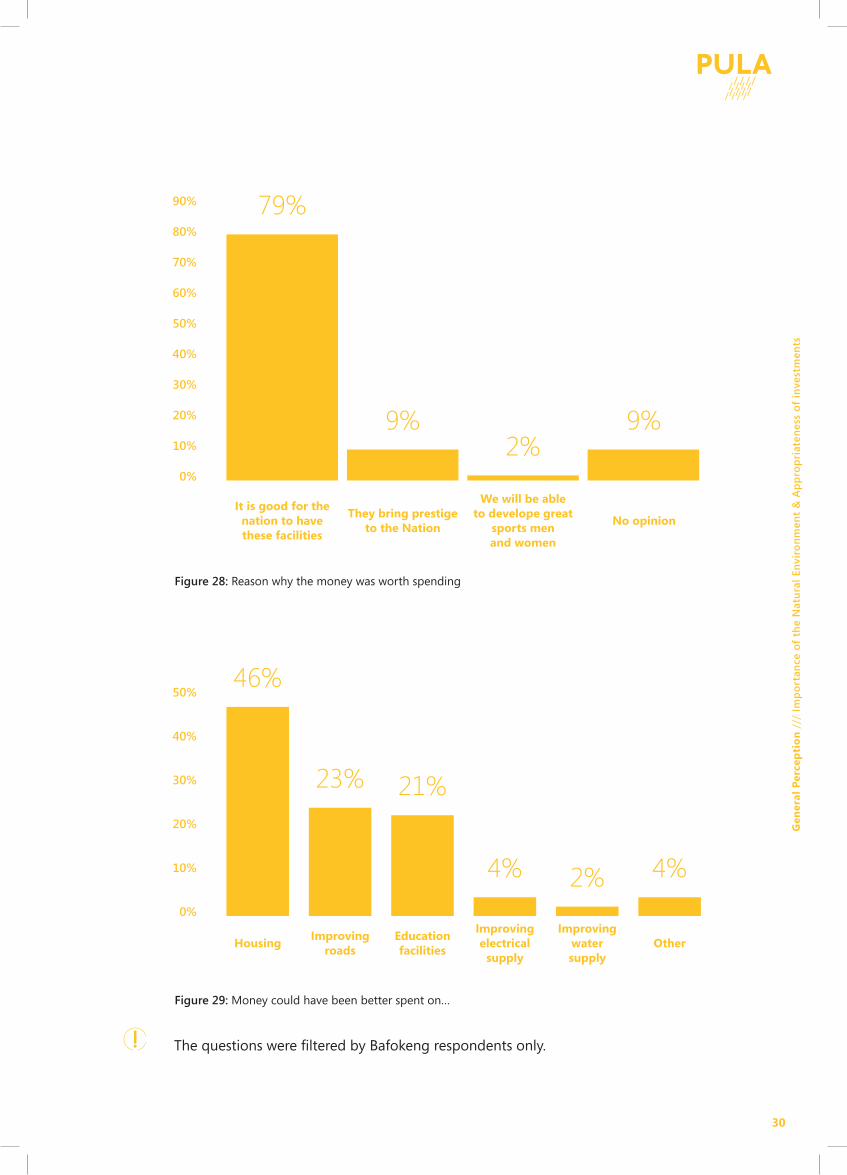
Of the 45% who said that the money was well spent, 79% said that it is good for the Nation to have these facilities and 9% said that it would bring prestige to the Nation. The 36% who think the money was not worth spending put forward a number of suggestions, particularly about infrastructure, where they propose the money should have been spent.
Figure 27: Was money spent on upgrade of Royal Bafokeng Stadium and Sports Campus worth it?
60%
50%
40%
30%
20%
10%
0%
45%Yes 36%
No
19%Don’t know
30
Gen
eral
Per
cep
tio
n /
// I
mp
ort
ance
of
the
Nat
ura
l En
viro
nm
ent
& A
pp
rop
riat
enes
s o
f in
vest
men
ts
The questions were fi ltered by Bafokeng respondents only.
Figure 28: Reason why the money was worth spending
90%
80%
70%
60%
50%
40%
30%
20%
10%
0%
79%
2%9%9%
It is good for the nation to have these facilities
They bring prestige to the Nation
We will be able to develope great
sports men and women
No opinion
Figure 29: Money could have been better spent on…
50%
40%
30%
20%
10%
0%
46%
23% 21%
4% 2% 4%
HousingImproving
roadsEducationfacilities
Improving electrical
supply
Improving watersupply
Other

31

32

33