Embed Size (px)
Citation preview
Body Size Norms and Underestimation of Obesity
Visual Body Size Norms and the Under-Detection of
Overweight and Obesity
Melissa Oldham and Eric Robinson
Psychological Sciences,
Eleanor Rathbone Building,
University of Liverpool
Liverpool, L69 7ZA, UK
Corresponding Author:
Melissa Oldham, above address, Email: [email protected].
Word Count: 6035
Key Words: Weight misperceptions; body size norms; obesity; visual perception
Running Head: Body Size Norms and Visual Underestimation of Obesity
Declaration of Conflicting Interests: The authors declared that they had no conflicts
of interest with respect to their authorship or the publication of this article.
Funding: This research received no external funding. ER’s salary is supported by the
Medical Research Council and the Economic and Social Research Council. ER has also
received research funding from the Wellcome Trust, the National Institute of Health
Research, the American Beverage Association and Unilever.
1
1
1
2
3
4
5
6
7
8
9
10
11
12
13
14
15
16
17
18
19
20
21
22
Body Size Norms and Underestimation of Obesity
Abstract
Objectives: The weight status of men with overweight and obesity tends to be visually
underestimated, but visual recognition of female overweight and obesity has not been
formally examined. The aims of the present studies were to test whether people can
accurately recognise both male and female overweight and obesity and to examine a
visual norm based explanation for why weight status is underestimated.
Methods: The present studies examine whether both male and female overweight and
obesity are visually underestimated (Study 1), whether body size norms predict when
underestimation of weight status occurs (Study 2) and whether visual exposure to
heavier bodyweights adjusts visual body size norms and results in underestimation of
weight status (Study 3).
Results: The weight status of males and females with overweight and obesity was
consistently visually underestimated (Study 1). Body size norms predicted
underestimation of weight status (Study 2) and in part explained why visual exposure to
heavier bodyweights caused underestimation of overweight (Study 3).
Conclusions: The under-detection of overweight and obesity may have been in part
caused by exposure to larger body sizes resulting in an upwards shift in the range of
body sizes that are perceived as being visually ‘normal’.
2
2
23
24
25
26
27
28
29
30
31
32
33
34
35
36
37
38
39
40
41
42
43
44
Body Size Norms and Underestimation of Obesity
Introduction
Although the worldwide prevalence of obesity has increased dramatically over the last
30 years1, there is evidence suggesting that overweight and obesity often go undetected.
Individuals with overweight and obesity consistently underestimate their own weight
status2. Furthermore, a number of studies show that both parents3,4 and health care
professionals (HCPs)5,6 visually underestimate the weight status of children and patients
with overweight and obesity. One potential explanation is that increases in the
prevalence of obesity may have resulted in an upwards shift in the range of body sizes
that are perceived visually as being ‘normal’ and that this may have resulted in
widespread under-detection of overweight and obesity.
Perceptions of stimulus normality form a critical point of reference when making visual
judgements7–9. In relation to body size, this type of ‘norm comparison’ process would
predict that when judging whether a target body is overweight or not, the target body is
compared to a person’s internal visual perception of a ‘normal’ body size and target
bodies will only be judged as being overweight if they appear larger than the ‘norm’. In
support of this theory, a large scale study found that accurate perception of overweight
was more likely as a person’s body size moved away from the population average or
‘normal’ body size10. The exact type of ‘norm comparison’ that is made when judging
weight status is less clear. One proposal is that when making visual judgements, stimuli
are compared against an internal norm or ‘prototype’ of what is perceived as being the
average size9. Another explanation is that body size is perceived categorically11. Thus,
3
3
45
46
47
48
49
50
51
52
53
54
55
56
57
58
59
60
61
62
63
64
65
66
Body Size Norms and Underestimation of Obesity
for each observer there may be a particular range of body sizes that are perceived as
normal and it is only when a person’s body size is above the upper boundary of this
‘norm range’ that they are perceived as being overweight.
If weight status is judged according to a ‘norm comparison’ process12, frequent exposure
to heavier bodyweights could contribute to under-detection of overweight and obesity
by recalibrating perceptions of what constitutes a ‘normal’ body size. This is because
visual body size norms are likely to be based on the size of bodies that are frequently
seen in the environment, otherwise known as the ‘visual diet’7,9,13. Cross-sectional data
suggest that underestimation of personal weight status is more common when there is a
high prevalence of obesity in the local area14,15. There is also experimental evidence
indicating that visual exposure to heavier bodies may increase underestimation of
weight status16, result in greater visual preference for larger bodies 17 and increase the
body sizes which are perceived as being ‘normal’18. Therefore, increases in obesity
prevalence may have shifted the range of body sizes that appear ‘normal’ and, in turn,
impacted the visual recognition of obesity.
A previous study has shown that absolute body weight (e.g. in kgs) tends to be visually
underestimated19, but there has been little direct experimental testing of whether the lay
public can objectively visually identify overweight and obesity. Some work has
suggested that male overweight and obesity tends to be visually underestimated6,20.
However, there has been no systematic examination of visual identification of female
4
4
67
68
69
70
71
72
73
74
75
76
77
78
79
80
81
82
83
84
85
86
87
88
Body Size Norms and Underestimation of Obesity
overweight and obesity. This is of importance because there may be sex differences in
the visual identification of male and female overweight and obesity. For example,
parents21,22 and HCPs23,24 are more likely to underestimate overweight and obesity when
a person is male, as opposed to female. Furthermore, there are different cultural body
ideals for men and women and more emphasis is placed on the value of thinness for
women25. As such, perceptions of the normal female body may be smaller than the
normal male body which could result in more accurate identification of female
overweight and obesity.
This manuscript examines whether exposure to obesity has led to an upwards shift in
terms of what is considered a normal body size and whether this results in greater visual
underestimation of overweight and obesity. No studies have examined whether visual
body size norms explain when overweight and obesity go visually under-detected. Three
experimental studies are reported. Study 1 examined whether the weight status of males
and females with normal weight, overweight and obese BMIs was visually
underestimated. Study 2 investigated whether body size norms explained
underestimation of overweight and obesity. Finally, Study 3 examined whether visual
exposure to obesity alters body size norms and whether this process leads to
underestimation of overweight body sizes. The first hypothesis was that participants
would frequently underestimate the weight status of males and females with overweight
and obesity, but that the level of underestimation may be less pronounced for female, as
opposed to male, overweight and obesity (Study 1). The second hypothesis was that
5
5
89
90
91
92
93
94
95
96
97
98
99
100
101
102
103
104
105
106
107
108
109
110
Body Size Norms and Underestimation of Obesity
body size norms would predict underestimation, whereby those who thought larger
bodies were more normal would be most likely to underestimate overweight and obesity
(Study 2). The third hypothesis was that exposure to heavier bodies would lead to larger
body size norms and this would in turn increase the likelihood of overweight body sizes
being visually underestimated (Study 3).
Study 1
Study 1 was designed to examine whether members of the general public are able to
accurately identify the weight status of men and women with normal weight,
overweight and obese BMIs.
Methods
Participants
One hundred and three US participants were recruited via Amazon Mechanical Turk
(MTURK) which has been identified as a valid online recruitment method26,27. For
example, Casler and colleagues found that data collected using Amazon MTurk was
equivalent to data collected in a laboratory study and that MTurk offered a more varied
sample than a traditional laboratory approach26. Data quality was ensured by only
recruiting MTURK participants with a previous approval rating of ≥ 95% 28.
Participants were asked to complete the survey on a computer or laptop to avoid
distortion to images and the device used was recorded at the end of the survey. All but
one participant reported using a laptop or computer and the participant who did not was
6
6
111
112
113
114
115
116
117
118
119
120
121
122
123
124
125
126
127
128
129
130
131
132
Body Size Norms and Underestimation of Obesity
excluded from analyses along with those who did not complete the study (11
participants did not complete the study; 12 were excluded in total). The mean age of the
final sample (n = 91; 47 females and 44 males) was 38.76 years (SD = 12.99, range = 19
- 70). The mean BMI (calculated from self-reported weight and height) was 27.99 (SD
= 7.51, range = 16.26 – 54.29). The majority of participants were Caucasian (81.3%).
The sample were generally well educated with the majority having had some experience
of college or a bachelor’s degree (83.6%) and the majority (58.3%) earned below $40,
000. The study was approved by the authors’ institutional ethics board (as were Studies
2 and 3). Participants received a small financial remuneration (50 cents) for their time.
Stimuli
The stimuli consisted of photographs of Caucasian males and females with varying
BMI’s [calculated from measured weight (kg)/height2 (m)]. The photographed
individuals were students and staff recruited from the University of Birmingham (men)
and the University of Liverpool (women) in the UK. The models were stood next to a
standard door frame, wearing normally fitting short sleeved t-shirts and full length
trousers or leggings. No models had particularly muscular builds (determined by fat
mass percentage; the males had body fat >8% and the women had a body fat percentage
>21%) and the central section of each model’s face was obscured. In order to select
standardised images of males and females for use in these three studies a pilot study was
conducted in which 40 US participants rated appearance related dimensions of the
photographs, such as attractiveness, posture, how muscular the target appeared and
7
7
133
134
135
136
137
138
139
140
141
142
143
144
145
146
147
148
149
150
151
152
153
154
Body Size Norms and Underestimation of Obesity
tightness of clothing. Twenty one photographs of male models and 21 photographs of
female models were selected [with equal numbers of models in the normal weight range
(BMI = 18.5 - 24.9), overweight range (BMI = 25.0 - 29.9) and obese range (BMI = 30
- 39.9)] that scored similarly on these dimensions. All selected models were aged 18-40.
See online supporting information for example images and for BMI information of the
selected models.
Procedure
The study was advertised as being about how people make judgements about others.
Participants provided digital informed consent and were given World Health
Organisation (WHO) BMI guidelines for underweight (< 18.5), normal weight (18.5 -
24.9) overweight (25.0 - 29.9) obese (30 - 39.9) and severely obese (> 40) weight
statuses. Participants viewed each of the 42 photographs consecutively on separate
pages in a random order and were asked to estimate the weight category of each
photographed person. Participants then provided demographic information (sex, age,
ethnicity, height, weight, education and income) and were debriefed. Participants were
allocated up to 60 minutes to complete the survey.
Analysis
When participants were inaccurate at categorising the weight status of the photographed
models, the overwhelming majority of the time this was because they were
underestimating the model’s weight status (Table 1). Thus, the main analysis focused on
8
8
155
156
157
158
159
160
161
162
163
164
165
166
167
168
169
170
171
172
173
174
175
176
Body Size Norms and Underestimation of Obesity
underestimation of weight status. Underestimation was characterised by calculating a
score out of seven to represent the number of times participants underestimated the
weight status of models from each weight category (normal weight, overweight and
obese men and women). A 2x3 repeated measures ANOVA was planned with sex (male
or female) and weight status (normal weight, overweight or obese) of model as within
subject factors and frequency of underestimation as the dependant variable. If a
significant interaction was found between model sex and weight status, Bonferroni
corrected t tests examining the difference between males and females with normal
weight, overweight and obese BMIs separately were planned. The effect of participant
demographics on underestimation was also examined; participant demographic
variables that were associated with frequency of underestimation (at a conservative
level of p ≤ .20) were controlled for in the primary analysis in order to rule out any
potential confounds. All data was significantly skewed according to the Kolmogorov-
Smirnov test of normality (p’s < .001) and the data was log transformed (as was the case
in Study 2 and 3). Inferential statistics (including effect sizes) were conducted on log
transformed data. Means that are reported are based on the non-transformed data for
ease of interpretation.
Results
9
9
177
178
179
180
181
182
183
184
185
186
187
188
189
190
191
192
193
194
195
196
197
198
Body Size Norms and Underestimation of Obesity
Underestimation
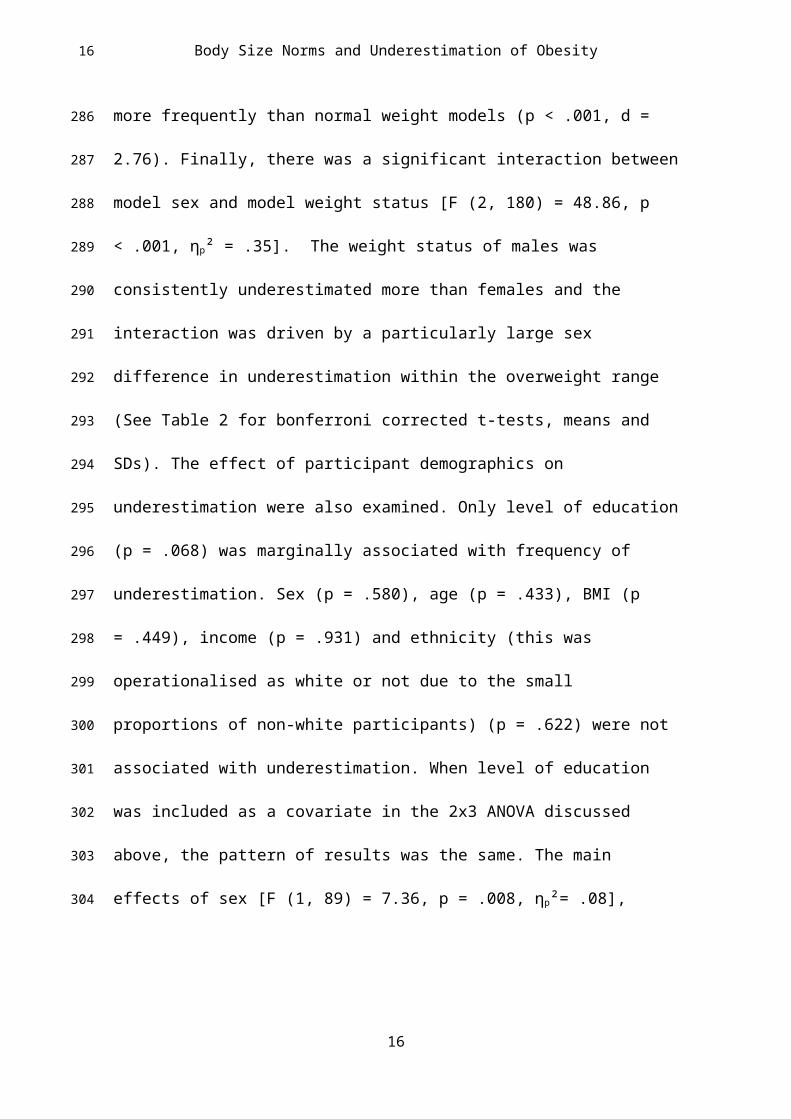
See Table 1 for the frequency of underestimation by weight status. There was a
significant main effect of model sex [F (1, 90) = 303.88, p < .001 ηp² = .77], participants
underestimated the weight status of males (67%) more frequently than females (36%).
There was also a significant effect of model weight status [F (2, 180) = 303.13, p
< .001, ηp² = .77], whereby the weight of obese models was more frequently
underestimated (76%) than overweight (54%) (p < .001, d = 2.64) or normal weight
models (23%) (p < .001, d = 3.0). The weight status of overweight models was also
underestimated significantly more frequently than normal weight models (p < .001, d =
2.76). Finally, there was a significant interaction between model sex and model weight
status [F (2, 180) = 48.86, p < .001, ηp² = .35]. The weight status of males was
consistently underestimated more than females and the interaction was driven by a
particularly large sex difference in underestimation within the overweight range (See
Table 2 for bonferroni corrected t-tests, means and SDs). The effect of participant
demographics on underestimation were also examined. Only level of education (p
= .068) was marginally associated with frequency of underestimation. Sex (p = .580),
age (p = .433), BMI (p = .449), income (p = .931) and ethnicity (this was
operationalised as white or not due to the small proportions of non-white participants)
(p = .622) were not associated with underestimation. When level of education was
included as a covariate in the 2x3 ANOVA discussed above, the pattern of results was
the same. The main effects of sex [F (1, 89) = 7.36, p = .008, ηp²= .08], weight status [F
10
10
199
200
201
202
203
204
205
206
207
208
209
210
211
212
213
214
215
216
217
218
219
Body Size Norms and Underestimation of Obesity
(2, 178) = 23.28, p < .001, ηp²= .21] and the interaction between sex and weight status
[F (2, 178) = 3.60, p = .029, ηp²= .04] remained significant.
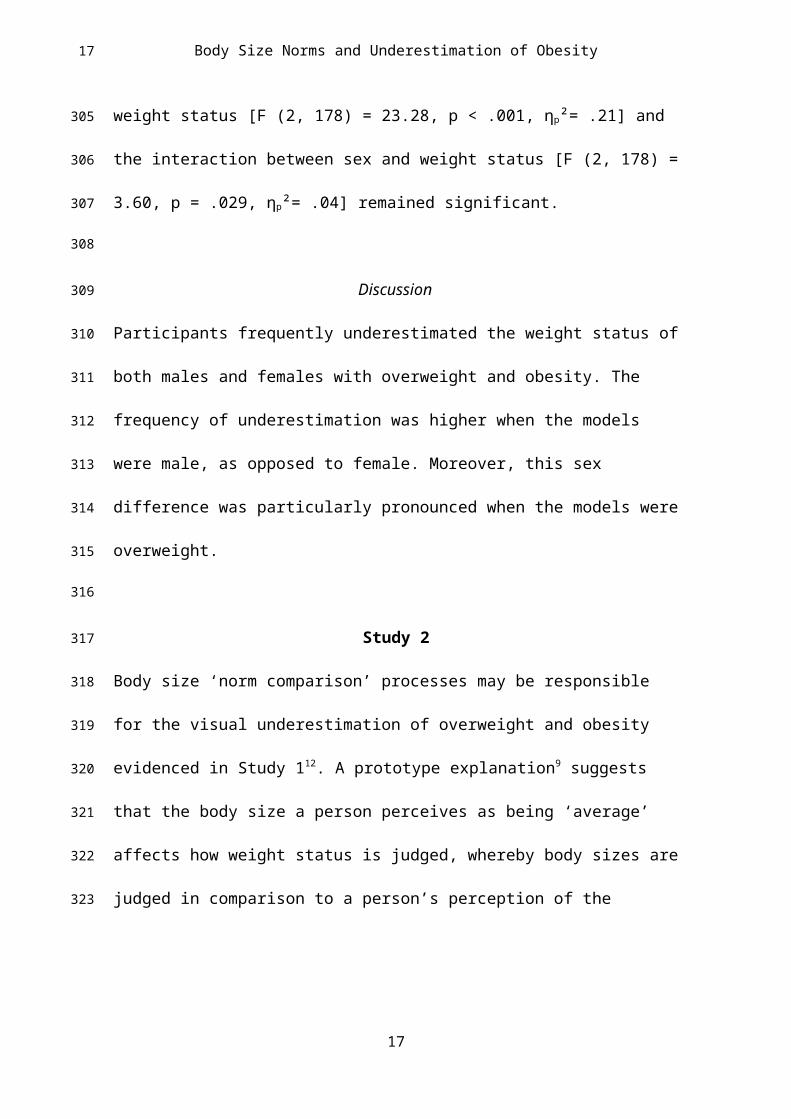
Discussion
Participants frequently underestimated the weight status of both males and females with
overweight and obesity. The frequency of underestimation was higher when the models
were male, as opposed to female. Moreover, this sex difference was particularly
pronounced when the models were overweight.
Study 2
Body size ‘norm comparison’ processes may be responsible for the visual
underestimation of overweight and obesity evidenced in Study 112. A prototype
explanation9 suggests that the body size a person perceives as being ‘average’ affects
how weight status is judged, whereby body sizes are judged in comparison to a person’s
perception of the ‘average’ body. Based on visual categorisation theory11, there are a
range of body sizes categorised as being ‘normal’ and how a body compares to the
largest body within the ‘normal range’ of body sizes is critical. Study 2 examined
whether either of these processes predict when the weight status of males and females
with overweight is visually underestimated. As underestimation was common in the
overweight range in Study 1, Study 2 focused on the overweight BMI range.
11
11
220
221
222
223
224
225
226
227
228
229
230
231
232
233
234
235
236
237
238
239
240
241
Body Size Norms and Underestimation of Obesity
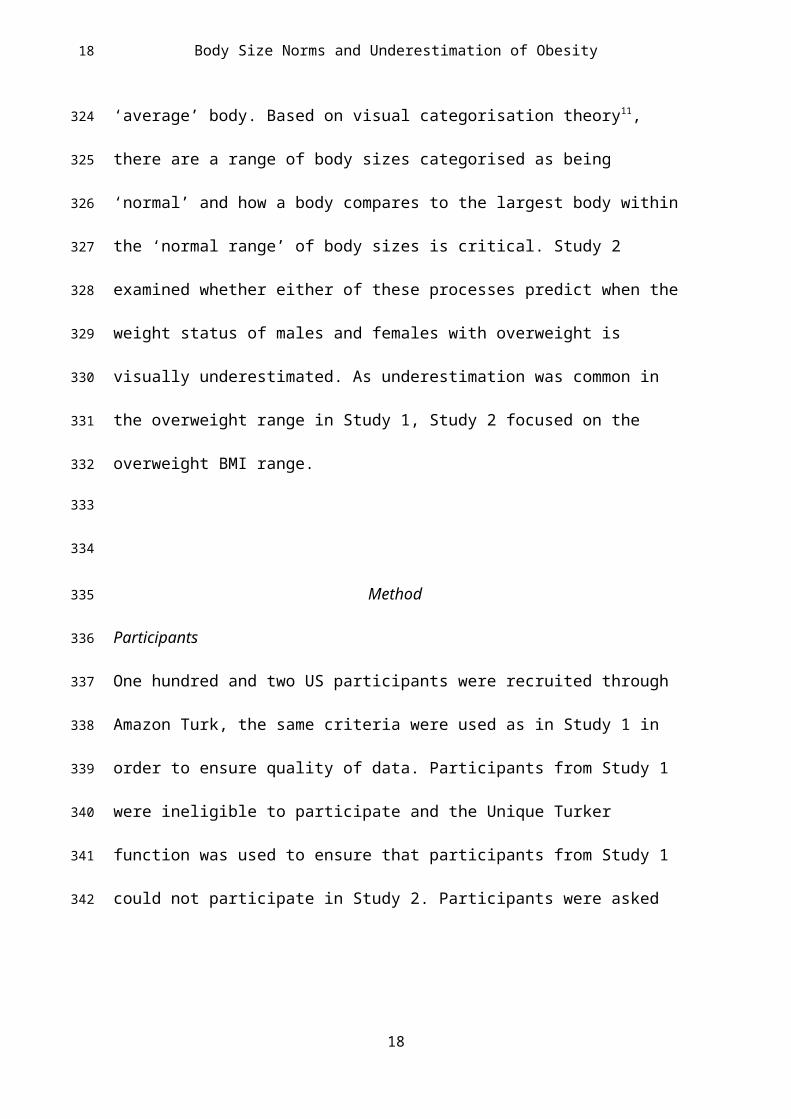
Method
Participants
One hundred and two US participants were recruited through Amazon Turk, the same
criteria were used as in Study 1 in order to ensure quality of data. Participants from
Study 1 were ineligible to participate and the Unique Turker function was used to
ensure that participants from Study 1 could not participate in Study 2. Participants were
asked to complete the survey on a computer or laptop and all participants reported
complying with this rule. Participants were excluded from final analyses if they did not
complete the study (23 participants started but did not complete the study). The final
sample of 79 participants (41 females and 38 males) had a mean age of 37.41 years (SD
= 12.66, range = 19 - 67) and their mean BMI (calculated from self-reported weight and
height) was 26.06 (SD = 5.87, range = 16.55 - 45.56). The majority of participants were
Caucasian (83.5%). The sample were generally well educated with the majority having
had some experience of college or a bachelor’s degree (78.5%) and the majority
(60.8%) earned below $40, 000. Participants received remuneration (50 cents) for their
time.
Procedure
The study was advertised as being about how people make judgements about people
that they do not know. Participants gave digital consent and were given the same BMI
guidance as in Study 1. They then viewed fourteen photographs, featuring the same
overweight models as in Study 1, in a random order on separate pages and were asked
12
12
242
243
244
245
246
247
248
249
250
251
252
253
254
255
256
257
258
259
260
261
262
263
Body Size Norms and Underestimation of Obesity
to estimate the weight status of each model. To measure body size norms, participants
were next shown male and female Body Size Guides (BSG)29; validated rating scales
consisting of photographs of 10 standardized human bodies of increasing BMI, ranging
from underweight to class III obesity (see Figure 1). Participants were asked to select
the body size (for males and females separately) that they thought ‘best represented an
average size’ and were asked to select all of the body sizes they believed ‘looked
normal in size’. The order in which participants completed these measures was
randomized. Participants then provided demographic information (sex, age, ethnicity,
height, weight, education and income) and were debriefed. Participants were allocated
up to 60 minutes to complete the survey.
Analysis
Underestimation was characterised by the number of photographs (out of 7), for which a
participant underestimated the weight status of the model. Participants were also given
scores (1 being the slimmest image and 10 being the largest) for the male and female
body sizes they selected as being average (average) and the slimmest and largest body
sizes they selected as falling within a normal range (lower and upper norm boundary)
using the BSGs. As it is conceivable that the number of body sizes perceived as being
normal could influence judgements, the width of the norm range (number of bodies
selected as being ‘normal’) was also computed (norm width). To examine differences in
judgements made between males and females, sex discrepancy scores were then
13
13
264
265
266
267
268
269
270
271
272
273
274
275
276
277
278
279
280
281
282
283
284
Body Size Norms and Underestimation of Obesity
calculated by subtracting the male score from the female equivalent for each of the
above measures.
Stepwise regression analyses were planned to compare the different norm judgments in
terms of the extent to which they predicted underestimation of weight status, as this
regression model automatically selects the strongest predictors and removes non-
significant predictors. To examine which norm measures best predicted underestimation
of weight status for men and women separately, two stepwise regression analyses were
planned with the upper and lower norm boundary, average and norm width as predictor
variables and frequency of underestimation as the outcome variable. In order to examine
whether a discrepancy in what was perceived as being normal for men vs. women
predicted why male overweight was underestimated more frequently than female
overweight, a further stepwise regression model was conducted. In this model the sex
discrepancy (difference in score between male vs. female models) in the upper and
lower norm boundary, norm width and average body size were predictor variables and
sex discrepancy in underestimation of weight status was the outcome variable. Finally,
for each stepwise regression model demographic factors which were associated with
underestimation (as in Study 1; at a conservative level of p ≤ .20) were controlled for.
14
14
285
286
287
288
289
290
291
292
293
294
295
296
297
298
299
300
301
302
303
304
305
306
Body Size Norms and Underestimation of Obesity
Results
Underestimation and norm judgements
In line with Study 1, participants underestimated the weight status of significantly more
male models (84%) than female models (36%) [t (78) = 17.18, p < .001, d = 2.32].
Participants believed that an average male body size (M = 4.28, SD = 1.15) was larger
than the average female body size [M = 3.70, SD = 1.18; t (78) = 5.45, p < .001, d
= .60]. Similarly, participants selected larger lower and upper norm boundaries for
males (Lower M = 2.91, SD = 1.07, Upper M = 4.80 SD = 1.37) than females [Lower M
= 2.39, SD = 1.11, Upper M = 4.24 SD = 1.60; Lower = t (78) = 5.84, p < .001 d = .54,
Upper = t (78) = 5.16, p < .001, d = .36]. The width of the normal range was similar for
males (M = 2.86, SD = 1.83) and females [M = 2.85, SD = 1.97; t (78) = .35, p = .726, d
< .01].
Male underestimation
The regression model examining male underestimation was statistically significant [F
(1, 78) = 14.46, p < .001, ∆R2 = .15] and the upper norm boundary was identified as a
significant predictor of underestimation (B = .259, SE = .07, β = .398, t = 3.80, p
< .001). The lower norm boundary, average and norm width (all p’s > .05) did not
predict underestimation (see Table 3). For each one unit increase in the upper norm
boundary, frequency of underestimation increased by 4%. There was no evidence of
significant multicollinearity [variance inflation factor (VIF) < 3]. In order to be sure that
demographic factors were not influencing underestimation, further analyses were
15
15
307
308
309
310
311
312
313
314
315
316
317
318
319
320
321
322
323
324
325
326
327
328
Body Size Norms and Underestimation of Obesity
conducted examining whether any of the main results differed when controlling for
participant demographic variables that were associated with underestimation at p ≤ .20.
For male underestimation; neither sex (p = .273), age (p = .543), ethnicity (white or not)
(p = .680), education level (p = .980), income (p = .905) or BMI (p = .895) were
associated with underestimation at p ≤ .20, so no further analyses were conducted.
Female underestimation
The regression model examining female underestimation was statistically significant [F
(1, 78) = 18.05, p < .001, ∆R2 = .18]. The upper norm boundary was identified as a
significant predictor of underestimation (B = .417, SE = .10, β = .436, t = 4.25, p
< .001). The lower norm boundary, average and norm width (all p’s > .05) did not
predict underestimation (Table 3). For each one unit increase in the upper norm
boundary, frequency of underestimation increased by 6%. There was no evidence of
significant multicollinearity (VIF < 3). Education (p = .043), BMI, (p = .039) and
income (p = .137) were associated with underestimation at p ≤ .20, whereas sex (p
= .491), age (p = .401) and ethnicity (white or not) (p = .576) were not. After controlling
for BMI, education and income, the upper norm boundary was still a significant
predictor of underestimation [B = .417, SE = .10, β = .436, t = 4.25 p <.001].
Sex discrepancy in underestimation
The regression model examining sex discrepancy in underestimation was statistically
significant [F (1, 78) = 8.65, p = .004; ∆R2 = .09]. The upper norm boundary
16
16
329
330
331
332
333
334
335
336
337
338
339
340
341
342
343
344
345
346
347
348
349
350
Body Size Norms and Underestimation of Obesity
discrepancy was identified as a significant predictor of underestimation discrepancy (B
= .398 SE = .14, β = .318, t = 2.94, p = .004). The lower norm boundary discrepancy,
average discrepancy and norm width discrepancy (all p’s > .05) did not predict
underestimation discrepancy (Table 3). For every one unit difference between male and
female upper norm boundaries, the tendency for male overweight to be underestimated
more than female overweight increased by 5%. There was no evidence of significant
multicollinearity (VIF < 3). Sex (p = .173), education (p = .035), income (p = .159) and
BMI (p = .023) were associated with the sex discrepancy in underestimation at p ≤ .20,
whereas age (p = .216) and ethnicity (white or not) (p = .995) were not. After
controlling for sex, education, income and BMI, the discrepancy in upper bounds was
still a significant predictor of the discrepancy in underestimation [B = .398, SE = .14, β
= .318, t = 2.94, p = .004].
Discussion
In line with Study 1, the weight status of males and females with overweight was
frequently underestimated. The results of Study 2 supported a categorisation theory of
body norms and weight status underestimation 11. The results suggest that there are a
range of body sizes that are perceived as being normal in size and when a target body is
bigger than the largest body size in this ‘norm range’ (the ‘upper norm boundary’),
underestimation of weight status is more likely to occur. Furthermore, sex differences in
this ‘upper norm boundary’ was associated with male overweight being more
17
17
351
352
353
354
355
356
357
358
359
360
361
362
363
364
365
366
367
368
369
370
371
Body Size Norms and Underestimation of Obesity
frequently underestimated than female overweight; the largest body size perceived as
being ‘normal’ was bigger for men than women.
Study 3
The aim of Study 3 was to directly examine the hypothesis that exposure to obesity
results in an upwards shift in the range of body sizes that are perceived as being
‘normal’, resulting in visual underestimation of weight status. Based on the findings of
Study 2, it was expected that exposure to obesity would result in an upwards shift in the
largest body size perceived as being normal (the upper norm boundary), leading to
increased underestimation of weight status. In Study 3, some of the potential limitations
associated with the stimuli used in Studies 1 and 2 were addressed. The images in the
first two studies were not fully standardized (e.g. participant clothing varied between
stimuli). Although it is unlikely that these factors would have affected the pattern of
results observed, ideally stimuli should be as standardized as is possible in terms of both
clothing and colour 30. As such, stimuli in Study 3 were presented in greyscale and
standardised images taken from the BSG; the validated body image scale used in Study
229.
Method
Participants
Because Study 3 involved an experimental manipulation, a larger sample size was
recruited and the study was powered to detect medium sized between-subjects effects16.
18
18
372
373
374
375
376
377
378
379
380
381
382
383
384
385
386
387
388
389
390
391
392
393
Body Size Norms and Underestimation of Obesity
Three hundred and twenty four US participants were recruited via Amazon Mechanical
Turk and Unique Turker was used to ensure that participants who took part in Studies 1
and 2 did not take part in Study 3. The same criteria was used as in Study 1 and 2 in
order to ensure quality of data. Participants who failed to complete study instructions
(34 participants) were excluded from analyses. Participants were asked to complete the
survey on a computer or laptop and received remuneration 50 cents) for their time. The
final sample of 290 participants (174 females and 116 males) had a mean age of 35.55
years (SD = 12.40, range = 18 - 77) and a mean BMI of 28.66 (SD = 9.59, range =
14.68 - 74.45). The majority of participants were Caucasian (76.9%), had some
experience of college or a bachelor’s degree (72.7%) and earned below $40,000 (60%).
Procedure
Participants were told that the aim of the study was to examine how personality
impacted judgements about others (cover story). After providing consent, participants
provided demographics (sex, age, ethnicity, height, weight, education and income) and
completed personality questions (e.g. ‘I am an outgoing person’) to distract from the
study aims. Participants either made ratings about images of males or females (between-
subjects). In the exposure phase of the experiment, participants were exposed to 10
images of BSGs (see Figure 1) with either normal weight (BMI = 18.5 – 24.9) or obese
(BMI 35-39.9) BMIs (between-subjects) on consecutive pages and were asked to make
one non weight related judgements about each image (e.g. ‘he/she looks like he/she
would be kind’). This procedure allowed us to visually expose participants to different
19
19
394
395
396
397
398
399
400
401
402
403
404
405
406
407
408
409
410
411
412
413
414
415
Body Size Norms and Underestimation of Obesity
body sizes in a way that corroborated the study cover story. Participants then completed
the norm judgement questions as in Study 2 [BSGs 29]. Finally, participants were asked
to estimate the weight status of an overweight male or female BSG (the sex of the
overweight BSG being evaluated was the same as the sex of BSGs participants were
exposed to). The presentation of the norm and weight judgement tasks was
counterbalanced. Participants were then asked to guess the aims (none of the
participants accurately guessed the aims of the study) and were debriefed. Participants
were allocated up to 60 minutes to complete the survey.
Analysis
Separate analyses for judgements about females and males were conducted. A series of t
tests were planned to examine whether exposure condition (normal weight or obese)
impacted judgements about norms (upper norm boundary, lower norm boundary,
average and norm width) and chi squares were used to examine whether exposure
condition impacted frequency of underestimation. Next, binary logistic regression
analyses were planned to examine whether any of the norm judgements that differed
significantly between exposure conditions were independently associated with
underestimation. If this was the case, PROCESS mediation analyses 31 were planned in
order to examine whether the effect of exposure to obesity on underestimation of weight
status was mediated by alteration to body size norm measures. In order to examine
whether results were consistent, any demographic factors which were associated with
20
20
416
417
418
419
420
421
422
423
424
425
426
427
428
429
430
431
432
433
434
435
436
Body Size Norms and Underestimation of Obesity
underestimation (at a conservative level of p ≤ .20) were controlled for in the mediation
analyses.
Results
The effect of exposure on judgements about females
Participants who were exposed to females with obesity later underestimated the weight
status of the female with overweight (43%) significantly more than participants who
were exposed to normal weight females (13%). Furthermore, participants exposed to
females with obesity chose a larger body size as being the largest body that fell within
the ‘normal’ range (upper norm boundary) than participants exposed to normal weight
females. Participants in the obese exposure condition also selected a larger ‘average’
body size and had a borderline significantly larger norm width than participants in the
normal weight exposure condition. Lower bound judgements did not differ between
exposure conditions (See Table 4 for Chi Square and t test results). In the binary logistic
regression model, upper norm boundary (B = -9.391, SE = 2.50, p < .001) and norm
width (B = -3.084, SE = 1.17, p = .008) were significantly associated with
underestimation, whereby a larger upper norm boundary and norm width predicted
underestimation. The average norm was not associated with underestimation (B =.576,
SE = 1.78, p = .746). In the parallel PROCESS mediation model, the upper norm
boundary significantly mediated the relationship between condition and underestimation
(B = -.675, Bca CI’s = -1.69, -.10) whereas norm width did not (B = .337, Bca CI’s =
-.01, 1.19; see Figure 2). Participant age (p = .008), education (p < .001) and BMI (p
21
21
437
438
439
440
441
442
443
444
445
446
447
448
449
450
451
452
453
454
455
456
457
458
Body Size Norms and Underestimation of Obesity
= .025) were all associated with underestimation at a level of p ≤ .20, whereas sex (p
= .550), income (p = .865) and ethnicity (white or not) (p = .582) were not. When age,
education and BMI were included as covariates in the parallel mediation model
described above the pattern of results did not change. The upper norm boundary still
mediated the relationship between condition and underestimation when age [B = -.626,
Bca CI’s = -1.54, -.03], education [B = -.721, Bca CI’s = -1.94, -.06] and BMI [B =
-.645, Bca CI’s = -1.64, -.08] were included as covariates.
The effect of exposure on judgements about males
Underestimation tended to be more common after being exposed to males with obesity
(92%), as opposed to normal weight males (83%). This did not reach statistical
significance (p = .097) but this may be due to the high prevalence of underestimation in
both conditions. Participants exposed to obesity selected a larger body as the upper
norm boundary and a larger body size as being average, as well as selecting a wider
norm width. Exposure condition had no impact on the lower norm boundary (Table 4).
In the binary logistic regression model, upper norm boundary (B = -.12.266, SE = 4.01,
p = .002) and average norm (B = -5.066, SE = .226, p = .025) were significantly
associated with underestimation, whereby a larger upper norm boundary and average
predicted underestimation. Norm width was not associated with underestimation (B =
1.940, SE = 1.86, p = .298). In the parallel PROCESS mediation model a significant
indirect effect of condition on underestimation through the upper norm boundary was
observed (B = -.694, Bca CI’s = -1.41, -.24), as well as through the average norm (B =
22
22
459
460
461
462
463
464
465
466
467
468
469
470
471
472
473
474
475
476
477
478
479
480
Body Size Norms and Underestimation of Obesity
-.330, Bca CI’s = -.85, -.03; see Figure 3). Participant ethnicity (white or not) (p = .011)
and age (p = .041) were associated with underestimation at a level of p ≤ .20, whereas
sex (p = .976), income (p = .438) education (p = .267) and BMI (p = .656) were not.
The indirect effects of both the upper norm boundary [ethnicity = B = -.664, Bca CI’s =
-1.36, -.23; age = B = -.579, Bca CI’s = -1.20, -.17] and the average [ethnicity = B =
-.307, Bca CI’s = -.82, -.01; age = B = -.300, Bca CI’s = -.78, -.02] remained significant
when ethnicity and age were included as covariates in the parallel mediation model
Discussion
Visual exposure to obesity shifted the range of body sizes perceived as being ‘normal’
upwards which acted as a mediator in explaining the effect of exposure to obesity on
visual underestimation of overweight. Norms regarding what an average weight looked
like also mediated the relationship between exposure to obesity and underestimation
when judging the overweight status of males but not females.
General Discussion
The present studies suggest that overweight and obesity are under-detected visually
which may be caused by exposure to larger body sizes having changed the range of
body sizes which are perceptually judged as being ‘normal’. The present findings
support a ‘norm comparison’ theory of the underestimation of weight status3,13. This
theory suggests that bodies that are perceived as being outside of the range of body sizes
that are considered to be normal will be judged as being overweight. The increased
23
23
481
482
483
484
485
486
487
488
489
490
491
492
493
494
495
496
497
498
499
500
501
502
Body Size Norms and Underestimation of Obesity
prevalence of obesity is likely to have resulted in heavier body sizes being perceived as
being ‘normal’. These findings could explain why visual underestimation of obesity is
more common in countries with a higher obesity prevalence 32 and why individuals with
overweight peers are more likely to underestimate their own weight status 15.
Previous work has found that male overweight and obesity is visually underestimated
2,6,32 and here this was also found to be the case for female overweight and obesity.
However, the weight status of males with overweight was more likely to be
underestimated than that of females. Media influence could be partly responsible for the
sex discrepancy in underestimation as female models and actresses are more likely to be
slender than males 33,34 and there is a persuasive western ‘thin ideal’, whereby thinness is
valued more positively and presented more frequently for females than males 25 . These
factors are therefore likely to result in thinner body sizes appearing more normal for
females than males, as was the case in Study 2. In line with this, there is evidence that
women are more likely to overestimate their weight status than men 35,36. Future research
should examine the separate and combined effects of exposure to heavier and slimmer
bodies in the media and in everyday life on body size norms and perception of weight.
The implications and applied relevance of the present studies now require further
attention. Some researchers suggest that a failure to identify overweight and obesity in
others could be a barrier to weight loss, as family members37 and clinicians38 could be
important agents of change in terms of promoting healthier behaviours. Parents who
underestimate child overweight are less likely to be concerned about their child’s
24
24
503
504
505
506
507
508
509
510
511
512
513
514
515
516
517
518
519
520
521
522
523
524
Body Size Norms and Underestimation of Obesity
weight39 and are less likely to attempt a weight loss intervention40,41. Furthermore, GPs
are less likely to discuss weight loss interventions with patients when they
underestimated the patients weight6. These studies are suggestive of a need for more
accurate recognition of overweight and obesity. This could be achieved by training
parents and HCPs to recognise body size norms which represent a healthier weight.
Conversely, an emerging literature suggests that underestimation of overweight may not
be a barrier to weight loss, as self-identification of overweight has been shown to be
associated with a number of adverse outcomes, including greater body dissatisfaction42,
depression 43 and weight gain44,45. These findings are consistent with a broader literature
on obesity and body satisfaction which shows that many individuals with obesity report
higher body dissatisfaction46,47 which can impact on self-esteem and depression46. These
findings are likely to be at least in part due to the stigma of obesity48–50 which could
make identifying as being overweight or obese unpleasant. One solution to this would
be to ensure that weight information is relayed to patients in a sensitive and non-
stigmatising way and to build stigma reduction techniques into future weight loss
interventions. Furthermore, different strategies for reducing the potentially negative
effects that self-perceived overweight can have on body satisfaction, weight related
behaviours and weight gain may warrant investigation.
A limitation of the present studies was that the sample was predominantly Caucasian
(81% average across the 3 studies). Similarly, the models used as stimuli in the studies
25
25
525
526
527
528
529
530
531
532
533
534
535
536
537
538
539
540
541
542
543
544
545
546
Body Size Norms and Underestimation of Obesity
were Caucasian. Some studies suggest that identification of overweight51 and body
norms52 can be affected by ethnicity, so further work in more diverse samples would
now be valuable. It may also be the case that overweight and obesity are more easily
detected in person than when using photograph stimuli and this may have resulted in
poorer identification of weight status in the present studies. However, it should be noted
that there is convincing evidence of widespread under-detection of overweight and
obesity when judgements are made in person53,54. As all three studies were conducted
online a further limitation could be reduced control over participant responses.
However, we used a number of procedures to limit this concern; we sampled only
reliable participants from MTURK (determined by their previous approval ratings) and
included attention checks to detect whether participants were completing our studies as
intended. Finally, there may be some limitations associated with the photographic
stimuli used in Studies 1 and 2. Although the male and female sets were closely
matched in terms of the BMI and appearance of the models, the male and female
photograph sets used in Studies 1 and 2 are not perfectly matched (e.g. in terms of the
clothing worn by models). However, the same pattern of results observed in studies 1
and 2 was observed in Study 3 where the images used were standardised.
Overweight and obesity are under-detected visually. The visual under-detection of
overweight and obesity may be in part caused by exposure to obesity changing the range
of body sizes that are perceptually judged as being ‘normal’.
26
26
547
548
549
550
551
552
553
554
555
556
557
558
559
560
561
562
563
564
565
566
567
568
Body Size Norms and Underestimation of Obesity
References
1. Swinburn BA, Sacks G, Hall KD, McPherson K, Finegood DT, Moodie ML,
Gortmaker SL. The global obesity pandemic: shaped by global drivers and local
environments. Lancet 2011; 378(9793): 804–814.
27
27
569
570
571
572
573
574
575
576
577
578
579
580
581
582
583
584
585
586
587
588
589
590
Body Size Norms and Underestimation of Obesity
2. Robinson E, Oldham M. Weight status misperceptions among UK adults: the use
of self-reported vs. measured BMI. BMC Obes 2016; 3(21): 4–9.
3. Lundahl AA, Kidwell KM. Parental underestimates of child weight: a meta-
analysis. Pediatrics 2014; 133(3): 1–15.
4. Jones AR, Parkinson KN, Drewett RF, Hyland RM, Pearce MS, Adamson AJ.
Parental perceptions of weight status in children: the gateshead millennium study.
Int J Obes 2011; 35(7): 953–62.
5. Yaemsiri S, Slining MM, Agarwal SK. Perceived weight status, overweight
diagnosis and weight control among US adults: the NHANES 2003-2008 Study.
Int J Obes 2011; 35(8): 1063–70.
6. Robinson E, Parretti H, Aveyard P. Visual identification of obesity by healthcare
professionals: an experimental study of trainee and qualified GPs. Br J Gen Prac
2014; 64(628): 703–8.
7. Winkler C, Rhodes G. Perceptual adaptation affects attractiveness of female
bodies. Br J Psychol 2005; 96: 141–54.
8. Rhodes G, Jeffrey L. Adaptive norm-based coding of facial identity. Vision
Research 2006; 46(18): 2977–2987.
9. Panis S, Wagemans J, Op de Beeck HP. Dynamic norm-based encoding for
unfamiliar shapes in human visual cortex. J Cogn Neurosci 2010; 23(7): 1829–
1843.
10. Wardle J, Haase AM, Steptoe A. Body image and weight control in young adults:
international comparisons in university students from 22 countries. Int J Obes
28
28
591
592
593
594
595
596
597
598
599
600
601
602
603
604
605
606
607
608
609
610
611
612
Body Size Norms and Underestimation of Obesity
2006; 30(4): 644–51.
11. Tovée MJ, Edmonds L, Vuong QC. Categorical perception of human female
physical attractiveness and health. Evol Hum Behav 2012; 33(2): 85–93.
12. Robinson E, Kersbergen I. Overweight or about right? A norm comparison
explanation of perceived weight status. Obes Sci Pract 2016; 3(1): 15–17.
13. Brooks KR, Mond JM, Stevenson RJ, Stephen ID. Body image distortion and
exposure to extreme body types: contingent adaptation and cross adaptation for
self and other. Front Neurosci 2016; 10(334): 1-10.
14. Binkin N, Spinelli A, Baglio G, Lamberti A. What is common becomes normal:
the effect of obesity prevalence on maternal perception. Nutr Metab Cardiovasc
Dis 2013; 23(5): 410–6.
15. Maximova K, McGrath JJ, Barnett T, O’Loughlin J, Paradis G, Lambert M. Do
you see what I see? Weight status misperception and exposure to obesity among
children and adolescents. Int J Obes 2008; 32(6): 1008–15.
16. Robinson E, Kirkham TC. Is he a healthy weight? Exposure to obesity changes
perception of the weight status of others. Int J Obes 2014; 38(5): 663–7.
17. Boothroyd LG, Tovée MJ, Pollet TV. Visual diet versus associative learning as
mechanisms of change in body size preferences. PLoS One 2012; 7(11): 1-6.
18. Glauert R, Rhodes G, Byrne S, Fink B, Grammer K. Body dissatisfaction and the
effects of perceptual exposure on body norms and ideals. Int J Eat Disord 2009;
42(5): 443–52.
19. Cornelissen KK, Gledhill LJ, Cornelissen PL, Tovée MJ. Visual biases in judging
29
29
613
614
615
616
617
618
619
620
621
622
623
624
625
626
627
628
629
630
631
632
633
634
Body Size Norms and Underestimation of Obesity
body weight. Br J Health Psy 2016; 21(3): 555-569.
20. Oldham M, Robinson E. Visual weight status misperceptions of men: why
overweight can look like a healthy weight. J Health Psychol 2015; 21(8): 1–10.
21. De La O A, Jordan KC, Ortiz K, et al. Do parents accurately perceive their
child’s weight status? J Pediatric Health Care 2009; 23(4): 216–21.
22. He M, Evans A. Are parents aware that their children are overweight or obese?
Do they care? Can Fam Physician 2007; 53(9): 1493–9.
23. Yoong SL, Carey ML, Sanson-Fisher RW, D’Este CA, Mackenzie L, Boyes A. A
cross-sectional study examining Australian general practitioners’ identification of
overweight and obese patients. J Gen Intern Med 2014; 29(2): 328–34.
24. Ko JY, Brown DR, Galuska DA, Zhang J, Blanck HM, Ainsworth BE. Weight
loss advice U.S. obese adults receive from health care professionals. Prev Med
2008; 47(6): 587–92.
25. Spitzer BL, Henderson KA, Zivian MT. Gender differences in population versus
media body sizes: a comparison over four decades. Sex Roles 1999; 40(7–8):
545–65.
26. Casler K, Bickel L, Hackett, E. Separate but equal? A comparison of participants
and data gathered via Amazon's MTurk, social media, and face to face behavioral
testing. Comput Hum Behav 2013; 29(6): 2156-2160.
27. Buhrmester M, Kwang T, Gosling SD. Amazon’s mechanical turk: a new source
of inexpensive, yet high-quality data? Perspectives on Psychological Science
2011; 6(1): 1–3.
30
30
635
636
637
638
639
640
641
642
643
644
645
646
647
648
649
650
651
652
653
654
655
656
Body Size Norms and Underestimation of Obesity
28. Peer E, Vosgerau J, Acquisti A. Reputation as a sufficient condition for data
quality on Amazon Mechanical Turk. Behav Res Methods 2014; 46(4): 1023–
1031.
29. Harris CV, Bradlyn AS, Coffman J, Gunel E, Cottrell L. BMI-based body size
guides for women and men: development and validation of a novel pictorial
method to assess weight-related concepts. Int J Obes 2008; 32(2): 336–42.
30. Swami V, Salem N, Furnham A, Tovée MJ. Initial examination of the validity
and reliability of the female photographic figure rating scale for body image
assessment. Pers Individ Dif 2008; 44(8): 1752–61.
31. Hayes AF. PROCESS: A versatile computational tool for observed variable
mediation, moderation and conditional process modeling. 2013. Retrieved from
http://www.afhayes.com/ public/process2012.pdf.
32. Robinson E, Hogenkamp PS. Visual perceptions of male obesity: a cross-cultural
study examining male and female lay perceptions of obesity in Caucasian males.
BMC Public Health 2015; 15(1): 492.
33. Greenberg BS, Eastin M, Hofschire L, Lachlan K, Brownell KD. Portrayals of
overweight and obese individuals on commercial television. Am J Public Health
2003; 93(8): 1342–8.
34. Leit RA, Pope HG, Gray JJ. Cultural expectations of muscularity in men: the
evolution of playgirl centerfolds. Int J Eating Disorders 1999; 29(1): 90-93.
35. Brug J, Wammes B, Kremers S, Giskes K, Oenema, A. Underestimation and
overestimation of personal weight status: associations with socio-demographic
31
31
657
658
659
660
661
662
663
664
665
666
667
668
669
670
671
672
673
674
675
676
677
678
Body Size Norms and Underestimation of Obesity
characteristics and weight maintenance intentions. J Hum Nutr Diet 2006; 19(4):
253–262.
36. Park, E. Overestimation and underestimation: adolescents’ weight perception in
comparison to BMI-based weight status and how it varies across
sociodemographic factors. J Sch Health 2011; 81(2): 57–64.
37. Golan, M. Parents as agents of change in childhood obesity from research to
practice. Int J Pediatr Obes 2006; 1(2): 66–76.
38. Spurrier NJ, Magarey A, Wong C. Recognition and management of childhood
overweight and obesity by clinicians. J Paediatr Child Health 2006; 42(7-8):
411–8.
39. Tschamler JM, Conn KM, Cook SR, Halterman JS. Underestimation of
children’s weight status: views of parents in an urban community. Clin Pediatr
2010; 49(5): 470–476.
40. Vuorela N, Saha MT, Salo MK. Parents underestimate their child’s overweight.
Int. J. Paediatr 2010; 99(9): 1374–1379.
41. Rhee K, DeLago C, Arscott-Mills T, Mehta S, Davis R. Factors associated with
parental readiness to make changes for overweight children. Pediatrics 2005;
116(1): 94–101.
42. Miller CT, Downey KTA. A meta-analysis of heavyweight and self-esteem.
Personal Soc Psychol Rev 1999; 3: 68–84.
43. Al Mamun A, Cramb S, McDermott BM, O'Callaghan M, Naiman JM, Williams
GM. Adolescents’ perceived weight associated with depression in young
32
32
679
680
681
682
683
684
685
686
687
688
689
690
691
692
693
694
695
696
697
698
699
700
Body Size Norms and Underestimation of Obesity
adulthood: a longitudinal study. Obesity 2007; 15(12): 3097–3105.
44. Robinson E, Sutin AR. Parental perception of weight status and weight gain
across childhood. Pediatrics 2016; 137(5): e20153957.
45. Robinson E, Hunger JM, Daly M. Perceived weight status and risk of weight gain
across life in US and UK adults. Int J Obes 2015; 39(12): 1721–6.
46. Sarwer DB, Wadden TA, Foster GD. Assessment of body image dissatisfaction
in obese women: specificity, severity and clinical significance. J Consult Clin
Psychol 1998; 66(4): 651–654.
47. Sarwer DB, Thompson JK, Cash TF. Body image and obesity in adulthood.
Psychiatr Clin North Am 2005; 28(1), 69–87.
48. Puhl R, Brownell KD. Bias, discrimination and obesity. Obes Res 2001; 9(12):
788–805.
49. Puhl RM, Heuer CA. The stigma of obesity: a review and update. Epidemiology
2009; 17(5): 941–964.
50. Puhl RM, Heuer CA. Obesity stigma: important considerations for public health.
Am J Public Health 2010; 100(6): 1019–1028.
51. Dorsey RR, Eberhardt MS, Ogden CL. Racial and ethnic differences in weight
management behavior by weight perception status. Ethn Dis 2010; 20(3): 244–
50.
52. Kemper KA, Sargent RG, Drane JW, Valois RF, Hussey JR. Black and white
females’ perceptions of ideal body size and social norms. Obes Res 1994; 2(2):
117–26.
33
33
701
702
703
704
705
706
707
708
709
710
711
712
713
714
715
716
717
718
719
720
721
722
Body Size Norms and Underestimation of Obesity
53. Bramlage P, Wittchen HU, Pittrow D et al. Recognition and management of
overweight and obesity in primary care in Germany. Int J Obes Relat Metab
Disord 2004; 28(10): 1299–308.
54. Christensen VT. Influences of sex and BMI on the weight level perception of
others. Am J Health Behav. 2016; 40(5): 604–13.
34
34
723
724
725
726
727
728
729
730
731
732
Body Size Norms and Underestimation of Obesity
Tables
Table 1 Percentage of underestimation, accuracy and overestimation of male and female photographs in Study 1Sex Weight Status Underestimated (%) Accurate (%) Overestimated (%)
Male Normal weight 32% 67% 1%Overweight 79% 21% 0%
Obese 90% 10% 0%Female Normal weight 14 % 79% 7%
Overweight 30% 60% 10%Obese 62% 35% 3%
Participants judged seven photographs of males and seven photographs of females from the three weight status categories.
35
35
733
734735
736737738
739
740
741
742
743
744
745
Body Size Norms and Underestimation of Obesity
Table 2 Means (SD) and t-test results for underestimation scores for male and female photographs in Study 1
Female models Male models t-test Result
Normal weight 1.01 (.67) 2.23 (1.68) t (90) = 7.35, p <.001, d = 0.95
Overweight 2.11 (1.81) 5.52 (1.50) t (90) = 17.59, p < .001, d = 2.04
Obese 4.35 (1.93) 6.29 (1.03) t (90) = 11.08, p < .001, d = 1.25
Means refer to the average number of models’ weight status which was underestimated (as participants estimated the weight status of 7 male and 7 female models the mean is out of out of 7).
36
36
746747
748
749
750
751
752753754755
756
757
758
759
760
Body Size Norms and Underestimation of Obesity
Table 3. Standardized Beta, t values and p values for non-significant predictors in the stepwise regression models for male and female underestimation and the discrepancy in underestimation in Study 2.
Upper Norm Boundary Lower Norm Boundary Average Norm Width
Underestimation of male overweight
B = .259, t = 3.80, p < .001
B = .095, t = .90, p = .369
B = -.040, t = .36 p = .723
B = -.141, t = .90, p = .374
Underestimation of female overweight
B = .417, t = 4.25, p < .001
B = .186, t = 1.84, p = .069
B = .213, t = 1.93, p = .057
B = -.297, t = 1.92 p = .059
Discrepancy between underestimation of male and female
overweight
B = .398, t = 2.94, p = .004
B = .154, t = 1.29, p = .200
B = .099, t = .87 p = .386
B = -.167, t = 1.22, p = .225
37
37
761
762
763
764765766
767
768
769
Body Size Norms and Underestimation of Obesity
Table 4 The effect of experimental exposure condition on norm judgements and underestimation in Study 3
Normal weight Exposure
Obese Exposure
Test Results
Females (N = 142) (N = 68) (N = 74)
Upper norm boundary 4.66 (2.28) 5.28 (1.97) t (140) = -2.31, p = .022, d = .37
Lower norm boundary 2.18 (1.01) 2.31 (1.38) t (140) = -.08, p = .935, d = .01
Average 3.60 (1.07) 4.32 (1.29) t (140) = -3.36, p = .001, d = .52
Norm width 3.47 (2.72) 3.91 (2.17) t (140) = -1.92, p = .057, d = .33
Underestimation of weight status 9 (13%) 32 (43%) X2 (1, N = 142) = 15.54, p < .001, V = .33
Males (N = 148) (N = 75) (N = 73)
Upper norm boundary 4.56 (1.50) 5.52 (1.98) t (146) = - 3.27, p = .001, d = .50
Lower norm boundary 2.67 (0.88) 2.74 (1.01) t (146) = -.048, p = .962, d = .01
Average 4.18 (1.10) 4.78 (1.19) t (146) = -3.20, p = .002, d = .50
Norm width 2.88 (1.82) 3.78 (2.42) t (146) = -2.12, p = .036, d = .35
38
38
770
771
772
773774
Body Size Norms and Underestimation of Obesity
Underestimation of weight status 62 (83%) 67 (92%) X2 (1, N = 148) = 2.75, p = .097, V = .14
For upper norm boundary, lower norm boundary and average, values refer to body sizes selected using BSG scales
and are M(SD). Norm width refers to number of body sizes selected using BSG scales are M(SD). Underestimated
refers to number of participants underestimating the weight status of the overweight model [frequency(%)].
39
39
775
776
777