Embed Size (px)
Citation preview
Manuscript Proofs
Date sent:
Manuscript number:
Manuscript title:
To:
Scheduled for:
E-mail:
RSNA Publications 820 Jorie Boulevard Oak Brook, IL 60523 USA
E-mail: Phone:
Manuscript Proofs
Your manuscript proofs are in PDF format. To review them, you will need Adobe Acrobat Reader installed on your computer system.
Author queries are indicated in the margin in red. Annotate the PDF proofs with your corrections using Acrobat comment and markup tools (preferred), or e-mail a list of your corrections to the manuscript editor. We recommend that you retain a copy of the corrected manuscript.
Do not unlock the PDF to make corrections in the file: Changes in this format will not be accepted and may delay publication.
Image resolution in this PDF proof is lower to allow for faster viewing; the final online version of your article will faithfully represent your original image files.
Figure sizing, table construction, and many layout decisions have already been made. Please keep your changes to a mini-mum and correct only inaccuracies.
Manuscript Editing
Your manuscript has been edited for RSNA style and usage, which are based on widely accepted conventions of grammar and the AMA Manual of Style. Please review the proofs carefully to ensure that your meaning has been retained. Please note that not all editorial changes will be indicated by an author query. These will be the last proofs you receive before publication, so all changes should be considered final.
Supplemental Material
If your article has supplemental material, it will appear at the end of these PDF proofs. Supplemental material receives a very light edit. It is your responsibility to verify all information in the sup-plement is correct and to return any corrections to the manuscript editor. You will not receive supplemental figures unless there is a specific question about an image.
Return and Publication
Return the corrected proofs and any requested forms to your manuscript editor at the e-mail address below within 2 days of receipt. Failure to return proofs within this time period may affect the publication date of your article.

TECHNICAL DEVELOPMENT
More than 3 million Americans (1) have a cardiac im-plantable electronic device (CIED), such as a pacemak-
er, implantable cardioverter defibrillator (ICD), or cardiac resynchronization therapy device, with each device serving a specific purpose to increase the survival rate and quality of life. Patients with an implantable defibrillator (ICD or cardiac resynchronization therapy defibrillator) are at high risk for development of new or worsening cardiac symp-toms because almost all of them have preexisting coronary artery disease, heart failure, or both, thereby warranting noninvasive imaging to rule out reversible symptoms.
Because patients with a CIED often have contraindi-cations to exercise or dobutamine stress echocardiography (eg, tachyarrhythmia), such patients who present with new or worsening cardiac symptoms routinely undergo a combination of vasodilator cardiac SPECT (perfusion
and viability) and resting echocardiography (function, valves) as part of their clinical workup. The necessity of two cardiac imaging tests (stress SPECT, resting echocar-diography) to diagnose new or worsening cardiac symp-toms in patients with a CIED represented an inefficient use of health care resources. As a versatile modality with which to accurately assess myocardial perfusion, function, viability, and valves, cardiovascular MRI may deliver bet-ter value compared with the requisite combination of two cardiac imaging modalities (SPECT, echocardiography) in patients with a CIED. Although cardiac MRI safety at 1.5 T in patients with a CIED was manageable (2), clinically important1 image artifacts occurring in 33%–48% of cases (3,4) remained a major limitation.
Rashid et al (5) first introduced the wideband con-cept for late gadolinium-enhanced (LGE) cardiac MRI
1. It is RSNA style to reserve “significant” for use in the statistical sense. Does “clinically important” retain your intended meaning?
This copy is for personal use only. To order printed copies, contact [email protected]
Purpose: To develop an accelerated wideband cardiac perfusion pulse sequence and test whether it can produce diagnostically accept-able image quality and whether it can be used to reliably quantify myocardial blood flow (MBF) in patients with a cardiac implantable electronic device (CIED).
Materials and Methods: A fivefold accelerated wideband perfusion pulse sequence was developed using compressed sensing to sample one arterial input function (AIF) plane and three myocardial perfusion (MP) planes per heartbeat in patients with a CIED with heart rates as high as 102 beats per minute. Resting perfusion scans were performed in 10 patients with a CIED and in 10 patients with no device as a control group. Two clinical readers compared the resulting images and retrospective images of the 10 patients with a CIED, which were obtained by using a previously described twofold accelerated wideband perfusion pulse sequence with temporal generalized au-tocalibrating partially parallel acquisition. Summed visual score (SVS) was defined as the sum of conspicuity, artifact, and noise scores individually ranging from 1 (worst) to 5 (best). Resting MBF in the remote zones was quantified using Fermi deconvolution.
Results: Median SVS was significantly different (P < .05) between the prospective and retrospective CIED groups (13 vs nine) and between the nondevice group and the retrospective CIED group (13.5 vs nine); all median SVSs were nine or greater (clinically ac-ceptable cut point). The median resting MBF in remote zones was not significantly different (P = .27) between patients with a CIED (1.1 mL/min/g; median left ventricular ejection fraction [LVEF], 52.5%) and patients with no device (1.3 mL/min/g; median LVEF, 64.0%). Mean MBF values were consistent with those (mean resting MBF range, 1.0–1.2 mL/min/g) reported by two prior state-of-the-art cardiac perfusion MRI studies.
Conclusion: The proposed scan yielded diagnostically acceptable image quality and enabled reliable quantification of MBF with three MP planes per heartbeat in patients with a CIED with heart rates as high as 102 beats per minute.
Supplemental material is available for this article.
© RSNA, 2020
Accelerated Wideband Myocardial Perfusion Pulse Sequence with Compressed Sensing Reconstruction for Myocardial Blood Flow Quantification in Patients with a Cardiac Implantable Electronic DeviceKyungPyo Hong24, PhD • Jeremy D. Collins, MD • Benjamin H. Freed, MD • Lexiaozi Fan, MS • Andrew E. Arai, MD • Li-Yueh Hsu, DSc • Daniel C. Lee, MD • Daniel Kim,25 PhD
From the Department of Radiology (K.P.H., L.F., D.K.) and Division of Cardiology,26Internal Medicine (B.H.F., D.C.L.), Northwestern University Feinberg School of Medicine, 737 N Michigan Ave, Suite 1600, Chicago, IL 60611; Department of Radiology, Mayo Clinic, Rochester, Minn (J.D.C.); Laboratory for Advanced Cardiovascular Imaging, National Heart, Lung, and Blood Institute, National Institutes of Health, Bethesda, Md (A.E.A., L.Y.H.); and Department of Biomedical Engineering, Northwestern University, Evanston, Ill (L.F., D.K.). Received June 13, 2019; revision requested August 20; revision received September 17; accepted October 2. Address correspondence to D.K. (e-mail: [email protected])27.
Supported by the National Institutes of Health (R01HL116895, R01HL138578, R21EB024315, R21AG055954) and American Heart Association (19IPLOI34760317).
Conflicts of interest are listed at the end of this article.
Radiology: Cardiothoracic Imaging 2020; 2(2):e190114 • https://doi.org/10.1148/ryct.2020190114 • Content codes:
24. Please verify the spelling and order of author names.
25. The RSNA pro-vides social media cover-age of journal articles. Please pro-vide us with any Twitter handles used by authors in the group. Please also provide Twit-ter handles for your de-partment (or institution). If your depart-ment uses other social media (eg, Instagram/Facebook), then provide those handles as an alterna-tive.
26. Is this the Depart-ment of Inter-nal Medicine at Northwest-ern? Please clarify, if necessary.
27. Okay to publish your e-mail address?
2 rcti.rsna.org n Radiology: Cardiothoracic Imaging Volume 2: Number 2—2020
Accelerated Wideband Cardiac Perfusion MRI
as compressed sensing (CS), to achieve relatively high spatial resolution (approximately 2 3 2 mm) and sample one arte-rial input function (AIF) plane and at least three myocardial perfusion (MP) planes per heartbeat. A previously described wideband cardiac perfusion pulse sequence (8) using a tem-poral generalized autocalibrating partially parallel acquisition acceleration factor (R) of two was insufficient to achieve the aforementioned objectives in patients with a CIED with rapid heart rates. Previously described accelerated cardiac perfusion cardiac MRI methods, including k-space and time (k-t) SLR (9), k-t SPARSE-SENSE (10), L + S (11), BLOSM (12), and TCR4 (13), had not been extended for wideband imaging and tested in patients with a CIED. Thus, a new cardiac perfusion pulse sequence that combined wideband imaging, AIF imaging (14), and highly accelerated Cartesian k-space sampling meth-ods was necessary to achieve the aforementioned objectives (high spatial resolution with adequate myocardial coverage, clinically acceptable image quality, reliable MBF) in patients with a CIED.
In this initial feasibility study, we sought to develop a five-fold accelerated wideband quantitative perfusion cardiac MRI pulse sequence by combining wideband, AIF imaging, and CS methods and testing whether it could produce images of diag-nostically acceptable image quality with high spatial resolution (approximately 2 3 2 mm) and adequate myocardial coverage (three MP planes per heartbeat with heart rates as high as 102 beats per minute) and be used to reliably quantify MBF in pa-tients with a CIED.
Materials and Methods
Experiment 1: Prospective Evaluation of Image Quality and MBF in Patients with a CIED and in Patients with No DeviceWe prospectively enrolled 10 patients with a CIED (seven men, three women; median age, 53.8 years; interquartile range [IQR], 35.6 years5) and 10 patients with no device (four men, six women; median age, 59.2 years; IQR, 9.9 years) who were undergoing clinical cardiac MRI with administration of a gadolinium-based contrast agent6. Because these clinical cardiac MRI scans did not involve dynamic contrast material–enhanced cardiac MRI, they provided us an opportunity to add resting perfusion scans for research without substantially altering the clinical workflow. Pa-tients with no device undergoing clinical cardiac MRI to rule out either infiltrative or hypertrophic cardiomyopathy were enrolled to serve as the control group for resting MBF. For each patient, the rhythm status during cardiac MRI was estimated by extract-ing the mean and standard deviation of the R-R interval embed-ded in the Digital Imaging and Communications in Medicine header of retrospective electrocardiography-gated cine data ac-quired as part of the clinical cardiac MRI routine. This study was conducted in accordance with protocols approved by the institutional review board and was compliant with the Health Insurance Portability and Accountability Act. All participants provided written informed consent. See Table E1 (supplement) for patient characteristics, including risk factors for myocardial ischemia and device types.
4. Please provide
expansions for SLR,
SPARSE-SENSE, L + S, BLOSM,
and TCR. Please verify expansion of
k-t as k-space and time.
5. OK that IQR is
one number throughout, instead of a
range?
6. If pos-sible, please
specify the type and
amount of contrast
material that was used.
to invert highly off-resonant spins using wideband radiofre-quency inversion pulses. This concept had been extended for cardiac T1 mapping (6,7) and perfusion cardiac MRI (8). For patients with a CIED with new or worsening coronary artery disease, it might have been desirable to quantify myocardial blood flow (MBF) in milliliters per minute per gram for longi-tudinal follow-up, enabling detection of multi- and microves-sel disease and prediction of outcomes. However, it was tech-nically challenging to perform quantitative perfusion cardiac MRI in patients with a CIED for several reasons. First, a CIED caused significant8 static magnetic field variations (off reso-nance) across the heart, on the order of several kilohertz (5). To compensate for such high off resonance, a wideband saturation pulse (8) was recommended to achieve uniform T1 weighting across the heart and set the residual longitudinal magnetization immediately after saturation pulse to near zero, and Cartesian k-space sampling was recommended over non–Cartesian k-space sampling to avoid 3significant geometric distortion in-duced by several kilohertz off resonance. Second, patients with a CIED typically had a high burden of arrhythmia and/or rapid heart rate, thereby necessitating acceleration techniques, such
2. Is “significant”
being used in the statistical sense in this
sentence?
3. Is “significant”
being used in the statistical sense in this
sentence? If not, will
“substantial” retain the intended
meaning?
AbbreviationsAIF = arterial input function, CIED = cardiac implantable electron-ic device, CS = compressed sensing, ICD = implantable cardioverter defibrillator, IQR = interquartile range, LGE = late gadolinium en-hanced, MBF = myocardial blood flow, MP = myocardial perfusion, PCA = principal component analysis, SVS = summed visual score, TS = saturation recovery time to the center of k-space
SummaryA28 fivefold accelerated cardiac perfusion pulse sequence with compressed sensing reconstruction to quantify myocardial blood flow (MBF) in patients with a cardiac implantable electronic device (CIED) showed that the proposed method was capable of producing high image quality with relatively high spatial resolution (approxi-mately 2 3 2 mm) and enabled reliable quantification of MBF in three short-axis planes per heartbeat in patients with a CIED with heart rates as high as 102 beats per minute.
Key Points n Although recently developed wideband cardiac perfusion MRI us-
ing standard parallel imaging was capable of suppressing image ar-tifacts induced by cardiac implantable electronic devices (CIEDs), its relatively low data acquisition efficiency made it challenging to achieve relatively high spatial resolution (approximately 2 3 2 mm) and extensive myocardial coverage and to include arterial in-put function imaging for myocardial blood flow quantification.
n By leveraging data acceleration afforded by compressed sensing, this study sought to develop a fivefold accelerated wideband cardi-ac perfusion pulse sequence to acquire an arterial input function to quantify myocardial blood flow and produce clinically acceptable image quality with relatively high spatial resolution (approximately 2 3 2 mm) in three short-axis planes per heartbeat in patients with a CIED with heart rates as high as 102 beats per minute.
n Results from this study showed that the proposed pulse sequence with compressed sensing reconstruction produced 2.1 3 2.1 mm spatial resolution with at least three short-axis planes per heartbeat in patients with a CIED (median heart rate, 65 beats per minute) and clinically acceptable image quality and resting myocardial blood flow values that were comparable to those from patients with no device (control group).
28. Is the shortened summary statement
OK?
Radiology: Cardiothoracic Imaging Volume 2: Number 2—2020 n rcti.rsna.org 3
Hong et al
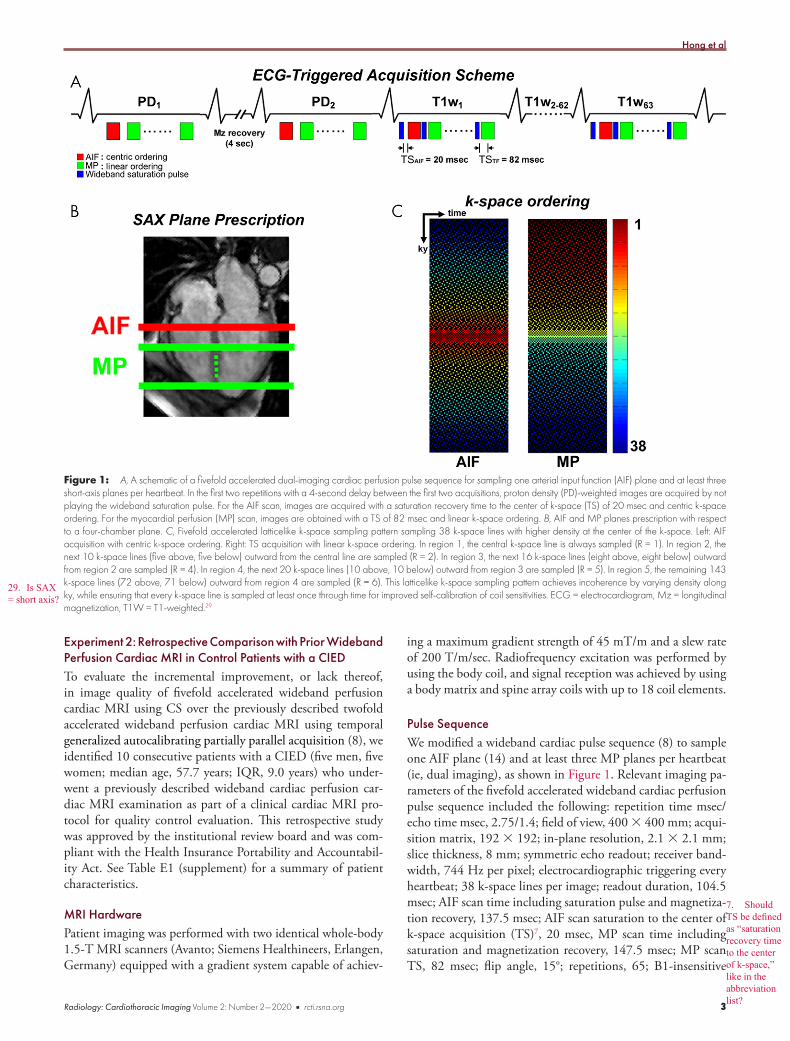
Figure 1: A, A schematic of a fivefold accelerated dual-imaging cardiac perfusion pulse sequence for sampling one arterial input function (AIF) plane and at least three short-axis planes per heartbeat. In the first two repetitions with a 4-second delay between the first two acquisitions, proton density (PD)-weighted images are acquired by not playing the wideband saturation pulse. For the AIF scan, images are acquired with a saturation recovery time to the center of k-space (TS) of 20 msec and centric k-space ordering. For the myocardial perfusion (MP) scan, images are obtained with a TS of 82 msec and linear k-space ordering. B, AIF and MP planes prescription with respect to a four-chamber plane. C, Fivefold accelerated latticelike k-space sampling pattern sampling 38 k-space lines with higher density at the center of the k-space. Left: AIF acquisition with centric k-space ordering. Right: TS acquisition with linear k-space ordering. In region 1, the central k-space line is always sampled (R = 1). In region 2, the next 10 k-space lines (five above, five below) outward from the central line are sampled (R = 2). In region 3, the next 16 k-space lines (eight above, eight below) outward from region 2 are sampled (R = 4). In region 4, the next 20 k-space lines (10 above, 10 below) outward from region 3 are sampled (R = 5). In region 5, the remaining 143 k-space lines (72 above, 71 below) outward from region 4 are sampled (R = 6). This latticelike k-space sampling pattern achieves incoherence by varying density along ky, while ensuring that every k-space line is sampled at least once through time for improved self-calibration of coil sensitivities. ECG = electrocardiogram, Mz = longitudinal magnetization, T1W = T1-weighted.29
29. Is SAX = short axis?
ing a maximum gradient strength of 45 mT/m and a slew rate of 200 T/m/sec. Radiofrequency excitation was performed by using the body coil, and signal reception was achieved by using a body matrix and spine array coils with up to 18 coil elements.
Pulse SequenceWe modified a wideband cardiac pulse sequence (8) to sample one AIF plane (14) and at least three MP planes per heartbeat (ie, dual imaging), as shown in Figure 1. Relevant imaging pa-rameters of the fivefold accelerated wideband cardiac perfusion pulse sequence included the following: repetition time msec/echo time msec, 2.75/1.4; field of view, 400 3 400 mm; acqui-sition matrix, 192 3 192; in-plane resolution, 2.1 3 2.1 mm; slice thickness, 8 mm; symmetric echo readout; receiver band-width, 744 Hz per pixel; electrocardiographic triggering every heartbeat; 38 k-space lines per image; readout duration, 104.5 msec; AIF scan time including saturation pulse and magnetiza-tion recovery, 137.5 msec; AIF scan saturation to the center of k-space acquisition (TS)7, 20 msec, MP scan time including saturation and magnetization recovery, 147.5 msec; MP scan TS, 82 msec; flip angle, 15°; repetitions, 65; B1-insensitive
7. Should TS be defined as “saturation recovery time to the center of k-space,” like in the abbreviation list?
Experiment 2: Retrospective Comparison with Prior Wideband Perfusion Cardiac MRI in Control Patients with a CIEDTo evaluate the incremental improvement, or lack thereof, in image quality of fivefold accelerated wideband perfusion cardiac MRI using CS over the previously described twofold accelerated wideband perfusion cardiac MRI using temporal generalized autocalibrating partially parallel acquisition (8), we identified 10 consecutive patients with a CIED (five men, five women; median age, 57.7 years; IQR, 9.0 years) who under-went a previously described wideband cardiac perfusion car-diac MRI examination as part of a clinical cardiac MRI pro-tocol for quality control evaluation. This retrospective study was approved by the institutional review board and was com-pliant with the Health Insurance Portability and Accountabil-ity Act. See Table E1 (supplement) for a summary of patient characteristics.
MRI HardwarePatient imaging was performed with two identical whole-body 1.5-T MRI scanners (Avanto; Siemens Healthineers, Erlangen, Germany) equipped with a gradient system capable of achiev-
4 rcti.rsna.org n Radiology: Cardiothoracic Imaging Volume 2: Number 2—2020
Accelerated Wideband Cardiac Perfusion MRI
Each perfusion scan was conducted with administration of gado-butrol (0.1 mmol/kg, Gadavist; Bayer Healthcare Pharmaceuti-cals, Whippany, NJ) via antecubital intravenous injection using a power injector at a rate of 5 mL/sec followed by injection of 20 mL of saline at a rate of 5 mL/sec. Gadobutrol with a 1-mol/L concentration was diluted with an equal volume of saline to re-duce T2* decay and signal clipping in the left ventricular cavity at peak blood enhancement. All perfusion scans were performed during shallow free breathing for patient comfort. In experiment 2, for each retrospective patient with a CIED, previously de-scribed wideband perfusion cardiac MRI was conducted using the same gadobutrol protocol described previously.
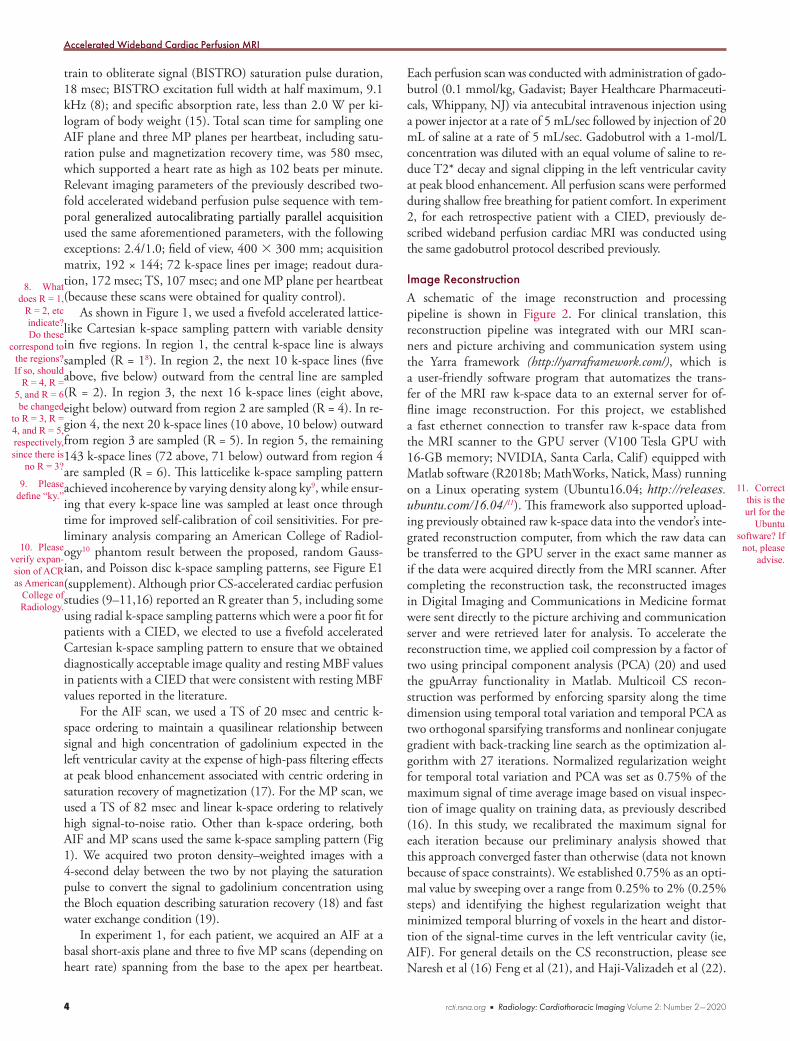
Image ReconstructionA schematic of the image reconstruction and processing pipeline is shown in Figure 2. For clinical translation, this reconstruction pipeline was integrated with our MRI scan-ners and picture archiving and communication system using the Yarra framework (http://yarraframework.com/), which is a user-friendly software program that automatizes the trans-fer of the MRI raw k-space data to an external server for of-fline image reconstruction. For this project, we established a fast ethernet connection to transfer raw k-space data from the MRI scanner to the GPU server (V100 Tesla GPU with 16-GB memory; NVIDIA, Santa Carla, Calif ) equipped with Matlab software (R2018b; MathWorks, Natick, Mass) running on a Linux operating system (Ubuntu16.04; http://releases.ubuntu.com/16.04/11). This framework also supported upload-ing previously obtained raw k-space data into the vendor’s inte-grated reconstruction computer, from which the raw data can be transferred to the GPU server in the exact same manner as if the data were acquired directly from the MRI scanner. After completing the reconstruction task, the reconstructed images in Digital Imaging and Communications in Medicine format were sent directly to the picture archiving and communication server and were retrieved later for analysis. To accelerate the reconstruction time, we applied coil compression by a factor of two using principal component analysis (PCA) (20) and used the gpuArray functionality in Matlab. Multicoil CS recon-struction was performed by enforcing sparsity along the time dimension using temporal total variation and temporal PCA as two orthogonal sparsifying transforms and nonlinear conjugate gradient with back-tracking line search as the optimization al-gorithm with 27 iterations. Normalized regularization weight for temporal total variation and PCA was set as 0.75% of the maximum signal of time average image based on visual inspec-tion of image quality on training data, as previously described (16). In this study, we recalibrated the maximum signal for each iteration because our preliminary analysis showed that this approach converged faster than otherwise (data not known because of space constraints). We established 0.75% as an opti-mal value by sweeping over a range from 0.25% to 2% (0.25% steps) and identifying the highest regularization weight that minimized temporal blurring of voxels in the heart and distor-tion of the signal-time curves in the left ventricular cavity (ie, AIF). For general details on the CS reconstruction, please see Naresh et al (16) Feng et al (21), and Haji-Valizadeh et al (22).
11. Correct this is the url for the
Ubuntu software? If
not, please advise.
train to obliterate signal (BISTRO) saturation pulse duration, 18 msec; BISTRO excitation full width at half maximum, 9.1 kHz (8); and specific absorption rate, less than 2.0 W per ki-logram of body weight (15). Total scan time for sampling one AIF plane and three MP planes per heartbeat, including satu-ration pulse and magnetization recovery time, was 580 msec, which supported a heart rate as high as 102 beats per minute. Relevant imaging parameters of the previously described two-fold accelerated wideband perfusion pulse sequence with tem-poral generalized autocalibrating partially parallel acquisition used the same aforementioned parameters, with the following exceptions: 2.4/1.0; field of view, 400 3 300 mm; acquisition matrix, 192 × 144; 72 k-space lines per image; readout dura-tion, 172 msec; TS, 107 msec; and one MP plane per heartbeat (because these scans were obtained for quality control).
As shown in Figure 1, we used a fivefold accelerated lattice-like Cartesian k-space sampling pattern with variable density in five regions. In region 1, the central k-space line is always sampled (R = 18). In region 2, the next 10 k-space lines (five above, five below) outward from the central line are sampled (R = 2). In region 3, the next 16 k-space lines (eight above, eight below) outward from region 2 are sampled (R = 4). In re-gion 4, the next 20 k-space lines (10 above, 10 below) outward from region 3 are sampled (R = 5). In region 5, the remaining 143 k-space lines (72 above, 71 below) outward from region 4 are sampled (R = 6). This latticelike k-space sampling pattern achieved incoherence by varying density along ky9, while ensur-ing that every k-space line was sampled at least once through time for improved self-calibration of coil sensitivities. For pre-liminary analysis comparing an American College of Radiol-ogy10 phantom result between the proposed, random Gauss-ian, and Poisson disc k-space sampling patterns, see Figure E1 (supplement). Although prior CS-accelerated cardiac perfusion studies (9–11,16) reported an R greater than 5, including some using radial k-space sampling patterns which were a poor fit for patients with a CIED, we elected to use a fivefold accelerated Cartesian k-space sampling pattern to ensure that we obtained diagnostically acceptable image quality and resting MBF values in patients with a CIED that were consistent with resting MBF values reported in the literature.
For the AIF scan, we used a TS of 20 msec and centric k-space ordering to maintain a quasilinear relationship between signal and high concentration of gadolinium expected in the left ventricular cavity at the expense of high-pass filtering effects at peak blood enhancement associated with centric ordering in saturation recovery of magnetization (17). For the MP scan, we used a TS of 82 msec and linear k-space ordering to relatively high signal-to-noise ratio. Other than k-space ordering, both AIF and MP scans used the same k-space sampling pattern (Fig 1). We acquired two proton density–weighted images with a 4-second delay between the two by not playing the saturation pulse to convert the signal to gadolinium concentration using the Bloch equation describing saturation recovery (18) and fast water exchange condition (19).
In experiment 1, for each patient, we acquired an AIF at a basal short-axis plane and three to five MP scans (depending on heart rate) spanning from the base to the apex per heartbeat.
8. What does R = 1,
R = 2, etc indicate? Do these
correspond to the regions? If so, should
R = 4, R = 5, and R = 6 be changed
to R = 3, R = 4, and R = 5, respectively, since there is
no R = 3?
9. Please define “ky.”
10. Please verify expan-sion of ACR as American
College of Radiology.
Radiology: Cardiothoracic Imaging Volume 2: Number 2—2020 n rcti.rsna.org 5
Hong et al
MBF QuantificationOne investigator14 (XX) performed image processing (mo-tion correction) and analysis to quantify MBF. As a first step, each CS reconstructed perfusion time series was processed with custom software that was validated previously for au-tomated motion correction (23). After motion correction, T1-weighted images were normalized with the proton den-sity–weighted images to correct for the unknown equilibrium magnetization and to convert normalized signal to gadolin-ium concentration (18) by assuming the longitudinal relaxiv-ity of gadobutrol was 5.3 and 5.2 mmol-1·sec-115 for the blood and myocardium, respectively (24). Native myocardial and blood T1 values were measured from unenhanced data (ie, the first T1-weighted image before contrast material arrival). For AIF, the signal-time curves were derived by manually drawing a region of interest inside the left ventricular cavity. A Fermi function (25) was assumed to be the transfer function to de-convolve the MP gadolinium-time curves with AIF for cal-culation of MBF on a pixel-by-pixel basis. To speed up data processing, MBF quantification was restricted to a smaller field of view that encapsulated the heart. For more details on MBF quantification, please see Naresh et al (16). To calculate mean resting MBF per plane, endo- and epicardial contours were manually segmented on a motion-corrected image at peak blood enhancement. For patients, the corresponding clinical wideband late gadolinium-enhanced16 (LGE) (5) im-ages were identified by using anatomic landmarks and were used to exclude regions showing scars because the goals of this
14. Please include the initials of this investigator if he or she is an author.
15. Is mmol-
1·sec-1 the correct unit of measure?
16. Ok to have changed this to “late gadolinium-enhanced?”
Visual Scores of Image QualityVisual analysis was based on the raw image series. Sixty rest perfusion data sets (three short-axis planes per subject12, 20 patients) obtained with the proposed CS scan were mixed with the 10 existing data sets (one plane per patient, 10 ret-rospective patients with a CIED) obtained with a previously described scan, randomized, and deidentified for indepen-dent evaluation by two readers (noninvasive cardiologists with 17 and 8 years, respectively, of clinical experience with cardiac MRI)13 using a five-point Likert scale for the follow-ing three categories: conspicuity of wall enhancement (1, nondiagnostic; 2, poor; 3, clinically acceptable; 4, good; 5, excellent) and noise and artifact levels (1, nondiagnostic; 2, severe; 3, moderate; 4, mild; 5, minimal). For the conspicu-ity score, readers were instructed to focus their evaluation on evaluable myocardial segments. For the noise score, readers were instructed to evaluate the entire image. For the artifact score, readers were instructed to examine all types (CIED, reconstruction, motion) of artifacts on the heart. Prior to independent blinded review, training data sets were scored by both reviewers in consensus to calibrate their scores. The two readers were blinded to each other’s scores and the pa-tient’s clinical history when they graded the images. Per cat-egory, each reader gave one composite score representing a set of three short-axis planes for CS images. Summed visual score (SVS) was computed by adding the three individual scores, with nine defined as clinically acceptable. We used average reader scores for statistical analysis.
12. Would it be OK to change “subject” to “patient”? AMA style discourages the use of “subject” (impersonal term) to refer to patients or participants.
13. Please include the initials of these two readers, if authors.
Figure 2: Schematic drawing of the integrated image reconstruction pipeline using the Yarra framework. Aliasing artifacts in arterial input function (AIF) and myocardial perfusion (MP) zero-filled images are removed using a compressed sensing (CS) framework with temporal total variation (TTV) and temporal principal component analysis (PCA) as two orthogonal sparsifying transforms. After completing the reconstruction task, the resulting images in Digital Imaging and Communications in Medicine format were sent directly to the picture archiving and commu-nication server. Fu = FFT30 operation, l = normalized regularization weight, x = images to be reconstructed, y = k-space, ψ1 = temporal finite difference (TTV), ψ2 = temporal PCA.
30. Please provide an expansion for FFT.

6 rcti.rsna.org n Radiology: Cardiothoracic Imaging Volume 2: Number 2—2020
Accelerated Wideband Cardiac Perfusion MRI
study were to quantify resting MBF in remote zones and to compare values between patients with a CIED and patients with no device (control group) and against resting MBF val-ues in the literature.
Statistical AnalysisOne investigator17 conducted the statistical analysis. Given the small sample size (n = 10 per group, three groups), we assumed nonnormal distribution and compared the three groups using the Kruskal-Wallis test, with Bonferroni correction for each pair. P < .05 was considered to indicate a significant difference for each statistical test. A sample size of 30 (10 per group) was needed to conduct a Kruskal-Wallis test with α = 0.05, power of 0.8, and effect size of 0.69 or more (ie, large). This power calculation was estimated assuming normal distribution (ie, analysis of variance) and adding 15% to the sample size, as previously described (26).
ResultsThe proposed pulse sequence on average sampled one AIF plane and 3.6 MP planes per heartbeat in patients with a CIED (median heart rate, 65.0 beats per minute; median CV in R-R interval, 7.2%), in whom zero heartbeats were skipped as a result of incoming (true or false) R wave detection prior to completion of multislice data acquisition. For reference, the same pulse sequence on average sampled one AIF plane and 3.8 short-axis planes per heartbeat in patients with no device (median heart rate, 67.5 beats per minute; median CV in R-R interval, 6.2%), in whom zero heartbeats were skipped as a result of incoming (true or false) R wave detection prior to completion of multislice data acquisition. For additional de-tails on average R-R intervals and skipped heartbeats for all 20 patients, see Table E2 (supplement). The mean CS recon-struction time was 1.40 minutes18 per slice ± 0.08 (standard deviation) (74 slices total).
Figure 3 shows representative resting perfusion images in (a) a patient with a CIED obtained using the proposed sequence, (b) a patient with no device obtained using the proposed sequence, and (c) a retrospective control patient with a CIED obtained
17. Please provide the
initials of this investigator.
18. Should 1.40 minutes
be changed to 1 minute 40
seconds?
using a previously described sequence (see Movie 1 [supplement] for dynamic display). Figure 4 shows representative perfusion images in a patient with a CIED and a patient with no device be-fore and after motion correction (see Movies 2, 3 [supplement] for dynamic display), demonstrating good performance with the motion correction algorithm (23). Figure 5 shows representative motion-corrected images at peak wall enhancement in a patient with a CIED without any perfusion defects (see Movie 4 [sup-plement] for dynamic display), as well as the corresponding AIF curve, resting MBF maps at three short-axis planes, and match-ing wideband LGE images corroborating normal perfusion with normal myocardial viability. Figure 6 shows representative motion-corrected images at peak wall enhancement in a patient with a subcutaneous ICD with cardiac sarcoidosis (see Movie 5 [supplement] for dynamic display), as well as the correspond-ing AIF curve, resting MBF maps at three short-axis planes, and matching wideband LGE images corroborating perfusion defects with regions of LGE. For dynamic display of images in a patient with a CIED with the most arrhythmia in our cohort, see Movie 6 (supplement).
As summarized in Table 1, for the average reader, the median conspicuity scores of wall enhancement, artifact, noise, and SVS were significantly different (P < .05) between the three groups (see symbols for specific pairs with a significant difference). All three patient groups produced median conspicuity, artifact, noise, and SVS scores above the clinically acceptable cutoff points (³3.0 for conspicuity, artifact, and noise; 9.0 for SVS), except for the retrospective CIED the median artifact score was below 3.0. For statistical trends for readers 1 and 2, see Table 1.
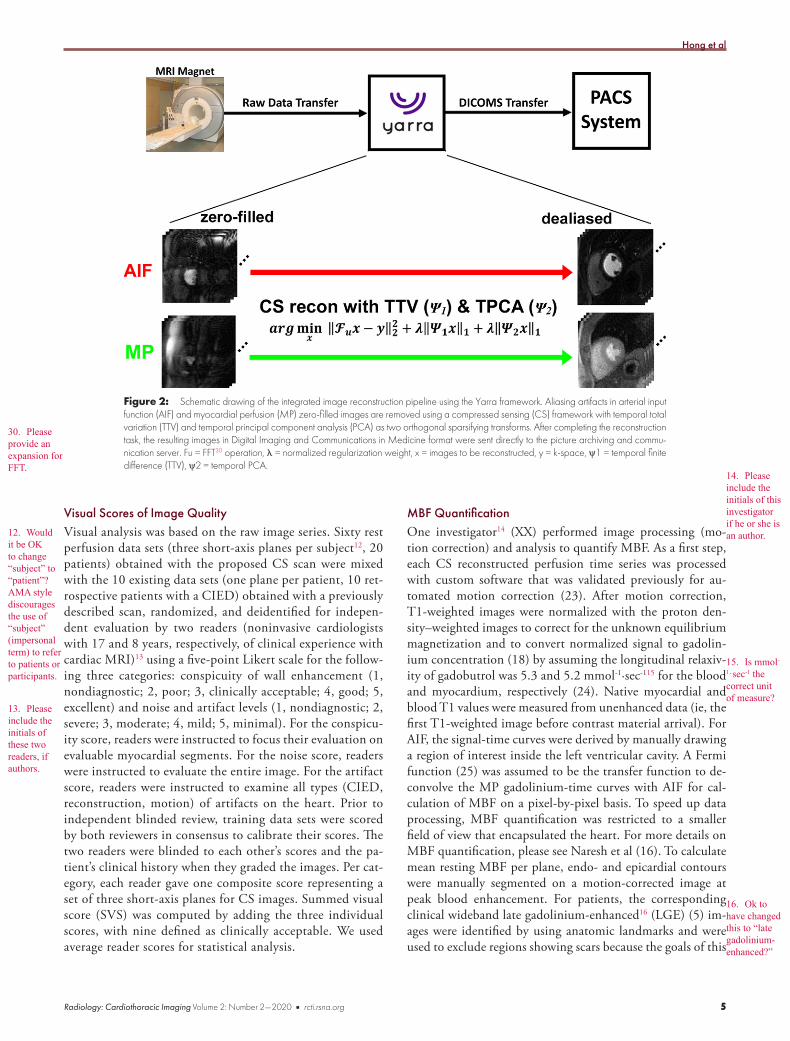
As summarized in Table 2, median AIF was not significantly different (P > .99) between the CIED group (7.7 mmol/L19; IQR, 2.8 mmol/L) and patients with no device (7.9 mmoL/L; IQR, 1.3 mmol/L). Median resting MBF was not significantly different (P = .27) between the CIED (1.1 mL/min/g; IQR, 0.2 mL/min/g) and patients with no device (1.3 mL/min/g; IQR, 0.4 mL/min/g); median resting MBF values in remote zones were consistent with values (mean resting MBF range, 1.0–1.2 mL/min/g) reported by two prior state-of-the-art perfusion car-diac MRI studies (27,28).
19. Please verify
conversion from mM to
mmol/L.
Figure 3: Representative perfusion images in (left) a patient with a cardiac implantable electronic device (CIED) obtained using the proposed pulse sequence, (middle) a patient with no device obtained using the proposed pulse sequence, and (right) a retrospective patient with a CIED obtained using the previously described pulse sequence. All three cases are shown together in Movie 1 (supplement). CS = com-pressed sensing, PI = temporal generalized autocalibrating partially parallel acquisition parallel imaging, R = acceleration factor.

Radiology: Cardiothoracic Imaging Volume 2: Number 2—2020 n rcti.rsna.org 7
Hong et al
DiscussionThis study described development and evaluation of a fivefold accelerated wideband cardiac perfusion pulse sequence with CS reconstruction for producing diagnostically acceptable im-age quality with relatively high spatial resolution (2.1 3 2.1 mm) and adequate myocardial coverage (three MP planes per heartbeat with heart rates as high as 102 beats per minute) and for reliably quantifying MBF in patients with a CIED. The resulting image quality was deemed clinically acceptable by ex-pert readers with clinical experience reading perfusion cardiac MRI scans. The resting MBF values in remote zones were not significantly different between patients with a CIED and those with no device, suggesting that the proposed method enabled reliable quantification of MBF. Our findings were also consis-tent with resting MBF values reported in two prior perfusion cardiac MRI studies (27,28).
This study had several interesting points. First, our results showed that the proposed perfusion pulse sequence enabled de-tection of resting perfusion defects in patients with a CIED (even subcutaneous ICD, as shown in Figure 6), which were corrobo-rated with the corresponding wideband LGE images. A future
study including the proposed perfusion pulse sequence in con-cert with wideband LGE and coronary angiography is warranted to investigate the prevalence of this finding in patients with a CIED. Second, peak AIF and resting MBF values in this study were consistent with those reported by prior perfusion cardiac MRI studies in patients with no device. Specifically, mean peak AIF of 8.0 mmol/L (CIED and no device groups combined, n = 20) after gadobutrol administration (0.1 mmol/kg) was con-sistent with the mean peak AIF of 4.4 mmol/L after gadobutrol administration (0.05 mmol/kg) described by Kellman et al (27). The small discrepancy in peak AIF may have been the result of the lack of T2* correction in our study, variations in cardiac out-put, and nonexact dosing by MRI technologists in a busy clinical practice. Third, we elected to use a Cartesian k-space sampling pattern, even though non–Cartesian k-space sampling patterns may have produced better results in patients with no device be-cause non–Cartesian k-space sampling patterns were known to produce considerable image blurring in an off-resonant environ-ment produced by CIEDs. We conducted a preliminary phan-tom experiment with a CIED taped to its side and verified it to be the case (data not shown because of space constraints).
Figure 4: Compressed sensing (CS)-reconstructed arterial input function (AIF) and myocardial perfusion (MP) images before and after motion correction (MOCO) in a patient with no device and a patient with a CIED. Intensity-time profiles show a reduction of respiratory motion after motion correction. See also Movies 2 (nondevice) and 3 (CIED) (supplement). Note the small signal void (arrow) caused by intracardiac leads.

8 rcti.rsna.org n Radiology: Cardiothoracic Imaging Volume 2: Number 2—2020
Accelerated Wideband Cardiac Perfusion MRI
Although it was possible to obtain a static magnetic field map and deblur the radial k-space data, such an approach would have required additional scanning and image processing and would have resulted in a slowdown of the overall workflow. Fourth, prior cardiac perfusion sequences with dual imaging (14,27,29) were used to obtain the AIF data with low spatial resolution and short TS. In this study20, the sequence enabled us to obtain AIF data with the same spatial resolution as the wall image but with a shorter TS. When compared with low-spatial-resolution AIF, the relative advantages of the high-spatial-resolution AIF image were that it reduced intravoxel dephasing (T2* decay) and im-proved visualization of endocardial borders, whereas the relative disadvantage was a longer scan time. We partially addressed the scan time issue by accelerating AIF data acquisition by a factor of five. Fifth, our sequence used centric k-space ordering for AIF scans and linear k-space ordering for MP scans. Although cen-tric k-space ordering induced higher eddy currents than linear k-space ordering, their effects were relatively minor in our pulse sequence using gradient echo readout with 15° flip angles (Figs 5, 6). Sixth, as shown in Figure 6, we obtained perfusion images and the resulting MBF maps in a patient with a subcutaneous ICD, which is approximately twice as large as a transvenous ICD and located closer to the heart. Despite some signal loss in the lateral wall of the basal and midventricular short-axis planes, our method revealed atypical perfusion defects in unaffected areas (by subcutaneous ICD) that correlated well with the correspond-ing wideband LGE images. A future study in a diverse group of
20. Please verify
editing of the sentence that
begins “In this study…”
to ensure your meaning
has been retained.
patients with subcutaneous ICDs is warranted to evaluate the robustness of our method with respect to subcutaneous ICDs. Seventh, the proposed CS-accelerated wideband perfusion pulse sequence yielded better image quality than did the previously described wideband perfusion pulse sequence in different CIED cohorts. This difference may be the result of improved image quality afforded by CS (ie, denoising, shorter readout dura-tion to minimize sensitivity to motion or arrhythmia, or both) or because of differences in the CIED types and implantation position relative to the heart and pathophysiology (arrhythmia, breathing motion) among CIED cohorts.
This study had several limitations that warranted further dis-cussion. First, we did not obtain perfusion scans during vasodi-lator stress. A previous study showed the safety of conducting stress perfusion cardiac MRI in a patient with a CIED (30). A future study is warranted to determine whether the proposed pulse sequence yields diagnostically acceptable image quality and quantifies MBF during stress in patients with a CIED. Second, we did not obtain reference MBF measurements in patients with a CIED because to date there are no other perfusion cardiac MRI methods that are capable of quantifying MBF in patients with a CIED without substantial image artifacts21 associated with CIEDs. Instead, we used patients with no device as the control group and compared our results with resting MBF val-ues reported in two leading quantitative perfusion cardiac MRI studies (27,28). Third, we did not obtain radiographic angiog-raphy data to corroborate the perfusion data. A future study is
21. Please verify that
“substantial image arti-
facts” retains your intended
meaning.
Figure 5: Row 1: Motion-corrected arterial input function (AIF) (column 1) and myocardial perfusion (MP) images (columns 2–4) in a patient with a cardiac implantable electronic device (CIED) without perfusion defects. Row 2: AIF curve (column 1) and resting myocardial blood flow (MBF) maps in three short-axis planes (columns 2–4). Row 3:31 Wideband late gadolinium-enhanced (LGE) images (columns 2–4) corroborating normal perfusion with normal myocardial viability. See also Movie 4 (supplement). CS = compressed sensing.
31. In row 3, what is the image in column 1? Please
specify.

Radiology: Cardiothoracic Imaging Volume 2: Number 2—2020 n rcti.rsna.org 9
Hong et al
Table 1: Summary of Visual Scores Assessed by Two Clinical Readers
Reader and Category CIED (n = 10) Nondevice (n = 10) Retro CIED (n = 10)Reader 1 Conspicuity of wall enhancement 5 (1) 4.5 (1) 4 (0.8) Artifact level 4 (1.8) 4.5 (1)* 2 (2.5)* Noise level 4.5 (1) 4.5 (1) 4 (1.5) SVS 13 (5)† 14 (1)* 10.1 (2.2)*†
Reader 2 Conspicuity of wall enhancement 5 (1) 4 (0.8) 4 (0) Artifact level 4 (1.8)† 5 (0)* 2 (0.8)*†
Noise level 4.5 (1)† 4 (0) 3.5 (2.5)†
SVS 13 (4)† 13 (1)* 8.6 (2.5)*†
Average reader Conspicuity of wall enhancement 4.5 (0.5)† 4.5 (0.4) 4 (0.5)†
Artifact level 4 (1.8)† 4.8 (0.5)* 2 (0.9)*†
Noise level 4.5 (1.0)† 4.3 (0.5) 4 (1.3)†
SVS 13 (3.8)† 13.5 (0.9)* 9 (0.9)*†
Note.—Data are medians, and data in parentheses are the interquartile range. Conspicuity of wall enhancement: 1 = nondiagnostic; 2 = poor; 3 = clinically acceptable; 4 = good; 5 = excellent. Noise and artifact scores: 1 = nondiagnostic; 2 = severe; 3 = clinically acceptable; 4 = mild; 5 = minimal. For summed visual scores (SVS), clinically acceptable is 9. CIED = cardiac implantable electronic device, retro CIED = retrospective CIED control.* P < .05 for nondevice versus retro CIED.† P < .05 for CIED versus retro CIED.
Figure 6: Row 1: Motion-corrected arterial input function (AIF) (column 1) and myocardial perfusion (MP) (columns 2–4) images in a patient with a subcutaneous implantable cardioverter-defibrillator (S-ICD) show atypical perfusion defects and late gadolinium enhancement (LGE) associated with cardiac sarcoidosis. Row 2: AIF curve (column 1) and resting myocardial blood flow (MBF) maps in three short-axis planes (columns 2–4). Row 3: Wideband LGE images (columns 2–4) corroborating perfusion defects in regions of LGE. See also Movie 5 (supplement). Note the perfusion defects (green arrows) on perfusion images and MBF maps, corresponding hyperenhancement (blue arrows) on wideband LGE images, and signal voids (magenta arrows) induced by S-ICD. Regions associated with signal voids need to be interpreted with caution. Wideband saturation pulse had a full width at half maximum (FWHM) of 9.2 kHz. Wideband inversion pulse had an FWHM of 4 kHz.32
32. Is a.u. arbitrary units?
10 rcti.rsna.org n Radiology: Cardiothoracic Imaging Volume 2: Number 2—2020
Accelerated Wideband Cardiac Perfusion MRI
warranted to correlate stress perfusion data with radiographic angiography in patients with a CIED. Fourth, the mean image reconstruction time was 1 minute 40 seconds per slice. Although this reconstruction time may be clinically acceptable in the con-text of first-pass cardiac perfusion cardiac MRI because it cannot be repeated, regardless of success or failure, a future study is war-ranted to explore a faster image reconstruction pipeline, includ-ing deep learning (31). Fifth, as shown in Figure 6, there was substantial signal loss in the lateral wall because of intravoxel de-phasing caused by a subcutaneous ICD, which was twice as large as a transvenous ICD and was located closer to the heart. One approach to minimize signal loss is to use a shorter echo time, which is attainable using the following combination: increased receiver bandwidth, shorter excitation radiofrequency pulse, and asymmetric echo readout, at the expense of signal-to-noise ratio or Gibbs ringing artifacts. Sixth, this study examined only 10 patients with a CIED because our clinical cardiac MRI volume for patients with a CIED was considerably lower compared with patients with no device. The 10 patients with a CIED (includ-ing one with a subcutaneous ICD) enrolled in this study did not fully represent a variety of implantation configurations in patients. Although the diagnostically acceptable image quality produced in a patient with a subcutaneous ICD was encour-aging, our results may not be generalizable for all devices and body habitus types. A future study, including a large patient co-hort with a variety of devices and body habitus types, is needed to fully test the performance of the proposed perfusion cardiac MRI pulse sequence. Seventh, this study did not account for the signal loss associated with T2* decay, particularly for the AIF, in which a high concentration of the gadolinium-based contrast agent (range, 5–10 mmol/L) was expected. One approach to further increase accuracy was to obtain AIF data with double echoes, calculate T2*, and analytically correct it (27). Eighth, we
elected to use a fivefold accelerated Cartesian k-space sampling pattern to ensure that we obtained diagnostically acceptable im-age quality and resting MBF values from patients with a CIED that agreed with resting MBF values in the literature. In the same vein, we used temporal total variation and temporal PCA as two orthogonal sparsifying transforms. A future study is warranted to investigate an optimal set of k-space sampling pattern, accel-eration factor, and sparsifying transforms for optimization of a quantitative wideband perfusion cardiac MRI pulse sequence.
In summary, this study showed that a fivefold accelerated wideband cardiac perfusion pulse sequence with CS reconstruc-tion was capable of producing clinically acceptable image quality in three short-axis planes per heartbeat and reliably quantifying MBF in patients with a CIED with heart rates as high as 102 beats per minute. Future work includes a study aimed at evaluat-ing the diagnostic accuracy of the proposed stress-rest protocol for detecting coronary artery disease in patients with a CIED against radiographic angiography.
Author contributions: Guarantor of integrity of entire study, D.K.; study con-cepts/study design or data acquisition or data analysis/interpretation, all authors; manuscript drafting or manuscript revision for important intellectual content, all authors; approval of final version of submitted manuscript, all authors; agrees to ensure any questions related to the work are appropriately resolved, all authors; lit-erature research, K.P.H., L.F., A.E.A., D.C.L., D.K.; clinical studies, K.P.H., J.D.C., B.H.F., D.C.L., D.K.; 22statistical analysis, K.P.H., L.F., D.K.; and manuscript edit-ing, K.P.H., J.D.C., B.H.F., A.E.A., L.Y.H., D.C.L., D.K.
Disclosures of Conflicts of Interest: K.P.H. disclosed no relevant relation-ships. J.D.C. disclosed no relevant relationships. B.H.F. disclosed no relevant relationships. L.F. disclosed no relevant relationships. A.E.A.23 Activities related to the present article: disclosed no relevant relationships. Activities not related to the present article: is an unpaid consultant to Bayer as part of a U.S. Government Cooperative Research and Development Agreement; institution holds patents and a software license for perfusion quantification and receives fees from Corstem and Circle CVI; institution has a U.S. Government Cooperative Research and Development Agreement with Siemens and Circle CVI; . Other relationships: disclosed no relevant relationships. L.Y.H. disclosed no relevant relationships.
22. I found no mention
of studies performed in animals,
cadavers, or phantoms,
so I have deleted the
experimental studies con-
tribution. (Or did the ACR
phantom count?)
23. Please verify the
COI state-ment for
Dr Arai is accurate.
Table 2: Summary of Peak AIF and Resting MBF in Remote Zones for 10 Patients with a CIED and 10 Patients without a Device
A: Current StudyCategory CIED Nondevice P ValueAIF (mmol/L) 7.7 (2.8) 7.9 (1.3) >.99MBF (mL/min/g) 1.1 (0.2) 1.3 (0.4) .27
B: Previous Studies
Study and Patient Type MBF (mL/min/g)Kellman et al (22)* Volunteers 1.0 ± 0.2 Hsu et al (23)* CAD positive (remote) 1.2 ± 0.6 CAD negative 1.2 ± 0.4 Volunteers 1.2 ± 0.3
Note.—Arterial input function (AIF) and myocardial blood flow (MBF) values from our study are the median, with interquartile range in parentheses. MBF values from prior studies are mean ± standard deviation. CAD = coronary artery disease, CIED = cardiac implant-able electronic device.* P < .05 indicates a significant difference.33
33. What does P < .05
correspond to? Are the * in the correct
place?

Radiology: Cardiothoracic Imaging Volume 2: Number 2—2020 n rcti.rsna.org 11
Hong et al
D.C.L. Activities related to the present article: disclosed no relevant relationships. Activities not related to the present article: institution received a grant from Ab-bott Laboratories. Other relationships: disclosed no relevant relationships. D.K. disclosed no relevant relationships.
References 1. Greenspon AJ, Patel JD, Lau E, et al. Trends in permanent pacemaker im-
plantation in the United States from 1993 to 2009: increasing complexity of patients and procedures. J Am Coll Cardiol 2012;60(16):1540–1545.
2. Nazarian S, Hansford R, Rahsepar AA, et al. Safety of magnetic resonance imag-ing in patients with cardiac devices. N Engl J Med 2017;377(26):2555–2564.
3. Dandamudi S, Collins JD, Carr JC, et al. The safety of cardiac and thoracic magnetic resonance imaging in patients with cardiac implantable electronic devices. Acad Radiol 2016;23(12):1498–1505.
4. Singh A, Kawaji K, Goyal N, et al. Feasibility of cardiac magnetic resonance wideband protocol in patients with implantable cardioverter defibrillators and its utility for defining scar. Am J Cardiol 2019;123(8):1329–1335.
5. Rashid S, Rapacchi S, Vaseghi M, et al. Improved late gadolinium enhance-ment MR imaging for patients with implanted cardiac devices. Radiology 2014;270(1):269–274.
6. Hong K, Jeong EK, Wall TS, Drakos SG, Kim D. Wideband arrhythmia-insensitive-rapid (AIR) pulse sequence for cardiac T1 mapping without image artifacts induced by an implantable-cardioverter-defibrillator. Magn Reson Med 2015;74(2):336–345.
7. Shao J, Rashid S, Renella P, Nguyen KL, Hu P. Myocardial T1 mapping for patients with implanted cardiac devices using wideband inversion recovery spoiled gradient echo readout. Magn Reson Med 2017;77(4):1495–1504.
8. Hong K, Collins JD, Knight BP, Carr JC, Lee DC, Kim D. Wideband myocardial perfusion pulse sequence for imaging patients with a cardiac implantable electronic device. Magn Reson Med 2019;81(2):1219–1228.
9. Lingala SG, DiBella E, Adluru G, McGann C, Jacob M. Accelerating free breathing myocardial perfusion MRI using multi coil radial k-t SLR. Phys Med Biol 2013;58(20):7309–7327.
10. Otazo R, Kim D, Axel L, Sodickson DK. Combination of compressed sensing and parallel imaging for highly accelerated first-pass cardiac perfusion MRI. Magn Reson Med 2010;64(3):767–776.
11. Otazo R, Candès E, Sodickson DK. Low-rank plus sparse matrix decom-position for accelerated dynamic MRI with separation of background and dynamic components. Magn Reson Med 2015;73(3):1125–1136.
12. Chen X, Salerno M, Yang Y, Epstein FH. Motion-compensated compressed sensing for dynamic contrast-enhanced MRI using regional spatiotemporal sparsity and region tracking: block low-rank sparsity with motion-guidance (BLOSM). Magn Reson Med 2014;72(4):1028–1038.
13. Adluru G, Awate SP, Tasdizen T, Whitaker RT, Dibella EV. Temporally constrained reconstruction of dynamic cardiac perfusion MRI. Magn Reson Med 2007;57(6):1027–1036.
14. Gatehouse PD, Elkington AG, Ablitt NA, Yang GZ, Pennell DJ, Firmin DN. Accurate assessment of the arterial input function during high-dose myocardial perfusion cardiovascular magnetic resonance. J Magn Reson Imaging 2004;20(1):39–45.
15. Nazarian S, Roguin A, Zviman MM, et al. Clinical utility and safety of a protocol for noncardiac and cardiac magnetic resonance imaging of patients with permanent pacemakers and implantable-cardioverter defibrillators at 1.5 tesla. Circulation 2006;114(12):1277–1284.
16. Naresh NK, Haji-Valizadeh H, Aouad PJ, et al. Accelerated, first-pass cardiac perfusion pulse sequence with radial k-space sampling, compressed sensing, and k-space weighted image contrast reconstruction tailored for visual analysis and quantification of myocardial blood flow. Magn Reson Med 2019;81(4):2632–2643.
17. Kim D. Influence of the k-space trajectory on the dynamic T1-weighted signal in quantitative first-pass cardiac perfusion MRI at 3T. Magn Reson Med 2008;59(1):202–208.
18. Cernicanu A, Axel L. Theory-based signal calibration with single-point T1 measurements for first-pass quantitative perfusion MRI studies. Acad Radiol 2006;13(6):686–693.
19. Donahue KM, Weisskoff RM, Burstein D. Water diffusion and exchange as they influence contrast enhancement. J Magn Reson Imaging 1997;7(1):102–110.
20. Adluru G, DiBella E. Compression2: compressed sensing with compressed coil arrays. J Cardiovasc Magn Reson 2012;14(Suppl 1):P242.
21. Feng L, Srichai MB, Lim RP, et al. Highly accelerated real-time cardiac cine MRI using k-t SPARSE-SENSE. Magn Reson Med 2013;70(1):64–74.
22. Haji-Valizadeh H, Rahsepar AA, Collins JD, et al. Validation of highly acceler-ated real-time cardiac cine MRI with radial k-space sampling and compressed sensing in patients at 1.5T and 3T. Magn Reson Med 2018;79(5):2745–2751.
23. Benovoy M, Jacobs M, Cheriet F, Dahdah N, Arai AE, Hsu LY. Robust universal nonrigid motion correction framework for first-pass cardiac MR perfusion imaging. J Magn Reson Imaging 2017;46(4):1060–1072.
24. Rohrer M, Bauer H, Mintorovitch J, Requardt M, Weinmann HJ. Com-parison of magnetic properties of MRI contrast media solutions at different magnetic field strengths. Invest Radiol 2005;40(11):715–724.
25. Christian TF, Rettmann DW, Aletras AH, et al. Absolute myocardial perfusion in canines measured by using dual-bolus first-pass MR imaging. Radiology 2004;232(3):677–684.
26. Lehmann EL. Nonparametrics: Statistical Methods Based on Ranks, Revised. Upper Saddle River, NJ: Prentice-Hall, 1998.
27. Kellman P, Hansen MS, Nielles-Vallespin S, et al. Myocardial perfusion cardiovascular magnetic resonance: optimized dual sequence and reconstruc-tion for quantification. J Cardiovasc Magn Reson 2017;19(1):43.
28. Hsu LY, Jacobs M, Benovoy M, et al. Diagnostic performance of fully auto-mated pixel-wise quantitative myocardial perfusion imaging by cardiovascular magnetic resonance. JACC Cardiovasc Imaging 2018;11(5):697–707.
29. Kim D, Axel L. Multislice, dual-imaging sequence for increasing the dy-namic range of the contrast-enhanced blood signal and CNR of myocardial enhancement at 3T. J Magn Reson Imaging 2006;23(1):81–86.
30. Klein-Wiele O, Garmer M, Urbien R, et al. Feasibility and safety of adenosine cardiovascular magnetic resonance in patients with MR conditional pacemaker systems at 1.5 Tesla. J Cardiovasc Magn Reson 2015;17(1):112.
31. Schlemper J, Caballero J, Hajnal JV, Price AN, Rueckert D. A deep cascade of convolutional neural networks for dynamic MR image reconstruction. IEEE Trans Med Imaging 2018;37(2):491–503..

Publisher: RSNA; Journal: RYCT:Radiology Cardiothoracic Imaging; Copyright: 2019, ; Volume: 0; Issue: 0; Manuscript: 190114; Month: ; Year: 2019
DOI: 10.1148/ryct.2019190114; TOC Head: Technical Developments; Section Head: Article Type: Original Research; Collection Codes: , , , , ,
Page 1 of 3
Figure E1: Preliminary analysis of three different Cartesian k-space sampling patterns (row 1): random Gaussian (left column), Poisson disc with variable density (middle column), and proposed lattice-like with variable density (right column). (Row 2) The corresponding the first frame images (out of 65 frames) of an ACR phantom with grids to appreciate potential blurring resulting from imperfect reconstruction. (Row 2) The corresponding root-mean-square-error (RMSE) images (along time dimension) to appreciate potential flicking artifacts resulting from imperfect reconstruction. Note, the RMSE images are displayed with 10-times narrower grayscale to bring out differences. Excluding signal-free background after a thresholding mask, the RMSE in the phantom was 0.0626, 0.0125, and 0.016 for Gaussian, Poisson, and lattice k-space sampling patterns, respectively.
Movie E1: Video display of representative cardiac perfusion images corresponding to Figure 3: CS-accelerated scan in a CIED patient (left), CS-accelerated scan in a nondevice patient, and previously described TGRAPPA scan in a control CIED patient (right).
Movie E2: Video display of cardiac perfusion images of a nondevice patient corresponding to Figure 4: before (top row) and after (bottom row) motion correction.
Movie E3: Video display of cardiac perfusion images of a CIED patient corresponding to Figure 4: before (top row) and after (bottom row) motion correction.
Movie E4: Video display of motion-corrected cardiac perfusion images of a CIED patient corresponding to Figure 5.
Movie E5: Video display of motion-corrected cardiac perfusion images of a subcutaneous ICD patient corresponding to Figure 6.
Movie E6: Video display of cardiac perfusion images without motion correction of a CIED patient with arrhythmia: AIF (first column), basal plane near the left ventricular outflow track (second column), midventricular (third column), and midpoint between midventricular and apex (fourth column). Note, AIF images appear darker than MP images because they were acquired with a shorter TS.
Table E1. Patient characteristics for prospectively enrolled CIED (n = 10), nondevice (n = 10) and retrospective CIED control (n = 10) groups based on chart review of clinical history.
CIED (n = 10) Nondevice (n = 10) Retro CIED (n = 10) Age (years) 53.8 (35.6) 59.2 (9.9) 57.7 (15.2) LVEF (%) 52.5 (11.8)* 64.0 (10.3)*€ 39.5 (38.8)€
Heart rate (bpm) 65.0 (8.8) 67.5 (17.5) 65.0 (10.0) Sex (Male/Female) 7/3 (70%) 4/6 (40%) 5/5 (50%)
ICD 4 (40%) 7 (70%) CRT-D 2 (20%) 1 (10%)

Publisher: RSNA; Journal: RYCT:Radiology Cardiothoracic Imaging; Copyright: 2019, ; Volume: 0; Issue: 0; Manuscript: 190114; Month: ; Year: 2019
DOI: 10.1148/ryct.2019190114; TOC Head: Technical Developments; Section Head: Article Type: Original Research; Collection Codes: , , , , ,
Page 2 of 3
Pacemaker 3 (30%) 1 (10%) S-ICD 1 (10%) 1 (10%)
Diabetes 3 (30%) 1 (10%) 2 (2%) Hypertension 7 (70%) 5 (50%) 8 (80%)
Obstructive CAD 2 (20%) 1 (10%) 5 (50%) Atrial Fibrillation 3 (30%) 0 (0%) 3 (30%) LBBB or RBBB 3 (30%) 1 (10%) 6 (60%)
VT or VF 4 (40%) 4 (40%) 9 (90%) PVC 4 (40%) 4 (40%) 9 (90%)
Heart failure 8 (80%) 2 (20%) 9 (90%)
Values for age, LVEF, and heart rate represent median (interquartile range). For all other variables, numbers in parenthesis represent percentages. All patients had GFR > 60 mL/min/1.73 m2. CRT-D: cardiac resynchronization therapy with defibrillator; S-ICD: subcutaneous ICD; LBBB: left bundle branch block; RBBB: right bundle branch block; VT: ventricular tachycardia; VF: ventricular fibrillation; PVC: premature ventricular contraction; NICM: nonischemic cardiomyopathy; GFR: glomerular filtration rate. Assuming nonnormal distribution, the Kruskal-Wallis test with Bonferroni correction was conducted for age, LVEF, and heart rate. We did not conduct a statistical comparison for binary variables because the sample sizes are too small.
P < .05 corresponds to statistical significance for the following pairs: *CIED versus nondevice, €nondevice versus retrospective CIED control.
Table E2. Summary of R-R interval, number of MP planes, total scan time for acquiring one AIF plane and MP planes per heartbeat, and skipped heartbeats during perfusion scans.
Patients R-R Interval MP Planes Total scan time Skipped Heartbeats CIED 1 943 ± 170 ms 3 580 ms 0 CIED 2 882 ± 19 ms 3 580 ms 0 CIED 3 664 ± 27 ms 3 580 ms 0 CIED 4 1118 ± 221 ms 4 727.5 ms 0 CIED 5 1025 ± 32 ms 4 727.5 ms 0 CIED 6 725 ± 2 ms 3 580 ms 0 CIED 7 1013 ± 31 ms 4 727.5 ms 0 CIED 8 802 ± 27 ms 3 580 ms 0 CIED 9 1274 ± 72 ms 5 875 ms 0
CIED 10 925 ± 19 ms 4 727.5 ms 0 Nondevice 1 955 ± 12 ms 4 727.5 ms 0 Nondevice 2 889 ± 14 ms 4 727.5 ms 0 Nondevice 3 940 ± 10 ms 3 580 ms 0 Nondevice 4 1180 ± 28 ms 4 727.5 ms 0 Nondevice 5 956 ± 16 ms 4 727.5 ms 0 Nondevice 6 922 ± 65 ms 4 727.5 ms 0 Nondevice 7 859 ± 24 ms 3 580 ms 0 Nondevice 8 905 ± 13 ms 4 727.5 ms 0 Nondevice 9 914 ± 61 ms 4 727.5 ms 0
Nondevice 10 1110 ± 18 ms 4 727.5 ms 0
The R-R interval data were obtained from the DICOM header of retrospective ECG-gated breath-hold cine data. The number of skipped heartbeats was calculated as follows. First, cutoff = (mean R-R interval + 2 × standard deviation of R-R interval) × 1.5, where x denotes multiplication. This corresponds to approximately 1.5 heartbeats. Second,
Publisher: RSNA; Journal: RYCT:Radiology Cardiothoracic Imaging; Copyright: 2019, ; Volume: 0; Issue: 0; Manuscript: 190114; Month: ; Year: 2019
DOI: 10.1148/ryct.2019190114; TOC Head: Technical Developments; Section Head: Article Type: Original Research; Collection Codes: , , , , ,
Page 3 of 3
calculate the change in time stamp between two consecutive perfusion images along the repetition dimension by extracting the time stamp embedded in the DICOM headers. Third, any frame with a change in time stamp greater than the cutoff is defined as a skipped heartbeat. This retrospective analysis suggests zero skipped heartbeats for all 20 patients. We note that these results need to interpreted with caution, because both the RR-interval and time stamp data may have been contaminated with distorted ECG trace inside the MRI scanner due to the magnetohydrodynamic effects, particularly for sicker heart disease patients with weak ECG traces. AIF scan time = 137.5 ms. MP scan time per plane = 147.5 ms. Total scan time per heartbeat = AIF scan time + MP scan time per plane x MP planes.


![Convective cells in Betelgeuse: imaging through spectropolarimetry · 2018. 11. 27. · arXiv:1811.10362v1 [astro-ph.SR] 26 Nov 2018. A&A proofs: manuscript no. art65_V4 Beyond that](https://img.pdfslide.us/doc/110x75/5feb589459218122a5587a5d/convective-cells-in-betelgeuse-imaging-through-spectropolarimetry-2018-11-27.jpg)