Embed Size (px)
Citation preview
United States Department of Agriculture Natural Resources Conservation Service National Park Service
In cooperation with United States Department of the Interior, National Park Service, and Texas Agricultural Experiment Station
Soil Survey of Padre Island National Seashore, Texas Special Report

i
How To Use This Soil Survey
General Soil Map
The general soil map, which is a color map, shows the survey area divided into groups of associated soils called general soil map units. This map is useful in planning the use and management of large areas.
To find information about your area of interest, locate that area on the map, identify the name of the map unit in the area on the color-coded map legend, then refer to the section General Soil Map Units for a general description of the soils in your area.
Detailed Soil Maps
The detailed soil maps can be useful in planning the use and management of small areas.
To find information about your area of interest, locate that area on the Index to Map Sheets.
Locate your area of interest on the map sheet. Note the map unit symbols that are in that area. Go to the Contents, which lists the map units by symbol and name and shows the page where each map unit is described.
The Contents shows which table has data on a specific land use for each detailed soil map unit. Also see the Contents for sections of this publication that may address your specific needs.
iii
This soil survey special report is a publication of the National Cooperative Soil
Survey, a joint effort of the United States Department of Agriculture and other Federal agencies, State agencies including the Agricultural Experiment Stations, and local agencies. The Natural Resources Conservation Service has leadership for the Federal part of the National Cooperative Soil Survey. Information, maps, and descriptions in this report will be incorporated into the soil survey of Kenedy and Kleberg Counties, Texas, when it is completed. Because of ongoing mapping in those adjacent areas, the information, maps, and descriptions in this report are also subject to change.
The proper citation for this soil survey report is as follows:
United States Department of Agriculture, Natural Resources Conservation Service, and United States Department of the Interior, National Park Service. 2005. Soil Survey of Padre Island National Seashore, Texas, Special Report.
Major fieldwork for this soil survey was completed in 2004. Soil names and descriptions were approved in 2005. Unless otherwise indicated, statements in this publication refer to conditions in the survey area in 2005. This survey was made cooperatively by the Natural Resources Conservation Service, the National Park Service, and the Texas Agricultural Experiment Station. The survey is part of the technical assistance furnished to the Kenedy and Kleberg Counties Soil and Water Conservation District.
Soil maps in this survey may be copied without permission. Enlargement of these maps, however, could cause misunderstanding of the detail of mapping. If enlarged, maps do not show the small areas of contrasting soils that could have been shown at a larger scale.
The U.S. Department of Agriculture (USDA) prohibits discrimination in all its programs and activities on the basis of race, color, national origin, age, disability, and where applicable, sex, marital status, familial status, parental status, religion, sexual orientation, genetic information, political beliefs, reprisal, or because all or a part of an individual's income is derived from any public assistance program. (Not all prohibited bases apply to all programs.) Persons with disabilities who require alternative means for communication of program information (Braille, large print, audiotape, etc.) should contact USDA's TARGET Center at (202) 720-2600 (voice and TDD).
To file a complaint of discrimination write to USDA, Director, Office of Civil Rights, 1400 Independence Avenue, S.W., Washington, D.C. 20250-9410 or call (800) 795-3272 (voice) or (202) 720-6382 (TDD). USDA is an equal opportunity provider and employer.
Cover: The foredune ridge of Daggerhill fine sand, 2 to 12 percent slopes, rarely flooded, stops the migration of small dunes. This helps to build the foredune ridge higher. The foredune ridges protect the island from storm surge during tropical storms. The view is to the northeast.
Additional information about the Nation’s natural resources is available on the Natural
Resources Conservation Service homepage on the World Wide Web. The address is http://www.nrcs.usda.gov
i
Contents
How To Use This Survey .................................................................................. i Foreword ......................................................................................................... vii
General Nature of the Survey Area............................................................... 3 History and Settlement............................................................................ 3 Natural Resources .................................................................................. 5 Climate................................................................................................... 6
How This Survey Was Made ........................................................................ 6 Geology and Soil Geomorphology.................................................................. 9
Formation of the Barrier Island Landscape ................................................... 9 Wind System, Longshore Drift, and Formation of Shell Beaches................... 9 Depositional Environments and Processes ................................................. 13
Beaches ............................................................................................... 13 Foredunes ............................................................................................ 14 Vegetated Barrier Flats, Back-Island Dune Fields, and Washover Fans. 15 Wind-Tidal Flats.................................................................................... 16
Subaqueous Soils ...................................................................................... 19 Submerged Aquatic Vegetation............................................................. 21 Black Mangrove Vegetation .................................................................. 23
Management Effects on Padre Island Geomorphology................................ 23 General Soil Map Units .................................................................................. 25
Soils on the Wind-Tidal Flats ...................................................................... 25 1. Satatton-Tatton................................................................................. 25
Soils on the Barrier Flat .............................................................................. 26 2. Mustang-Panam-Padre..................................................................... 26 3. Madre-Malaquite-Mustang ................................................................ 26
Soils on the Foredunes or High Back-Island Dune Fields............................ 27 4. Daggerhill-Greenhill-Mustang............................................................ 27
Dune Land ................................................................................................. 27 5. Dune Land-Satatton.......................................................................... 27
Soils on the Spoil Islands............................................................................ 28 6. Yarborough-Twinpalms..................................................................... 28
Beaches..................................................................................................... 28 7. Beaches ........................................................................................... 28
Detailed Soil Map Units ................................................................................. 29 Barrier Island: Beach .............................................................................. 31
CB1—Beaches, sandy, 0 to 2 percent slopes, very frequently flooded .................................................................... 31
CB2—Beaches, gravelly, 0 to 2 percent slopes, very frequently flooded .................................................................... 33
CB3—Beaches, bermed, very gravelly, 1 to 3 percent slopes, very frequently flooded .................................................................... 35
CB4—Beaches, bermed, gravelly, 1 to 3 percent slopes, very frequently flooded .................................................................... 37
Barrier Island: Foredune or Back-Island Dune Field ............................. 39 299—Greenhill fine sand, 2 to 12 percent slopes, rarely flooded............ 39
iv
399—Greenhill-Mustang complex, 0 to 12 percent slopes, occasionally flooded........................................................................ 41
499—Daggerhill fine sand, 2 to 12 percent slopes, rarely flooded.......... 43 502—Daggerhill-Satatton complex, 0 to 12 percent slopes,
frequently flooded............................................................................ 45 599—Daggerhill-Mustang complex, 0 to 12 percent slopes,
occasionally flooded........................................................................ 47 999—Dune land-Satatton complex, 0 to 5 percent slopes,
occasionally flooded........................................................................ 49 Barrier Island: Barrier Flat ...................................................................... 51
82A—Mustang fine sand, 0 to 1 percent slopes, occasionally flooded........................................................................ 51
199—Dune land, 0 to 5 percent slopes, occasionally flooded ................ 53 282—Madre-Malaquite complex, 0 to 1 percent slopes,
occasionally flooded........................................................................ 54 290—Novillo peat, 0 to 1 percent slopes, ponded.................................. 57 291—Mustang-Padre complex, 0 to 2 percent slopes,
occasionally flooded........................................................................ 59 491—Mustang-Panam complex, 0 to 2 percent slopes,
occasionally flooded........................................................................ 61 891—Madre-Panam complex, 0 to 2 percent slopes,
occasionally flooded........................................................................ 63 Barrier Island: Wind-Tidal Flat ................................................................ 66
102—Satatton fine sand, 0 to 1 percent slopes, frequently flooded............................................................................ 66
103—Tatton fine sand, 0 to 1 percent slopes, very frequently flooded .................................................................... 68
402—Tatton-Beaches, washover fan association, 0 to 1 percent slopes, very frequently flooded ........................................................ 69
Lagoon: Spoil Island ............................................................................... 71 95BD—Twinpalms-Yarborough complex, 0 to 3 percent slopes,
frequently flooded............................................................................ 71 982—Yarborough fine sandy loam, 0 to 1 percent slopes,
very frequently flooded .................................................................... 74 Lagoon: Lagoon Bottom ......................................................................... 75
GF—Baffin soils, submerged ................................................................ 75 W—Water............................................................................................. 77
Use and Management of the Soils ................................................................ 79 Interpretive Ratings .................................................................................... 79
Rating Class Terms .............................................................................. 79 Numerical Ratings ................................................................................ 79
Rangeland ................................................................................................. 80 Ecological Site Descriptions.................................................................. 81
Recreation.................................................................................................. 81 Wildlife Habitat ........................................................................................... 82 Hydric Soils................................................................................................ 85 Engineering................................................................................................ 86
Building Site Development .................................................................... 87 Sanitary Facilities.................................................................................. 88 Construction Materials .......................................................................... 90
Soil Properties ............................................................................................... 93 Engineering Index Properties...................................................................... 93 Physical Soil Properties.............................................................................. 94 Chemical Soil Properties ............................................................................ 96
v
Water Features .......................................................................................... 97 Soil Features.............................................................................................. 98 Physical and Chemical Analyses of Selected Soils ..................................... 99
Classification of the Soils.............................................................................101 Soil Series and Their Morphology..............................................................101
Baffin Series ........................................................................................102 Daggerhill Series .................................................................................106 Greenhill Series ...................................................................................108 Madre Series .......................................................................................113 Malaquite Series..................................................................................117 Mustang Series....................................................................................123 Novillo Series.......................................................................................128 Padre Series........................................................................................132 Panam Series......................................................................................137 Satatton Series ....................................................................................142 Tatton Series .......................................................................................145 Twinpalms Series ................................................................................150 Yarborough Series...............................................................................153
References ....................................................................................................159 Glossary ........................................................................................................165 Tables............................................................................................................179
Table 1—Temperature and Precipitation....................................................180 Table 2—Freeze Dates in Spring and Fall .................................................183 Table 3—Growing Season.........................................................................185 Table 4—Elevation, Landscape, Parent Material, and Vegetation ..............186 Table 5—Acreage and Proportionate Extent of the Soils............................193 Table 6—Rangeland Productivity and Plant Composition...........................194 Table 7—Camp Areas, Picnic Areas, and Playgrounds..............................201 Table 8—Paths, Trails, and Off-road Vehicle Trails....................................207 Table 9—Burrowing Mammals and Reptiles, and Saline Water
Wetland Plants ....................................................................................211 Table 10—Riparian Herbaceous Plants, Shrubs, Vines, and
Trees, and Freshwater Wetland Plants.................................................215 Table 11—Dwellings and Small Commercial Buildings...............................219 Table 12—Roads and Streets, Shallow Excavations, and
Lawns and Landscaping ......................................................................223 Table 13—Sewage Disposal .....................................................................228 Table 14—Landfills....................................................................................233 Table 15—Source of Gravel and Sand ......................................................238 Table 16—Source of Reclamation Material, Roadfill, and Topsoil ..............241 Table 17—Engineering Index Properties....................................................247 Table 18—Physical Soil Properties............................................................252 Table 19—Chemical Soil Properties ..........................................................256 Table 20—Water Features ........................................................................259 Table 21—Soil Features............................................................................269 Table 22—Physical Analyses of Selected Soils..........................................272 Table 23—Chemical Analyses of Selected Soils........................................274 Table 24—Taxonomic Classification of the Soils........................................275
May 2007

vii
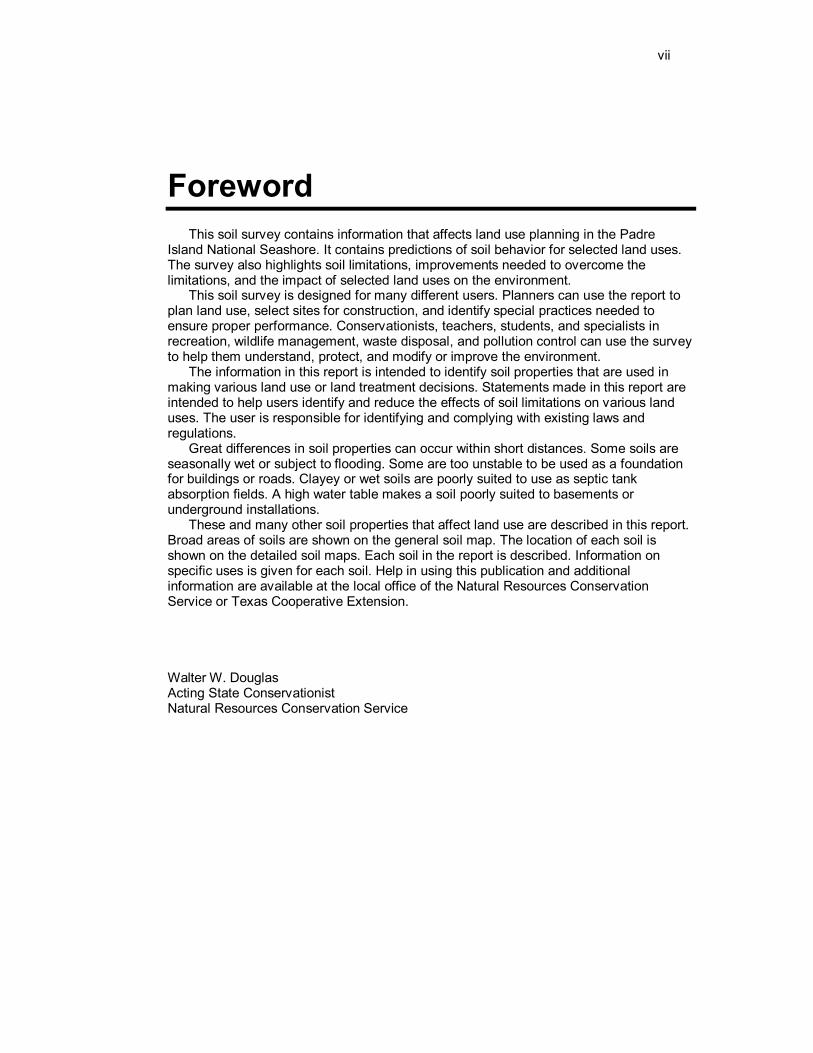
Foreword
This soil survey contains information that affects land use planning in the Padre Island National Seashore. It contains predictions of soil behavior for selected land uses. The survey also highlights soil limitations, improvements needed to overcome the limitations, and the impact of selected land uses on the environment.
This soil survey is designed for many different users. Planners can use the report to plan land use, select sites for construction, and identify special practices needed to ensure proper performance. Conservationists, teachers, students, and specialists in recreation, wildlife management, waste disposal, and pollution control can use the survey to help them understand, protect, and modify or improve the environment.
The information in this report is intended to identify soil properties that are used in making various land use or land treatment decisions. Statements made in this report are intended to help users identify and reduce the effects of soil limitations on various land uses. The user is responsible for identifying and complying with existing laws and regulations.
Great differences in soil properties can occur within short distances. Some soils are seasonally wet or subject to flooding. Some are too unstable to be used as a foundation for buildings or roads. Clayey or wet soils are poorly suited to use as septic tank absorption fields. A high water table makes a soil poorly suited to basements or underground installations.
These and many other soil properties that affect land use are described in this report. Broad areas of soils are shown on the general soil map. The location of each soil is shown on the detailed soil maps. Each soil in the report is described. Information on specific uses is given for each soil. Help in using this publication and additional information are available at the local office of the Natural Resources Conservation Service or Texas Cooperative Extension. Walter W. Douglas Acting State Conservationist Natural Resources Conservation Service

1
Soil Survey of Padre Island National Seashore, Texas, Special Report
By Dennis N. Brezina, Natural Resources Conservation Service
Fieldwork by Dennis N. Brezina, Alan L. Stahnke, Shanna M. Dunn, Gerald L. Crenwelge, and Paul D. Holland, Natural Resources Conservation Service
Review and quality assurance by Conrad L. Neitsch, Ramiro Molina, Jonathan K. Wiedenfeld, and Nathan I.Haile
United States Department of Agriculture, Natural Resources Conservation Service, in cooperation with United States Department of the Interior, National Park Service, and Texas Agricultural Experiment Station
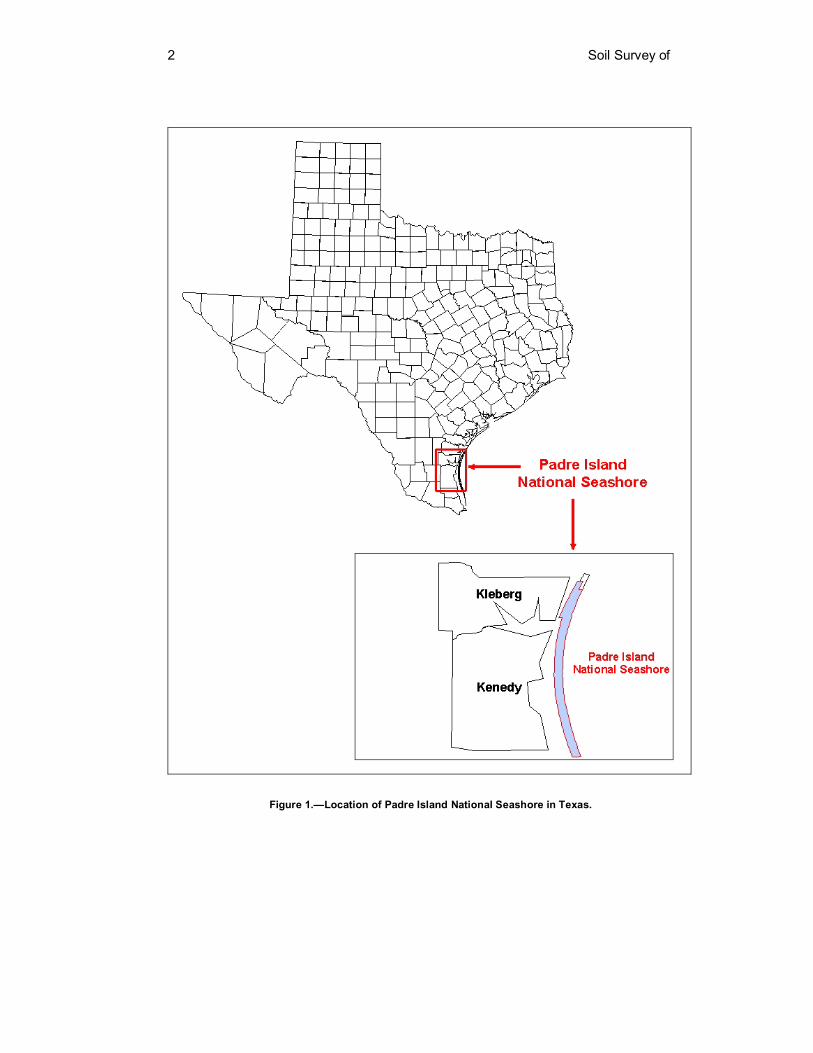
Padre Island National Seashore is along the southern gulf coast of Texas (fig. 1). It is about 68 miles long. It is 4 miles wide in the northern third of the island and 3 miles wide in the southern two-thirds of the island. The total area including water areas is 130,454 acres, or about 204 square miles. Padre Island National Seashore lies in the Gulf Coast Saline Prairies Major Land Resource Area. It is on the eastern edges of Kleberg, Kenedy, and Willacy Counties.
The land surface is nearly level, but the foredune ridge along the beach is undulating. Elevations range from 0 to about 45 feet above sea level, but most of the island is at an elevation of less than 20 feet. Padre Island is separated from the Texas mainland by the Laguna Madre. The Laguna Madre extends from Corpus Christi Bay in the north to Santiago Pass near the mouth of the Rio Grande. There is no open route from the Laguna Madre to the Gulf of Mexico except for the Port Mansfield Channel in Willacy County, which is the southern edge of Padre Island National Seashore. Baffin Bay is an inland bay between Kenedy and Kleberg Counties. The Laguna Madre and Baffin Bay systems are thus relatively unaffected by daily tides which, on the Gulf side of the island, are generally about 1.5 feet. The absence of an open path to the Gulf of Mexico has created a hyper-saline environment.
The Laguna Madre is separated into a northern, or upper, part and a southern, or lower, part by an extensive area of wind-tidal flats. These wind-tidal flats are on the western (leeward) side of the island between the vegetated portion of the island and the lagoon. Wind-tidal flats differ from tidal flats in that they are essentially unaffected by daily tides. The wind-tidal flats are inundated when strong winds, generally from cold fronts, push the lagoon water onto the flats. The soils on the wind-tidal flats have a variably thick algal mat on the surface. The algal mat in some areas is thick enough to trap hydrogen sulfide gas as it is released, forming vesicular pores in the upper 10 inches of the soil. The wind-tidal flats are extremely “delicate” and easily damaged. Tracks left by vehicles and human footprints take several years to heal; thus fieldwork during the making of this survey was limited in these areas.
2 Soil Survey of
Figure 1.—Location of Padre Island National Seashore in Texas.
Padre Island National Seashore, Texas 3
Padre Island protects the mainland by absorbing much of the force of strong tropical storms and hurricanes. These storms can have storm surge higher than 10 feet. This high storm surge combined with above-normal tides can erode the foredune ridge and flood the area behind it. The water coming across the island causes obvious damage to the island, but the water going back out to sea can often cause even more damage. The eroded area becomes a washover channel. These washover channels generally split into two or more channels as they move across the island and form a washover fan. Presently, all of the washover fans are in the southern part of the island.
The beaches of Padre Island change almost daily due to the wind, currents, waves, and tides. After periods of abnormal high tides the beach is smoothed over by the waves. Driving conditions on the beach are generally good soon afterwards. Driving conditions can change quite rapidly, however, as currents in the Gulf deposit sargassam and other seaweed on the beach. The seaweed starts to build a slight ridge along the length of the beach as it collects sand and more seaweed. This ridge separates the beach into a forebeach on the Gulf side, and a backbeach towards the foredune ridge. The backbeach then is typically not inundated by daily tides, and strong southeast winds start to dry the surface. As the backbeach dries, the winds start to blow sand toward the foredune ridge, helping to build the ridge.
As part of this survey, the soils were mapped in areas of the grassflats in subaqeous areas of the Laguna Madre and on the spoil islands along the Intracoastal Waterway and other dredged areas. The Upper Laguna Madre was the primary area of interest for subaqeous soils in the survey area. The Upper Laguna Madre grassflats are dominated by shoalgrass, but it also includes clovergrass, turtlegrass, manateegrass, and widgeon- grass. The grassflats of the Upper Laguna Madre were at water depths generally less than 4 feet. The southern portion of the Upper Laguna Madre is an area known locally as The Hole. The “Hole” is a shallow sub-bay system with depths of 2.5 feet or less, and often less than 1 foot. Spoil islands in the survey area were previously recognized as miscellaneous areas. Although these man-made islands are only about 60 years old, they support vegetation and exhibit some soil development.
The major land use on Padre Island National Seashore is wildlife habitat and recreation. Most of the recreation is either on the beach, in the surf, or in the Laguna Madre via Bird Island Basin.
General Nature of the Survey Area This section gives general information about Padre Island and Padre Island National
Seashore. It briefly describes the history and settlement, natural resources, and climate.
History and Settlement Padre Island, a long sand-barrier island extending some 130 miles along the coast of
South Texas, has the longest sand beach in the United States. The north end is just east of Corpus Christi, and the south end is opposite Port Isabel. The island is separated from the mainland by the Laguna Madre and connected to the mainland at each end by causeways. It is divided by the dredged Port Mansfield Channel, which provides shipping access to the Intracoastal Waterway and to Port Mansfield from the Gulf of Mexico. (Handbook of Texas Online, 2004a and 2004b)
Padre Island comprises over 130,000 acres in Nueces, Kleberg, Willacy, Cameron, and Kenedy Counties. A belt of dunes 25 to 40 feet high runs along the Gulf side of the island. Nowhere is the island more than 3 to 4 miles wide. The island was formed by the slow, ongoing process of sea erosion and deposition. A large variety of shells has been washed ashore on the island, and other objects from rivers and from the Gulf have been deposited in fine silt and sand on the island. The Sigsbee Deep, the deepest part of the Gulf of Mexico, is situated off the central part of the island. It is an abyss 300 miles long,
4 Soil Survey of
100 miles wide, and 12,000 feet deep. More than 272 varieties of saltwater fish have been identified in the Sigsbee Deep, a favorite site for fishermen.
Padre Island first appears as a dot labeled Isla Blanca on a map by Alonzo Álvarez de Pineda in 1519. Since that time the island has been known by various names: Isla de San Carlos de las Malaguitas, Isla Corpus Christi, Isla del Padre Ballí, Ysla del Vallín, Isla de Bayán (Vallín and Bayán are variations of Ballí), and Isla de Santiago. Indians of the Archaic period are believed to have lived on the island from 2700 to 1000 B.C. They were followed by Karankawan and Coahuiltecan peoples of the Rockport culture, who visited the island seasonally until the mid-1800s. In 1554 four ships sailed from Veracruz for Spain. They encountered storms, and three of the four were cast up on Padre Island at about the location of the present Mansfield Channel.
The first known land grant on the island is believed to have been given to Padre José Nicolás Ballí, for whom Padre Island is named, and his nephew José Ballí II in 1805. They established Rancho Santa Cruz de Buena Vista some 24 miles from the south end of the island. Their grant was perfected by the Mexican state of Tamaulipas on February 21, 1829. Capt. John V. Singer and his family were shipwrecked on Padre Island in 1847. They built a home on the site of the old Ballí ranch and ranched there until the Civil War. In spite of the independence of Texas in 1836 and statehood in 1847, Padre Island remained a possession of Mexico until the Treaty of Guadalupe Hidalgo in 1848. The state of Texas subsequently relinquished all rights on the island to Nicolás and Juan José Ballí, on February 10, 1852.
In 1879 Patrick Dunn, the "Duke of Padre," was living on the island. He gradually acquired title to all but 7,500 acres of the south end, then sold his interests in 1926 to Samuel A. Robertson, who attempted to develop the south end into a beach drive. Robertson's two hotels and four houses were destroyed by the hurricane of 1933, and the developer sold his interests to Albert and Frank Jones of Kansas City, Missouri, in 1939. In the 1940s oil was discovered offshore, and gas was discovered on the island. In the 1950s oil and gas leases were negotiated on what is now the National Seashore.
All of Padre Island is susceptible to tropical storm damage. Between 1900 and 1979 eleven tropical storms struck the island, an average of one every 7.1 years. Historically, developments have been hard to maintain against storm surge, flooding, and wind and wave erosion.
Efforts to establish a state park on Padre Island began in 1936 when D. E. Colp, State Parks Board chairman, proposed a park halfway between Port Isabel and Corpus Christi. That year, an 80-mile state park was suggested. A year later Rep. W. E. Pope of Corpus Christi introduced a bill in the Texas legislature for a park. After the bill passed both state chambers, Governor James Allred vetoed the measure, believing that the state already held some legal title to the island. State courts subsequently upheld private ownership. As a result of this court ruling, the first thorough land survey of the island—Boyle's survey—was undertaken in 1941. Investment, real estate speculation, and commercial development on the island escalated during the 1940s and 1950s. In 1955 the United States Park Service issued a publication, “The Vanishing Shoreline,” on the loss of America's natural shorelines. One year later a 10-year plan entitled Mission 66 was unveiled by Conrad Wirth, the Director of the National Park Service, who wanted to establish more national parks and seashores.
In 1958, newly elected Texas senator Ralph W. Yarborough introduced a bill to establish a national park on Padre Island. One year later the bill was reintroduced, and committee hearings were held in December 1959 and August 1960. Texas citizens favored the establishment of a park but were opposed by developers and land investors. Though a similar bill proposing a smaller 40-mile park was introduced, Senator Yarborough was able to guide his bill through Congress, and it passed in 1962. On September 23, 1962, President John F. Kennedy signed the measure into law. Five years of condemnation proceedings were required before Padre Island National Seashore was dedicated. Separate civil suits at Corpus Christi in 1965 and Brownsville in 1966 resulted
Padre Island National Seashore, Texas 5
in larger settlements than had previously been expected. The island's surface lands were finally purchased at a cost of nearly $23 million, compared to the initial estimate of $4.5 million.
Padre Island National Seashore, the longest seashore in the National Parks System was dedicated on April 8, 1968, by Mrs. Lyndon B. Johnson before a crowd of nearly 10,000. Attending were state and national officials, eighty American and foreign journalists, and leaders of various civic, garden, and environmental groups. The national seashore includes a 67.5-mile-long portion of the barrier island, and some of the island's backwaters of the Laguna Madre. The seashore comprises approximately 130,000 acres in Kleberg, Willacy, and Kenedy Counties, bounded by Mustang Island on the north and the Port Mansfield Channel on the south.
Subsoil and mineral rights still belong to private landowners. Shorter sections at each end of the island were not included in the national seashore. Small county parks and commercial developments already existed there when the Padre Island National Seashore bill was passed by Congress and the Texas Legislature. Nueces County has a park at the northern end of the island and Cameron County maintains another at the southern end. Areas between the county parks and the national seashore remain under private or corporate ownership.
At present the island is divided into three distinct areas: north, central, and south. The north is devoted to residential, water-oriented, and recreational development. In 1962 the central portion became Padre Island National Seashore, which is in its natural state except at Malaquite Beach. The south part has been developing rapidly since the 1970s as a resort area; the town of South Padre Island was incorporated in 1973.
The chief attraction of Padre Island is its wide eastern beach of fine sand and shell fragments that slopes gently into the Gulf of Mexico, making it ideal for swimming, surf fishing, and play. In the interior of the island there are numerous deflated basins that become ponds and lakes in wet periods. In addition to these basins there are extensive dune fields of great scenic beauty, particularly early or late in the day. The National Park Service plans to alter the landscape as little as possible, so that visitors can experience the wind, sand, sea, and sky with minimal distraction.
Padre Island is home to more than 600 species of plants and wildflowers. A unique species of oily live oak tree (Quercus fusiformis) grows in small areas on the island. Blacktail jackrabbits, ground squirrels, kangaroo rats, coyotes, and eastern moles are among the many animals on Padre. The Laguna Madre is noted for its large numbers of waterfowl. Herons, ibis, egrets, spoonbills, pelicans, cormorants, ducks, and geese use the island and the lagoons as a sanctuary and breeding ground. For beachcombers, the Gulf shore provides a large variety of seashells, and everywhere there are innumerable natural and man-made objects cast ashore, especially after storms. The island has always been a lonely place because few people, including the Indians, have been able to live there permanently. Like many such sparsely occupied areas, Padre Island has a rich folklore, which is based mainly on pirates, treasure-laden shipwrecks, and Indian conflict. Its status as a national park is designed to keep most of it free from further settlement and commercial development. There is a visitor center at Malaquite Beach in the northern part of the park, which comprises an observation deck, a snack bar, a gift shop, showers, and a changing area. Padre Island National Seashore attracts hundreds of thousands of visitors every year.
Natural Resources The most important natural resources on Padre Island National Seashore are soil,
water, and wildlife. Soil is critical for the production of native species of grasses and other plants which the wildlife utilizes as habitat for food and cover. Many species of birds nest on the island. The island’s beach has also become a new birthing ground for the endangered Kemp’s Ridley Turtle, as well as other turtle species.
6 Soil Survey of
Water is abundant, but freshwater is limited to shallow swales on the interior of the island. The largest area of freshwater occurs on the northern third of the island in freshwater marshes. The Intracoastal Waterway runs parallel to the Gulf from Brownsville, Texas, to Florida. It extends for more than 16 miles along the western edge in the northern third of the survey area.
Malaquite Beach, as well as the entire beach shoreline is a popular recreational area, especially for sunbathers in the summer months. Fish and wildlife provide opportunities for recreation. Many species of fish and sharks are caught in the surf. The Laguna Madre and Baffin Bay support several species of fin fish. Bird watchers come to the area for the variety of ducks, geese, hawks, herons, and other birds.
Climate Prepared by the Natural Resources Conservation Service, National Water and Climate Center, Portland,
Oregon.
Table 1 provides data on temperature and precipitation for Padre Island as recorded at Port Aransas, in the period 1986 to 2000; Port Mansfield, in the period 1971 to 2000; and South Padre Island, in the period 1992 to 2000. Table 2 shows probable dates of the first freeze in fall and the last freeze in spring. Table 3 provides data on the length of the growing season. Thunderstorm days, relative humidity, percent sunshine, and wind information are estimated from the weather station at Corpus Christi, Texas.
In winter, the average temperature is 59 degrees F and the average daily minimum temperature is 51 degrees. The lowest temperature on record, which occurred at Port Aransas on December 23, 1989, is 12 degrees. In summer, the average temperature is 83 degrees and the average daily maximum temperature is 88 degrees. The highest temperature, which occurred at Port Mansfield on May 31, 1963, is 103 degrees.
Growing degree days are shown in table 1. They are equivalent to "heat units". During the month, growing degree days accumulate by the amount that the average temperature each day exceeds a base temperature (50 degrees F). The normal monthly accumulation is used to schedule single or successive plantings of a crop between the last freeze in spring and the first freeze in fall.
Average annual total precipitation varies significantly from North to South on Padre Island. The average annual total precipitation is about 34 inches at Port Aransas, Texas, on the northern end of the island, 26 inches at Port Mansfield in the central part, and 24 inches in the southern part at South Padre Island, Texas. Of this, 72 percent usually falls in May through November. The growing season is year round and adequate precipitation falls during most of the year. Thunderstorms occur on about 29 days each year, and most occur in May and September at 5 days.
The average relative humidity in mid-afternoon is about 68 percent. Humidity is higher at night, and the average at dawn is about 90 percent. The sun shines 77 percent of the time in summer and 47 percent in winter. The prevailing wind is from the SSE. Average wind speed is highest, 14 miles per hour, in March and April.
On Christmas Eve 2004, a freak winter storm dumped 4 inches of snow in the area. It was only the second white Christmas ever recorded in Corpus Christi.
How This Survey Was Made This survey was made to provide information about the soils and miscellaneous areas
in the Padre Island National Seashore. The information includes a description of the soils and miscellaneous areas and their location and a discussion of their suitability, limitations, and management for specified uses. Soil scientists observed the steepness, length, and shape of the slopes; the general pattern of drainage; and the kinds of native plants. They dug many holes to study the soil profile, which is the sequence of natural layers, or horizons, in a soil. The profile extends from the surface down into the
Padre Island National Seashore, Texas 7
unconsolidated material in which the soil formed. The unconsolidated material is devoid of roots and other living organisms and has not been changed by other biological activity.
The soils and miscellaneous areas in the survey area are in an orderly pattern that is related to the geology, landforms, relief, climate, and natural vegetation of the area. Each kind of soil and miscellaneous area is associated with a particular kind of landform or with a segment of the landform. By observing the soils and miscellaneous areas in the survey area and relating their position to specific segments of the landform, a soil scientist develops a concept or model of how they were formed. Thus, during mapping, this model enables the soil scientist to predict with a considerable degree of accuracy the kind of soil or miscellaneous area at a specific location on the landscape.
Commonly, individual soils on the landscape merge into one another as their characteristics gradually change. To construct an accurate soil map, however, soil scientists must determine the boundaries between the soils. They can observe only a limited number of soil profiles. Nevertheless, these observations, supplemented by an understanding of the soil-vegetation-landscape relationship, are sufficient to verify predictions of the kinds of soil in an area and to determine the boundaries.
Soil scientists recorded the characteristics of the soil profiles that they studied. They noted soil color, texture, size and shape of soil aggregates, kind and amount of rock or shell fragments, distribution of plant roots, reaction, and other features that enable them to identify soils. After describing the soils in the survey area and determining their properties, the soil scientists assigned the soils to taxonomic classes (units). Taxonomic classes are concepts. Each taxonomic class has a set of soil characteristics with precisely defined limits. The classes are used as a basis for comparison to classify soils systematically. Soil taxonomy, the system of taxonomic classification used in the United States, is based mainly on the kind and character of soil properties and the arrangement of horizons within the profile. After the soil scientists classified and named the soils in the survey area, they compared the individual soils with similar soils in the same taxonomic class in other areas so that they could confirm data and assemble additional data based on experience and research.
While a soil survey is in progress, samples of some of the soils in the area generally are collected for laboratory analyses and for engineering tests. Soil scientists interpret the data from these analyses and tests as well as the field-observed characteristics and the soil properties to determine the expected behavior of the soils under different uses. Interpretations for all of the soils are field tested through observation of the soils in different uses and under different levels of management. Some interpretations are modified to fit local conditions, and some new interpretations are developed to meet local needs. Data are assembled from other sources, such as research information, production records, and field experience of specialists.
Predictions about soil behavior are based not only on soil properties but also on such variables as climate and biological activity. Soil conditions are predictable over long periods of time, but they are not predictable from year to year. For example, soil scientists can predict with a fairly high degree of accuracy that a given soil will have a high water table within certain depths in most years, but they cannot predict that a high water table will always be at a specific level in the soil on a specific date.
After soil scientists located and identified the significant natural bodies of soil in the survey area, they drew the boundaries of these bodies on aerial photographs and identified each as a specific map unit. Aerial photographs show trees, buildings, fields, roads, and rivers, all of which help in locating boundaries accurately.
The descriptions, names, and delineations of the soils in this survey area do not fully agree with those of the soils in adjacent survey areas. Differences are the result of a better knowledge of soils, modifications in series concepts, or variations in the intensity of mapping or in the extent of the soils in the survey areas.

9
Geology and Soil Geomorphology
Previous publications that discuss the geology and geomorphology of Padre Island are informative and comprehensive. They include “Padre Island National Seashore – Field Guide,” compiled by the Corpus Christi Geological Society for the Gulf Coast Association of Geological Societies Convention Field Trip, October, 1972, and the 1980 Bureau of Economic Geology publication “Padre Island National Seashore – A Guide to the Geology, Natural Environments, and History of a Texas Barrier Island” by Bonnie R. Weise and William A. White. The following narrative on depositional processes and depositional environments includes geologic and geomorphic discussions that are relevant to an understanding of soil geomorphology and soil formation on Padre Island. This material may include some overlap with these two publications.
Table 4 provides information about the geomorphology and vegetation for the map units in the survey area. The following provides a discussion of the columns in this table. Slope is the inclination of the land surface from the horizontal. Percentage of slope is the vertical distance divided by the horizontal distance, then multiplied by 100. Elevation is the height above mean sea level for the major components in the map unit. Landscape is a group of spatially related, natural landforms over a relatively large area. The landscape is the land surface which the eye can comprehend in a single view. Landform is any physical, recognizable form or feature on the earth’s surface having a characteristic shape and range in composition, and produced by natural causes. A landform can span a wide range in size. Parent material is the unconsolidated and more or less chemically weathered mineral or organic matter from which a soil forms.
An ecological site is an area where climate, soil, and relief are sufficiently uniform to produce a distinct natural plant community. Characteristic native vegetation (the grasses, forbs, and shrubs that make up most of the potential natural plant community on each soil) is listed by common name. Rangeland composition is the expected percentage of the total annual production given for each species making up the characteristic vegetation. The amount that can be used as forage depends on the kinds of grazing animals and on the grazing season.
Formation of the Barrier Island Landscape Barrier island systems are dynamic environments with the potential for significant
change in surface morphology following each tropical storm. Barrier islands aggrade by the vertical stacking of beach sediments in a generally coarsening-upward sequence. Lagoonward extension by deposition of washover fans and windblown sands and slight seaward growth of the beach are important in the development of barrier islands (fig. 2).
Wind System, Longshore Drift, and Formation of Shell Beaches Wind action plays a large role in shaping the land surface on Padre Island (fig. 3).
Low rainfall (compared to northeastern portions of the Texas barrier island system) and strong, predominantly offshore winds are responsible for the importance of wind as an agent affecting deposition and erosion.
10 Soil Survey of
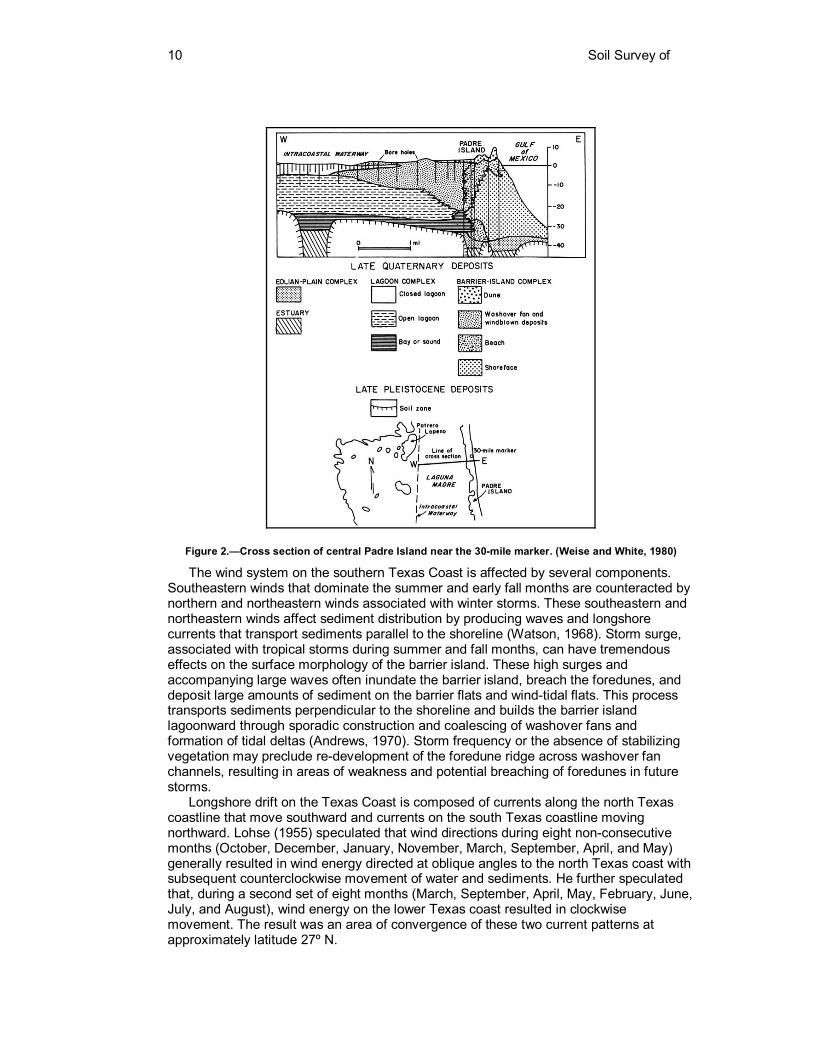
Figure 2.—Cross section of central Padre Island near the 30-mile marker. (Weise and White, 1980)
The wind system on the southern Texas Coast is affected by several components. Southeastern winds that dominate the summer and early fall months are counteracted by northern and northeastern winds associated with winter storms. These southeastern and northeastern winds affect sediment distribution by producing waves and longshore currents that transport sediments parallel to the shoreline (Watson, 1968). Storm surge, associated with tropical storms during summer and fall months, can have tremendous effects on the surface morphology of the barrier island. These high surges and accompanying large waves often inundate the barrier island, breach the foredunes, and deposit large amounts of sediment on the barrier flats and wind-tidal flats. This process transports sediments perpendicular to the shoreline and builds the barrier island lagoonward through sporadic construction and coalescing of washover fans and formation of tidal deltas (Andrews, 1970). Storm frequency or the absence of stabilizing vegetation may preclude re-development of the foredune ridge across washover fan channels, resulting in areas of weakness and potential breaching of foredunes in future storms.
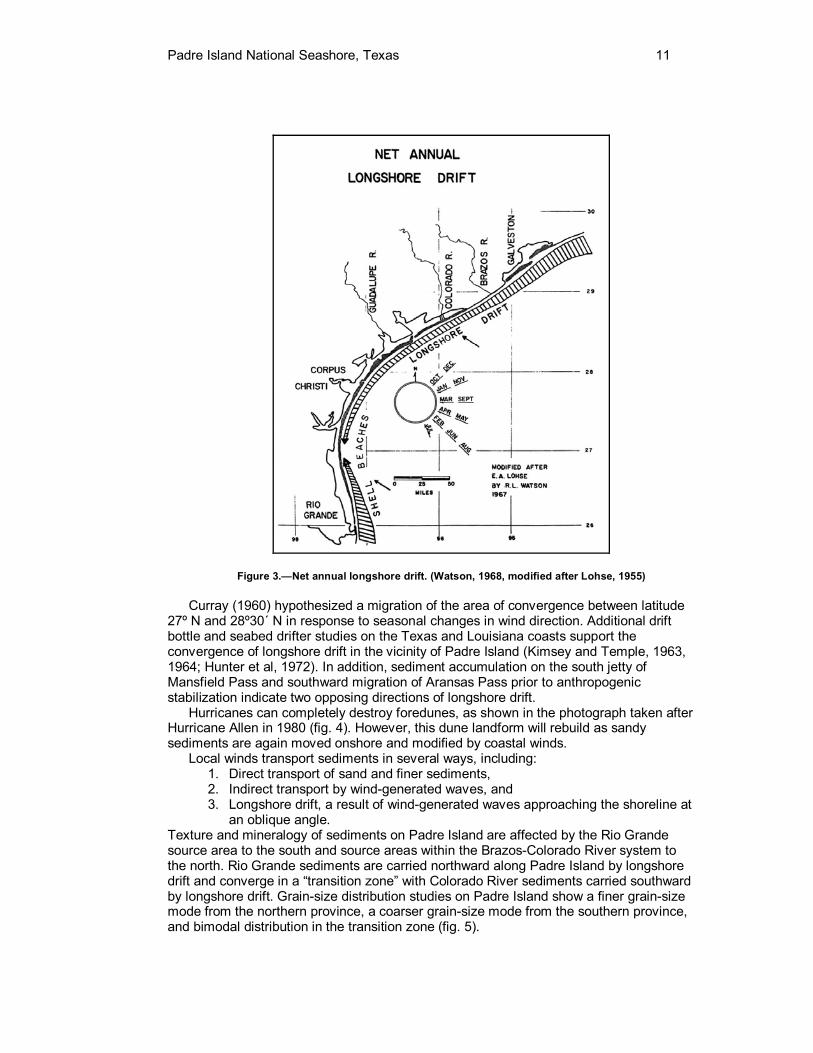
Longshore drift on the Texas Coast is composed of currents along the north Texas coastline that move southward and currents on the south Texas coastline moving northward. Lohse (1955) speculated that wind directions during eight non-consecutive months (October, December, January, November, March, September, April, and May) generally resulted in wind energy directed at oblique angles to the north Texas coast with subsequent counterclockwise movement of water and sediments. He further speculated that, during a second set of eight months (March, September, April, May, February, June, July, and August), wind energy on the lower Texas coast resulted in clockwise movement. The result was an area of convergence of these two current patterns at approximately latitude 27º N.
Padre Island National Seashore, Texas 11
Figure 3.—Net annual longshore drift. (Watson, 1968, modified after Lohse, 1955)
Curray (1960) hypothesized a migration of the area of convergence between latitude 27º N and 28º30´ N in response to seasonal changes in wind direction. Additional drift bottle and seabed drifter studies on the Texas and Louisiana coasts support the convergence of longshore drift in the vicinity of Padre Island (Kimsey and Temple, 1963, 1964; Hunter et al, 1972). In addition, sediment accumulation on the south jetty of Mansfield Pass and southward migration of Aransas Pass prior to anthropogenic stabilization indicate two opposing directions of longshore drift.
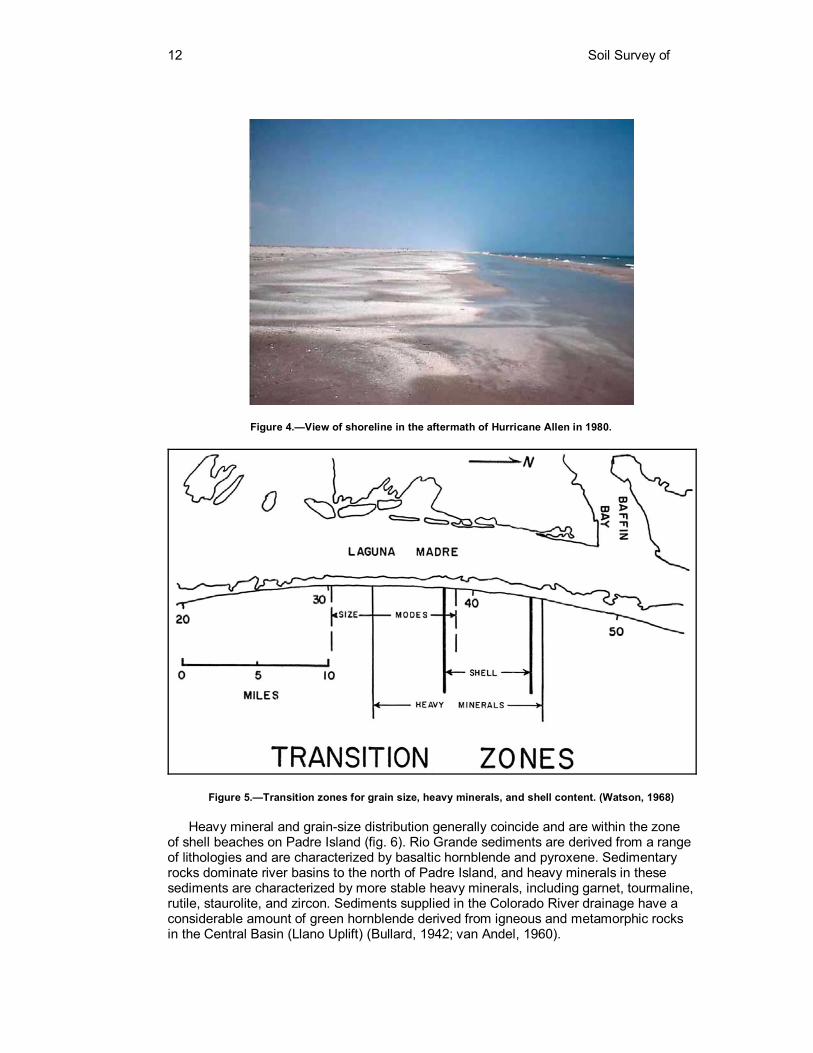
Hurricanes can completely destroy foredunes, as shown in the photograph taken after Hurricane Allen in 1980 (fig. 4). However, this dune landform will rebuild as sandy sediments are again moved onshore and modified by coastal winds.
Local winds transport sediments in several ways, including: 1. Direct transport of sand and finer sediments, 2. Indirect transport by wind-generated waves, and 3. Longshore drift, a result of wind-generated waves approaching the shoreline at
an oblique angle. Texture and mineralogy of sediments on Padre Island are affected by the Rio Grande source area to the south and source areas within the Brazos-Colorado River system to the north. Rio Grande sediments are carried northward along Padre Island by longshore drift and converge in a “transition zone” with Colorado River sediments carried southward by longshore drift. Grain-size distribution studies on Padre Island show a finer grain-size mode from the northern province, a coarser grain-size mode from the southern province, and bimodal distribution in the transition zone (fig. 5).
12 Soil Survey of
Figure 4.—View of shoreline in the aftermath of Hurricane Allen in 1980.
Figure 5.—Transition zones for grain size, heavy minerals, and shell content. (Watson, 1968)
Heavy mineral and grain-size distribution generally coincide and are within the zone of shell beaches on Padre Island (fig. 6). Rio Grande sediments are derived from a range of lithologies and are characterized by basaltic hornblende and pyroxene. Sedimentary rocks dominate river basins to the north of Padre Island, and heavy minerals in these sediments are characterized by more stable heavy minerals, including garnet, tourmaline, rutile, staurolite, and zircon. Sediments supplied in the Colorado River drainage have a considerable amount of green hornblende derived from igneous and metamorphic rocks in the Central Basin (Llano Uplift) (Bullard, 1942; van Andel, 1960).
Padre Island National Seashore, Texas 13
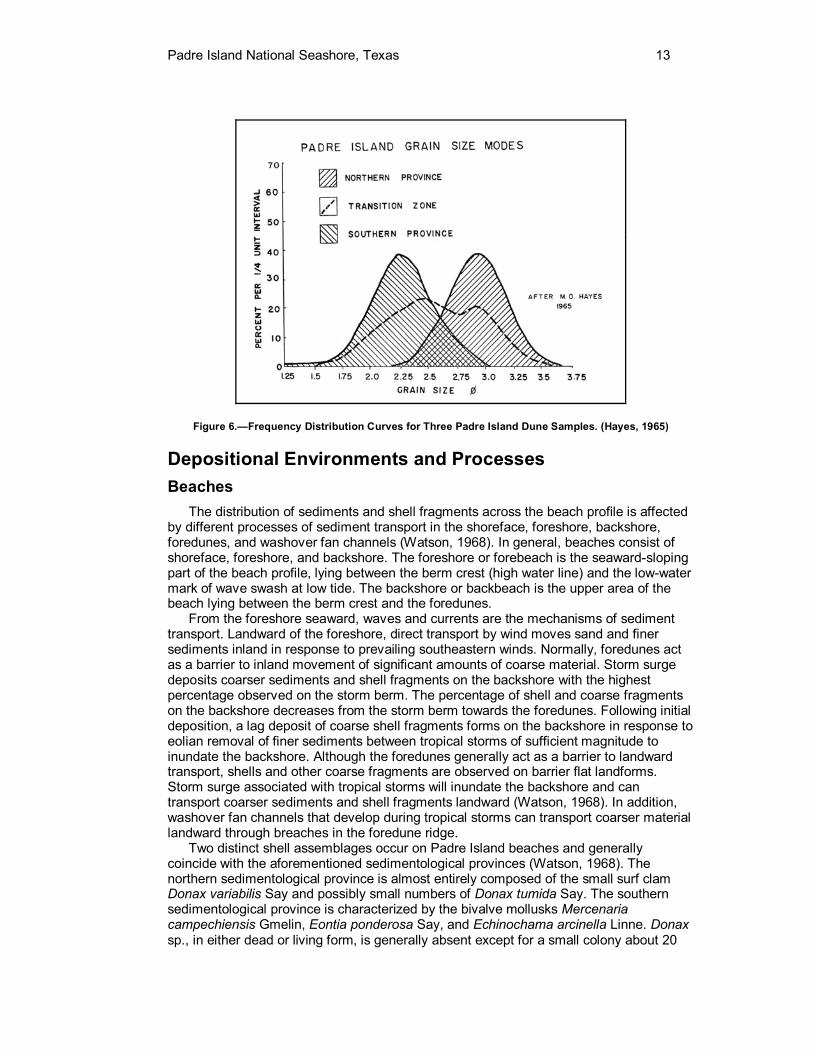
Figure 6.—Frequency Distribution Curves for Three Padre Island Dune Samples. (Hayes, 1965)
Depositional Environments and Processes Beaches
The distribution of sediments and shell fragments across the beach profile is affected by different processes of sediment transport in the shoreface, foreshore, backshore, foredunes, and washover fan channels (Watson, 1968). In general, beaches consist of shoreface, foreshore, and backshore. The foreshore or forebeach is the seaward-sloping part of the beach profile, lying between the berm crest (high water line) and the low-water mark of wave swash at low tide. The backshore or backbeach is the upper area of the beach lying between the berm crest and the foredunes.
From the foreshore seaward, waves and currents are the mechanisms of sediment transport. Landward of the foreshore, direct transport by wind moves sand and finer sediments inland in response to prevailing southeastern winds. Normally, foredunes act as a barrier to inland movement of significant amounts of coarse material. Storm surge deposits coarser sediments and shell fragments on the backshore with the highest percentage observed on the storm berm. The percentage of shell and coarse fragments on the backshore decreases from the storm berm towards the foredunes. Following initial deposition, a lag deposit of coarse shell fragments forms on the backshore in response to eolian removal of finer sediments between tropical storms of sufficient magnitude to inundate the backshore. Although the foredunes generally act as a barrier to landward transport, shells and other coarse fragments are observed on barrier flat landforms. Storm surge associated with tropical storms will inundate the backshore and can transport coarser sediments and shell fragments landward (Watson, 1968). In addition, washover fan channels that develop during tropical storms can transport coarser material landward through breaches in the foredune ridge.
Two distinct shell assemblages occur on Padre Island beaches and generally coincide with the aforementioned sedimentological provinces (Watson, 1968). The northern sedimentological province is almost entirely composed of the small surf clam Donax variabilis Say and possibly small numbers of Donax tumida Say. The southern sedimentological province is characterized by the bivalve mollusks Mercenaria campechiensis Gmelin, Eontia ponderosa Say, and Echinochama arcinella Linne. Donax sp., in either dead or living form, is generally absent except for a small colony about 20
14 Soil Survey of
miles north of Mansfield Pass (Watson, 1968). The bivalve mollusks Andara braziliana Lamarck, Andara ovalis Bruguiere, and Andara baughmani Hertlein are common throughout the extent of Padre Island and do not exhibit significant trends in distribution. The transition zone between these two provinces has a lower total shell percentage than flanking areas with slightly increased numbers of the Andara species. Percentage of shell species and degree of abrasion suggest that the Mercenaria-Eontia-Echinochama assemblage has a southern source and is transported to the north and that the Donax assemblage has a northern source and is transported to the south (Watson, 1968).
Following a life span within the surf zone, Donax is transported southward by longshore drift to accumulate in a beach area called Little Shell, located on the southern end of the northern sedimentological province. Mercenaria, Eontia, and Echinochama shells are abraded and not present as fresh specimens on a beach area called Big Shell, located on the northern end of the southern sedimentological province (Watson, 1968). Holocene radiocarbon dates and long-term stability in the area of Little Shell and Big Shell beaches (Morton, 1977) accommodate a high degree of abrasion, resulting from continual reworking by wave action for extended periods of time. In addition, Mercenaria shells are commonly highly discolored. These observations suggest accumulation of shell fragments due to differential sorting by wave energy and not a locally rich population. The discoloration might also suggest an older, reworked shell assemblage, possibly subject to burial prior to accumulation in a beach environment.
Stratifications in the beach environment are primarily seaward-dipping laminations produced by wave swash. However, burrowing organisms on the beach tend to destroy these primary sedimentary structures. The backshore and upper foreshore are dominated by the burrowing ghost crab Ocypode quadrata, while the ghost shrimp Callianassa islagrande characterizes the lower foreshore (Hunter et al, 1972). Variations in ghost crab burrow morphology, including spatial density, size, and shape, can be used to designate sub-environments on the beach.
Beds containing up to 80 percent shell fragments have been observed in trenches on Padre Island between present-day foredunes and back-island dune fields and may represent ancestral, buried beaches (Watson, 1968; Hayes, 1965).
Foredunes Foredunes, also referred to as foredune ridges or fore-island dune ridges, are the
dunal ridges immediately landward of the beach and aligned parallel to the shoreline. They protect the barrier flats from the full onslaught of tropical storms. On Padre Island, foredune sediments consist of very well-sorted, fine and very fine sands that are blown from the backshore beach environment and stabilized by vegetation.
The degree of foredune development and foredune height are directly related to the sediment supply and the amount of vegetation (necessary for dune stabilization). The semiarid climate, typic ustic soil moisture regime, and hyperthermic soil temperature regime on Padre Island affect the growth of vegetation and, therefore, the potential stability of foredunes. Drier, southern portions of Padre Island have low foredunes. In contrast, elevation of large foredunes on Big Shell beach can reach 45 feet (14 meters). In addition, foredunes in the area of longshore drift convergence show a distinct correlation between increased or maximum amount of shell fragments on the beach and the location of high, continuous foredunes (Watson, 1968). Low dunes and/or washover fan channels correspond to local minima in shell fragment percentages. This positive correlation does not occur elsewhere on Padre Island where high and continuous foredunes are adjacent to beaches with less than 1 percent shell fragments.
Tropical storms can breach the foredunes to create or re-open washover fan channels. Foredunes are rarely subjected to flooding that accompanies the storm surge of tropical storms if the storm event does not destroy the dune morphology.
The soils mapped on foredunes on Padre Island National Seashore exhibit a difference in pH between northern and southern portions of the island. Greenhill soils
Padre Island National Seashore, Texas 15
form on lower pH sediments on northern parts of Padre Island, while Daggerhill soils develop on higher pH sediments that have sand-sized and coarser shell fragments. The vegetation on these two soils is in response to a relatively deep water table (within a depth of 80 inches [2 meters] of the soil surface) rather than pH differences.
Vegetated Barrier Flats, Back-Island Dune Fields, and Washover Fans Vegetated barrier flats form on the lagoon side of barrier island foredunes and slope
very gently toward the lagoon from about 5 feet (1.5 meters) in elevation to near sea level. Parent sediments on barrier flat landforms are a combination of sandy sediments on deflation flats and sandy storm-washover sediments with eolian modification to locally form low dunes. Sparsely vegetated barrier flats have not yet had enough time or moisture to produce a dense vegetative cover, while heavily vegetated barrier flats indicate more land stability and support various grasses and small shrubs.
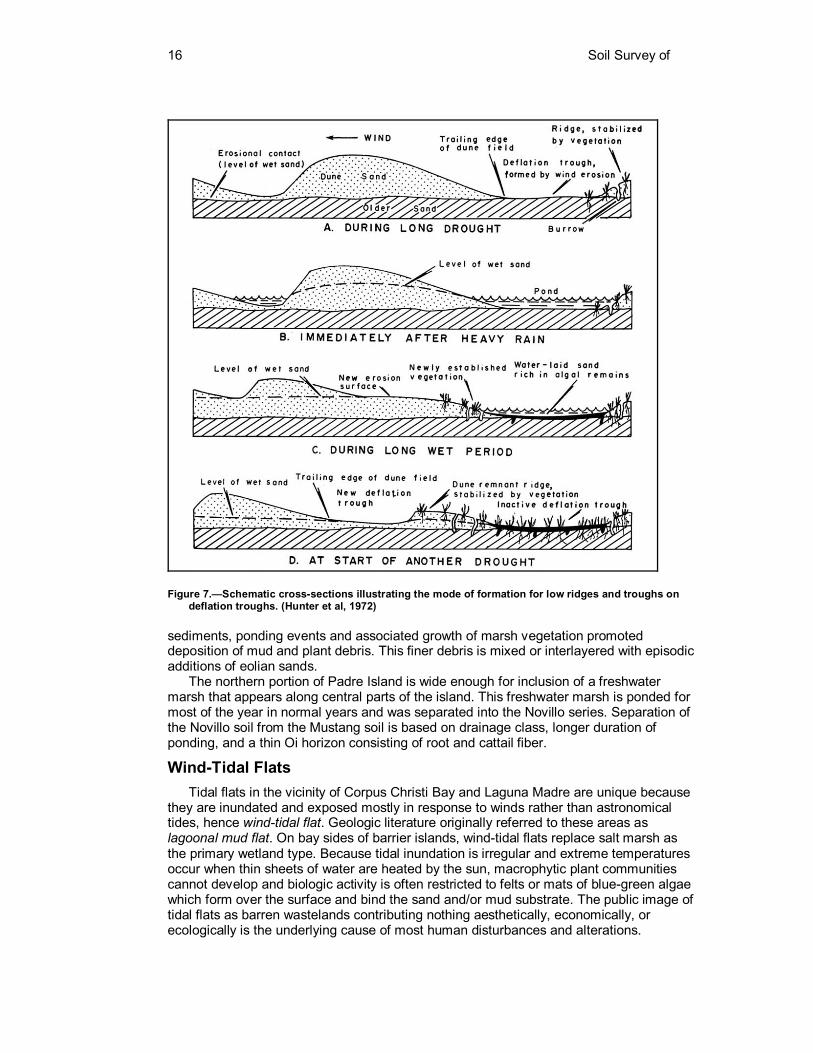
Most barrier flats on the South Texas Gulf Coast have some percentage of barren or minimally vegetated deflation flats. Barren deflation flats are a series of low ridges and troughs on an essentially flat surface that typically form on the windward side of back-island dune fields. These deflation flats form when sandy sediments are removed (by eolian activity) to the water table level during drought periods and deposited as dune landforms downwind. Ridges are stabilized by vegetation that invades the edge of dune fields during wet periods. Coarser sediments and shell fragments on the land surface form a lag deposit that results from wind deflation of finer sediments. The erosional nature of deflation flats results in “uncovering” of perhaps the oldest sandy sediments exposed on Padre Island. However, these relatively older sediments are often covered by a veneer of more recently deposited eolian sands. The lagoonward margins of deflation flats often grade into wind-tidal flats, and this boundary between landforms is (at times) not well defined (fig. 7).
Mustand, Padre, Panam, Madre, Malaquite, and Novillo soils are mapped on barrier flats on Padre Island National Seashore. The Mustang soil has a water table within 10 to 30 inches (25 to 75 centimeters) of the soil surface throughout the year, and is generally ponded for some time in normal years after periods of heavy rainfall. Mustang soils occur on more linear slope shapes on the barrier flat. The Padre and Panam soils have a water table within 40 inches (100 centimeters) of the soil surface for some time during normal years, redox depletions within a depth of 40 inches (100 centimeters), and less than 5 percent silt plus clay. Padre and Panam soils occur on low, stabilized dunes on barrier flats.
Soils on low dunes on northern portions of Padre Island National Seashore have a significantly lower pH than soils on similar landforms farther south. The lower pH appears to be a result of less sand-sized seashell fragments and the low buffering capacity of the sand. The presence of greater amounts of sand-sized seashell fragments in the down-island soils is coincident with the occurrence of shell beaches, primarily Little Shell and Big Shell. The Panam series was separated from the Padre series in areas of higher pH. Panam soils are slightly and moderately alkaline, while Padre soils are moderately to strongly acidic. These soils exhibit only a subtle vegetation difference in species composition.
The Mustang series had been previously mapped along the Texas coast with several different saline phases. During the mapping of Padre Island National Seashore, these phases were separated into the sodic Madre series and the saline Malaquite series. Madre soils occur on linear to slightly concave slope shapes on barrier flats, and Malaquite soils occur on shallow depressions on barrier flats.
Freshwater ponds and marshes occur in troughs associated with deflation flats on the barrier flats. Troughs are generally linear and are located in areas through which back-island dune fields have migrated. While these troughs were originally floored in sandy
16 Soil Survey of
Figure 7.—Schematic cross-sections illustrating the mode of formation for low ridges and troughs on deflation troughs. (Hunter et al, 1972)
sediments, ponding events and associated growth of marsh vegetation promoted deposition of mud and plant debris. This finer debris is mixed or interlayered with episodic additions of eolian sands.
The northern portion of Padre Island is wide enough for inclusion of a freshwater marsh that appears along central parts of the island. This freshwater marsh is ponded for most of the year in normal years and was separated into the Novillo series. Separation of the Novillo soil from the Mustang soil is based on drainage class, longer duration of ponding, and a thin Oi horizon consisting of root and cattail fiber.
Wind-Tidal Flats Tidal flats in the vicinity of Corpus Christi Bay and Laguna Madre are unique because
they are inundated and exposed mostly in response to winds rather than astronomical tides, hence wind-tidal flat. Geologic literature originally referred to these areas as lagoonal mud flat. On bay sides of barrier islands, wind-tidal flats replace salt marsh as the primary wetland type. Because tidal inundation is irregular and extreme temperatures occur when thin sheets of water are heated by the sun, macrophytic plant communities cannot develop and biologic activity is often restricted to felts or mats of blue-green algae which form over the surface and bind the sand and/or mud substrate. The public image of tidal flats as barren wastelands contributing nothing aesthetically, economically, or ecologically is the underlying cause of most human disturbances and alterations.
Padre Island National Seashore, Texas 17
Wind-tidal flats differ from regular tidal flats in that the tides in this area are wind or storm tides. Astronomical tide fluctuation is only about 1.5 feet (0.5 meter) on the gulf side, and the lack of bay access to the gulf restricts astronomical tide to only a few inches in the bay, and even less in the Laguna Madre and Baffin Bay. Tidal fluctuation is highest during the semi-annual tides that occur in late May and late October, and lowest during late February and late July.
The wind-tidal flat appearance belies their importance to overall productivity of estuaries within the area. Worldwide, the most extensive wind-tidal flats are found around hypersaline lagoons like the Laguna Madre. There are approximately 225,000 acres of wind-tidal flats in Texas, with 37,314 acres within the boundary of Padre Island National Seashore.
Although fish, such as sheepshead minnows, may be found on wind-tidal flats when they are flooded, shorebirds that use exposed flats as foraging habitat are the most important vertebrate organisms found on these flats. Wind-tidal flats in the Laguna Madre are one of the most significant feeding areas for shorebirds on the Texas Gulf Coast. At least 26 shorebird feeding guilds can be found. Shorebirds, such as plovers, find their food using their eyes. They see prey or some evidence of the prey, e.g., a burrow entrance, and use their bills to capture it. Other shorebirds, including sandpipers and dowitchers, find food by probing into the substrate and feeling their prey with special cells at the end of their bills.
The extensive area of wind-tidal flats along the bay or lagoon side of the barrier islands includes primarily two soil series—the Tatton series along the lagoon margin, and the Satatton series at slightly higher elevations. Tatton soils are very poorly drained, have a water table within 12 inches (30 centimeters) of the soil surface, and are subjected to very frequent flooding for long duration. Satatton soils are poorly drained, have a water table within 12 to 18 inches (30 to 45 centimeters) of the soil surface, and are subjected to frequent flooding for brief duration.
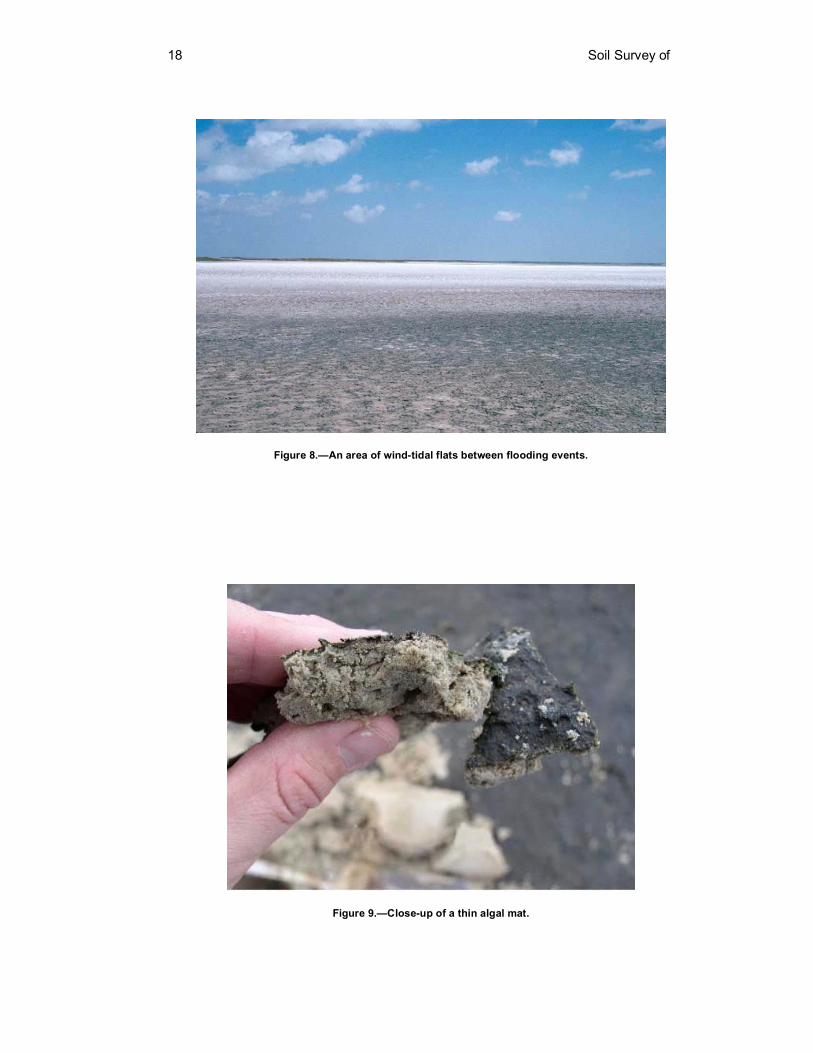
Wind-tidal flats are dry for extended periods during the year, being flooded only when sustained winds “push” the water over the surface (fig. 8). These areas in the Upper Laguna Madre are predominantly inundated by cold fronts with northwest winds. These fronts do not have to be strong, as cool fronts in the summer months can push a significant amount of water onto the wind-tidal flats.
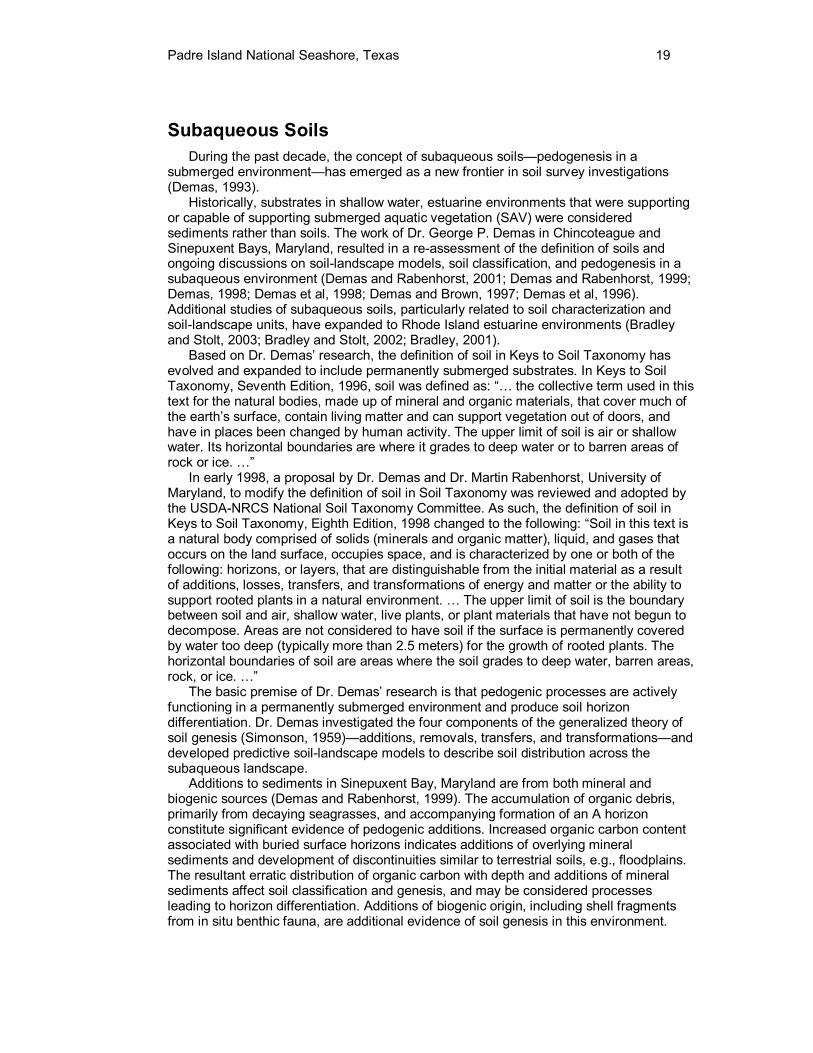
The wind-tidal flat algal mat is composed predominantly of the benthic, blue-green algae Cyanobacteria (fig. 9). This alga has chlorophyll and is thought to have been the plant that changed earth’s atmosphere during the Archaean and Proterozoic Era. Halophytic vegetation consisting of saltwort Batis maritima and glasswort Salicornia spp. occur for short periods after inundation. The surface salinity rises as the surface dries, and eventually the salinity becomes toxic to the plants.
The algal mat in some areas is thick enough to trap hydrogen sulfide gas as it is released from the soil, forming vesicular pores in the upper 10 inches (25 centimeters) of the soil. The gas and pores actually raise the surface, and one leaves footprints when walking on the wind-tidal flats that are sometimes as deep as 3 inches (8 centimeters).
Wind-tidal flats and washover channels are more common and extensive on southern portions of Padre Island in Kenedy County. Washover fan channels are common south of the 30-mile mark on Padre Island National Seashore.
18 Soil Survey of
Figure 8.—An area of wind-tidal flats between flooding events.
Figure 9.—Close-up of a thin algal mat.
Padre Island National Seashore, Texas 19
Subaqueous Soils During the past decade, the concept of subaqueous soils—pedogenesis in a
submerged environment—has emerged as a new frontier in soil survey investigations (Demas, 1993).
Historically, substrates in shallow water, estuarine environments that were supporting or capable of supporting submerged aquatic vegetation (SAV) were considered sediments rather than soils. The work of Dr. George P. Demas in Chincoteague and Sinepuxent Bays, Maryland, resulted in a re-assessment of the definition of soils and ongoing discussions on soil-landscape models, soil classification, and pedogenesis in a subaqueous environment (Demas and Rabenhorst, 2001; Demas and Rabenhorst, 1999; Demas, 1998; Demas et al, 1998; Demas and Brown, 1997; Demas et al, 1996). Additional studies of subaqueous soils, particularly related to soil characterization and soil-landscape units, have expanded to Rhode Island estuarine environments (Bradley and Stolt, 2003; Bradley and Stolt, 2002; Bradley, 2001).
Based on Dr. Demas’ research, the definition of soil in Keys to Soil Taxonomy has evolved and expanded to include permanently submerged substrates. In Keys to Soil Taxonomy, Seventh Edition, 1996, soil was defined as: “… the collective term used in this text for the natural bodies, made up of mineral and organic materials, that cover much of the earth’s surface, contain living matter and can support vegetation out of doors, and have in places been changed by human activity. The upper limit of soil is air or shallow water. Its horizontal boundaries are where it grades to deep water or to barren areas of rock or ice. …”
In early 1998, a proposal by Dr. Demas and Dr. Martin Rabenhorst, University of Maryland, to modify the definition of soil in Soil Taxonomy was reviewed and adopted by the USDA-NRCS National Soil Taxonomy Committee. As such, the definition of soil in Keys to Soil Taxonomy, Eighth Edition, 1998 changed to the following: “Soil in this text is a natural body comprised of solids (minerals and organic matter), liquid, and gases that occurs on the land surface, occupies space, and is characterized by one or both of the following: horizons, or layers, that are distinguishable from the initial material as a result of additions, losses, transfers, and transformations of energy and matter or the ability to support rooted plants in a natural environment. … The upper limit of soil is the boundary between soil and air, shallow water, live plants, or plant materials that have not begun to decompose. Areas are not considered to have soil if the surface is permanently covered by water too deep (typically more than 2.5 meters) for the growth of rooted plants. The horizontal boundaries of soil are areas where the soil grades to deep water, barren areas, rock, or ice. …”
The basic premise of Dr. Demas’ research is that pedogenic processes are actively functioning in a permanently submerged environment and produce soil horizon differentiation. Dr. Demas investigated the four components of the generalized theory of soil genesis (Simonson, 1959)—additions, removals, transfers, and transformations—and developed predictive soil-landscape models to describe soil distribution across the subaqueous landscape.
Additions to sediments in Sinepuxent Bay, Maryland are from both mineral and biogenic sources (Demas and Rabenhorst, 1999). The accumulation of organic debris, primarily from decaying seagrasses, and accompanying formation of an A horizon constitute significant evidence of pedogenic additions. Increased organic carbon content associated with buried surface horizons indicates additions of overlying mineral sediments and development of discontinuities similar to terrestrial soils, e.g., floodplains. The resultant erratic distribution of organic carbon with depth and additions of mineral sediments affect soil classification and genesis, and may be considered processes leading to horizon differentiation. Additions of biogenic origin, including shell fragments from in situ benthic fauna, are additional evidence of soil genesis in this environment.
20 Soil Survey of
One important consideration is the relationship between SAV, sediment substrate, and water quality. In Demas et al (1996), the authors comment that the original belief that SAV receive a majority of necessary nutrients from the water column and only use the sediment substrate for support has been challenged in recent decades. They discuss recent studies that indicate a high correlation between sediment characteristics and SAV species, and evidence of seagrass uptake of nutrients from the sediment rather than the water column.
Losses commonly cited in terrestrial soils include leaching, seepage, erosion, and organic matter decomposition (Simonson, 1959). While removals due to leaching and seepage would not be expected in permanently submerged environments, erosion does occur in shallow water systems due to storm events and wind and tidal agitation. Any decline in SAV productivity could expose the bay or lagoon bottom surface to these erosive forces. Decomposition of organic matter is the more significant loss and evidence of pedogenesis, with microbial activity often degrading seagrass detritus at rates comparable to terrestrial environments (Demas and Rabenhorst, 1999). The continual pedogenic additions and losses of organic matter in the subaqueous environment are (at least in part) responsible for formation of surface horizons with stable, but relatively low, levels of organic carbon.
Pedogenic transfers include eluviation, diffusion, and bioturbation (Simonson, 1959) although (as previously discussed) eluviation (or leaching) is not associated with subaqueous environments. Oxygen diffusion across the sediment-water interface results in a light brown color associated with sediment surfaces. This light brown oxidized layer would generally range to several millimeters in thickness, depending on surface texture. However, the burrowing activity of benthic organisms can result in development of an oxidized surface layer up to 10 to 20 centimeters in thickness (Demas and Rabenhorst, 1999). While bioturbation in terrestrial environments tends to destroy soil horizonation, burrowing activity in permanently submerged environments appears to complement diffusion processes to actually support horizon differentiation.
Pedogenic transformations in terrestrial and subaqueous and terrestrial environments occur in both organic and mineral fractions (Demas and Rabenhorst, 1999). Microbial decomposition in both environments results in lowering of the C:N ratio of organic matter residues. The reduction in C:N ratios of fresh SAV residue and transformation to other humic substances documents this organic transformation in permanently submerged settings. The mineral transformation most unique to lagoonal and estuarine systems, evident in tidal marsh soils and shallow water sediments, is formation of solid phase sulfides. Fundamental elements in the sulfidization process include sulfate reducing bacteria, a source of sulfate, presence of a reactive ion, and organic matter functioning as a microbial substrate. The primary end product of this process is pyrite (FeS2). In the sediment substrate, sulfidization primarily occurs below the contact between the aerobic surface layer and the anaerobic subsurface layer. Evidence of increased pyrite levels coincident with buried A horizons suggests that this transformative process occurred in the past with development of stable surfaces in the subaqueous environment (Demas and Rabenhorst, 1999).
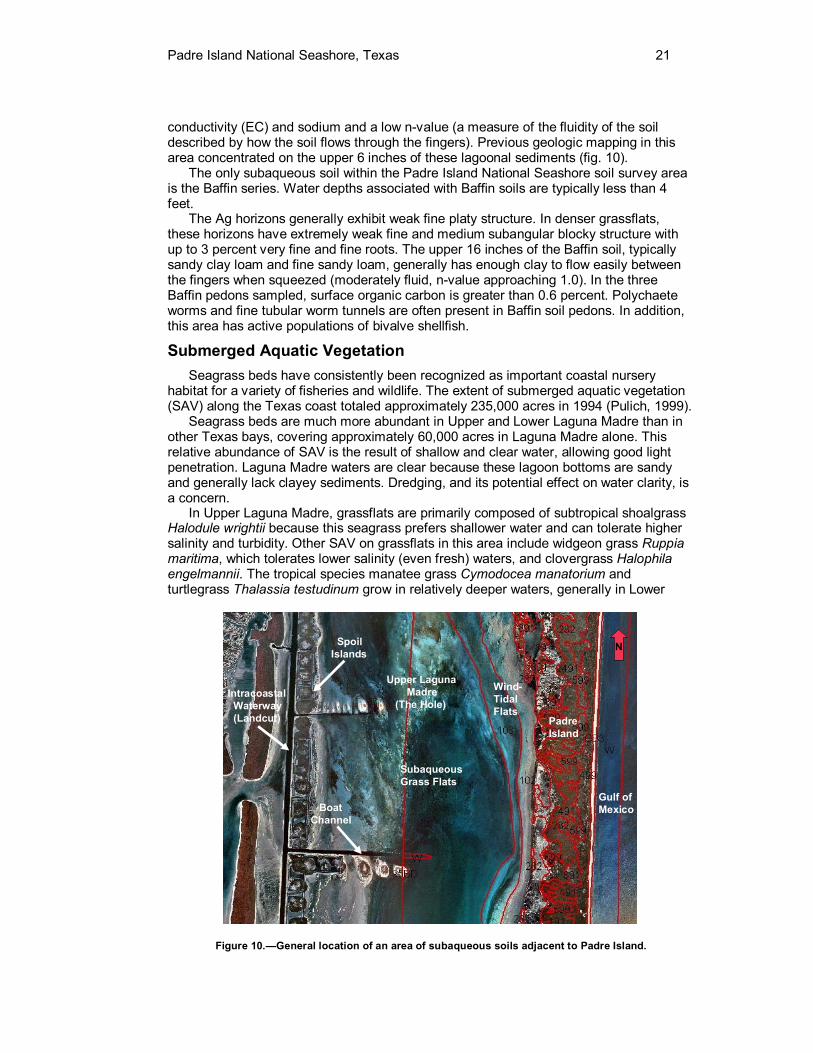
In conjunction with preparation of the soil survey for Padre Island National Seashore, special attention was paid to mapping the soils in subaqueous areas of the Laguna Madre adjacent to Padre Island. The Laguna Madre is divided into two parts (Upper and Lower) by an extensive area of wind-tidal flats on the lagoon side (leeward) of Padre Island. The absence of an open path to the Gulf of Mexico has created a hypersaline environment in the Lower Laguna Madre. This restriction also causes the Laguna Madre and Baffin Bay systems to be relatively unaffected by daily tides, which on the gulf side of the island are generally about 1.5 feet (0.5 meters).
The Upper Laguna Madre was the primary area of interest for mapping subaqueous soils in the Padre Island National Seashore soil survey area. These soils are permanently submersed and in a subtidal (rather than intertidal) range. They have high electrical
Padre Island National Seashore, Texas 21
conductivity (EC) and sodium and a low n-value (a measure of the fluidity of the soil described by how the soil flows through the fingers). Previous geologic mapping in this area concentrated on the upper 6 inches of these lagoonal sediments (fig. 10).
The only subaqueous soil within the Padre Island National Seashore soil survey area is the Baffin series. Water depths associated with Baffin soils are typically less than 4 feet.
The Ag horizons generally exhibit weak fine platy structure. In denser grassflats, these horizons have extremely weak fine and medium subangular blocky structure with up to 3 percent very fine and fine roots. The upper 16 inches of the Baffin soil, typically sandy clay loam and fine sandy loam, generally has enough clay to flow easily between the fingers when squeezed (moderately fluid, n-value approaching 1.0). In the three Baffin pedons sampled, surface organic carbon is greater than 0.6 percent. Polychaete worms and fine tubular worm tunnels are often present in Baffin soil pedons. In addition, this area has active populations of bivalve shellfish.
Submerged Aquatic Vegetation Seagrass beds have consistently been recognized as important coastal nursery
habitat for a variety of fisheries and wildlife. The extent of submerged aquatic vegetation (SAV) along the Texas coast totaled approximately 235,000 acres in 1994 (Pulich, 1999).
Seagrass beds are much more abundant in Upper and Lower Laguna Madre than in other Texas bays, covering approximately 60,000 acres in Laguna Madre alone. This relative abundance of SAV is the result of shallow and clear water, allowing good light penetration. Laguna Madre waters are clear because these lagoon bottoms are sandy and generally lack clayey sediments. Dredging, and its potential effect on water clarity, is a concern.
In Upper Laguna Madre, grassflats are primarily composed of subtropical shoalgrass Halodule wrightii because this seagrass prefers shallower water and can tolerate higher salinity and turbidity. Other SAV on grassflats in this area include widgeon grass Ruppia maritima, which tolerates lower salinity (even fresh) waters, and clovergrass Halophila engelmannii. The tropical species manatee grass Cymodocea manatorium and turtlegrass Thalassia testudinum grow in relatively deeper waters, generally in Lower
SubaqueousGrass Flats
Upper LagunaMadre
(The Hole)Padre Island
Gulf ofMexico
Wind-Tidal Flats
IntracoastalWaterway(Landcut)
N
Boat Channel
Spoil Islands
Figure 10.—General location of an area of subaqueous soils adjacent to Padre Island.
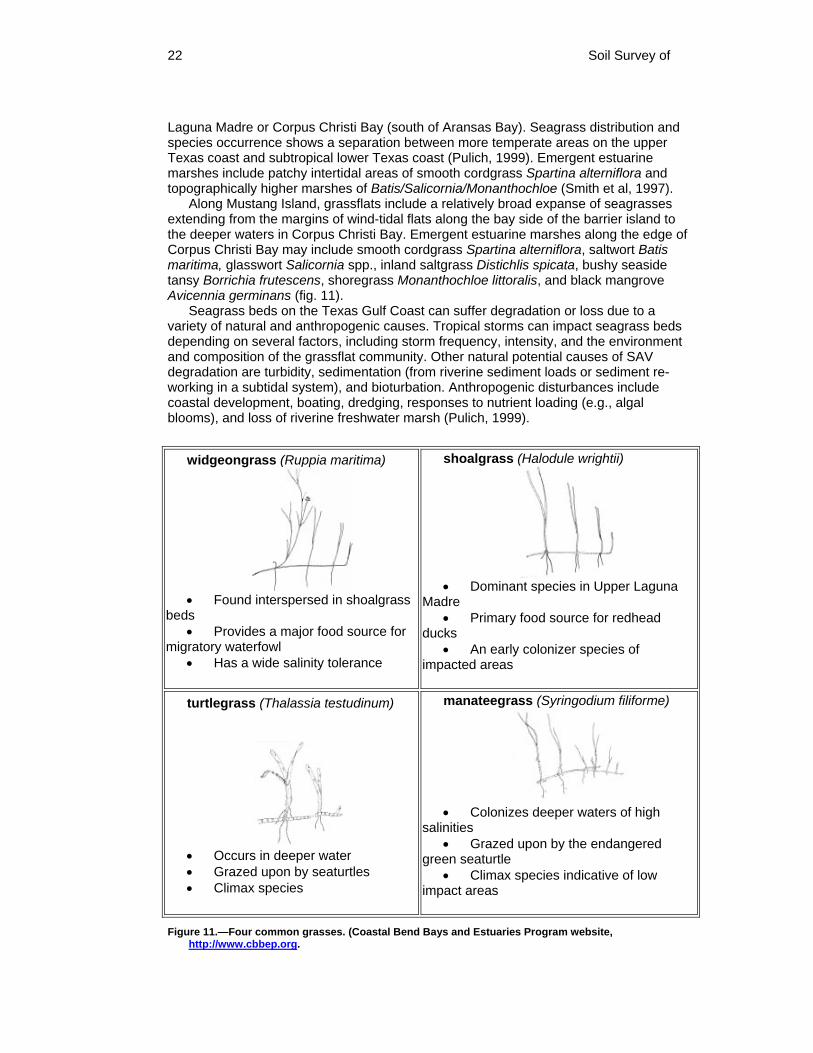
22 Soil Survey of
Laguna Madre or Corpus Christi Bay (south of Aransas Bay). Seagrass distribution and species occurrence shows a separation between more temperate areas on the upper Texas coast and subtropical lower Texas coast (Pulich, 1999). Emergent estuarine marshes include patchy intertidal areas of smooth cordgrass Spartina alterniflora and topographically higher marshes of Batis/Salicornia/Monanthochloe (Smith et al, 1997).
Along Mustang Island, grassflats include a relatively broad expanse of seagrasses extending from the margins of wind-tidal flats along the bay side of the barrier island to the deeper waters in Corpus Christi Bay. Emergent estuarine marshes along the edge of Corpus Christi Bay may include smooth cordgrass Spartina alterniflora, saltwort Batis maritima, glasswort Salicornia spp., inland saltgrass Distichlis spicata, bushy seaside tansy Borrichia frutescens, shoregrass Monanthochloe littoralis, and black mangrove Avicennia germinans (fig. 11).
Seagrass beds on the Texas Gulf Coast can suffer degradation or loss due to a variety of natural and anthropogenic causes. Tropical storms can impact seagrass beds depending on several factors, including storm frequency, intensity, and the environment and composition of the grassflat community. Other natural potential causes of SAV degradation are turbidity, sedimentation (from riverine sediment loads or sediment re-working in a subtidal system), and bioturbation. Anthropogenic disturbances include coastal development, boating, dredging, responses to nutrient loading (e.g., algal blooms), and loss of riverine freshwater marsh (Pulich, 1999).
Figure 11.—Four common grasses. (Coastal Bend Bays and Estuaries Program website, http://www.cbbep.org.
widgeongrass (Ruppia maritima)
• Found interspersed in shoalgrass
beds • Provides a major food source for
migratory waterfowl • Has a wide salinity tolerance
shoalgrass (Halodule wrightii)
• Dominant species in Upper Laguna
Madre • Primary food source for redhead
ducks • An early colonizer species of
impacted areas
turtlegrass (Thalassia testudinum)
• Occurs in deeper water • Grazed upon by seaturtles • Climax species
manateegrass (Syringodium filiforme)
• Colonizes deeper waters of high
salinities • Grazed upon by the endangered
green seaturtle • Climax species indicative of low
impact areas
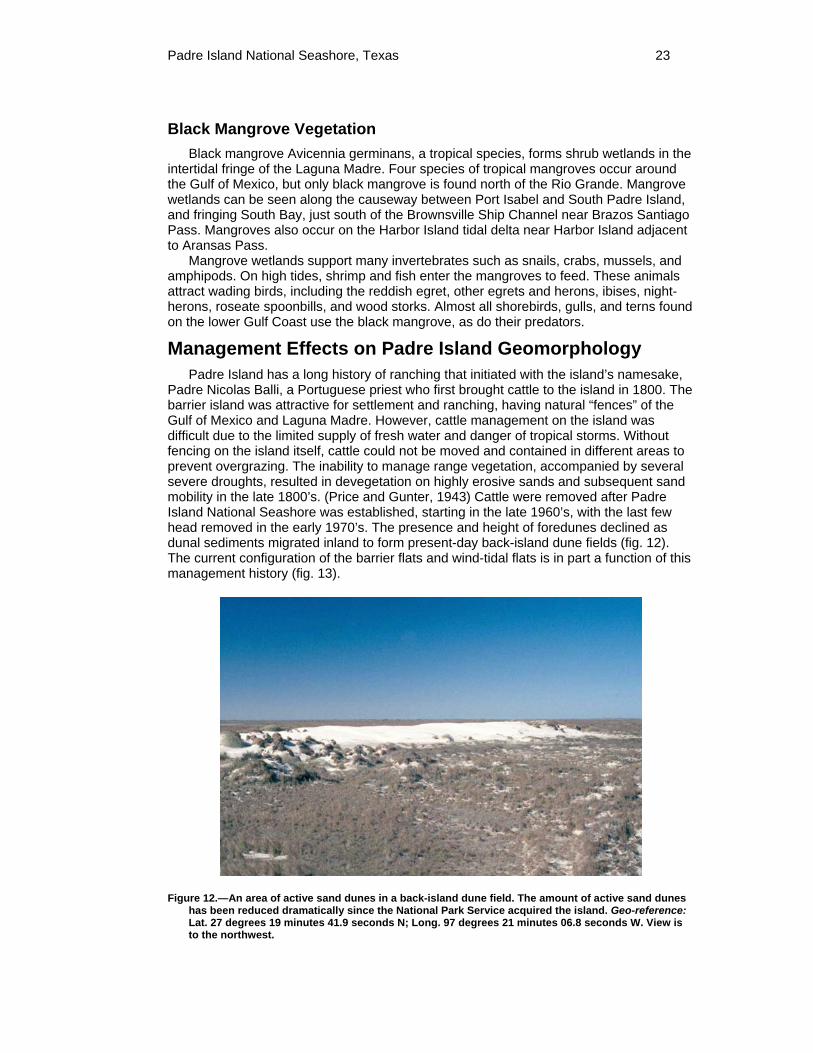
Padre Island National Seashore, Texas 23
Black Mangrove Vegetation Black mangrove Avicennia germinans, a tropical species, forms shrub wetlands in the
intertidal fringe of the Laguna Madre. Four species of tropical mangroves occur around the Gulf of Mexico, but only black mangrove is found north of the Rio Grande. Mangrove wetlands can be seen along the causeway between Port Isabel and South Padre Island, and fringing South Bay, just south of the Brownsville Ship Channel near Brazos Santiago Pass. Mangroves also occur on the Harbor Island tidal delta near Harbor Island adjacent to Aransas Pass.
Mangrove wetlands support many invertebrates such as snails, crabs, mussels, and amphipods. On high tides, shrimp and fish enter the mangroves to feed. These animals attract wading birds, including the reddish egret, other egrets and herons, ibises, night-herons, roseate spoonbills, and wood storks. Almost all shorebirds, gulls, and terns found on the lower Gulf Coast use the black mangrove, as do their predators.
Management Effects on Padre Island Geomorphology Padre Island has a long history of ranching that initiated with the island’s namesake,
Padre Nicolas Balli, a Portuguese priest who first brought cattle to the island in 1800. The barrier island was attractive for settlement and ranching, having natural “fences” of the Gulf of Mexico and Laguna Madre. However, cattle management on the island was difficult due to the limited supply of fresh water and danger of tropical storms. Without fencing on the island itself, cattle could not be moved and contained in different areas to prevent overgrazing. The inability to manage range vegetation, accompanied by several severe droughts, resulted in devegetation on highly erosive sands and subsequent sand mobility in the late 1800’s. (Price and Gunter, 1943) Cattle were removed after Padre Island National Seashore was established, starting in the late 1960’s, with the last few head removed in the early 1970’s. The presence and height of foredunes declined as dunal sediments migrated inland to form present-day back-island dune fields (fig. 12). The current configuration of the barrier flats and wind-tidal flats is in part a function of this management history (fig. 13).
Figure 12.—An area of active sand dunes in a back-island dune field. The amount of active sand dunes has been reduced dramatically since the National Park Service acquired the island. Geo-reference: Lat. 27 degrees 19 minutes 41.9 seconds N; Long. 97 degrees 21 minutes 06.8 seconds W. View is to the northwest.
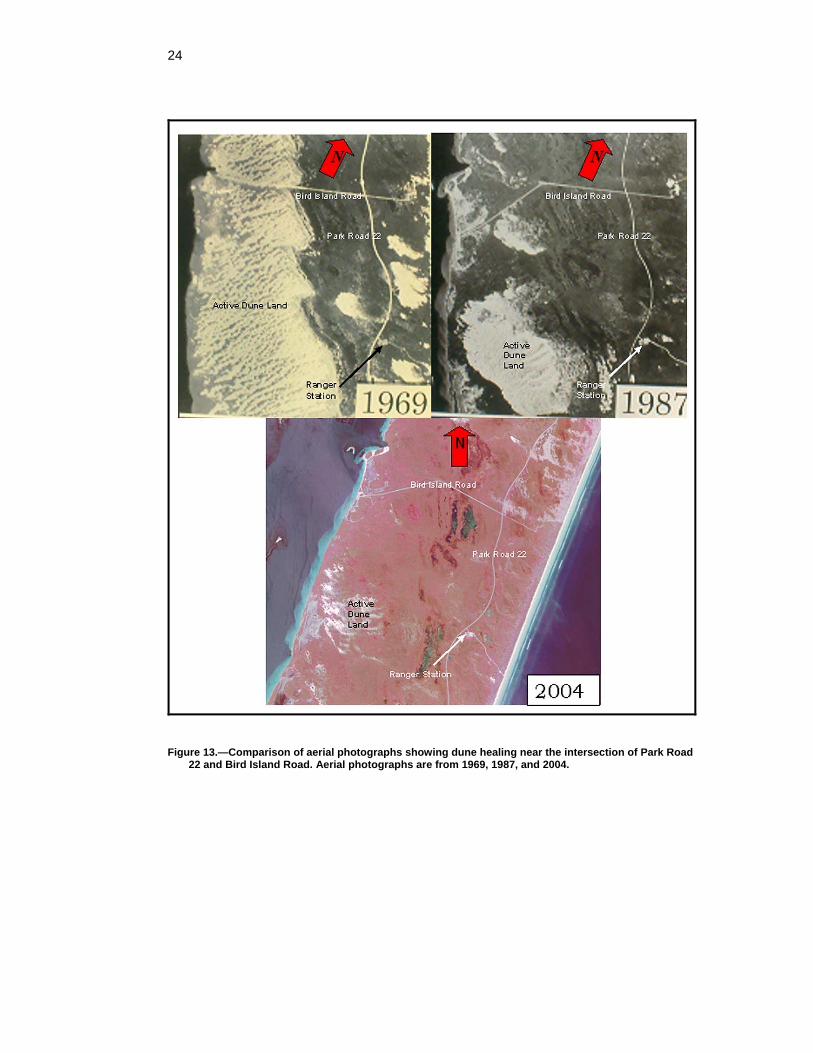
24
Figure 13.—Comparison of aerial photographs showing dune healing near the intersection of Park Road 22 and Bird Island Road. Aerial photographs are from 1969, 1987, and 2004.
25
General Soil Map Units
The general soil map in this publication shows broad areas that have a distinctive pattern of soils, relief, and drainage. Each map unit on the general soil map defines a specific group of natural landscapes. Typically, it consists of one or more major soils or miscellaneous areas and some minor soils or miscellaneous areas. It is named for the major soils or miscellaneous areas. The soils of one map unit can occur in another but are on a different landform.
The general soil map can be used to compare the suitability of large areas for general land uses. Areas of suitable soils can be identified on the map. Likewise, areas where the soils are not suitable can be identified.
Because of its small scale, the map is not suitable for planning the management of a specific area or for selecting a site for a road, building, or other structure. The soils in any one map unit differ from place to place in slope, depth, drainage, and other characteristics that affect management.
A few areas of these map units have been developed for building sites. The soils on Padre Island National Seashore are poorly suited to most urban uses. Flooding is the main limitation. Wetness in the majority of the soils is also a management concern.
The soils are suitable for limited recreational uses and for wildlife habitat. They provide habitat for birds, waterfowl, deer, small mammals, and marine animals. Almost the entire acreage has been left in a natural state and is used for wildlife habitat and recreation. The dunes serve to protect the mainland from storm surge during tropical storms and hurricanes.
The soils on Padre Island National Seashore are not suited to cultivated crops, pasture, hay, or woodland. Salt spray from the Gulf of Mexico is a severe limitation affecting the growth of most trees, improved varieties of grasses, and cultivated crops.
Soils on the Wind-Tidal Flats Nearly level, poorly drained and very poorly drained, saline soils that are sandy
throughout; on wind-tidal flats or deflation flats associated with the barrier islands
1. Satatton-Tatton This map unit consists of soils on wind-tidal flats and in deflation flats between dunes.
The landscape is nearly level. Slope ranges from 0 to 1 percent. This map unit makes up about 35,500 acres, or about 38 percent of the land area of
the National Seashore. It is about 68 percent Satatton soils, 20 percent Tatton soils, and 12 percent soils or miscellaneous areas of minor extent.
The poorly drained, saline Satatton soils are mainly on wind-tidal flats but also may occur in deflation flats when closely associated with washover channels and fans. Typically the surface layer is grayish brown fine sand about 17 inches thick. The subsoil is gray fine sand.
The very poorly drained, saline Tatton soils are mainly on wind-tidal flats but also may occur in deflation flats when closely associated with washover channels and fans. Typically the surface layer is light brownish gray fine sand about 12 inches thick. The subsoil is gray fine sand.
Both of these soils are essentially barren of vegetation, but have a thin blue-green algal mat and scattered glassworts.
26 Soil Survey of
Of minor extent in this map unit are areas of washover fans, dune land, the poorly drained Malaquite soils in salt marshes, the poorly drained Madre soils on barrier flats, the somewhat poorly drained Padre and Panam soils on low stabilized dunes, and the excessively drained Daggerhill and Greenhill soils on high back-island dune fields.
Soils on the Barrier Flat Nearly level, somewhat poorly drained and poorly drained soils that are sandy
throughout; on barrier islands
2. Mustang-Panam-Padre This map unit consists of soils on low, stabilized dunes; and soils on flats and in
depressions and swales between dunes. The landscape is nearly level and very gently sloping. Slope ranges from 0 to 2 percent.
This map unit makes up about 21,900 acres, or about 23 percent of the land area of the National Seashore. It is about 49 percent Mustang soils, 27 percent Panam soils, 15 percent Padre soils, and 9 percent soils of minor extent.
The poorly drained Mustang soils are on barrier flats and in shallow swales and other depressions between dunes. These soils are rapidly permeable over very slowly permeable, and are nonsaline. Characteristic vegetation consists of sedges and gulfdune paspalum. Typically, the surface layer is brown fine sand about 15 inches thick. The subsoil is gray fine sand.
The somewhat poorly drained Panam and Padre soils are on the low dunes of the barrier flat. These soils are rapidly permeable over very slowly permeable and are nonsaline. Characteristic vegetation consists of seacoast bluestem and false indigo. Typically, the surface layer is brown fine sand about 17 inches thick. The subsoil is very pale brown fine sand over light gray fine sand.
Of minor extent in this map unit are areas of the very poorly drained Novillo soils in freshwater marsh swales, the poorly drained Malaquite soils in salt marshes, the excessively drained Daggerhill and Greenhill soils on foredunes and high back-island dune fields, and the poorly drained Satatton soils on wind-tidal flats and deflation flats.
3. Madre-Malaquite-Mustang This map unit consists of poorly drained soils on flats, and in depressions and swales
between dunes. The landscape is nearly level. Slope ranges from 0 to 1 percent. This map unit makes up about 13,600 acres, or about 14 percent of the land area of
the National Seashore. It is about 34 percent Madre soils, 29 percent Malaquite soils, 28 percent Mustang soils and 9 percent soils or miscellaneous areas of minor extent.
The poorly drained Madre soils are on barrier flats and in shallow swales and other depressions between dunes. These soils are rapidly permeable over very slowly permeable, and are nonsaline; however they have high amounts of sodium. Characteristic vegetation consists almost exclusively of marshhay cordgrass. Typically, the surface layer is grayish brown fine sand about 11 inches thick. The subsoil is gray fine sand.
The poorly drained, saline Malaquite soils are on flats and in shallow swales and other depressions between dunes. These soils are rapidly permeable over very slowly permeable, and are saline. Characteristic vegetation consists of shoregrass and bushy sea-oxeye daisy. Typically, the surface layer is grayish brown fine sand about 5 inches thick. The subsoil is gray fine sand.
The poorly drained Mustang soils are on barrier flats and in shallow swales and other depressions between dunes. These soils are rapidly permeable over very slowly permeable, and are nonsaline. Characteristic vegetation consists of sedges and gulfdune paspalum. Typically, the surface layer is brown fine sand about 15 inches thick. The subsoil is gray fine sand.
Padre Island National Seashore, Texas 27
Of minor extent in this map unit are areas of the somewhat poorly drained Padre and Panam soils on low stabilized dunes, and the excessively drained Daggerhill and Greenhill soils on foredunes and high back-island dune fields.
Soils on the Foredunes or High Back-Island Dune Fields Undulating, excessively drained and poorly drained soils that are sandy throughout;
on barrier islands
4. Daggerhill-Greenhill-Mustang This map unit consists of soils on dunes and soils in depressions and swales between
dunes. The landscape is undulating. Slope is dominantly less than 8 percent, but it ranges up to 12 percent on the higher dunes.
This map unit makes up about 12,700 acres, or about 13 percent of the land area of the National Seashore. It is about 52 percent Daggerhill soils, 18 percent Greenhill soils, 16 percent Mustang soils, and 14 percent soils or miscellaneous areas of minor extent.
The excessively drained Daggerhill and Greenhill soils are on foredunes and high back-island dune fields. These soils are rapidly permeable, and nonsaline. Characteristic vegetation consists of seaoats and camphorweed. Typically, the surface layer is pale brown fine sand about 21 inches thick. The subsoil is very pale brown fine sand.
The poorly drained Mustang soils are in shallow swales and other depressions between dunes. These soils are rapidly permeable over very slowly permeable, and are nonsaline. Characteristic vegetation consists of sedges and gulfdune paspalum. Typically, the surface layer is brown fine sand about 15 inches thick. The subsoil is gray fine sand.
Of minor extent in this map unit are areas of Dune land, the poorly drained Malaquite soils in salt marshes, the somewhat poorly drained Padre and Panam soils on low stabilized dunes, and the poorly drained Satatton soils on deflation flats.
Dune Land Nearly level to undulating dune land; on the barrier islands
5. Dune Land-Satatton This map unit consists of miscellaneous land types Dune land and Dune land-
Satatton complex. The landscape is nearly level to undulating. Slope is dominantly less than 8 percent, but it ranges up to 12 percent on the higher dunes.
This map unit makes up about 7,300 acres, or about 8 percent of the land area of the National Seashore. It is about 62 percent Dune land, 35 percent Satatton soils, and 3 percent soils or miscellaneous areas of minor extent.
The excessively drained Dune land miscellaneous areas are on active back-island dune fields. These land types are rapidly permeable, and generally nonsaline. The areas are essentially barren of vegetation other than scattered rhizomatous species such as sedge and gulfdune paspalum. Typically, the dunes are sandy throughout.
The poorly drained, saline Satatton soils are mainly on wind-tidal flats but also may occur in deflation flats when closely associated with washover channels and fans. These soils are essentially barren of vegetation, but have a thin blue-green algal mat and scattered glassworts. Typically the surface layer is grayish brown fine sand about 17 inches thick. The subsoil is gray fine sand.
Of minor extent in this map unit are areas of the poorly drained Malaquite soils in salt marshes, and the somewhat poorly drained Panam soils on low stabilized dunes.
28
Soils on the Spoil Islands Nearly level, somewhat poorly drained and poorly drained, saline and nonsaline soils
that are sandy and loamy throughout; on spoil islands
6. Yarborough-Twinpalms This map unit consists of soils on mounds and soils on flats and in depressions
between mounds. The landscape is nearly level. Slope ranges from 0 to 3 percent. This map unit makes up about 1,400 acres, or about 2 percent of the land area of the
National Seashore. It is about 64 percent Yarborough soils and 36 percent Twinpalms soils. Because of the location of the spoil islands, there are no soils or miscellaneous areas of minor extent.
The poorly drained, saline Yarborough soils are on low flats and concave areas mainly along the margins of spoil islands associated with dredging of the Intracoastal Waterway. These soils are very slowly permeable and saline. Characteristic vegetation consists of shoregrass and bushy sea-oxeye daisy. Typically, the surface layer is dark grayish brown fine sandy loam about 7 inches (18 centimeters) thick. The subsoil is gray fine sandy loam over gray loamy fine sand.
The somewhat poorly drained Twinpalms soils are on low mounds on spoil islands associated with dredging of the Intracoastal Waterway. These soils are moderately permeable, and nonsaline. Characteristic vegetation consists of seacoast bluestem and prickly pear. Typically, the surface layer is light olive brown fine sand about 18 inches (46 centimeters) thick. The subsoil is olive fine sandy loam over gray loamy fine sand.
Beaches Nearly level beaches; on the barrier islands
7. Beaches This map unit consists of miscellaneous areas along the margin of the island between
the Gulf of Mexico and the foredune ridge. The landscape is nearly level and very gently sloping. Slope is dominantly less than 2 percent, but it can range up to 3 percent on the steeper shell beaches.
This map unit makes up about 1,900 acres, or about 2 percent of the land area of the National Seashore. It is made up exclusively of beaches. Because of the location of the beaches, there are no soils or miscellaneous areas of minor extent.
29
Detailed Soil Map Units
The map units delineated on the detailed soil maps in this survey represent the soils or miscellaneous areas in the survey area. The map unit descriptions in this section, along with the maps, can be used to determine the suitability and potential of a unit for specific uses. They also can be used to plan the management needed for those uses.
A map unit delineation on a soil map represents an area dominated by one or more major kinds of soil or miscellaneous areas. A map unit is identified and named according to the taxonomic classification of the dominant soils. Within a taxonomic class there are precisely defined limits for the properties of the soils. On the landscape, however, the soils are natural phenomena, and they have the characteristic variability of all natural phenomena. Thus, the range of some observed properties may extend beyond the limits defined for a taxonomic class. Areas of soils of a single taxonomic class rarely, if ever, can be mapped without including areas of other taxonomic classes. Consequently, every map unit is made up of the soils or miscellaneous areas for which it is named and some minor components that belong to taxonomic classes other than those of the major soils.
Most minor soils have properties similar to those of the dominant soil or soils in the map unit, and thus they do not affect use and management. These are called noncontrasting, or similar, components. They may or may not be mentioned in a particular map unit description. Other minor components, however, have properties and behavioral characteristics divergent enough to affect use or to require different management. These are called contrasting, or dissimilar, components. They generally are in small areas and could not be mapped separately because of the scale used. Some small areas of strongly contrasting soils or miscellaneous areas are identified by a special symbol on the maps. The contrasting components are mentioned in the map unit descriptions. A few areas of minor components may not have been observed, and consequently they are not mentioned in the descriptions, especially where the pattern was so complex that it was impractical to make enough observations to identify all the soils and miscellaneous areas on the landscape.
The presence of minor components in a map unit in no way diminishes the usefulness or accuracy of the data. The objective of mapping is not to delineate pure taxonomic classes but rather to separate the landscape into landforms or landform segments that have similar use and management requirements. The delineation of such segments on the map provides sufficient information for the development of resource plans. If intensive use of small areas is planned, however, onsite investigation is needed to define and locate the soils and miscellaneous areas.
An identifying symbol precedes the map unit name in the map unit descriptions. Each description includes general facts about the unit and gives the principal hazards and limitations to be considered in planning for specific uses.
Soils that have profiles that are almost alike make up a soil series. Except for differences in texture of the surface layer, all the soils of a series have major horizons that are similar in composition, thickness, and arrangement.
Soils of one series can differ in texture of the surface layer, slope, stoniness, salinity, degree of erosion, and other characteristics that affect their use. On the basis of such differences, a soil series is divided into soil phases. Most of the areas shown on the detailed soil maps are phases of soil series. The name of a soil phase commonly indicates a feature that affects use or management. For example, Daggerhill fine sand, 2 to 12 percent slopes, rarely flooded, is a phase of the Daggerhill series.
Some map units are made up of two or more major soils or miscellaneous areas. These map units are complexes, associations, or undifferentiated groups.
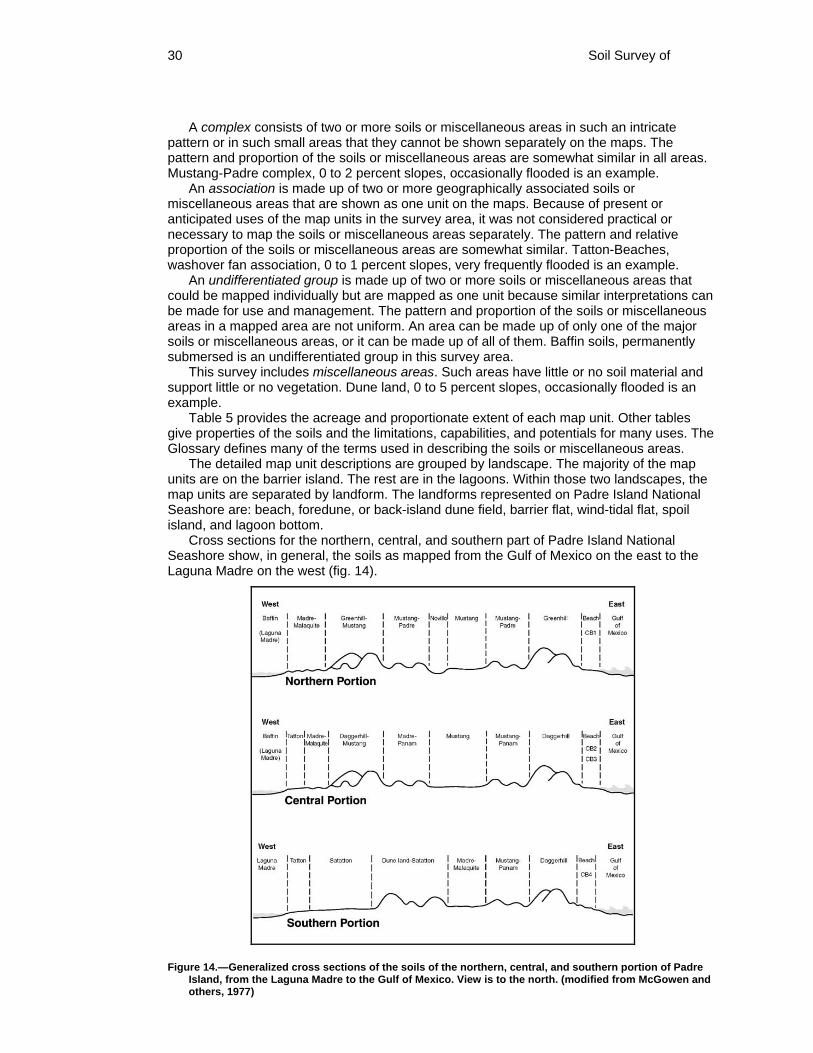
30 Soil Survey of
A complex consists of two or more soils or miscellaneous areas in such an intricate pattern or in such small areas that they cannot be shown separately on the maps. The pattern and proportion of the soils or miscellaneous areas are somewhat similar in all areas. Mustang-Padre complex, 0 to 2 percent slopes, occasionally flooded is an example.
An association is made up of two or more geographically associated soils or miscellaneous areas that are shown as one unit on the maps. Because of present or anticipated uses of the map units in the survey area, it was not considered practical or necessary to map the soils or miscellaneous areas separately. The pattern and relative proportion of the soils or miscellaneous areas are somewhat similar. Tatton-Beaches, washover fan association, 0 to 1 percent slopes, very frequently flooded is an example.
An undifferentiated group is made up of two or more soils or miscellaneous areas that could be mapped individually but are mapped as one unit because similar interpretations can be made for use and management. The pattern and proportion of the soils or miscellaneous areas in a mapped area are not uniform. An area can be made up of only one of the major soils or miscellaneous areas, or it can be made up of all of them. Baffin soils, permanently submersed is an undifferentiated group in this survey area.
This survey includes miscellaneous areas. Such areas have little or no soil material and support little or no vegetation. Dune land, 0 to 5 percent slopes, occasionally flooded is an example.
Table 5 provides the acreage and proportionate extent of each map unit. Other tables give properties of the soils and the limitations, capabilities, and potentials for many uses. The Glossary defines many of the terms used in describing the soils or miscellaneous areas.
The detailed map unit descriptions are grouped by landscape. The majority of the map units are on the barrier island. The rest are in the lagoons. Within those two landscapes, the map units are separated by landform. The landforms represented on Padre Island National Seashore are: beach, foredune, or back-island dune field, barrier flat, wind-tidal flat, spoil island, and lagoon bottom.
Cross sections for the northern, central, and southern part of Padre Island National Seashore show, in general, the soils as mapped from the Gulf of Mexico on the east to the Laguna Madre on the west (fig. 14).
Figure 14.—Generalized cross sections of the soils of the northern, central, and southern portion of Padre Island, from the Laguna Madre to the Gulf of Mexico. View is to the north. (modified from McGowen and others, 1977)
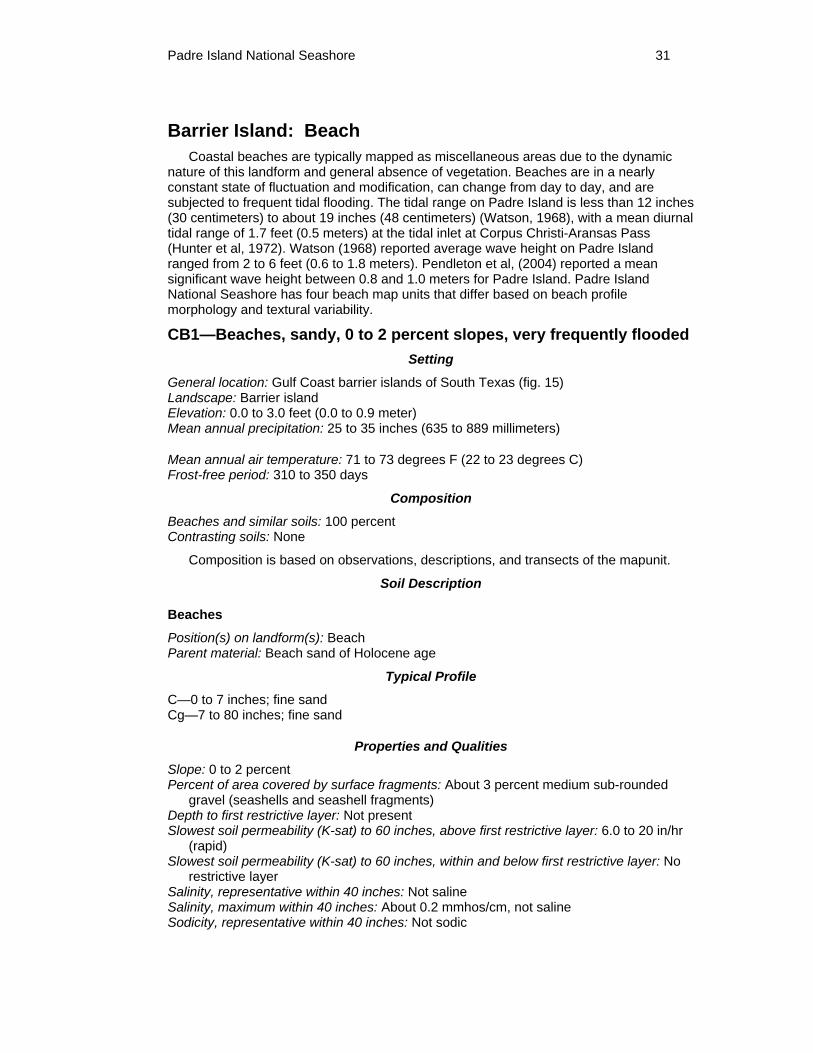
Padre Island National Seashore 31
Barrier Island: Beach Coastal beaches are typically mapped as miscellaneous areas due to the dynamic
nature of this landform and general absence of vegetation. Beaches are in a nearly constant state of fluctuation and modification, can change from day to day, and are subjected to frequent tidal flooding. The tidal range on Padre Island is less than 12 inches (30 centimeters) to about 19 inches (48 centimeters) (Watson, 1968), with a mean diurnal tidal range of 1.7 feet (0.5 meters) at the tidal inlet at Corpus Christi-Aransas Pass (Hunter et al, 1972). Watson (1968) reported average wave height on Padre Island ranged from 2 to 6 feet (0.6 to 1.8 meters). Pendleton et al, (2004) reported a mean significant wave height between 0.8 and 1.0 meters for Padre Island. Padre Island National Seashore has four beach map units that differ based on beach profile morphology and textural variability.
CB1—Beaches, sandy, 0 to 2 percent slopes, very frequently flooded Setting
General location: Gulf Coast barrier islands of South Texas (fig. 15) Landscape: Barrier island Elevation: 0.0 to 3.0 feet (0.0 to 0.9 meter) Mean annual precipitation: 25 to 35 inches (635 to 889 millimeters)
Mean annual air temperature: 71 to 73 degrees F (22 to 23 degrees C) Frost-free period: 310 to 350 days
Composition
Beaches and similar soils: 100 percent Contrasting soils: None
Composition is based on observations, descriptions, and transects of the mapunit.
Soil Description
Beaches
Position(s) on landform(s): Beach Parent material: Beach sand of Holocene age
Typical Profile
C—0 to 7 inches; fine sand Cg—7 to 80 inches; fine sand
Properties and Qualities
Slope: 0 to 2 percent Percent of area covered by surface fragments: About 3 percent medium sub-rounded
gravel (seashells and seashell fragments) Depth to first restrictive layer: Not present Slowest soil permeability (K-sat) to 60 inches, above first restrictive layer: 6.0 to 20 in/hr
(rapid) Slowest soil permeability (K-sat) to 60 inches, within and below first restrictive layer: No
restrictive layer Salinity, representative within 40 inches: Not saline Salinity, maximum within 40 inches: About 0.2 mmhos/cm, not saline Sodicity, representative within 40 inches: Not sodic
32 Soil Survey of
Figure 15.—An area of Beaches, sandy, 0 to 2 percent, very frequently flooded. This photograph shows the relatively flat, sandy beaches in the northern part of the island. Geo-reference: Lat. 27 degrees 23 minutes 23.0 seconds N; Long. 97 degrees 18 minutes 42.1 seconds W. View is to the northeast.
Sodicity, maximum within 40 inches: Sodium Adsorption Ratio (SAR) is about 2.2, not sodic
Representative total available water capacity to 60 inches: About 4.8 inches (low) Natural drainage class: Poorly drained Runoff: Negligible Flooding frequency: Very frequent Ponding frequency: None Seasonal high water table minimum depth: About 0 to 6 inches
Interpretive Groups
Ecological site name: Not assigned to an ecological site Ecological site number: Not assigned to an ecological site Typical vegetation: Essentially barren, except for a few annual grasses or forbs
Note: Additional information specific to the components of this map unit is available in the “Tables” section.
Use and Management
Major land uses: Wildlife habitat and recreation
This map unit consists of the land area adjacent to the Gulf of Mexico, between the low tide mark and the front of the foredune ridges, and is mapped from the northern extent of Padre Island National Seashore southward to approximately the 4-mile marker. The beach in this area ranges from 100 to 600 feet (30 to 180 meters) in width and has a wide foreshore and narrow, flat backshore. Longshore drift in this mapped area is to the south. The overall finer grain size mode and heavy mineral composition are characteristic of sediments in Brazos and Colorado Rivers to the north. Beach sediments are stratified,
Padre Island National Seashore, Texas 33
calcareous sands, and individual strata range in color from white to light gray, light brownish gray, very pale brown, or pale brown and have brown or yellow mottles.
A permanent high water table ranges from the surface to a depth of about 2 feet (0.6 meter). This beach map unit is washed and rewashed by wave action and high tides, and also reworked by wind. These areas are partially inundated by normal daily high tides and abnormally high tides and are completely covered by high tides and storm surge from tropical storms. Water erosion from daily high tides locally forms rills that are generally smoothed by wave action. Ripple marks are evident on the foreshore.
This beach map unit is smooth and generally barren of vegetation. However, vegetation does survive on shrub-coppice dunes on the beach landform immediately seaward of the foredunes. These shrub-coppice dunes are generally low, average 2 to 3 feet (0.6 to 0.9 meter) in height and develop in an area that parallels the foredune ridge. They typically have a water table within 40 inches (100 centimeters) of the land surface. Vegetation on shrub-coppice dunes on the beach consists of goatfoot morning glory, gulf croton (beach tea), beach or fiddleleaf morning glory, and sea purslane. Survival of shrub-coppice dunes on this beach map unit can be diminished during high spring tides and in response to vehicular activity on the beach. The number and size of shrub-coppice dunes are greater on the 4-mile extent of Malaquite Beach, on which driving is prohibited.
CB2—Beaches, gravelly, 0 to 2 percent slopes, very frequently flooded
Setting
General location: Gulf Coast barrier islands of South Texas Landscape: Barrier island Elevation: 0.0 to 3.3 feet (0.0 to 1.0 meters) Mean annual precipitation: 25 to 35 inches (635 to 889 millimeters) Mean annual air temperature: 71 to 73 degrees F (22 to 23 degrees C) Frost-free period: 310 to 350 days
Composition
Beaches and similar soils: 100 percent Contrasting soils: None
Composition is based on observations, descriptions, and transects of the mapunit.
Soil Description
Beaches
Position(s) on landform(s): Beach Parent material: Shelly beach sand of Holocene age
Typical Profile
C—0 to 7 inches; gravelly fine sand Cg—7 to 80 inches; stratified gravel to fine sand
Properties and Qualities
Slope: 0 to 2 percent Percent of area covered by surface fragments: About 30 percent medium sub-rounded
gravel (seashells and seashell fragments) Depth to first restrictive layer: Not present Slowest soil permeability (K-sat) to 60 inches, above first restrictive layer: 6.0 to 20 in/hr
(rapid)
34 Soil Survey of
Slowest soil permeability (K-sat) to 60 inches, within and below first restrictive layer: No restrictive layer
Salinity, representative within 40 inches: Not saline Salinity, maximum within 40 inches: About 0.2 mmhos/cm, not saline Sodicity, representative within 40 inches: Not sodic Sodicity, maximum within 40 inches: Sodium Adsorption Ratio (SAR) is about 2.2, not
sodic Representative total available water capacity to 60 inches: About 4.8 inches (low) Natural drainage class: Poorly drained Runoff: Negligible Flooding frequency: Very frequent Ponding frequency: None Seasonal high water table minimum depth: About 0 to 6 inches
Interpretive Groups
Ecological site name: Not assigned to an ecological site Ecological site number: Not assigned to an ecological site Typical vegetation: Essentially barren, except for a few annual grasses or forbs
Note: Additional information specific to the components of this map unit is available in the “Tables” section.
Use and Management
Major land uses: Wildlife habitat and recreation
This map unit consists of the land area adjacent to the Gulf of Mexico, between the low tide mark and the front of the foredune ridges, and is mapped from approximately the 4- to 17-mile markers. The beach in this area ranges from 100 to 600 feet (30 to 180 meters) in width and has a generally wide foreshore and flat backshore. Longshore drift in this mapped area is generally to the south with the convergence zone in extreme southern portions of the map unit. Over most of this mapped area, the overall finer grain size mode and heavy mineral composition are characteristic of sediments in the Brazos and Colorado Rivers to the north. However, the transition zones associated with bimodal grain size and heavy mineral assemblage do affect extreme southern portions of this map unit.
Beach sediments are composed of more than 50 percent shell fragments, and the area is commonly referred to as “Little Shell.” A high percentage of the shell fragments are the small surf clam Donax variailis Say with some Donax tumida Say. Extremely poor packing of coarse shell fragments makes driving along the beach hazardous without a four-wheel drive vehicle or large, soft tires.
Beach sediments are stratified, calcareous sands, and individual strata range in color from white to light gray, light brownish gray, very pale brown, or pale brown and have brown or yellow mottles.
A permanent high water table ranges from the surface to a depth of about 2 feet (0.6 meter. This beach map unit is washed and rewashed by wave action and high tides, and also reworked by wind. These areas are partially inundated by normal daily high tides and abnormally high tides and are completely covered by high tides and storm surge from tropical storms. Water erosion from daily high tides locally forms rills that are generally smoothed by wave action. Ripple marks are evident on the foreshore.
This beach map unit is smooth and generally barren of vegetation. However, vegetation does survive on shrub-coppice dunes on the beach landform immediately seaward of the foredunes. These shrub-coppice dunes are generally low, average 2 to 3 feet (0.6 to 0.9 meter) in height and develop in an area that parallels the foredune ridge. They typically have a water table within 40 inches (100 centimeters) of the land surface. Vegetation on shrub-coppice dunes on the beach consists of goatfoot morning glory, gulf
Padre Island National Seashore, Texas 35
croton (beach tea), beach or fiddleleaf morning glory, and sea purslane. Survival of shrub-coppice dunes on this beach map unit can be diminished during high spring tides and in response to vehicular activity on the beach.
CB3—Beaches, bermed, very gravelly, 1 to 3 percent slopes, very frequently flooded
Setting
General location: Gulf Coast barrier islands of South Texas (fig. 16) Landscape: Barrier island Elevation: 0.0 to 4.0 feet (0.0 to 1.2 meters) Mean annual precipitation: 25 to 35 inches (635 to 889 millimeters) Mean annual air temperature: 71 to 73 degrees F (22 to 23 degrees C) Frost-free period: 310 to 350 days
Composition
Beaches and similar soils: 100 percent Contrasting soils: None
Composition is based on observations, descriptions, and transects of the mapunit.
Soil Description
Beaches
Position(s) on landform(s): Beach Parent material: Shelly beach sand of Holocene age
Typical Profile
C—0 to 7 inches; very paragravelly fine sand Cg—7 to 80 inches; stratified gravel to fine sand
Properties and Qualities
Slope: 1 to 2 percent Percent of area covered by surface fragments: About 45 percent subangular medium and
coarse gravel (seashells and seashell fragments) Depth to first restrictive layer: Not present Slowest soil permeability (K-sat) to 60 inches, above first restrictive layer: 6.0 to 20 in/hr
(rapid) Slowest soil permeability (K-sat) to 60 inches, within and below first restrictive layer: No
restrictive layer Salinity, representative within 40 inches: Not saline Salinity, maximum within 40 inches: About 0.2 mmhos/cm, not saline Sodicity, representative within 40 inches: Not sodic Sodicity, maximum within 40 inches: Sodium Adsorption Ratio (SAR) is about 2.2, not
sodic Representative total available water capacity to 60 inches: About 4.8 inches (low) Natural drainage class: Poorly drained Runoff: Negligible Flooding frequency: Very frequent Ponding frequency: None Seasonal high water table minimum depth: About 0 to 6 inches
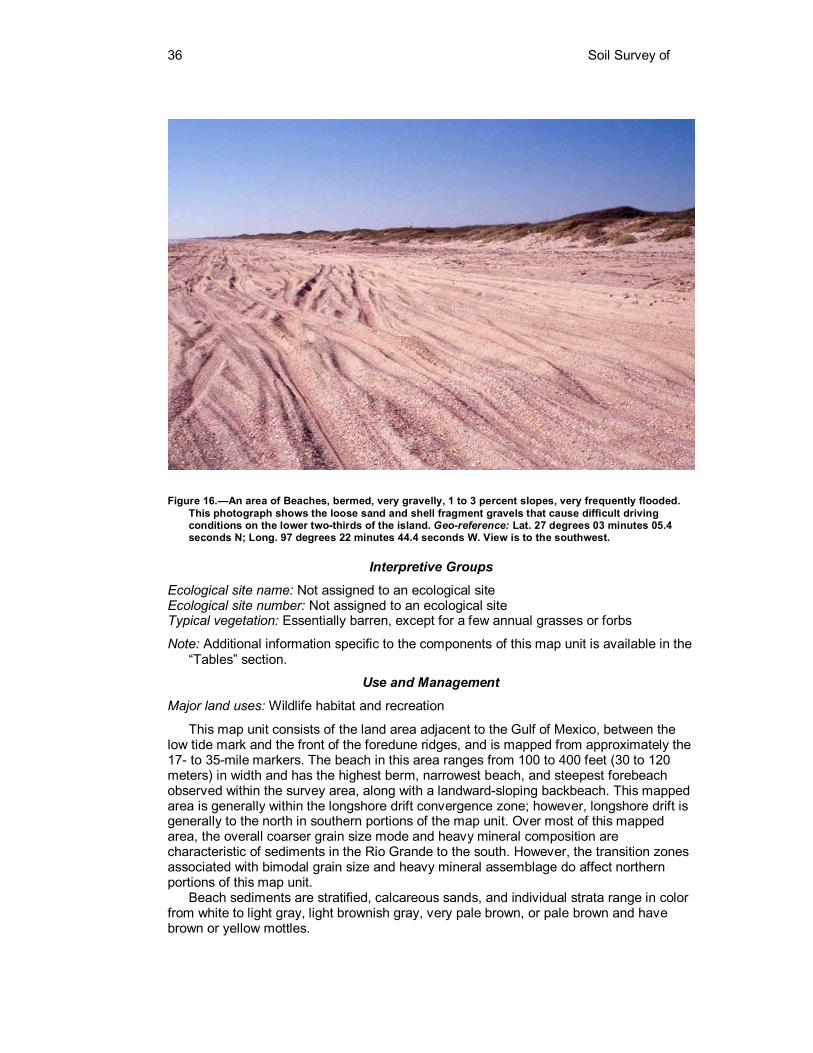
36 Soil Survey of
Figure 16.—An area of Beaches, bermed, very gravelly, 1 to 3 percent slopes, very frequently flooded. This photograph shows the loose sand and shell fragment gravels that cause difficult driving conditions on the lower two-thirds of the island. Geo-reference: Lat. 27 degrees 03 minutes 05.4 seconds N; Long. 97 degrees 22 minutes 44.4 seconds W. View is to the southwest.
Interpretive Groups
Ecological site name: Not assigned to an ecological site Ecological site number: Not assigned to an ecological site Typical vegetation: Essentially barren, except for a few annual grasses or forbs
Note: Additional information specific to the components of this map unit is available in the “Tables” section.
Use and Management
Major land uses: Wildlife habitat and recreation
This map unit consists of the land area adjacent to the Gulf of Mexico, between the low tide mark and the front of the foredune ridges, and is mapped from approximately the 17- to 35-mile markers. The beach in this area ranges from 100 to 400 feet (30 to 120 meters) in width and has the highest berm, narrowest beach, and steepest forebeach observed within the survey area, along with a landward-sloping backbeach. This mapped area is generally within the longshore drift convergence zone; however, longshore drift is generally to the north in southern portions of the map unit. Over most of this mapped area, the overall coarser grain size mode and heavy mineral composition are characteristic of sediments in the Rio Grande to the south. However, the transition zones associated with bimodal grain size and heavy mineral assemblage do affect northern portions of this map unit.
Beach sediments are stratified, calcareous sands, and individual strata range in color from white to light gray, light brownish gray, very pale brown, or pale brown and have brown or yellow mottles.
Padre Island National Seashore, Texas 37
A permanent high water table ranges from the surface to a depth of about 2 feet (0.6 meter). This beach map unit is washed and rewashed by wave action and high tides, and also reworked by wind. These areas are partially inundated by normal daily high tides and abnormally high tides and are completely covered by high tides and storm surge from tropical storms. Water erosion from daily high tides locally forms rills that are generally smoothed by wave action. Ripple marks are evident on the foreshore.
The narrow beach (and generally lower foredunes) within this map unit facilitates the development of natural cuts, and formation of washover fans and washover fan channels landward of the foredunes, during strong tropical storms. These temporary breaks in the foredune ridges are generally closed by sand deposition within a short period of time, but remain as natural low areas that are often reopened during subsequent storms (Hunter et al, 1972). The storm berm in this mapped area can have up to 18 inches (46 centimeters) of vertical relief.
Beach sediments are composed of 20 percent shell fragments and the area is commonly referred to as “Big Shell.” Large shells are common, and the beach is littered with valves of Mercenaria campechiensis Gmelin, Eontia ponderosa Say, and Echinochama arcinella Linne. Donax sp., in either dead or living form, is generally absent except for a small colony about 20 miles north of Mansfield Pass (Watson, 1968). Reduced shell content and improved packing result in a firmer beach with better trafficability.
This beach map unit is smooth and generally barren of vegetation. However, vegetation does survive on shrub-coppice dunes on the beach landform immediately seaward of the foredunes. These shrub-coppice dunes are generally low, average 2 to 3 feet (0.6 to 0.9 meter) in height and develop in an area that parallels the foredune ridge. They typically have a water table within 40 inches (100 centimeters) of the land surface. Vegetation on shrub-coppice dunes on the beach consists of goatfoot morning glory, gulf croton (beach tea), beach or fiddleleaf morning glory, and sea purslane. Survival of shrub-coppice dunes on this beach map unit can be diminished during high spring tides and in response to vehicular activity on the beach, although the storm berm can provide some protection from surf action. Shrub-coppice dunes are less common within this map unit than other mapped areas on the Padre Island National Seashore beach.
CB4—Beaches, bermed, gravelly, 1 to 3 percent slopes, very frequently flooded
Setting
General location: Gulf Coast barrier islands of South Texas Landscape: Barrier island Elevation: 0.0 to 4.0 feet (0.0 to 1.2 meters) Mean annual precipitation: 25 to 35 inches (635 to 889 millimeters) Mean annual air temperature: 71 to 73 degrees F (22 to 23 degrees C) Frost-free period: 310 to 350 days
Composition
Beaches and similar soils: 100 percent Contrasting soils: None
Composition is based on observations, descriptions, and transects of the mapunit.
Soil Description
Beaches
Position(s) on landform(s): Beach Parent material: Shelly beach sand of Holocene age
38 Soil Survey of
Typical Profile
C—0 to 7 inches; gravelly fine sand Cg—7 to 80 inches; stratified gravel to fine sand
Properties and Qualities
Slope: 1 to 3 percent Percent of area covered by surface fragments: About 25 percent subangular medium and
coarse gravel (seashells and seashell fragments) Depth to first restrictive layer: Not present Slowest soil permeability (K-sat) to 60 inches, above first restrictive layer: 6.0 to 20 in/hr
(rapid) Slowest soil permeability (K-sat) to 60 inches, within and below first restrictive layer: No
restrictive layer Salinity, representative within 40 inches: Not saline Salinity, maximum within 40 inches: About 0.2 mmhos/cm, not saline Sodicity, representative within 40 inches: Not sodic Sodicity, maximum within 40 inches: Sodium Adsorption Ratio (SAR) is about 2.2, not
sodic Representative total available water capacity to 60 inches: About 4.8 inches (low) Natural drainage class: Poorly drained Runoff: Negligible Flooding frequency: Very frequent Ponding frequency: None Seasonal high water table minimum depth: About 0 to 6 inches
Interpretive Groups
Ecological site name: Not assigned to an ecological site Ecological site number: Not assigned to an ecological site Typical vegetation: Essentially barren, except for a few annual grasses or forbs
Note: Additional information specific to the components of this map unit is available in the “Tables” section.
Use and Management
Major land uses: Wildlife habitat and recreation
This map unit consists of the land area adjacent to the Gulf of Mexico, between the low tide mark and the front of the foredune ridges, and is mapped from the 35-mile mark to the Port Mansfield Jetties in Willacy County (approximately 25 miles). The beach in this area ranges from 100 to 900 feet (30 to 275 meters) in width and has a steep forebeach and flat backbeach. The wider beach widths and lower foredunes within this map unit can be attributed to development of washover fan channels and breaks in the foredune ridge. Longshore drift in this mapped area is to the north. The overall coarser grain size mode and heavy mineral composition are characteristic of sediments in the Rio Grande River to the south.
Beach sediments are stratified, calcareous sands, and individual strata range in color from white to light gray, light brownish gray, very pale brown, or pale brown and have brown or yellow mottles.
A permanent high water table ranges from the surface to a depth of about 2 feet (0.6 meter). This beach map unit is washed and rewashed by wave action and high tides, and also reworked by wind. These areas are partially inundated by normal daily high tides and abnormally high tides and are completely covered by high tides and storm surge from tropical storms. Water erosion from daily high tides locally forms rills that are generally smoothed by wave action. Ripple marks are evident on the foreshore.
Padre Island National Seashore, Texas 39
Narrower portions of the beach are susceptible to breaching of the foredune ridge and formation of washover fans and washover fan channels, similar to the Big Shell area. These temporary breaks in the foredune ridges are generally closed by sand deposition within a short period of time, but remain as natural low areas that are often reopened during subsequent storms (Hunter et al, 1972). The storm berm in this mapped area can have up to 18 inches (46 centimeters) of vertical relief.
Shell fragments within this mapped area are composed of the same species as found in the Big Shell area, although the percentage of shell fragments decreases southward.
This beach map unit is smooth and generally barren of vegetation. However, vegetation does survive on shrub-coppice dunes on the beach landform immediately seaward of the foredunes. These shrub-coppice dunes are generally low, average 2 to 3 feet (0.6 to 0.9 meter) in height and develop in an area that parallels the foredune ridge. They typically have a water table within 40 inches (100 centimeters) of the land surface. Vegetation on shrub-coppice dunes on the beach consists of goatfoot morning glory, gulf croton (beach tea), beach or fiddleleaf morning glory, and sea purslane. Survival of shrub-coppice dunes in this beach map unit can be diminished during high spring tides and in response to vehicular activity on the beach, although the storm berm can provide some protection from surf action.
Barrier Island: Foredune or Back-Island Dune Field
299—Greenhill fine sand, 2 to 12 percent slopes, rarely flooded
Setting
General location: Gulf Coast barrier islands of South Texas (fig. 17) Landscape: Barrier island Elevation: 5.0 to 30.0 feet (1.5 to 9.1 meters) Mean annual precipitation: 25 to 35 inches (635 to 889 millimeters) Mean annual air temperature: 71 to 73 degrees F (22 to 23 degrees C) Frost-free period: 310 to 350 days
Composition
Greenhill and similar soils: 85 percent Contrasting soils: 15 percent
Dissimilar Minor Components
Padre soils
Composition: 7 percent Landform: Low dune on barrier flat on barrier islands
Mustang soils
Composition: 6 percent Landform: Barrier flat on barrier islands
Madre soils
Composition: 2 percent Landform: Barrier flat on barrier islands
Composition is based on observations, descriptions, and transects of the mapunit.
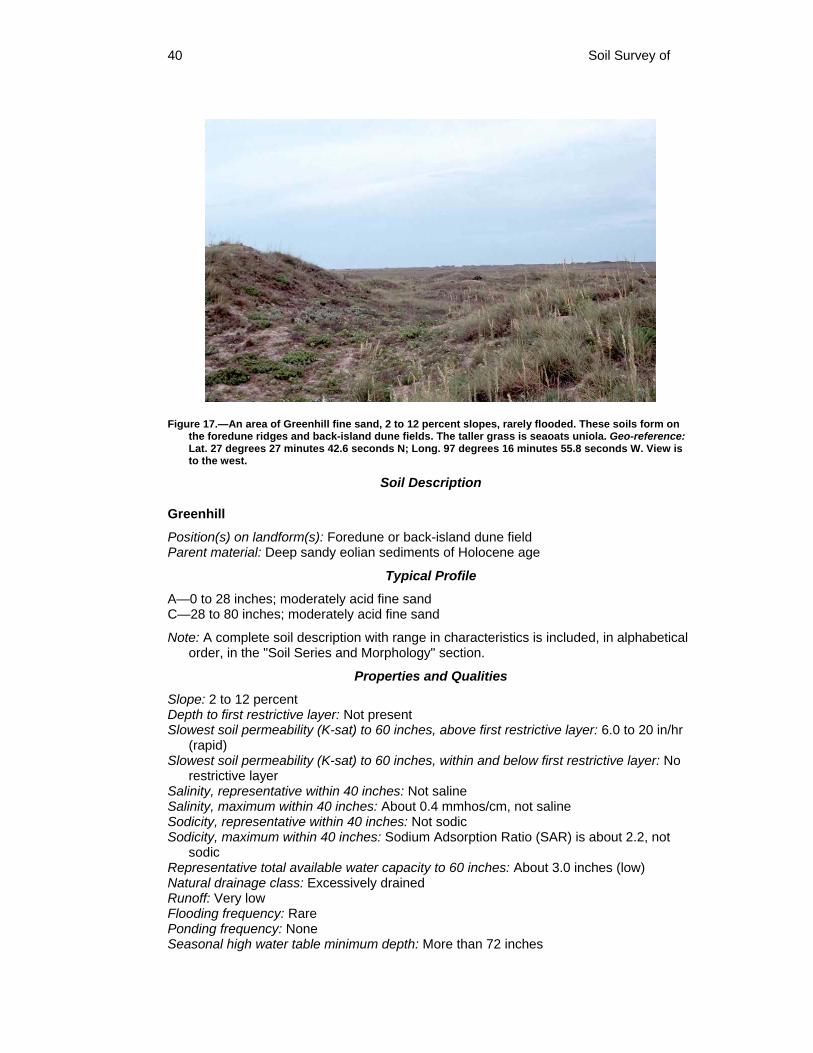
40 Soil Survey of
Figure 17.—An area of Greenhill fine sand, 2 to 12 percent slopes, rarely flooded. These soils form on the foredune ridges and back-island dune fields. The taller grass is seaoats uniola. Geo-reference: Lat. 27 degrees 27 minutes 42.6 seconds N; Long. 97 degrees 16 minutes 55.8 seconds W. View is to the west.
Soil Description
Greenhill
Position(s) on landform(s): Foredune or back-island dune field Parent material: Deep sandy eolian sediments of Holocene age
Typical Profile
A—0 to 28 inches; moderately acid fine sand C—28 to 80 inches; moderately acid fine sand
Note: A complete soil description with range in characteristics is included, in alphabetical order, in the "Soil Series and Morphology" section.
Properties and Qualities
Slope: 2 to 12 percent Depth to first restrictive layer: Not present Slowest soil permeability (K-sat) to 60 inches, above first restrictive layer: 6.0 to 20 in/hr
(rapid) Slowest soil permeability (K-sat) to 60 inches, within and below first restrictive layer: No
restrictive layer Salinity, representative within 40 inches: Not saline Salinity, maximum within 40 inches: About 0.4 mmhos/cm, not saline Sodicity, representative within 40 inches: Not sodic Sodicity, maximum within 40 inches: Sodium Adsorption Ratio (SAR) is about 2.2, not
sodic Representative total available water capacity to 60 inches: About 3.0 inches (low) Natural drainage class: Excessively drained Runoff: Very low Flooding frequency: Rare Ponding frequency: None Seasonal high water table minimum depth: More than 72 inches
Padre Island National Seashore, Texas 41
Interpretive Groups
Ecological site name: Coastal Dune PE 31-44 Ecological site number: R150BY714TX Typical vegetation: Coastal prairie of mid to tall grasses such as bitter panicum, seaoats
uniola, camphorweed, seacoast bluestem, and thin paspalum
Note: Additional information specific to the components of this map unit is available in the “Tables” section.
Use and Management
Major land uses: Wildlife habitat and recreation
399—Greenhill-Mustang complex, 0 to 12 percent slopes, occasionally flooded
Setting
General location: Gulf Coast barrier islands of South Texas Landscape: Barrier island Elevation: 0.0 to 30.0 feet (0.0 to 9.1 meters) Mean annual precipitation: 25 to 35 inches (635 to 889 millimeters) Mean annual air temperature: 71 to 73 degrees F (22 to 23 degrees C) Frost-free period: 310 to 350 days
Composition
Greenhill and similar soils: 50 percent Mustang and similar soils: 41 percent Contrasting soils: 9 percent
Dissimilar Minor Components
Padre soils
Composition: 9 percent Landform: Low dune on barrier flat on barrier islands
Composition is based on observations, descriptions, and transects of the mapunit.
Soil Description
Greenhill
Position(s) on landform(s): Back-island dune field Parent material: Deep sandy eolian sediments of Holocene age
Typical Profile
A—0 to 21 inches; moderately acid fine sand C—21 to 80 inches; moderately acid fine sand
Note: A complete soil description with range in characteristics is included, in alphabetical order, in the "Soil Series and Morphology" section.
Properties and Qualities
Slope: 2 to 12 percent Depth to first restrictive layer: Not present Slowest soil permeability (K-sat) to 60 inches, above first restrictive layer: 6.0 to 20 in/hr
(rapid)
42 Soil Survey of
Slowest soil permeability (K-sat) to 60 inches, within and below first restrictive layer: No restrictive layer
Salinity, representative within 40 inches: Not saline Salinity, maximum within 40 inches: About 0.4 mmhos/cm, not saline Sodicity, representative within 40 inches: Not sodic Sodicity, maximum within 40 inches: Sodium Adsorption Ratio (SAR) is about 2.2, not
sodic Representative total available water capacity to 60 inches: About 3.0 inches (low) Natural drainage class: Excessively drained Runoff: Very low Flooding frequency: Rare Ponding frequency: None Seasonal high water table minimum depth: More than 72 inches
Interpretive Groups
Ecological site name: Coastal Dune PE 31-44 Ecological site number: R150BY714TX Typical vegetation: Coastal prairie of mid to tall grasses such as bitter panicum, seaoats
uniola, camphorweed, seacoast bluestem, and thin paspalum
Mustang
Position(s) on landform(s): Barrier flat Parent material: Sandy eolian and storm washover sediments of Holocene age
Typical Profile
A—0 to 19 inches; neutral fine sand Cg—19 to 80 inches; neutral fine sand
Note: A complete soil description with range in characteristics is included, in alphabetical order, in the "Soil Series and Morphology" section.
Properties and Qualities
Slope: 0 to 1 percent Depth to first restrictive layer: Not present Slowest soil permeability (K-sat) to 60 inches, above first restrictive layer: 0.001 to 0.06
in/hr (very slow) Slowest soil permeability (K-sat) to 60 inches, within and below first restrictive layer: No
restrictive layer Salinity, representative within 40 inches: Not saline Salinity, maximum within 40 inches: About 0.8 mmhos/cm, not saline Sodicity, representative within 40 inches: Not sodic Sodicity, maximum within 40 inches: Sodium Adsorption Ratio (SAR) is about 2.5, not
sodic Representative total available water capacity to 60 inches: About 2.4 inches (very low) Natural drainage class: Poorly drained Runoff: Negligible Flooding frequency: Occasional Ponding frequency: Frequent Seasonal high water table minimum depth: About 0 to 6 inches
Interpretive Groups
Ecological site name: Low Coastal Sand PE 31-44 Ecological site number: R150BY650TX Typical vegetation: Coastal prairie of mid to tall grasses such as marshay cordgrass,
sedge, gulfdune paspalum, bushy bluestem, and Scribner panicum
Padre Island National Seashore, Texas 43
Note: Additional information specific to the components of this map unit is available in the “Tables” section.
Use and Management
Major land uses: Wildlife habitat and recreation
499—Daggerhill fine sand, 2 to 12 percent slopes, rarely flooded
Setting
General location: Gulf Coast barrier islands of South Texas (fig. 18) Landscape: Barrier island Elevation: 5.0 to 45.0 feet (1.5 to 13.7 meters) Mean annual precipitation: 25 to 35 inches (635 to 889 millimeters) Mean annual air temperature: 71 to 73 degrees F (22 to 23 degrees C) Frost-free period: 310 to 350 days
Composition
Daggerhill and similar soils: 86 percent Contrasting soils: 14 percent
Dissimilar Minor Components
Panam soils
Composition: 9 percent Landform: Low dune on barrier flat on barrier islands
Mustang soils
Composition: 3 percent Landform: Barrier flat on barrier islands
Madre soils
Composition: 2 percent Landform: Barrier flat on barrier islands
Composition is based on observations, descriptions, and transects of the mapunit.
Soil Description
Daggerhill
Position(s) on landform(s): Foredune or back-island dune field Parent material: Deep sandy eolian sediments of Holocene age
Typical Profile
A—0 to 18 inches; strongly alkaline fine sand C—18 to 80 inches; strongly alkaline fine sand
Note: A complete soil description with range in characteristics is included, in alphabetical order, in the "Soil Series and Morphology" section.
Properties and Qualities
Slope: 2 to 12 percent Depth to first restrictive layer: Not present Slowest soil permeability (K-sat) to 60 inches, above first restrictive layer: 6.0 to 20 in/hr
(rapid)
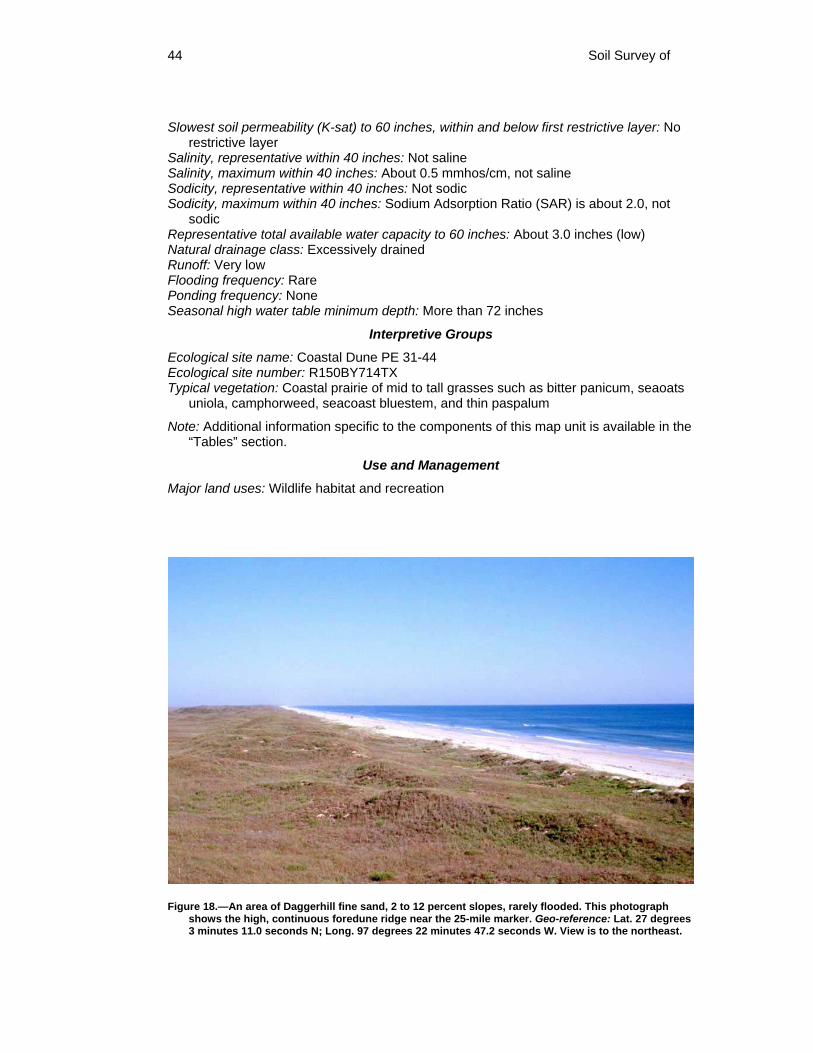
44 Soil Survey of
Slowest soil permeability (K-sat) to 60 inches, within and below first restrictive layer: No restrictive layer
Salinity, representative within 40 inches: Not saline Salinity, maximum within 40 inches: About 0.5 mmhos/cm, not saline Sodicity, representative within 40 inches: Not sodic Sodicity, maximum within 40 inches: Sodium Adsorption Ratio (SAR) is about 2.0, not
sodic Representative total available water capacity to 60 inches: About 3.0 inches (low) Natural drainage class: Excessively drained Runoff: Very low Flooding frequency: Rare Ponding frequency: None Seasonal high water table minimum depth: More than 72 inches
Interpretive Groups
Ecological site name: Coastal Dune PE 31-44 Ecological site number: R150BY714TX Typical vegetation: Coastal prairie of mid to tall grasses such as bitter panicum, seaoats
uniola, camphorweed, seacoast bluestem, and thin paspalum
Note: Additional information specific to the components of this map unit is available in the “Tables” section.
Use and Management
Major land uses: Wildlife habitat and recreation
Figure 18.—An area of Daggerhill fine sand, 2 to 12 percent slopes, rarely flooded. This photograph shows the high, continuous foredune ridge near the 25-mile marker. Geo-reference: Lat. 27 degrees 3 minutes 11.0 seconds N; Long. 97 degrees 22 minutes 47.2 seconds W. View is to the northeast.
Padre Island National Seashore, Texas 45
502—Daggerhill-Satatton complex, 0 to 12 percent slopes, frequently flooded
Setting
General location: Gulf Coast barrier islands of South Texas Landscape: Barrier island Elevation: 1.0 to 20.0 feet (0.3 to 6.1 meters) Mean annual precipitation: 25 to 35 inches (635 to 889 millimeters) Mean annual air temperature: 71 to 73 degrees F (22 to 23 degrees C) Frost-free period: 310 to 350 days
Composition
Daggerhill and similar soils: 45 percent Satatton and similar soils: 40 percent Contrasting soils: 15 percent
Dissimilar Minor Components
Malaquite soils
Composition: 8 percent Landform: Shallow depression in barrier flat on barrier islands
Panam soils
Composition: 7 percent Landform: Low dune on barrier flat on barrier islands
Composition is based on observations, descriptions, and transects of the mapunit.
Soil Description
Daggerhill
Position(s) on landform(s): Back-island dune field Parent material: Deep sandy eolian sediments of Holocene age
Typical Profile
A—0 to 18 inches; strongly alkaline fine sand C—18 to 80 inches; strongly alkaline fine sand
Note: A complete soil description with range in characteristics is included, in alphabetical order, in the "Soil Series and Morphology" section.
Properties and Qualities
Slope: 2 to 12 percent Depth to first restrictive layer: Not present Slowest soil permeability (K-sat) to 60 inches, above first restrictive layer: 6.0 to 20 in/hr
(rapid) Slowest soil permeability (K-sat) to 60 inches, within and below first restrictive layer: No
restrictive layer Salinity, representative within 40 inches: Not saline Salinity, maximum within 40 inches: About 0.5 mmhos/cm, not saline Sodicity, representative within 40 inches: Not sodic Sodicity, maximum within 40 inches: Sodium Adsorption Ratio (SAR) is about 2.0, not
sodic Representative total available water capacity to 60 inches: About 3.0 inches (low)
46 Soil Survey of
Natural drainage class: Excessively drained Runoff: Very low Flooding frequency: Rare Ponding frequency: None Seasonal high water table minimum depth: More than 72 inches
Interpretive Groups
Ecological site name: Coastal Dune PE 31-44 Ecological site number: R150BY714TX Typical vegetation: Coastal prairie of mid to tall grasses such as bitter panicum, seaoats
uniola, camphorweed, seacoast bluestem, and thin paspalum
Satatton Soils
Position(s) on landform(s): Deflation flat or wind-tidal flat Parent material: Sandy eolian and storm washover sediments of Holocene age
Typical Profile
Anz—0 to 17 inches; slightly alkaline fine sand Cnzg—17 to 80 inches; slightly alkaline fine sand
Note: A complete soil description with range in characteristics is included, in alphabetical order, in the "Soil Series and Morphology" section.
Properties and Qualities
Slope: 0 to 1 percent Depth to first restrictive layer: 0 to 10 inches, salic Slowest soil permeability (K-sat) to 60 inches, above first restrictive layer: 0.001 to 0.06
in/hr (very slow) Slowest soil permeability (K-sat) to 60 inches, within and below first restrictive layer: No
restrictive layer Salinity, representative within 40 inches: Saline Salinity, maximum within 40 inches: About 150.0 mmhos/cm, saline Sodicity, representative within 40 inches: Sodic Sodicity, maximum within 40 inches: Sodium Adsorption Ratio (SAR) is about 104.0,
sodic Representative total available water capacity to 60 inches: About 0.0 inches (very low) Natural drainage class: Poorly drained Runoff: Negligible Flooding frequency: Frequent Ponding frequency: None Seasonal high water table minimum depth: About 0 to 18 inches
Interpretive Groups
Ecological site name: Wind Tidal Flat Ecological site number: R150BY716TX Typical vegetation: Wind-tidal flat that is essentially barren of vegetation, other than
scattered Salicornia species. A thin benthic, blue-green algal mat consisting of Cyanobacteria occurs on the surface.
Note: Additional information specific to the components of this map unit is available in the “Tables” section.
Use and Management
Major land uses: Wildlife habitat and recreation
Padre Island National Seashore, Texas 47
599—Daggerhill-Mustang complex, 0 to 12 percent slopes, occasionally flooded
Setting
General location: Gulf Coast barrier islands of South Texas Landscape: Barrier island Elevation: 0.0 to 45.0 feet (0.0 to 13.7 meters) Mean annual precipitation: 25 to 35 inches (635 to 889 millimeters) Mean annual air temperature: 71 to 73 degrees F (22 to 23 degrees C) Frost-free period: 310 to 350 days
Composition
Daggerhill and similar soils: 50 percent Mustang and similar soils: 41 percent Contrasting soils: 9 percent
Dissimilar Minor Components
Panam soils
Composition: 9 percent Landform: Low dune on barrier flat on barrier islands
Composition is based on observations, descriptions, and transects of the mapunit.
Soil Description
Daggerhill soils
Position(s) on landform(s): Back-island dune field Parent material: Deep sandy eolian sediments of Holocene age
Typical Profile
A—0 to 18 inches; strongly alkaline fine sand C—18 to 80 inches; strongly alkaline fine sand
Note: A complete soil description with range in characteristics is included, in alphabetical order, in the "Soil Series and Morphology" section.
Properties and Qualities
Slope: 2 to 12 percent Depth to first restrictive layer: Not present Slowest soil permeability (K-sat) to 60 inches, above first restrictive layer: 6.0 to 20 in/hr
(rapid) Slowest soil permeability (K-sat) to 60 inches, within and below first restrictive layer: No
restrictive layer Salinity, representative within 40 inches: Not saline Salinity, maximum within 40 inches: About 0.5 mmhos/cm, not saline Sodicity, representative within 40 inches: Not sodic Sodicity, maximum within 40 inches: Sodium Adsorption Ratio (SAR) is about 2.0, not
sodic Representative total available water capacity to 60 inches: About 3.0 inches (low) Natural drainage class: Excessively drained Runoff: Very low Flooding frequency: Rare
48 Soil Survey of
Ponding frequency: None Seasonal high water table minimum depth: More than 72 inches
Interpretive Groups
Ecological site name: Coastal Dune PE 31-44 Ecological site number: R150BY714TX Typical vegetation: Coastal prairie of mid to tall grasses such as bitter panicum, seaoats
uniola, camphorweed, seacoast bluestem, and thin paspalum
Mustang soils
Position(s) on landform(s): Barrier flat Parent material: Sandy eolian and storm washover sediments of Holocene age
Typical Profile
A—0 to 11 inches; strongly alkaline fine sand Cg—11 to 80 inches; strongly alkaline fine sand
Note: A complete soil description with range in characteristics is included, in alphabetical order, in the "Soil Series and Morphology" section.
Properties and Qualities
Slope: 0 to 1 percent Depth to first restrictive layer: Not present Slowest soil permeability (K-sat) to 60 inches, above first restrictive layer: 0.001 to 0.06
in/hr (very slow) Slowest soil permeability (K-sat) to 60 inches, within and below first restrictive layer: No
restrictive layer Salinity, representative within 40 inches: Not saline Salinity, maximum within 40 inches: About 2.1 mmhos/cm, not saline Sodicity, representative within 40 inches: Not sodic Sodicity, maximum within 40 inches: Sodium Adsorption Ratio (SAR) is about 7.0, not
sodic Representative total available water capacity to 60 inches: About 2.4 inches (very low) Natural drainage class: Poorly drained Runoff: Negligible Flooding frequency: Occasional Ponding frequency: Frequent Seasonal high water table minimum depth: About 0 to 6 inches
Interpretive Groups
Ecological site name: Low Coastal Sand PE 31-44 Ecological site number: R150BY650TX Typical vegetation: Coastal prairie of mid to tall grasses such as marshay cordgrass,
sedge, gulfdune paspalum, bushy bluestem, and Scribner panicum
Note: Additional information specific to the components of this map unit is available in the “Tables” section.
Use and Management
Major land uses: Wildlife habitat and recreation
Padre Island National Seashore, Texas 49
999—Dune land-Satatton complex, 0 to 5 percent slopes, occasionally flooded
Setting
General location: Gulf Coast barrier islands of South Texas Landscape: Barrier island coastal plain Elevation: 1.0 to 49.0 feet (0.3 to 14.9 meters) Mean annual precipitation: 25 to 35 inches (635 to 889 millimeters) Mean annual air temperature: 71 to 73 degrees F (22 to 23 degrees C) Frost-free period: 300 to 350 days
Composition
Dune Land and similar soils: 55 percent Satatton and similar soils: 42 percent Contrasting soils: 3 percent
Dissimilar Minor Components
Malaquite soils
Composition: 3 percent Landform: Shallow depression in barrier flat on barrier islands
Composition is based on observations, descriptions, and transects of the mapunit.
Soil Description
Dune Land
Position(s) on landform(s): Dune field or back-island dune field Parent material: Deep sandy eolian sediments of Holocene age
Typical Profile
C—0 to 80 inches; fine sand
Properties and Qualities
Slope: 1 to 5 percent Depth to first restrictive layer: Not present Slowest soil permeability (K-sat) to 60 inches, above first restrictive layer: 6.0 to 20 in/hr
(rapid) Slowest soil permeability (K-sat) to 60 inches, within and below first restrictive layer: No
restrictive layer Salinity, representative within 40 inches: Not saline Salinity, maximum within 40 inches: About 1.0 mmhos/cm, Not saline Sodicity, representative within 40 inches: Not sodic Sodicity, maximum within 40 inches: Sodium Adsorption Ratio (SAR) is about 1.0, not
sodic Representative total available water capacity to 60 inches: About 3.0 inches (low) Natural drainage class: Excessively drained Runoff: Low Flooding frequency: Occasional Ponding frequency: None Seasonal high water table minimum depth: More than 72 inches
Interpretive Groups
Ecological site name: Not assigned to an ecological site
50 Soil Survey of
Ecological site number: Not assigned to an ecological site Typical vegetation: Essentially barren, except for a few annual grasses or forbs
Satatton soils
Position(s) on landform(s): Deflation flat or wind-tidal flat Parent material: Deep sandy eolian sediments of Holocene age
Typical Profile
Anz—0 to 17 inches; slightly alkaline fine sand Cnzg—17 to 80 inches; slightly alkaline fine sand
Note: A complete soil description with range in characteristics is included, in alphabetical order, in the "Soil Series and Morphology" section.
Properties and Qualities
Slope: 0 to 1 percent Depth to first restrictive layer: 0 to 10 inches, salic Slowest soil permeability (K-sat) to 60 inches, above first restrictive layer: 0.001 to 0.06
in/hr (very slow) Slowest soil permeability (K-sat) to 60 inches, within and below first restrictive layer: No
restrictive layer Salinity, representative within 40 inches: Saline Salinity, maximum within 40 inches: About 150.0 mmhos/cm, saline Sodicity, representative within 40 inches: Sodic Sodicity, maximum within 40 inches: Sodium Adsorption Ratio (SAR) is about 104.0,
sodic Representative total available water capacity to 60 inches: About 0.0 inches (very low) Natural drainage class: Poorly drained Runoff: Negligible Flooding frequency: Frequent Ponding frequency: None Seasonal high water table minimum depth: About 0 to 18 inches
Interpretive Groups
Ecological site name: Wind Tidal Flat Ecological site number: R150BY716TX Typical vegetation: Wind-tidal flat that is essentially barren of vegetation, other than
scattered Salicornia species. A thin benthic, blue-green algal mat consisting of Cyanobacteria occurs on the surface.
Note: Additional information specific to the components of this map unit is available in the “Tables” section.
Use and Management
Major land uses: Wildlife habitat and recreation
This unit consists partially of gently sloping active sand dunes. These dunes are on the southern portion of the island. Because of the prevailing southeast winds, the dunes generally occur as ridges that are oriented in a southeast to northwest direction. Some longitudinal dunes occur in an east to west direction. This unit is not suited to most land uses. It has the greatest potential as wildlife habitat. The unit can be stabilized by special management including picket dune fences. If moisture is available, vegetation can be established by hand planting native or adapted species. After planting, vegetation should be covered with hay or paper mulch in order to conserve moisture.
Padre Island National Seashore, Texas 51
Barrier Island: Barrier Flat
82A—Mustang fine sand, 0 to 1 percent slopes, occasionally flooded
Setting
General location: Gulf Coast barrier islands of South Texas (fig. 19) Landscape: Barrier island Elevation: 0.0 to 5.0 feet (0.0 to 1.5 meters) Mean annual precipitation: 25 to 35 inches (635 to 889 millimeters) Mean annual air temperature: 71 to 73 degrees F (22 to 23 degrees C) Frost-free period: 310 to 350 days
Composition
Mustang and similar soils: 85 percent Contrasting soils: 15 percent
Dissimilar Minor Components
Panam soils
Composition: 5 percent Landform: Low dune on barrier flat on barrier islands
Padre soils
Composition: 4 percent Landform: Low dune on barrier flat on barrier islands
Malaquite soils
Composition: 2 percent Landform: Shallow depression in barrier flat on barrier islands
Greenhill soils
Composition: 2 percent Landform: Foredune or back-island dune field on barrier islands
Daggerhill soils
Composition: 2 percent Landform: Foredune or back-island dune field on barrier islands
Composition is based on observations, descriptions, and transects of the mapunit.
Soil Description
Mustang soils
Position(s) on landform(s): Barrier flat Parent material: Sandy eolian and storm washover sediments of Holocene age
Typical Profile
A—0 to 19 inches; moderately alkaline fine sand Cg—19 to 80 inches; moderately alkaline fine sand
Note: A complete soil description with range in characteristics is included, in alphabetical order, in the "Soil Series and Morphology" section.
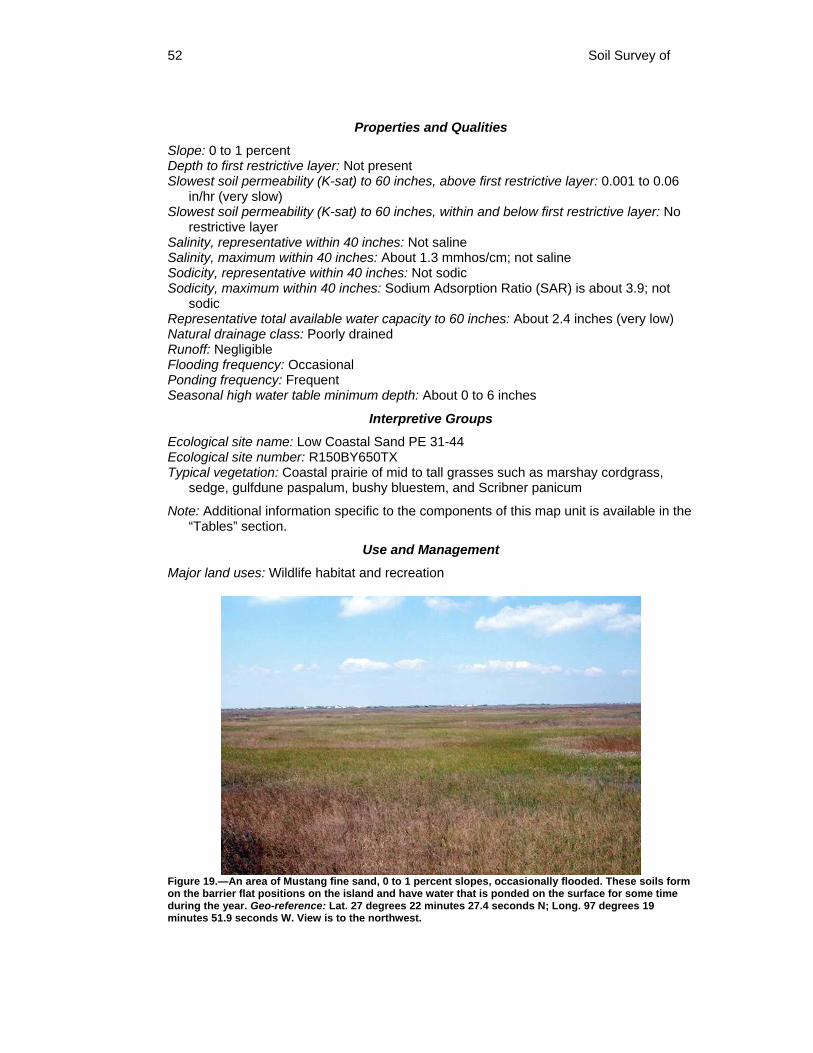
52 Soil Survey of
Properties and Qualities
Slope: 0 to 1 percent Depth to first restrictive layer: Not present Slowest soil permeability (K-sat) to 60 inches, above first restrictive layer: 0.001 to 0.06
in/hr (very slow) Slowest soil permeability (K-sat) to 60 inches, within and below first restrictive layer: No
restrictive layer Salinity, representative within 40 inches: Not saline Salinity, maximum within 40 inches: About 1.3 mmhos/cm; not saline Sodicity, representative within 40 inches: Not sodic Sodicity, maximum within 40 inches: Sodium Adsorption Ratio (SAR) is about 3.9; not
sodic Representative total available water capacity to 60 inches: About 2.4 inches (very low) Natural drainage class: Poorly drained Runoff: Negligible Flooding frequency: Occasional Ponding frequency: Frequent Seasonal high water table minimum depth: About 0 to 6 inches
Interpretive Groups
Ecological site name: Low Coastal Sand PE 31-44 Ecological site number: R150BY650TX Typical vegetation: Coastal prairie of mid to tall grasses such as marshay cordgrass,
sedge, gulfdune paspalum, bushy bluestem, and Scribner panicum
Note: Additional information specific to the components of this map unit is available in the “Tables” section.
Use and Management
Major land uses: Wildlife habitat and recreation
Figure 19.—An area of Mustang fine sand, 0 to 1 percent slopes, occasionally flooded. These soils form on the barrier flat positions on the island and have water that is ponded on the surface for some time during the year. Geo-reference: Lat. 27 degrees 22 minutes 27.4 seconds N; Long. 97 degrees 19 minutes 51.9 seconds W. View is to the northwest.
Padre Island National Seashore, Texas 53
199—Dune land, 0 to 5 percent slopes, occasionally flooded Setting
General location: Gulf Coast barrier islands of South Texas Landscape: Barrier island Elevation: 3.0 to 50.0 feet (0.9 to 15.0 meters) Mean annual precipitation: 25 to 30 inches (635 to 762 millimeters) Mean annual air temperature: 71 to 73 degrees F (22 to 23 degrees C) Frost-free period: 310 to 350 days
Composition
Dune Land and similar soils: 95 percent Contrasting soils: 5 percent
Dissimilar Minor Components
Mustang soils
Composition: 2 percent Landform: Barrier flat on barrier islands
Panam soils
Composition: 2 percent Landform: Low dune on barrier flat on barrier islands
Malaquite soils
Composition: 1 percent Landform: Shallow depression in barrier flat on barrier islands
Composition is based on observations, descriptions, and transects of the mapunit.
Soil Description
Dune Land
Position(s) on landform(s): Dune field or back-island dune field Parent material: Deep sandy eolian sediments of Holocene age
Typical Profile
C—0 to 80 inches; fine sand
Properties and Qualities
Slope: 0 to 5 percent Depth to first restrictive layer: Not present Slowest soil permeability (K-sat) to 60 inches, above first restrictive layer: 6.0 to 20 in/hr
(rapid) Slowest soil permeability (K-sat) to 60 inches, within and below first restrictive layer: No
restrictive layer Salinity, representative within 40 inches: Not saline Salinity, maximum within 40 inches: About 1.0 mmhos/cm, not saline Sodicity, representative within 40 inches: Not sodic Sodicity, maximum within 40 inches: Sodium Adsorption Ratio (SAR) is about 1.0; not
sodic Representative total available water capacity to 60 inches: About 3.0 inches (low) Natural drainage class: Excessively drained Runoff: Negligible
54 Soil Survey of
Flooding frequency: Occasional Ponding frequency: None Seasonal high water table minimum depth: More than 72 inches
Interpretive Groups
Ecological site name: Not assigned to an ecological site Ecological site number: Not assigned to an ecological site Typical vegetation: Essentially barren, except for a few annual grasses or forbs
Note: Additional information specific to the components of this map unit is available in the “Tables” section.
Use and Management
Major land uses: Wildlife habitat and recreation
This unit consists of gently sloping active sand dunes. Most of these dunes are on the southern portion of the island, but a few remain on the northern part. Because of the prevailing southeast winds, the dunes occur as ridges that are oriented in a southeast to northwest direction. This unit is not suited to most land uses. It has the greatest potential as wildlife habitat. The unit can be stabilized by special management including picket dune fences. If moisture is available, vegetation can be established by hand planting native or adapted species. After planting, vegetation should be covered with hay or paper mulch in order to conserve moisture.
282—Madre-Malaquite complex, 0 to 1 percent slopes, occasionally flooded
Setting
General location: Gulf Coast barrier islands of South Texas (fig. 20) Landscape: Barrier island Elevation: 0.0 to 5.0 feet (0.0 to 1.5 meters) Mean annual precipitation: 25 to 35 inches (635 to 889 millimeters) Mean annual air temperature: 71 to 73 degrees F (22 to 23 degrees C) Frost-free period: 310 to 350 days
Composition
Madre and similar soils: 45 percent Malaquite and similar soils: 39 percent Contrasting soils: 16 percent
Dissimilar Minor Components
Mustang soils
Composition: 7 percent Landform: Barrier flat on barrier islands
Panam soils
Composition: 6 percent Landform: Low dune on barrier flat on barrier islands
Daggerhill soils
Composition: 3 percent Landform: Foredune or back-island dune field on barrier islands
Composition is based on observations, descriptions, and transects of the mapunit.
Padre Island National Seashore, Texas 55
Soil Description
Madre soils
Position(s) on landform(s): Nearly level barrier flat Parent material: Sandy eolian and storm washover sediments of Holocene age
Typical Profile
An—0 to 11 inches; slightly alkaline fine sand Cng—11 to 41 inches; neutral fine sand Anb—41 to 46 inches; neutral fine sand Cngb—46 to 80 inches; neutral fine sand
Note: A complete soil description with range in characteristics is included, in alphabetical order, in the "Soil Series and Morphology" section.
Properties and Qualities
Slope: 0 to 1 percent Depth to first restrictive layer: Not present Slowest soil permeability (K-sat) to 60 inches, above first restrictive layer: 0.001 to 0.06
in/hr (very slow) Slowest soil permeability (K-sat) to 60 inches, within and below first restrictive layer: No
restrictive layer Salinity, representative within 40 inches: Not saline Salinity, maximum within 40 inches: About 3.0 mmhos/cm, not saline Sodicity, representative within 40 inches: Sodic Sodicity, maximum within 40 inches: Sodium Adsorption Ratio (SAR) is about 15.9, sodic Representative total available water capacity to 60 inches: About 2.4 inches (very low) Natural drainage class: Poorly drained Runoff: Negligible Flooding frequency: Occasional Ponding frequency: Frequent Seasonal high water table minimum depth: About 0 to 6 inches
Interpretive Groups
Ecological site name: Firm Brackish Marsh Ecological site number: R150BY715TX Typical vegetation: Coastal prairie of mid grasses and forbs such as marshay cordgrass,
bushy sea-oxeye daisy, inland saltgrass, seashore dropseed, and shoregrass
Malaquite soils
Position(s) on landform(s): Shallow depression on barrier flat Parent material: Sandy eolian and storm washover sediments of Holocene age
Typical Profile
Anz—0 to 5 inches; moderately alkaline fine sand Cnzg—5 to 21 inches; strongly alkaline fine sand Anzb—21 to 27 inches; moderately alkaline fine sand Cnzgb—27 to 80 inches; moderately alkaline fine sand
Note: A complete soil description with range in characteristics is included, in alphabetical order, in the "Soil Series and Morphology" section.
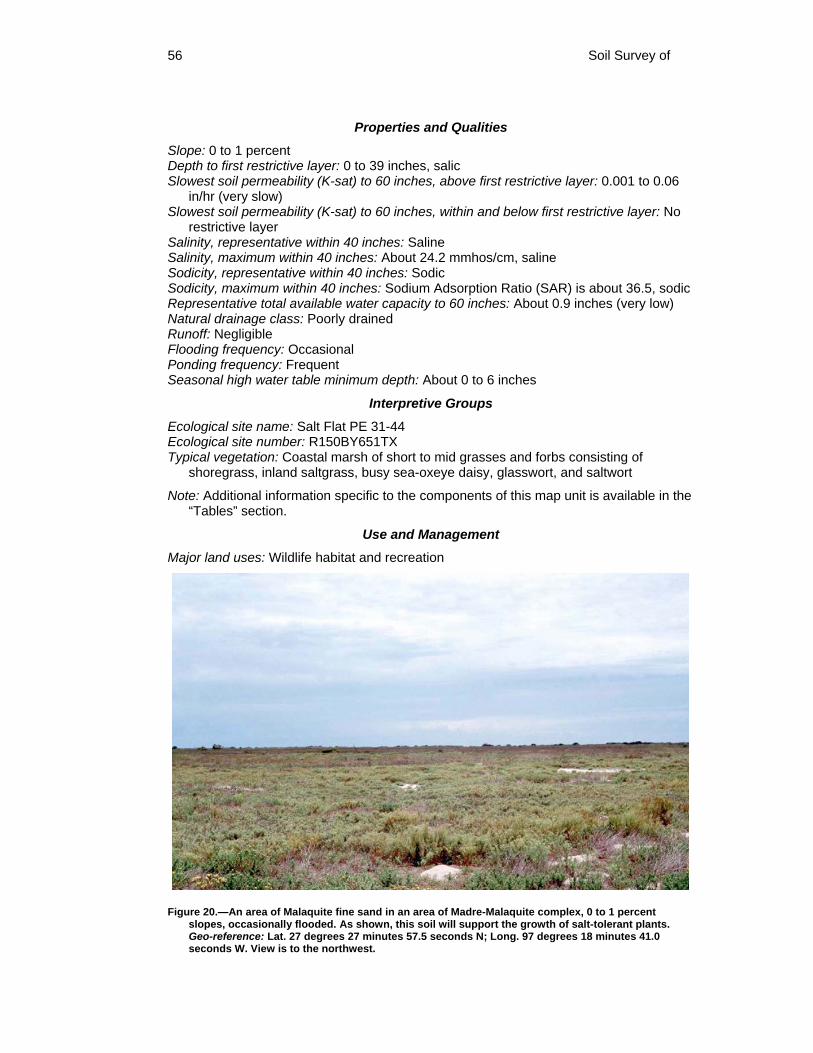
56 Soil Survey of
Properties and Qualities
Slope: 0 to 1 percent Depth to first restrictive layer: 0 to 39 inches, salic Slowest soil permeability (K-sat) to 60 inches, above first restrictive layer: 0.001 to 0.06
in/hr (very slow) Slowest soil permeability (K-sat) to 60 inches, within and below first restrictive layer: No
restrictive layer Salinity, representative within 40 inches: Saline Salinity, maximum within 40 inches: About 24.2 mmhos/cm, saline Sodicity, representative within 40 inches: Sodic Sodicity, maximum within 40 inches: Sodium Adsorption Ratio (SAR) is about 36.5, sodic Representative total available water capacity to 60 inches: About 0.9 inches (very low) Natural drainage class: Poorly drained Runoff: Negligible Flooding frequency: Occasional Ponding frequency: Frequent Seasonal high water table minimum depth: About 0 to 6 inches
Interpretive Groups
Ecological site name: Salt Flat PE 31-44 Ecological site number: R150BY651TX Typical vegetation: Coastal marsh of short to mid grasses and forbs consisting of
shoregrass, inland saltgrass, busy sea-oxeye daisy, glasswort, and saltwort
Note: Additional information specific to the components of this map unit is available in the “Tables” section.
Use and Management
Major land uses: Wildlife habitat and recreation
Figure 20.—An area of Malaquite fine sand in an area of Madre-Malaquite complex, 0 to 1 percent slopes, occasionally flooded. As shown, this soil will support the growth of salt-tolerant plants. Geo-reference: Lat. 27 degrees 27 minutes 57.5 seconds N; Long. 97 degrees 18 minutes 41.0 seconds W. View is to the northwest.
Padre Island National Seashore, Texas 57
290—Novillo peat, 0 to 1 percent slopes, ponded Setting
General location: Gulf Coast barrier islands of South Texas (fig. 21) Landscape: Barrier island Elevation: 0.0 to 3.0 feet (0.0 to 0.9 meter) Mean annual precipitation: 25 to 35 inches (635 to 889 millimeters) Mean annual air temperature: 71 to 73 degrees F (22 to 23 degrees C) Frost-free period: 310 to 350 days
Composition
Novillo and similar soils: 88 percent Contrasting soils: 12 percent
Dissimilar Minor Components
Madre soils
Composition: 7 percent Landform: Barrier flat on barrier islands
Padre soils
Composition: 3 percent Landform: Low dune on barrier flat on barrier islands
Malaquite soils
Composition: 2 percent Landform: Shallow depression in barrier flat on barrier islands
Composition is based on observations, descriptions, and transects of the mapunit.
Soil Description
Novillo soils
Position(s) on landform(s): Elongated swale on barrier flat Parent material: Sandy eolian and storm washover sediments of Holocene age
Typical Profile
Oi—0 to 2 inches; slightly acid peat A—2 to 12 inches; slightly acid fine sand Cg—12 to 80 inches; slightly acid fine sand
Note: A complete soil description with range in characteristics is included, in alphabetical order, in the "Soil Series and Morphology" section.
Properties and Qualities
Slope: 0 to 1 percent Depth to first restrictive layer: Not present Slowest soil permeability (K-sat) to 60 inches, above first restrictive layer: 0.001 to 0.06
in/hr (very slow) Slowest soil permeability (K-sat) to 60 inches, within and below first restrictive layer: No
restrictive layer Salinity, representative within 40 inches: Not saline Salinity, maximum within 40 inches: About 1.8 mmhos/cm, not saline Sodicity, representative within 40 inches: Not sodic
58 Soil Survey of
Sodicity, maximum within 40 inches: Sodium Adsorption Ratio (SAR) is about 7.7, not sodic
Representative total available water capacity to 60 inches: About 2.9 inches (very low) Natural drainage class: Very poorly drained Runoff: Negligible Flooding frequency: Occasional Ponding frequency: Frequent Seasonal high water table minimum depth: About 0 to 6 inches
Interpretive Groups
Ecological site name: Coastal Swale PE 31-44 Ecological site number: R150BY713TX Typical vegetation: Coastal fresh-water marsh swale consisting of cattails, Olney bulrush,
sedge, spikerush, and hemp sesbania
Note: Additional information specific to the components of this map unit is available in the “Tables” section.
Use and Management
Major land uses: Wildlife habitat and recreation
Figure 21.—An area of Novillo peat, 0 to 1 percent slopes, ponded. This soil formed in a fresh marsh environment. The marsh runs along the central portion of the northern third of the island. Geo-reference: Lat. 27 degrees 27 minutes 59.6 seconds N; Long. 97 degrees 17 minutes 57.5 seconds W. View is to the southwest.
Padre Island National Seashore, Texas 59
291—Mustang-Padre complex, 0 to 2 percent slopes, occasionally flooded
Setting
General location: Gulf Coast barrier islands of South Texas (fig. 22) Landscape: Barrier island Elevation: 0.0 to 10.0 feet (0.0 to 3.0 meters) Mean annual precipitation: 25 to 35 inches (635 to 889 millimeters) Mean annual air temperature: 71 to 73 degrees F (22 to 23 degrees C) Frost-free period: 310 to 350 days
Composition
Mustang and similar soils: 49 percent Padre and similar soils: 42 percent Contrasting soils: 9 percent
Dissimilar Minor Components
Greenhill soils
Composition: 6 percent Landform: Foredune or back-island dune field on barrier islands
Malaquite soils
Composition: 2 percent Landform: Shallow depression in barrier flat on barrier islands
Novillo soils
Composition: 1 percent Landform: Elongated swale on barrier flat
Composition is based on observations, descriptions, and transects of the mapunit.
Soil Description
Mustang soils
Position(s) on landform(s): Barrier flat Parent material: Sandy eolian and storm washover sediments of Holocene age
Typical Profile
A—0 to 19 inches; neutral fine sand Cg—19 to 80 inches; neutral fine sand
Note: A complete soil description with range in characteristics is included, in alphabetical order, in the "Soil Series and Morphology" section.
Properties and Qualities
Slope: 0 to 1 percent Depth to first restrictive layer: Not present Slowest soil permeability (K-sat) to 60 inches, above first restrictive layer: 0.001 to 0.06
in/hr (very slow) Slowest soil permeability (K-sat) to 60 inches, within and below first restrictive layer: No
restrictive layer Salinity, representative within 40 inches: Not saline Salinity, maximum within 40 inches: About 0.8 mmhos/cm, not saline
60 Soil Survey of
Figure 22.—An area of Mustang-Padre complex, 0 to 2 percent slopes, occasionally flooded. Padre soils form on the higher mounded areas, while the Mustang soils form on the lower barrier flat position. The mounded areas are low, stabilized dunes. Geo-reference: Lat. 27 degrees 25 minutes 53.2 seconds N; Long. 97 degreees 18 minutes 05.0 seconds W. View is to the west.
Sodicity, representative within 40 inches: Not sodic Sodicity, maximum within 40 inches: Sodium Adsorption Ratio (SAR) is about 2.5, not
sodic Representative total available water capacity to 60 inches: About 2.4 inches (very low) Natural drainage class: Poorly drained Runoff: Negligible Flooding frequency: Occasional Ponding frequency: Frequent Seasonal high water table minimum depth: About 0 to 6 inches
Interpretive Groups
Ecological site name: Low Coastal Sand PE 31-44 Ecological site number: R150BY650TX Typical vegetation: Coastal prairie of mid to tall grasses such as marshay cordgrass,
sedge, gulfdune paspalum, bushy bluestem, and Scribner panicum
Padre soils
Position(s) on landform(s): Low dune on barrier flat Parent material: Sandy eolian and storm washover sediments of Holocene age
Typical Profile
A—0 to 19 inches; moderately acid fine sand C—19 to 28 inches; moderately acid fine sand Cg—28 to 80 inches; moderately acid fine sand
Note: A complete soil description with range in characteristics is included, in alphabetical order, in the "Soil Series and Morphology" section.
Padre Island National Seashore, Texas 61
Properties and Qualities
Slope: 0 to 2 percent Depth to first restrictive layer: Not present Slowest soil permeability (K-sat) to 60 inches, above first restrictive layer: 0.001 to 0.06
in/hr (very slow) Slowest soil permeability (K-sat) to 60 inches, within and below first restrictive layer: No
restrictive layer Salinity, representative within 40 inches: Not saline Salinity, maximum within 40 inches: About 0.2 mmhos/cm, not saline Sodicity, representative within 40 inches: Not sodic Sodicity, maximum within 40 inches: Sodium Adsorption Ratio (SAR) is about 2.2, not
sodic Representative total available water capacity to 60 inches: About 4.8 inches (low) Natural drainage class: Somewhat poorly drained Runoff: Negligible Flooding frequency: Occasional Ponding frequency: None Seasonal high water table minimum depth: About 30 to 48 inches
Interpretive Groups
Ecological site name: Coastal Sand PE 31-44 Ecological site number: R150BY648TX Typical vegetation: Coastal prairie of mid to tall grasses such as seacoast bluestem,
gulfdune paspalum, brownseed paspalum, false indigo, and partridge pea
Note: Additional information specific to the components of this map unit is available in the “Tables” section.
Use and Management
Major land uses: Wildlife habitat and recreation
491—Mustang-Panam complex, 0 to 2 percent slopes, occasionally flooded
Setting
General location: Gulf Coast barrier islands of South Texas Landscape: Barrier island Elevation: 0.0 to 10.0 feet (0.0 to 3.0 meters) Mean annual precipitation: 25 to 35 inches (635 to 889 millimeters) Mean annual air temperature: 71 to 73 degrees F (22 to 23 degrees C) Frost-free period: 310 to 350 days
Composition
Mustang and similar soils: 50 percent Panam and similar soils: 40 percent Contrasting soils: 10 percent
Dissimilar Minor Components
Daggerhill soils
Composition: 5 percent Landform: Foredune or back-island dune field on barrier island
62 Soil Survey of
Malaquite soils
Composition: 3 percent Landform: Shallow depression in barrier flat on barrier island
Satatton soils
Composition: 2 percent Landform: Wind-tidal flat on barrier island, deflation flat on barrier island
Composition is based on observations, descriptions, and transects of the mapunit.
Soil Description
Mustang soils
Position(s) on landform(s): Barrier flat Parent material: Sandy eolian and storm washover sediments of Holocene age
Typical Profile
A—0 to 11 inches; strongly alkaline fine sand Cg—11 to 80 inches; strongly alkaline fine sand
Note: A complete soil description with range in characteristics is included, in alphabetical order, in the "Soil Series and Morphology" section.
Properties and Qualities
Slope: 0 to 1 percent Depth to first restrictive layer: Not present Slowest soil permeability (K-sat) to 60 inches, above first restrictive layer: 0.001 to 0.06
in/hr (very slow) Slowest soil permeability (K-sat) to 60 inches, within and below first restrictive layer: No
restrictive layer Salinity, representative within 40 inches: Not saline Salinity, maximum within 40 inches: About 2.1 mmhos/cm, not saline Sodicity, representative within 40 inches: Not sodic Sodicity, maximum within 40 inches: Sodium Adsorption Ratio (SAR) is about 7.0, not
sodic Representative total available water capacity to 60 inches: About 2.4 inches (very low) Natural drainage class: Poorly drained Runoff: Negligible Flooding frequency: Occasional Ponding frequency: Frequent Seasonal high water table minimum depth: About 0 to 6 inches
Interpretive Groups
Ecological site name: Low Coastal Sand PE 31-44 Ecological site number: R150BY650TX Typical vegetation: Coastal prairie of mid to tall grasses such as marshay cordgrass,
sedge, gulfdune paspalum, bushy bluestem, and Scribner panicum.
Panam soils
Position(s) on landform(s): Low dune on barrier flat Parent material: Sandy eolian and storm washover sediments of Holocene age
Typical Profile
A—0 to 9 inches; slightly alkaline fine sand
Padre Island National Seashore, Texas 63
C—9 to 38 inches; strongly alkaline fine sand Cg—38 to 80 inches; strongly alkaline fine sand
Note: A complete soil description with range in characteristics is included, in alphabetical order, in the "Soil Series and Morphology" section.
Properties and Qualities
Slope: 0 to 2 percent Depth to first restrictive layer: Not present Slowest soil permeability (K-sat) to 60 inches, above first restrictive layer: 0.001 to 0.06
in/hr (very slow) Slowest soil permeability (K-sat) to 60 inches, within and below first restrictive layer: No
restrictive layer Salinity, representative within 40 inches: Not saline Salinity, maximum within 40 inches: About 1.0 mmhos/cm, not saline Sodicity, representative within 40 inches: Not sodic Sodicity, maximum within 40 inches: Sodium Adsorption Ratio (SAR) is about 2.9, not
sodic Representative total available water capacity to 60 inches: About 4.8 inches (low) Natural drainage class: Somewhat poorly drained Runoff: Negligible Flooding frequency: Occasional Ponding frequency: None Seasonal high water table minimum depth: About 30 to 48 inches
Interpretive Groups
Ecological site name: Coastal Sand PE 31-44 Ecological site number: R150BY648TX Typical vegetation: Coastal prairie of mid to tall grasses such as seacoast bluestem,
gulfdune paspalum, brownseed paspalum, false indigo, and partridge pea
Note: Additional information specific to the components of this map unit is available in the “Tables” section.
Use and Management
Major land uses: Wildlife habitat and recreation
Included are areas of soils very similar to the Mustang and Panam soils that have gravelly subsoils. These gravels consist of sand- and gravel-sized seashell and seashell fragments throughout the subsoil. The gravel-sized fragments reduce the available water holding capacity. This lower available moisture is reflected in a reduced vegetative cover. The vegetation generally consists of species such as prickly pear, seaoats uniola, and gulfdune paspalum which are more associated with well-drained soils.
891—Madre-Panam complex, 0 to 2 percent slopes, occasionally flooded
Setting
General location: Gulf Coast barrier islands of South Texas Landscape: Barrier island Elevation: 0.0 to 10.0 feet (0.0 to 3.0 meters) Mean annual precipitation: 25 to 35 inches (635 to 889 millimeters) Mean annual air temperature: 71 to 73 degrees F (22 to 23 degrees C) Frost-free period: 310 to 350 days
64 Soil Survey of
Composition
Madre and similar soils: 48 percent Panam and similar soils: 43 percent Contrasting soils: 9 percent
Dissimilar Minor Components
Daggerhill soils
Composition: 5 percent Landform: Foredune or back-island dune field on barrier island
Malaquite soils
Composition: 4 percent Landform: Shallow depression in barrier flat on barrier island
Also included are areas with soils similar to Madre and Panam, but the soils have few to many gravel-sized seashell fragments throughout. These soils have a lower available water-holding capacity than the Madre and Panam soils.
Composition is based on observations, descriptions, and transects of the mapunit.
Soil Description
Madre soils
Position(s) on landform(s): Nearly level barrier flat Parent material: Sandy eolian and storm washover sediments of Holocene age
Typical Profile
An—0 to 8 inches; slightly alkaline fine sand Cng—8 to 80 inches; neutral fine sand
Note: A complete soil description with range in characteristics is included, in alphabetical order, in the "Soil Series and Morphology" section.
Properties and Qualities
Slope: 0 to 1 percent Depth to first restrictive layer: Not present Slowest soil permeability (K-sat) to 60 inches, above first restrictive layer: 0.001 to 0.06
in/hr (very slow) Slowest soil permeability (K-sat) to 60 inches, within and below first restrictive layer: No
restrictive layer Salinity, representative within 40 inches: Not saline Salinity, maximum within 40 inches: About 3.0 mmhos/cm, not saline Sodicity, representative within 40 inches: Sodic Sodicity, maximum within 40 inches: Sodium Adsorption Ratio (SAR) is about 15.9, sodic Representative total available water capacity to 60 inches: About 2.4 inches (very low) Natural drainage class: Poorly drained Runoff: Negligible Flooding frequency: Occasional Ponding frequency: Frequent Seasonal high water table minimum depth: About 0 to 6 inches
Interpretive Groups
Ecological site name: Firm Brackish Marsh Ecological site number: R150BY715TX
Padre Island National Seashore, Texas 65
Typical vegetation: Coastal prairie of mid grasses and forbs such as marshay cordgrass, bushy sea-oxeye daisy, inland saltgrass, seashore dropseed, and shoregrass
Panam soils
Position(s) on landform(s): Low dune on barrier flat Parent material: Sandy eolian and storm washover sediments of Holocene age
Typical Profile
A—0 to 23 inches; slightly alkaline fine sand C—23 to 38 inches; slightly alkaline fine sand Cg—38 to 80 inches; slightly alkaline fine sand
Note: A complete soil description with range in characteristics is included, in alphabetical order, in the "Soil Series and Morphology" section.
Properties and Qualities
Slope: 0 to 2 percent Depth to first restrictive layer: Not present Slowest soil permeability (K-sat) to 60 inches, above first restrictive layer: 0.001 to 0.06
in/hr (very slow) Slowest soil permeability (K-sat) to 60 inches, within and below first restrictive layer: No
restrictive layer Salinity, representative within 40 inches: Not saline Salinity, maximum within 40 inches: About 1.1 mmhos/cm, not saline Sodicity, representative within 40 inches: Not sodic Sodicity, maximum within 40 inches: Sodium Adsorption Ratio (SAR) is about 5.4, not
sodic Representative total available water capacity to 60 inches: About 4.8 inches (low) Natural drainage class: Somewhat poorly drained Runoff: Negligible Flooding frequency: Occasional Ponding frequency: None Seasonal high water table minimum depth: About 30 to 48 inches
Interpretive Groups
Ecological site name: Coastal Sand PE 31-44 Ecological site number: R150BY648TX Typical vegetation: Coastal prairie of mid to tall grasses such as seacoast bluestem,
gulfdune paspalum, brownseed paspalum, false indigo, and partridge pea
Note: Additional information specific to the components of this map unit is available in the “Tables” section.
Use and Management
Major land uses: Wildlife habitat and recreation
Included are areas of soils very similar to the Madre and Panam soils that have gravelly subsoils. These gravels consist of sand- and gravel-sized seashell and seashell fragments throughout the subsoil. The gravel-sized fragments reduce the available water holding capacity. This lower available moisture is reflected in a reduced vegetative cover. The vegetation generally consists of species such as prickly pear, seaoats uniola, and gulfdune paspalum which are more associated with well-drained soils.
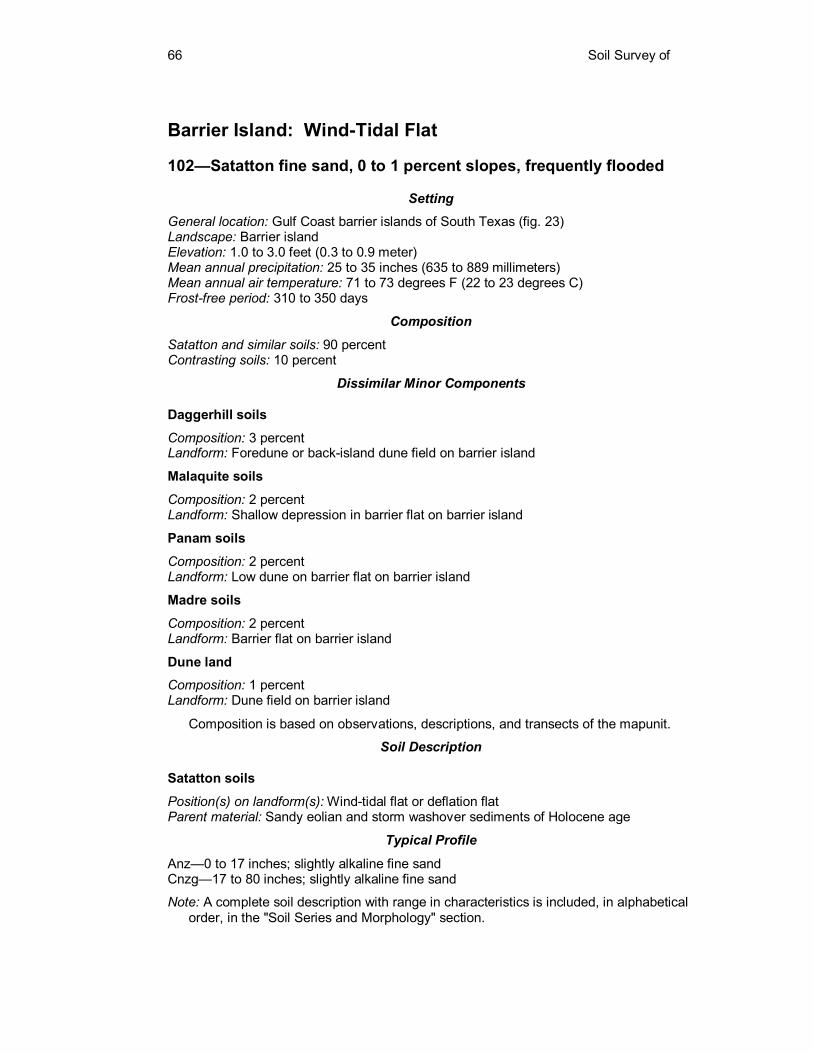
66 Soil Survey of
Barrier Island: Wind-Tidal Flat
102—Satatton fine sand, 0 to 1 percent slopes, frequently flooded
Setting
General location: Gulf Coast barrier islands of South Texas (fig. 23) Landscape: Barrier island Elevation: 1.0 to 3.0 feet (0.3 to 0.9 meter) Mean annual precipitation: 25 to 35 inches (635 to 889 millimeters) Mean annual air temperature: 71 to 73 degrees F (22 to 23 degrees C) Frost-free period: 310 to 350 days
Composition
Satatton and similar soils: 90 percent Contrasting soils: 10 percent
Dissimilar Minor Components
Daggerhill soils
Composition: 3 percent Landform: Foredune or back-island dune field on barrier island
Malaquite soils
Composition: 2 percent Landform: Shallow depression in barrier flat on barrier island
Panam soils
Composition: 2 percent Landform: Low dune on barrier flat on barrier island
Madre soils
Composition: 2 percent Landform: Barrier flat on barrier island
Dune land Composition: 1 percent Landform: Dune field on barrier island
Composition is based on observations, descriptions, and transects of the mapunit.
Soil Description
Satatton soils
Position(s) on landform(s): Wind-tidal flat or deflation flat Parent material: Sandy eolian and storm washover sediments of Holocene age
Typical Profile
Anz—0 to 17 inches; slightly alkaline fine sand Cnzg—17 to 80 inches; slightly alkaline fine sand
Note: A complete soil description with range in characteristics is included, in alphabetical order, in the "Soil Series and Morphology" section.
Padre Island National Seashore, Texas 67
Properties and Qualities
Slope: 0 to 1 percent Depth to first restrictive layer: 0 to 10 inches, salic Slowest soil permeability (K-sat) to 60 inches, above first restrictive layer: 0.001 to 0.06
in/hr (very slow) Slowest soil permeability (K-sat) to 60 inches, within and below first restrictive layer: No
restrictive layer Salinity, representative within 40 inches: Saline Salinity, maximum within 40 inches: About 150.0 mmhos/cm, saline Sodicity, representative within 40 inches: Sodic Sodicity, maximum within 40 inches: Sodium Adsorption Ratio (SAR) is about 104.0,
sodic Representative total available water capacity to 60 inches: About 0.0 inches (very low) Natural drainage class: Poorly drained Runoff: Negligible Flooding frequency: Frequent Ponding frequency: None Seasonal high water table minimum depth: About 0 to 18 inches
Interpretive Groups
Ecological site name: Wind Tidal Flat Ecological site number: R150BY716TX Typical vegetation: Wind-tidal flat that is essentially barren of vegetation, other than
scattered Salicornia species. A thin benthic, blue-green algal mat consisting of Cyanobacteria occurs on the surface.
Note: Additional information specific to the components of this map unit is available in the “Tables” section.
Use and Management
Major land uses: Wildlife habitat and recreation
Figure 23.—An area of Sattaton fine sand, 0 to 1 percent slopes, frequently flooded. This photograph shows an extensive area of wind-tidal flats on the island. Geo-reference: Lat. 26 degrees 56 minutes 50.5 seconds N; Long. 97 degrees 24 minutes 48.5 seconds W. View is to the northeast.
68 Soil Survey of
103—Tatton fine sand, 0 to 1 percent slopes, very frequently flooded Setting
General location: Gulf Coast barrier islands of South Texas Landscape: Barrier island, Lagoon Elevation: 0.0 to 1.0 feet (0.0 to 0.3 meters) Mean annual precipitation: 25 to 35 inches (635 to 889 millimeters) Mean annual air temperature: 71 to 73 degrees F (22 to 23 degrees C) Frost-free period: 310 to 350 days
Composition
Tatton and similar soils: 95 percent Contrasting soils: 5 percent
Dissimilar Minor Components
Twinpalms soils
Composition: 3 percent Landform: Mound on dredge spoil bank
Panam soils
Composition: 2 percent Landform: Low dune on barrier flat on barrier island
Composition is based on observations, descriptions, and transects of the mapunit.
Soil Description
Tatton soils
Position(s) on landform(s): Wind-tidal flat Parent material: Sandy eolian and storm washover sediments of Holocene age
Typical Profile
Anz—0 to 4 inches; moderately alkaline loamy sand Anzg—4 to 12 inches; slightly alkaline loamy fine sand Cnzg—12 to 80 inches; slightly alkaline loamy fine sand
Note: A complete soil description with range in characteristics is included, in alphabetical order, in the "Soil Series and Morphology" section.
Properties and Qualities
Slope: 0 to 1 percent Depth to first restrictive layer: 0 to 10 inches, salic Slowest soil permeability (K-sat) to 60 inches, above first restrictive layer: 0.001 to 0.06
in/hr (very slow) Slowest soil permeability (K-sat) to 60 inches, within and below first restrictive layer: No
restrictive layer Salinity, representative within 40 inches: Saline Salinity, maximum within 40 inches: About 150.0 mmhos/cm, saline Sodicity, representative within 40 inches: Sodic Sodicity, maximum within 40 inches: Sodium Adsorption Ratio (SAR) is about 104.0,
sodic Representative total available water capacity to 60 inches: About 0.0 inches (very low) Natural drainage class: Very poorly drained Runoff: Negligible

Padre Island National Seashore, Texas 69
Flooding frequency: Very frequent Ponding frequency: None Seasonal high water table minimum depth: About 0 to 9 inches
Interpretive Groups
Ecological site name: Wind Tidal Flat Ecological site number: R150BY716TX Typical vegetation: Wind-tidal flat that is essentially barren of vegetation, other than
scattered Salicornia species. A thin benthic, blue-green algal mat consisting of Cyanobacteria occurs on the surface.
Note: Additional information specific to the components of this map unit is available in the “Tables” section.
Use and Management
Major land uses: Wildlife habitat and recreation
402—Tatton-Beaches, washover fan association, 0 to 1 percent slopes, very frequently flooded
Setting
General location: Gulf Coast barrier islands of South Texas Landscape: Barrier island Elevation: 0.0 to 3.0 feet (0.0 to 0.9 meter) Mean annual precipitation: 25 to 35 inches (635 to 889 millimeters) Mean annual air temperature: 71 to 73 degrees F (22 to 23 degrees C) Frost-free period: 310 to 350 days
Composition
Tatton and similar soils: 55 percent Beaches, washover fan and similar soils: 35 percent Contrasting soils: 10 percent
Dissimilar Minor Components
Daggerhill soils
Composition: 4 percent Landform: Foredune or back-island dune field on barrier island
Panam soils
Composition: 3 percent Landform: Low dune on barrier flat on barrier island
Dune land
Composition: 3 percent Landform: Dune field on barrier island
Composition is based on observations, descriptions, and transects of the mapunit.
Soil Description
Tatton soils
Position(s) on landform(s): Deflation flat or wind-tidal flat Parent material: Sandy eolian and storm washover sediments of Holocene age
70 Soil Survey of
Typical Profile
Anzg—0 to 11 inches; neutral fine sand Cnzg—11 to 80 inches; neutral loamy sand
Note: A complete soil description with range in characteristics is included, in alphabetical order, in the "Soil Series and Morphology" section.
Properties and Qualities
Slope: 0 to 1 percent Depth to first restrictive layer: 0 to 10 inches, salic Slowest soil permeability (K-sat) to 60 inches, above first restrictive layer: 0.001 to 0.06
in/hr (very slow) Slowest soil permeability (K-sat) to 60 inches, within and below first restrictive layer: No
restrictive layer Salinity, representative within 40 inches: Saline Salinity, maximum within 40 inches: About 96.0 mmhos/cm, saline Sodicity, representative within 40 inches: Sodic Sodicity, maximum within 40 inches: Sodium Adsorption Ratio (SAR) is about 72.0, sodic Representative total available water capacity to 60 inches: About 0.0 inches (very low) Natural drainage class: Very poorly drained Runoff: Negligible Flooding frequency: Very frequent Ponding frequency: None Seasonal high water table minimum depth: About 0 to 9 inches
Interpretive Groups
Ecological site name: Wind Tidal Flat Ecological site number: R150BY716TX Typical vegetation: Wind-tidal flat that is essentially barren of vegetation, other than
scattered Salicornia species. A thin benthic, blue-green algal mat consisting of Cyanobacteria occurs on the surface.
Beaches, Washover Fan
Position(s) on landform(s): Washover fan Parent material: Sandy eolian and (primarily) storm washover sediments of Holocene age
Typical Profile
C—0 to 7 inches; gravelly fine sand Cg—7 to 80 inches; stratified gravel to fine sand
Properties and Qualities
Slope: 0 to 1 percent Depth to first restrictive layer: Not present Slowest soil permeability (K-sat) to 60 inches, above first restrictive layer: 0.001 to 0.06
in/hr (very slow) Slowest soil permeability (K-sat) to 60 inches, within and below first restrictive layer: No
restrictive layer Salinity, representative within 40 inches: Saline Salinity, maximum within 40 inches: About 71.0 mmhos/cm, saline Sodicity, representative within 40 inches: Sodic Sodicity, maximum within 40 inches: Sodium Adsorption Ratio (SAR) is about 64.0, sodic Representative total available water capacity to 60 inches: About 4.2 inches (low) Natural drainage class: Very poorly drained Runoff: Negligible
Padre Island National Seashore, Texas 71
Flooding frequency: Very frequent Ponding frequency: Frequent Seasonal high water table minimum depth: About 0 to 9 inches
Interpretive Groups
Ecological site name: Not assigned to an ecological site Ecological site number: Not assigned to an ecological site Typical vegetation: Essentially barren, except for a few annual grasses or forbs
Note: Additional information specific to the components of this map unit is available in the “Tables” section.
Use and Management
Major land uses: Wildlife habitat and recreation
This map unit is on the southern portion of the island from approximately the 33-mile marker to the Port Mansfield Jetties in Willacy County. This unit consists partially of washover fans. Washover fans and channels are caused by abnormally high tides associated with strong tropical storms. The storms cut through the beach and sometimes the foredune to form guts that cut through the fore-island to the barrier flat or wind-tidal flats. The cuts on the beach and foredunes gradually fill back in through normal shoreline erosion and sediment creep. Those cuts further towards the barrier flat take several years to heal, because they must be reworked by wind alone. Often, these washover channels and fans are re-opened by another storm before they have time to heal. These areas are essentially barren of vegetation. This unit is not suited to most land uses. It has the greatest potential as wildlife habitat.
Lagoon: Spoil Island
95BD—Twinpalms-Yarborough complex, 0 to 3 percent slopes, frequently flooded
Setting
General location: Gulf Coast spoil islands of South Texas (fig. 24) Landscape: Lagoon Elevation: 0.0 to 10.0 feet (0.0 to 3.0 meters) Mean annual precipitation: 25 to 35 inches (635 to 889 millimeters) Mean annual air temperature: 71 to 73 degrees F (22 to 23 degrees C) Frost-free period: 310 to 350 days
Composition
Twinpalms and similar soils: 55 percent Yarborough and similar soils: 45 percent Contrasting soils: None
Composition is based on observations, descriptions, and transects of the mapunit.
Soil Description
Twinpalms
Position(s) on landform(s): Mound on dredge spoil bank Parent material: Sandy dredge spoils and/or loamy dredge spoils
Typical Profile
A—0 to 18 inches; slightly alkaline fine sand
72 Soil Survey of
C—18 to 30 inches; slightly alkaline fine sandy loam Cg—30 to 80 inches; slightly alkaline gravelly fine sand
Note: A complete soil description with range in characteristics is included, in alphabetical order, in the "Soil Series and Morphology" section.
Properties and Qualities
Slope: 1 to 3 percent Percent of area covered by surface fragments: About 0 percent (shape or size
unspecified) Depth to first restrictive layer: Not present Slowest soil permeability (K-sat) to 60 inches, above first restrictive layer: 0.6 to 2.0 in/hr
(moderate) Slowest soil permeability (K-sat) to 60 inches, within and below first restrictive layer: No
restrictive layer Salinity, representative within 40 inches: Not saline Salinity, maximum within 40 inches: About 1.0 mmhos/cm; not saline Sodicity, representative within 40 inches: Not sodic Sodicity, maximum within 40 inches: Adsorption Ratio is about 1.0; not sodic Representative total available water capacity to 60 inches: About 2.4 inches (very low) Natural drainage class: Somewhat poorly drained Runoff: Low Flooding frequency: Frequent Ponding frequency: None Seasonal high water table minimum depth: About 30 to 60 inches
Interpretive Groups
Ecological site name: Coastal Sand PE 31-44 Ecological site number: R150BY648TX Typical vegetation: Coastal prairie of mid to tall grasses such as seacoast bluestem,
gulfdune paspalum, brownseed paspalum, Wright threeawn, and annual ragweed
Yarborough soils
Position(s) on landform(s): Flats and concave areas on dredge spoil bank Parent material: Sandy dredge spoils and/or loamy dredge spoils
Typical Profile
Anz—0 to 7 inches; slightly alkaline fine sandy loam Cnzg—7 to 80 inches; moderately alkaline fine sandy loam
Note: A complete soil description with range in characteristics is included, in alphabetical order, in the "Soil Series and Morphology" section.
Properties and Qualities
Slope: 0 to 1 percent Percent of area covered by surface fragments: About 8 percent rounded channers Depth to first restrictive layer: 0 to 30 inches, salic Slowest soil permeability (K-sat) to 60 inches, above first restrictive layer: 0.001 to 0.06
in/hr (very slow) Slowest soil permeability (K-sat) to 60 inches, within and below first restrictive layer: No
restrictive layer Salinity, representative within 40 inches: Saline Salinity, maximum within 40 inches: About 57.0 mmhos/cm; saline Sodicity, representative within 40 inches: Sodic Sodicity, maximum within 40 inches: Sodium Adsorption Ratio (SAR) is about 51.0; sodic
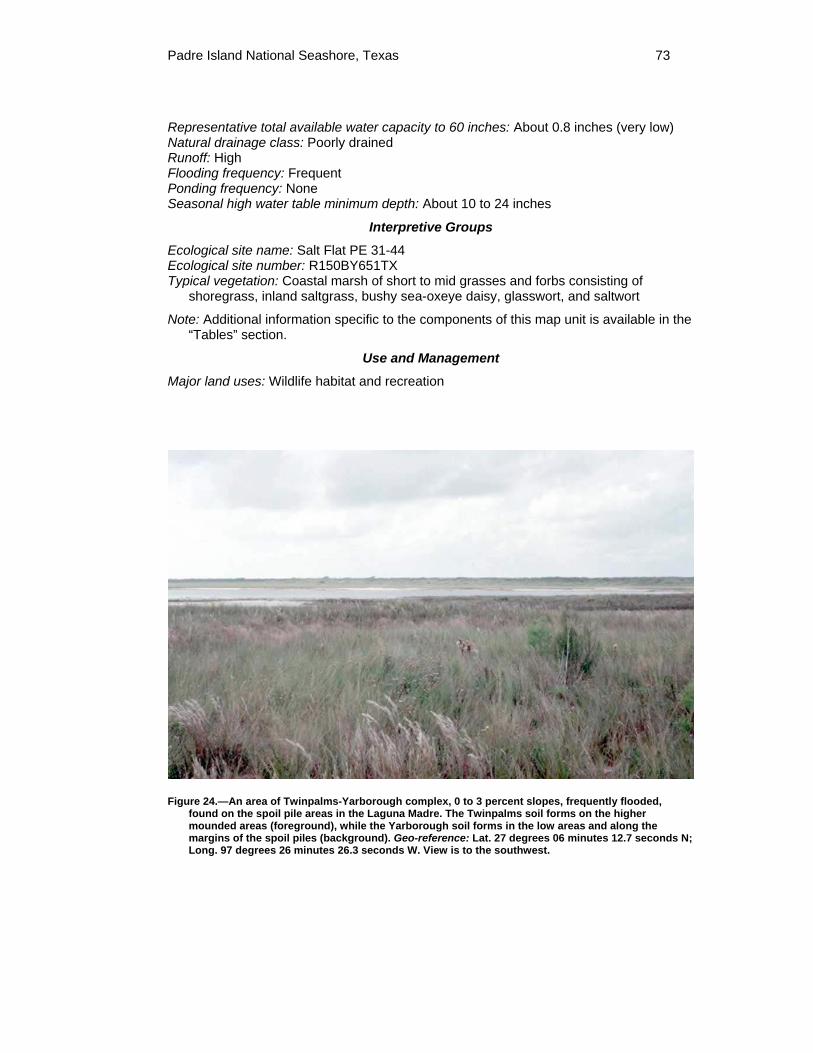
Padre Island National Seashore, Texas 73
Representative total available water capacity to 60 inches: About 0.8 inches (very low) Natural drainage class: Poorly drained Runoff: High Flooding frequency: Frequent Ponding frequency: None Seasonal high water table minimum depth: About 10 to 24 inches
Interpretive Groups
Ecological site name: Salt Flat PE 31-44 Ecological site number: R150BY651TX Typical vegetation: Coastal marsh of short to mid grasses and forbs consisting of
shoregrass, inland saltgrass, bushy sea-oxeye daisy, glasswort, and saltwort
Note: Additional information specific to the components of this map unit is available in the “Tables” section.
Use and Management
Major land uses: Wildlife habitat and recreation
Figure 24.—An area of Twinpalms-Yarborough complex, 0 to 3 percent slopes, frequently flooded, found on the spoil pile areas in the Laguna Madre. The Twinpalms soil forms on the higher mounded areas (foreground), while the Yarborough soil forms in the low areas and along the margins of the spoil piles (background). Geo-reference: Lat. 27 degrees 06 minutes 12.7 seconds N; Long. 97 degrees 26 minutes 26.3 seconds W. View is to the southwest.
74 Soil Survey of
982—Yarborough fine sandy loam, 0 to 1 percent slopes, very frequently flooded
Setting
General location: Gulf Coast spoil islands of South Texas Landscape: Lagoon Elevation: 0.0 to 4.0 feet (0.0 to 1.2 meters) Mean annual precipitation: 25 to 35 inches (635 to 889 millimeters) Mean annual air temperature: 71 to 73 degrees F (22 to 23 degrees C) Frost-free period: 310 to 350 days
Composition
Yarborough and similar soils: 90 percent Contrasting soils: 10 percent
Dissimilar Minor Components
Twinpalms soils
Composition: 10 percent Landform: Mound on dredge spoil bank
Composition is based on observations, descriptions, and transects of the mapunit.
Soil Description
Yarborough soils
Position(s) on landform(s): Flats and concave areas on dredge spoil bank Parent material: Sandy dredge spoils and/or loamy dredge spoils
Typical Profile
Anz—0 to 8 inches; slightly alkaline fine sandy loam Cnzg—8 to 80 inches; moderately alkaline fine sandy loam
Note: A complete soil description with range in characteristics is included, in alphabetical order, in the "Soil Series and Morphology" section.
Properties and Qualities
Slope: 0 to 1 percent Percent of area covered by surface fragments: About 8 percent rounded channers Depth to first restrictive layer: 0 to 30 inches, salic Slowest soil permeability (K-sat) to 60 inches, above first restrictive layer: 0.001 to 0.06
in/hr (very slow) Slowest soil permeability (K-sat) to 60 inches, within and below first restrictive layer: No
restrictive layer Salinity, representative within 40 inches: Saline Salinity, maximum within 40 inches: About 57.0 mmhos/cm, saline Sodicity, representative within 40 inches: Sodic Sodicity, maximum within 40 inches: Sodium Adsorption Ratio (SAR) is about 51.0, sodic Representative total available water capacity to 60 inches: About 0.8 inches (very low) Natural drainage class: Poorly drained Runoff: High Flooding frequency: Very frequent Ponding frequency: None Seasonal high water table minimum depth: About 10 to 24 inches
Padre Island National Seashore, Texas 75
Interpretive Groups
Ecological site name: Salt Flat PE 31-44 Ecological site number: R150BY651TX Typical vegetation: Coastal marsh of short to mid grasses and forbs consisting of
shoregrass, inland saltgrass, busy sea-oxeye daisy, glasswort, and saltwort
Note: Additional information specific to the components of this map unit is available in the “Tables” section.
Use and Management
Major land uses: Wildlife habitat and recreation
Lagoon: Lagoon Bottom
GF—Baffin soils, submerged
Setting
General location: Gulf Coast barrier islands of South Texas (fig. 25) Landscape: Lagoon Elevation: -5.0 to 0.0 feet (-1.5 to 0.0 meters); permanently submersed Mean annual precipitation: 25 to 35 inches (635 to 889 millimeters) Mean annual air temperature: 71 to 73 degrees F (22 to 23 degrees C) Frost-free period: 310 to 350 days
Composition
Baffin and similar soils: 95 percent Contrasting soils: 5 percent
Dissimilar Minor Components
Tatton soils
Composition: 5 percent Landform: Wind-tidal flat on barrier island or Lagoon
Composition is based on observations, descriptions, and transects of the mapunit.
Soil Description
Baffin soils
Position(s) on landform(s): Lagoon bottom Parent material: Sandy lagoonal deposits and/or loamy lagoonal deposits
Typical Profile
Ag1—0 to 2 inches; slightly alkaline sandy clay loam Ag2—2 to 8 inches; slightly alkaline fine sandy loam Cg—8 to 80 inches; slightly alkaline fine sandy loam
Note: A complete soil description with range in characteristics is included, in alphabetical order, in the "Soil Series and Morphology" section.
Properties and Qualities
Slope: 0 to 0 percent Depth to first restrictive layer: 0 to 10 inches, salic
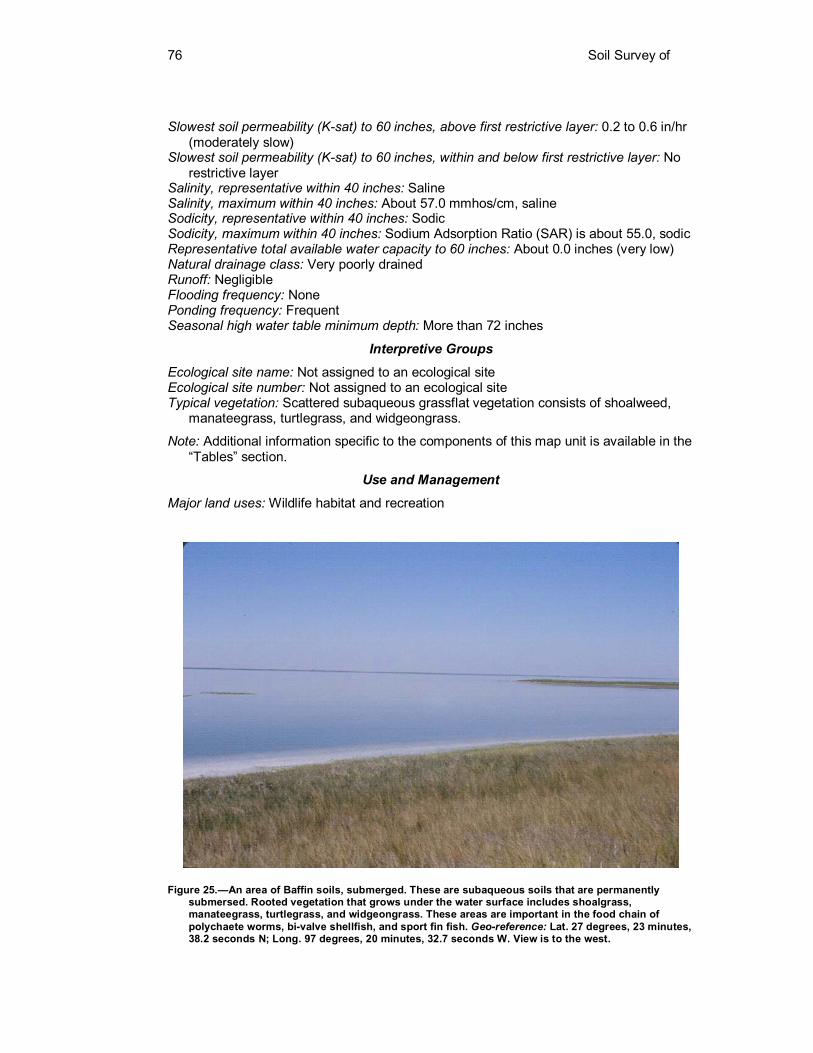
76 Soil Survey of
Slowest soil permeability (K-sat) to 60 inches, above first restrictive layer: 0.2 to 0.6 in/hr (moderately slow)
Slowest soil permeability (K-sat) to 60 inches, within and below first restrictive layer: No restrictive layer
Salinity, representative within 40 inches: Saline Salinity, maximum within 40 inches: About 57.0 mmhos/cm, saline Sodicity, representative within 40 inches: Sodic Sodicity, maximum within 40 inches: Sodium Adsorption Ratio (SAR) is about 55.0, sodic Representative total available water capacity to 60 inches: About 0.0 inches (very low) Natural drainage class: Very poorly drained Runoff: Negligible Flooding frequency: None Ponding frequency: Frequent Seasonal high water table minimum depth: More than 72 inches
Interpretive Groups
Ecological site name: Not assigned to an ecological site Ecological site number: Not assigned to an ecological site Typical vegetation: Scattered subaqueous grassflat vegetation consists of shoalweed,
manateegrass, turtlegrass, and widgeongrass.
Note: Additional information specific to the components of this map unit is available in the “Tables” section.
Use and Management
Major land uses: Wildlife habitat and recreation
Figure 25.—An area of Baffin soils, submerged. These are subaqueous soils that are permanently submersed. Rooted vegetation that grows under the water surface includes shoalgrass, manateegrass, turtlegrass, and widgeongrass. These areas are important in the food chain of polychaete worms, bi-valve shellfish, and sport fin fish. Geo-reference: Lat. 27 degrees, 23 minutes, 38.2 seconds N; Long. 97 degrees, 20 minutes, 32.7 seconds W. View is to the west.
Padre Island National Seashore, Texas 77
W—Water
Setting
General location: Water areas surrounding the Gulf Coast barrier islands of South Texas Mean annual precipitation: 25 to 35 inches (635 to 889 millimeters) Mean annual air temperature: 71 to 73 degrees F (22 to 23 degrees C)
Composition
Water: 100 percent Contrasting soils: None
Composition is based on observations, descriptions, and transects of the mapunit.
Note: Additional information specific to the components of this map unit is available in the “Tables” section.
Use and Management
Major land uses: Wildlife habitat and recreation
This map unit consists of the water areas adjacent to Padre Island National Seashore. These are salt water areas consisting of dredged channels in the Laguna Madre, areas of water greater than 4 feet deep in the Laguna Madre and Baffin Bay, the Port Mansfield Channel, and the Gulf of Mexico. While the Laguna Madre and Baffin Bay are affected only slightly by high tides, sea level can vary daily due to tidal fluctuation. During periods of extreme high tides or tropical storms, sea level can cover the beaches and reach the foredune ridge, and it can make the Laguna Madre and Baffin Bay levels higher also. Almost all of the water areas are used for recreation, such as fishing and participation in water sports.

79
Use and Management of the Soils
This soil survey is an inventory and evaluation of the soils in the survey area. It can be used to adjust land uses to the limitations and potentials of natural resources and the environment. Also, it can help to prevent soil-related failures in land uses.
In preparing a soil survey, soil scientists, conservationists, engineers, and others collect extensive field data about the nature and behavioral characteristics of the soils. They collect data on erosion, droughtiness, flooding, and other factors that affect various soil uses and management. Field experience and collected data on soil properties and performance are used as a basis in predicting soil behavior.
Information in this section can be used to plan the use and management of soils for crops and pasture; as rangeland and forestland; as sites for buildings, sanitary facilities, highways and other transportation systems, and parks and other recreational facilities; for agricultural waste management; and as wildlife habitat. It can be used to identify the potentials and limitations of each soil for specific land uses and to help prevent construction failures caused by unfavorable soil properties.
Planners and others using soil survey information can evaluate the effect of specific land uses on productivity and on the environment in all or part of the survey area. The survey can help planners to maintain or create a land use pattern in harmony with the natural soil.
Contractors can use this survey to locate sources of sand and gravel, roadfill, and topsoil. They can use it to identify areas where bedrock, wetness, or very firm soil layers can cause difficulty in excavation.
Health officials, highway officials, engineers, and others may also find this survey useful. The survey can help them plan the safe disposal of wastes and locate sites for pavements, sidewalks, campgrounds, playgrounds, lawns, and trees and shrubs.
Interpretive Ratings The interpretive tables in this survey rate the soils in the survey area for various uses.
Many of the tables identify the limitations that affect specified uses and indicate the severity of those limitations. The ratings in these tables are both verbal and numerical.
Rating Class Terms Rating classes are expressed in the tables in terms that indicate the extent to which
the soils are limited by all of the soil features that affect a specified use or in terms that indicate the suitability of the soils for the use. Thus, the tables may show limitation classes or suitability classes. Terms for the limitation classes are not limited, somewhat limited, and very limited. The suitability ratings are expressed as well suited, moderately suited, poorly suited, and unsuited or as good, fair, and poor.
Numerical Ratings Numerical ratings in the tables indicate the relative severity of individual limitations.
The ratings are shown as decimal fractions ranging from 0.00 to 1.00. They indicate gradations between the point at which a soil feature has the greatest negative impact on the use and the point at which the soil feature is not a limitation. The limitations appear in order from the most limiting to the least limiting. Thus, if more than one limitation is identified, the most severe limitation is listed first and the least severe one is listed last.
80 Soil Survey of
Rangeland In areas that have similar climate and topography, differences in the kind and amount
of rangeland vegetation are closely related to the kind of soil. Effective management is based on the relationship between the soils and vegetation and water.
Table 6 shows, for each soil that supports vegetation suitable for grazing, the ecological site; the total annual production of vegetation in favorable, normal, and unfavorable years; the characteristic vegetation; and the rangeland composition average percentage of each species. An explanation of the column headings in table 6 follows.
An ecological site is the product of all the environmental factors responsible for its development. It has characteristic soils that have developed over time throughout the soil development process; a characteristic hydrology, particularly infiltration and runoff, that has developed over time; and a characteristic plant community (kind and amount of vegetation). The hydrology of the site is influenced by development of the soil and plant community. The vegetation, soils, and hydrology are all interrelated. Each is influenced by the others and influences the development of the others. The plant community on an ecological site is typified by an association of species that differs from that of other ecological sites in the kind and/or proportion of species or in total production. Descriptions of ecological sites are provided in the Field Office Technical Guide, which is available in local offices of the Natural Resources Conservation Service or on the NRCS website at www.nrcs.usda.gov
Total dry-weight production is the amount of vegetation that can be expected to grow annually in a well managed area that is supporting the potential natural plant community. It includes all vegetation, whether or not it is palatable to grazing animals. It includes the current year's growth of leaves, twigs, and fruits of woody plants. It does not include the increase in stem diameter of trees and shrubs. It is expressed in pounds per acre of air-dry vegetation for favorable, normal, and unfavorable years. In a favorable year, the amount and distribution of precipitation and the temperatures make growing conditions substantially better than average. In a normal year, growing conditions are about average. In an unfavorable year, growing conditions are well below average, generally because of low available soil moisture. Yields are adjusted to a common percent of air-dry moisture content.
Characteristic vegetation—the grasses, forbs, and shrubs that make up most of the potential natural plant community on each soil—is listed by common name. Under rangeland composition, the expected percentage of the total annual production is given for each species making up the characteristic vegetation. The amount that can be used as forage depends on the kinds of grazing animals and on the grazing season.
Range management requires a knowledge of the kinds of soil and of the potential natural plant community. It also requires an evaluation of the present range similarity index and rangeland trend. Range similarity index is determined by comparing the present plant community with the potential natural plant community on a particular rangeland ecological site. The more closely the existing community resembles the potential community, the higher the range similarity index. Rangeland trend is defined as the direction of change in an existing plant community relative to the potential natural plant community. Further information about the range similarity index and rangeland trend is available in chapter 4 of the "National Range and Pasture Handbook" at http://www.glti.nrcs.usda.gov/technical/publications/nrph.html.
The objective in range management is to control grazing so that the plants growing on a site are about the same in kind and amount as the potential natural plant community for that site. Such management generally results in the optimum production of vegetation, control of undesirable brush species, conservation of water, and control of erosion. Sometimes, however, an area with a range similarity index somewhat below the potential meets grazing needs, provides wildlife habitat, and protects soil and water resources.
Padre Island National Seashore, Texas 81
Ecological Site Descriptions There are seven ecological sites represented on Padre Island National Seashore.
They are Coastal Dune, Coastal Sand, Coastal Swale, Firm Brackish Marsh, Low Coastal Sand, Salt Flat, and Wind-tidal Flat ecological sites. A complete description of each site can be found at http://plants.usda.gov.
Recreation Padre Island National Seashore is about 20 miles south of Corpus Christi, Texas.
Summers are warm, winter is very mild, and the average rainfall is about 28 inches. The climate of the area affords year-round opportunity for recreation.
Some of the more obvious recreational activities include camping, swimming, beachcombing, and kite flying. A developed campground site is available at Malaquite Beach. It includes restroom and rinse shower facilities, and there is a potable water and gray water dump station near the campground. Primitive camping is available anywhere along the almost 70 miles of beach and at Bird Island Basin. Restroom and rinse shower facilities are also available at the Malaquite Beach Visitor’s Center.
Birdwatching and wildlife viewing can be done almost anywhere in the park. A short nature trail is just south of the pay station, and offers a quick look at several natural environments on the island.
Fishing is another year-round sport available on the island. A boat ramp to the Laguna Madre is located at Bird Island Basin just southwest of the pay entrance. This offers an opportunity for fishing the Laguna Madre and Baffin Bay. Surf fishing is also popular, and several species of fish can be caught almost anywhere along the beach. Big Shell Beach, south of the 20-mile mark, offers an area to fish for larger species. The continental shelf is somewhat steeper here, so the water near the beach is deeper here than at other areas along the island.
Surfing and kayaking are other sports that can be enjoyed almost year-round. The strong sustained winds have also made the area very popular for sailboarding and kitesurfing.
The soils of the survey area are rated in table 7 and table 8 according to limitations that affect their suitability for recreation. Rating class terms indicate the extent to which the soils are limited by all of the soil features that affect the recreational uses. Not limited indicates that the soil has features that are very favorable for the specified use. Good performance and very low maintenance can be expected. Somewhat limited indicates that the soil has features that are moderately favorable for the specified use. The limitations can be overcome or minimized by special planning, design, or installation. Fair performance and moderate maintenance can be expected. Very limited indicates that the soil has one or more features that are unfavorable for the specified use. The limitations generally cannot be overcome without major soil reclamation, special design, or expensive installation procedures. Poor performance and high maintenance can be expected.
Numerical ratings in the tables indicate the severity of individual limitations. The ratings are shown as decimal fractions ranging from 0.01 to 1.00. They indicate gradations between the point at which a soil feature has the greatest negative impact on the use (1.00) and the point at which the soil feature is not a limitation (0.00).
The ratings in the tables are based on restrictive soil features, such as wetness, slope, and texture of the surface layer. Susceptibility to flooding is considered. Not considered in the ratings, but important in evaluating a site, are the location and accessibility of the area, the size and shape of the area and its scenic quality, vegetation, access to water, potential water impoundment sites, and access to public sewer lines. The capacity of the soil to absorb septic tank effluent and the ability of the soil to support vegetation also are important. Soils that are subject to flooding are limited for recreational uses by the duration and intensity of flooding and the season when flooding occurs. In
82 Soil Survey of
planning recreational facilities, onsite assessment of the height, duration, intensity, and frequency of flooding is essential.
The information in table 7 and table 8 can be supplemented by other information in this survey, for example, interpretations for building site development, construction materials, sanitary facilities, and water management.
Camp areas require site preparation, such as shaping and leveling the tent and parking areas, stabilizing roads and intensively used areas, and installing sanitary facilities and utility lines. Camp areas are subject to heavy foot traffic and some vehicular traffic. The ratings are based on the soil properties that affect the ease of developing camp areas and the performance of the areas after development. Slope, stoniness, and depth to bedrock or a cemented pan are the main concerns affecting the development of camp areas. The soil properties that affect the performance of the areas after development are those that influence trafficability and promote the growth of vegetation, especially in heavily used areas. For good trafficability, the surface of camp areas should absorb rainfall readily, remain firm under heavy foot traffic, and not be dusty when dry. The soil properties that influence trafficability are texture of the surface layer, depth to a water table, ponding, flooding, permeability, and large stones. The soil properties that affect the growth of plants are depth to bedrock or a cemented pan, permeability, and toxic substances in the soil.
Picnic areas are subject to heavy foot traffic. Most vehicular traffic is confined to access roads and parking areas. The ratings are based on the soil properties that affect the ease of developing picnic areas and that influence trafficability and the growth of vegetation after development. Slope and stoniness are the main concerns affecting the development of picnic areas. For good trafficability, the surface of picnic areas should absorb rainfall readily, remain firm under heavy foot traffic, and not be dusty when dry. The soil properties that influence trafficability are texture of the surface layer, depth to a water table, ponding, flooding, permeability, and large stones. The soil properties that affect the growth of plants are depth to bedrock or a cemented pan, permeability, and toxic substances in the soil.
Playgrounds require soils that are nearly level, are free of stones, and can withstand intensive foot traffic. The ratings are based on the soil properties that affect the ease of developing playgrounds and that influence trafficability and the growth of vegetation after development. Slope and stoniness are the main concerns affecting the development of playgrounds. For good trafficability, the surface of the playgrounds should absorb rainfall readily, remain firm under heavy foot traffic, and not be dusty when dry. The soil properties that influence trafficability are texture of the surface layer, depth to a water table, ponding, flooding, permeability, and large stones. The soil properties that affect the growth of plants are depth to bedrock or a cemented pan, permeability, and toxic substances in the soil.
Paths and trails for hiking and horseback riding should require little or no slope modification through cutting and filling. The ratings are based on the soil properties that affect trafficability and erodibility. These properties are stoniness, depth to a water table, ponding, flooding, slope, and texture of the surface layer.
Off-road vehicle trails require little or no site preparation. They are not covered with surfacing material or vegetation. Considerable compaction of the soil material is likely. The ratings are based on the soil properties that influence erodibility, trafficability, dustiness, and the ease of revegetation. These properties are stoniness, slope, depth to a water table, ponding, flooding, and texture of the surface layer.
Wildlife Habitat Soils affect the kind and amount of vegetation that is available to wildlife as food and
cover. They also affect the construction of water impoundments. The kind and abundance of wildlife depend largely on the amount and distribution of food, cover, and water. Wildlife habitat can be created or improved by planting appropriate vegetation, by
Padre Island National Seashore, Texas 83
maintaining the existing plant cover, or by promoting the natural establishment of desirable plants.
In table 9 and table 10, the soils in the survey area are rated according to their potential for providing habitat for various kinds of wildlife. This information can be used in planning parks, wildlife refuges, nature study areas, and other developments for wildlife; in selecting soils that are suitable for establishing, improving, or maintaining specific elements of wildlife habitat; and in determining the intensity of management needed for each element of the habitat.
The degree of limitation is expressed as a numeric index between 0 (non-limiting condition) and 1.0 (limiting condition). If an individual soil property within 60 inches (150 centimeters) of the soil surface has a degree of limitation greater then zero, then that soil property is limiting and the soil restrictive feature is identified. The overall interpretive rating assigned is the maximum degree of limitation of each soil interpretive property considered in the rating process. Lesser restrictive soil features are those having a degree of limitation less then the maximum and are identified to provide the user with additional information about the soil's capability to support the land use. These lesser restrictive features could be important factors where the major restrictive features are overcome through practice design and application modifications.
Soils are placed into interpretive rating classes depending on their degree of limitation. These are not limited (degree of limitation = 0), somewhat limited (degree of limitation > 0 and < 1.0), or very limited (degree of limitation = 1.0).
The elements of wildlife habitat are described in the following paragraphs. Burrowing mammals and reptiles interpretation provides a tool to assess a soil’s
limitations for use as a component of burrowing mammals and reptiles habitat. The ratings are for the soils in their natural condition and do not consider present land use, existing vegetation, water sources, and the presence or absence of wildlife in the area.
Burrowing habitat ranks the soil as a habitat component according to its limitation for use by mammals and specific species of reptiles that excavate burrows. Burrows are considered a necessary part of specific local habitat requirements for targeted and non-targeted species of wildlife. The interpretation is intended to provide guidelines in the identification and selection of sites that have the least limitations for preserving, maintaining, or increasing local populations of burrowing species. Site identification of problem areas for control of pests, such as moles and ground squirrels is also another potential application of this guide.
The interpretation provides ratings and identifies the dominant soil characteristics that limit the site for burrowing mammals and reptiles. This information allows the user to plan and develop alternatives in site selection by identifying the site that best meets the wildlife habitat requirements. The user is required to develop a list of locally adapted wildlife species that excavate their own burrows or that utilize abandoned burrows to meet at least part of their habitat requirements. This list may include many other mammals, reptiles, and/or bird species.
This interpretation rates and identifies the dominant soil characteristics that limit the site for burrowing mammals, reptiles, and other species capable of utilizing abandoned burrows. The soil properties and qualities important in burrowing habitat are wetness, low sodium and salt content, surface texture, pH, ponding, slope, permeability, and high organic matter content.
Saline water wetland plants interpretation provides a tool to assess a soil’s limitations for use as either primary or secondary wildlife habitat. This interpretation is useful for planning the establishment and maintenance of saline wetland plant habitat. The ratings are for the soils in their natural condition and do not consider present land use, existing vegetation, water sources, and the presence or absence of wildlife in the area.
This interpretation ranks the soil as a medium for growing saline-tolerant wetland herbaceous vegetation and shrubs for use as saline wetland wildlife habitat. The purpose of the guide is to identify soils that have the best probability for success in maintaining
84 Soil Survey of
existing, naturally established saline wetlands or in establishing new saline water wetlands, including mitigation to replace existing wetlands. The soils suitable for this habitat generally occur in saline-sodic affected areas of cropland, previously cropped areas, odd areas associated with cropland, wetlands, and marginal areas associated with existing wetlands that are not directly affected by moving floodwaters. Not included are sites that are wet due to past irrigation and management practices. Some areas may be subject to ponding for indefinite periods because of the accumulation of excessive moisture caused by runoff from the surrounding area.
The interpretation provides interpretive ratings and identifies the dominant soil characteristics that limit the site for saline wetlands, either naturally or artificially established. This information allows the user to plan and develop alternative sites and to identify saline wetland species that best meet wildlife habitat requirements. The soil properties and qualities important in establishment and growth of saline wetland plants are wetness, sodium and salt content, surface texture, pH, ponding, slope, permeability, and high organic matter content.
Riparian herbaceous plants interpretation provides a tool to assess a soil’s limitations for use as either primary or secondary wildlife habitat. This interpretation is useful for planning the establishment and maintenance of riparian herbaceous plants for use as wildlife habitat. The ratings are for the soils in their natural condition and do not consider present land use, existing vegetation, water sources, and the presence or absence of wildlife in the area.
Riparian herbaceous plants are adapted to soil conditions that are wetter than those common in the drier upland areas. The soils suitable for this habitat generally occur along flood plains, depressions, bottomlands, and drainageways adjacent to ephemeral, intermittent, or perennial streams. They either are saturated with water for some period during the year or are subject to periodic overflow from ponding or flooding. Stream scouring and material deposition on flood plains are common. The natural regeneration of many plant species may be dictated by the timing of stream, peak flow events.
The interpretation provides ratings and identifies the dominant soil characteristics that limit the site for growing herbaceous riparian plants, either naturally or artificially established. This information allows the user to plan and develop alternative sites and to identify the riparian species that best meet the wildlife habitat requirements.
The management, reestablishment, or introduction of woody riparian species to meet select wildlife habitat requirements is determined by a number of factors. The factors are landscape, climate, soil, vegetation, hydrology, and time. A limitation caused by any one of these factors can influence the adaptability, survival, growth, and vigor of the herbaceous species. This interpretation addresses only those factors that relate primarily to the soil and identifies the soil limitation that will have the most affect on the site’s use for riparian habitat. The soil properties and qualities important in establishment and growth of riparian herbaceous plants are wetness, sodium and salt content, surface texture, ponding, flooding, and organic matter content.
Riparian shrubs, vines, and trees interpretation provides a tool to assess a soil’s limitations for use as either primary or secondary wildlife habitat. This interpretation is useful for planning the establishment and maintenance of riparian shrubs, vines, and trees for use as wildlife habitat. The ratings are for the soils in their natural condition and do not consider present land use, existing vegetation, water sources, and the presence or absence of wildlife in the area.
Riparian shrubs, vines, and trees are woody species of plants, which are adapted to soil conditions that are wetter than those common in the drier upland areas. The soils suitable for riparian habitat generally occur along flood plains, depressions, bottomlands, and drainageways adjacent to ephemeral, intermittent, or perennial streams. They either are saturated with water for some period during the year or are subject to periodic overflow from ponding or flooding. Stream scouring and material deposition on flood
Padre Island National Seashore, Texas 85
plains are common. The natural regeneration of many plant species may be dictated by the timing of stream, peak flow events.
The interpretation provides ratings and identifies the dominant soil characteristics that limit the site for growing riparian shrubs, vines, and trees, either naturally or artificially established. This information allows the user to plan and develop alternative sites and to identify woody riparian species that best meet the wildlife habitat requirements.
The management, reestablishment, or introduction of woody riparian species to meet select wildlife habitat requirements is determined by a number of factors. The factors are landscape, climate, soil, vegetation, hydrology, and time. A limitation caused by any one of these factors can influence the adaptability, survival, growth, and vigor of the shrubs or vine species. This interpretation addresses only those factors that relate primarily to the soil and identifies the soil limitation that will have the most affect on the site’s use for riparian habitat. The soil properties and qualities important in establishment and growth of riparian herbaceous plants are wetness, sodium and salt content, surface texture, ponding, flooding, and organic matter content.
Freshwater wetland plants interpretation provides a tool to assess a soil’s limitations for use as either primary or secondary wildlife habitat. This interpretation is useful for planning the establishment and maintenance of freshwater wetland plants habitat. The ratings are for the soils in their natural condition and do not consider present land use, existing vegetation, water sources, and the presence or absence of wildlife in the area.
This interpretation ranks the soil as a medium for growing freshwater wetland herbaceous vegetation and shrubs for use as saline wetland wildlife habitat. Plant species considered by the interpretation are predominantly hydrophytic and may include some mesophytic plants. The purpose of the guide is to identify soils that have the best probability for success in maintaining existing, naturally established freshwater wetlands or in establishing new freshwater wetlands, including mitigation to replace existing wetlands. The soils suitable for this habitat generally occur adjacent to springs, seeps, depressions, bottomlands, marshes, or the backwater areas of flood plains, such as oxbow lakes, that are not directly affected by moving floodwaters.
The interpretation provides ratings and identifies the dominant soil characteristics that limit the site for wetland plants, either naturally or artificially established. This information allows the user to plan and develop alternative sites and to identify the wetland vegetation that best meet the wildlife habitat requirements.
The management, reestablishment, or introduction of wetland saline species to meet select wildlife habitat requirements is determined by a number of factors. The factors are landscape, climate, soil, vegetation, hydrology, and time. A limitation caused by any one of these factors can influence the adaptability, survival, growth, and vigor of the wetland species. This interpretation addresses only those factors that relate primarily to the soil and identifies the soil limitation that have the most affect on the site’s use for wetland habitat. The soil properties and qualities important in establishment and growth of freshwater wetland plants are drainage, ponding, depth to water table, flooding, sodium and salt content, and surface texture.
Hydric Soils In this section, hydric soils are defined and described. The three essential characteristics of wetlands are hydrophytic vegetation, hydric
soils, and wetland hydrology (Cowardin and others, 1979; U.S. Army Corps of Engineers, 1987; National Research Council, 1995; Tiner, 1985). Criteria for each of the characteristics must be met for areas to be identified as wetlands.
Hydric soils are defined by the National Technical Committee for Hydric Soils (NTCHS) as soils that formed under conditions of saturation, flooding, or ponding long enough during the growing season to develop anaerobic conditions in the upper part (Federal Register, 1994). These soils are either saturated or inundated long enough
86 Soil Survey of
during the growing season to support the growth and reproduction of hydrophytic vegetation.
The NTCHS definition identifies general soil properties that are associated with wetness. In order to determine whether a specific soil is a hydric soil or nonhydric soil, however, more specific information, such as information about the depth and duration of the water table, is needed. Thus, criteria that identify those estimated soil properties unique to hydric soils have been established (Federal Register, 1995). The criteria are used to identify a phase of a soil series that normally is also a hydric soil. The criteria used are selected estimated soil properties that are described in "Soil Taxonomy" (Soil Survey Staff, 1999) and "Keys to Soil Taxonomy" (Soil Survey Staff, 2003) and in the "Soil Survey Manual" (Soil Survey Division Staff, 1993).
If soils are wet enough for a long enough period to be considered hydric, they generally exhibit certain properties that can be observed in the field. These visible properties are indicators of hydric soils. The indicators used to make onsite determinations of hydric soils in this survey area are specified in "Field Indicators of Hydric Soils in the United States" (Hurt and others, 1998).
For information regarding hydric soils in the soil survey area, refer to the USDA Natural Resources Conservation Service Soil Data Mart at http://soildatamart.nrcs.usda.gov.
Engineering This section provides information for planning land uses related to urban development
and to water management. Soils are rated for various uses, and the most limiting features are identified. Ratings are given for building site development, sanitary facilities, construction materials, and water management. The ratings are based on observed performance of the soils and on the data in the tables described under the heading "Soil Properties."
Information in this section is intended for land use planning, for evaluating land use alternatives, and for planning site investigations prior to design and construction. The information, however, has limitations. For example, estimates and other data generally apply only to that part of the soil between the surface and a depth of 5 to 7 feet. Because of the map scale, small areas of different soils may be included within the mapped areas of a specific soil.
The information is not site specific and does not eliminate the need for onsite investigation of the soils or for testing and analysis by personnel experienced in the design and construction of engineering works.
Government ordinances and regulations that restrict certain land uses or impose specific design criteria were not considered in preparing the information in this section. Local ordinances and regulations should be considered in planning, in site selection, and in design.
Soil properties, site features, and observed performance were considered in determining the ratings in this section. During the fieldwork for this soil survey, determinations were made about particle-size distribution, liquid limit, plasticity index, soil reaction, soil wetness, depth to a water table, ponding, slope, likelihood of flooding, natural soil structure aggregation, and soil density. Data were collected about kinds of clay minerals, mineralogy of the sand and silt fractions, and the kinds of adsorbed cations. Estimates were made for erodibility, permeability, corrosivity, shrink-swell potential, available water capacity, and other behavioral characteristics affecting engineering uses.
This information can be used to evaluate the potential of areas for residential, commercial, industrial, and recreational uses; make preliminary estimates of construction conditions; evaluate alternative routes for roads, streets, highways, pipelines, and underground cables; evaluate alternative sites for sanitary landfills, septic tank absorption fields, and sewage lagoons; plan detailed onsite investigations of soils and geology; locate potential sources of gravel, sand, earthfill, and topsoil; plan drainage systems,
Padre Island National Seashore, Texas 87
irrigation systems, ponds, terraces, and other structures for soil and water conservation; and predict performance of proposed small structures and pavements by comparing the performance of existing similar structures on the same or similar soils.
The information in the tables, along with the soil maps, the soil descriptions, and other data provided in this survey, can be used to make additional interpretations.
Some of the terms used in this soil survey have a special meaning in soil science and are defined in the Glossary.
Building Site Development Soil properties influence the development of building sites, including the selection of
the site, the design of the structure, construction, performance after construction, and maintenance. Table 11 and table 12 shows the degree and kind of soil limitations that affect dwellings with and without basements, small commercial buildings, local roads and streets, shallow excavations, and lawns and landscaping.
Rating class terms indicate the extent to which the soils are limited by all of the soil features that affect building site development. Not limited indicates that the soil has features that are very favorable for the specified use. Good performance and very low maintenance can be expected. Somewhat limited indicates that the soil has features that are moderately favorable for the specified use. The limitations can be overcome or minimized by special planning, design, or installation. Fair performance and moderate maintenance can be expected. Very limited indicates that the soil has one or more features that are unfavorable for the specified use. The limitations generally cannot be overcome without major soil reclamation, special design, or expensive installation procedures. Poor performance and high maintenance can be expected.
Numerical ratings in the tables indicate the severity of individual limitations. The ratings are shown as decimal fractions ranging from 0.01 to 1.00. They indicate gradations between the point at which a soil feature has the greatest negative impact on the use (1.00) and the point at which the soil feature is not a limitation (0.00).
Dwellings are single-family houses of three stories or less. For dwellings without basements, the foundation is assumed to consist of spread footings of reinforced concrete built on undisturbed soil at a depth of 2 feet or at the depth of maximum frost penetration, whichever is deeper. For dwellings with basements, the foundation is assumed to consist of spread footings of reinforced concrete built on undisturbed soil at a depth of about 7 feet. The ratings for dwellings are based on the soil properties that affect the capacity of the soil to support a load without movement and on the properties that affect excavation and construction costs. The properties that affect the load-supporting capacity include depth to a water table, ponding, flooding, subsidence, linear extensibility (shrink-swell potential), and compressibility. Compressibility is inferred from the Unified classification. The properties that affect the ease and amount of excavation include depth to a water table, ponding, flooding, slope, depth to bedrock or a cemented pan, hardness of bedrock or a cemented pan, and the amount and size of rock fragments.
Small commercial buildings are structures that are less than three stories high and do not have basements. The foundation is assumed to consist of spread footings of reinforced concrete built on undisturbed soil at a depth of 2 feet or at the depth of maximum frost penetration, whichever is deeper. The ratings are based on the soil properties that affect the capacity of the soil to support a load without movement and on the properties that affect excavation and construction costs. The properties that affect the load-supporting capacity include depth to a water table, ponding, flooding, subsidence, linear extensibility (shrink-swell potential), and compressibility (which is inferred from the Unified classification). The properties that affect the ease and amount of excavation include flooding, depth to a water table, ponding, slope, depth to bedrock or a cemented pan, hardness of bedrock or a cemented pan, and the amount and size of rock fragments.
88 Soil Survey of
Local roads and streets have an all-weather surface and carry automobile and light truck traffic all year. They have a subgrade of cut or fill soil material; a base of gravel, crushed rock, or soil material stabilized by lime or cement; and a surface of flexible material (asphalt), rigid material (concrete), or gravel with a binder. The ratings are based on the soil properties that affect the ease of excavation and grading and the traffic-supporting capacity. The properties that affect the ease of excavation and grading are depth to bedrock or a cemented pan, hardness of bedrock or a cemented pan, depth to a water table, ponding, flooding, the amount of large stones, and slope. The properties that affect the traffic-supporting capacity are soil strength (as inferred from the AASHTO group index number), subsidence, linear extensibility (shrink-swell potential), the potential for frost action, depth to a water table, and ponding.
Shallow excavations are trenches or holes dug to a maximum depth of 5 or 6 feet for graves, utility lines, open ditches, or other purposes. The ratings are based on the soil properties that influence the ease of digging and the resistance to sloughing. Depth to bedrock or a cemented pan, hardness of bedrock or a cemented pan, the amount of large stones, and dense layers influence the ease of digging, filling, and compacting. Depth to the seasonal high water table, flooding, and ponding may restrict the period when excavations can be made. Slope influences the ease of using machinery. Soil texture, depth to the water table, and linear extensibility (shrink-swell potential) influence the resistance to sloughing.
Lawns and landscaping require soils on which turf and ornamental trees and shrubs can be established and maintained. Irrigation is not considered in the ratings. The ratings are based on the soil properties that affect plant growth and trafficability after vegetation is established. The properties that affect plant growth are reaction; depth to a water table; ponding; depth to bedrock or a cemented pan; the available water capacity in the upper 40 inches (100 centimeters); the content of salts, sodium, or calcium carbonate; and sulfidic materials. The properties that affect trafficability are flooding, depth to a water table, ponding, slope, stoniness, and the amount of sand, clay, or organic matter in the surface layer.
Sanitary Facilities Table 13 and table 14 shows the degree and kind of soil limitations that affect septic
tank absorption fields, sewage lagoons, sanitary landfills, and daily cover for landfill. The ratings are both verbal and numerical. Rating class terms indicate the extent to which the soils are limited by all of the soil features that affect these uses. Not limited indicates that the soil has features that are very favorable for the specified use. Good performance and very low maintenance can be expected. Somewhat limited indicates that the soil has features that are moderately favorable for the specified use. The limitations can be overcome or minimized by special planning, design, or installation. Fair performance and moderate maintenance can be expected. Very limited indicates that the soil has one or more features that are unfavorable for the specified use. The limitations generally cannot be overcome without major soil reclamation, special design, or expensive installation procedures. Poor performance and high maintenance can be expected.
Numerical ratings in the tables indicate the severity of individual limitations. The ratings are shown as decimal fractions ranging from 0.01 to 1.00. They indicate gradations between the point at which a soil feature has the greatest negative impact on the use (1.00) and the point at which the soil feature is not a limitation (0.00).
Septic tank absorption fields are areas in which effluent from a septic tank is distributed into the soil through subsurface tiles or perforated pipe. Only that part of the soil between depths of 24 and 60 inches is evaluated. The ratings are based on the soil properties that affect absorption of the effluent, construction and maintenance of the system, and public health. Permeability, depth to a water table, ponding, depth to bedrock or a cemented pan, and flooding affect absorption of the effluent. Stones and boulders, ice, and bedrock or a cemented pan interfere with installation. Subsidence

Padre Island National Seashore, Texas 89
interferes with installation and maintenance. Excessive slope may cause lateral seepage and surfacing of the effluent in downslope areas.
Some soils are underlain by loose sand and gravel or fractured bedrock at a depth of less than 4 feet below the distribution lines. In these soils the absorption field may not adequately filter the effluent, particularly when the system is new. As a result, the ground water may become contaminated.
Sewage lagoons are shallow ponds constructed to hold sewage while aerobic bacteria decompose the solid and liquid wastes. Lagoons should have a nearly level floor surrounded by cut slopes or embankments of compacted soil. Nearly impervious soil material for the lagoon floor and sides is required to minimize seepage and contamination of ground water. Considered in the ratings are slope, permeability, depth to a water table, ponding, depth to bedrock or a cemented pan, flooding, large stones, and content of organic matter.
Soil permeability is a critical property affecting the suitability for sewage lagoons. Most porous soils eventually become sealed when they are used as sites for sewage lagoons. Until sealing occurs, however, the hazard of pollution is severe. Soils that have a permeability rate of more than 2 inches per hour are too porous for the proper functioning of sewage lagoons. In these soils, seepage of the effluent can result in contamination of the ground water. Ground-water contamination is also a hazard if fractured bedrock is within a depth of 40 inches (100 centimeters), if the water table is high enough to raise the level of sewage in the lagoon, or if floodwater overtops the lagoon.
A high content of organic matter is detrimental to proper functioning of the lagoon because it inhibits aerobic activity. Slope, bedrock, and cemented pans can cause construction problems, and large stones can hinder compaction of the lagoon floor. If the lagoon is to be uniformly deep throughout, the slope must be gentle enough and the soil material must be thick enough over bedrock or a cemented pan to make land smoothing practical.
A trench sanitary landfill is an area where solid waste is placed in successive layers in an excavated trench. The waste is spread, compacted, and covered daily with a thin layer of soil excavated at the site. When the trench is full, a final cover of soil material at least 2 feet thick is placed over the landfill. The ratings in the table are based on the soil properties that affect the risk of pollution, the ease of excavation, trafficability, and revegetation. These properties include permeability, depth to bedrock or a cemented pan, depth to a water table, ponding, slope, flooding, texture, stones and boulders, highly organic layers, soil reaction, and content of salts and sodium. Unless otherwise stated, the ratings apply only to that part of the soil within a depth of about 6 feet. For deeper trenches, onsite investigation may be needed.
Hard, nonrippable bedrock, creviced bedrock, or highly permeable strata in or directly below the proposed trench bottom can affect the ease of excavation and the hazard of ground-water pollution. Slope affects construction of the trenches and the movement of surface water around the landfill. It also affects the construction and performance of roads in areas of the landfill.
Soil texture and consistence affect the ease with which the trench is dug and the ease with which the soil can be used as daily or final cover. They determine the workability of the soil when dry and when wet. Soils that are plastic and sticky when wet are difficult to excavate, grade, or compact and are difficult to place as a uniformly thick cover over a layer of refuse.
The soil material used as the final cover for a trench landfill should be suitable for plants. It should not have excess sodium or salts and should not be too acid. The surface layer generally has the best workability, the highest content of organic matter, and the best potential for plants. Material from the surface layer should be stockpiled for use as the final cover.
90 Soil Survey of
In an area sanitary landfill, solid waste is placed in successive layers on the surface of the soil. The waste is spread, compacted, and covered daily with a thin layer of soil from a source away from the site. A final cover of soil material at least 2 feet thick is placed over the completed landfill. The ratings in the table are based on the soil properties that affect trafficability and the risk of pollution. These properties include flooding, permeability, depth to a water table, ponding, slope, and depth to bedrock or a cemented pan.
Flooding is a serious problem because it can result in pollution in areas downstream from the landfill. If permeability is too rapid or if fractured bedrock, a fractured cemented pan, or the water table is close to the surface, the leachate can contaminate the water supply. Slope is a consideration because of the extra grading required to maintain roads in the steeper areas of the landfill. Also, leachate may flow along the surface of the soils in the steeper areas and cause difficult seepage problems.
Daily cover for landfill is the soil material that is used to cover compacted solid waste in an area sanitary landfill. The soil material is obtained offsite, transported to the landfill, and spread over the waste. The ratings in the table also apply to the final cover for a landfill. They are based on the soil properties that affect workability, the ease of digging, and the ease of moving and spreading the material over the refuse daily during wet and dry periods. These properties include soil texture, depth to a water table, ponding, rock fragments, slope, depth to bedrock or a cemented pan, reaction, and content of salts, sodium, or lime.
Loamy or silty soils that are free of large stones and excess gravel are the best cover for a landfill. Clayey soils may be sticky and difficult to spread; sandy soils are subject to wind erosion.
Slope affects the ease of excavation and of moving the cover material. Also, it can influence runoff, erosion, and reclamation of the borrow area.
After soil material has been removed, the soil material remaining in the borrow area must be thick enough over bedrock, a cemented pan, or the water table to permit revegetation. The soil material used as the final cover for a landfill should be suitable for plants. It should not have excess sodium, salts, or lime and should not be too acid.
Construction Materials Table 15 and table 16 shows information about the soils as potential sources of
gravel, sand, topsoil, reclamation material, and roadfill. Normal compaction, minor processing, and other standard construction practices are assumed.
Sand and gravel are natural aggregates suitable for commercial use with a minimum of processing. They are used in many kinds of construction. Specifications for each use vary widely. In table 15, only the likelihood of finding material in suitable quantity is evaluated. The suitability of the material for specific purposes is not evaluated, nor are factors that affect excavation of the material. The properties used to evaluate the soil as a source of sand or gravel are gradation of grain sizes (as indicated by the Unified classification of the soil), the thickness of suitable material, and the content of rock fragments. If the bottom layer of the soil contains sand or gravel, the soil is considered a likely source regardless of thickness. The assumption is that the sand or gravel layer below the depth of observation exceeds the minimum thickness.
The soils are rated good, fair, or poor as potential sources of sand and gravel. A rating of good or fair means that the source material is likely to be in or below the soil. The bottom layer and the thickest layer of the soils are assigned numerical ratings. These ratings indicate the likelihood that the layer is a source of sand or gravel. The number 0.00 indicates that the layer is a poor source. The number 1.00 indicates that the layer is a good source. A number between 0.00 and 1.00 indicates the degree to which the layer is a likely source.
The soils are rated good, fair, or poor as potential sources of topsoil, reclamation material, and roadfill. The features that limit the soils as sources of these materials are
Padre Island National Seashore, Texas 91
specified in the tables. The numerical ratings given after the specified features indicate the degree to which the features limit the soils as sources of topsoil, reclamation material, or roadfill. The lower the number, the greater the limitation.
Reclamation material is used in areas that have been drastically disturbed by surface mining or similar activities. When these areas are reclaimed, layers of soil material or unconsolidated geological material, or both, are replaced in a vertical sequence. The reconstructed soil favors plant growth. The ratings in the table do not apply to quarries and other mined areas that require an offsite source of reconstruction material. The ratings are based on the soil properties that affect erosion and stability of the surface and the productive potential of the reconstructed soil. These properties include the content of sodium, salts, and calcium carbonate; reaction; available water capacity; erodibility; texture; content of rock fragments; and content of organic matter and other features that affect fertility.
Roadfill is soil material that is excavated in one place and used in road embankments in another place. In this table, the soils are rated as a source of roadfill for low embankments, generally less than 6 feet high and less exacting in design than higher embankments.
The ratings are for the whole soil, from the surface to a depth of about 5 feet. It is assumed that soil layers will be mixed when the soil material is excavated and spread.
The ratings are based on the amount of suitable material and on soil properties that affect the ease of excavation and the performance of the material after it is in place. The thickness of the suitable material is a major consideration. The ease of excavation is affected by large stones, depth to a water table, and slope. How well the soil performs in place after it has been compacted and drained is determined by its strength (as inferred from the AASHTO classification of the soil) and linear extensibility (shrink-swell potential).
Topsoil is used to cover an area so that vegetation can be established and maintained. The upper 40 inches (100 centimeters) of a soil is evaluated for use as topsoil. Also evaluated is the reclamation potential of the borrow area. The ratings are based on the soil properties that affect plant growth; the ease of excavating, loading, and spreading the material; and reclamation of the borrow area. Toxic substances, soil reaction, and the properties that are inferred from soil texture, such as available water capacity and fertility, affect plant growth. The ease of excavating, loading, and spreading is affected by rock fragments, slope, depth to a water table, soil texture, and thickness of suitable material. Reclamation of the borrow area is affected by slope, depth to a water table, rock fragments, depth to bedrock or a cemented pan, and toxic material.
The surface layer of most soils is generally preferred for topsoil because of its organic matter content. Organic matter greatly increases the absorption and retention of moisture and nutrients for plant growth.

93
Soil Properties
Data relating to soil properties are collected during the course of the soil survey. Soil properties are ascertained by field examination of the soils and by laboratory
index testing of some benchmark soils. Established standard procedures are followed. During the survey, many shallow borings are made and examined to identify and classify the soils and to delineate them on the soil maps. Samples are taken from some typical profiles and tested in the laboratory to determine particle-size distribution, plasticity, and compaction characteristics.
Estimates of soil properties are based on field examinations, on laboratory tests of samples from the survey area, and on laboratory tests of samples of similar soils in nearby areas. Tests verify field observations, verify properties that cannot be estimated accurately by field observation, and help to characterize key soils.
The estimates of soil properties are shown in tables. They include engineering index properties, physical and chemical properties, and pertinent soil and water features.
Engineering Index Properties Table 17 shows the engineering classifications and the range of index properties for
the layers of each soil in the survey area. Depth to the upper and lower boundaries of each layer is indicated. Texture is given in the standard terms used by the U.S. Department of Agriculture.
These terms are defined according to percentages of sand, silt, and clay in the fraction of the soil that is less than 2 millimeters in diameter. "Loam," for example, is soil that is 7 to 27 percent clay, 28 to 50 percent silt, and less than 52 percent sand. If the content of particles coarser than sand is 15 percent or more, an appropriate modifier is added, for example, "gravelly." Textural terms are defined in the Glossary.
Classification of the soils is determined according to the Unified soil classification system (ASTM, 2001) and the system adopted by the American Association of State Highway and Transportation Officials (AASHTO, 2000).
The Unified system classifies soils according to properties that affect their use as construction material. Soils are classified according to particle-size distribution of the fraction less than 3 inches in diameter and according to plasticity index, liquid limit, and organic matter content. Sandy and gravelly soils are identified as GW, GP, GM, GC, SW, SP, SM, and SC; silty and clayey soils as ML, CL, OL, MH, CH, and OH; and highly organic soils as PT. Soils exhibiting engineering properties of two groups can have a dual classification, for example, CL-ML.
The AASHTO system classifies soils according to those properties that affect roadway construction and maintenance. In this system, the fraction of a mineral soil that is less than 3 inches in diameter is classified in one of seven groups from A-1 through A-7 on the basis of particle-size distribution, liquid limit, and plasticity index. Soils in group A-1 are coarse grained and low in content of fines (silt and clay). At the other extreme, soils in group A-7 are fine grained. Highly organic soils are classified in group A-8 on the basis of visual inspection.
If laboratory data are available, the A-1, A-2, and A-7 groups are further classified as A-1-a, A-1-b, A-2-4, A-2-5, A-2-6, A-2-7, A-7-5, or A-7-6. As an additional refinement, the suitability of a soil as subgrade material can be indicated by a group index number. Group index numbers range from 0 for the best subgrade material to 20 or higher for the poorest.
94 Soil Survey of
Rock fragments larger than 10 inches in diameter and 3 to 10 inches in diameter are indicated as a percentage of the total soil on a dry-weight basis. The percentages are estimates determined mainly by converting volume percentage in the field to weight percentage.
Percentage (of soil particles) passing designated sieves is the percentage of the soil fraction less than 3 inches in diameter based on an ovendry weight. The sieves, numbers 4, 10, 40, and 200 (USA Standard Series), have openings of 4.76, 2.00, 0.420, and 0.074 millimeters, respectively. Estimates are based on laboratory tests of soils sampled in the survey area and in nearby areas and on estimates made in the field.
Liquid limit and plasticity index (Atterberg limits) indicate the plasticity characteristics of a soil. The estimates are based on test data from the survey area or from nearby areas and on field examination.
The estimates of particle-size distribution, liquid limit, and plasticity index are generally rounded to the nearest 5 percent. Thus, if the ranges of gradation and Atterberg limits extend a marginal amount (1 or 2 percentage points) across classification boundaries, the classification in the marginal zone is generally omitted in the table.
Physical Soil Properties Table 18 shows estimates of some physical characteristics and features that affect
soil behavior. These estimates are given for the layers of each soil in the survey area. The estimates are based on field observations and on test data for these and similar soils.
Depth to the upper and lower boundaries of each layer is indicated. Particle size is the effective diameter of a soil particle as measured by sedimentation,
sieving, or micrometric methods. Particle sizes are expressed as classes with specific effective diameter class limits. The broad classes are sand, silt, and clay, ranging from the larger to the smaller.
Sand as a soil separate consists of mineral soil particles that are 0.05 millimeter to 2 millimeters in diameter. In table 18, the estimated sand content of each soil layer is given as a percentage, by weight, of the soil material that is less than 2 millimeters in diameter.
Silt as a soil separate consists of mineral soil particles that are 0.002 to 0.05 millimeter in diameter. In table 18, the estimated silt content of each soil layer is given as a percentage, by weight, of the soil material that is less than 2 millimeters in diameter.
Clay as a soil separate consists of mineral soil particles that are less than 0.002 millimeter in diameter. In table 18, the estimated clay content of each soil layer is given as a percentage, by weight, of the soil material that is less than 2 millimeters in diameter.
The content of sand, silt, and clay affects the physical behavior of a soil. Particle size is important for engineering and agronomic interpretations, for determination of soil hydrologic qualities, and for soil classification.
The amount and kind of clay affect the fertility and physical condition of the soil and the ability of the soil to adsorb cations and to retain moisture. They influence shrink-swell potential, permeability, plasticity, the ease of soil dispersion, and other soil properties. The amount and kind of clay in a soil also affect tillage and earthmoving operations.
Moist bulk density is the weight of soil (ovendry) per unit volume. Volume is measured when the soil is at field moisture capacity, that is, the moisture content at 1/3- or 1/10-bar (33kPa or 10kPa) moisture tension. Weight is determined after the soil is dried at 105 degrees C. In the table, the estimated moist bulk density of each soil horizon is expressed in grams per cubic centimeter of soil material that is less than 2 millimeters in diameter. Bulk density data are used to compute shrink-swell potential, available water capacity, total pore space, and other soil properties. The moist bulk density of a soil indicates the pore space available for water and roots. Depending on soil texture, a bulk density of more than 1.4 can restrict water storage and root penetration. Moist bulk density is influenced by texture, kind of clay, content of organic matter, and soil structure.
Padre Island National Seashore, Texas 95
Permeability (K-sat) refers to the ability of a soil to transmit water or air. The term "permeability," as used in soil surveys, indicates saturated hydraulic conductivity (K-sat). The estimates in the table indicate the rate of water movement, in inches per hour, when the soil is saturated. They are based on soil characteristics observed in the field, particularly structure, porosity, and texture. Permeability is considered in the design of soil drainage systems and septic tank absorption fields.
Available water capacity refers to the quantity of water that the soil is capable of storing for use by plants. The capacity for water storage is given in inches of water per inch of soil for each soil layer. The capacity varies, depending on soil properties that affect retention of water. The most important properties are the content of organic matter, soil texture, bulk density, and soil structure. Available water capacity is an important factor in the choice of plants or crops to be grown and in the design and management of irrigation systems. Available water capacity is not an estimate of the quantity of water actually available to plants at any given time.
Linear extensibility refers to the change in length of an unconfined clod as moisture content is decreased from a moist to a dry state. It is an expression of the volume change between the water content of the clod at 1/3- or 1/10-bar tension (33kPa or 10kPa tension) and oven dryness. The volume change is reported in the table as percent change for the whole soil. Volume change is influenced by the amount and type of clay minerals in the soil.
Linear extensibility is used to determine the shrink-swell potential of soils. The shrink-swell potential is low if the soil has a linear extensibility of less than 3 percent; moderate if 3 to 6 percent; high if 6 to 9 percent; and very high if more than 9 percent. If the linear extensibility is more than 3, shrinking and swelling can cause damage to buildings, roads, and other structures and to plant roots. Special design commonly is needed.
Organic matter is the plant and animal residue in the soil at various stages of decomposition. In table 18, the estimated content of organic matter is expressed as a percentage, by weight, of the soil material that is less than 2 millimeters in diameter.
The content of organic matter in a soil can be maintained by returning crop residue to the soil. Organic matter has a positive effect on available water capacity, water infiltration, soil organism activity, and tilth. It is a source of nitrogen and other nutrients for crops and soil organisms.
Erosion factors are shown in table 18 as the K factor (Kw and Kf) and the T factor. Erosion factor K indicates the susceptibility of a soil to sheet and rill erosion by water. Factor K is one of several factors used in the Universal Soil Loss Equation (USLE) and the Revised Universal Soil Loss Equation (RUSLE) to predict the average annual rate of soil loss by sheet and rill erosion in tons per acre per year. The estimates are based primarily on percentage of silt, sand, and organic matter and on soil structure and permeability. Values of K range from 0.02 to 0.69. Other factors being equal, the higher the value, the more susceptible the soil is to sheet and rill erosion by water.
Erosion factor Kw indicates the erodibility of the whole soil. The estimates are modified by the presence of rock fragments.
Erosion factor Kf indicates the erodibility of the fine-earth fraction, or the material less than 2 millimeters in size.
Erosion factor T is an estimate of the maximum average annual rate of soil erosion by wind or water that can occur without affecting crop productivity over a sustained period. The rate is in tons per acre per year.
Wind erodibility groups are made up of soils that have similar properties affecting their susceptibility to wind erosion in cultivated areas. The soils assigned to group 1 are the most susceptible to wind erosion, and those assigned to group 8 are the least susceptible. The groups are as follows:
1. Coarse sands, sands, fine sands, and very fine sands. 2. Loamy coarse sands, loamy sands, loamy fine sands, loamy very fine sands, ash
material, and sapric soil material.
96 Soil Survey of
3. Coarse sandy loams, sandy loams, fine sandy loams, and very fine sandy loams. 4L. Calcareous loams, silt loams, clay loams, and silty clay loams. 4. Clays, silty clays, noncalcareous clay loams, and silty clay loams that are more
than 35 percent clay. 5. Noncalcareous loams and silt loams that are less than 20 percent clay and sandy
clay loams, sandy clays, and hemic soil material. 6. Noncalcareous loams and silt loams that are more than 20 percent clay and
noncalcareous clay loams that are less than 35 percent clay. 7. Silts, noncalcareous silty clay loams that are less than 35 percent clay, and fibric
soil material. 8. Soils that are not subject to wind erosion because of rock fragments on the surface
or because of surface wetness. Wind erodibility index is a numerical value indicating the susceptibility of soil to wind
erosion, or the tons per acre per year that can be expected to be lost to wind erosion. There is a close correlation between wind erosion and the texture of the surface layer, the size and durability of surface clods, rock fragments, organic matter, and a calcareous reaction. Soil moisture and frozen soil layers also influence wind erosion.
Chemical Soil Properties Table 19 shows estimates of some chemical characteristics and features that affect
soil behavior. These estimates are given for the layers of each soil in the survey area. The estimates are based on field observations and on test data for these and similar soils.
Depth to the upper and lower boundaries of each layer is indicated. Cation-exchange capacity is the total amount of extractable bases that can be held by
the soil, expressed in terms of milliequivalents per 100 grams of soil at neutrality (pH 7.0) or at some other stated pH value. Soils having a low cation-exchange capacity hold fewer cations and may require more frequent applications of fertilizer than soils having a high cation-exchange capacity. The ability to retain cations reduces the hazard of ground-water pollution.
Effective cation-exchange capacity refers to the sum of extractable bases plus aluminum expressed in terms of milliequivalents per 100 grams of soil. It is determined for soils that have pH of less than 5.5.
Soil reaction is a measure of acidity or alkalinity. The pH of each soil horizon is based on many field tests. For many soils, values have been verified by laboratory analyses. Soil reaction is important in selecting crops and other plants, in evaluating soil amendments for fertility and stabilization, and in determining the risk of corrosion.
Calcium carbonate equivalent is the percent of carbonates, by weight, in the fraction of the soil less than 2 millimeters in size. The availability of plant nutrients is influenced by the amount of carbonates in the soil. Incorporating nitrogen fertilizer into calcareous soils helps to prevent nitrite accumulation and ammonium-N volatilization.
Gypsum is expressed as a percent, by weight, of hydrated calcium sulfates in the fraction of the soil less than 20 millimeters in size. Gypsum is partially soluble in water. Soils that have a high content of gypsum may collapse if the gypsum is removed by percolating water.
Salinity is a measure of soluble salts in the soil at saturation. It is expressed as the electrical conductivity of the saturation extract, in millimhos per centimeter at 25 degrees C. Estimates are based on field and laboratory measurements at representative sites of nonirrigated soils. The salinity of irrigated soils is affected by the quality of the irrigation water and by the frequency of water application. Hence, the salinity of soils in individual fields can differ greatly from the value given in the table. Salinity affects the suitability of a soil for crop production, the stability of soil if used as construction material, and the potential of the soil to corrode metal and concrete.
Padre Island National Seashore, Texas 97
Sodium adsorption ratio (SAR) is a measure of the amount of sodium (Na) relative to calcium (Ca) and magnesium (Mg) in the water extract from saturated soil paste. It is the ratio of the Na concentration divided by the square root of one-half of the Ca + Mg concentration. Soils that have SAR values of 13 or more may be characterized by an increased dispersion of organic matter and clay particles, reduced permeability and aeration, and a general degradation of soil structure.
Water Features Table 20 provides estimates of various water features. The estimates are used in land
use planning that involves engineering considerations. Hydrologic soil groups are based on estimates of runoff potential. Soils are assigned
to one of four groups according to the rate of water infiltration when the soils are not protected by vegetation, are thoroughly wet, and receive precipitation from long-duration storms.
The four hydrologic soil groups are: Group A. Soils having a high infiltration rate (low runoff potential) when thoroughly
wet. These consist mainly of deep and very deep, well drained to excessively drained sands or gravelly sands. These soils have a high rate of water transmission.
Group B. Soils having a moderate infiltration rate when thoroughly wet. These consist chiefly of moderately deep to very deep, moderately well drained or well drained soils that have moderately fine texture to moderately coarse texture. These soils have a moderate rate of water transmission.
Group C. Soils having a slow infiltration rate when thoroughly wet. These consist chiefly of soils having a layer that impedes the downward movement of water or soils of moderately fine texture or fine texture. These soils have a slow rate of water transmission.
Group D. Soils having a very slow infiltration rate (high runoff potential) when thoroughly wet. These consist chiefly of clays that have a high shrink-swell potential, soils that have a high water table, soils that have a claypan or clay layer at or near the surface, and soils that are shallow over nearly impervious material. These soils have a very slow rate of water transmission.
The months in the table indicate the portion of the year in which the feature is most likely to be a concern.
Water table refers to a saturated zone in the soil. Table 20 indicates, by month, depth to the top (upper limit) and base (lower limit) of the saturated zone in most years. Estimates of the upper and lower limits are based mainly on observations of the water table at selected sites and on evidence of a saturated zone, namely grayish colors or mottles (redoximorphic features) in the soil. A saturated zone that lasts for less than a month is not considered a water table.
Ponding is standing water in a closed depression. Unless a drainage system is installed, the water is removed only by percolation, transpiration, or evaporation. Table 20 indicates surface water depth and the duration and frequency of ponding. Duration is expressed as very brief if less than 2 days, brief if 2 to 7 days, long if 7 to 30 days, and very long if more than 30 days. Frequency is expressed as none, rare, occasional, and frequent. None means that ponding is not probable; rare that it is unlikely but possible under unusual weather conditions (the chance of ponding is nearly 0 percent to 5 percent in any year); occasional that it occurs, on the average, once or less in 2 years (the chance of ponding is 5 to 50 percent in any year); and frequent that it occurs, on the average, more than once in 2 years (the chance of ponding is more than 50 percent in any year).
Flooding is the temporary inundation of an area caused by overflowing streams, by runoff from adjacent slopes, or by tides or high storm surge. Water standing for short periods after rainfall or snowmelt is not considered flooding, and water standing in swamps and marshes is considered ponding rather than flooding.
98 Soil Survey of
Duration and frequency are estimated. Duration is expressed as extremely brief if 0.1 hour to 4 hours, very brief if 4 hours to 2 days, brief if 2 to 7 days, long if 7 to 30 days, and very long if more than 30 days. Frequency is expressed as none, very rare, rare, occasional, frequent, and very frequent. None means that flooding is not probable; very rare that it is very unlikely but possible under extremely unusual weather conditions (the chance of flooding is less than 1 percent in any year); rare that it is unlikely but possible under unusual weather conditions (the chance of flooding is 1 to 5 percent in any year); occasional that it occurs infrequently under normal weather conditions (the chance of flooding is 5 to 50 percent in any year); frequent that it is likely to occur often under normal weather conditions (the chance of flooding is more than 50 percent in any year but is less than 50 percent in all months in any year); and very frequent that it is likely to occur very often under normal weather conditions (the chance of flooding is more than 50 percent in all months of any year).
The information is based on evidence in the soil profile, namely thin strata of gravel, sand, silt, or clay deposited by floodwater; irregular decrease in organic matter content with increasing depth; and little or no horizon development.
Also considered are local information about the extent and levels of flooding and the relation of each soil on the landscape to historic floods. Information on the extent of flooding based on soil data is less specific than that provided by detailed engineering surveys that delineate flood-prone areas at specific flood frequency levels.
Soil Features Table 21 provides estimates of various soil features. The estimates are used in land
use planning that involves engineering considerations. A restrictive layer is a nearly continuous layer that has one or more physical,
chemical, or thermal properties that significantly impede the movement of water and air through the soil or that restrict roots or otherwise provide an unfavorable root environment. Examples are bedrock, cemented layers, dense layers, and frozen layers. The table indicates the hardness and thickness of the restrictive layer, both of which significantly affect the ease of excavation. Depth to top is the vertical distance from the soil surface to the upper boundary of the restrictive layer.
Subsidence is the settlement of organic soils or of saturated mineral soils of very low density. Subsidence generally results from either desiccation and shrinkage or oxidation of organic material, or both, following drainage. Subsidence takes place gradually, usually over a period of several years. The table shows the expected initial subsidence, which usually is a result of drainage, and total subsidence, which results from a combination of factors.
Potential for frost action is the likelihood of upward or lateral expansion of the soil caused by the formation of segregated ice lenses (frost heave) and the subsequent collapse of the soil and loss of strength on thawing. Frost action occurs when moisture moves into the freezing zone of the soil. Temperature, texture, density, permeability, content of organic matter, and depth to the water table are the most important factors considered in evaluating the potential for frost action. It is assumed that the soil is not insulated by vegetation or snow and is not artificially drained. Silty and highly structured, clayey soils that have a high water table in winter are the most susceptible to frost action. Well drained, very gravelly, or very sandy soils are the least susceptible. Frost heave and low soil strength during thawing cause damage to pavements and other rigid structures.
Risk of corrosion pertains to potential soil-induced electrochemical or chemical action that corrodes or weakens uncoated steel or concrete. The rate of corrosion of uncoated steel is related to such factors as soil moisture, particle-size distribution, acidity, and electrical conductivity of the soil. The rate of corrosion of concrete is based mainly on the sulfate and sodium content, texture, moisture content, and acidity of the soil. Special site examination and design may be needed if the combination of factors results in a severe hazard of corrosion. The steel or concrete in installations that intersect soil boundaries or
Padre Island National Seashore, Texas 99
soil layers is more susceptible to corrosion than the steel or concrete in installations that are entirely within one kind of soil or within one soil layer.
For uncoated steel, the risk of corrosion, expressed as low, moderate, or high, is based on soil drainage class, total acidity, electrical resistivity near field capacity, and electrical conductivity of the saturation extract.
For concrete, the risk of corrosion also is expressed as low, moderate, or high. It is based on soil texture, acidity, and amount of sulfates in the saturation extract.
Physical and Chemical Analyses of Selected Soils The results of physical analysis of several typical pedons in the survey area are given
in table 22 and the results of chemical analysis in table 23. The data are for soils sampled at carefully selected sites. Unless otherwise indicated, the pedons are typical of the series. They are described in the section "Soil Series and Their Morphology." Soil samples were analyzed by the National Soil Survey Laboratory in Lincoln, Nebraska.
Most determinations, except those for grain-size analysis and bulk density, were made on soil material smaller than 2 millimeters in diameter. Measurements reported as percent or quantity of unit weight were calculated on an ovendry basis. The methods used in obtaining the data are indicated in the list that follows. The codes in parentheses refer to published methods (USDA, 1996).
Sand—(0.05-2.0 mm fraction) weight percentages of material less than 2 mm (3A1). Silt—(0.002-0.05 mm fraction) pipette extraction, weight percentages of all material
less than 2 mm (3A1). Clay—(fraction less than 0.002 mm) pipette extraction, weight percentages of
material less than 2 mm (3A1). Water retained—pressure extraction, percentage of ovendry weight of less than 2 mm
material; 1/3 or 1/10 bar (4B1), 15 bars (4B2). Bulk density—of less than 2 mm material, saran-coated clods field moist (4A1a), 1/3
bar (4A1d), ovendry (4A1h). Linear extensibility—change in clod dimension based on whole soil (4D). Extractable cations—ammonium acetate pH 7.0, ICP; calcium (6N2i), magnesium
(6O2h), sodium (6P2f), potassium (6Q2f). Cation-exchange capacity—ammonium acetate, pH 7.0, steam distillation (5A8b). Base saturation—ammonium acetate, pH 7.0 (5C1). Reaction (pH)—1:1 water dilution (8C1f). Electrical conductivity—saturation extract (8A3a). Sodium adsorption ratio (5E). Exchangeable sodium percentage (5D2). Carbonate as calcium carbonate—(fraction less than 20 mm) manometric (6E4).

101
Classification of the Soils
The system of soil classification used by the National Cooperative Soil Survey has six categories (Soil Survey Staff, 1999 and 2003). Beginning with the broadest, these categories are the order, suborder, great group, subgroup, family, and series. Classification is based on soil properties observed in the field or inferred from those observations or from laboratory measurements. Table 24 shows the classification of the soils in the survey area. The categories are defined in the following paragraphs.
ORDER. Twelve soil orders are recognized. The differences among orders reflect the dominant soil-forming processes and the degree of soil formation. Each order is identified by a word ending in sol. An example is Inceptisol.
SUBORDER. Each order is divided into suborders primarily on the basis of properties that influence soil genesis and are important to plant growth or properties that reflect the most important variables within the orders. The last syllable in the name of a suborder indicates the order. An example is Aquept (Aqua, meaning water, plus ept, from Inceptisol).
GREAT GROUP. Each suborder is divided into great groups on the basis of close similarities in kind, arrangement, and degree of development of pedogenic horizons; soil moisture and temperature regimes; type of saturation; and base status. Each great group is identified by the name of a suborder and by a prefix that indicates a property of the soil. An example is Halaquepts (Hal, meaning salty, plus aquept, the suborder of the Inceptisols that has an aquic moisture regime).
SUBGROUP. Each great group has a typic subgroup. Other subgroups are intergrades or extragrades. The typic subgroup is the central concept of the great group; it is not necessarily the most extensive. Intergrades are transitions to other orders, suborders, or great groups. Extragrades have some properties that are not representative of the great group but do not indicate transitions to any other taxonomic class. Each subgroup is identified by one or more adjectives preceding the name of the great group. The adjective Typic identifies the subgroup that typifies the great group. An example is Typic Halaquepts.
FAMILY. Families are established within a subgroup on the basis of physical and chemical properties and other characteristics that affect management. Generally, the properties are those of horizons below plow depth where there is much biological activity. Among the properties and characteristics considered are particle-size class, mineralogy class, cation-exchange activity class, reaction class, soil temperature regime, soil depth, and reaction class. A family name consists of the name of a subgroup preceded by terms that indicate soil properties. An example is coarse-loamy, siliceous, active, calcareous, hyperthermic Typic Halaquepts.
SERIES. The series consists of soils within a family that have horizons similar in color, texture, structure, reaction, consistence, mineral and chemical composition, and arrangement in the profile.
Soil Series and Their Morphology In this section, each soil series recognized in the survey area is described.
Characteristics of the soil and the material in which it formed are identified for each series. A pedon, a small three-dimensional area of soil, that is typical of the series in the survey area is described. The detailed description of each soil horizon follows standards in the "Soil Survey Manual" (Soil Survey Division Staff, 1993). Many of the technical terms used in the descriptions are defined in "Soil Taxonomy" (Soil Survey Staff, 1999)
102 Soil Survey of
and in "Keys to Soil Taxonomy" (Soil Survey Staff, 2003). Unless otherwise indicated, colors in the descriptions are for moist soil. Following the pedon description is the range of important characteristics of the soils in the series. To link directly to the official series descriptions for each series, go to the following address and type in the name: http://ortho.ftw.nrcs.usda.gov/cgi-bin/osd/osdname.cgi
Baffin Series The Baffin series consists of very deep, very poorly drained (permanently submerged)
soils that formed in slightly fluid sandy and loamy estuarine sediments. These nearly level soils are in shallow-water grass flats of bays. Water depth is generally less than 4 feet. Slope ranges from 0 to 1 percent but is mostly less than 0.5 percent. Mean annual air temperature is about 72 degrees F and mean annual precipitation is about 27 inches.
Taxonomic Class
Coarse-loamy, siliceous, active, calcareous, hyperthermic Sodic Hydraquents
Typical Pedon
Baffin sandy clay loam on a smooth 0 percent slope, in a shoalgrass meadow under 8 inches of water, near the transitional margin of the wind-tidal flats at an elevation of -0.5 feet (Colors are for moist soil.)
Ag1—0 to 2 inches; dark greenish gray (5GY 3/1) sandy clay loam; weak fine platy structure; moderately fluid (n-value 1.0), soil flows easily between fingers and leaves a small residue in hand when squeezed; 2 percent very fine and fine roots; 2 percent fine tubular polychaete worm tunnels; 2 percent fine and medium faint greenish gray (5GY 5/1) iron depletions with diffuse boundaries in the matrix; strongly saline; SAR is about 50; strongly effervescent; slightly alkaline; clear smooth boundary.
Ag2—2 to 8 inches; greenish gray (5GY 5/1) fine sandy loam; weak fine platy structure; moderately fluid (n-value 1.0), soil flows easily between fingers and leaves a small residue in hand when squeezed; 3 percent very fine and fine roots; 4 percent fine and medium tubular polychaete worm tunnels; 4 percent fine and medium distinct dark greenish gray (5GY 3/1) and 1 percent fine and medium distinct dark greenish gray (5G 4/1) iron depletions with diffuse boundaries in the matrix; strongly saline; SAR is about 50; violently effervescent; slightly alkaline; clear smooth boundary. (Combined thickness of the Ag horizons is 4 to 9 inches.)
Cg1—8 to 14 inches; greenish gray (5G 5/1) sandy clay loam; massive; moderately fluid (n-value 1.0), soil flows easily between fingers and leaves a small residue in hand when squeezed; 1 percent very fine and fine roots; 12 percent medium distinct greenish gray (10Y 5/1) iron depletions with clear boundaries in the matrix; 3 percent gravel-sized shell fragments; strongly saline; SAR is about 50; strongly effervescent; slightly alkaline; clear smooth boundary.
Cg2—14 to 23 inches; greenish gray (5GY 5/1) fine sandy loam; massive; moderately fluid (n-value 1.0), soil flows easily between fingers and leaves a small residue in hand when squeezed; 3 percent fine and medium faint greenish gray (5GY 5/1) iron depletions with diffuse boundaries in the matrix; 3 percent gravel-sized shell fragments; strongly saline; SAR is about 60; strongly effervescent; slightly alkaline; clear smooth boundary.
Cg3—23 to 43 inches; greenish gray (5GY 5/1) fine sand; massive; non-fluid in natural state (n-value less than 0.7); 12 percent medium faint greenish gray (5G 5/1) and 3 percent fine and medium faint greenish gray (10Y 5/1) iron depletions with diffuse boundaries in the matrix; 3 percent gravel-sized shell fragments; strongly saline; SAR is about 50; strongly effervescent; slightly alkaline; clear smooth boundary.
Cg4—43 to 63 inches; greenish gray (10Y 5/1) fine sand; massive; non-fluid in natural state (n-value less than 0.7); 3 percent medium distinct dark greenish gray (5GY 3/1)
Padre Island National Seashore, Texas 103
and 2 percent fine and medium faint greenish gray (5G 5/1) iron depletions with diffuse boundaries in the matrix; 1 percent gravel-sized shell fragments; strongly saline; SAR is about 60; slightly effervescent; neutral; gradual smooth boundary.
Cg5—63 to 75 inches; dark gray (N 4/0) fine sand; massive; non-fluid in natural state (n-value less than 0.7); 7 percent sand-sized and 1 percent gravel-sized shell fragments; strongly saline; SAR is about 60; slightly effervescent; neutral; clear smooth boundary.
Cg6—75 to 80 inches; dark gray (N 4/0) fine sandy loam; massive; moderately fluid (n-value 1.0), soil flows easily between fingers and leaves a small residue in hand when squeezed; 20 percent medium distinct dark greenish gray (5GY 4/1) and 2 percent medium distinct dark greenish gray (5GY 3/1) iron depletions with diffuse boundaries in the matrix; 3 percent fine and medium distinct olive gray (5Y 4/2) iron depletions with clear boundaries in the matrix; 3 percent sand-sized and 2 percent gravel-sized shell fragments; moderately saline; SAR is about 60; slightly effervescent; neutral. (Combined thickness of the Cg horizons is 71 to 76 inches.)
Type Location
Kenedy County, Texas; from the intersection of Park Road 22 and the county line between Kleberg and Nueces Counties; 8.0 miles southwest on Park Road 22 to the pay station entrance of Padre Island National Seashore; 0.8 miles southwest on Park Road 22 to the intersection of Novillo and Bird Island Basin Road; 2.1 miles west-northwest and north on Bird Island Basin Road to boat ramp; 28.7 miles by boat generally west-southwest along the Gulf Intracoastal Waterway into the landcut to channel running east near the center of Potrero Grande; 0.6 mile east into channel; 1,100 feet south in a sparse shoalgrass meadow, in an area known locally as the Hole or the Graveyard. Potrero Cortado, Texas USGS topographic quadrangle; Lat. 27 degrees, 05 minutes, 57.9 seconds N; Long. 97 degrees, 26 minutes, 05.7 seconds W; NAD 83.
Range in Characteristics
Soil moisture: These soils have aquic conditions throughout at all times in normal years and have a peraquic moisture regime. In one or more horizons, at least 6 inches thick, the electrical conductivity of the water extracted from a saturated paste is more than 30 dS/m for more than 90 days in normal years.
Mean annual soil temperature: 74 to 76 degrees F Depth to iron depletions or depleted matrix: 0 to 10 inches Depth to endosaturation: Permanently submersed Particle-size control section (weighted average):
Clay content: 10 to 18 percent Sand content: 65 to 85 percent
Coarse fragments: Consist of seashell and seashell fragments n-Value: The soil in all subhorizons between 8 and 20 inches below the mineral soil
surface flows easily between the fingers when squeezed and has an n-value of more than 0.7.
Ag Horizon
Hue: 5Y, 10Y, or 5GY Value: 3 to 5 Chroma: 1 Texture: Sandy clay loam Clay content: 20 to 30 percent Iron depletions: Quantity—5 to 20 percent; size—fine or medium; contrast—faint or
distinct; boundary—diffuse or clear; shades—gray or green Coarse fragments: 0 to 5 percent EC (dS/m): 40 to 50
104 Soil Survey of
SAR: 35 to 70 Reaction: Slightly alkaline or moderately alkaline
Ag2 Horizon (where present)
Hue: 5Y, 10Y, or 5GY Value: 3 to 5 Chroma: 1 Texture: Loamy fine sand or fine sandy loam Clay content: 8 to 20 percent Iron depletions: Quantity—5 to 20 percent; size—fine or medium; contrast—faint or
distinct; boundary—diffuse or clear; shades—gray or green Coarse fragments: 0 to 5 percent EC (dS/m): 40 to 50 SAR: 35 to 70 Reaction: Slightly alkaline or moderately alkaline
Cg Horizon
Hue: 5Y, 10Y, 5GY, 5G, or N Value: 4 to 7 Chroma: 0 or 1 Texture: Textures are variable in fine sand, loamy fine sand, fine sandy loam, or sandy
clay loam Clay content: 8 to 28 percent Iron depletions: Quantity—3 to 20 percent; size—fine or medium; contrast—faint or
distinct; boundary—diffuse or clear; shades—gray or green Coarse fragments: 0 to 10 percent EC (dS/m): 35 to 85 SAR: 45 to 75 Reaction: Neutral to moderately alkaline
Competing Series
There are no other series in the same family. Similar soils are the Arat (LA), Arrada (TX), Bancker (LA), Hobucken (NC), Satatton (TX), Scatlake (LA), Tatlum (TX), Tatton (TX) and the Yarborough (TX) series.
Arat and Tatlum soils have a fine-silty particle-size control section. In addition, Arat soils have SAR of less than 13 within the 10- to 40-inch control section.
Arrada soils are poorly drained, have a fine-loamy particle-size control section and are not permanently submersed.
Bancker and Scatlake soils have a very-fine particle-size control section. Hobucken soils have SAR of less than 13 within the 10- to 40-inch control section and
are in the thermic temperature regime. Satatton and Tatton soils have a sandy particle-size control section and are not
permanently submersed. In addition, Satatton soils are poorly drained. Yarborough soils are poorly drained, have an n-value of less than 0.7, and are not
permanently submersed.
Geographic Setting
Parent material: Loamy and sandy estuarine sediments Landform: Shallow bays Slope: 0 to 0.5 percent Mean annual air temperature: 71 to 73 degrees F Mean annual water temperature: 73 to 75 degrees F Mean annual precipitation: 25 to 35 inches
Padre Island National Seashore, Texas 105
Precipitation pattern: November through April are the driest months, with a second dry period in July. September is the wettest month.
Frost-free period: 310 to 350 days Bathymetry: 0 to 5 feet below sea level
Geographically Associated Soils
These are the Arrada, Satatton, Tatton, Twinpalms, and Yarborough series. Arrada, Satatton, and Tatton soils occur on slightly higher wind-tidal flat landforms. Twinpalms soils are somewhat poorly drained, have lower salinity and sodicity, and
occur on higher positions on spoil pile islands. Yarborough soils occur on higher positions on spoil pile islands.
Drainage and Permeability
Very poorly drained. These soils are permanently submersed.
Use and Vegetation
Used as aquatic wildlife habitat and for recreation. They are important to the food chain of many commercial and sport fin fish as well as shellfish. Native vegetation is predominantly shoalgrass. Some areas have sparse to almost no vegetation, while other areas have manateegrass, turtlegrass, and widgeongrass, especially in areas of deeper water depth. (An ecological site is not assigned).
Distribution and Extent
Gulf Coast Saline Prairies, Texas; MLRA 150B; Land Resource Region T-Atlantic and Gulf Coast Lowlands; Shallow water grassflats associated with bay systems along the lower Gulf Coast of Texas; the series is of small extent.
MLRA Office Responsible
Temple, Texas
Series Proposed
Kenedy County, Texas, 2004. The name is from Baffin Bay in the survey area.
Remarks
The series was formerly included as areas of water. The series was established based on the rooted vegetation that grows in certain bays. Diagnostic horizons and features recognized in this pedon are:
Particle-size control section: 10 to 40 inches (Cg1, Cg2, and Cg3 horizons) Ochric epipedon: 0 to 8 inches (Ag1 and Ag2 horizons) n-value: More than 0.7: 0 to 23 inches (A1, Ag2, Cg1, and Cg2 horizons) Iron depletions: Depleted matrix at 0 to 80 inches (A1, Ag2, Cg1, Cg2, Cg3, Cg4,
Cg5, and Cg6 horizons) Peraquic feature: From 0 to 60 inches is permanently saturated (Ag1, Ag2, Cg1, Cg2,
Cg3, and Cg4 horizons) Endosaturation: Permanently submersed
Additional Data
TAMU reference sample data for organic carbon from the type location S04TX-261-001, S04TX-261-002, and S04TX-261-003. Particle-size analysis, and salinity and sodicity tests on three pedons were performed at the soil survey project office.
Taxonomic Version
Keys to Soil Taxonomy, Ninth Edition, 2003
106 Soil Survey of
Daggerhill Series The Daggerhill series consists of very deep, excessively drained, rapidly permeable
soils that formed in deep sandy eolian sediments on barrier islands. These soils are on undulating to strongly rolling foredunes and stabilized back-island dune fields. These soils are subject to rare flooding by high storm surge from strong tropical storms. Slope ranges from 2 to 12 percent. Mean annual temperature is about 72 degrees F and mean annual precipitation is about 27 inches.
Taxonomic Class
Hyperthermic, uncoated Ustic Quartzipsamments
Typical Pedon
Daggerhill fine sand on a south facing, convex, 8 percent slope in rangeland at an elevation of 20 feet. (Colors are for dry soil unless otherwise stated.)
A1—0 to 8 inches; pale brown (10YR 6/3) fine sand, brown (10YR 5/3), moist; single grain; loose; 4 percent very fine and fine roots; 2 percent sand-sized seashell fragments; nonsaline; SAR is about 2; noneffervescent; strongly alkaline; clear smooth boundary.
A2—8 to 18 inches; pale brown (10YR 6/3) fine sand, brown (10YR 5/3), moist; single grain; loose; 3 percent very fine and fine roots; 1 percent sand-sized seashell fragments; nonsaline; SAR is about 1; noneffervescent; strongly alkaline; clear smooth boundary. (Combined thickness of the A horizons is 9 to 28 inches.)
C1—18 to 47 inches; very pale brown (10YR 7/3) fine sand, pale brown (10YR 6/3), moist; single grain; loose; 2 percent very fine and fine roots; 1 percent sand-sized seashell fragments; nonsaline; SAR is about 2; noneffervescent; strongly alkaline; gradual smooth boundary.
C2—47 to 80 inches; very pale brown (10YR 7/3) fine sand, pale brown (10YR 6/3), moist; single grain; loose; 1 percent very fine and fine roots; 7 percent sand-sized seashell fragments; nonsaline; SAR is about 2; noneffervescent; strongly alkaline. (Combined thickness of the C horizons is 52 to 71 inches.)
Type Location
Kenedy County, Texas; from the intersection of Park Road 22 and the county line between Kleberg and Nueces Counties; 8.0 miles southwest on Park Road 22 to the pay station entrance of Padre Island National Seashore; 4.5 miles southwest on Park Road 22 to the end of the paved road; 11.0 miles south along the beach (1 mile south of the 10 mile marker); 1,400 feet northwest on slope of dune in rangeland. South Bird Island Southeast, Texas USGS topographic quadrangle; Lat. 27 degrees, 15 minutes, 55.1 seconds N; Long. 97 degrees, 21 minutes, 14.4 seconds W; NAD 83.
Range in Characteristics
Soil moisture: An ustic moisture regime. The soil moisture control section is dry in some or all parts for more than 90 cumulative days in normal years. It is also either moist in some or all parts for 180 days or more cumulative, or moist for 90 or more consecutive days in normal years.
Mean annual soil temperature: 74 to 76 degrees F Particle-size control section (weighted average): Less than 5 percent silt plus clay
Clay content: 0 to 3 percent Sand content: 95 to 99 percent
A Horizon
Hue: 10YR Value: 5 to 7 (4 to 6 moist)
Padre Island National Seashore, Texas 107
Chroma: 2 to 4 Texture: Fine sand Sand-sized seashell fragments: 1 to 7 percent EC (dS/m): 0 to 2 SAR: 0 to 8, but typically less than 4 Reaction: Slightly alkaline to strongly alkaline
C Horizon
Hue: 10YR Value: 7 or 8 (6 or 7 moist) Chroma: 2 to 4 Texture: Fine sand Masses of oxidized iron: Quantity—0 to 3 percent; size—fine or medium; contrast—
distinct or prominent; boundary—clear or sharp; shades—brown, red, or yellow Sand-sized seashell fragments: 1 to 10 percent EC (dS/m): 0 to 2 SAR: 0 to 8, but typically less than 4 Reaction: Slightly alkaline to strongly alkaline
Competing Series
The Greenhill (TX) series is in the same family. Similar soils include the Arenisco (TX), Falfurrias (TX), Galveston (TX), Padre (TX), Panam (TX), and Rockport (TX) series.
Greenhill soils have strongly acid to neutral soil reaction class throughout and do not have seashell fragments.
Arenisco and Falfurrias soils are Typic Ustipsamments, have mixed sand mineralogy, and are not subject to storm surge from tropical storms.
Galveston soils have mixed sand mineralogy and are dry in the soil moisture control section for less than 90 cumulative days.
Padre and Panam soils are Aquic Quartzipsamments. Rockport soils are Oxyaquic Quartzipsamments and have more than 5 percent silt
plus clay in the particle-size control section.
Geographic Setting
Parent material: Deep sandy eolian sediments of Holocene age Landform: Foredunes and stabilized back-island dune fields of barrier islands Slope: 2 to 12 percent Mean annual temperature: 71 to 73 degrees F Mean annual precipitation: 25 to 35 inches Precipitation pattern: November through April are the driest months, with a second dry
period in July. September is the wettest month. Frost-free period: 310 to 350 days Elevation: 5 to 45 feet Thornthwaite P-E Index: 31 to 44
Geographically Associated Soils
These are the Greenhill, Madre, Malaquite, Mustang, Novillo, Padre, and Panam series.
Greenhill soils are on a similar landform. Madre soils are Sodic Psammaquents and occur on lower, planar to concave
landforms on barrier flats. Malaquite soils are Typic Halaquepts and occur on lower, planar to concave
landforms on barrier flats. Mustang soils are Typic Psammaquents and occur on lower, planar to concave
landforms on barrier flats.
108 Soil Survey of
Novillo soils are Typic Psammaquents and occur on lower, concave landforms in fresh-water marshes on barrier flats.
Padre and Panam soils occur on lower, convex landforms on low stabilized dunes on barrier flats.
Drainage and Permeability
Excessively drained. Permeability is rapid. Runoff is very low. The soil is rarely flooded for very brief periods by high storm surge during strong tropical storms.
Use and Vegetation
Used primarily as wildlife habitat and for recreation. Native vegetation consists mostly of mid to tall grasses and forbs such as bitter panicum, seaoats uniola, seacoast bluestem, camphorweed, and partridge pea. (Coastal Dune ecological site, PE 31-44, 150BY714TX)
Distribution and Extent
Gulf Coast Saline Prairie; Land Resource Region T-Atlantic and Gulf Coast Lowlands; MLRA 150B. Barrier islands along the lower Gulf Coast of Texas; the series is of moderate extent.
MLRA Office Responsible
Temple, Texas
Series Proposed
Kenedy County, Texas; 2002. The name is from a USGS benchmark on Padre Island National Seashore.
Remarks
This soil was formerly included in the Galveston series or mapped as the miscellaneous area—Coastal Dune. The series is separated based primarily on the difference in soil moisture regime and sand mineralogy.
Diagnostic horizons and features recognized in this pedon are: Ochric epipedon: 0 to 18 inches (A1 and A2 horizons) Particle-size control section: 10 to 40 inches (A2 and C1 horizons)
Additional Data
TAMU reference sample data for pH, salinity, sodicity, and mineralogy from S01TX-273-008. Particle-size analysis, and salinity and sodicity tests performed on six pedons at the soil survey project office.
Taxonomic Version
Keys to Soil Taxonomy, Ninth Edition, 2003.
Greenhill Series The Greenhill series consists of very deep, excessively drained, rapidly permeable
soils that formed in deep sandy eolian sediments on barrier islands (fig. 26). These soils are on undulating to strongly rolling foredunes and stabilized back-island dune fields. These soils are subject to rare flooding by high storm surge from strong tropical storms. Slope ranges from 2 to 12 percent. Mean annual temperature is about 72 degrees F and mean annual precipitation is about 27 inches.
Taxonomic Class
Hyperthermic, uncoated Ustic Quartzipsamments
Padre Island National Seashore, Texas 109
Typical Pedon
Greenhill fine sand on a south facing, convex, 8 percent slope in rangeland at an elevation of 20 feet. (Colors are for dry soil unless otherwise stated.)
A1—0 to 10 inches; pale brown (10YR 6/3) fine sand, brown (10YR 4/3), moist; single grain; loose; 3 percent very fine and fine roots and 1 percent medium roots; nonsaline; SAR is about 1; noneffervescent; slightly acid; clear wavy boundary.
A2—10 to 28 inches; pale brown (10YR 6/3) fine sand, brown (10YR 5/3), moist; single grain; loose; 2 percent very fine and fine roots; nonsaline; SAR is about 4; noneffervescent; moderately acid; gradual smooth boundary. (Combined thickness of the A horizon is 21 to 35 inches.)
C1—28 to 43 inches; light gray (10YR 7/2) fine sand, pale brown (10YR 6/3), moist; single grain; loose; 1 percent very fine and fine roots; 3 percent very pale brown (10YR 7/3) krotovina; nonsaline; SAR is about 3; noneffervescent; moderately acid; gradual smooth boundary.
C2—43 to 60 inches; very pale brown (10YR 7/3) fine sand, pale brown (10YR 6/3), moist; single grain; loose; 1 percent very fine roots; 4 percent light gray (10YR 7/2) krotovina; nonsaline; SAR is about 2; noneffervescent; moderately acid; gradual smooth boundary.
C3—60 to 80 inches; very pale brown (10YR 8/3) fine sand, very pale brown (10YR 7/3), moist; single grain; loose; 1 percent very fine roots; 1 percent fine and medium prominent reddish yellow (7.5YR 6/6) and 1 percent fine prominent yellowish red (5YR 5/8) masses of oxidized iron with sharp boundaries lining pores; nonsaline; SAR is about 1; noneffervescent; moderately acid. (Combined thickness of the C horizon is 45 to 59 inches.)
Type Location
Kleberg County, Texas; from the intersection of Park Road 22 and the county line between Kleberg and Nueces Counties; 8.0 miles southwest on Park Road 22 to the pay station entrance of Padre Island National Seashore; 0.8 mile southwest on Park Road 22 to the intersection of Novillo and Bird Island Basin Road; 0.5 mile east and northeast on caliche and shell road; 200 feet east on slope of dune ridge in rangeland. South Bird Island Basin, Texas topographic quadrangle; Lat. 27 degrees, 27 minutes, 44.8 seconds N; Long. 97 degrees, 17 minutes, 01.5 seconds W; NAD 83.
Range in Characteristics
Soil moisture: An Ustic moisture regime. The soil moisture control section is dry in some or all parts for more than 90 cumulative days in normal years. It is also either moist in some or all parts for 180 days or more cumulative, or moist for 90 or more consecutive days in normal years.
Mean annual soil temperature: 74 to 76 degrees F Depth to masses of oxidized iron: 24 to 80 inches Particle-size control section (weighted average): Less than 5 percent silt plus clay
Clay content: 0 to 3 percent Sand content: 95 to 99 percent
A Horizon
Hue: 10YR Value: 6 or 7 (4 to 6 moist) Chroma: 3 Texture: Fine sand EC (dS/m): 0 to 2 SAR: 0 to 4 Reaction: Strongly acid to neutral
110 Soil Survey of
C Horizon
Hue: 10YR Value: 7 or 8 (6 or 7 moist) Chroma: 2 or 3 Texture: Fine sand Masses of oxidized iron: Quantity—0 to 5 percent; size—fine or medium; contrast—faint
to prominent; boundary—clear or sharp; shades—brown, red, or yellow EC (dS/m): 0 to 2 SAR: 0 to 4 Reaction: Strongly acid to neutral
Competing Series
This is the Daggerhill (TX) series in the same family. Similar soils include the Arenisco (TX), Falfurrias (TX), Galveston (TX), Padre (TX), Panam (TX), and Rockport (TX) series.
Daggerhill soils have slightly to strongly alkaline soil reaction class throughout and have seashell fragments.
Arenisco and Falfurrias soils are Typic Ustipsamments, have mixed sand mineralogy and are not subject to storm surge from tropical storms.
Galveston soils have mixed sand mineralogy and are dry in the soil moisture control section for less than 90 cumulative days.
Padre and Panam soils are Aquic Quartzipsamments Rockport soils are Oxyaquic Quartzipsamments and have more than 5 percent silt
plus clay in the particle-size control section.
Geographic Setting
Parent material: Deep sandy eolian sediments of Holocene age Landform: Foredunes and stabilized back-island dune fields of barrier islands Slope: 2 to 12 percent Mean annual temperature: 71 to 73 degrees F Mean annual precipitation: 25 to 35 inches Precipitation pattern: November through April are the driest months, with a second dry
period in July. September is the wettest month. Frost-free period: 310 to 350 days Elevation: 5 to 30 feet Thornthwaite P-E Index: 31 to 44
Geographically Associated Soils
These are the Daggerhill, Madre, Malaquite, Mustang, Novillo, Padre, and Panam series.
Daggerhill soils are on a similar landscapes. Madre soils are Sodic Psammaquents and occur on a lower, planar to concave
landforms on barrier flats. Malaquite soils are Typic Halaquepts and occur on a lower, planar to concave
landforms on barrier flats. Mustang soils are Typic Psammaquents and occur on a lower, planar to concave
landforms on barrier flats. Novillo soils are Typic Psammaquents and occur on a lower, concave landforms in
fresh-water marshes on barrier flats. Padre and Panam soils occur on lower, convex landforms on low stabilized dunes on
barrier flats.
Drainage and Permeability
Excessively drained. Permeability is rapid. Runoff is very low. The soil is rarely flooded for very brief periods by high storm surge during strong tropical storms.
Padre Island National Seashore, Texas 111
Use and Vegetation
Used primarily as wildlife habitat and for recreation. Native vegetation consists mostlyof mid to tall grasses and forbs such as bitter panicum, seaoats uniola, seacoast bluestem, camphorweed, and partridge pea. (Coastal Dune ecological site, PE 31-44, 150BY714TX)
Distribution and Extent
Gulf Coast Saline Prairies; Land Resource Region T-Atlantic and Gulf Coast Lowlands; MLRA 150B. Barrier islands along the lower Gulf Coast of Texas; the series is of moderate extent.
MLRA Office Responsible
Temple, Texas
Series Proposed
Kleberg County, Texas; 2001. The name is from a USGS benchmark on Padre Island National Seashore.
Remarks
This soil was formerly included in the Galveston series or mapped as the miscellaneous area—Coastal Dunes. The series is separated based primarily on the difference in soil moisture regime and sand mineralogy.
Diagnostic horizons and features recognized in this pedon are: Ochric epipedon: 0 to 28 inches (A1 and A2 horizons) Particle-size control section: 10 to 40 inches (A2 and C1 horizons) Masses of oxidized iron: 60 to 80 inches (C3 horizon)
Additional Data
NSSL Characterization data from the type location (S03TX-273-001). TAMU reference sample data for pH, salinity, sodicity, and mineralogy from S01TX-273-006 and S01TX-273-007. Particle-size analysis on four pedons and salinity and sodicity tests on seven pedons were performed at the soil survey project office.
Taxonomic Version
Keys to Soil Taxonomy, Ninth Edition, 2003.
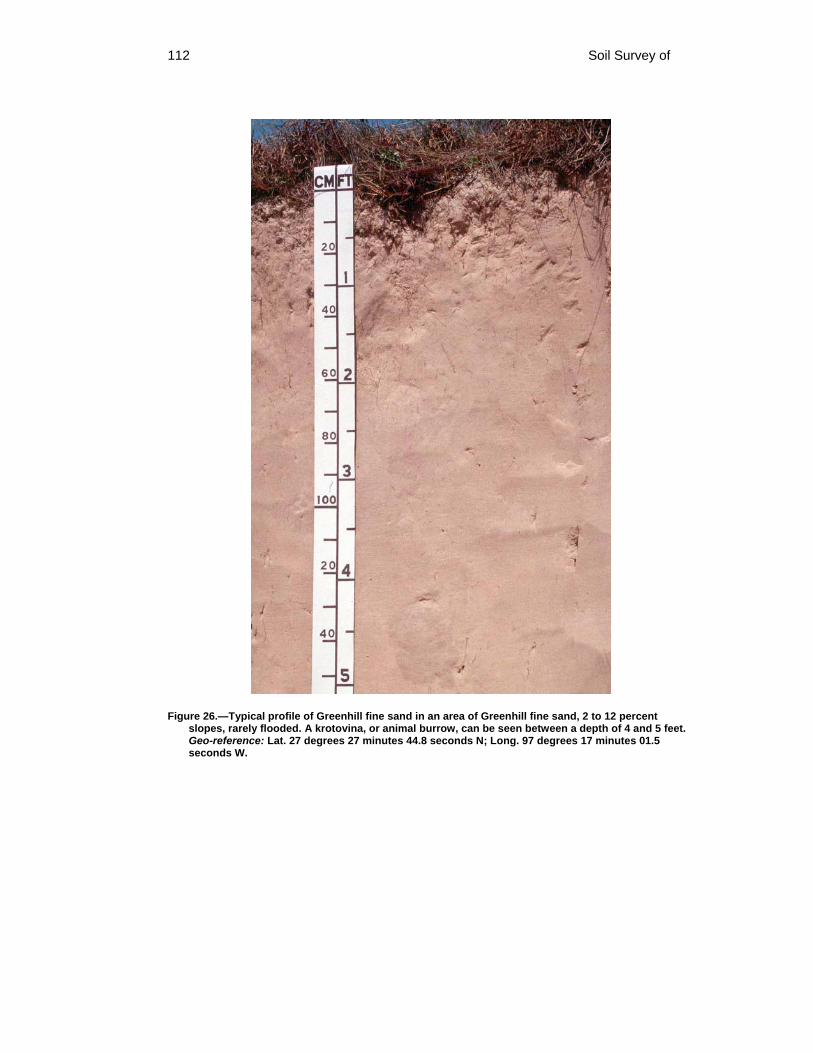
112 Soil Survey of
Figure 26.—Typical profile of Greenhill fine sand in an area of Greenhill fine sand, 2 to 12 percent slopes, rarely flooded. A krotovina, or animal burrow, can be seen between a depth of 4 and 5 feet. Geo-reference: Lat. 27 degrees 27 minutes 44.8 seconds N; Long. 97 degrees 17 minutes 01.5 seconds W.
Padre Island National Seashore, Texas 113
Madre Series The Madre series consists of very deep, poorly drained, very slowly permeable soils
that formed in sandy eolian and storm washover sediments on barrier islands. These nearly level soils are on planar to concave barrier flats. These soils are subject to occasional flooding by high storm surge from strong tropical storms, and are ponded after periods of heavy rainfall. Slope ranges from 0 to 1 percent. Mean annual temperature is about 72 degrees F and mean annual precipitation is about 27 inches.
Taxonomic Class
Siliceous, hyperthermic Sodic Psammaquents
Typical Pedon
Madre fine sand in area of Madre-Malaquite complex on a slightly concave, 0 to 1 percent slopes in rangeland at an elevation of 3 feet. (Colors are for moist soil unless otherwise stated.)
An1—0 to 4 inches; grayish brown (10YR 5/2), fine sand, light brownish gray (10YR 6/2), dry; weak fine and medium subangular blocky structure parting to single grain; very friable, soft; 6 percent very fine and fine roots; 3 percent fine and medium distinct yellowish brown (10YR 5/6) masses of oxidized iron with clear boundaries lining pores; very slightly saline; SAR is about 16; slightly alkaline; gradual smooth boundary.
An2—4 to 11 inches; grayish brown (10YR 5/2), fine sand, light brownish gray (10YR 6/2), dry; weak fine and medium subangular blocky structure parting to single grain; very friable, soft; 4 percent very fine and fine roots; 6 percent fine and medium distinct brownish yellow (10YR 6/6) masses of oxidized iron with clear boundaries lining pores; 1-inch thick strata of grayish brown (10YR 5/2) and very dark grayish brown (10YR 3/2) at lower boundary; very slightly saline; SAR is about 16; moderately alkaline; clear smooth boundary. (Combined thickness of the An horizon is 5 to 18 inches.)
Cng1—11 to 22 inches; light brownish gray (10YR 6/2), fine sand, light gray (10YR 7/2), dry; weak medium subangular blocky structure parting to single grain; loose; 4 percent very fine and fine roots and 1 percent roots; 4 percent fine and medium distinct brownish yellow (10YR 6/6) and olive yellow (2.5Y 6/6) masses of oxidized iron with clear boundaries lining pores; very slightly saline; SAR is about 14; slightly alkaline; abrupt smooth boundary.
Cng2—22 to 28 inches; grayish brown (2.5Y 5/2), fine sand, light brownish gray (2.5Y 6/2), dry; single grain; loose; 3 percent very fine and fine roots; 5 percent medium faint gray (10YR 5/1) iron depletions with diffuse boundaries in matrix; very slightly saline; SAR is about 18; neutral; clear smooth boundary.
Cng3—28 to 41 inches; light brownish gray (2.5Y 6/2), fine sand, light gray (2.5Y 7/2), dry; single grain; loose; 3 percent very fine and fine roots and 1 percent medium roots; 2 percent fine faint light olive brown (2.5Y 5/3) masses of oxidized iron with clear boundaries lining pores; 5 percent medium and coarse distinct gray (2.5Y 5/1) iron depletions with clear boundaries in matrix; very slightly saline; SAR is about 17; neutral; abrupt smooth boundary. (Combined thickness of the Cng horizon is 27 to 67 inches.)
Anb—41 to 46 inches; dark gray (10YR 4/1), fine sand, grayish brown (10YR 5/2), dry; single grain; loose; 2 percent very fine and fine roots; 5 percent medium and coarse faint gray (2.5Y 5/1) iron depletions with diffuse boundaries in matrix; very slightly saline; SAR is about 16; neutral; clear smooth boundary. (Thickness is 0 to 18 inches.)
Cngb1—46 to 53 inches; dark grayish brown (2.5Y 4/2), fine sand, grayish brown (2.5Y 5/2), dry; single grain; loose; 1 percent very fine and fine roots; 5 percent medium and
114 Soil Survey of
coarse faint dark gray (2.5Y 4/1) and 5 percent medium distinct light brownish gray (10YR 6/2) iron depletions with diffuse boundaries in matrix; very slightly saline; SAR is about 15; neutral; clear smooth boundary.
Cngb2—53 to 80 inches; grayish brown (2.5Y 5/2), fine sand, light brownish gray (2.5Y 6/2), dry; single grain; loose; 1 percent very fine and fine roots; 5 percent medium and coarse faint light brownish gray (10YR 6/2) iron depletions with diffuse boundaries in matrix; very slightly saline; SAR is about 11; neutral. (Combined thickness of the Cngb horizon is 0 to 34 inches.)
Type Location
Kleberg County, Texas; from the intersection of Park Road 22 and the county line between Kleberg and Nueces Counties; 8.0 miles southwest on Park Road 22 to the pay station entrance of Padre Island National Seashore; 0.8 mile southwest on Park Road 22 to the intersection of Novillo and Bird Island Basin Road; 0.42 mile west-northwest on Bird Island Basin Road; 150 feet northeast in rangeland. South Bird Island, Texas USGS topographic quadrangle; Lat. 27 degrees, 28 minutes, 00.4 seconds N; Long. 97 degrees, 17 minutes, 48.4 seconds W; NAD 83.
Range in Characteristics
Soil moisture: An aquic soil moisture regime. Although rainfall amounts are that of an ustic moisture regime, the soil has a permanent water table at depths of 10 to 30 inches throughout the year in most years. The soil is rarely, if ever, at the wilting point below 10 inches, and it is saturated or ponded for periods of several days or weeks following heavy rains.
Mean annual soil temperature: 74 to 76 degrees F Depth to masses of oxidized iron: 0 to 10 inches Depth to iron depletions: 5 to 18 inches Depth to endosaturation: 10 to 30 inches in most years Particle-size control section (weighted average): Less than 5 percent silt plus clay
Clay content: 0 to 5 percent Sand content: 95 to 99 percent
A Horizon
Hue: 10YR Value: 4 to 6 Chroma: 2 or 3 Texture: Fine sand Clay content: 0 to 5 percent Masses of oxidized iron: Quantity—1 to 12 percent; size—fine or medium; contrast—faint
to prominent; boundary—clear or sharp; shades—brown or yellow Iron depletions: Quantity—0 to 2 percent; size—fine or medium; contrast—faint;
boundary—diffuse or clear; shades—gray EC (dS/m): 0 to 4 SAR: 5 to 20 Reaction: Neutral to strongly alkaline
Cng Horizon
Hue: 10YR, 2.5Y, 5Y or N/ Value: 4 to 6 Chroma: 0 to 2 Texture: Fine sand Clay content: 0 to 5 percent Masses of oxidized iron: Quantity—2 to 20 percent; size—fine or medium; contrast—faint
to prominent; boundary—clear or sharp; shades—brown or yellow
Padre Island National Seashore, Texas 115
Iron depletions: Quantity—1 to 15 percent; size—fine or medium; contrast—faint or distinct; boundary—diffuse or clear; shades—gray
EC (dS/m): 2 to 8 SAR: 13 to 40 Reaction: Neutral to strongly alkaline
Anb Horizon (where present)
Hue: 10YR, 2.5Y, 5GY, or 5B Value: 3 or 4 Chroma: 1 Texture: Fine sand Clay content: 0 to 5 percent Masses of oxidized iron: Quantity—0 to 10 percent; size—fine to coarse; contrast—faint
to prominent; boundary—clear or sharp; shades—brown or yellow Iron depletions: Quantity—1 to 5 percent; size—fine or medium; contrast—faint or
distinct; boundary—diffuse or clear; shades—gray EC (dS/m): 2 to 8 SAR: 13 to 40 Reaction: Neutral to strongly alkaline
Cngb Horizon (where present)
Hue: 10YR, 2.5Y, 5Y, or 5GY Value: 4 or 5 Chroma: 1 or 2 Texture: Fine sand Clay content: 0 to 5 percent Masses of oxidized iron: Quantity—0 to 10 percent; size—fine or medium; contrast—faint
or distinct; boundary—clear or sharp; shades—brown or yellow Iron depletions: Quantity—2 to 20 percent; size—fine to coarse; contrast—faint or
distinct; boundary—diffuse or clear; shades—gray EC (dS/m): 2 to 8 SAR: 13 to 40 Reaction: Neutral to strongly alkaline
Competing Series
These are the Satatton (TX) and Tatton (TX) series in the same family. Similar soils include the Basinger (FL), Captiva (FL), Dianola (TX), Hallandale (FL), Kesson (FL), Malaquite (TX), Margate (FL), Moultrie (FL), Mustang (TX), Novillo (TX), Pompano (FL), and Valkaria (FL) series.
Satatton soils have SAR values of more than 40, EC values of more than 30, and are frequently flooded.
Tatton soils have SAR values of more than 40, EC values of more than 30, are very poorly drained, and very frequently flooded.
Basinger, Moultrie, and Valkaria soils are Spodic Psammaquents Captiva and Margate soils are Mollic Psammaquents Dianola, Kesson, Novillo, Pompano (FL), and Mustang soils are Typic
Psammaquents. In addition, Dianola soils have more than 5 percent silt plus clay within the 10- to 40-inch control section.
Hallandale soils are Lithic Psammaquents Malaquite soils are Typic Halaquepts
Geographic Setting
Parent material: Eolian and storm washover sandy sediments of Holocene age
116 Soil Survey of
Landform: Nearly level barrier flats or shallow depressions between dunes and low mounds of barrier islands
Slope: 0 to 1 percent Mean annual air temperature: 71 to 73 degrees F Mean annual precipitation: 25 to 35 inches Precipitation pattern: November through April are the driest months, with a second dry
period in July. September is the wettest month. Frost-free period: 310 to 350 days Elevation: 0 to 5 feet Thornthwaite P-E Index: 31 to 44
Geographically Associated Soils
These are the Daggerhill, Greenhill, Malaquite, Mustang, Novillo, Padre, Panam, Satatton, and Tatton series.
Daggerhill and Greenhill soils are Ustic Quartzipsamments and are on a higher landform on convex foredunes and back-island dune fields.
Malaquite soils are on a similar to slightly lower landform. Mustang soils are on a similar to slightly higher landform. Novillo soils are Typic Psammaquents, are very poorly drained and are on a lower
landform in fresh-water marshes. Padre and Panam soils are Aquic Quartzipsamments and are on a slightly higher
landform on low dunes or mounds on barrier flats. Satatton and Tatton soils are on a lower landform on planar to concave wind-tidal
flats.
Drainage and Permeability
Poorly drained; runoff is negligible due to the depressional feature of the barrier flat. Permeability is rapid above the high water table, but the overall permeability class is very slow. These soils are subject to occasional flooding for brief periods by high storm surge during strong tropical storms. The soils are ponded for several days to weeks following periods of heavy rainfall.
Use and Vegetation
Used primarily as wildlife habitat and for recreation. Native vegetation is marshay cordgrass, seashore dropseed, seashore saltgrass, saltflat grass, and star-topped sedge. (Firm Brackish Marsh ecological site, 150BY715TX).
Distribution and Extent
Gulf Coast Saline Prairies; Land Resource Region T-Atlantic and Gulf Coast Lowlands; MLRA 150B; Barrier islands along the lower Gulf Coast of Texas; the series is of moderate extent.
MLRA Office Responsible
Temple, Texas
Series Proposed
Kleberg County, Texas, 2002. The name is from the Laguna Madre, which is between Padre Island and the mainland.
Remarks
The series was formerly included in the Mustang series and are separated based on the difference in the sodium adsorption ratio (SAR) of the soils.
Diagnostic horizons and features recognized in this pedon are:
Padre Island National Seashore, Texas 117
Aquic conditions: These soils remain saturated and have aquic conditions for at least 1 month in most years from 11 to 80 inches (Cng1, Cng2, Cng3, Anb, Cngb1, and Cngb2 horizons)
Particle-size control section: 10 to 40 inches (An2, Cng1, Cng2, and Cng3 horizons)
Ochric epipedon: 0 to 11 inches (An1 and An2 horizons) Sodic feature (SAR more than 13): 0 to 80 inches (An1, An2, Cng1, Cng2, Cng3,
Anb, Cngb1, and Cngb2 horizons) Masses of oxidized iron: 0 to 80 inches (An1, An2, Cng1, Cng2, Cng3, Anb,
Cngb1, and Cngb2 horizons) Iron depletions or depleted matrix: 11 to 80 inches (Cng1, Cng2, Cng3, Anb,
Cngb1, and Cngb2 horizons) Endosaturation: 11 to 80 inches (Cng1, Cng2, Cng3, Anb, Cngb1, and Cngb2
horizons)
Additional Data
Particle-size analysis on five pedons, and salinity and sodicity tests on six pedons were performed at the soil survey project office.
Taxonomic Version
Keys to Soil Taxonomy, Ninth Edition, 2003
Malaquite Series The Malaquite series consists of very deep, poorly drained, very slowly permeable
soils that formed in sandy eolian and storm washover sediments on barrier islands. These nearly level soils are on planar to concave barrier flats. These soils are subject to occasional flooding by high storm surge from strong tropical storms, and are ponded after periods of heavy rainfall. Slope ranges from 0 to 1 percent. Mean annual temperature is about 72 degrees F and mean annual precipitation is about 27 inches.
Taxonomic Class
Sandy, siliceous, hyperthermic Typic Halaquepts
Typical Pedon
Malaquite fine sand in an area of Madre-Malaquite complex on a slightly concave, 0 to 1 percent slopes in rangeland at an elevation of 2 feet (fig. 27). (Colors are for moist soil unless otherwise stated.)
Anz—0 to 5 inches; grayish brown (10YR 5/2) fine sand, light gray (10YR7/2), dry; weak fine and medium subangular blocky structure; very friable, soft; 5 percent very fine and fine and 3 percent medium roots; 5 percent fine and medium distinct yellowish brown (10YR 5/6) masses of oxidized iron with sharp boundaries lining pores; 1 percent fine shell fragments; strongly saline; SAR is about 35; slighty effervescent; moderately alkaline; clear smooth boundary. (Thickness is 3 to 18 inches.)
Cnzg1—5 to 12 inches; light brownish gray (10YR 6/2) fine sand, light gray (2.5Y 7/2), dry; weak fine and medium subangular blocky structure; very friable, soft; 4 percent very fine and fine roots; 1 percent fine and medium prominent black (N 2.5/0) iron-manganese masses with sharp boundaries lining pores and 1 percent medium and coarse faint gray (10YR 5/1) iron depletions with clear boundaries in matrix; 3 percent fine prominent strong brown (7.5YR 4/6) and 7 percent fine and medium prominent yellowish brown (10YR 5/6) masses of oxidized iron with sharp boundaries lining pores; 1 percent fine shell fragments; moderately saline; SAR is about 30; very slightly effervescent; strongly alkaline; clear smooth boundary.
118 Soil Survey of
Cnzg2—12 to 21 inches; light brownish gray (2.5Y 6/2) fine sand, light gray (10YR 7/2), dry; weak coarse prismatic structure; loose; 3 percent very fine and fine roots; 4 percent fine and medium distinct black (N2.5/0) iron-manganese masses with sharp boundaries lining pores; 1 percent fine prominent yellowish red (5YR 4/6) masses of oxidized iron and 2 percent medium prominent brownish yellow (10YR 6/6) masses of oxidized iron with sharp boundaries lining pores; 5 percent medium distinct gray (10YR 5/1) iron depletions with clear boundaries in matrix; 2 percent fine shell fragments; strongly saline; SAR is about 36; noneffervescent; strongly alkaline; clear smooth boundary. (Combined thickness of the Cnzg horizon is 9 to 75 inches.)
Anzb—21 to 27 inches; very dark gray (2.5Y 3/1) fine sand, grayish brown (2.5Y 5/2), dry; single grain; loose; 2 percent very fine and fine roots; 3 percent medium distinct dark gray (2.5Y 4/1) iron depletions with clear boundaries in matrix; 1 percent fine shell fragments; strongly saline; SAR is about 37; very slightly effervescent; moderately alkaline; clear smooth boundary. (Thickness is 0 to 22 inches.)
Cnzgb1—27 to 38 inches; gray (10YR 5/1) fine sand, light brownish gray (10YR 6/2), dry; single grain; loose; 1 percent very fine and fine roots; 2 percent fine distinct yellowish brown (10YR 5/4) masses of oxidized iron with sharp boundaries lining pores; 2 percent fine and medium distinct light brownish gray (10YR 6/2) iron depletions with diffuse boundaries in matrix; 10 percent fine and medium shell fragments; strongly saline; SAR is about 37; very slightly effervescent; moderately alkaline; clear smooth boundary.
Cnzgb2—38 to 69 inches; gray (2.5Y 6/1) fine sand, light gray (2.5Y7/1), dry; single grain; loose; 1 percent very fine and fine roots; 5 percent medium faint gray (2.5Y 5/1) iron depletions with diffuse boundaries in matrix; strongly saline; SAR is about 37; strongly effervescent; moderately alkaline; clear smooth boundary.
Cnzgb3—69 to 80 inches; greenish gray (10Y 6/1) fine sand, light gray (2.5Y 7/1), dry; single grain; loose; 1 percent very fine and fine roots; 3 percent medium distinct dark greenish gray (5GY 4/1) and 3 percent medium prominent dark gray (5Y 4/1) iron depletions with clear boundaries in matrix and 5 percent medium faint greenish gray (5GY 5/1) iron depletions with diffuse boundaries in matrix; 2 percent fine and medium shell fragments; strongly saline; SAR is about 41; slightly effervescent; moderately alkaline; clear smooth boundary. (Combined thickness of the Cnzgb horizon is 0 to 55 inches.)
Type Location
Kleberg County, Texas; from the intersection of Park Road 22 and the county line between Kleberg and Nueces Counties; 8.0 miles southwest on Park Road 22 to the pay station entrance of Padre Island National Seashore; 2.4 miles southwest on Park Road 22 to the end of the paved road; 7.0 miles south on beach to the entrance of Pan Am Road; 0.2 mile northwest, 3.2 miles southwest on Pan Am Road; 200 feet west in rangeland. South Bird Island Southeast, Texas topographic quadrangle; Lat. 27 degrees, 17 minutes, 27.0 seconds N; Long. 97 degrees, 21 minutes, 43.7 seconds W; NAD 83.
Range in Characteristics
Soil moisture: An aquic soil moisture regime. Although rainfall amounts are that of an ustic moisture regime, the soil has a permanent water table at depths of 10 to 30 inches throughout the year in most years. The soil is rarely, if ever, at the wilting point below 10 inches, and it is saturated or ponded for periods of several days or weeks following heavy rains.
Mean annual soil temperature: 74 to 76 degrees F Depth to masses of oxidized iron: 0 to 10 inches Depth to iron depletions: 6 to 24 inches Depth to endosaturation: 10 to 30 inches throughout the year Particle-size control section (weighted average):
Padre Island National Seashore, Texas 119
Clay content: 0 to 7 percent Sand content: 93 to 99 percent
Anz Horizon
Hue: 10YR or 2.5Y Value: 5 to 7 Chroma: 2 or 3 Texture: Fine sand Masses of oxidized iron: Quantity—1 to 10 percent; size—fine or medium; contrast—faint
to prominent; boundary—clear or sharp; shades—brown or yellow Iron depletions: Quantity—0 to 2 percent; size—fine or medium; contrast—faint or
distinct; boundary—diffuse or clear; shades—gray in the lower part EC (dS/m): 8 to 45 SAR: 30 to 50 Reaction: Neutral to strongly alkaline
Cnzg Horizon
Hue: 10YR, 2.5Y, 5Y, or N/ Value: 4 to 6 Chroma: 0 to 2 Texture: Fine sand Masses of oxidized iron: Quantity—2 to 20 percent; size—fine or medium; contrast—faint
to prominent; boundary—clear or sharp; shades—brown, olive, red, or yellow Iron depletions: Quantity—1 to 15 percent; size—fine to coarse; contrast—faint to
prominent; boundary—diffuse or clear; shades—gray EC (dS/m): 8 to 75 SAR: 25 to 70 Reaction: Neutral to strongly alkaline
Anzb Horizon (where present)
Hue: 10YR, 2.5Y, 5Y, 5GY, or N/ Value: 3 or 4 Chroma: 0 or 1 Texture: Fine sand Masses of oxidized iron: Quantity—0 to 2 percent; size—fine or medium; contrast—faint
or distinct; boundary—clear; shades—brown Iron depletions: Quantity—0 to 5 percent; size—fine or medium; contrast—faint or
distinct; boundary—diffuse or clear; shades—gray EC (dS/m): 20 to 75 SAR: 25 to 70 Reaction: Neutral to strongly alkaline
Cnzgb Horizon (where present)
Hue: 10YR, 2.5Y, 5Y, 10Y, 5GY, 5G or N/ Value: 4 to 6 Chroma: 0 or 1 Texture: Fine sand Masses of oxidized iron: Quantity—0 to 5 percent; size—fine or medium; contrast—faint
or distinct; boundary—clear or sharp; shades—brown or yellow Iron depletions: Quantity—0 to 15 percent; size—fine or medium; contrast—faint to
prominent; boundary—diffuse or clear; shades—gray or green EC (dS/m): 20 to 75 SAR: 25 to 70 Reaction: Neutral to strongly alkaline

120 Soil Survey of
Competing Series
There are no other series in the same family. Similar soils include the Arrada (TX), Barrada (TX), Dianola (TX), Madre (TX), Mustang (TX), Satatton (TX), Saucel (TX), Tatton (TX), Topo (TX), and Yarborough (TX) series.
Arrada, Barrada, and Dianola soils have higher clay content throughout. Madre soils are Sodic Psammaquents and do not have a salic horizon. Mustang soils are Typic Psammaquents. Satatton and Tatton soils are Sodic Psammaquents and have higher salinity
throughout. Saucel, Topo, and Yarborough soils have a coarse-loamy control section.
Geographic Setting
Parent material: Eolian and storm washover sandy sediments of Holocene age Landform: Nearly level barrier flats or shallow depressions between dunes and low
mounds of barrier islands Slope: 0 to 1 percent Mean annual air temperature: 71 to 73 degrees F Mean annual precipitation: 25 to 35 inches Precipitation pattern: November through April are the driest months, with a second dry
period in July. September is the wettest month. Frost-free period: 310 to 350 days Elevation: 0 to 5 feet Thornthwaite P-E Index: 31 to 44
Geographically Associated Soils
These are the Daggerhill, Greenhill, Madre, Mustang, Novillo, Padre, Panam, Satatton, and Tatton series.
Daggerhill and Greenhill soils are Ustic Quartzipsamments and are on a higher landform on convex foredunes and back-island dune fields.
Madre and Mustang soils are on a similar to slightly higher landform. Novillo soils are Typic Psammaquents, are very poorly drained and are on a lower
landform in fresh-water marshes. Padre and Panam soils are Aquic Quartzipsamments and are on a slightly higher
landform on low dunes or mounds on barrier flats. Satatton and Tatton soils are on a lower landform on planar to concave wind-tidal
flats.
Drainage and Permeability
Poorly drained; runoff is negligible due to the depressional feature of the barrier flat. Permeability is rapid above the high water table, but the overall permeability class is very slow. These soils are subject to occasional flooding for brief periods by high storm surge during strong tropical storms. The soils are ponded for several days to several weeks following periods of heavy rainfall.
Use and Vegetation
Used primarily as wildlife habitat and for recreation. Native vegetation is seashore saltgrass, saltflat grass, bushy sea-oxeye daisy, salicornia, and wolfberry with some interspersed barren areas. (Salt Flat ecological site, PE 31-44, 150BY651TX).
Distribution and Extent
Gulf Coast Saline Prairies; Land Resource Region T-Atlantic and Gulf Coast Lowlands; MLRA 150B; Barrier islands along the lower Gulf Coast of Texas; the series is of moderate extent.
Padre Island National Seashore, Texas 121
MLRA Office Responsible
Temple, Texas
Series Proposed
Kleberg County, Texas, 2002. The name is from the Malaquite Beach and Visitor's Center on Padre Island National Seashore.
Remarks
This series was formerly included in the Mustang series. The series are separated based on the difference in salinity and sodium adsorption ratio (SAR) of the soils.
Diagnostic horizons and features recognized in this pedon are: Aquic conditions: These soils remain saturated and have aquic conditions for at
least 1 month in most years from 5 to 80 inches (Cnzg1, Cnzg2, Anzb, Cnzgb1, Cnzgb2, and Cnzgb3 horizons)
Ochric epipedon: 0 to 5 inches (Anz horizon) Particle-size control section: 10 to 40 inches (Cnzg1, Cnzg2, Anzb, Cnzgb1, and
Cnzgb2 horizons) Sodic feature (SAR more than 13): 0 to 80 inches (Anz, Cnzg1, Cnzg2, Anzb,
Cnzgb1, Cnzgb2, and Cnzgb3 horizons) Masses of oxidized iron: 0 to 38 inches (Anz, Cnzg1, Cnzg2, Anzb, and Cnzgb1
horizons) Iron depletions or depleted matrix: 5 to 80 inches (Cnzg1, Cnzg2, Anzb, Cnzgb1,
Cnzgb2, and Cnzgb3 horizons) Endosaturation: 5 to 80 inches (Cnzg1, Cnzg2, Anzb, Cnzgb1, Cnzgb2, and
Cnzgb3 horizons)
Additional Data
NSSL Characterization data from the type location (S03TX-273-004). Particle-size analysis on seven pedons, and salinity and sodicity tests on eight pedons were performed at the soil survey project office.
Taxonomic Version
Keys to Soil Taxonomy, Ninth Edition, 2003
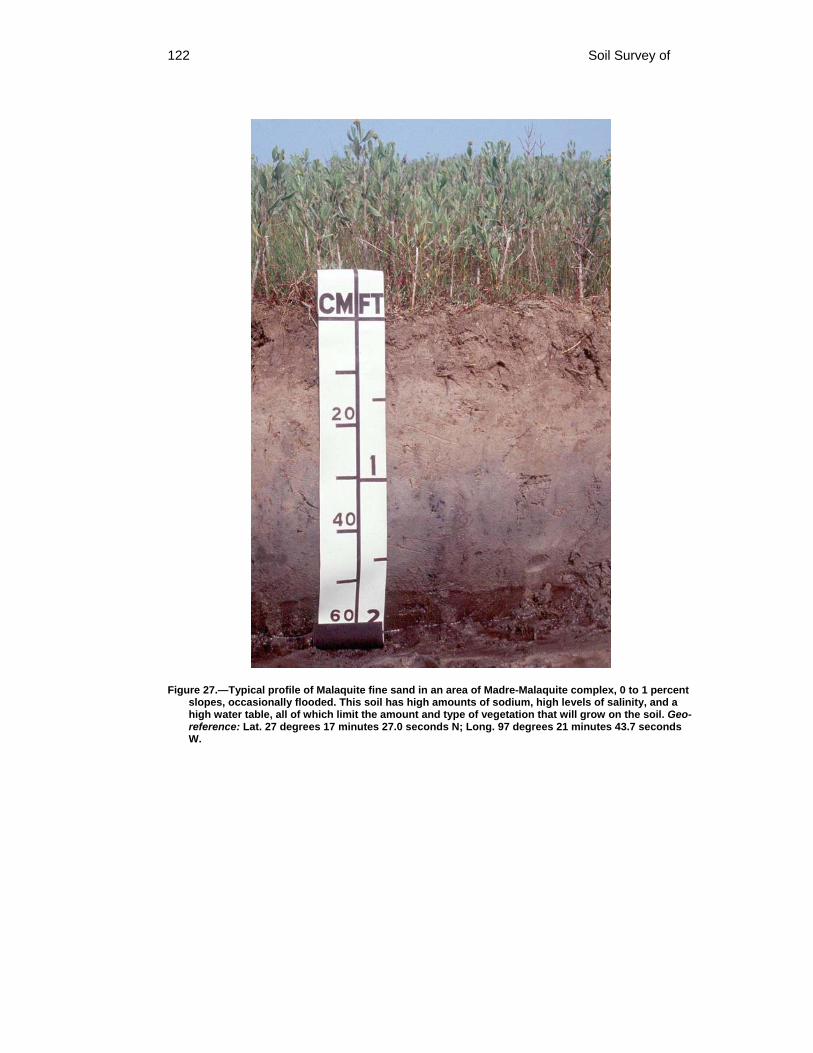
122 Soil Survey of
Figure 27.—Typical profile of Malaquite fine sand in an area of Madre-Malaquite complex, 0 to 1 percent slopes, occasionally flooded. This soil has high amounts of sodium, high levels of salinity, and a high water table, all of which limit the amount and type of vegetation that will grow on the soil. Geo-reference: Lat. 27 degrees 17 minutes 27.0 seconds N; Long. 97 degrees 21 minutes 43.7 seconds W.
Padre Island National Seashore, Texas 123
Mustang Series The Mustang series consists of very deep, poorly drained, very slowly permeable
soils that formed in sandy eolian and storm washover sediments on barrier islands. These nearly level soils are on planar to concave barrier flats. These soils are subject to occasional flooding by high storm surge from strong tropical storms, and are ponded after periods of heavy rainfall. Slope ranges from 0 to 1 percent. Mean annual temperature is about 72 degrees F and mean annual precipitation is about 27 inches.
Taxonomic Class
Siliceous, hyperthermic Typic Psammaquents
Typical Pedon
Mustang fine sand in an area of Panam-Mustang complex, 0 to 2 percent slopes on a slightly concave, 0 to 1 percent slopes in rangeland at an elevation of 3 feet. (fig. 28) (Colors are for moist soil unless otherwise stated.)
A1—0 to 4 inches; brown (10YR 5/3), fine sand, pale brown (10YR 6/3), dry; single grain; loose; 5 percent very fine and fine roots and 2 percent medium roots; 15 percent medium and coarse prominent gray (2.5Y 5/1) iron depletions with clear boundaries in the matrix; 1 percent fine and medium prominent olive yellow (2.5Y 6/6) masses of oxidized iron with sharp boundaries lining pores; 1 percent fine shell fragments; nonsaline; SAR is about 10; slightly effervescent; slightly alkaline; clear smooth boundary.
A2—4 to 11 inches; pale brown (10YR 6/3), fine sand, very pale brown (10YR 7/3), dry; single grain; loose; 4 percent very fine and fine roots; 2 percent fine and medium distinct light brownish gray (2.5Y 6/2) iron depletions with diffuse boundaries in the matrix; 2 percent fine and medium distinct light yellowish brown (2.5Y 6/4) and 1 percent fine and medium prominent strong brown (7.5YR 5/8) masses of oxidized iron with sharp boundaries lining pores; 1 percent fine shell fragments; nonsaline; SAR is about 6; very slightly effervescent; moderately alkaline; clear smooth boundary. (Combined thickness of the A horizon is 6 to 19 inches.)
Cg1—11 to 21 inches; light brownish gray (10YR 6/2), fine sand, light gray (10YR 7/2), dry; single grain; loose; 3 percent very fine and fine roots; 7 percent medium faint grayish brown (2.5Y 5/2) and 1 percent medium and coarse distinct very dark gray (N 3/0) and dark gray (N 4/0) iron depletions with diffuse boundaries in matrix; 2 percent fine and medium prominent light yellowish brown (2.5Y 6/4) masses of oxidized iron with sharp boundaries lining pores; 1 percent fine shell fragments; nonsaline; SAR is about 7; very slightly effervescent; moderately alkaline; clear smooth boundary.
Cg2—21 to 34 inches; grayish brown (2.5Y 5/2), fine sand, light brownish gray (2.5Y 6/2), dry; single grain; loose; 2 percent very fine and fine roots; 2 percent fine and medium faint gray (2.5Y 5/1) and 1 percent fine and medium distinct very dark gray (N 3/0) iron depletions with diffuse boundaries in the matrix; 1 percent fine and medium distinct light yellowish brown (2.5Y 6/3) masses of oxidized iron with clear boundaries lining pores; 1 percent fine shell fragments; nonsaline; SAR is about 6; very slightly effervescent; moderately alkaline; clear smooth boundary.
Cg3—34 to 45 inches; light brownish gray (2.5Y 6/2), fine sand, light gray (2.5Y 7/2), dry; single grain; loose; 1 percent very fine and fine roots; 1 percent fine distinct light yellowish brown (2.5Y 6/4) masses of oxidized iron with clear boundaries lining pores; 1 percent fine shell fragments; nonsaline; SAR is about 7; very slightly effervescent; moderately alkaline; clear smooth boundary.
Cg4—45 to 57 inches; gray (5Y 5/1), fine sand, light brownish gray (2.5Y 6/2), dry; single grain; loose; 5 percent medium distinct dark gray (N 4/0) iron depletions with diffuse boundaries in the matrix; 20 percent medium and coarse prominent light olive brown
124 Soil Survey of
(2.5Y 5/6) masses of oxidized iron with sharp boundaries in the matrix; 1 percent fine and medium shell fragments; nonsaline; SAR is about 5; slightly effervescent; moderately alkaline; gradual smooth boundary.
Cg5—57 to 71 inches; gray (5Y 6/1), fine sand, light gray (2.5Y 7/2), dry; single grain; loose; 5 percent medium distinct dark gray (N 4/0) iron depletions with diffuse boundaries in the matrix; 5 percent medium and coarse prominent light olive brown (2.5Y 5/6) masses of oxidized iron with clear boundaries in the matrix; 1 percent fine shell fragments; nonsaline; SAR is about 6; slightly effervescent; moderately alkaline; gradual smooth boundary.
Cg6—71 to 80 inches; gray (5Y 5/1), fine sand, light brownish gray (2.5Y 6/2), dry; single grain; loose; 5 percent medium distinct dark gray (N 4/0) iron depletions with diffuse boundaries in the matrix; 3 percent medium prominent olive yellow (2.5Y 6/6) masses of oxidized iron with clear boundaries in the matrix; 1 percent fine and medium shell fragments; nonsaline; SAR is about 6; slightly effervescent; moderately alkaline. (Combined thickness of the Cg horizon is 61 to 74 inches.)
Type Location
Kleberg County, Texas; from the intersection of Park Road 22 and the county line between Kleberg and Nueces Counties; 8.0 miles southwest on Park Road 22 to the pay station entrance of Padre Island National Seashore; 4.5 miles southwest on Park Road 22 to the end of the paved road; 7.0 miles south on beach to the entrance of Pan Am Road; 0.2 miles northwest and 0.6 miles south on Pan Am Road; 120 feet west on an intermound barrier flat in rangeland. South Bird Island Southeast, Texas topographic quadrangle; Lat. 27 degrees 18 minutes 51.80 seconds N; Long. 97 degrees 20 minutes 33.30 seconds W; NAD 83.
Range in Characteristics
Soil moisture: An aquic soil moisture regime. Although rainfall amounts are that of an ustic moisture regime, the soil has a permanent water table at depths of 10 to 30 inches throughout the year in most years. The soil is rarely, if ever, at the wilting point below 10 inches, and it is saturated or ponded for periods of several days or weeks following heavy rains. Coarse fragments of marine shells and shell fragments comprise less than 15 percent by volume.
Mean annual soil temperature: 74 to 76 degrees F Depth to masses of oxidized iron: 0 to 10 inches Depth to iron depletions: 6 to 24 inches Depth to endosaturation: 10 to 30 inches throughout the year Particle-size control section (weighted average): Less than 5 percent silt plus clay
Clay content: 0 to 5 percent Sand content: 95 to 99 percent
Cng Horizon
Hue: 10YR or 2.5Y Value: 5 or 6 Chroma: 2 or 3 Texture: Fine sand Masses of oxidized iron: Quantity—0 to 8 percent; size—fine or medium; contrast—faint
to prominent; boundary—clear to sharp; shades—brown or yellow Iron depletions: Quantity—0 to 15 percent; size—fine or medium; contrast—faint to
prominent; boundary—diffuse or clear; shades—gray EC (dS/m): 0 to 4 SAR: 0 to 10 Reaction: Neutral to strongly alkaline
Padre Island National Seashore, Texas 125
C Horizon (where present)
Hue: 10YR or 2.5Y Value: 6 or 7 Chroma: 2 or 3 Texture: Fine sand Masses of oxidized iron: Quantity—0 to 5 percent; size—fine or medium; contrast—faint
to prominent; boundary—clear to sharp; shades—brown or yellow Iron depletions: Quantity—0 to 10 percent; size—fine or medium; contrast—faint or
distinct; boundary—diffuse or clear; shades—gray EC (dS/m): 0 to 4 SAR: 0 to 8 Reaction: Neutral to strongly alkaline
Cg Horizon
Hue: 10YR, 2.5Y, 5Y, 5GY or N/ Value: 4 to 7 Chroma: 0 to 2 Texture: Fine sand Masses of oxidized iron: Quantity—1 to 15 percent; size—fine or medium; contrast—faint
to prominent; boundary—clear to sharp; shades—brown or yellow Iron depletions: Quantity—1 to 15 percent; size—fine or medium; contrast—faint or
distinct; boundary—diffuse or clear; shades—gray EC (dS/m): 0 to 2 SAR: 0 to 8 Reaction: Neutral to strongly alkaline
Competing Series
These are the Dianola (TX), Kesson (FL), Pompano (FL), and Novillo (TX) series in the same family. Similar soils include the Basinger (FL), Captiva (FL), Hallandale (FL), Madre (TX), Margate (FL), Moultrie (FL), Satatton (TX), Tatton (TX), and Valkaria (FL) series.
Dianola soils have more than 5 percent silt plus clay, have EC of 26 to 70, and have SAR of more than 13.
Kesson soils are very poorly drained, have EC greater than 16, and are subject to tidal flooding.
Pompano soils are very poorly drained and have average annual precipitation range of 48 to 52 inches.
Novillo soils have an O horizon, are very poorly drained, and are ponded for very long periods.
Basinger, Moultrie, and Valkaria soils are Spodic Psammaquents Captiva and Margate soils are Mollic Psammaquents Hallandale soils are Lithic Psammaquents Madre, Satatton, and Tatton soils are Sodic Psammaquents
Geographic Setting
Parent material: Eolian and storm washover sandy sediments of Holocene age Landform: Nearly level barrier flats or shallow depressions between dunes and low
mounds on barrier islands Slope: 0 to 1 percent Mean annual air temperature: 71 to 73 degrees F Mean annual precipitation: 25 to 48 inches Precipitation pattern: November through April are the driest months, with a second dry
period in July. September is the wettest month. Frost-free period: 310 to 350 days
126 Soil Survey of
Elevation: 0 to 5 feet Thornthwaite P-E Index: 31 to 62
Geographically Associated Soils
These are the Daggerhill, Dianola, Galveston, Greenhill, Karankawa, Madre, Malaquite, Nass, Novillo, Padre, Panam, and Veston series.
Daggerhill and Greenhill soils are Ustic Quartzipsamments and are on a higher landform position on convex foredunes and back-island dune fields.
Dianola and Madre soils are on a similar to slightly lower landform. Galveston, Padre, and Panam soils are not saturated with water at some period of the
year, and are on a slightly higher landform on low dunes or mounds on barrier flats. Karankawa soils have a coarse-loamy control section and are on a lower landform in
tidal marshes. Malaquite soils are Typic Halaquepts and are on a slightly lower landform. Nass soils have a coarse-loamy control section and are in a lower concave landform. Novillo soils are in a lower concave landform in fresh-water marshes. Veston soils have a fine-silty control section and are on a similar landform.
Drainage and Permeability
Poorly drained; runoff is negligible due to the depressional feature of the barrier flat. Permeability is rapid above the high water table, but the overall permeability class is very slow. These soils are subject to occasional flooding for brief periods by high storm surge during strong tropical storms. The soils are ponded for several days to several weeks following periods of heavy rainfall.
Use and Vegetation
Used primarily as wildlife habitat and for recreation. A few areas are used for livestock grazing. Native vegetation is gulfdune paspalum, marshay cordgrass, seashore dropseed, Scribner panicum, and beaked spikerush. (Low Coastal Sand ecological site, PE 31-44, 150BY650TX).
Distribution and Extent
Gulf Coast Saline Prairies; Land Resource Region T-Atlantic and Gulf Coast Lowlands; MLRA 150B; Barrier islands along the lower Gulf Coast of Texas; the series is extensive.
MLRA Office Responsible
Temple, Texas
Series Established
Nueces County, Texas, Nueces County Soil Survey; 1963. The name is from Mustang Island.
Remarks
Sand mineralogy changed from mixed to siliceous based on a study by USDA-NRCS of the mineralogy of the barrier island system in 2002. The series range of electrical conductivity (EC) in the control section was changed from 0 to 8, to 0 to 2 in 2004 during the Soil Survey of Kenedy and Kleberg Counties, Texas.
Diagnostic horizons and features recognized in this pedon are: Aquic conditions: These soils remain saturated and have reducing conditions for
at least 1 month in most years from 11 to 80 inches (Cg1, Cg2, Cg3, Cg4, Cg5, and Cg6 horizons)
Particle-size control section: 10 to 40 inches (A2, Cg1, Cg2, and Cg3 horizons) Ochric epipedon: 0 to 11 inches (A1 and A2 horizons)
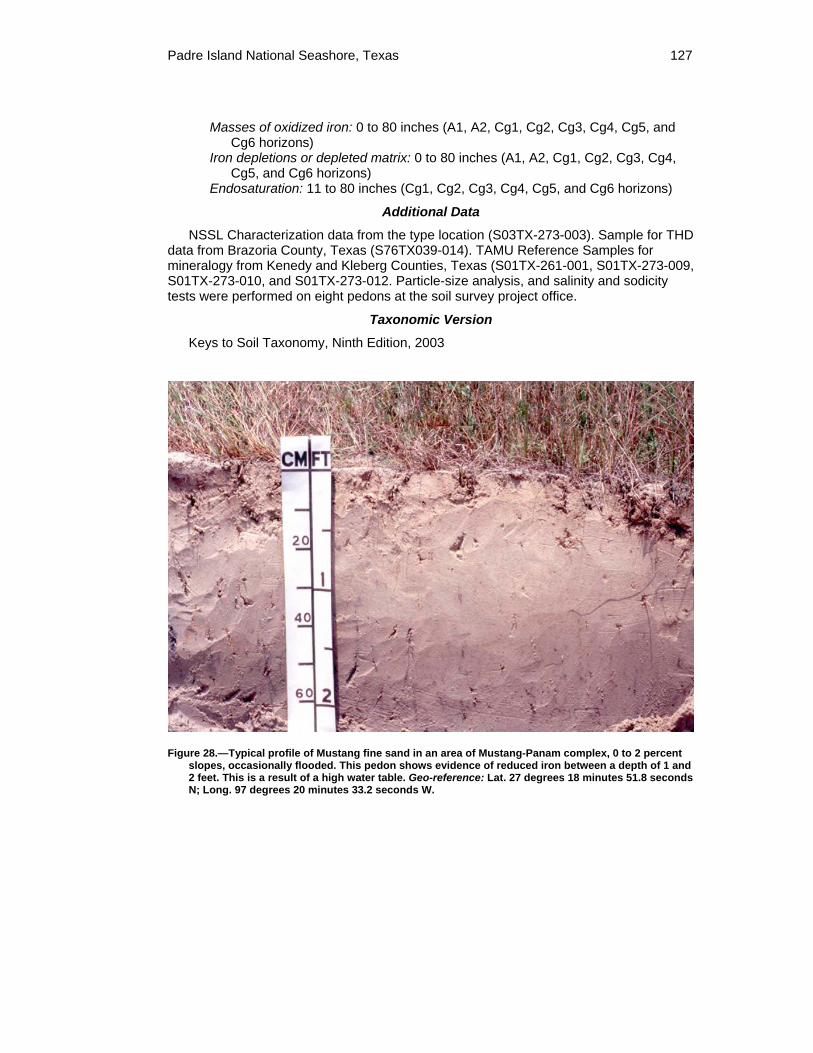
Padre Island National Seashore, Texas 127
Masses of oxidized iron: 0 to 80 inches (A1, A2, Cg1, Cg2, Cg3, Cg4, Cg5, and Cg6 horizons)
Iron depletions or depleted matrix: 0 to 80 inches (A1, A2, Cg1, Cg2, Cg3, Cg4, Cg5, and Cg6 horizons)
Endosaturation: 11 to 80 inches (Cg1, Cg2, Cg3, Cg4, Cg5, and Cg6 horizons)
Additional Data
NSSL Characterization data from the type location (S03TX-273-003). Sample for THD data from Brazoria County, Texas (S76TX039-014). TAMU Reference Samples for mineralogy from Kenedy and Kleberg Counties, Texas (S01TX-261-001, S01TX-273-009, S01TX-273-010, and S01TX-273-012. Particle-size analysis, and salinity and sodicity tests were performed on eight pedons at the soil survey project office.
Taxonomic Version
Keys to Soil Taxonomy, Ninth Edition, 2003
Figure 28.—Typical profile of Mustang fine sand in an area of Mustang-Panam complex, 0 to 2 percent slopes, occasionally flooded. This pedon shows evidence of reduced iron between a depth of 1 and 2 feet. This is a result of a high water table. Geo-reference: Lat. 27 degrees 18 minutes 51.8 seconds N; Long. 97 degrees 20 minutes 33.2 seconds W.
128 Soil Survey of
Novillo Series The Novillo series consists of very deep, very poorly drained soils that formed in
sandy eolian sediments on barrier islands. These nearly level soils are on concave positions in fresh-water swales on barrier flats. These soils are ponded for very long periods in normal years and are subject to occasional flooding by high storm surge from strong tropical storms. Slope ranges from 0 to 1 percent. Mean annual temperature is about 72 degrees F and mean annual precipitation is about 27 inches.
Taxonomic Class
Siliceous, hyperthermic Typic Psammaquents
Typical Pedon
Novillo peat on a concave, 0 to 1 percent slopes in wildlife land at an elevation of 1 foot. (Colors are for moist soil unless otherwise stated.)
Oi—0 to 2 inches; very dark gray (2.5Y 3/1) peat, very dark gray (2.5Y 3/1) pressed and rubbed; massive; 85 percent fine and very fine, 8 percent medium and 2 percent coarse roots; dominantly herbaceous roots and fiber; about 10 percent mineral matter dark grayish brown (10YR 4/2) fine sand; nonsaline; SAR is about 4; noneffervescent; slightly acid; clear smooth boundary. (Thickness is 0 to 4 inches.)
A1—2 to 7 inches; dark grayish brown (10YR 4/2) fine sand, grayish brown (10YR 5/2) dry; single grain; loose; 12 percent fine and very fine roots and 3 percent medium and coarse roots; 5 percent fine and medium faint grayish brown (10YR 5/2) iron depletions with diffuse boundaries in the matrix; nonsaline; SAR is about 6; noneffervescent; slightly acid; clear smooth boundary.
A2—7 to 12 inches; grayish brown (10YR 5/2) fine sand, light brownish gray (10YR 6/2) dry; single grain; loose; 7 percent fine and very fine and 2 percent medium and coarse roots; 12 percent medium faint dark grayish brown (10YR 4/2) iron depletions with diffuse boundaries in the matrix; nonsaline; SAR is about 8; noneffervescent; slightly acid; clear smooth boundary. (Combined thickness of the A horizon is 4 to 12 inches.)
Cg1—12 to 19 inches; gray (10YR 5/1) fine sand, gray (10YR 6/1) dry; single grain; loose; 5 percent fine and very fine and 2 percent medium roots; 15 percent medium faint light brownish gray (2.5Y 6/2) iron depletions with diffuse boundaries in the matrix; nonsaline; SAR is about 8; noneffervescent; neutral; gradual smooth boundary.
Cg2—19 to 55 inches; light brownish gray (10YR 6/2) fine sand, light gray (10YR 7/2) dry; single grain; loose; 3 percent fine and very fine roots; 5 percent medium faint gray (10YR 5/1) iron depletions with diffuse boundaries in the matrix; nonsaline; SAR is about 8; noneffervescent; neutral; clear smooth boundary. (Combined thickness of the Cg horizon is 21 to 49 inches.)
Ab—55 to 60 inches; dark gray (10YR 4/1) fine sand, dark grayish brown (10YR 4/2) dry; single grain; loose; 1 percent fine and very fine roots; 10 percent medium distinct grayish brown (10YR 5/2) iron depletions with diffuse boundaries in the matrix; nonsaline; SAR is about 7; noneffervescent; moderately acid; clear smooth boundary. (Thickness is 0 to 16 inches.)
Cgb—60 to 80 inches; grayish brown (10YR 5/2) fine sand, light brownish gray (10YR 6/2) dry; single grain; loose; 1 percent fine and very fine roots; 7 percent medium distinct gray (10YR 6/1) iron depletions with diffuse boundaries in the matrix; nonsaline; SAR is about 7; noneffervescent; slightly acid. (Thickness is 0 to 23 inches.)
Padre Island National Seashore, Texas 129
Type Location
Kleberg County, Texas; from the intersection of Park Road 22 and the county line between Kleberg and Nueces Counties; 8.0 miles southwest on Park Road 22 to the pay station entrance of Padre Island National Seashore; 0.8 mile southwest on Park Road 22 to the intersection of Novillo and Bird Island Basin Road; 0.56 mile west-northwest on Bird Island Basin Road; 300 feet south in a fresh-water marsh. South Bird Island, Texas USGS topographic quadrangle; Lat. 27 degrees, 27 minutes, 59.6 seconds N; Long. 97 degrees, 17 minutes, 57.5 seconds W; NAD 83.
Range in Characteristics
Soil moisture: Aquic conditions exist between 0 and 6 inches below the soil surface, or the soil is ponded for very long periods in normal years.
Mean annual soil temperature: 74 to 76 degrees F Depth to masses of oxidized iron: 0 to 10 inches Depth to iron depletions or depleted matrix: 0 to 10 inches Depth to endosaturation: 0 to 6 inches throughout the year Particle-size control section (weighted average): Less than 5 percent silt plus clay
Clay content: 1 to 3 percent Sand content: 95 to 99 percent
Oi Horizon (where present)
Hue: 10YR or 2.5Y Value: 2 or 3 (2 to 4 pressed and rubbed) Chroma: 1 or 2 Texture: Peat EC (dS/m): 0 to 4 SAR: 0 to 8 Reaction: Moderately acid to slightly acid
A Horizon
Hue: 10YR or 2.5Y Value: 3 to 5 (4 to 6 dry) Chroma: 1 or 2 Texture: Fine sand Clay content: 1 to 3 percent Masses of oxidized iron: Quantity—0 to 10 percent; size—fine or medium; contrast—faint
to prominent; boundary—clear or sharp; shades—brown or yellow Iron depletions: Quantity—0 to 10 percent; size—fine or medium; contrast—faint;
boundary—diffuse or clear; shades—gray (matrix colors are a reduced matrix) EC (dS/m): 0 to 4 SAR: 0 to 8 Reaction: Strongly acid to neutral
Cg Horizon
Hue: 10YR or 2.5Y Value: 5 or 6 (6 or 7 dry) Chroma: 1 or 2 Texture: Fine sand Clay content: 1 to 3 percent Masses of oxidized iron: Quantity—2 to 15 percent; size—fine or medium; contrast—faint
to prominent; boundary—clear or sharp; shades—brown or yellow Iron depletions: Quantity—2 to 15 percent; size—fine or medium; contrast—faint or
distinct; boundary—diffuse or clear; shades—gray (matrix colors are a reduced matrix)
130 Soil Survey of
EC (dS/m): 0 to 4 SAR: 2 to 10 Reaction: Slightly acid to slightly alkaline
Ab Horizon (where present)
Hue: 10YR or 2.5Y Value: 3 or 4 (4 or 5 dry) Chroma: 1 or 2 Texture: Fine sand Clay content: 1 to 3 percent Masses of oxidized iron: Quantity—0 to 10 percent; size—fine to coarse; contrast—faint
to prominent; boundary—clear or sharp; shades—brown or yellow Iron depletions: Quantity—2 to 15 percent; size—fine or medium; contrast—faint or
distinct; boundary—diffuse or clear; shades—gray EC (dS/m): 0 to 4 SAR: 2 to 10 Reaction: Slightly acid to slightly alkaline
Cgb Horizon (where present)
Hue: 10YR or 2.5Y Value: 5 or 6 (6 or 7 dry) Chroma: 1 or 2 Texture: Fine sand Clay content: 1 to 3 percent Masses of oxidized iron: Quantity—2 to 15 percent; size—fine or medium; contrast—faint
to prominent; boundary—clear or sharp; shades—brown or yellow Iron depletions: Quantity—2 to 15 percent; size—fine or medium; contrast—faint or
distinct; boundary—diffuse or clear; shades—gray (matrix colors are a reduced matrix)
EC (dS/m): 0 to 4 SAR: 2 to 10 Reaction: Slightly acid to slightly alkaline
Competing Series
These are the Dianola (TX), Kesson (FL), Mustang (TX), and Pompano (FL) series in the same family. Similar soils include the Madre (TX), Malaquite (TX), Padre (TX), Panam (TX), Nass (TX), Satatton (TX), and Tatton (TX) series.
Dianola, Madre, and Malaquite soils have SAR of 13 or more within 40 inches of the soil surface. In addition, Dianola and Malaquite soils have silt plus clay of 5 percent or more in the 10- to 40-inch control section.
Kesson, Satatton, and Tatton soils have SAR of 13 or more within 40 inches of the soil surface, and are subject to tidal flooding.
Mustang soils do not have an O horizon, are poorly drained, and have a water table within 10 to 30 inches.
Nass soils have a coarse-loamy particle-size control section and salinity of 4 dS/m or more within 40 inches of the soil surface.
Padre and Panam soils are somewhat poorly drained, and have a water table within 30 to 50 inches.
Pompano soils do not have an O horizon, do not have a buried A horizon, and have silt plus clay of 5 percent or more.
Padre Island National Seashore, Texas 131
Geographic Setting
Parent material: Eolian sandy sediments of Holocene age Landform: Concave fresh-water marsh swales or depressions between low dunes on
barrier flats Slope: 0 to 1 percent Mean annual air temperature: 71 to 73 degrees F Mean annual precipitation: 25 to 35 inches Precipitation pattern: November through April are the driest months, with a second dry
period in July. September is the wettest month. Frost-free period: 310 to 350 days Elevation: 0 to 3 feet Thornthwaite P-E Index: 31 to 44
Geographically Associated Soils
These are the Daggerhill, Greenhill, Madre, Malaquite, Mustang, Padre, Panam, Satatton, and Tatton series.
Daggerhill and Greenhill soils are on a higher landform on convex foredunes and back-island dunal ridges.
Madre, Malaquite, and Mustang soils are on slightly higher barrier flat landforms. Padre and Panam soils are on higher landforms on convex, low mounds on barrier
flats. Satatton and Tatton soils are on lower, planar to concave landforms on wind-tidal
flats.
Drainage and Permeability
Very poorly drained; runoff is negligible to ponded. The water table is within 6 inches of the soil surface throughout the year and the soil is ponded for very long periods in normal years. These soils are also subject to occasional flooding for brief periods by high storm surge during strong tropical storms.
Use and Vegetation
Used as wetland wildlife habitat. Native vegetation is cattails, pennywort, sedges, rushes, and bushy bluestem. (Coastal Swale, PE 31-44 ecological site, 150BY713TX.)
Distribution and Extent
Gulf Coast Saline Prairies, Land Resource Region T-Atlantic and Gulf Coast Lowlands; MLRA 150B; Barrier islands along the lower Gulf Coast of Texas; the series is of small extent.
MLRA Office Responsible
Temple, Texas
Series Proposed
Kleberg County, Texas, 2004. The name is from a road and former line camp on Padre Island.
Remarks
The series was formerly included in the Nass series. The series was established based on the difference in clay content.
Diagnostic horizons and features recognized in this pedon are: Fibric soil material: 0 to 2 inches (Oi horizon) Ochric epipedon: 0 to 12 inches (Oi, A1, and A2 horizons) Particle-size control section: 10 to 40 inches (A2, Cg1, and Cg2 horizons)
132 Soil Survey of
Aquic conditions: Evidenced by low chroma colors due to wetness Masses of oxidized iron: 0 to 80 inches (Oi, A1, A2, Cg1, Cg2, Ab, and Cgb
horizons) Iron depletions or depleted matrix: 0 to 80 inches (Oi, A1, A2, Cg1, Cg2, Ab, and
Cgb horizons) Peraquic moisture regime feature: The zone from 0 to 60 inches is permanently
saturated in normal years (Oi, A1, A2, Cg1, Cg2, and Ab horizons) Endosaturation: 0 to 6 inches throughout the year, and ponded for most of the
year in normal years.
Additional Data
Particle-size analysis, and salinity and sodicity tests on three pedons were performed at the soil survey project office.
Taxonomic Version
Keys to Soil Taxonomy, Ninth Edition, 2003
Padre Series The Padre series consists of very deep, somewhat poorly drained, rapidly permeable
soils that formed in sandy eolian and storm washover sediments on barrier islands. These nearly level or very gently sloping soils are on low stabilized dunes on barrier flats. These soils are subject to occasional flooding by high storm surge from strong tropical storms. Slope ranges from 0 to 2 percent. Mean annual temperature is about 72 degrees F and mean annual precipitation is about 27 inches.
Taxonomic Class
Hyperthermic, uncoated Aquic Quartzipsamments
Typical Pedon
Padre fine sand in an area of Padre-Mustang complex, 0 to 2 percent slopes on a southwest facing 1.5 percent slope in rangeland at an elevation of 6 feet (fig. 29). (Colors are for moist soil unless otherwise stated.)
A1—0 to 7 inches; brown (10YR 4/3) fine sand, brown (10YR 5/3), dry; weak fine and medium subangular blocky structure parting to single grain; loose; 6 percent very fine and fine roots and 1 percent medium roots; 2 percent fine distinct yellowish brown (10YR 5/4) masses of oxidized iron with sharp boundaries lining pores; nonsaline; SAR is about 1; noneffervescent; moderately acid; clear smooth boundary.
A2—7 to 19 inches; brown (10YR 5/3) fine sand, pale brown (10YR 6/3), dry; weak fine and medium subangular blocky structure parting to single grain; loose; 5 percent very fine and fine roots; 3 percent fine and medium distinct yellowish brown (10YR 5/6) and dark yellowish brown (10YR 4/4) masses of oxidized iron with sharp boundaries lining pores; nonsaline; SAR is about 1; noneffervescent; strongly acid; clear smooth boundary. (Combined thickness of the A horizon is 15 to 33 inches.)
C—19 to 28 inches; brown (10YR 5/3) fine sand, very pale brown (10YR 7/3), dry; single grain; loose; 4 percent very fine and fine roots; 3 percent fine and medium distinct yellowish brown (10YR 5/6) and dark yellowish brown (10YR 4/4) masses of oxidized iron with sharp boundaries lining pores; nonsaline; SAR is about 1; noneffervescent; moderately acid; clear smooth boundary. (Thickness is 7 to 22 inches.)
Cg1—28 to 38 inches; grayish brown (10YR 5/2) fine sand, light brownish gray (10YR 6/2), dry; single grain; loose; 3 percent very fine and fine roots; 5 percent fine and medium yellowish brown (10YR 5/8) and brownish yellow (10YR 6/6) masses of oxidized iron with sharp boundaries lining pores; nonsaline; SAR is about 1; noneffervescent; moderately acid; clear smooth boundary.
Padre Island National Seashore, Texas 133
Cg2—38 to 58 inches; light brownish gray (10YR 6/2) fine sand, light gray (10YR 7/2), dry; single grain; loose; 1 percent very fine and fine roots; 2 percent fine and medium distinct yellowish brown (10YR 5/4) masses of oxidized iron with sharp boundaries lining pores; nonsaline; SAR is about 1; noneffervescent; moderately acid; gradual smooth boundary.
Cg3—58 to 80 inches; light brownish gray (10YR 6/2) fine sand, light gray (10YR 7/2) dry; single grain; loose; 1 percent very fine and fine roots; 5 percent medium faint grayish brown (10YR 5/2) iron depletions with diffuse boundaries in matrix; nonsaline; SAR is about 4; noneffervescent; moderately acid. (Combined thickness of the Cg horizon is 37 to 65 inches.)
Type Location
Kleberg County, Texas; from the intersection of Park Road 22 and the county line between Kleberg and Nueces Counties; 8.0 miles southwest on Park Road 22 to the entrance station of Padre Island National Seashore; 0.8 mile southwest on Park Road 22 to the intersection of Novillo and Bird Island Basin Road; 250 feet east on caliche and shell road; 200 feet north on low mound in rangeland. South Bird Island, Texas USGS topographic quadrangle; Lat. 27 degrees, 27 minutes, 49.8 seconds N; Long. 97 degrees, 17 minutes, 23.0 seconds W; NAD 83.
Range in Characteristics
Soil moisture: An ustic soil moisture regime bordering on udic. The soil moisture control section is dry in some or all parts for less than 120 cumulative days in normal years. Although rainfall amounts are that of an ustic moisture regime, the effective precipitation is higher due to relative landscape position and a fluctuating water table. The water table occurs in most pedons at a depth of 30 to 50 inches for at least 2 months in most years.
Mean annual soil temperature: 74 to 76 degrees F Depth to masses of oxidized iron: 0 to 10 inches Depth to iron depletions: 25 to 40 inches Depth to endosaturation: 30 to 50 inches for at least 2 months in most years Particle-size control section (weighted average): Less than 5 percent silt plus clay
Clay content: 1 to 3 percent Sand content: 95 to 99 percent
A Horizon
Hue: 10YR Value: 4 to 6, 5 to 7 dry Chroma: 2 or 3 Texture: Fine sand Masses of oxidized iron: Quantity—1 to 7 percent; size—fine or medium; contrast—faint
to prominent; boundary—clear or sharp; shades—brown or yellow EC (dS/m): 0 to 2 SAR: 0 to 4 Reaction: Very strongly acid to neutral
C Horizon
Hue: 10YR Value: 5 to 7, 6 to 8 dry Chroma: 2 or 3 Texture: Fine sand Masses of oxidized iron: Quantity—1 to 10 percent; size—fine or medium; contrast—faint
to prominent; boundary—clear or sharp; shades—brown or yellow EC (dS/m): 0 to 2
134 Soil Survey of
SAR: 0 to 4 Reaction: Strongly acid to neutral
Cg Horizon
Hue: 10YR or 2.5Y Value: 5 to 7, 6 to 8 dry Chroma: 1 or 2 Texture: Fine sand Masses of oxidized iron: Quantity—0 to 10 percent; size—fine or medium; contrast—faint
to prominent; boundary—clear or sharp; shades—brown, red, or yellow Iron depletions: Quantity—0 to 15 percent; size—fine to coarse; contrast—faint or
distinct; boundary—diffuse or clear; shades—gray EC (dS/m): 0 to 2 SAR: 0 to 4 Reaction: Strongly acid to neutral
Competing Series
These are the Adamsville (FL), Broward (FL), Canaveral (FL), Panam (TX), and Satellite (FL) series. Similar soils are the Arenisco (TX), Daggerhill (TX), Falfurrias (TX), Galveston (TX), Greenhill (TX), and Rockport (TX) series.
Adamsville, Broward, Canaveral, and Satellite soils all these soils have a udic soil moisture regime and are not subject to flooding by storm surge. Also, Adamsville soils are on uplands; Broward soils are moderately deep to limestone. Canaveral soils are calcareous and have shell fragments and are more alkaline throughout. Satellite soils are on flatwoods.
Panam soils have slightly to strongly alkaline soil reaction throughout and have seashell fragments.
Arenisco soils are somewhat excessively drained and have mixed sand mineralogy. Daggerhill, Falfurrias, and Greenhill soils are excessively drained and do not have a
fluctuating water table within 80 inches of the surface. Galveston soils are somewhat excessively drained, have mixed sand mineralogy, and
are dry in the soil moisture control section for less than 90 cumulative days in normal years (udic soil moisture regime).
Geographic Setting
Parent material: Eolian and storm washover sandy sediments of Holocene age. Landform: Low mounds or stabilized dunes on barrier flat areas of barrier islands. Slope: 0 to 2 percent Mean annual air temperature: 71 to 73 degrees F Mean annual precipitation: 25 to 35 inches Precipitation pattern: November through April are the driest months, with a second dry
period in July. September is the wettest month. Frost-free period: 310 to 350 days Elevation: 3 to 10 feet Thornthwaite P-E Index: 31 to 44
Geographically Associated Soils
These are the Daggerhill, Greenhill, Madre, Malaquite, Mustang, Novillo, Panam, Sattaton, and Tatton series.
Daggerhill and Greenhill soils occur on higher landforms on convex foredunes and back-island stabilized dune fields.
Madre, Malaquite, and Mustang soils are poorly drained, have higher water tables for longer periods throughout the year, and occur on a lower, planar to concave landforms
Padre Island National Seashore, Texas 135
on barrier flats. In addition, Madre and Malaquite soils have a SAR of 13 or more within 40 inches of the soil surface.
Novillo soils are Typic Psammaquents and are on a lower landforms in fresh-water marshes.
Panam soils are on a similar landform. Satatton and Tatton soils are Sodic Psammaquents and occur on a lower landform on
wind-tidal flats.
Drainage and Permeability
Somewhat poorly drained. Permeability is rapid. Runoff is negligible. A water table occurs in most pedons, at a depth of 30 to 50 inches for at least 2 months in most years. The soil is occasionally flooded for very brief periods by high storm surge during strong tropical storms.
Use and Vegetation
Used primarily as wildlife habitat and for recreation. Native vegetation consists of seacoast bluestem, gulfdune paspalum, brownseed paspalum, partridge pea, and false indigo. (Coastal Sand ecological site, PE 31-44, 150BY648TX).
Distribution and Extent
Gulf Coast Saline Prairies; Land Resource Region T-Atlantic and Gulf Coast Lowlands; MLRA 150B; Barrier islands along the lower Gulf Coast of Texas; the series is of moderate extent.
MLRA Office Responsible
Temple, Texas
Series Proposed
Kleberg County, Texas, 2002. The name is from Padre Island.
Remarks
This series was formerly included with the Galveston series. The series are separated based on differences in soil moisture regime and sand mineralogy.
Diagnostic horizons and features recognized in this pedon are: Ochric epipedon: 0 to 19 inches (A1 and A2 horizons) Particle-size control section: 10 to 40 inches (A2, C, Cg1, and Cg2 horizons) Masses of oxidized iron: 0 to 58 inches (A1, A2, C, Cg1, and Cg2 horizons) Iron depletions: Depleted matrix at 28 to 80 inches (Cg1, Cg2, and Cg3 horizons) Endosaturation: 30 to 50 inches for at least 2 months in most years (Cg1, Cg2,
and Cg3 horizons)
Additional Data
TAMU reference sample data for pH, salinity, sodicity, and mineralogy from S01TX-273-004 and S01TX-273-005. Particle-size analysis on five pedons, and salinity and sodicity tests on nine pedons were performed at the soil survey project office.
Taxonomic Version
Keys to Soil Taxonomy, Ninth Edition, 2003
136 Soil Survey of
Figure 29.—Typical profile of Padre fine sand in a unit of Mustang-Padre complex, 0 to 2 percent slopes, occasionally flooded. This pedon exhibits masses of oxidized iron starting at a depth of 2 feet, and reduced iron at a depth of about 3 feet. This oxidation and reduction is caused by a fluctuating water table. Geo-reference: Lat. 27 degrees 29 minutes 39.6 seconds N; Long. 97degrees 16 minutes 38.3 seconds W.
Padre Island National Seashore, Texas 137
Panam Series The Panam series consists of very deep, somewhat poorly drained, rapidly
permeable soils that formed in sandy, eolian and storm washover sediments on barrier islands. These nearly level or very gently sloping soils are on low stabilized dunes on barrier flats. These soils are subject to occasional flooding by high storm surge from strong tropical storms. Slope ranges from 0 to 2 percent. Mean annual temperature is about 72 degrees F and mean annual precipitation is about 27 inches.
Taxonomic Class
Hyperthermic, uncoated Aquic Quartzipsamments
Typical Pedon
Panam fine sand in an area of Panam-Mustang complex, 0 to 2 percent slopes, occasionally flooded (fig. 30); on a southeast facing 1.5 percent slope in rangeland at an elevation of 6 feet. (Colors are for moist soil unless otherwise stated.)
A1—0 to 4 inches; brown (10YR 4/3) fine sand, brown (10YR 5/3), dry; single grain; loose; 7 percent very fine and fine roots and 1 percent medium roots; 1 percent fine and medium faint yellowish brown (10YR 5/4) and 1 percent fine and medium distinct brownish yellow (10YR 6/6) masses of oxidized iron with sharp boundaries lining pores; 1 percent sand-sized seashell fragments; nonsaline; SAR is about 1; noneffervescent; slightly alkaline; clear smooth boundary.
A2—4 to 9 inches; brown (10YR 5/3) fine sand, pale brown (10YR 6/3), dry; single grain; loose; 5 percent very fine and fine roots and 1 percent medium roots; 1 percent fine and medium distinct yellowish brown (10YR 5/6) masses of oxidized iron with sharp boundaries lining pores; 1 percent sand-sized seashell fragments; nonsaline; SAR is about 2; noneffervescent; slightly alkaline; clear smooth boundary. (Combined thickness of the A horizon is 6 to 35 inches.)
C1—9 to 18 inches; brown (10YR 5/3) fine sand, very pale brown (10YR 7/3), dry; single grain; loose; 2 percent very fine and fine roots; 1 percent fine and medium distinct yellowish brown (10YR 5/6) masses of oxidized iron with sharp boundaries lining pores; 2 percent sand-sized seashell fragments; nonsaline; SAR is about 2; noneffervescent; slightly alkaline; clear smooth boundary.
C2—18 to 30 inches; pale brown (10YR 6/3) fine sand, very pale brown (10YR 7/3), dry; single grain; loose; 2 percent very fine and fine roots; 5 percent fine and medium distinct brownish yellow (10YR 6/6) and 1 percent fine and medium faint light yellowish brown (10YR 6/4) masses of oxidized iron with sharp boundaries lining pores; 5 percent sand-sized seashell fragments; nonsaline; SAR is about 6; noneffervescent; slightly alkaline: clear smooth boundary.
C3—30 to 38 inches; brown (10YR 5/3) fine sand, light brownish gray (10YR 6/2), dry; single grain; loose; 1 percent very fine and fine roots; 1 percent fine and medium distinct light yellowish brown (10YR 6/4) masses of oxidized iron with clear boundaries lining pores; 3 percent medium and coarse faint light brownish gray (10YR 6/2) iron depletions with clear boundaries in matrix; 4 percent sand-sized seashell fragments; nonsaline; SAR is about 4; noneffervescent; slightly alkaline; abrupt smooth boundary. (Combined thickness of the C horizon is 10 to 35 inches.)
Cg1—38 to 48 inches; gray (2.5Y 5/1) fine sand, light brownish gray (2.5Y 6/2), dry; single grain; loose; 1 percent very fine and fine roots; 10 percent coarse faint yellowish brown (10YR 5/4) masses of oxidized iron with clear boundaries in matrix; 4 percent sand-sized seashell fragments; nonsaline; SAR is about 2; noneffervescent; moderately alkaline; clear smooth boundary.
Cg2—48 to 60 inches; gray (5Y 6/1) fine sand, light gray (2.5Y 7/2), dry; single grain; loose; 1 percent fine and medium distinct light yellowish brown (10YR 6/4) masses of oxidized iron with clear boundaries in matrix; 6 percent sand-sized and 1 percent fine
138 Soil Survey of
and medium seashell fragments; nonsaline; SAR is about 1; noneffervescent; moderately alkaline; clear smooth boundary.
Cg3—60 to 80 inches; gray (5Y 5/1) fine sand, light brownish gray (2.5Y 6/2), dry; single grain; loose; 1 percent fine distinct light yellowish brown (2.5Y 6/4) masses of oxidized iron with clear boundaries in matrix; 6 percent sand-sized and 1 percent fine and medium seashell fragments; nonsaline; SAR is about 1; noneffervescent; moderately alkaline. (Combined thickness of the Cg horizon is 19 to 59 inches.)
Type Location
Kleberg County, Texas; from the intersection of Park Road 22 and the county line between Kleberg and Nueces Counties; 8.0 miles southwest on Park Road 22 to the pay station entrance of Padre Island National Seashore; 4.5 miles southwest on Park Road 22 to the end of the paved road; 7.0 miles south along the beach to the entrance of Pan Am Road; 0.2 mile northwest on Pan Am Road; 0.6 mile south on Pan Am Road; 50 feet west on a low mound in rangeland. South Bird Island SE, Texas USGS topographic quadrangle; Lat. 27 degrees, 18 minutes, 52.1 seconds N; Long. 97 degrees, 20 minutes, 32.9 seconds W; NAD 83.
Range in Characteristics
Soil moisture: An ustic soil moisture regime bordering on udic. The soil moisture control section is dry in some or all parts for less than 120 cumulative days in normal years. Although rainfall amounts are that of an ustic moisture regime, the effective precipitation is higher due to relative landscape position and a fluctuating water table. The water table occurs in most pedons at a depth of 30 to 50 inches for at least 2 months, in most years.
Mean annual soil temperature: 74 to 76 degrees F Depth to masses of oxidized iron: 0 to 10 inches Depth to iron depletions: 25 to 40 inches Depth to endosaturation: 30 to 50 inches for at least 2 months in most years Particle-size control section (weighted average): Less than 5 percent silt plus clay
Clay content: 1 to 4 percent Sand content: 95 to 99 percent Coarse seashell fragments: 0 to 4 percent
A Horizon
Hue: 10YR Value: 4 to 6, 5 to 7 dry Chroma: 2 or 3 Texture: Fine sand Clay content: 1 to 4 percent Masses of oxidized iron: Quantity—1 to 3 percent; size—fine or medium; contrast—faint
to prominent; boundary—clear or sharp; shades—brown or yellow Coarse seashell fragments: 0 to 1 percent Sand-sized seashell fragments: 0 to 3 percent EC (dS/m): 0 to 2 SAR: 0 to 4 Reaction: Slightly alkaline to strongly alkaline
C Horizon
Hue: 10YR or 2.5Y Value: 4 to 6, 6 to 8 dry Chroma: 2 or 3 Texture: Fine sand Clay content: 1 to 4 percent
Padre Island National Seashore, Texas 139
Masses of oxidized iron: Quantity—1 to 5 percent; size—fine or medium; contrast—faint to distinct; boundary—clear or sharp; shades—brown, red, or yellow
Iron depletions: Quantity—0 to 15 percent; size—fine or medium; contrast—faint or distinct; boundary—diffuse or clear; shades—gray
Coarse seashell fragments: 0 to 10 percent Sand-sized seashell fragments: 1 to 20 percent EC (dS/m): 0 to 2 SAR: 0 to 8 Reaction: Slightly alkaline to strongly alkaline
Cg Horizon
Hue: 10YR, 2.5Y, 5Y, N/, 5GY, 5BG, or 5B Value: 4 to 6, 5 to 8 dry Chroma: 0 to 2 Texture: Fine sand Clay content: 1 to 4 percent Masses of oxidized iron: Quantity—1 to 15 percent; size—fine to coarse; contrast—faint
to prominent; boundary—clear or sharp; shades—brown, red, or yellow Iron depletions: Quantity—0 to 40 percent; size—fine to coarse; contrast—faint or
distinct; boundary—diffuse or clear; shades—gray Coarse seashell fragments: 0 to 10 percent Sand-sized seashell fragments: 1 to 15 percent EC (dS/m): 0 to 4 SAR: 0 to 8 Reaction: Slightly alkaline to strongly alkaline
Competing Series
These are the Adamsville (FL), Broward (FL), Canaveral (FL), Padre (TX), and Satellite (FL) series. Similar soils are the Arenisco (TX), Daggerhill (TX), Falfurrias (TX), Galveston (TX), and Greenhill (TX) series.
Adamsville, Broward, Canaveral, and Satellite soils have a udic soil moisture regime and are not subject to flooding by storm surge. Also, Adamsville soils are on uplands. Broward soils are moderately deep to limestone. Canaveral soils are on a similar landscape position but generally have more shell fragments. Satellite soils are on flatwoods.
Padre soils have very strongly acid to neutral soil reaction throughout and do not have seashell fragments.
Arenisco soils are somewhat excessively drained and have mixed sand mineralogy. Daggerhill, Falfurrias, and Greenhill soils are excessively drained and do not have a
fluctuating water table within 80 inches of the soil surface. Galveston soils are somewhat excessively drained, have mixed sand mineralogy, and
are dry in the soil moisture control section for less than 90 cumulative days in normal years (udic moisture regime).
Geographic Setting
Parent material: Eolian and storm washover sandy sediments of Holocene age Landform: Low mounds or stabilized dunes on barrier flat areas of barrier islands Slope: 0 to 2 percent Mean annual air temperature: 71 to 73 degrees F Mean annual precipitation: 25 to 35 inches Precipitation pattern: November through April are the driest months, with a second dry
period in July. September is the wettest month Frost-free period: 310 to 350 days Elevation: 3 to 10 feet
140 Soil Survey of
Thornthwaite P-E Index: 31 to 44
Geographically Associated Soils
These are the Daggerhill, Greenhill, Madre, Malaquite, Mustang, Novillo, Padre, Satatton, and Tatton series.
Daggerhill and Greenhill soils occur on a higher landform on convex foredunes and back-island stabilized dune fields.
Madre, Malaquite, and Mustang soils are poorly drained, have higher water tables for longer periods throughout the year, and occur on a lower, planar to concave landform on barrier flats. In addition, Madre and Malaquite soils have a SAR of 13 or more within 40 inches of the soil surface.
Novillo soils are Typic Psammaquents and are on a lower landform in fresh-water marshes.
Padre soils are on a similar landform. Satatton and Tatton soils are Sodic Psammaquents and occur on a lower landform on
wind-tidal flats.
Drainage and Permeability
Somewhat poorly drained. Permeability is rapid. Runoff is negligible. A water table occurs in most pedons, at a depth of 30 to 50 inches for at least 2 months, in most years. The soil is occasionally flooded for very brief periods by high storm surge during strong tropical storms.
Use and Vegetation
Used primarily as wildlife habitat and for recreation. Native vegetation consists of seacoast bluestem, gulfdune paspalum, brownseed paspalum, partridge pea, and false indigo. (Coastal Sand ecological site, PE 31-44, 150BY648TX).
Distribution and Extent
Gulf Coast Saline Prairies; Land Resource Region T-Atlantic and Gulf Coast Lowlands; MLRA 150B; Barrier islands along the lower Gulf Coast of Texas; the series is of moderate extent.
MLRA Office Responsible
Temple, Texas
Series Proposed
Kleberg County, Texas, 2002. The name is from a service road on Padre Island.
Remarks
The series was formerly included in the Galveston series. The series are separated based on the difference in soil moisture regime and sand mineralogy.
Diagnostic horizons and features recognized in this pedon are: Ochric epipedon: 0 to 9 inches (A1 and A2 horizons) Particle-size control section: 10 to 40 inches (C1, C2, C3, and Cg1 horizons) Masses of oxidized iron: 0 to 80 inches (A1, A2, C1, C2, C3, Cg1, Cg2, and Cg3
horizons) Iron depletions: Depleted matrix at 38 to 80 inches (Cg1, Cg2, and Cg3 horizons) Endosaturation: 30 to 50 inches for at least 2 months in most years (C3, Cg1,
Cg2, and Cg3 horizons)
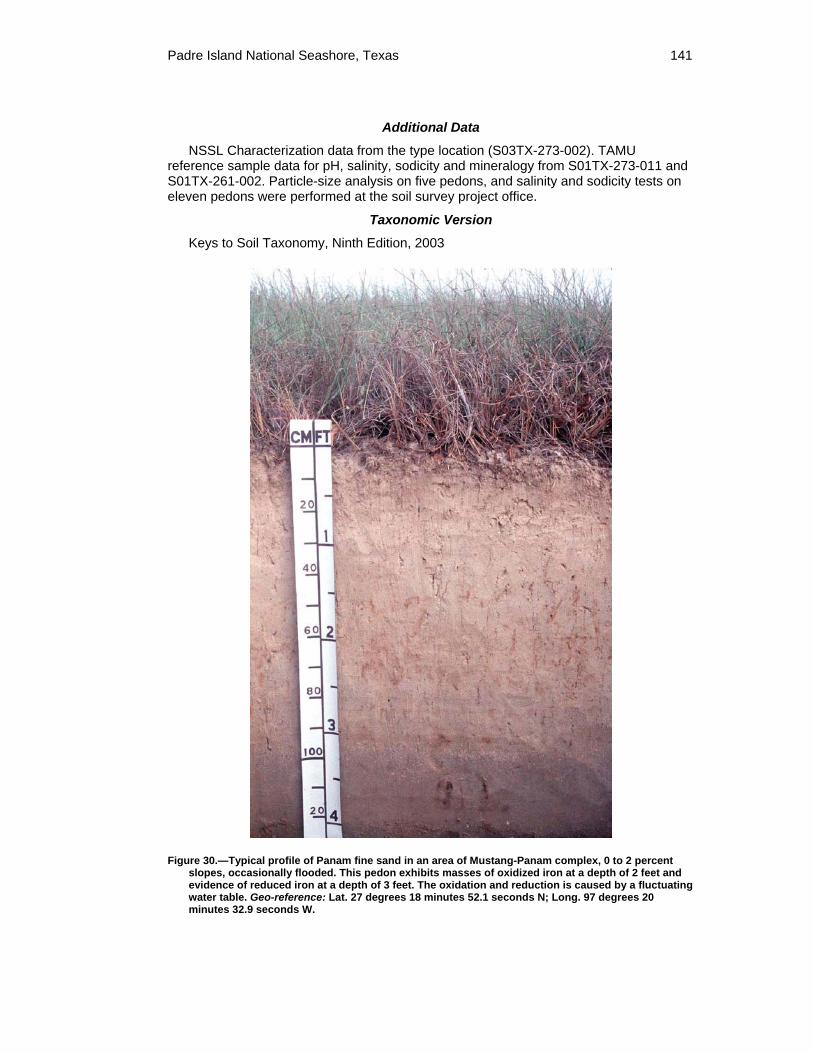
Padre Island National Seashore, Texas 141
Additional Data
NSSL Characterization data from the type location (S03TX-273-002). TAMU reference sample data for pH, salinity, sodicity and mineralogy from S01TX-273-011 and S01TX-261-002. Particle-size analysis on five pedons, and salinity and sodicity tests on eleven pedons were performed at the soil survey project office.
Taxonomic Version
Keys to Soil Taxonomy, Ninth Edition, 2003
Figure 30.—Typical profile of Panam fine sand in an area of Mustang-Panam complex, 0 to 2 percent slopes, occasionally flooded. This pedon exhibits masses of oxidized iron at a depth of 2 feet and evidence of reduced iron at a depth of 3 feet. The oxidation and reduction is caused by a fluctuating water table. Geo-reference: Lat. 27 degrees 18 minutes 52.1 seconds N; Long. 97 degrees 20 minutes 32.9 seconds W.
142 Soil Survey of
Satatton Series The Satatton series consists of very deep, poorly drained, very slowly permeable
soils. These soils formed in sandy eolian and storm washover sediments of Holocene age. These nearly level soils are on wind-tidal flats on the bay or lagoon side of barrier islands. These soils are subject to frequent flooding by wind tides and tropical storms. Slope ranges from 0 to 1 percent. Mean annual temperature is about 72 degrees F and mean annual precipitation is about 27 inches.
Taxonomic Class
Siliceous, hyperthermic Sodic Psammaquents
Typical Pedon
Satatton fine sand on a barren wind-tidal flat at an elevation of 2 feet. (Colors are for moist soil unless otherwise stated.)
Anz1—0 to 11 inches; pale brown (10YR 6/3), fine sand; single grain; very friable; many fine vesicular pores; 1/2 inch thick algal mat on the surface; 7 percent fine and medium distinct dark yellowish brown (10YR 4/4) masses of oxidized iron with sharp boundaries lining pores; strongly saline; SAR is about 120; strongly effervescent; slightly alkaline; clear smooth boundary.
Anz2—11 to 17 inches; grayish brown (10YR 5/2), stratified loamy fine sand; single grain; very friable; common fine vesicular pores; 1/2 inch layer of dark gray (10YR 4/1) material; 5 percent fine and medium distinct dark yellowish brown (10YR 4/6) masses of oxidized iron with sharp boundaries lining pores; strongly saline; SAR is about 90; slightly effervescent; slightly alkaline; clear smooth boundary. (Combined thickness of the Anz horizons is 6 to 18 inches.)
Cnzg1—17 to 22 inches; gray (2.5Y 5/1), fine sand; single grain; very friable; 1 percent fine faint light olive brown (2.5Y 5/3) masses of oxidized iron with clear boundaries in matrix; 5 percent medium faint gray (2.5Y 6/1) iron depletions with diffuse boundaries in matrix; strongly saline; SAR is about 85; very slightly effervescent; slightly alkaline; gradual smooth boundary.
Cnzg2—22 to 67 inches; dark gray (2.5Y 4/1), fine sand; single grain; very friable; 10 percent medium prominent greenish gray (5GY 5/1) iron depletions with clear boundaries in matrix; strongly saline; SAR is about 87; noneffervescent; neutral; gradual smooth boundary.
Cnzg3—67 to 80 inches; gray (2.5Y 5/1), fine sand; single grain; very friable; 5 percent fine and medium prominent dark greenish gray (5G 4/1) iron depletions with clear boundaries in matrix and 20 percent medium prominent greenish gray (5GY 5/1) iron depletions with clear boundaries in matrix; strongly saline; SAR is about 86; very slightly effervescent; slightly alkaline. (Combined thickness of the Cnzg horizons is 62 to 74 inches.)
Type Location
Kenedy County, Texas; from the intersection of Park Road 22 and the county line between Kleberg and Nueces counties; 8.0 miles southwest on Park Road 22 to the pay station entrance of Padre Island National Seashore; 2.4 miles southwest on Park Road 22 to the end of the paved road; 51.3 miles south along beach; 2.4 miles west on wind-tidal flat. Lat. 26 degrees 40 minutes 8.50 seconds N; Long. 97 degrees 21 minutes 18.60 seconds W. 7.5 Minute Topographic Quad: South of Potrero Lopeno NE, Texas. NAD 83
Padre Island National Seashore, Texas 143
Range in Characteristics
Soil moisture: An aquic soil moisture regime. The soil moisture control section is 12 to 36 inches from the soil surface. Although rainfall amounts are that of an ustic moisture regime, these soils remain saturated throughout in most years due to location on the landscape. The top of a permanent water table is at a depth of 12 to 18 inches throughout the year in normal years.
Mean annual soil temperature: 74 to 76 degrees F Depth to endosaturation: 12 to 18 inches Texture: Loamy fine sand or fine sand EC (dS/m): 60 to 175 SAR: 60 to 125 Particle-size control section (weighted average):
Clay content: 4 to 12 percent Sand content: 88 to 95 percent
Anz Horizon
Hue: 10YR or 2.5Y Value: 5 or 6 Chroma: 2 or 3 Clay content: 4 to 12 percent Masses of oxidized iron: Quantity—2 to 10 percent; size—fine or medium; contrast—faint
or distinct; boundary—clear or sharp; location—lining pores; shades—brown Iron depletions: Quantity—0 to 5 percent; size—fine or medium; contrast—faint;
boundary—clear or diffuse; location—adjacent to masses of oxidized iron; shades—gray
Reaction: Neutral to strongly alkaline
Cnzg Horizon
Hue: 10YR, 2.5Y, 5Y, or 5GY Value: 4 to 6 Chroma: 1 or 2 Clay content: 4 to 12 percent Masses of oxidized iron: Quantity—5 to 25 percent; size—fine to coarse; contrast—faint
to prominent; boundary—diffuse to sharp; location—throughout; shades—brown or yellow
Iron depletions: Quantity—2 to 25 percent; size—fine or medium; contrast—faint to prominent; boundary—clear or diffuse; location—adjacent to masses of oxidized iron; shades—gray, green, or blue
Reaction: Neutral to strongly alkaline
Competing Series
These are the Madre (TX) and Tatton (TX) series in the same family. Similar soils are the Basinger (FL), Captiva (FL), Dianola (TX), Hallandale (FL), Kesson (FL), Margate (FL), Moultrie (FL), Mustang (TX), Novillo (TX), Pompano (FL), and Valkaria (FL) series.
Madre soils have SAR values of less than 40, and EC values of less than 30 Tatton soils are very poorly drained and very frequently flooded Basinger, Moultrie, and Valkaria soils are Spodic Psammaquents Captiva and Margate soils are Mollic Psammaquents Dianola, Kesson, Novillo, Pompano, and Mustang soils are Typic Psammaquents Hallandale soils are Lithic Psammaquents
Geographic Setting
Parent material: Sandy eolian and storm washover sediments of Holocene age Landform: Wind-tidal flats
144 Soil Survey of
Slope: 0 to 1 percent Mean annual air temperature: 71 to 73 degrees F Mean annual precipitation: 25 to 35 inches Precipitation pattern: November through April are the driest months, with a second dry
period in July. September is the wettest month. Frost-free period: 310 to 350 days Elevation: 1 to 3 feet Thornthwaite annual P-E index: 31 to 44
Geographically Associated Soils
These are the Baffin, Daggerhill, Greenhill, Madre, Malaquite, Mustang, Padre, Panam, Tatton, Twinpalms, and Yarborough series.
Baffin soils are Sodic Hydraquents and are on a lower landform under seawater. Daggerhill and Greenhill soils are Ustic Quartzipsamments and are on a higher
landform on convex foredunes and back-island dune fields. Madre soils are on a higher landform on nearly level to concave barrier flats. Malaquite soils are Typic Halaquepts and are on a higher landform on nearly level to
concave barrier flats. Mustang soils are Typic Psammaquents and are on a higher landform on nearly level
to concave barrier flats. Padre and Panam soils are Aquic Quartzipsamments and are on a higher landform
on convex, low dunes or mounds on barrier flats. Tatton soils are very poorly drained and on a slightly lower landform. Twinpalms soils are Aquic Ustorthents and are on a higher landform on spoil pile
islands. Yarborough soils are Typic Halaquepts and are on a higher landform on spoil pile
islands.
Drainage and Permeability
Poorly drained; runoff is negligible due to the depressional feature of the wind-tidal flats. Permeability is rapid above the high water table, but the overall permeability class is very slow. A permanent water table fluctuates from 1 to 1.5 feet from the surface. These soils are frequently flooded for brief periods with salt water, which occur during times of high wind that pushes water onto the wind-tidal flats, storm surges, and heavy rains associated with tropical storms.
Use and Vegetation
Used primarily as wildlife habitat and for recreation. These soils are essentially barren of vegetation but have a thin benthic, blue-green algal mat consisting of Cyanobacteria. Halophytic vegetation consisting of saltwort and glasswort occur for short periods after inundation. The surface salinity rises as the surface dries, and eventually becomes toxic to the plants. (Wind Tidal Flat ecological site, 150BY716TX).
Distribution and Extent
Gulf Coast Saline Prairies; Land Resource Region T-Atlantic and Gulf Coast Lowlands; MLRA 150B; Barrier islands along the lower Gulf Coast of Texas; the series is of moderate extent.
MLRA Office Responsible
Temple, Texas
Series Established
Willacy County, Texas, 1980
Padre Island National Seashore, Texas 145
Remarks
Diagnostic horizons and features recognized in this pedon are: Particle-size control section: 10 to 40 inches (Anz1, Anz2, Cnzg1, and Cnzg2
horizons) Ochric epipedon: 0 to 17 inches (Anz1 and Anz2 horizons) Endosaturation: 12 to 80 inches (Anz2, Cnzg1, Cnzg2, and Cnzg3 horizons) Aquic conditions: These soils remain saturated and have reducing conditions for
at least 1 month in most years from 12 to 80 inches. Additional comments: The series type location was moved from Willacy County to
Kenedy County during the Soil Survey of Kenedy County because of easier access, local laboratory data, and more centralized series concept. The classification was changed from Typic Salorthids to Typic Aquisalids in 1995 based on application of the 6th edition of the Keys to Soil Taxonomy. The classification was changed in December 2004 from Typic Aquisalids to Sodic Psammaquents based on application of the 9th edition of the Keys to Soil Taxonomy and field investigations during the mapping of Padre Island National Seashore.
Additional Data
Laboratory data gathered by the project staff exists on the typical pedon from Kenedy County. Particle-size analysis on five pedons, and salinity and sodicity tests on eight pedons were performed at the soil survey project office.
Taxonomic Version
Keys to Soil Taxonomy, Ninth Edition, 2003
Tatton Series The Tatton series consists of very deep, very poorly drained, very slowly permeable
soils. These soils formed in sandy eolian and storm washover sediments of Holocene age. These nearly level soils are on wind-tidal flats on the bay or lagoon side of barrier islands. These soils are subject to very frequent flooding by wind tides and tropical storms. Slope ranges from 0 to 1 percent. Mean annual temperature is about 72 degrees F and mean annual precipitation is about 27 inches.
Taxonomic Class
Siliceous, hyperthermic Sodic Psammaquents
Typical Pedon
Tatton fine sand on a barren wind-tidal flat at an elevation of 0.5 feet (fig. 31). (Colors are for moist soil unless otherwise stated.)
Anz—0 to 4 inches; light yellowish brown (2.5Y 6/3), fine sand; moderate fine platy in the upper 2 inches and massive; very friable; 1/8- to 1/4-inch algal mat on surface; strongly saline; SAR is about 125; strongly effervescent; moderately alkaline; clear smooth boundary. (Thickness is 0 to 9 inches.)
Anzg—4 to 12 inches; light brownish gray (2.5Y 6/2), fine sand; massive; very friable; few light yellowish brown (2.5Y 6/3) strata about 1 1/2 inches thick; strongly saline; SAR is about 94; strongly effervescent; strongly alkaline; gradual smooth boundary. (Thickness is 3 to 15 inches.)
Cnzg1—12 to 18 inches; greenish gray (10Y 6/1), loamy fine sand; massive; very friable; 2 percent fine and medium prominent brownish yellow (10YR 6/6) masses of oxidized iron with diffuse boundaries at top of horizon; strongly saline; SAR is about 90; very slightly effervescent; slightly alkaline; clear smooth boundary.
Cnzg2—18 to 26 inches; light brownish gray (2.5Y 6/2), fine sand; massive; very friable; 4 percent medium prominent dark grayish brown (2.5Y 4/2) iron depletions with
146 Soil Survey of
diffuse boundaries in matrix; strongly saline; SAR is about 82; strongly effervescent; slightly alkaline; clear smooth boundary.
Cnzg3—26 to 40 inches; dark greenish gray (5G 4/1), fine sand; massive; very friable; few greenish gray (5GY 6/1) strata about 1/8- to 1/4-inch thick; strongly saline; SAR is about 88; noneffervescent; slightly alkaline; clear smooth boundary.
Cnzg4—40 to 80 inches; dark bluish gray (5B 4/1), fine sand; massive; very friable; very distinct sulfur smell; strongly saline; SAR is about 78; noneffervescent; slightly alkaline. (Combined thickness of the Cnzg horizon is 61 to 71 inches.)
Type Location
Willacy County, Texas; from the intersection of Park Road 22 and the county line between Kleberg and Nueces Counties; 8.0 miles southwest on Park Road 22 to the pay station entrance of Padre Island National Seashore; 2.4 miles southwest on Park Road 22 to the end of the paved road; 57.9 miles south along the beach; 3.9 miles west on wind-tidal flat. South of Potrero Lopeno SE, Texas USGS topographic quadrangle; Lat. 26 degrees 34 minutes 13.60 seconds N; Long. 97 degrees 20 minutes 15.30 seconds W; NAD 83.
Range in Characteristics
Soil moisture: An aquic soil moisture regime. The soil moisture control section is 12 to 36 inches from the soil surface. Although rainfall amounts are that of an ustic moisture regime, these soils remain saturated throughout in most years due to location on the landscape. The top of a permanent water table is at a depth of 0 to 9 inches throughout the year in normal years.
Mean annual soil temperature: 74 to 76 degrees F Depth to endosaturation: 0 to 9 inches Texture: Loamy fine sand, fine sand, or sand EC (dS/m): 60 to 175 SAR: 60 to 100 Particle-size control section (weighted average):
Clay content: 4 to 12 percent Sand content: 85 to 95 percent
Anz Horizon (where present)
Hue: 10YR or 2.5Y Value: 5 or 6 Chroma: 2 or 3 Masses of oxidized iron: Quantity—0 to 5 percent; size—fine or medium; contrast—faint
or distinct; boundary—clear or sharp; location—lining pores, shades—brown Iron depletions: Quantity—0 to 5 percent; size—fine or medium; contrast—faint;
boundary—clear or diffuse; location—adjacent to masses of oxidized iron; shades—gray
Reaction: Neutral to strongly alkaline
Anzg Horizon
Hue: 10YR, 2.5Y, 5Y, or N Value: 5 or 6 Chroma: 1 or 2 Masses of oxidized iron: Quantity—0 to 10 percent; size—fine or medium; contrast—faint
or distinct; boundary—clear or sharp; location—lining pores; shades—brown Iron depletions: Quantity—0 to 5 percent; size—fine or medium; contrast—faint;
boundary—clear or diffuse; location—adjacent to masses of oxidized iron; shades—gray
Reaction: Neutral to strongly alkaline
Padre Island National Seashore, Texas 147
Cnzg Horizon
Hue: 10YR, 2.5Y, 5Y, 5GY, 5G, or N Value: 4 to 6 Chroma: 0 to 2 Masses of oxidized iron: Quantity—2 to 25 percent; size—fine to coarse contrast—faint to
prominent; boundary—diffuse to sharp; location—throughout; shades—brown or yellow
Iron depletions: Quantity—2 to 25 percent; size—fine or medium; contrast—faint or distinct; boundary—clear or diffuse; location—adjacent to masses of oxidized iron; shades—gray, green, or blue
Reaction: Neutral to strongly alkaline
Competing Series
These are the Madre (TX) and Satatton (TX) series in the same family. Similar soils are the Basinger (FL), Captiva (FL), Dianola (TX), Hallandale (FL), Kesson (FL), Margate (FL), Moultrie (FL), Mustang (TX), Novillo (TX), Pompano (FL), and Valkaria (FL) series.
Madre soils have SAR values of less than 40, and EC values of less than 30 Satatton soils are poorly drained and are frequently flooded Basinger, Moultrie, and Valkaria soils are Spodic Psammaquents Captiva and Margate soils are Mollic Psammaquents Dianola, Kesson, Novillo, Pompano, and Mustang soils are Typic Psammaquents Hallandale soils are Lithic Psammaquents
Geographic Setting
Parent material: Sandy eolian and storm washover sediments of Holocene age Landform: Wind-tidal flats Slope: 0 to 1 percent Mean annual air temperature: 71 to 73 degrees F Mean annual precipitation: 25 to 35 inches Precipitation pattern: November through April are the driest months, with a second dry
period in July. September is the wettest month. Frost-free period: 310 to 350 days Elevation: 0 to 1 feet Thornthwaite annual P-E index: 31 to 44
Geographically Associated Soils
These are Baffin, Daggerhill, Greenhill, Madre, Malaquite, Mustang, Padre, Panam, Satatton, Twinpalms, and Yarborough series.
Baffin soils are Sodic Hydraquents and are on a lower landform under seawater. Daggerhill and Greenhill soils are Ustic Quartzipsamments and are on a higher
landform on convex foredunes and back-island dune fields. Madre soils are on a higher landform on nearly level to concave barrier flats. Malaquite soils are Typic Halaquepts and are on a higher landform on nearly level to
concave barrier flats. Mustang soils are Typic Psammaquents and are on a higher landform on nearly level
to concave barrier flats. Padre and Panam soils are Aquic Quartzipsamments and are on a higher landform
on convex, low dunes or mounds on barrier flats. Satatton soils are on a slightly higher landform. Twinpalms soils are Aquic Ustorthents and are on a higher landform on spoil pile
islands. Yarborough soils are Typic Halaquepts and are on a higher landform on spoil pile
islands.
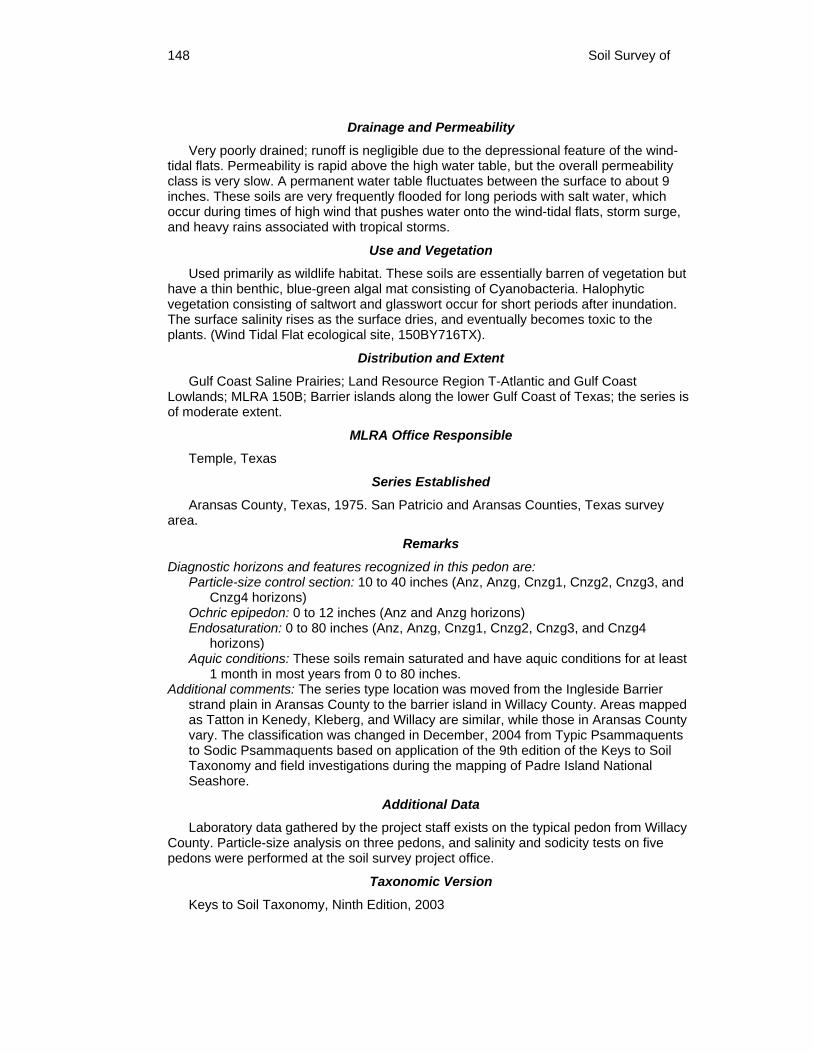
148 Soil Survey of
Drainage and Permeability
Very poorly drained; runoff is negligible due to the depressional feature of the wind-tidal flats. Permeability is rapid above the high water table, but the overall permeability class is very slow. A permanent water table fluctuates between the surface to about 9 inches. These soils are very frequently flooded for long periods with salt water, which occur during times of high wind that pushes water onto the wind-tidal flats, storm surge, and heavy rains associated with tropical storms.
Use and Vegetation
Used primarily as wildlife habitat. These soils are essentially barren of vegetation but have a thin benthic, blue-green algal mat consisting of Cyanobacteria. Halophytic vegetation consisting of saltwort and glasswort occur for short periods after inundation. The surface salinity rises as the surface dries, and eventually becomes toxic to the plants. (Wind Tidal Flat ecological site, 150BY716TX).
Distribution and Extent
Gulf Coast Saline Prairies; Land Resource Region T-Atlantic and Gulf Coast Lowlands; MLRA 150B; Barrier islands along the lower Gulf Coast of Texas; the series is of moderate extent.
MLRA Office Responsible
Temple, Texas
Series Established
Aransas County, Texas, 1975. San Patricio and Aransas Counties, Texas survey area.
Remarks
Diagnostic horizons and features recognized in this pedon are: Particle-size control section: 10 to 40 inches (Anz, Anzg, Cnzg1, Cnzg2, Cnzg3, and
Cnzg4 horizons) Ochric epipedon: 0 to 12 inches (Anz and Anzg horizons) Endosaturation: 0 to 80 inches (Anz, Anzg, Cnzg1, Cnzg2, Cnzg3, and Cnzg4
horizons) Aquic conditions: These soils remain saturated and have aquic conditions for at least
1 month in most years from 0 to 80 inches. Additional comments: The series type location was moved from the Ingleside Barrier
strand plain in Aransas County to the barrier island in Willacy County. Areas mapped as Tatton in Kenedy, Kleberg, and Willacy are similar, while those in Aransas County vary. The classification was changed in December, 2004 from Typic Psammaquents to Sodic Psammaquents based on application of the 9th edition of the Keys to Soil Taxonomy and field investigations during the mapping of Padre Island National Seashore.
Additional Data
Laboratory data gathered by the project staff exists on the typical pedon from Willacy County. Particle-size analysis on three pedons, and salinity and sodicity tests on five pedons were performed at the soil survey project office.
Taxonomic Version
Keys to Soil Taxonomy, Ninth Edition, 2003
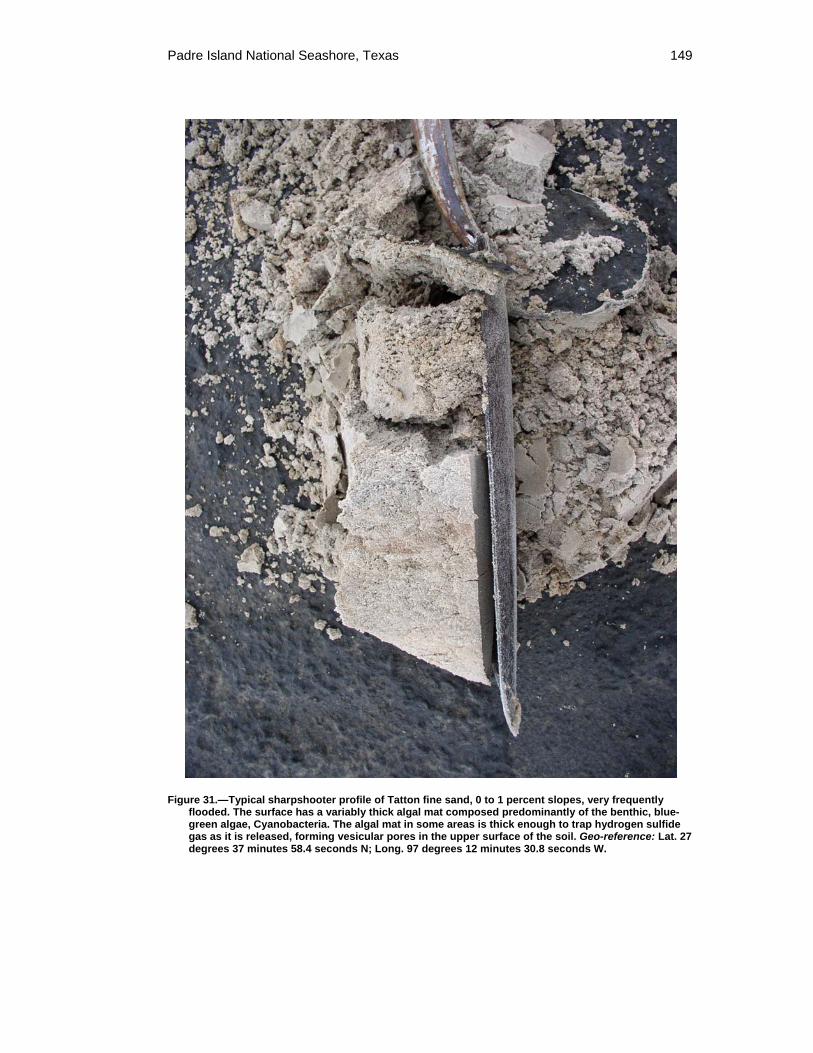
Padre Island National Seashore, Texas 149
Figure 31.—Typical sharpshooter profile of Tatton fine sand, 0 to 1 percent slopes, very frequently flooded. The surface has a variably thick algal mat composed predominantly of the benthic, blue-green algae, Cyanobacteria. The algal mat in some areas is thick enough to trap hydrogen sulfide gas as it is released, forming vesicular pores in the upper surface of the soil. Geo-reference: Lat. 27 degrees 37 minutes 58.4 seconds N; Long. 97 degrees 12 minutes 30.8 seconds W.
150 Soil Survey of
Twinpalms Series The Twinpalms series consists of very deep, somewhat poorly drained, moderately
permeable soils that formed in sandy and loamy sediments dredged from submerged areas. These very gently sloping soils are on low mounds on spoil pile areas. These soils are subject to occasional flooding by high storm surge from strong tropical storms. Slope ranges from 1 to 3 percent. Mean annual temperature is about 72 degrees F and mean annual precipitation is about 27 inches.
Taxonomic Class
Coarse-loamy, siliceous, active, calcareous, hyperthermic Aquic Ustorthents
Typical Pedon
Twinpalms fine sand in an area of Twinpalms-Yarborough complex, 0 to 3 percent slopes on a southwest facing 2 percent slope in wildlife land at an elevation of 6 feet (Colors are for moist soil unless otherwise stated.)
A1—0 to 8 inches; light olive brown (2.5Y 5/3) fine sand, light yellowish brown (2.5Y 6/3) dry; weak fine subangular blocky structure parting to single grain; loose; 6 percent very fine and fine roots; 5 percent fine faint light yellowish brown (2.5Y 6/4) masses of oxidized iron with clear boundaries lining pores; 2 percent gravel-sized and 10 percent sand-sized seashell fragments; nonsaline; SAR is less than 1; very slight effervescence; slightly alkaline; clear smooth boundary.
A2—8 to 18 inches; grayish brown (2.5Y 5/2) fine sand, light brownish gray (2.5Y 6/2) dry; single grain; loose; 3 percent very fine and fine roots; 3 percent fine distinct pale yellow (2.5Y 7/4) masses of oxidized iron with sharp boundaries lining pores; 2 percent gravel-sized and 10 percent sand-sized seashell fragments; nonsaline; SAR is less than 1; very slightly effervescent; slightly alkaline; clear smooth boundary. (Combined thickness of the A horizons is 6 to 27 inches.)
C—18 to 30 inches; olive (5Y 5/3) fine sandy loam, pale olive (5Y 6/3) dry; massive; slightly hard, friable; 2 percent very fine and fine roots; 15 percent medium distinct greenish gray (10Y 6/1) clay balls; 2 percent fine and medium gypsum crystals; 5 percent fine and medium prominent dark yellowish brown (10YR 4/6) masses of oxidized iron with clear boundaries lining pores; 4 percent gravel-sized and 10 percent sand-sized seashell fragments; 5 percent gravel-sized serpulid reef fragments; nonsaline; SAR is less than 1; very slightly effervescent; slightly alkaline; clear smooth boundary. (Thickness is 6 to 29 inches.)
Cg1—30 to 40 inches; light brownish gray (2.5Y 6/2) gravelly fine sand, light gray (2.5Y 7/2) dry; massive; loose; 1 percent very fine and fine roots; 4 percent fine and medium distinct dark gray (10YR 4/1) and 3 percent fine and medium gray (N 5/0) iron depletions with clear boundaries in the matrix; 20 percent gravel-sized, and 10 percent sand-sized seashell fragments; 7 percent gravel-sized serpulid reef fragments; nonsaline; SAR is less than 1; very slightly effervescent; slightly alkaline; gradual smooth boundary.
Cg2—40 to 67 inches; light olive gray (5Y 6/2) loamy fine sand, light gray (5Y 7/2) dry; massive; soft, very friable; 1 percent very fine and fine roots; 2 percent 1 centimeter thick strata of greenish gray (10Y 5/1) clay; 2 percent 1 centimeter thick strata of olive gray (5Y5/2) clay loam; 3 percent fine and medium prominent light olive brown (2.5Y 5/6) and 1 percent fine prominent strong brown (7.5YR 5/6) masses of oxidized iron with clear to sharp boundaries lining pores; 3 percent fine and medium distinct olive gray (5Y 5/2) iron depletions with diffuse boundaries in the matrix; 7 percent gravel-sized and 10 percent sand-sized seashell fragments; 5 percent gravel-sized serpulid reef fragments; nonsaline; SAR is about 1; very slightly effervescent; slightly alkaline; gradual smooth boundary.
Padre Island National Seashore, Texas 151
Cg3—67 to 80 inches; gray (5Y 6/1) gravelly fine sand, light gray (5Y 7/1) dry; massive; soft, very friable; 5 percent fine and medium distinct greenish gray (5GY 6/1) iron depletions with diffuse boundaries in the matrix; 10 percent gravel-sized and 10 percent sand-sized seashell fragments; 10 percent paragravel-sized claystone fragments; nonsaline; SAR is about 2; very slightly effervescent; slightly alkaline. (Combined thickness of the Cg horizon is 41 to 62 inches.)
Type Location
Kenedy County, Texas; from the intersection of Park Road 22 and the county line between Kleberg and Nueces Counties; 8.0 miles southwest on Park Road 22 to the pay station entrance of Padre Island National Seashore; 0.8 miles southwest on Park Road 22 to the intersection of Novillo and Bird Island Basin Road; 2.1 miles west-northwest and north on Bird Island Basin Road to boat ramp; 28.7 miles by boat generally west-southwest along the Gulf Intracoastal Waterway into the landcut to channel running east near the center of Potrero Grande; 600 feet east into channel; 400 feet north on mound in wildlife land. Potrero Cortado, Texas USGS topographic quadrangle; Lat. 27 degrees, 06 minutes, 13.7 seconds N; Long. 97 degrees, 26 minutes, 24.7 seconds W; NAD 83.
Range in Characteristics
Soil moisture: An ustic soil moisture regime bordering on udic. The soil moisture control section is dry in some or all parts for less than 120 cumulative days in normal years. A water table is present in most pedons at depths of 30 to 60 inches throughout the year in most years.
Mean annual soil temperature: 74 to 76 degrees F Depth to masses of oxidized iron: 0 to 10 inches Depth to iron depletions: 30 to 60 inches Depth to endosaturation: 30 to 60 inches in most years Particle-size control section (weighted average):
Clay content: 5 to 18 percent Sand content: 70 to 95 percent Coarse fragments: Consist of seashell and seashell fragments, or fragments of
serpulid reefs
A Horizon
Hue: 10YR or 2.5Y Value: 4 to 6 (5 to 7 dry) Chroma: 2 or 3 Texture: Fine sand Clay content: 5 to 10 percent Masses of oxidized iron: Quantity—2 to 15 percent; size—fine or medium; contrast—faint
to prominent; boundary—clear to sharp; shades—brown, olive, or yellow Coarse fragments: 1 to 14 percent EC (dS/m): 0 to 4 SAR: 0 to 8 Reaction: Slightly alkaline to strongly alkaline
C Horizon
Hue: 10YR, 2.5Y or 5Y Value: 5 or 6 (6 or 7 dry) Chroma: 2 or 3 Texture: Loamy fine sand, fine sandy loam, or their gravelly counterparts Clay content: 5 to 18 percent Masses of oxidized iron: Quantity—2 to 15 percent; size—fine or medium; contrast—faint
to distinct; boundary—clear to sharp; shades—brown, olive, or yellow
152 Soil Survey of
Iron depletions: Quantity—0 to 2 percent; size—fine or medium; contrast—faint or distinct; boundary—diffuse or clear; shades—gray or green
Coarse fragments: 1 to 20 percent EC (dS/m): 0 to 4 SAR: 0 to 8 Reaction: Slightly alkaline to strongly alkaline
Cg Horizon
Hue: 2.5Y, 5Y, 10Y, or 5GY Value: 5 to 6 (6 or 7 dry) Chroma: 1 or 2 Texture: Fine sand, loamy fine sand, fine sandy loam, or their gravelly counterparts Clay content: 5 to 18 percent Masses of oxidized iron: Quantity—2 to 20 percent; size—fine to coarse; contrast—faint
to prominent; boundary—clear to sharp; shades—black, brown, olive, or yellow Iron depletions: Quantity—0 to 20 percent; size—fine to coarse; contrast—faint or
distinct; boundary—diffuse or clear; shades—gray or green Coarse fragments: 1 to 30 percent EC (dS/m): 0 to 4 SAR: 0 to 8 Reaction: Neutral to strongly alkaline
Competing Series
There are no competing series in the same family. Similar soils are the Neches (TX), Riolomas (TX), Sievers (TX), and Yarborough (TX) series.
Neches and Riolomas soils have no seashell fragments, do not have iron depletions within 40 inches, and are in the udic moisture regime.
Sievers soils have a fine-loamy particle size control section, are somewhat poorly drained, and are in the udic moisture regime.
Yarborough soils are poorly drained, have SAR of 13 or more within 40 inches of the soil surface and have a water table within 24 inches of the surface.
Geographic Setting
Parent material: Sandy and loamy sediments dredged from shallow bays Landform: Mounds on spoil piles Slope: 1 to 3 percent Mean annual air temperature: 71 to 73 degrees F Mean annual precipitation: 25 to 35 inches Precipitation pattern: November through April are the driest months, with a second dry
period in July. September is the wettest month. Frost-free period: 310 to 350 days Elevation: 3 to 10 feet Thornthwaite P-E Index: 31 to 44
Geographically Associated Soils
These are the Arrada, Baffin, Madre, Malaquite, Satatton, Tatton, and Yarborough series.
Arrada, Satatton and Tatton soils have SAR of 13 or more within 40 inches of the surface, and occur on lower wind-tidal flat landforms.
Baffin soils are very poorly drained, have an n-value of more than 0.7 in the upper 20 inches, and are on lower landforms under seawater.
Madre and Malaquite soils are poorly drained, have SAR of 13 or more within 40 inches of the surface, and occur on lower, planar to concave landforms on barrier flats.
Yarborough soils are on lower, planar to concave landforms on spoil piles.
Padre Island National Seashore, Texas 153
Drainage and Permeability
Somewhat poorly drained. Permeability is moderate. Runoff is low. A water table is present in most pedons within a depth of 30 to 60 inches. These soils are subject to occasional flooding for very brief periods of time by high storm surge during strong tropical storms.
Use and Vegetation
Used for wildlife habitat. Native vegetation consists of seacoast bluestem, gulfdune paspalum, brownseed paspalum, ragweed, and scattered mesquite. (Coastal Sand ecological site, PE 31-44, 150BY648TX).
Distribution and Extent
Gulf Coast Saline Prairies; Land Resource Region T-Atlantic and Gulf Coast Lowlands; MLRA 150B; Spoil pile areas associated with bay systems and barrier islands along the lower Gulf Coast of Texas; the series is of small extent.
MLRA Office Responsible
Temple, Texas
Series Proposed
Kenedy County, Texas; Kenedy and Kleberg Counties soil survey area, 2004. The name is from the local name of a spoil island near Baffin Bay.
Remarks
The series was formerly included in the Ijam series, undifferentiated groups Ustifluvents, Ustorthents, or Udipsamments, or the miscellaneous areas—spoil piles.
The series was established based on the difference in family particle size and soil moisture regime.
Diagnostic horizons and features recognized in this pedon are: Aquic conditions: 30 to 80 inches (Cg1, Cg2 and Cg3 horizons) Particle-size control section: 10 to 40 inches (A2, C and Cg1 horizons) Ochric epipedon: 0 to 18 inches (A1 and A2 horizons) Masses of oxidized iron: 0 to 80 inches (A1, A2, C, Cg1, Cg2 and Cg3 horizons) Iron depletions: Depleted matrix at 28 to 80 inches (Cg1, Cg2 and Cg3 horizons) Endosaturation: 30 to 80 inches in most years
Additional Data
Particle-size analysis on seven pedons, and salinity and sodicity tests on ten pedons were performed at the soil survey project office.
Taxonomic Version
Keys to Soil Taxonomy, Ninth Edition, 2003
Yarborough Series The Yarborough series consists of very deep, poorly drained, very slowly permeable
soils that formed in sandy and loamy sediments dredged from submerged areas. These nearly level soils are on flats within and along the margins of spoil pile areas. These soils are subject to very frequent flooding by high storm surge from strong tropical storms. Slope ranges from 0 to 1 percent. Mean annual temperature is about 72 degrees F and mean annual precipitation is about 27 inches.
Taxonomic Class
Coarse-loamy, siliceous, active, calcareous, hyperthermic Typic Halaquepts
154 Soil Survey of
Typical Pedon
Yarborough fine sandy loam in an area of Twinpalms-Yarborough complex, 0 to 3 percent slopes in wildlife land at an elevation of 1 foot. (Colors are for moist soil unless otherwise stated.)
Anz—0 to 7 inches; dark grayish brown (2.5Y 4/2), fine sandy loam, grayish brown (2.5Y 5/2), dry; weak fine and medium subangular blocky structure; friable, slightly hard; common fine and medium roots; 7 percent medium and coarse distinct pale olive (5Y 6/3) and 2 percent fine prominent dark yellowish brown (10YR 4/6) masses of oxidized iron with sharp boundaries lining pores; 1 percent medium faint very dark grayish brown (2.5Y 3/2) iron depletions with diffuse boundaries in the matrix; 8 percent gravel-sized and 20 percent sand-sized shell fragments; strongly saline; SAR is about 45; strongly effervescent; slightly alkaline; clear smooth boundary. (Thickness is 4 to 9 inches.)
Cnzg1—7 to 20 inches; light olive gray (5Y 6/2), fine sandy loam, light brownish gray (2.5Y 6/2), dry; massive; friable, slightly hard; 7 percent fine and medium prominent olive yellow (2.5Y 6/6) masses of oxidized iron with sharp boundaries lining pores; 1 percent fine faint olive gray (5Y 5/2) iron depletions with diffuse boundaries in the matrix; 12 percent gravel-sized and 20 percent sand-sized shell fragments; strongly saline; SAR is about 47; strongly effervescent; moderately alkaline; gradual smooth boundary.
Cnzg2—20 to 30 inches; light olive gray (5Y 6/2), gravelly fine sandy loam, light gray (2.5Y 7/2), dry; massive; friable, slightly hard; 20 percent medium and coarse greenish gray (5G 5/1) sandy clay loam; 4 percent fine and medium prominent olive yellow (2.5Y 6/6) masses of oxidized iron with sharp boundaries in the matrix; 20 percent gravel-sized and 20 percent sand-sized shell fragments; strongly saline; SAR is about 52; strongly effervescent; moderately alkaline; clear smooth boundary.
Cnzg3—30 to 60 inches; greenish gray (5G 5/1), fine sandy loam; massive; friable, slightly hard; 30 percent gray (2.5Y 6/1) gravelly loamy fine sand; 2 percent fine and medium prominent olive (5Y 5/6) masses of oxidized iron with sharp boundaries in the matrix; 5 percent medium faint light olive gray (5Y 6/2) iron depletions with diffuse boundaries in the matrix; 7 percent gravel-sized and 15 percent sand-sized shell fragments; strongly saline; SAR is about 52; violently effervescent; slightly alkaline; clear smooth boundary.
Cnzg4—60 to 72 inches; dark gray (5Y 4/1), loamy fine sand, light brownish gray (2.5Y 6/2), dry; massive; very friable, soft; 10 percent 3 centimeters thick strata of greenish gray (5G 5/1) sandy clay loam; 2 percent gravel-sized and 15 percent sand-sized shell fragments; strongly saline; SAR is about 52; violently effervescent; slightly alkaline; clear smooth boundary.
Cnzg5—72 to 80 inches; gray (5Y 5/1), fine sand, light gray (2.5Y 7/2), dry; massive; very friable, soft; 3 percent gravel-sized and 10 percent sand-sized shell fragments; strongly saline; SAR is about 57; violently effervescent; slightly alkaline. (Combined thickness of the Cnzg horizon is 71 to 76 inches.)
Type Location
Kenedy County, Texas; from the intersection of Park Road 22 and the county line between Kleberg and Nueces Counties; 8.0 miles southwest on Park Road 22 to the pay station entrance of Padre Island National Seashore; continue 0.8 miles southwest on Park Road 22 to the intersection of Novillo and Bird Island Basin Road; 2.1 miles west-northwest and north on Bird Island Basin Road to boat ramp; 14.6 miles by boat generally west-southwest along the Gulf Intracoastal Waterway to the mouth of Baffin Bay; 900 feet east to spoil island near green can marker 215; 350 feet south in low flat in wildlife land. Point of Rocks, Texas USGS topographic quadrangle; Lat. 27 degrees, 17 minutes, 42.8 seconds N; Long. 97 degrees, 24 minutes, 16.9 seconds W; NAD 83.
Padre Island National Seashore, Texas 155
Range in Characteristics
Soil moisture: Aquic conditions between 10 and 20 inches below the soil surface at some time in normal years. Although rainfall amounts are that of an ustic moisture regime, the top of a permanent water table is at a depth of 10 to 24 inches throughout the year, and is saturated for several days following heavy rains or extremely high tides. Salinity is variable, but in one or more horizons that are at least 6 inches thick, electrical conductivity of the water extracted from a saturated paste is more than 30 dS/m for more than 90 days in normal years. The SAR ranges from 20 to 60 throughout the series control section. The location in the soil of the maximum salinity and sodicity varies according to length of time since last flooding.
Mean annual soil temperature: 74 to 76 degrees F Depth to masses of oxidized iron: 0 to 10 inches Depth to iron depletions: 6 to 24 inches Depth to endosaturation: 10 to 24 inches throughout the year Particle-size control section (weighted average):
Clay content: 5 to 18 percent Sand content: 75 to 90 percent Coarse fragments: Consist of seashell and seashell fragments or fragments of
serpulid reefs.
Anz Horizon
Hue: 2.5Y or 5Y Value: 4 to 6 (5 to 7 dry) Chroma: 1 or 2 Texture: Fine sandy loam Clay content: 7 to 18 percent Masses of oxidized iron: Quantity—2 to 10 percent; size—fine or medium; contrast—
distinct or prominent; boundary—clear or sharp; shades—brown, olive, or yellow Iron depletions: Quantity—0 to 15 percent; size—fine or medium; contrast—faint or
distinct; boundary—diffuse or clear; shades—gray in the lower part Coarse fragments: 1 to 10 percent EC (dS/m): 15 to 60 SAR: 20 to 60 Reaction: Slightly alkaline or moderately alkaline
Upper Cnzg Horizon
Hue: 2.5Y, 5Y, 10Y, or 5GY Value: 5 or 6 (6 or 7 dry) Chroma: 1 or 2 Texture: Loamy fine sand, fine sandy loam, or their gravelly counterparts Clay content: 5 to 18 percent Masses of oxidized iron: Quantity—0 to 10 percent; size—fine or medium; contrast—faint
to prominent; boundary—clear or sharp; shades—brown, olive, or yellow Iron depletions: Quantity—2 to 15 percent; size—fine to coarse; contrast—faint or
distinct; boundary—diffuse or clear; shades—gray Coarse fragments: 3 to 20 percent EC (dS/m): 20 to 60 SAR: 20 to 60 Reaction: Slightly alkaline or moderately alkaline
Lower Cnzg Horizon
Hue: 5Y, 10Y, 5GY, 5G, or N Value: 4 to 6 (5 to 7 dry) Chroma: 0 or 1
156 Soil Survey of
Texture: Fine sand, loamy fine sand, or fine sandy loam Clay content: 5 to 18 percent Masses of oxidized iron: Quantity—0 to 3 percent; size—fine or medium; contrast—
distinct or prominent; boundary—clear or sharp; shades—brown or olive Iron depletions: Quantity—3 to 20 percent; size—fine or medium; contrast—faint or
distinct; boundary—diffuse or clear; shades—gray or green Coarse fragments: 1 to 10 percent EC (dS/m): 20 to 60 SAR: 20 to 70 Reaction: Slightly alkaline or moderately alkaline
Competing Series
There are no competing series in the same family. Similar soils are the Arrada (TX), Baffin (TX), Barrada (TX), Cedarlake (TX), Malaquite (TX), Neches (TX), Riolomas (TX), Saucel (TX), Sievers (TX), Topo (TX), and Twinpalms (TX) series.
Arrada and Cedarlake soils have mixed mineralogy and a fine-loamy particle-size control section. In addition, Cedarlake soils have a thermic temperature regime.
Baffin soils are very poorly drained, have an n-value of 0.7 or more and are permanently submersed.
Barrada soils have mixed mineralogy and a fine particle-size control section. Malaquite soils have a sandy particle-size control section. Neches and Riolomas soils have no seashell fragments, do not have iron depletions
within 40 inches, and are in the udic moisture regime. Saucel and Topo soils have mixed mineralogy and no seashell fragments. In addition,
Topo soils have salinity of less than 16 dS/m in the series control section. Sievers soils have a fine-loamy particle-size control section, are somewhat poorly
drained, and are in the udic moisture regime. Twinpalms soils are somewhat poorly drained, have a water table within 30 to 60
inches and have SAR of less than 13 within the 10- to 40-inch control section.
Geographic Setting
Parent material: Sandy and loamy sediments dredged from shallow bays Landform: Flats and concave positions of spoil piles Slope: 0 to 1 percent Mean annual air temperature: 71 to 73 degrees F Mean annual precipitation: 25 to 35 inches Precipitation pattern: November through April are the driest months, with a second dry
period in July. September is the wettest month. Frost-free period: 310 to 350 days Elevation: 0 to 4 feet Thornthwaite P-E Index: 31 to 44
Geographically Associated Soils
These are the Arrada, Baffin, Madre, Malaquite, Satatton, Tatton, and Twinpalms series.
Arrada soils occur on lower wind-tidal flat landforms. Baffin soils are on lower landforms under seawater. Madre and Malaquite soils have a sandy particle-size control section, and occur on
barrier flat landforms on barrier islands. Satatton and Tatton soils have a sandy particle-size control section, and occur on
lower wind-tidal flat landforms. Twinpalms soils are on higher, slightly mounded landforms on spoil piles.
Padre Island National Seashore, Texas 157
Drainage and Permeability
Poorly drained; runoff is high due to the seasonal water table. Permeability is moderate above the high water table, but the overall permeability class is very slow. The water table is at a depth of 10 to 24 inches throughout the year in most years. These soils are subject to very frequent flooding for brief periods by high storm surge during strong tropical storms.
Use and Vegetation
Used as wildlife habitat. Native vegetation is saltflat grass, seashore saltgrass, marshay cordgrass, bushy sea-oxeye daisy, and glasswort with some interspersed barren areas. (Salt Flat ecological site, PE 31-44, 150BY651TX).
Distribution and Extent
Gulf Coast Saline Prairies; Land Resource Region T-Atlantic and Gulf Coast Lowlands; MLRA 150B; Spoil pile areas associated with bay systems and barrier islands along the lower Gulf Coast of Texas; the series is of small extent.
MLRA Office Responsible
Temple, Texas
Series Proposed
Kenedy County, Texas, 2004. The name is from the name of a closed pass that was dredged on Padre Island.
Remarks
The series was formerly included in the Ijam series, undifferentiated groups ustifluvents, ustorthents, or udipsamments, or the miscellaneous areas—spoil piles.
The series was established based on the difference in family particle size and soil moisture regime.
Diagnostic horizons and features recognized in this pedon are: Particle-size control section: 10 to 40 inches (Cnzg1, Cnzg2 and Cnzg3 horizons) Aquic conditions: Evidenced by low chroma colors due to wetness Ochric epipedon: 0 to 7 inches (Anz horizon) Masses of oxidized iron: 0 to 80 inches (Anz, Cnzg1, Cnzg2, Cnzg3, Cnzg4, and
Cnzg5 horizons) Iron depletions: Depleted matrix at 0 to 80 inches (Anz, Cnzg1, Cnzg2, Cnzg3,
Cnzg4, and Cnzg5 horizons) Endosaturation: 10 to 24 inches in most years
Additional Data
Particle-size analysis on six pedons, and salinity and sodicity tests on eight pedons were performed at the soil survey project office.
Taxonomic Version
Keys to Soil Taxonomy, Ninth Edition, 2003

159
References
American Association of State Highway and Transportation Officials (AASHTO). 2000. Standard specifications for transportation materials and methods of sampling and testing. 20th edition, 2 volumes.
American Society for Testing and Materials (ASTM). 2001. Standard classification of soils for engineering purposes. ASTM Standard D 2487-00.
Andrews, P.B. 1970. Facies and genesis of a hurricane-washover fan, St. Joseph Island, central Texas coast. The University of Texas at Austin, Bureau of Economic Geology Report of Investigatrions 67, 147 p.
Birkeland, Peter W. 1974. Pedology, weathering, and geomorphological research.
Birkeland, Peter W. 1984. Soils and geomorphology. 2nd edition.
Black, C.A. 1968. Soil-plant relationships. 2nd edition.
Bradley, Michael P. 2001. Subaqueous soils and subtidal wetlands in Rhode Island. M.S. thesis, Univ. of Rhode Island, Kingston.
Bradley, Michael P. and M.H. Stolt. 2002. Evaluating methods to create a base map for a subaqueous soil inventory. Soil Science, vol. 167, no. 3, March 2002, pp. 222-228.
Bradley, Michael P. and M.H. Stolt. 2003. Subaqueous soil-landscape relationships in a Rhode Island estuary. Soil Sci. Soc. Am. Jour., vol. 67, pp. 1487-1495.
Bullard, F.M. 1942. Source of beach and river sands on the Gulf coast of Texas, Geol. Soc America Bull., v. 53, no. 7, pp. 1021-1044.
Buol, S.W., F.D. Hole, and R.J. McCracken. 1980. Soil genesis and classification. 3rd edition.
Coastal Bend Bays and Estuaries Program website, http://www.cbbep.org.
Cowardin, L.M., V. Carter, F.C. Golet, and E.T. LaRoe. 1979. Classification of wetlands and deep-water habitats of the United States. U.S. Fish and Wildlife Service FWS/OBS-79/31.
Curray, J.R. 1960. Sediments and history of the Holocene transgression, continental shelf, northwest Gulf of Mexico. In Recent sediments, northwest Gulf of Mexico, Shepard et al, eds., AAPG, Tulsa, OK, pp. 221-266.
Demas, George P. 1993. Submerged soils: a new frontier in soil survey. Soil Surv. Horiz., vol. 34, pp. 44-46.
Demas, George P. 1998. Subaqueous soils of Sinepuxent Bay, Maryland. Ph.D. dissertation, Univ. of Maryland, College Park.
160 Soil Survey of
Demas, George P. and J.H. Brown. 1997. A new look at soil survey: a tandem approach using conceptual and quantitative methods. Soil Surv. Horiz., vol. 38, pp. 30-33.
Demas, George P., J.H. Brown, and M.C. Rabenhorst. 1998. Subaqueous soil survey of Sinepuxent Bay, Maryland, USDA-NRCS, July 1998.
Demas, George P. and M.C. Rabenhorst. 1999. Subaqueous soils: pedogenesis in a submersed environment. Soil Sci. Soc. Am. Jour., vol. 63, pp. 1250-1257.
Demas, George P. and Martin C. Rabenhorst. 2001. Factors of subaqueous soil formation: a system of quantitative pedology for submersed environments. Geoderma, 102:3-4, August 2001, pp. 189-204.
Demas, George P., M.C. Rabenhorst, and J.C. Stevenson. 1996. Subaqueous soils: a pedological approach to the study of shallow water habitats. Estuaries, vol.19, pp. 229-237.
Federal Register. July 13, 1994. Changes in hydric soils of the United States.
Federal Register. February 24, 1995. Hydric soils of the United States.
Handbook of Texas Online, s.v. "PADRE ISLAND," http://www.tsha.utexas.edu/handbook/online/articles/view/PP/rrp1.html (accessed December 30, 2004a).
Handbook of Texas Online, s.v. "PADRE ISLAND NATIONAL SEASHORE," http://www.tsha.utexas.edu/handbook/online/articles/view/PP/gkp1.html (accessed December 30, 2004b).
Hayes, M.O., 1965. Sedimentation on a semiarid, wave-dominated coast (South Texas) with emphasis on hurricane effects, Univ. of Texas dissertation, 350 p.
Hunter, Ralph E., Richard L. Watson, Gary W. Hill, and Kendell A. Dickinson. 1972. Modern depositional environments and processes, northern and central Padre Island, Texas. In Padre Island National Seashore Field Guide, Corpus Christi Geological Society, Corpus Christi, Texas, pp. 1-27.
Hurt, G.W., P.M. Whited, and R.F. Pringle, editors. Version 4.0, 1998. Field indicators of hydric soils in the United States.
Jenny, Hans. 1941. Factors of soil formation.
Jenny, Hans. 1980. The soil resource—origin and behavior. Ecological Studies 37.
Kimsey, D.B. and R.F. Temple, 1963. Currents on the continental shelf of the northwestern Gulf of Mexico. In Fishery Research, Biological Laboratory,Galveston, TX, Fiscal Year 1962: U.S. Bur. Commercial Fisheries Circ. 161, pp. 23-27.
Kimsey, D.B. and R.F. Temple, 1964. Currents on the continental shelf of the northwestern Gulf of Mexico. In Fishery Research, Biological Laboratory,Galveston, TX, Fiscal Year 1963: U.S. Bur. Commercial Fisheries Circ. 183, pp. 25-27.
Padre Island National Seashore, Texas 161
Lazarine, Paul. Common wetland plants of southeast Texas. U.S. Army Corps of Engineers District, Galveston, Texas.
Leatherman, Stephen P. 1988. Barrier island handbook.
Lohse, E.A., 1955. Dynamic geology of the modern coastal region, northwest Gulf of Mexico. In Finding ancient shorelines—a symposium, Hough and Menard eds., SEPM Spec. Pub. 3, pp. 99-105.
McGowen, J.H., Garner, L. E., and Wilkinson, B.H. 1977. The Gulf shoreline of Texas: processes, characteristics, and factors in use. The University of Texas at Austin, Bureau of Economic Geology Geological Circular 77-3, 27 p.
Mokma, D.L. 1978. Soil management units and land use planning. Michigan State University, Extension Bulletin E-1262.
Morton, R.A. 1977. Historical shoreline changes and their causes, Texas Gulf Coast, Gulf Coast Assoc. Geol. Socs. Trans., v. 27, pp. 352-364.
National Research Council. 1995. Wetlands: Characteristics and boundaries.
Pendleton, Elizabeth A., E. Robert Thieler, S. Jerrfress Williams, and Rebecca L. Beavers. 2004. Coastal Vulnerability Assessment of Padre Island National Seashore (PAIS) to Sea-Level Rise, U.S. Geol. Surv. Open-File Report 2004-1090, http://pubs.usgs.gov/of/2004/1090/index.html
Portland Cement Association. 1973. PCA soil primer.
Price, W.A. and Gordon Gunter. 1943. Certain recent geological and biological changes in south Texas, with consideration of probable causes, Texas Acad. Sci. Proc. And Trans., 1942, v. 26, pp. 138-156.
Pulich, Jr., Warren. 1999. Chapter 1 – Introduction. In “Seagrass Conservation Plan for Texas”, Texas Parks and Wildlife Resource Division, http://www.tpwd.state.tx.us/publications/pwdpubs/media/pwd_bk_r0400_0041.pdf
Ruhe, Robert V. 1956. Geomorphic surfaces and the nature of soils. Soil Science 82: 441-455.
Simonson, Roy W. 1959. Outline of a generalized theory of soil genesis. Soil Science Society of America Proceedings 23: 152-156.
Smith, Elizabeth H., Thomas R. Calnan, and Susan A. Cox. 1997. Potential sites for wetland restoration, enhancement, and creation: Corpus Christi/Nueces Bay area. Corpus Christi Bay National Estuary Program, CCBNEP-15, July 1997, 183 p.
Soil Survey Division Staff. 1993. Soil survey manual. Soil Conservation Service. U.S. Department of Agriculture Handbook 18.
Soil Survey Staff. 2003. Keys to soil taxonomy. 9th edition. U.S. Department of Agriculture, Natural Resources Conservation Service.
Soil Survey Staff. 1999. Soil taxonomy: A basic system of soil classification for making and interpreting soil surveys. 2nd edition. Natural Resources Conservation Service. U.S. Department of Agriculture Handbook 436.
162 Soil Survey of
Southern Geological Society Ad Hoc Committee on Florida Hydrostratigraphic Unit Definition. 1986. Hydrogeological units of Florida. Florida Bureau of Geology Special Publication 28.
Stevenson, F.J. 1982. Humus chemistry: Genesis, composition, reactions.
Stutzenbaker, Charles D. 1999. Aquatic and wetland plants of the western gulf coast.
Thornbury, William D. 1969. Principles of geomorphology. 2nd edition.
Tiner, R.W., Jr. 1985. Wetlands of Delaware. U.S. Fish and Wildlife Service and Delaware Department of Natural Resources and Environmental Control, Wetlands Section.
Tunnell, J. W., F. W. Judd, et al. 2002. The Laguna Madre of Texas and Tamaulipas.
United States Army Corps of Engineers, Environmental Laboratory. 1987. Corps of Engineers wetlands delineation manual. Waterways Experiment Station Technical Report Y-87-1.
United States Department of Agriculture, Natural Resources Conservation Service. National range and pasture handbook. (http://www.glti.nrcs.usda.gov/technical/publications/nrph.html)
United States Department of Agriculture, Natural Resources Conservation Service. National soil survey handbook, title 430-VI. http://soils.usda.gov/technical/handbook/
United States Department of Agriculture, Natural Resources Conservation Service. 1996. Soil survey laboratory methods manual. Soil Survey Investigations Report 42.
United States Department of Agriculture, Soil Conservation Service. 1961. Land capability classification. U.S. Department of Agriculture Handbook 210.
United States Department of Agriculture, Soil Conservation Service. 1981. Land resource regions and major land resource areas of the United States. U.S. Department of Agriculture Handbook 296.
United States Department of Agriculture, Soil Conservation Service. 1987. Basic statistics, 1982 national resources inventory. Statistical Bulletin 756.
United States Department of the Interior, U.S. Geological Survey. 1998. Landcover classification for Padre Island National Seashore.
University of Texas, Bureau of Economic Geology. 1980. Environmental geologic atlas of the Texas coastal zone—Brownsville-Harlingen area.
University of Texas, Bureau of Economic Geology. 1976. Environmental geologic atlas of the Texas coastal zone—Corpus Christi area.
University of Texas, Bureau of Economic Geology. 1977. Environmental geologic atlas of the Texas coastal zone—Kingsville area.
University of Texas, Bureau of Economic Geology. 1975. Geologic atlas of Texas, Corpus Christi sheet.
Padre Island National Seashore, Texas 163
University of Texas, Bureau of Economic Geology. 1976. Geologic atlas of Texas, McAllen-Brownsville sheet.
van Andel, T.H. 1960. Sources and dispersion of Holocene sediments, northern Gulf of Mexico. In Recent sediments, northwest Gulf of Mexico, Shepard et al eds., AAPG, Tulsa, OK, pp. 34-55.
Watson, Richard L., 1968. Origin of shell beaches, Padre Island, Texas, Univ. of Texas thesis, 121 p.
Weise, Bonnie R. and William A. White. 1980. Padre Island National Seashore-A Guide to the Geology, Natural Environments, and History of a Texas Barrier Island. University of Texas, Bureau of Economic Geology.
White, William A. 1970. The geomorphology of the Florida peninsula. Florida Department of Natural Resources, Bureau of Geology Bulletin 51.

165
Glossary
Many of the terms relating to landforms, geology, and geomorphology are defined in more detail in the "National Soil Survey Handbook" (available in local offices of the Natural Resources Conservation Service or on the Internet).
ABC soil. A soil having an A, a B, and a C horizon. AC soil. A soil having only an A and a C horizon. Commonly, such soil formed in recent
alluvium or on steep, rocky slopes. Aeration, soil. The exchange of air in soil with air from the atmosphere. The air in a well
aerated soil is similar to that in the atmosphere; the air in a poorly aerated soil is considerably higher in carbon dioxide and lower in oxygen.
Aggregate, soil. Many fine particles held in a single mass or cluster. Natural soil aggregates, such as granules, blocks, or prisms, are called peds. Clods are aggregates produced by tillage or logging.
Alluvium. Material, such as sand, silt, or clay, deposited on land by streams. Alpha,alpha-dipyridyl. A dye that when dissolved in 1N ammonium acetate is used to
detect the presence of reduced iron (Fe II) in the soil. A positive reaction indicates a type of redoximorphic feature.
Animal unit month (AUM). The amount of forage required by one mature cow of approximately 1,000 pounds weight, with or without a calf, for 1 month.
Aquic conditions. Current soil wetness characterized by saturation, reduction, and redoximorphic features.
Area reclaim (in tables). An area difficult to reclaim after the removal of soil for construction and other uses. Revegetation and erosion control are extremely difficult.
Argillic horizon. A subsoil horizon characterized by an accumulation of illuvial clay. Aspect. The direction in which a slope faces. Association, soil. A group of soils or miscellaneous areas geographically associated in
a characteristic repeating pattern and defined and delineated as a single map unit. Available water capacity (available moisture capacity). The capacity of soils to hold
water available for use by most plants. It is commonly defined as the difference between the amount of soil water at field moisture capacity and the amount at wilting point. It is commonly expressed as inches of water per inch of soil. The capacity, in inches, in a 60-inch profile or to a limiting layer is expressed as:
Very low ....................................................0 to 3 Low ...........................................................3 to 6 Moderate ...................................................6 to 9 High.........................................................9 to 12 Very high .......................................more than 12
Back slope. The geomorphic component that forms the steepest inclined surface and principal element of many hillsides. Back slopes in profile are commonly steep, are linear, and may or may not include cliff segments.
Base saturation. The degree to which material having cation-exchange properties is saturated with exchangeable bases (sum of Ca, Mg, Na, and K), expressed as a percentage of the total cation-exchange capacity.
166 Soil Survey of
Bedding planes. Fine strata, less than 5 millimeters thick, in unconsolidated alluvial, eolian, lacustrine, or marine sediment.
Bedding system. A drainage system made by plowing, grading, or otherwise shaping the surface of a flat field. It consists of a series of low ridges separated by shallow, parallel dead furrows.
Bedrock. The solid rock that underlies the soil and other unconsolidated material or that is exposed at the surface.
Bedrock-controlled topography. A landscape where the configuration and relief of the landforms are determined or strongly influenced by the underlying bedrock.
Bottomland. The normal flood plain of a stream, subject to flooding. Boulders. Rock fragments larger than 2 feet (60 centimeters) in diameter. Brush management. Use of mechanical, chemical, or biological methods to make
conditions favorable for reseeding or to reduce or eliminate competition from woody vegetation and thus allow understory grasses and forbs to recover. Brush management increases forage production and thus reduces the hazard of erosion. It can improve the habitat for some species of wildlife.
Calcareous soil. A soil containing enough calcium carbonate (commonly combined with magnesium carbonate) to effervesce visibly when treated with cold, dilute hydrochloric acid.
Canopy. The leafy crown of trees or shrubs. (See Crown.) Capillary water. Water held as a film around soil particles and in tiny spaces between
particles. Surface tension is the adhesive force that holds capillary water in the soil. Catena. A sequence, or "chain," of soils on a landscape that formed in similar kinds of
parent material but have different characteristics as a result of differences in relief and drainage.
Cation. An ion carrying a positive charge of electricity. The common soil cations are calcium, potassium, magnesium, sodium, and hydrogen.
Cation-exchange capacity. The total amount of exchangeable cations that can be held by the soil, expressed in terms of milliequivalents per 100 grams of soil at neutrality (pH 7.0) or at some other stated pH value. The term, as applied to soils, is synonymous with base-exchange capacity but is more precise in meaning.
Chemical treatment. Control of unwanted vegetation through the use of chemicals. Chiseling. Tillage with an implement having one or more soil-penetrating points that
shatter or loosen hard, compacted layers to a depth below normal plow depth. Clay. As a soil separate, the mineral soil particles less than 0.002 millimeter in diameter.
As a soil textural class, soil material that is 40 percent or more clay, less than 45 percent sand, and less than 40 percent silt.
Clay depletions. Low-chroma zones having a low content of iron, manganese, and clay because of the chemical reduction of iron and manganese and the removal of iron, manganese, and clay. A type of redoximorphic depletion.
Clay film. A thin coating of oriented clay on the surface of a soil aggregate or lining pores or root channels. Synonyms: clay coating, clay skin.
Claypan. A slowly permeable soil horizon that contains much more clay than the horizons above it. A claypan is commonly hard when dry and plastic or stiff when wet.
Climax plant community. The stabilized plant community on a particular site. The plant cover reproduces itself and does not change so long as the environment remains the same.
Coarse textured soil. Sand or loamy sand. Cobble (or cobblestone). A rounded or partly rounded fragment of rock 3 to 10 inches
(7.6 to 25 centimeters) in diameter. Colluvium. Soil material or rock fragments, or both, moved by creep, slide, or local wash
and deposited at the base of steep slopes. Complex slope. Irregular or variable slope. Planning or establishing terraces, diversions,
and other water-control structures on a complex slope is difficult.
Padre Island National Seashore, Texas 167
Complex, soil. A map unit of two or more kinds of soil or miscellaneous areas in such an intricate pattern or so small in area that it is not practical to map them separately at the selected scale of mapping. The pattern and proportion of the soils or miscellaneous areas are somewhat similar in all areas.
Compressible (in tables). Excessive decrease in volume of soft soil under load. Concretions. Cemented bodies with crude internal symmetry organized around a point,
a line, or a plane. They typically take the form of concentric layers visible to the naked eye. Calcium carbonate, iron oxide, and manganese oxide are common compounds making up concretions. If formed in place, concretions of iron oxide or manganese oxide are generally considered a type of redoximorphic concentration.
Conservation cropping system. Growing crops in combination with needed cultural and management practices. In a good conservation cropping system, the soil-improving crops and practices more than offset the effects of the soil-depleting crops and practices. Cropping systems are needed on all tilled soils. Soil-improving practices in a conservation cropping system include the use of rotations that contain grasses and legumes and the return of crop residue to the soil. Other practices include the use of green manure crops of grasses and legumes, proper tillage, adequate fertilization, and weed and pest control.
Conservation tillage. A tillage system that does not invert the soil and that leaves a protective amount of crop residue on the surface throughout the year.
Consistence, soil. Refers to the degree of cohesion and adhesion of soil material and its resistance to deformation when ruptured. Consistence includes resistance of soil material to rupture and to penetration; plasticity, toughness, and stickiness of puddled soil material; and the manner in which the soil material behaves when subject to compression. Terms describing consistence are defined in the "Soil Survey Manual."
Contour stripcropping. Growing crops in strips that follow the contour. Strips of grass or close-growing crops are alternated with strips of clean-tilled crops or summer fallow.
Control section. The part of the soil on which classification is based. The thickness varies among different kinds of soil, but for many it is that part of the soil profile between depths of 10 inches and 40 or 80 inches.
Corrosion. Soil-induced electrochemical or chemical action that dissolves or weakens concrete or uncoated steel.
Cover crop. A close-growing crop grown primarily to improve and protect the soil between periods of regular crop production, or a crop grown between trees and vines in orchards and vineyards.
Cropping system. Growing crops according to a planned system of rotation and management practices.
Crop residue management. Returning crop residue to the soil, which helps to maintain soil structure, organic matter content, and fertility and helps to control erosion.
Cross-slope farming. Deliberately conducting farming operations on sloping farmland in such a way that tillage is across the general slope.
Cutbanks cave (in tables). The walls of excavations tend to cave in or slough. Deferred grazing. Postponing grazing or resting grazing land for a prescribed period. Delta. A body of alluvium having a surface that is nearly flat and fan shaped; deposited at
or near the mouth of a river or stream where it enters a body of relatively quiet water, generally a sea or lake.
Dense layer (in tables). A very firm, massive layer that has a bulk density of more than 1.8 grams per cubic centimeter. Such a layer affects the ease of digging and can affect filling and compacting.
Depth, soil. Generally, the thickness of the soil over bedrock. Very deep soils are more than 60 inches deep over bedrock; deep soils, 40 to 60 inches; moderately deep, 20 to 40 inches; shallow, 10 to 20 inches; and very shallow, less than 10 inches.
Depth to rock (in tables). Bedrock is too near the surface for the specified use.
168 Soil Survey of
Diversion (or diversion terrace). A ridge of earth, generally a terrace, built to protect downslope areas by diverting runoff from its natural course.
Drainage class (natural). Refers to the frequency and duration of wet periods under conditions similar to those under which the soil formed. Alterations of the water regime by human activities, either through drainage or irrigation, are not a consideration unless they have significantly changed the morphology of the soil. Seven classes of natural soil drainage are recognized—excessively drained, somewhat excessively drained, well drained, moderately well drained, somewhat poorly drained, poorly drained, and very poorly drained. These classes are defined in the "Soil Survey Manual."
Drainage, surface. Runoff, or surface flow of water, from an area. Ecological site. An area of rangeland where climate, soil, and relief are sufficiently
uniform to produce a distinct natural plant community. A range site is the product of all the environmental factors responsible for its development. It is typified by an association of species that differ from those on other range sites in kind or proportion of species or total production.
Eluviation. The movement of material in true solution or colloidal suspension from one place to another within the soil. Soil horizons that have lost material through eluviation are eluvial; those that have received material are illuvial.
Endosaturation. A type of saturation of the soil in which all horizons between the upper boundary of saturation and a depth of 2 meters are saturated.
Ephemeral stream. A stream, or reach of a stream, that flows only in direct response to precipitation. It receives no long-continued supply from melting snow or other source, and its channel is above the water table at all times.
Episaturation. A type of saturation indicating a perched water table in a soil in which saturated layers are underlain by one or more unsaturated layers within 2 meters of the surface.
Erosion. The wearing away of the land surface by water, wind, ice, or other geologic agents and by such processes as gravitational creep. Erosion (geologic). Erosion caused by geologic processes acting over long geologic
periods and resulting in the wearing away of mountains and the building up of such landscape features as flood plains and coastal plains. Synonym: natural erosion.
Erosion (accelerated). Erosion much more rapid than geologic erosion, mainly as a result of human or animal activities or of a catastrophe in nature, such as a fire, that exposes the surface.
Excess fines (in tables). Excess silt and clay in the soil. The soil does not provide a source of gravel or sand for construction purposes.
Fallow. Cropland left idle in order to restore productivity through accumulation of moisture. Summer fallow is common in regions of limited rainfall where cereal grain is grown. The soil is tilled for at least one growing season for weed control and decomposition of plant residue.
Fast intake (in tables). The rapid movement of water into the soil. Fertility, soil. The quality that enables a soil to provide plant nutrients, in adequate
amounts and in proper balance, for the growth of specified plants when light, moisture, temperature, tilth, and other growth factors are favorable.
Field moisture capacity. The moisture content of a soil, expressed as a percentage of the ovendry weight, after the gravitational, or free, water has drained away; the field moisture content 2 or 3 days after a soaking rain; also called normal field capacity, normal moisture capacity, or capillary capacity.
Fine textured soil. Sandy clay, silty clay, or clay. First bottom. The normal flood plain of a stream, subject to frequent or occasional
flooding.
Padre Island National Seashore, Texas 169
Flood plain. A nearly level alluvial plain that borders a stream and is subject to flooding unless protected artificially.
Fluvial. Of or pertaining to rivers; produced by river action, as a fluvial plain. Footslope. The inclined surface at the base of a hill. Forb. Any herbaceous plant not a grass or a sedge. Genesis, soil. The mode of origin of the soil. Refers especially to the processes or soil-
forming factors responsible for the formation of the solum, or true soil, from the unconsolidated parent material.
Gilgai. Commonly, a succession of microbasins and microknolls in nearly level areas or of microvalleys and microridges parallel with the slope. Typically, the microrelief of clayey soils that shrink and swell considerably with changes in moisture content. Microlows (microbasins). A generic microrelief term applied to slightly lower areas
relative to the adjacent ground surface (e.g., shallow depression); changes in relief range from several centimeters to several meters; cross-sectional profiles can be simple or complex and generally consist of subdued, concave, open or closed depressions with gently sloping sides.
Microhighs (microknolls). A generic microrelief term applied to slightly elevated areas relative to the adjacent ground surface; changes in relief range from several centimeters to several meters; cross-sectional profiles can be simple or complex and generally consist of gently rounded, convex tops with gently sloping sides.
Gleyed soil. Soil that formed under poor drainage, resulting in the reduction of iron and other elements in the profile and in gray colors.
Grassed waterway. A natural or constructed waterway, typically broad and shallow, seeded to grass as protection against erosion. Conducts surface water away from cropland.
Gravel. Rounded or angular fragments of rock as much as 3 inches (2 millimeters to 7.6 centimeters) in diameter. An individual piece is a pebble.
Gravelly soil material. Material that is 15 to 35 percent, by volume, rounded or angular rock fragments, not prominently flattened, as much as 3 inches (7.6 centimeters) in diameter.
Green manure crop (agronomy). A soil-improving crop grown to be plowed under in an early stage of maturity or soon after maturity.
Ground water. Water filling all the unblocked pores of the material below the water table. Gully. A miniature valley with steep sides cut by running water and through which water
ordinarily runs only after rainfall. The distinction between a gully and a rill is one of depth. A gully generally is an obstacle to farm machinery and is too deep to be obliterated by ordinary tillage; a rill is of lesser depth and can be smoothed over by ordinary tillage.
Hard bedrock. Bedrock that cannot be excavated except by blasting or by the use of special equipment that is not commonly used in construction.
Hardpan. A hardened or cemented soil horizon, or layer. The soil material is sandy, loamy, or clayey and is cemented by iron oxide, silica, calcium carbonate, or other substance.
High-residue crops. Such crops as small grain and corn used for grain. If properly managed, residue from these crops can be used to control erosion until the next crop in the rotation is established. These crops return large amounts of organic matter to the soil.
Horizon, soil. A layer of soil, approximately parallel to the surface, having distinct characteristics produced by soil-forming processes. In the identification of soil horizons, an uppercase letter represents the major horizons. Numbers or lowercase letters that follow represent subdivisions of the major horizons. An explanation of the subdivisions is given in the "Soil Survey Manual." The major horizons of mineral soil are as follows: O horizon.—An organic layer of fresh and decaying plant residue.
170 Soil Survey of
A horizon.—The mineral horizon at or near the surface in which an accumulation of humified organic matter is mixed with the mineral material. Also, a plowed surface horizon, most of which was originally part of a B horizon.
E horizon.—The mineral horizon in which the main feature is loss of silicate clay, iron, aluminum, or some combination of these.
B horizon.—The mineral horizon below an A, O, or E horizon. The B horizon is in part a layer of transition from the overlying horizon to the underlying C horizon. The B horizon also has distinctive characteristics, such as (1) accumulation of clay, sesquioxides, humus, or a combination of these; (2) prismatic or blocky structure; (3) redder or browner colors than those in the A horizon; or (4) a combination of these.
C horizon.—The mineral horizon or layer, excluding indurated bedrock, that is little affected by soil-forming processes and does not have the properties typical of the overlying soil material. The material of a C horizon may be either like or unlike that in which the solum formed. If the material is known to differ from that in the solum, an Arabic numeral, commonly a 2, precedes the letter C.
Cr horizon.—Soft, consolidated bedrock beneath the soil. R layer.—Consolidated bedrock beneath the soil. The bedrock commonly underlies a
C horizon, but it can be directly below an A or a B horizon. Humus. The well decomposed, more or less stable part of the organic matter in mineral
soils. Hydrologic soil groups. Refers to soils grouped according to their runoff potential. The
soil properties that influence this potential are those that affect the minimum rate of water infiltration on a bare soil during periods after prolonged wetting when the soil is not frozen. These properties are depth to a seasonal high water table, the infiltration rate and permeability after prolonged wetting, and depth to a very slowly permeable layer. The slope and the kind of plant cover are not considered but are separate factors in predicting runoff.
Illuviation. The movement of soil material from one horizon to another in the soil profile. Generally, material is removed from an upper horizon and deposited in a lower horizon.
Impervious soil. A soil through which water, air, or roots penetrate slowly or not at all. No soil is absolutely impervious to air and water all the time.
Infiltration. The downward entry of water into the immediate surface of soil or other material, as contrasted with percolation, which is movement of water through soil layers or material.
Infiltration capacity. The maximum rate at which water can infiltrate into a soil under a given set of conditions.
Infiltration rate. The rate at which water penetrates the surface of the soil at any given instant, usually expressed in inches per hour. The rate can be limited by the infiltration capacity of the soil or the rate at which water is applied at the surface.
Intake rate. The average rate of water entering the soil under irrigation. Most soils have a fast initial rate; the rate decreases with application time. Therefore, intake rate for design purposes is not a constant but is a variable depending on the net irrigation application. The rate of water intake, in inches per hour, is expressed as follows:
Less than 0.2.........................................very low 0.2 to 0.4 ...................................................... low 0.4 to 0.75 ..................................moderately low 0.75 to 1.25 .........................................moderate 1.25 to 1.75 ...............................moderately high 1.75 to 2.5 ...................................................high More than 2.5 ...................................... very high
Padre Island National Seashore, Texas 171
Intermittent stream. A stream, or reach of a stream, that flows for prolonged periods only when it receives ground-water discharge or long, continued contributions from melting snow or other surface and shallow subsurface sources.
Iron depletions. Low-chroma zones having a low content of iron and manganese oxide because of chemical reduction and removal, but having a clay content similar to that of the adjacent matrix. A type of redoximorphic depletion.
Irrigation. Application of water to soils to assist in production of crops. Methods of irrigation are: Controlled flooding.—water is released at intervals from closely spaced field ditches
and distributed uniformly over the field. Drip (or trickle).—Water is applied slowly and under low pressure to the surface of the
soil or into the soil through such applicators as emitters, porous tubing, or perforated pipe.
Furrow.—Water is applied in small ditches made by cultivation implements. Furrows are used for tree and row crops.
Sprinkler.—Water is sprayed over the soil surface through pipes or nozzles from a pressure system.
Knoll. A small, low, rounded hill rising above adjacent landforms. Large stones (in tables). Rock fragments 3 inches (7.6 centimeters) or more across.
Large stones adversely affect the specified use of the soil. Leaching. The removal of soluble material from soil or other material by percolating
water. Liquid limit. The moisture content at which the soil passes from a plastic to a liquid
state. Loam. Soil material that is 7 to 27 percent clay particles, 28 to 50 percent silt particles,
and less than 52 percent sand particles. Low-residue crops. Such crops as corn used for silage, peas, beans, and potatoes.
Residue from these crops is not adequate to control erosion until the next crop in the rotation is established. These crops return little organic matter to the soil.
Low strength. The soil is not strong enough to support loads. Masses. Concentrations of substances in the soil matrix that do not have a clearly
defined boundary with the surrounding soil material and cannot be removed as a discrete unit. Common compounds making up masses are calcium carbonate, gypsum or other soluble salts, iron oxide, and manganese oxide. Masses consisting of iron oxide or manganese oxide generally are considered a type of redoximorphic concentration.
Mechanical treatment. Use of mechanical equipment for seeding, brush management, and other management practices.
Medium textured soil. Very fine sandy loam, loam, silt loam, or silt. Mineral soil. Soil that is mainly mineral material and low in organic material. Its bulk
density is more than that of organic soil. Minimum tillage. Only the tillage essential to crop production and prevention of soil
damage. Miscellaneous area. An area that has little or no natural soil and supports little or no
vegetation. Moderately coarse textured soil. Coarse sandy loam, sandy loam, or fine sandy loam. Moderately fine textured soil. Clay loam, sandy clay loam, or silty clay loam. Mollic epipedon. A thick, dark, humus-rich surface horizon (or horizons) that has high
base saturation and pedogenic soil structure. It may include the upper part of the subsoil.
Morphology, soil. The physical makeup of the soil, including the texture, structure, porosity, consistence, color, and other physical, mineral, and biological properties of the various horizons, and the thickness and arrangement of those horizons in the soil profile.
172 Soil Survey of
Mottling, soil. Irregular spots of different colors that vary in number and size. Descriptive terms are as follows: abundance—few, common, and many; size—fine, medium, and coarse; and contrast—faint, distinct, and prominent. The size measurements are of the diameter along the greatest dimension. Fine indicates less than 5 millimeters (about 0.2 inch); medium, from 5 to 15 millimeters (about 0.2 to 0.6 inch); and coarse, more than 15 millimeters (about 0.6 inch).
Mudstone. Sedimentary rock formed by induration of silt and clay in approximately equal amounts.
Munsell notation. A designation of color by degrees of three simple variables—hue, value, and chroma. For example, a notation of 10YR 6/4 is a color with hue of 10YR, value of 6, and chroma of 4.
Neutral soil. A soil having a pH value of 6.6 to 7.3. (See Reaction, soil.) Nodules. Cemented bodies lacking visible internal structure. Calcium carbonate, iron
oxide, and manganese oxide are common compounds making up nodules. If formed in place, nodules of iron oxide or manganese oxide are considered types of redoximorphic concentrations.
Nutrient, plant. Any element taken in by a plant essential to its growth. Plant nutrients are mainly nitrogen, phosphorus, potassium, calcium, magnesium, sulfur, iron, manganese, copper, boron, and zinc obtained from the soil and carbon, hydrogen, and oxygen obtained from the air and water.
Organic matter. Plant and animal residue in the soil in various stages of decomposition. The content of organic matter in the surface layer is described as follows:
Very low ............................ less than 0.5 percent Low ........................................ 0.5 to 1.0 percent Moderately low ....................... 1.0 to 2.0 percent Moderate ................................ 2.0 to 4.0 percent High........................................ 4.0 to 8.0 percent Very high ......................... more than 8.0 percent
Pan. A compact, dense layer in a soil that impedes the movement of water and the growth of roots. For example, hardpan, fragipan, claypan, plowpan, and traffic pan.
Parent material. The unconsolidated organic and mineral material in which soil forms. Ped. An individual natural soil aggregate, such as a granule, a prism, or a block. Pedon. The smallest volume that can be called "a soil." A pedon is three dimensional
and large enough to permit study of all horizons. Its area ranges from about 10 to 100 square feet (1 square meter to 10 square meters), depending on the variability of the soil.
Percolation. The downward movement of water through the soil. Percs slowly (in tables). The slow movement of water through the soil adversely affects
the specified use. Permeability. The quality of the soil that enables water or air to move downward through
the profile. The rate at which a saturated soil transmits water is accepted as a measure of this quality. In soil physics, the rate is referred to as "saturated hydraulic conductivity," which is defined in the "Soil Survey Manual." In line with conventional usage in the engineering profession and with traditional usage in published soil surveys, this rate of flow continues to be expressed as "permeability." Terms describing permeability, measured in inches per hour, are as follows:
Very slow................................ less than .06 inch Slow .......................................... 0.06 to 0.2 inch Moderately slow........................... 0.2 to 0.6 inch Moderate .......................... 0.6 inch to 2.0 inches Moderately rapid.......................2.0 to 6.0 inches Rapid.........................................6.0 to 20 inches Very rapid...........................more than 20 inches
Padre Island National Seashore, Texas 173
Phase, soil. A subdivision of a soil series based on features that affect its use and management, such as slope, stoniness, and flooding.
pH value. A numerical designation of acidity and alkalinity in soil. (See Reaction, soil.) Piping (in tables). Formation of subsurface tunnels or pipelike cavities by water moving
through the soil. Plasticity index. The numerical difference between the liquid limit and the plastic limit;
the range of moisture content within which the soil remains plastic. Plastic limit. The moisture content at which a soil changes from semisolid to plastic. Pleistocene. The epoch of the Quaternary Period of geologic time, following the Pliocene
Epoch and preceding the Holocene (from about 2 million to 10 thousand years ago); also the corresponding (time-stratigraphic) “series” of earth materials.
Plowpan. A compacted layer formed in the soil directly below the plowed layer. Ponding. Standing water on soils in closed depressions. Unless the soils are artificially
drained, the water can be removed only by percolation or evapotranspiration. Poor filter (in tables). Because of rapid or very rapid permeability, the soil may not
adequately filter effluent from a waste disposal system. Poorly graded. Refers to a coarse grained soil or soil material consisting mainly of
particles of nearly the same size. Because there is little difference in size of the particles, density can be increased only slightly by compaction.
Potential native plant community. See Climax plant community. Potential rooting depth (effective rooting depth). Depth to which roots could penetrate
if the content of moisture in the soil were adequate. The soil has no properties restricting the penetration of roots to this depth.
Prescribed burning. Deliberately burning an area for specific management purposes, under the appropriate conditions of weather and soil moisture and at the proper time of day.
Productivity, soil. The capability of a soil for producing a specified plant or sequence of plants under specific management.
Profile, soil. A vertical section of the soil extending through all its horizons and into the parent material.
Proper grazing use. Grazing at an intensity that maintains enough cover to protect the soil and maintain or improve the quantity and quality of the desirable vegetation. This practice increases the vigor and reproduction capacity of the key plants and promotes the accumulation of litter and mulch necessary to conserve soil and water.
Range condition. The present composition of the plant community on a range site in relation to the potential natural plant community for that site. Range condition is expressed as excellent, good, fair, or poor on the basis of how much the present plant community has departed from the potential.
Rangeland. Land on which the potential natural vegetation is predominantly grasses, grasslike plants, forbs, or shrubs suitable for grazing or browsing. It includes natural grasslands, savannas, many wetlands, some deserts, tundras, and areas that support certain forb and shrub communities.
Reaction, soil. A measure of acidity or alkalinity of a soil, expressed in pH values. A soil that tests to pH 7.0 is described as precisely neutral in reaction because it is neither acid nor alkaline. The degrees of acidity or alkalinity, expressed as pH values, are:
Ultra acid ........................................less than 3.5 Extremely acid .....................................3.5 to 4.4 Very strongly acid ................................4.5 to 5.0 Strongly acid........................................5.1 to 5.5 Moderately acid ...................................5.6 to 6.0 Slightly acid .........................................6.1 to 6.5 Neutral.................................................6.6 to 7.3 Slightly alkaline....................................7.4 to 7.8 Moderately alkaline..............................7.9 to 8.4
174 Soil Survey of
Strongly alkaline ..................................8.5 to 9.0 Very strongly alkaline................... 9.1 and higher
Redoximorphic concentrations. Nodules, concretions, soft masses, pore linings, and other features resulting from the accumulation of iron or manganese oxide. An indication of chemical reduction and oxidation resulting from saturation.
Redoximorphic depletions. Low-chroma zones from which iron and manganese oxide or a combination of iron and manganese oxide and clay has been removed. These zones are indications of the chemical reduction of iron resulting from saturation.
Redoximorphic features. Redoximorphic concentrations, redoximorphic depletions, reduced matrices, a positive reaction to alpha,alpha-dipyridyl, and other features indicating the chemical reduction and oxidation of iron and manganese compounds resulting from saturation.
Reduced matrix. A soil matrix that has low chroma in situ because of chemically reduced iron (Fe II). The chemical reduction results from nearly continuous wetness. The matrix undergoes a change in hue or chroma within 30 minutes after exposure to air as the iron is oxidized (Fe III). A type of redoximorphic feature.
Relief. The elevations or inequalities of a land surface, considered collectively. Residuum (residual soil material). Unconsolidated, weathered or partly weathered
mineral material that accumulated as consolidated rock disintegrated in place. Rill. A steep-sided channel resulting from accelerated erosion. A rill generally is a few
inches deep and not wide enough to be an obstacle to farm machinery. Road cut. A sloping surface produced by mechanical means during road construction. It
is commonly on the uphill side of the road. Rock fragments. Rock or mineral fragments having a diameter of 2 millimeters or more;
for example, pebbles, cobbles, stones, and boulders. Rooting depth (in tables). Shallow root zone. The soil is shallow over a layer that greatly
restricts roots. Root zone. The part of the soil that can be penetrated by plant roots. Runoff. The precipitation discharged into stream channels from an area. The water that
flows off the surface of the land without sinking into the soil is called surface runoff. Water that enters the soil before reaching surface streams is called ground-water runoff or seepage flow from ground water.
Sand. As a soil separate, individual rock or mineral fragments from 0.05 millimeter to 2.0 millimeters in diameter. Most sand grains consist of quartz. As a soil textural class, a soil that is 85 percent or more sand and not more than 10 percent clay.
Sandstone. Sedimentary rock containing dominantly sand-sized particles. Saturation. Wetness characterized by zero or positive pressure of the soil water. Under
conditions of saturation, the water will flow from the soil matrix into an unlined auger hole.
Second bottom. The first terrace above the normal flood plain (or first bottom) of a river. Sedimentary rock. Rock made up of particles deposited from suspension in water. The
chief kinds of sedimentary rock are conglomerate, formed from gravel; sandstone, formed from sand; shale, formed from clay; and limestone, formed from soft masses of calcium carbonate. There are many intermediate types. Some wind-deposited sand is consolidated into sandstone.
Seepage (in tables). The movement of water through the soil. Seepage adversely affects the specified use.
Sequum. A sequence consisting of an illuvial horizon and the overlying eluvial horizon. (See Eluviation.)
Series, soil. A group of soils that have profiles that are almost alike, except for differences in texture of the surface layer. All the soils of a series have horizons that are similar in composition, thickness, and arrangement.
Shale. Sedimentary rock formed by induration of a clay, silty clay, or silty clay loam deposit and having the tendency to split into thin layers.
Padre Island National Seashore, Texas 175
Sheet erosion. The removal of a fairly uniform layer of soil material from the land surface by the action of rainfall and surface runoff.
Shrink-swell (in tables). The shrinking of soil when dry and the swelling when wet. Shrinking and swelling can damage roads, dams, building foundations, and other structures. It can also damage plant roots.
Silica. A combination of silicon and oxygen. The mineral form is called quartz. Silt. As a soil separate, individual mineral particles that range in diameter from the upper
limit of clay (0.002 millimeter) to the lower limit of very fine sand (0.05 millimeter). As a soil textural class, soil that is 80 percent or more silt and less than 12 percent clay.
Siltstone. Sedimentary rock made up of dominantly silt-sized particles. Similar soils. Soils that share limits of diagnostic criteria, behave and perform in a
similar manner, and have similar conservation needs or management requirements for the major land uses in the survey area.
Slickensides. Polished and grooved surfaces produced by one mass sliding past another. In soils, slickensides may occur at the bases of slip surfaces on the steeper slopes; on faces of blocks, prisms, and columns; and in swelling clayey soils, where there is marked change in moisture content.
Slippage (in tables). Soil mass susceptible to movement downslope when loaded, excavated, or wet.
Slope. The inclination of the land surface from the horizontal. Percentage of slope is the vertical distance divided by horizontal distance, then multiplied by 100. Thus, a slope of 20 percent is a drop of 20 feet in 100 feet of horizontal distance. In this survey, classes for simple slopes are as follows:
Nearly level................................... 0 to 1 percent Very gently sloping ....................... 1 to 3 percent Gently sloping............................... 3 to 5 percent Moderately sloping........................ 5 to 8 percent Strongly sloping .......................... 8 to 12 percent Moderately steep ...................... 12 to 20 percent Steep........................................ 20 to 45 percent Very steep ....................... 45 percent and higher
Slope (in tables). Slope is great enough that special practices are required to ensure satisfactory performance of the soil for a specific use.
Slow intake (in tables). The slow movement of water into the soil. Slow refill (in tables). The slow filling of ponds, resulting from restricted permeability in
the soil. Small stones (in tables). Rock fragments less than 3 inches (7.6 centimeters) in
diameter. Small stones adversely affect the specified use of the soil. Soft bedrock. Bedrock that can be excavated with trenching machines, backhoes, small
rippers, and other equipment commonly used in construction. Soil. A natural, three-dimensional body at the earth's surface. It is capable of supporting
plants and has properties resulting from the integrated effect of climate and living matter acting on earthy parent material, as conditioned by relief over periods of time.
Soil separates. Mineral particles less than 2 millimeters in equivalent diameter and ranging between specified size limits. The names and sizes, in millimeters, of separates recognized in the United States are as follows:
Very coarse sand ....................2.0 to 1.0 Coarse sand............................1.0 to 0.5 Medium sand ........................0.5 to 0.25 Fine sand ............................0.25 to 0.10 Very fine sand .....................0.10 to 0.05 Silt .................................... 0.05 to 0.002 Clay ............................... less than 0.002
176 Soil Survey of
Solum. The upper part of a soil profile, above the C horizon, in which the processes of soil formation are active. The solum in soil consists of the A, E, and B horizons. Generally, the characteristics of the material in these horizons are unlike those of the material below the solum. The living roots and plant and animal activities are largely confined to the solum.
Stones. Rock fragments 10 to 24 inches (25 to 60 centimeters) in diameter if rounded or 15 to 24 inches (38 to 60 centimeters) in length if flat.
Stony. Refers to a soil containing stones in numbers that interfere with or prevent tillage. Stripcropping. Growing crops in a systematic arrangement of strips or bands that
provide vegetative barriers to wind erosion and water erosion. Structure, soil. The arrangement of primary soil particles into compound particles or
aggregates. The principal forms of soil structure are—platy (laminated), prismatic (vertical axis of aggregates longer than horizontal), columnar (prisms with rounded tops), blocky (angular or subangular), and granular. Structureless soils are either single grained (each grain by itself, as in dune sand) or massive (the particles adhering without any regular cleavage, as in many hardpans).
Stubble mulch. Stubble or other crop residue left on the soil or partly worked into the soil. It protects the soil from wind erosion and water erosion after harvest, during preparation of a seedbed for the next crop, and during the early growing period of the new crop.
Subsoil. Technically, the B horizon; roughly, the part of the solum below plow depth. Subsoiling. Tilling a soil below normal plow depth, ordinarily to shatter a hardpan or
claypan. Subsurface layer. Any surface soil horizon (A, E, AB, or EB) below the surface layer. Summer fallow. The tillage of uncropped land during the summer to control weeds and
allow storage of moisture in the soil for the growth of a later crop. A practice common in semiarid regions, where annual precipitation is not enough to produce a crop every year. Summer fallow is frequently practiced before planting winter grain.
Surface layer. The soil ordinarily moved in tillage, or its equivalent in uncultivated soil, ranging in depth from 4 to 10 inches (10 to 25 centimeters). Frequently designated as the "plow layer," or the "Ap horizon."
Surface soil. The A, E, AB, and EB horizons, considered collectively. It includes all subdivisions of these horizons.
Taxadjuncts. Soils that cannot be classified in a series recognized in the classification system. Such soils are named for a series they strongly resemble and are designated as taxadjuncts to that series because they differ in ways too small to be of consequence in interpreting their use and behavior. Soils are recognized as taxadjuncts only when one or more of their characteristics are slightly outside the range defined for the family of the series for which the soils are named.
Terrace. An embankment, or ridge, constructed across sloping soils on the contour or at a slight angle to the contour. The terrace intercepts surface runoff so that water soaks into the soil or flows slowly to a prepared outlet. A terrace in a field generally is built so that the field can be farmed. A terrace intended mainly for drainage has a deep channel that is maintained in permanent sod.
Terrace (geologic). An old alluvial plain, ordinarily flat or undulating, bordering a river, a lake, or the sea.
Texture, soil. The relative proportions of sand, silt, and clay particles in a mass of soil. The basic textural classes, in order of increasing proportion of fine particles, are sand, loamy sand, sandy loam, loam, silt loam, silt, sandy clay loam, clay loam, silty clay loam, sandy clay, silty clay, and clay. The sand, loamy sand, and sandy loam classes may be further divided by specifying "coarse," "fine," or "very fine."
Thin layer (in tables). Otherwise suitable soil material that is too thin for the specified use.
Padre Island National Seashore, Texas 177
Tilth, soil. The physical condition of the soil as related to tillage, seedbed preparation, seedling emergence, and root penetration.
Toe slope. The outermost inclined surface at the base of a hill; part of a footslope. Topsoil. The upper part of the soil, which is the most favorable material for plant growth.
It is ordinarily rich in organic matter and is used to topdress roadbanks, lawns, and land affected by mining.
Toxicity (in tables). Excessive amount of toxic substances, such as sodium or sulfur, that severely hinder establishment of vegetation or severely restrict plant growth.
Trace elements. Chemical elements, for example, zinc, cobalt, manganese, copper, and iron, in soils in extremely small amounts. They are essential to plant growth.
Tuff. A compacted deposit that is 50 percent or more volcanic ash and dust. Underlying material. The part of the soil below the solum. Unstable fill (in tables). Risk of caving or sloughing on banks of fill material. Upland. Land at a higher elevation, in general, than the alluvial plain or stream terrace;
land above the lowlands along streams. Valley fill. In glaciated regions, material deposited in stream valleys by glacial meltwater.
In nonglaciated regions, alluvium deposited by heavily loaded streams. Variegation. Refers to patterns of contrasting colors assumed to be inherited from the
parent material rather than to be the result of poor drainage. Weathering. All physical and chemical changes produced in rocks or other deposits at or
near the earth's surface by atmospheric agents. These changes result in disintegration and decomposition of the material.
Well graded. Refers to soil material consisting of coarse grained particles that are well distributed over a wide range in size or diameter. Such soil normally can be easily increased in density and bearing properties by compaction. Contrasts with poorly graded soil.
Wilting point (or permanent wilting point). The moisture content of soil, on an ovendry basis, at which a plant (specifically a sunflower) wilts so much that it does not recover when placed in a humid, dark chamber.


179
Tables
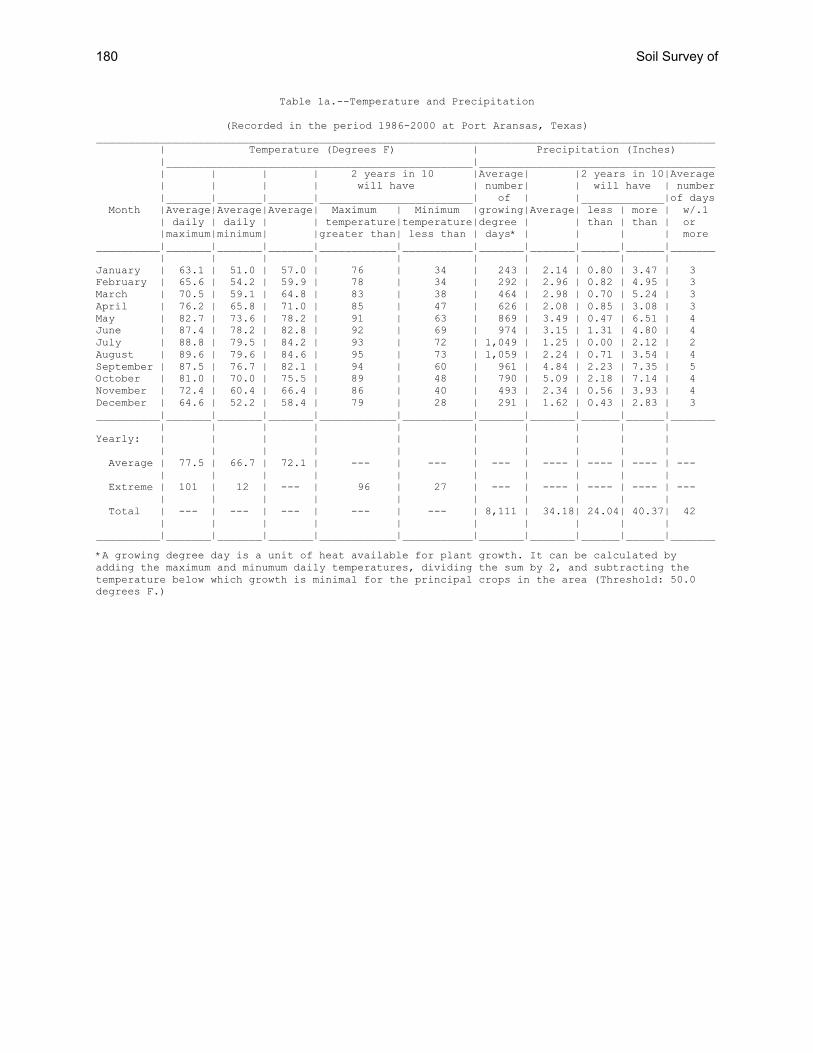
Table 1a.--Temperature and Precipitation
(Recorded in the period 1986-2000 at Port Aransas, Texas) _________________________________________________________________________________________________ | Temperature (Degrees F) | Precipitation (Inches) |________________________________________________|_____________________________________ | | | | 2 years in 10 |Average| |2 years in 10|Average | | | | will have | number| | will have | number |_______|_______|_______|________________________| of | |_____________|of days Month |Average|Average|Average| Maximum | Minimum |growing|Average| less | more | w/.1 | daily | daily | | temperature|temperature|degree | | than | than | or |maximum|minimum| |greater than| less than | days* | | | | more __________|_______|_______|_______|____________|___________|_______|_______|______|______|_______ | | | | | | | | | | January | 63.1 | 51.0 | 57.0 | 76 | 34 | 243 | 2.14 | 0.80 | 3.47 | 3 February | 65.6 | 54.2 | 59.9 | 78 | 34 | 292 | 2.96 | 0.82 | 4.95 | 3 March | 70.5 | 59.1 | 64.8 | 83 | 38 | 464 | 2.98 | 0.70 | 5.24 | 3 April | 76.2 | 65.8 | 71.0 | 85 | 47 | 626 | 2.08 | 0.85 | 3.08 | 3 May | 82.7 | 73.6 | 78.2 | 91 | 63 | 869 | 3.49 | 0.47 | 6.51 | 4 June | 87.4 | 78.2 | 82.8 | 92 | 69 | 974 | 3.15 | 1.31 | 4.80 | 4 July | 88.8 | 79.5 | 84.2 | 93 | 72 | 1,049 | 1.25 | 0.00 | 2.12 | 2 August | 89.6 | 79.6 | 84.6 | 95 | 73 | 1,059 | 2.24 | 0.71 | 3.54 | 4 September | 87.5 | 76.7 | 82.1 | 94 | 60 | 961 | 4.84 | 2.23 | 7.35 | 5 October | 81.0 | 70.0 | 75.5 | 89 | 48 | 790 | 5.09 | 2.18 | 7.14 | 4 November | 72.4 | 60.4 | 66.4 | 86 | 40 | 493 | 2.34 | 0.56 | 3.93 | 4 December | 64.6 | 52.2 | 58.4 | 79 | 28 | 291 | 1.62 | 0.43 | 2.83 | 3 __________|_______|_______|_______|____________|___________|_______|_______|______|______|_______ | | | | | | | | | | Yearly: | | | | | | | | | | | | | | | | | | | | Average | 77.5 | 66.7 | 72.1 | --- | --- | --- | ---- | ---- | ---- | --- | | | | | | | | | | Extreme | 101 | 12 | --- | 96 | 27 | --- | ---- | ---- | ---- | --- | | | | | | | | | | Total | --- | --- | --- | --- | --- | 8,111 | 34.18| 24.04| 40.37| 42 | | | | | | | | | | __________|_______|_______|_______|____________|___________|_______|_______|______|______|_______
*A growing degree day is a unit of heat available for plant growth. It can be calculated by adding the maximum and minumum daily temperatures, dividing the sum by 2, and subtracting the temperature below which growth is minimal for the principal crops in the area (Threshold: 50.0 degrees F.)
180 Soil Survey of
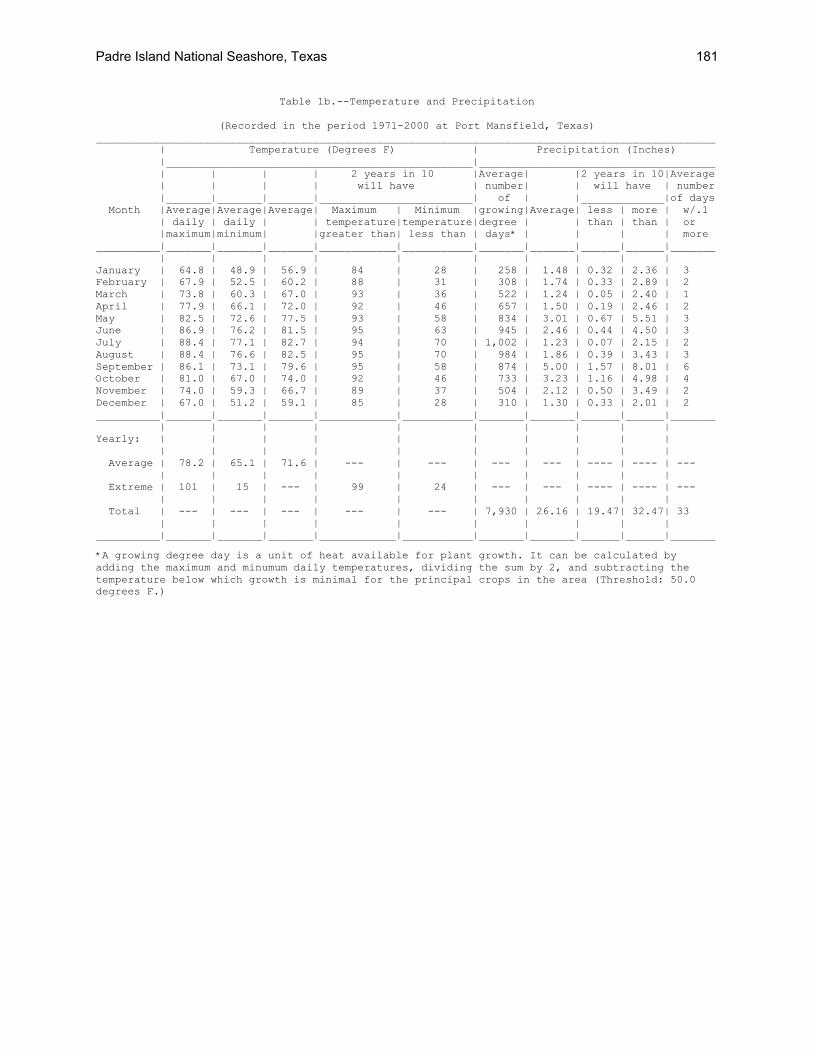
Table 1b.--Temperature and Precipitation
(Recorded in the period 1971-2000 at Port Mansfield, Texas) _________________________________________________________________________________________________ | Temperature (Degrees F) | Precipitation (Inches) |________________________________________________|_____________________________________ | | | | 2 years in 10 |Average| |2 years in 10|Average | | | | will have | number| | will have | number |_______|_______|_______|________________________| of | |_____________|of days Month |Average|Average|Average| Maximum | Minimum |growing|Average| less | more | w/.1 | daily | daily | | temperature|temperature|degree | | than | than | or |maximum|minimum| |greater than| less than | days* | | | | more __________|_______|_______|_______|____________|___________|_______|_______|______|______|_______ | | | | | | | | | | January | 64.8 | 48.9 | 56.9 | 84 | 28 | 258 | 1.48 | 0.32 | 2.36 | 3 February | 67.9 | 52.5 | 60.2 | 88 | 31 | 308 | 1.74 | 0.33 | 2.89 | 2 March | 73.8 | 60.3 | 67.0 | 93 | 36 | 522 | 1.24 | 0.05 | 2.40 | 1 April | 77.9 | 66.1 | 72.0 | 92 | 46 | 657 | 1.50 | 0.19 | 2.46 | 2 May | 82.5 | 72.6 | 77.5 | 93 | 58 | 834 | 3.01 | 0.67 | 5.51 | 3 June | 86.9 | 76.2 | 81.5 | 95 | 63 | 945 | 2.46 | 0.44 | 4.50 | 3 July | 88.4 | 77.1 | 82.7 | 94 | 70 | 1,002 | 1.23 | 0.07 | 2.15 | 2 August | 88.4 | 76.6 | 82.5 | 95 | 70 | 984 | 1.86 | 0.39 | 3.43 | 3 September | 86.1 | 73.1 | 79.6 | 95 | 58 | 874 | 5.00 | 1.57 | 8.01 | 6 October | 81.0 | 67.0 | 74.0 | 92 | 46 | 733 | 3.23 | 1.16 | 4.98 | 4 November | 74.0 | 59.3 | 66.7 | 89 | 37 | 504 | 2.12 | 0.50 | 3.49 | 2 December | 67.0 | 51.2 | 59.1 | 85 | 28 | 310 | 1.30 | 0.33 | 2.01 | 2 __________|_______|_______|_______|____________|___________|_______|_______|______|______|_______ | | | | | | | | | | Yearly: | | | | | | | | | | | | | | | | | | | | Average | 78.2 | 65.1 | 71.6 | --- | --- | --- | --- | ---- | ---- | --- | | | | | | | | | | Extreme | 101 | 15 | --- | 99 | 24 | --- | --- | ---- | ---- | --- | | | | | | | | | | Total | --- | --- | --- | --- | --- | 7,930 | 26.16 | 19.47| 32.47| 33 | | | | | | | | | | __________|_______|_______|_______|____________|___________|_______|_______|______|______|_______
*A growing degree day is a unit of heat available for plant growth. It can be calculated by adding the maximum and minumum daily temperatures, dividing the sum by 2, and subtracting the temperature below which growth is minimal for the principal crops in the area (Threshold: 50.0 degrees F.)
Padre Island National Seashore, Texas 181
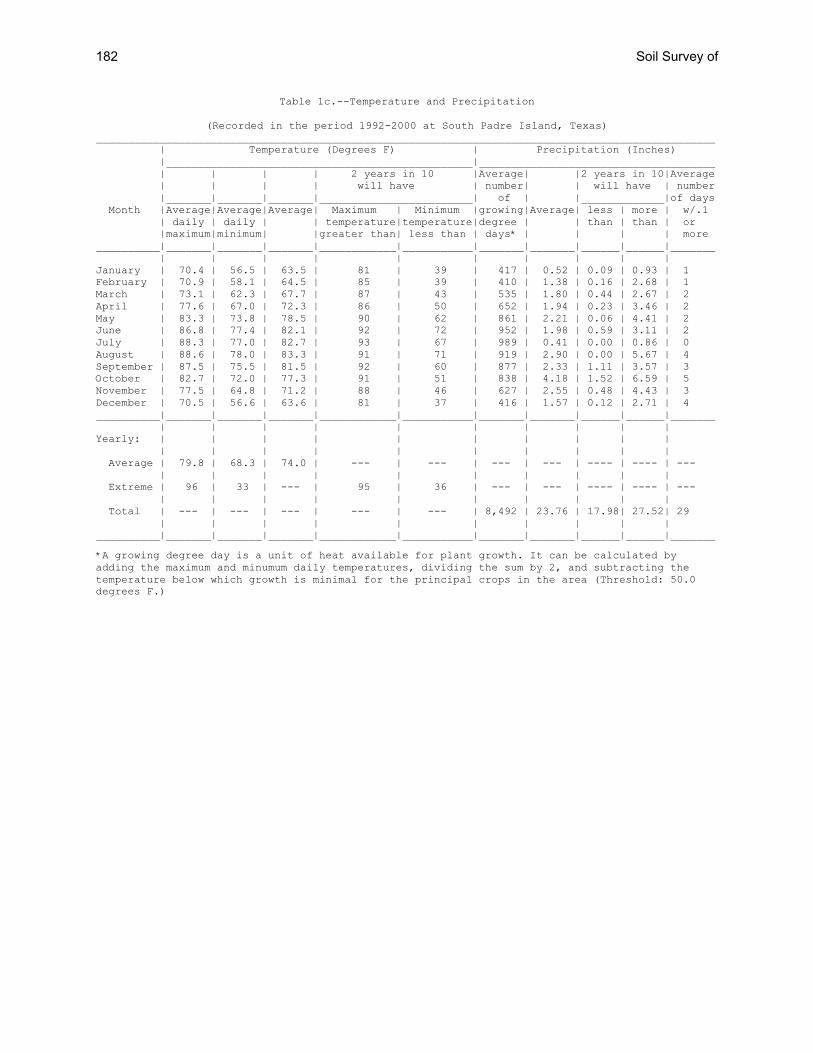
Table 1c.--Temperature and Precipitation
(Recorded in the period 1992-2000 at South Padre Island, Texas) _________________________________________________________________________________________________ | Temperature (Degrees F) | Precipitation (Inches) |________________________________________________|_____________________________________ | | | | 2 years in 10 |Average| |2 years in 10|Average | | | | will have | number| | will have | number |_______|_______|_______|________________________| of | |_____________|of days Month |Average|Average|Average| Maximum | Minimum |growing|Average| less | more | w/.1 | daily | daily | | temperature|temperature|degree | | than | than | or |maximum|minimum| |greater than| less than | days* | | | | more __________|_______|_______|_______|____________|___________|_______|_______|______|______|_______ | | | | | | | | | | January | 70.4 | 56.5 | 63.5 | 81 | 39 | 417 | 0.52 | 0.09 | 0.93 | 1 February | 70.9 | 58.1 | 64.5 | 85 | 39 | 410 | 1.38 | 0.16 | 2.68 | 1 March | 73.1 | 62.3 | 67.7 | 87 | 43 | 535 | 1.80 | 0.44 | 2.67 | 2 April | 77.6 | 67.0 | 72.3 | 86 | 50 | 652 | 1.94 | 0.23 | 3.46 | 2 May | 83.3 | 73.8 | 78.5 | 90 | 62 | 861 | 2.21 | 0.06 | 4.41 | 2 June | 86.8 | 77.4 | 82.1 | 92 | 72 | 952 | 1.98 | 0.59 | 3.11 | 2 July | 88.3 | 77.0 | 82.7 | 93 | 67 | 989 | 0.41 | 0.00 | 0.86 | 0 August | 88.6 | 78.0 | 83.3 | 91 | 71 | 919 | 2.90 | 0.00 | 5.67 | 4 September | 87.5 | 75.5 | 81.5 | 92 | 60 | 877 | 2.33 | 1.11 | 3.57 | 3 October | 82.7 | 72.0 | 77.3 | 91 | 51 | 838 | 4.18 | 1.52 | 6.59 | 5 November | 77.5 | 64.8 | 71.2 | 88 | 46 | 627 | 2.55 | 0.48 | 4.43 | 3 December | 70.5 | 56.6 | 63.6 | 81 | 37 | 416 | 1.57 | 0.12 | 2.71 | 4 __________|_______|_______|_______|____________|___________|_______|_______|______|______|_______ | | | | | | | | | | Yearly: | | | | | | | | | | | | | | | | | | | | Average | 79.8 | 68.3 | 74.0 | --- | --- | --- | --- | ---- | ---- | --- | | | | | | | | | | Extreme | 96 | 33 | --- | 95 | 36 | --- | --- | ---- | ---- | --- | | | | | | | | | | Total | --- | --- | --- | --- | --- | 8,492 | 23.76 | 17.98| 27.52| 29 | | | | | | | | | | __________|_______|_______|_______|____________|___________|_______|_______|______|______|_______
*A growing degree day is a unit of heat available for plant growth. It can be calculated by adding the maximum and minumum daily temperatures, dividing the sum by 2, and subtracting the temperature below which growth is minimal for the principal crops in the area (Threshold: 50.0 degrees F.)
182 Soil Survey of
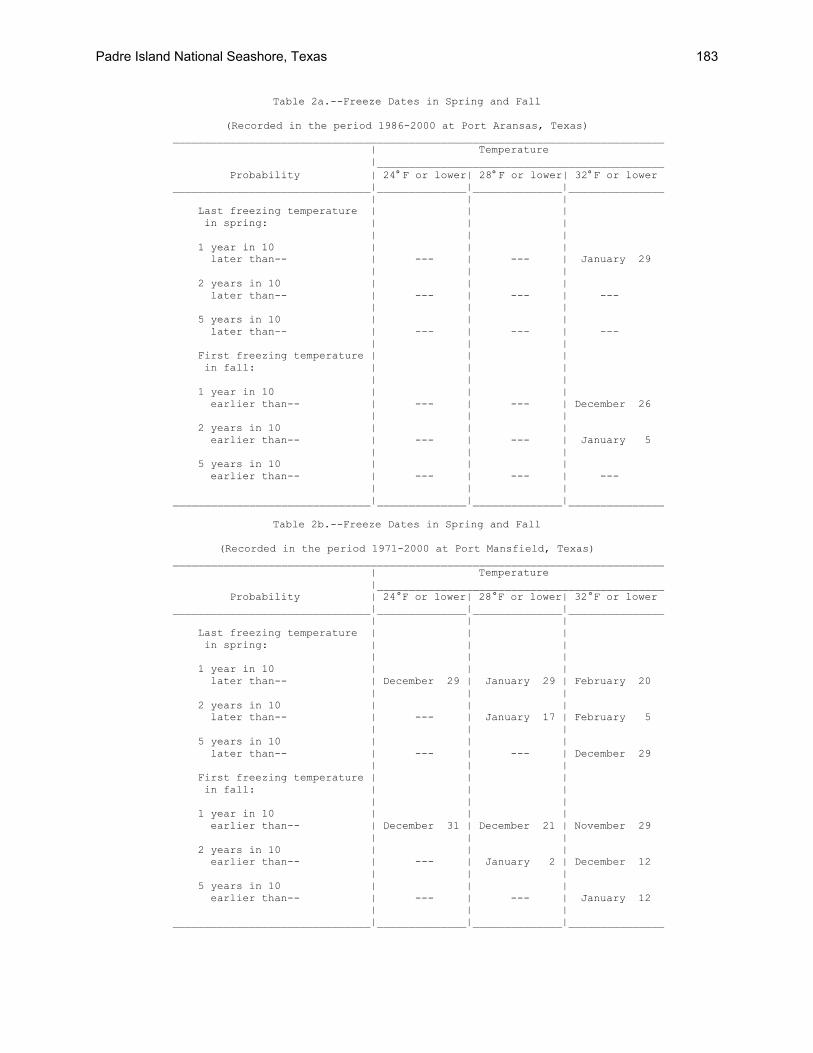
Table 2a.--Freeze Dates in Spring and Fall
(Recorded in the period 1986-2000 at Port Aransas, Texas) _____________________________________________________________________________ | Temperature |_____________________________________________ Probability | 24° F or lower| 28° F or lower| 32°F or lower _______________________________|______________|______________|_______________ | | | Last freezing temperature | | | in spring: | | | | | | 1 year in 10 | | | later than-- | --- | --- | January 29 | | | 2 years in 10 | | | later than-- | --- | --- | --- | | | 5 years in 10 | | | later than-- | --- | --- | --- | | | First freezing temperature | | | in fall: | | | | | | 1 year in 10 | | | earlier than-- | --- | --- | December 26 | | | 2 years in 10 | | | earlier than-- | --- | --- | January 5 | | | 5 years in 10 | | | earlier than-- | --- | --- | --- | | | _______________________________|______________|______________|_______________
Table 2b.--Freeze Dates in Spring and Fall
(Recorded in the period 1971-2000 at Port Mansfield, Texas) _____________________________________________________________________________ | Temperature |_____________________________________________ Probability | 24°F or lower| 28°F or lower| 32°F or lower _______________________________|______________|______________|_______________ | | | Last freezing temperature | | | in spring: | | | | | | 1 year in 10 | | | later than-- | December 29 | January 29 | February 20 | | | 2 years in 10 | | | later than-- | --- | January 17 | February 5 | | | 5 years in 10 | | | later than-- | --- | --- | December 29 | | | First freezing temperature | | | in fall: | | | | | | 1 year in 10 | | | earlier than-- | December 31 | December 21 | November 29 | | | 2 years in 10 | | | earlier than-- | --- | January 2 | December 12 | | | 5 years in 10 | | | earlier than-- | --- | --- | January 12 | | | _______________________________|______________|______________|_______________
Padre Island National Seashore, Texas 183
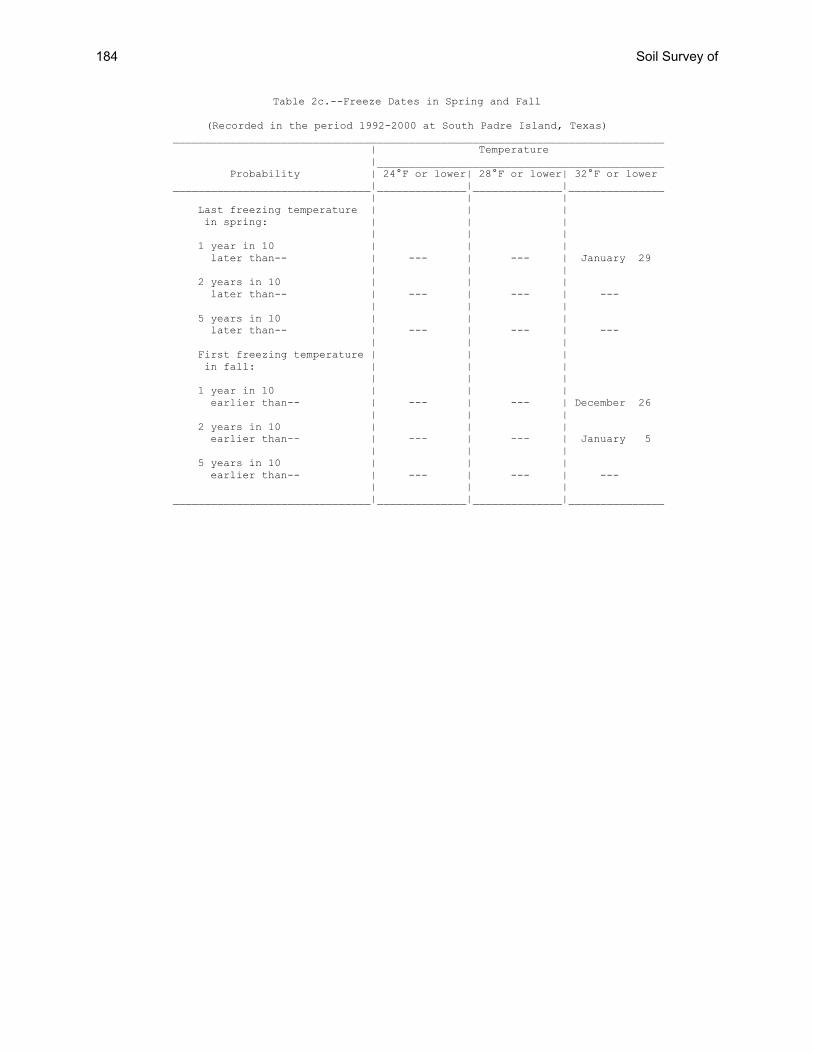
Table 2c.--Freeze Dates in Spring and Fall
(Recorded in the period 1992-2000 at South Padre Island, Texas) _____________________________________________________________________________ | Temperature |_____________________________________________ Probability | 24°F or lower| 28°F or lower| 32°F or lower _______________________________|______________|______________|_______________ | | | Last freezing temperature | | | in spring: | | | | | | 1 year in 10 | | | later than-- | --- | --- | January 29 | | | 2 years in 10 | | | later than-- | --- | --- | --- | | | 5 years in 10 | | | later than-- | --- | --- | --- | | | First freezing temperature | | | in fall: | | | | | | 1 year in 10 | | | earlier than-- | --- | --- | December 26 | | | 2 years in 10 | | | earlier than-- | --- | --- | January 5 | | | 5 years in 10 | | | earlier than-- | --- | --- | --- | | | _______________________________|______________|______________|_______________
184 Soil Survey of
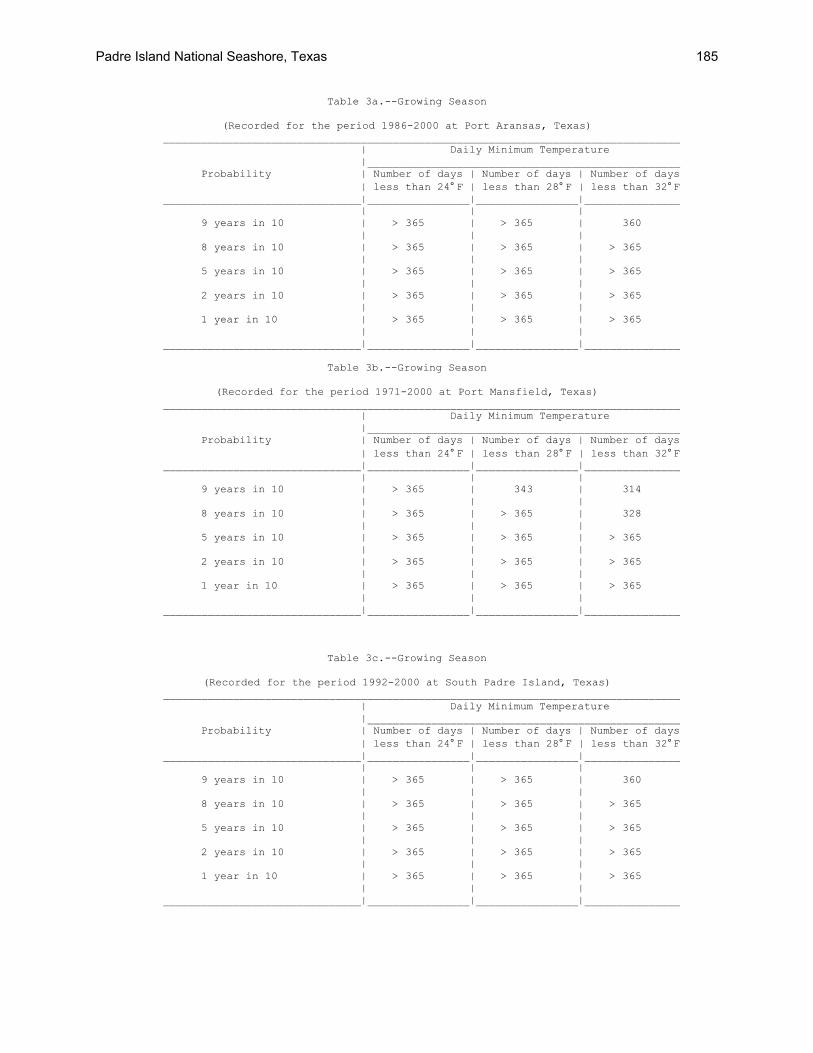
Table 3a.--Growing Season
(Recorded for the period 1986-2000 at Port Aransas, Texas) _________________________________________________________________________________ | Daily Minimum Temperature |_________________________________________________ Probability | Number of days | Number of days | Number of days | less than 24° F | less than 28° F | less than 32°F _______________________________|________________|________________|_______________ | | | 9 years in 10 | > 365 | > 365 | 360 | | | 8 years in 10 | > 365 | > 365 | > 365 | | | 5 years in 10 | > 365 | > 365 | > 365 | | | 2 years in 10 | > 365 | > 365 | > 365 | | | 1 year in 10 | > 365 | > 365 | > 365 | | | _______________________________|________________|________________|_______________
Table 3b.--Growing Season
(Recorded for the period 1971-2000 at Port Mansfield, Texas)
_________________________________________________________________________________ | Daily Minimum Temperature |_________________________________________________ Probability | Number of days | Number of days | Number of days | less than 24° F | less than 28° F | less than 32°F _______________________________|________________|________________|_______________ | | | 9 years in 10 | > 365 | 343 | 314 | | | 8 years in 10 | > 365 | > 365 | 328 | | | 5 years in 10 | > 365 | > 365 | > 365 | | | 2 years in 10 | > 365 | > 365 | > 365 | | | 1 year in 10 | > 365 | > 365 | > 365 | | | _______________________________|________________|________________|_______________
Table 3c.--Growing Season
(Recorded for the period 1992-2000 at South Padre Island, Texas) _________________________________________________________________________________ | Daily Minimum Temperature |_________________________________________________ Probability | Number of days | Number of days | Number of days | less than 24° F | less than 28° F | less than 32°F _______________________________|________________|________________|_______________ | | | 9 years in 10 | > 365 | > 365 | 360 | | | 8 years in 10 | > 365 | > 365 | > 365 | | | 5 years in 10 | > 365 | > 365 | > 365 | | | 2 years in 10 | > 365 | > 365 | > 365 | | | 1 year in 10 | > 365 | > 365 | > 365 | | | _______________________________|________________|________________|_______________
Padre Island National Seashore, Texas 185
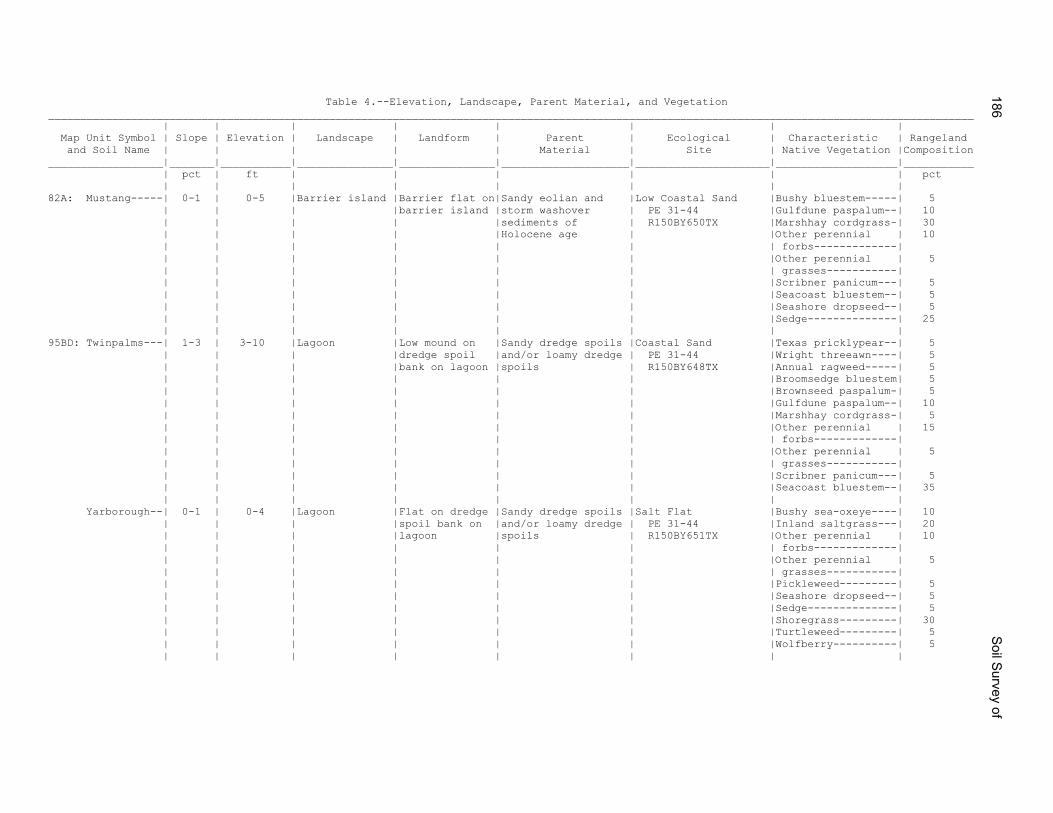
Table 4.--Elevation, Landscape, Parent Material, and Vegetation _________________________________________________________________________________________________________________________________________________ | | | | | | | | Map Unit Symbol | Slope | Elevation | Landscape | Landform | Parent | Ecological | Characteristic | Rangeland and Soil Name | | | | | Material | Site | Native Vegetation |Composition __________________|_______|___________|_______________|_______________|____________________|_____________________|___________________|___________ | pct | ft | | | | | | pct | | | | | | | | 82A: Mustang-----| 0-1 | 0-5 |Barrier island |Barrier flat on|Sandy eolian and |Low Coastal Sand |Bushy bluestem-----| 5 | | | |barrier island |storm washover | PE 31-44 |Gulfdune paspalum--| 10 | | | | |sediments of | R150BY650TX |Marshhay cordgrass-| 30 | | | | |Holocene age | |Other perennial | 10 | | | | | | | forbs-------------| | | | | | | |Other perennial | 5 | | | | | | | grasses-----------| | | | | | | |Scribner panicum---| 5 | | | | | | |Seacoast bluestem--| 5 | | | | | | |Seashore dropseed--| 5 | | | | | | |Sedge--------------| 25 | | | | | | | | 95BD: Twinpalms---| 1-3 | 3-10 |Lagoon |Low mound on |Sandy dredge spoils |Coastal Sand |Texas pricklypear--| 5 | | | |dredge spoil |and/or loamy dredge | PE 31-44 |Wright threeawn----| 5 | | | |bank on lagoon |spoils | R150BY648TX |Annual ragweed-----| 5 | | | | | | |Broomsedge bluestem| 5 | | | | | | |Brownseed paspalum-| 5 | | | | | | |Gulfdune paspalum--| 10 | | | | | | |Marshhay cordgrass-| 5 | | | | | | |Other perennial | 15 | | | | | | | forbs-------------| | | | | | | |Other perennial | 5 | | | | | | | grasses-----------| | | | | | | |Scribner panicum---| 5 | | | | | | |Seacoast bluestem--| 35 | | | | | | | | Yarborough--| 0-1 | 0-4 |Lagoon |Flat on dredge |Sandy dredge spoils |Salt Flat |Bushy sea-oxeye----| 10 | | | |spoil bank on |and/or loamy dredge | PE 31-44 |Inland saltgrass---| 20 | | | |lagoon |spoils | R150BY651TX |Other perennial | 10 | | | | | | | forbs-------------| | | | | | | |Other perennial | 5 | | | | | | | grasses-----------| | | | | | | |Pickleweed---------| 5 | | | | | | |Seashore dropseed--| 5 | | | | | | |Sedge--------------| 5 | | | | | | |Shoregrass---------| 30 | | | | | | |Turtleweed---------| 5 | | | | | | |Wolfberry----------| 5 | | | | | | | |
186S
oil Survey of
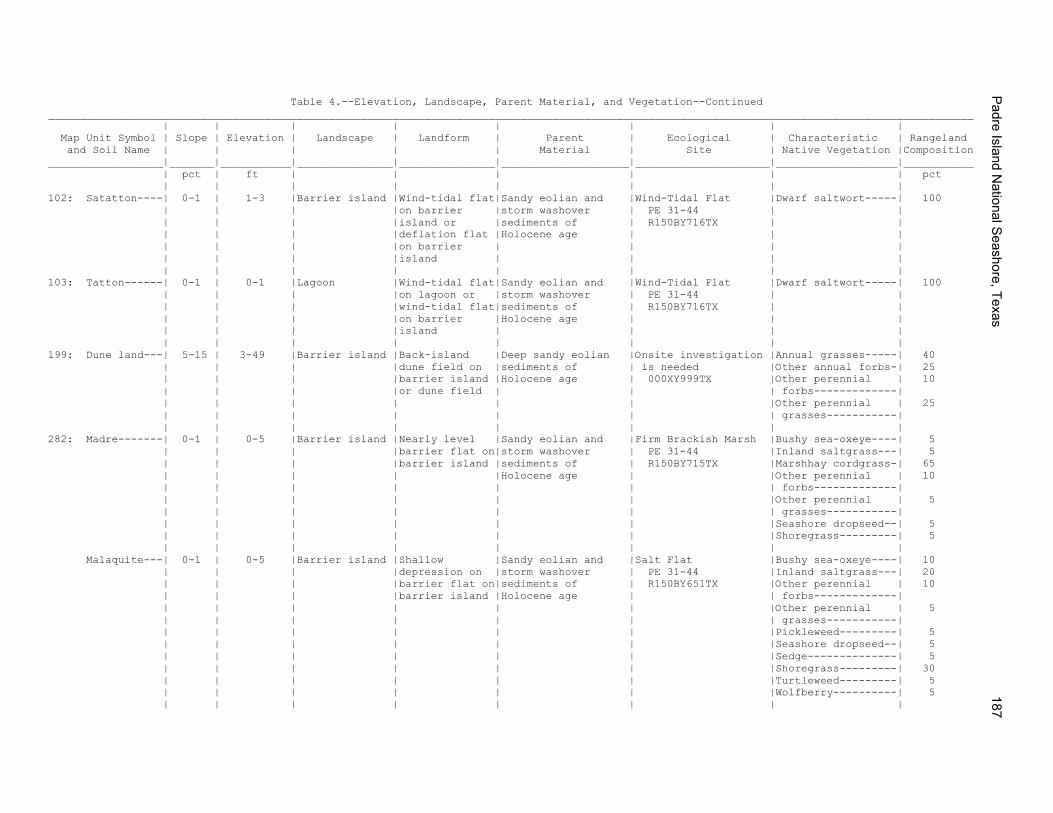
Table 4.--Elevation, Landscape, Parent Material, and Vegetation--Continued _________________________________________________________________________________________________________________________________________________ | | | | | | | | Map Unit Symbol | Slope | Elevation | Landscape | Landform | Parent | Ecological | Characteristic | Rangeland and Soil Name | | | | | Material | Site | Native Vegetation |Composition __________________|_______|___________|_______________|_______________|____________________|_____________________|___________________|___________ | pct | ft | | | | | | pct | | | | | | | | 102: Satatton----| 0-1 | 1-3 |Barrier island |Wind-tidal flat|Sandy eolian and |Wind-Tidal Flat |Dwarf saltwort-----| 100 | | | |on barrier |storm washover | PE 31-44 | | | | | |island or |sediments of | R150BY716TX | | | | | |deflation flat |Holocene age | | | | | | |on barrier | | | | | | | |island | | | | | | | | | | | | 103: Tatton------| 0-1 | 0-1 |Lagoon |Wind-tidal flat|Sandy eolian and |Wind-Tidal Flat |Dwarf saltwort-----| 100 | | | |on lagoon or |storm washover | PE 31-44 | | | | | |wind-tidal flat|sediments of | R150BY716TX | | | | | |on barrier |Holocene age | | | | | | |island | | | | | | | | | | | | 199: Dune land---| 5-15 | 3-49 |Barrier island |Back-island |Deep sandy eolian |Onsite investigation |Annual grasses-----| 40 | | | |dune field on |sediments of | is needed |Other annual forbs-| 25 | | | |barrier island |Holocene age | 000XY999TX |Other perennial | 10 | | | |or dune field | | | forbs-------------| | | | | | | |Other perennial | 25 | | | | | | | grasses-----------| | | | | | | | | 282: Madre-------| 0-1 | 0-5 |Barrier island |Nearly level |Sandy eolian and |Firm Brackish Marsh |Bushy sea-oxeye----| 5 | | | |barrier flat on|storm washover | PE 31-44 |Inland saltgrass---| 5 | | | |barrier island |sediments of | R150BY715TX |Marshhay cordgrass-| 65 | | | | |Holocene age | |Other perennial | 10 | | | | | | | forbs-------------| | | | | | | |Other perennial | 5 | | | | | | | grasses-----------| | | | | | | |Seashore dropseed--| 5 | | | | | | |Shoregrass---------| 5 | | | | | | | | Malaquite---| 0-1 | 0-5 |Barrier island |Shallow |Sandy eolian and |Salt Flat |Bushy sea-oxeye----| 10 | | | |depression on |storm washover | PE 31-44 |Inland saltgrass---| 20 | | | |barrier flat on|sediments of | R150BY651TX |Other perennial | 10 | | | |barrier island |Holocene age | | forbs-------------| | | | | | | |Other perennial | 5 | | | | | | | grasses-----------| | | | | | | |Pickleweed---------| 5 | | | | | | |Seashore dropseed--| 5 | | | | | | |Sedge--------------| 5 | | | | | | |Shoregrass---------| 30 | | | | | | |Turtleweed---------| 5 | | | | | | |Wolfberry----------| 5 | | | | | | | |
Padre Island N
ational Seashore, Texas
187
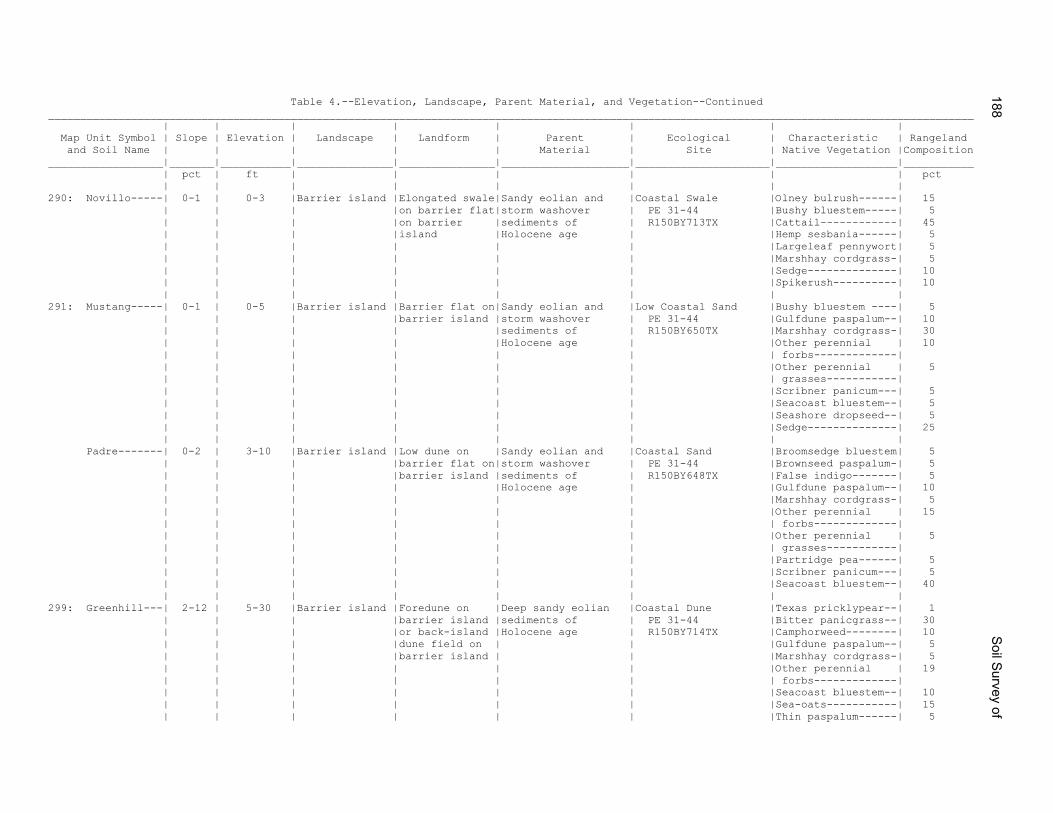
Table 4.--Elevation, Landscape, Parent Material, and Vegetation--Continued _________________________________________________________________________________________________________________________________________________ | | | | | | | | Map Unit Symbol | Slope | Elevation | Landscape | Landform | Parent | Ecological | Characteristic | Rangeland and Soil Name | | | | | Material | Site | Native Vegetation |Composition __________________|_______|___________|_______________|_______________|____________________|_____________________|___________________|___________ | pct | ft | | | | | | pct | | | | | | | | 290: Novillo-----| 0-1 | 0-3 |Barrier island |Elongated swale|Sandy eolian and |Coastal Swale |Olney bulrush------| 15 | | | |on barrier flat|storm washover | PE 31-44 |Bushy bluestem-----| 5 | | | |on barrier |sediments of | R150BY713TX |Cattail------------| 45 | | | |island |Holocene age | |Hemp sesbania------| 5 | | | | | | |Largeleaf pennywort| 5 | | | | | | |Marshhay cordgrass-| 5 | | | | | | |Sedge--------------| 10 | | | | | | |Spikerush----------| 10 | | | | | | | | 291: Mustang-----| 0-1 | 0-5 |Barrier island |Barrier flat on|Sandy eolian and |Low Coastal Sand |Bushy bluestem ----| 5 | | | |barrier island |storm washover | PE 31-44 |Gulfdune paspalum--| 10 | | | | |sediments of | R150BY650TX |Marshhay cordgrass-| 30 | | | | |Holocene age | |Other perennial | 10 | | | | | | | forbs-------------| | | | | | | |Other perennial | 5 | | | | | | | grasses-----------| | | | | | | |Scribner panicum---| 5 | | | | | | |Seacoast bluestem--| 5 | | | | | | |Seashore dropseed--| 5 | | | | | | |Sedge--------------| 25 | | | | | | | | Padre-------| 0-2 | 3-10 |Barrier island |Low dune on |Sandy eolian and |Coastal Sand |Broomsedge bluestem| 5 | | | |barrier flat on|storm washover | PE 31-44 |Brownseed paspalum-| 5 | | | |barrier island |sediments of | R150BY648TX |False indigo-------| 5 | | | | |Holocene age | |Gulfdune paspalum--| 10 | | | | | | |Marshhay cordgrass-| 5 | | | | | | |Other perennial | 15 | | | | | | | forbs-------------| | | | | | | |Other perennial | 5 | | | | | | | grasses-----------| | | | | | | |Partridge pea------| 5 | | | | | | |Scribner panicum---| 5 | | | | | | |Seacoast bluestem--| 40 | | | | | | | | 299: Greenhill---| 2-12 | 5-30 |Barrier island |Foredune on |Deep sandy eolian |Coastal Dune |Texas pricklypear--| 1 | | | |barrier island |sediments of | PE 31-44 |Bitter panicgrass--| 30 | | | |or back-island |Holocene age | R150BY714TX |Camphorweed--------| 10 | | | |dune field on | | |Gulfdune paspalum--| 5 | | | |barrier island | | |Marshhay cordgrass-| 5 | | | | | | |Other perennial | 19 | | | | | | | forbs-------------| | | | | | | |Seacoast bluestem--| 10 | | | | | | |Sea-oats-----------| 15 | | | | | | |Thin paspalum------| 5
188S
oil Survey of
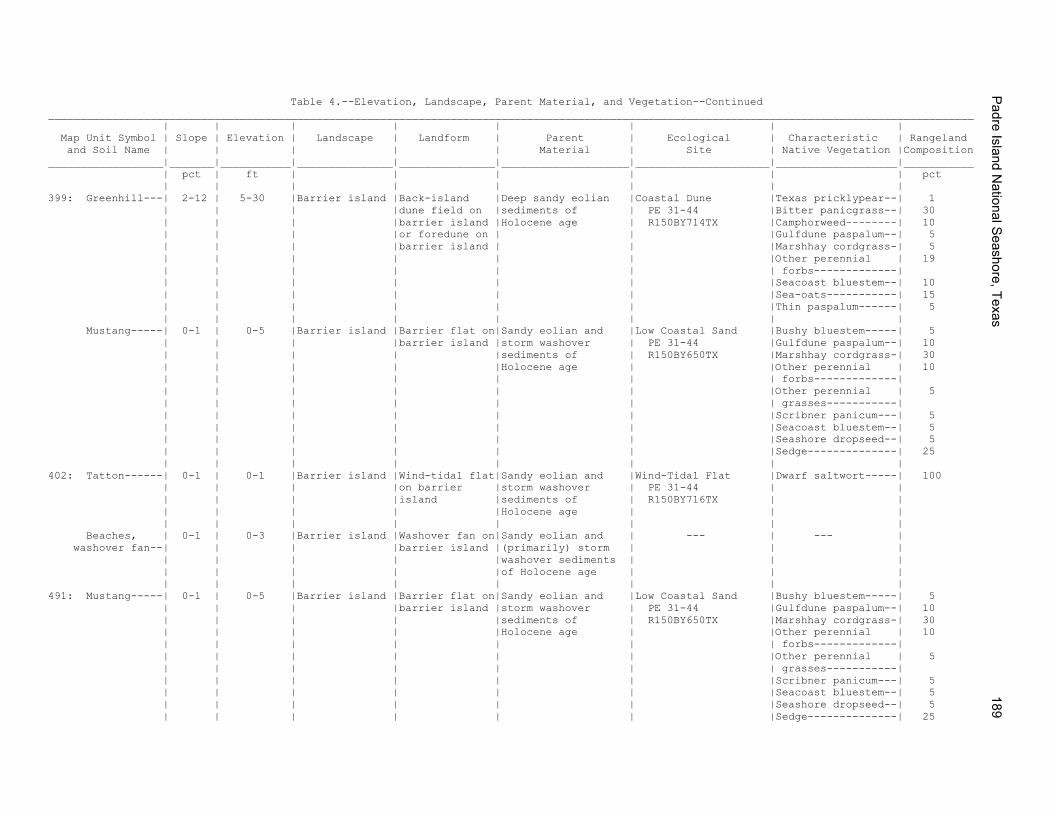
Table 4.--Elevation, Landscape, Parent Material, and Vegetation--Continued _________________________________________________________________________________________________________________________________________________ | | | | | | | | Map Unit Symbol | Slope | Elevation | Landscape | Landform | Parent | Ecological | Characteristic | Rangeland and Soil Name | | | | | Material | Site | Native Vegetation |Composition __________________|_______|___________|_______________|_______________|____________________|_____________________|___________________|___________ | pct | ft | | | | | | pct | | | | | | | | 399: Greenhill---| 2-12 | 5-30 |Barrier island |Back-island |Deep sandy eolian |Coastal Dune |Texas pricklypear--| 1 | | | |dune field on |sediments of | PE 31-44 |Bitter panicgrass--| 30 | | | |barrier island |Holocene age | R150BY714TX |Camphorweed--------| 10 | | | |or foredune on | | |Gulfdune paspalum--| 5 | | | |barrier island | | |Marshhay cordgrass-| 5 | | | | | | |Other perennial | 19 | | | | | | | forbs-------------| | | | | | | |Seacoast bluestem--| 10 | | | | | | |Sea-oats-----------| 15 | | | | | | |Thin paspalum------| 5 | | | | | | | | Mustang-----| 0-1 | 0-5 |Barrier island |Barrier flat on|Sandy eolian and |Low Coastal Sand |Bushy bluestem-----| 5 | | | |barrier island |storm washover | PE 31-44 |Gulfdune paspalum--| 10 | | | | |sediments of | R150BY650TX |Marshhay cordgrass-| 30 | | | | |Holocene age | |Other perennial | 10 | | | | | | | forbs-------------| | | | | | | |Other perennial | 5 | | | | | | | grasses-----------| | | | | | | |Scribner panicum---| 5 | | | | | | |Seacoast bluestem--| 5 | | | | | | |Seashore dropseed--| 5 | | | | | | |Sedge--------------| 25 | | | | | | | | 402: Tatton------| 0-1 | 0-1 |Barrier island |Wind-tidal flat|Sandy eolian and |Wind-Tidal Flat |Dwarf saltwort-----| 100 | | | |on barrier |storm washover | PE 31-44 | | | | | |island |sediments of | R150BY716TX | | | | | | |Holocene age | | | | | | | | | | | Beaches, | 0-1 | 0-3 |Barrier island |Washover fan on|Sandy eolian and | --- | --- | washover fan--| | | |barrier island |(primarily) storm | | | | | | | |washover sediments | | | | | | | |of Holocene age | | | | | | | | | | | 491: Mustang-----| 0-1 | 0-5 |Barrier island |Barrier flat on|Sandy eolian and |Low Coastal Sand |Bushy bluestem-----| 5 | | | |barrier island |storm washover | PE 31-44 |Gulfdune paspalum--| 10 | | | | |sediments of | R150BY650TX |Marshhay cordgrass-| 30 | | | | |Holocene age | |Other perennial | 10 | | | | | | | forbs-------------| | | | | | | |Other perennial | 5 | | | | | | | grasses-----------| | | | | | | |Scribner panicum---| 5 | | | | | | |Seacoast bluestem--| 5 | | | | | | |Seashore dropseed--| 5 | | | | | | |Sedge--------------| 25
Padre Island N
ational Seashore, Texas
189
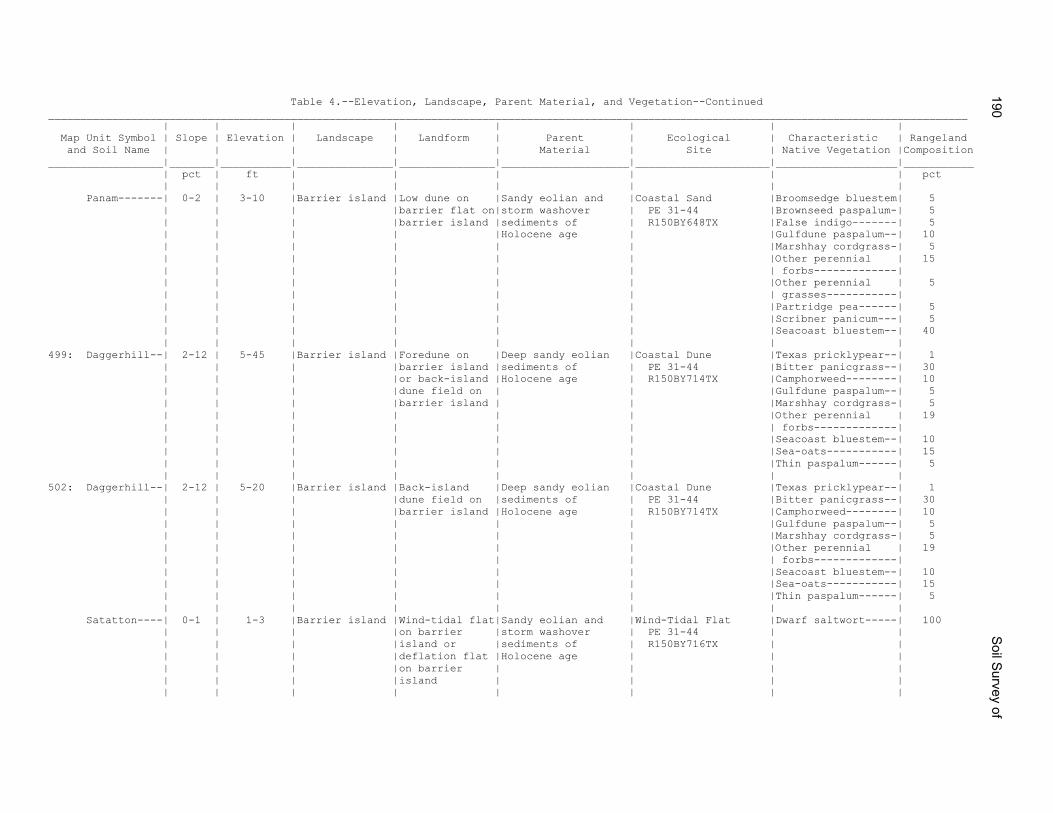
Table 4.--Elevation, Landscape, Parent Material, and Vegetation--Continued ________________________________________________________________________________________________________________________________________________ | | | | | | | | Map Unit Symbol | Slope | Elevation | Landscape | Landform | Parent | Ecological | Characteristic | Rangeland and Soil Name | | | | | Material | Site | Native Vegetation |Composition __________________|_______|___________|_______________|_______________|____________________|_____________________|___________________|___________ | pct | ft | | | | | | pct | | | | | | | | Panam-------| 0-2 | 3-10 |Barrier island |Low dune on |Sandy eolian and |Coastal Sand |Broomsedge bluestem| 5 | | | |barrier flat on|storm washover | PE 31-44 |Brownseed paspalum-| 5 | | | |barrier island |sediments of | R150BY648TX |False indigo-------| 5 | | | | |Holocene age | |Gulfdune paspalum--| 10 | | | | | | |Marshhay cordgrass-| 5 | | | | | | |Other perennial | 15 | | | | | | | forbs-------------| | | | | | | |Other perennial | 5 | | | | | | | grasses-----------| | | | | | | |Partridge pea------| 5 | | | | | | |Scribner panicum---| 5 | | | | | | |Seacoast bluestem--| 40 | | | | | | | | 499: Daggerhill--| 2-12 | 5-45 |Barrier island |Foredune on |Deep sandy eolian |Coastal Dune |Texas pricklypear--| 1 | | | |barrier island |sediments of | PE 31-44 |Bitter panicgrass--| 30 | | | |or back-island |Holocene age | R150BY714TX |Camphorweed--------| 10 | | | |dune field on | | |Gulfdune paspalum--| 5 | | | |barrier island | | |Marshhay cordgrass-| 5 | | | | | | |Other perennial | 19 | | | | | | | forbs-------------| | | | | | | |Seacoast bluestem--| 10 | | | | | | |Sea-oats-----------| 15 | | | | | | |Thin paspalum------| 5 | | | | | | | | 502: Daggerhill--| 2-12 | 5-20 |Barrier island |Back-island |Deep sandy eolian |Coastal Dune |Texas pricklypear--| 1 | | | |dune field on |sediments of | PE 31-44 |Bitter panicgrass--| 30 | | | |barrier island |Holocene age | R150BY714TX |Camphorweed--------| 10 | | | | | | |Gulfdune paspalum--| 5 | | | | | | |Marshhay cordgrass-| 5 | | | | | | |Other perennial | 19 | | | | | | | forbs-------------| | | | | | | |Seacoast bluestem--| 10 | | | | | | |Sea-oats-----------| 15 | | | | | | |Thin paspalum------| 5 | | | | | | | | Satatton----| 0-1 | 1-3 |Barrier island |Wind-tidal flat|Sandy eolian and |Wind-Tidal Flat |Dwarf saltwort-----| 100 | | | |on barrier |storm washover | PE 31-44 | | | | | |island or |sediments of | R150BY716TX | | | | | |deflation flat |Holocene age | | | | | | |on barrier | | | | | | | |island | | | | | | | | | | | |
190S
oil Survey of
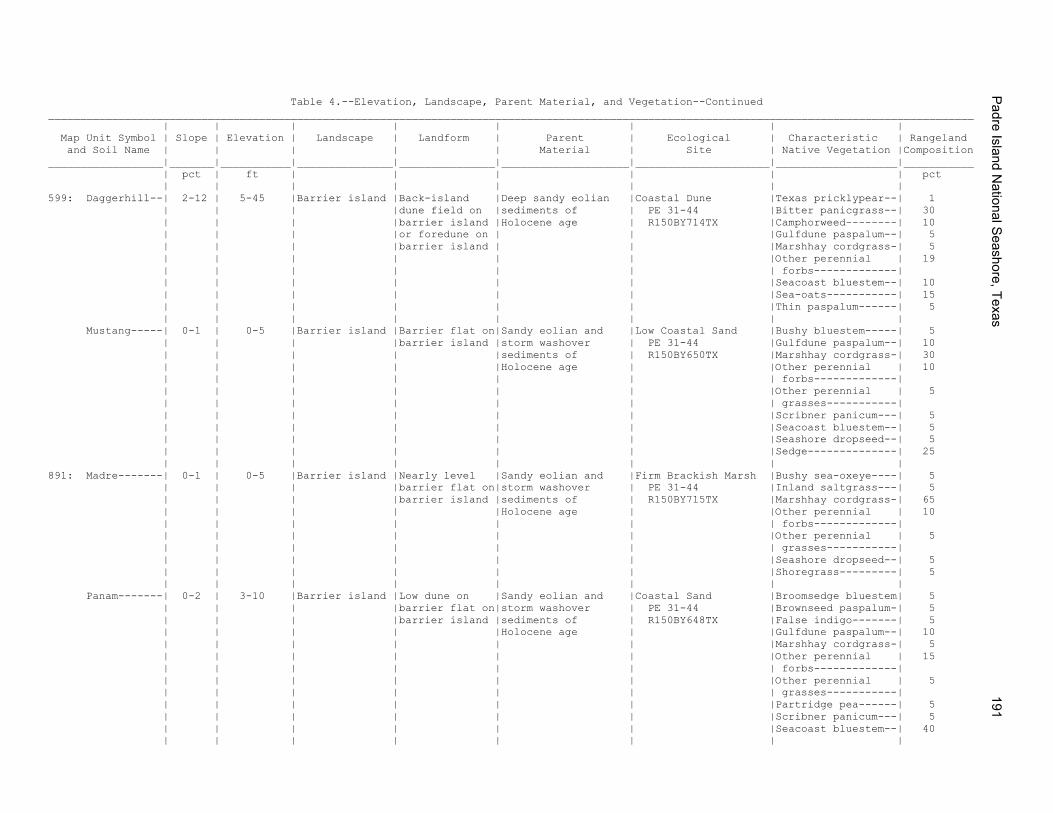
Table 4.--Elevation, Landscape, Parent Material, and Vegetation--Continued _________________________________________________________________________________________________________________________________________________ | | | | | | | | Map Unit Symbol | Slope | Elevation | Landscape | Landform | Parent | Ecological | Characteristic | Rangeland and Soil Name | | | | | Material | Site | Native Vegetation |Composition __________________|_______|___________|_______________|_______________|____________________|_____________________|___________________|___________ | pct | ft | | | | | | pct | | | | | | | | 599: Daggerhill--| 2-12 | 5-45 |Barrier island |Back-island |Deep sandy eolian |Coastal Dune |Texas pricklypear--| 1 | | | |dune field on |sediments of | PE 31-44 |Bitter panicgrass--| 30 | | | |barrier island |Holocene age | R150BY714TX |Camphorweed--------| 10 | | | |or foredune on | | |Gulfdune paspalum--| 5 | | | |barrier island | | |Marshhay cordgrass-| 5 | | | | | | |Other perennial | 19 | | | | | | | forbs-------------| | | | | | | |Seacoast bluestem--| 10 | | | | | | |Sea-oats-----------| 15 | | | | | | |Thin paspalum------| 5 | | | | | | | | Mustang-----| 0-1 | 0-5 |Barrier island |Barrier flat on|Sandy eolian and |Low Coastal Sand |Bushy bluestem-----| 5 | | | |barrier island |storm washover | PE 31-44 |Gulfdune paspalum--| 10 | | | | |sediments of | R150BY650TX |Marshhay cordgrass-| 30 | | | | |Holocene age | |Other perennial | 10 | | | | | | | forbs-------------| | | | | | | |Other perennial | 5 | | | | | | | grasses-----------| | | | | | | |Scribner panicum---| 5 | | | | | | |Seacoast bluestem--| 5 | | | | | | |Seashore dropseed--| 5 | | | | | | |Sedge--------------| 25 | | | | | | | | 891: Madre-------| 0-1 | 0-5 |Barrier island |Nearly level |Sandy eolian and |Firm Brackish Marsh |Bushy sea-oxeye----| 5 | | | |barrier flat on|storm washover | PE 31-44 |Inland saltgrass---| 5 | | | |barrier island |sediments of | R150BY715TX |Marshhay cordgrass-| 65 | | | | |Holocene age | |Other perennial | 10 | | | | | | | forbs-------------| | | | | | | |Other perennial | 5 | | | | | | | grasses-----------| | | | | | | |Seashore dropseed--| 5 | | | | | | |Shoregrass---------| 5 | | | | | | | | Panam-------| 0-2 | 3-10 |Barrier island |Low dune on |Sandy eolian and |Coastal Sand |Broomsedge bluestem| 5 | | | |barrier flat on|storm washover | PE 31-44 |Brownseed paspalum-| 5 | | | |barrier island |sediments of | R150BY648TX |False indigo-------| 5 | | | | |Holocene age | |Gulfdune paspalum--| 10 | | | | | | |Marshhay cordgrass-| 5 | | | | | | |Other perennial | 15 | | | | | | | forbs-------------| | | | | | | |Other perennial | 5 | | | | | | | grasses-----------| | | | | | | |Partridge pea------| 5 | | | | | | |Scribner panicum---| 5 | | | | | | |Seacoast bluestem--| 40 | | | | | | | |
Padre Island N
ational Seashore, Texas
191
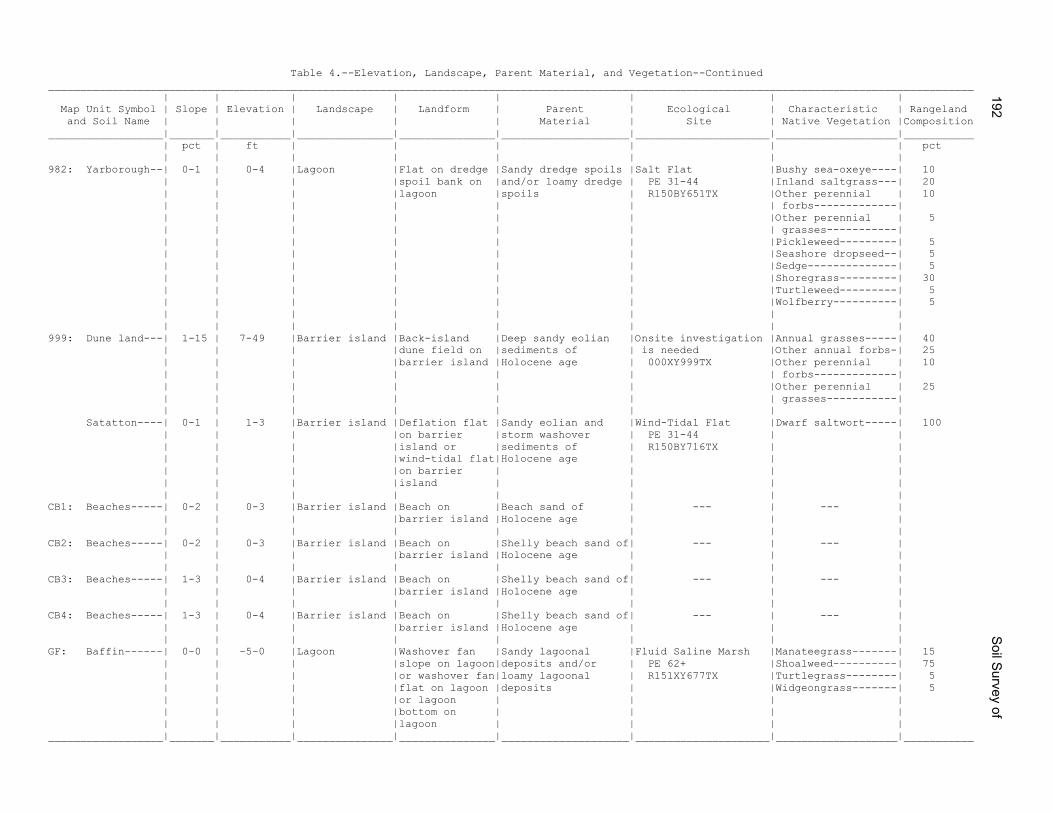
Table 4.--Elevation, Landscape, Parent Material, and Vegetation--Continued _________________________________________________________________________________________________________________________________________________ | | | | | | | | Map Unit Symbol | Slope | Elevation | Landscape | Landform | Parent | Ecological | Characteristic | Rangeland and Soil Name | | | | | Material | Site | Native Vegetation |Composition __________________|_______|___________|_______________|_______________|____________________|_____________________|___________________|___________ | pct | ft | | | | | | pct | | | | | | | | 982: Yarborough--| 0-1 | 0-4 |Lagoon |Flat on dredge |Sandy dredge spoils |Salt Flat |Bushy sea-oxeye----| 10 | | | |spoil bank on |and/or loamy dredge | PE 31-44 |Inland saltgrass---| 20 | | | |lagoon |spoils | R150BY651TX |Other perennial | 10 | | | | | | | forbs-------------| | | | | | | |Other perennial | 5 | | | | | | | grasses-----------| | | | | | | |Pickleweed---------| 5 | | | | | | |Seashore dropseed--| 5 | | | | | | |Sedge--------------| 5 | | | | | | |Shoregrass---------| 30 | | | | | | |Turtleweed---------| 5 | | | | | | |Wolfberry----------| 5 | | | | | | | | | | | | | | | | 999: Dune land---| 1-15 | 7-49 |Barrier island |Back-island |Deep sandy eolian |Onsite investigation |Annual grasses-----| 40 | | | |dune field on |sediments of | is needed |Other annual forbs-| 25 | | | |barrier island |Holocene age | 000XY999TX |Other perennial | 10 | | | | | | | forbs-------------| | | | | | | |Other perennial | 25 | | | | | | | grasses-----------| | | | | | | | | Satatton----| 0-1 | 1-3 |Barrier island |Deflation flat |Sandy eolian and |Wind-Tidal Flat |Dwarf saltwort-----| 100 | | | |on barrier |storm washover | PE 31-44 | | | | | |island or |sediments of | R150BY716TX | | | | | |wind-tidal flat|Holocene age | | | | | | |on barrier | | | | | | | |island | | | | | | | | | | | | CB1: Beaches-----| 0-2 | 0-3 |Barrier island |Beach on |Beach sand of | --- | --- | | | | |barrier island |Holocene age | | | | | | | | | | | CB2: Beaches-----| 0-2 | 0-3 |Barrier island |Beach on |Shelly beach sand of| --- | --- | | | | |barrier island |Holocene age | | | | | | | | | | | CB3: Beaches-----| 1-3 | 0-4 |Barrier island |Beach on |Shelly beach sand of| --- | --- | | | | |barrier island |Holocene age | | | | | | | | | | | CB4: Beaches-----| 1-3 | 0-4 |Barrier island |Beach on |Shelly beach sand of| --- | --- | | | | |barrier island |Holocene age | | | | | | | | | | | GF: Baffin------| 0-0 | -5-0 |Lagoon |Washover fan |Sandy lagoonal |Fluid Saline Marsh |Manateegrass-------| 15 | | | |slope on lagoon|deposits and/or | PE 62+ |Shoalweed----------| 75 | | | |or washover fan|loamy lagoonal | R151XY677TX |Turtlegrass--------| 5 | | | |flat on lagoon |deposits | |Widgeongrass-------| 5 | | | |or lagoon | | | | | | | |bottom on | | | | | | | |lagoon | | | | __________________|_______|___________|_______________|_______________|____________________|_____________________|___________________|___________
192S
oil Survey of
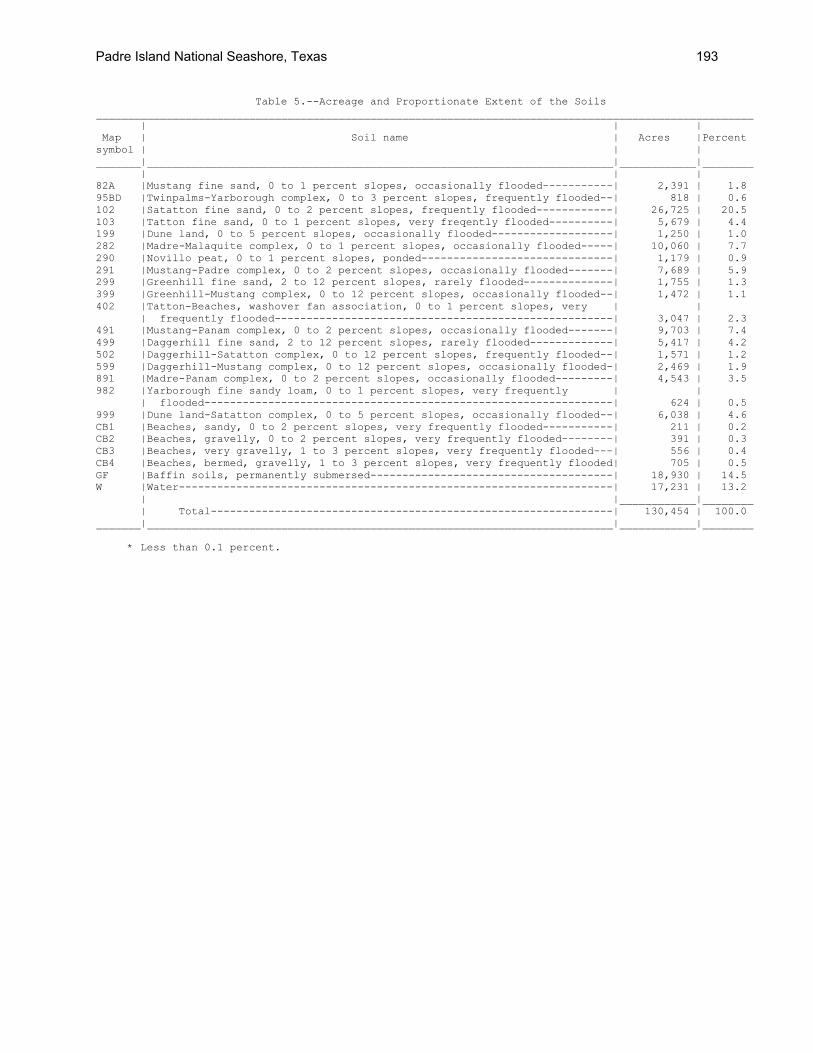
Table 5.--Acreage and Proportionate Extent of the Soils _______________________________________________________________________________________________________ | | | Map | Soil name | Acres |Percent symbol | | | _______|_________________________________________________________________________|____________|________ | | | 82A |Mustang fine sand, 0 to 1 percent slopes, occasionally flooded-----------| 2,391 | 1.8 95BD |Twinpalms-Yarborough complex, 0 to 3 percent slopes, frequently flooded--| 818 | 0.6 102 |Satatton fine sand, 0 to 2 percent slopes, frequently flooded------------| 26,725 | 20.5 103 |Tatton fine sand, 0 to 1 percent slopes, very freqently flooded----------| 5,679 | 4.4 199 |Dune land, 0 to 5 percent slopes, occasionally flooded-------------------| 1,250 | 1.0 282 |Madre-Malaquite complex, 0 to 1 percent slopes, occasionally flooded-----| 10,060 | 7.7 290 |Novillo peat, 0 to 1 percent slopes, ponded------------------------------| 1,179 | 0.9 291 |Mustang-Padre complex, 0 to 2 percent slopes, occasionally flooded-------| 7,689 | 5.9 299 |Greenhill fine sand, 2 to 12 percent slopes, rarely flooded--------------| 1,755 | 1.3 399 |Greenhill-Mustang complex, 0 to 12 percent slopes, occasionally flooded--| 1,472 | 1.1 402 |Tatton-Beaches, washover fan association, 0 to 1 percent slopes, very | | | frequently flooded-----------------------------------------------------| 3,047 | 2.3 491 |Mustang-Panam complex, 0 to 2 percent slopes, occasionally flooded-------| 9,703 | 7.4 499 |Daggerhill fine sand, 2 to 12 percent slopes, rarely flooded-------------| 5,417 | 4.2 502 |Daggerhill-Satatton complex, 0 to 12 percent slopes, frequently flooded--| 1,571 | 1.2 599 |Daggerhill-Mustang complex, 0 to 12 percent slopes, occasionally flooded-| 2,469 | 1.9 891 |Madre-Panam complex, 0 to 2 percent slopes, occasionally flooded---------| 4,543 | 3.5 982 |Yarborough fine sandy loam, 0 to 1 percent slopes, very frequently | | | flooded----------------------------------------------------------------| 624 | 0.5 999 |Dune land-Satatton complex, 0 to 5 percent slopes, occasionally flooded--| 6,038 | 4.6 CB1 |Beaches, sandy, 0 to 2 percent slopes, very frequently flooded-----------| 211 | 0.2 CB2 |Beaches, gravelly, 0 to 2 percent slopes, very frequently flooded--------| 391 | 0.3 CB3 |Beaches, very gravelly, 1 to 3 percent slopes, very frequently flooded---| 556 | 0.4 CB4 |Beaches, bermed, gravelly, 1 to 3 percent slopes, very frequently flooded| 705 | 0.5 GF |Baffin soils, permanently submersed--------------------------------------| 18,930 | 14.5 W |Water--------------------------------------------------------------------| 17,231 | 13.2 | |____________|________ | Total---------------------------------------------------------------| 130,454 | 100.0 _______|_________________________________________________________________________|____________|________ * Less than 0.1 percent.
Padre Island National Seashore, Texas 193
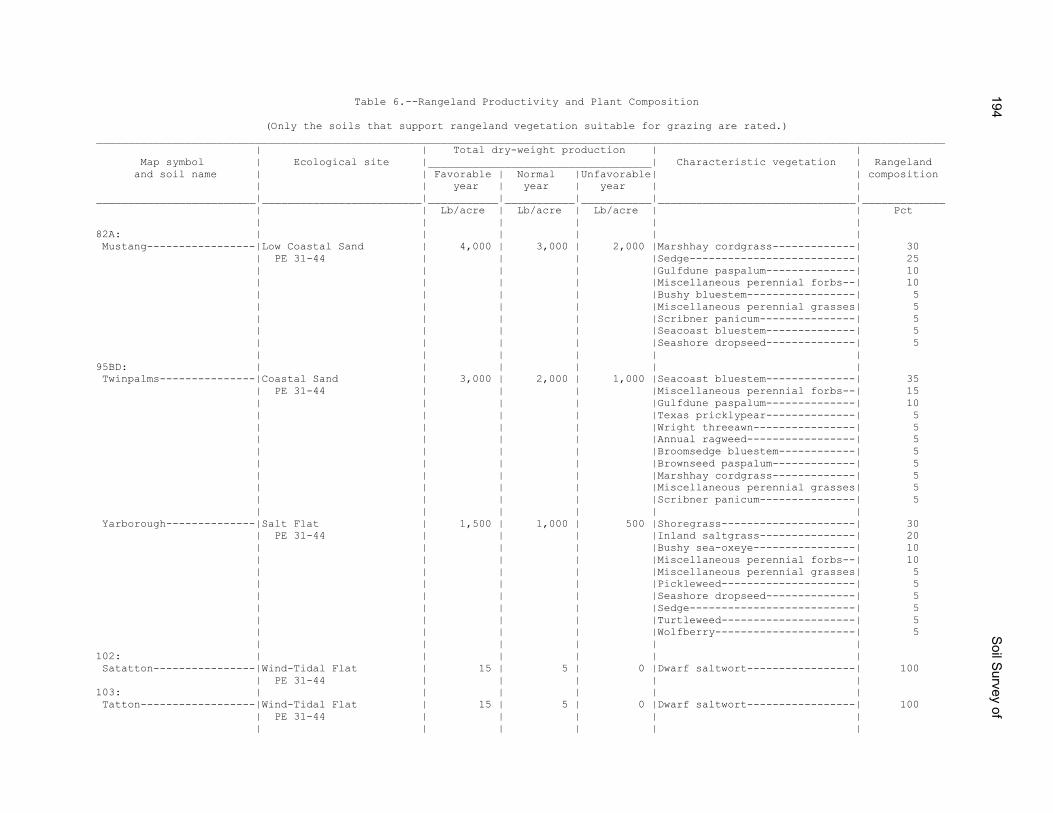
Table 6.--Rangeland Productivity and Plant Composition
(Only the soils that support rangeland vegetation suitable for grazing are rated.) _____________________________________________________________________________________________________________________________________ | | Total dry-weight production | | Map symbol | Ecological site |___________________________________| Characteristic vegetation | Rangeland and soil name | | Favorable | Normal |Unfavorable| | composition | | year | year | year | | _________________________|_________________________|___________|___________|___________|_______________________________|_____________ | | Lb/acre | Lb/acre | Lb/acre | | Pct | | | | | | 82A: | | | | | | Mustang-----------------|Low Coastal Sand | 4,000 | 3,000 | 2,000 |Marshhay cordgrass-------------| 30 | PE 31-44 | | | |Sedge--------------------------| 25 | | | | |Gulfdune paspalum--------------| 10 | | | | |Miscellaneous perennial forbs--| 10 | | | | |Bushy bluestem-----------------| 5 | | | | |Miscellaneous perennial grasses| 5 | | | | |Scribner panicum---------------| 5 | | | | |Seacoast bluestem--------------| 5 | | | | |Seashore dropseed--------------| 5 | | | | | | 95BD: | | | | | | Twinpalms---------------|Coastal Sand | 3,000 | 2,000 | 1,000 |Seacoast bluestem--------------| 35 | PE 31-44 | | | |Miscellaneous perennial forbs--| 15 | | | | |Gulfdune paspalum--------------| 10 | | | | |Texas pricklypear--------------| 5 | | | | |Wright threeawn----------------| 5 | | | | |Annual ragweed-----------------| 5 | | | | |Broomsedge bluestem------------| 5 | | | | |Brownseed paspalum-------------| 5 | | | | |Marshhay cordgrass-------------| 5 | | | | |Miscellaneous perennial grasses| 5 | | | | |Scribner panicum---------------| 5 | | | | | | Yarborough--------------|Salt Flat | 1,500 | 1,000 | 500 |Shoregrass---------------------| 30 | PE 31-44 | | | |Inland saltgrass---------------| 20 | | | | |Bushy sea-oxeye----------------| 10 | | | | |Miscellaneous perennial forbs--| 10 | | | | |Miscellaneous perennial grasses| 5 | | | | |Pickleweed---------------------| 5 | | | | |Seashore dropseed--------------| 5 | | | | |Sedge--------------------------| 5 | | | | |Turtleweed---------------------| 5 | | | | |Wolfberry----------------------| 5 | | | | | | 102: | | | | | | Satatton----------------|Wind-Tidal Flat | 15 | 5 | 0 |Dwarf saltwort-----------------| 100 | PE 31-44 | | | | | 103: | | | | | | Tatton------------------|Wind-Tidal Flat | 15 | 5 | 0 |Dwarf saltwort-----------------| 100 | PE 31-44 | | | | | | | | | | |
194S
oil Survey of
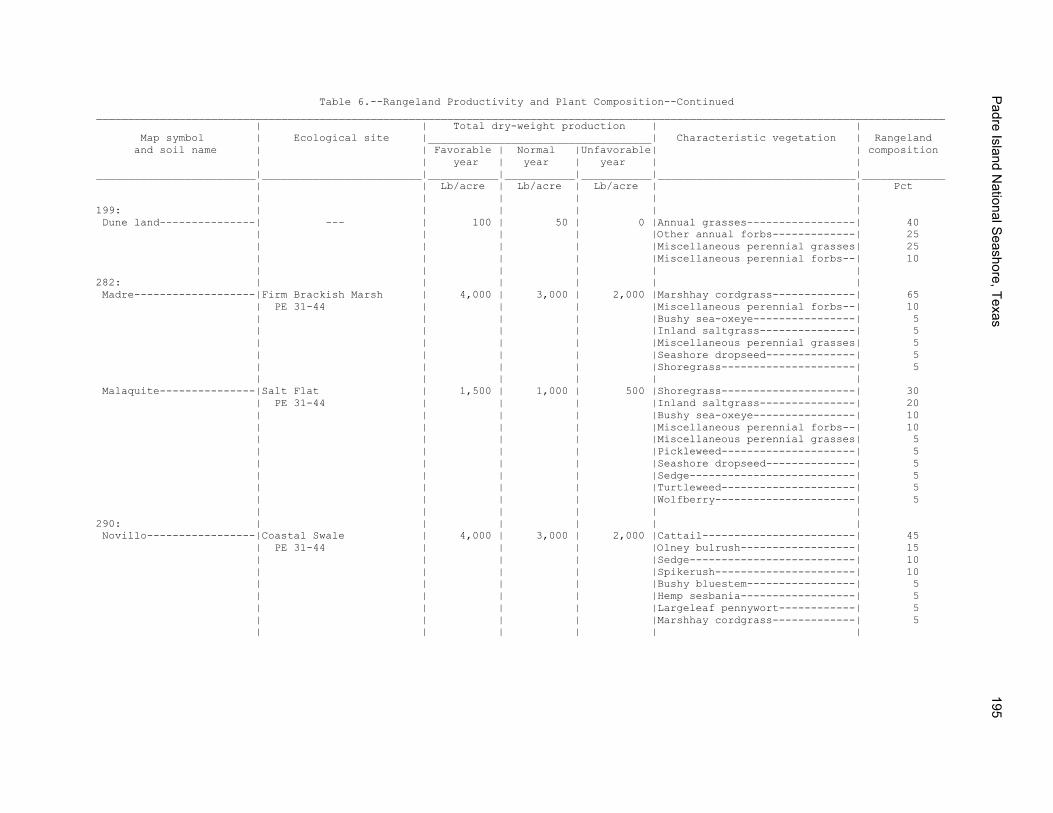
Table 6.--Rangeland Productivity and Plant Composition--Continued _____________________________________________________________________________________________________________________________________ | | Total dry-weight production | | Map symbol | Ecological site |___________________________________| Characteristic vegetation | Rangeland and soil name | | Favorable | Normal |Unfavorable| | composition | | year | year | year | | _________________________|_________________________|___________|___________|___________|_______________________________|_____________ | | Lb/acre | Lb/acre | Lb/acre | | Pct | | | | | | 199: | | | | | | Dune land---------------| --- | 100 | 50 | 0 |Annual grasses-----------------| 40 | | | | |Other annual forbs-------------| 25 | | | | |Miscellaneous perennial grasses| 25 | | | | |Miscellaneous perennial forbs--| 10 | | | | | | 282: | | | | | | Madre-------------------|Firm Brackish Marsh | 4,000 | 3,000 | 2,000 |Marshhay cordgrass-------------| 65 | PE 31-44 | | | |Miscellaneous perennial forbs--| 10 | | | | |Bushy sea-oxeye----------------| 5 | | | | |Inland saltgrass---------------| 5 | | | | |Miscellaneous perennial grasses| 5 | | | | |Seashore dropseed--------------| 5 | | | | |Shoregrass---------------------| 5 | | | | | | Malaquite---------------|Salt Flat | 1,500 | 1,000 | 500 |Shoregrass---------------------| 30 | PE 31-44 | | | |Inland saltgrass---------------| 20 | | | | |Bushy sea-oxeye----------------| 10 | | | | |Miscellaneous perennial forbs--| 10 | | | | |Miscellaneous perennial grasses| 5 | | | | |Pickleweed---------------------| 5 | | | | |Seashore dropseed--------------| 5 | | | | |Sedge--------------------------| 5 | | | | |Turtleweed---------------------| 5 | | | | |Wolfberry----------------------| 5 | | | | | | 290: | | | | | | Novillo-----------------|Coastal Swale | 4,000 | 3,000 | 2,000 |Cattail------------------------| 45 | PE 31-44 | | | |Olney bulrush------------------| 15 | | | | |Sedge--------------------------| 10 | | | | |Spikerush----------------------| 10 | | | | |Bushy bluestem-----------------| 5 | | | | |Hemp sesbania------------------| 5 | | | | |Largeleaf pennywort------------| 5 | | | | |Marshhay cordgrass-------------| 5 | | | | | |
Padre Island N
ational Seashore, Texas
195
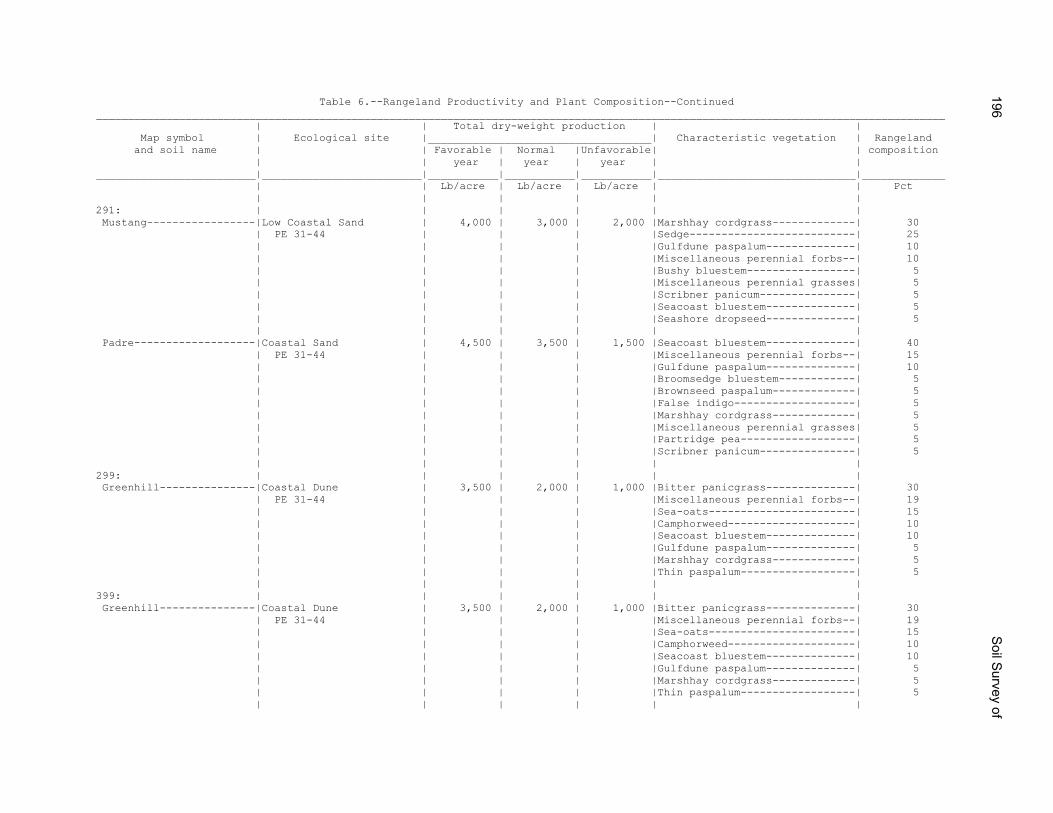
Table 6.--Rangeland Productivity and Plant Composition--Continued _____________________________________________________________________________________________________________________________________ | | Total dry-weight production | | Map symbol | Ecological site |___________________________________| Characteristic vegetation | Rangeland and soil name | | Favorable | Normal |Unfavorable| | composition | | year | year | year | | _________________________|_________________________|___________|___________|___________|_______________________________|_____________ | | Lb/acre | Lb/acre | Lb/acre | | Pct | | | | | | 291: | | | | | | Mustang-----------------|Low Coastal Sand | 4,000 | 3,000 | 2,000 |Marshhay cordgrass-------------| 30 | PE 31-44 | | | |Sedge--------------------------| 25 | | | | |Gulfdune paspalum--------------| 10 | | | | |Miscellaneous perennial forbs--| 10 | | | | |Bushy bluestem-----------------| 5 | | | | |Miscellaneous perennial grasses| 5 | | | | |Scribner panicum---------------| 5 | | | | |Seacoast bluestem--------------| 5 | | | | |Seashore dropseed--------------| 5 | | | | | | Padre-------------------|Coastal Sand | 4,500 | 3,500 | 1,500 |Seacoast bluestem--------------| 40 | PE 31-44 | | | |Miscellaneous perennial forbs--| 15 | | | | |Gulfdune paspalum--------------| 10 | | | | |Broomsedge bluestem------------| 5 | | | | |Brownseed paspalum-------------| 5 | | | | |False indigo-------------------| 5 | | | | |Marshhay cordgrass-------------| 5 | | | | |Miscellaneous perennial grasses| 5 | | | | |Partridge pea------------------| 5 | | | | |Scribner panicum---------------| 5 | | | | | | 299: | | | | | | Greenhill---------------|Coastal Dune | 3,500 | 2,000 | 1,000 |Bitter panicgrass--------------| 30 | PE 31-44 | | | |Miscellaneous perennial forbs--| 19 | | | | |Sea-oats-----------------------| 15 | | | | |Camphorweed--------------------| 10 | | | | |Seacoast bluestem--------------| 10 | | | | |Gulfdune paspalum--------------| 5 | | | | |Marshhay cordgrass-------------| 5 | | | | |Thin paspalum------------------| 5 | | | | | | 399: | | | | | | Greenhill---------------|Coastal Dune | 3,500 | 2,000 | 1,000 |Bitter panicgrass--------------| 30 | PE 31-44 | | | |Miscellaneous perennial forbs--| 19 | | | | |Sea-oats-----------------------| 15 | | | | |Camphorweed--------------------| 10 | | | | |Seacoast bluestem--------------| 10 | | | | |Gulfdune paspalum--------------| 5 | | | | |Marshhay cordgrass-------------| 5 | | | | |Thin paspalum------------------| 5 | | | | | |
196S
oil Survey of
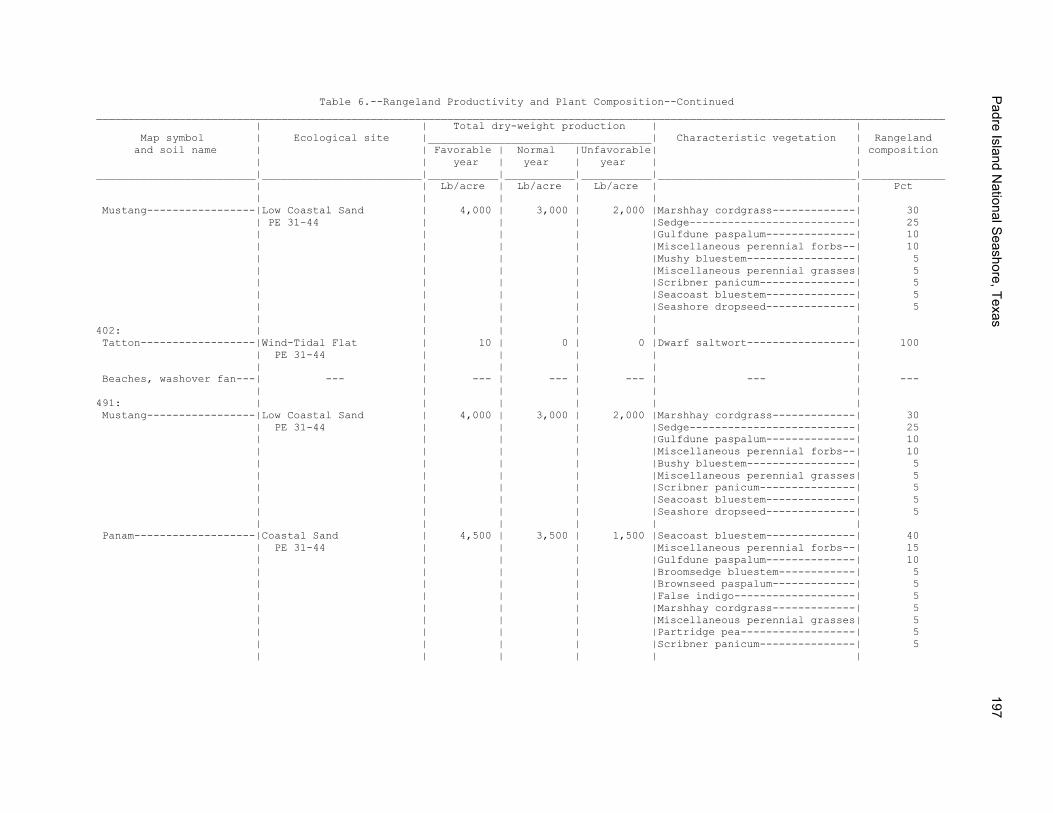
Table 6.--Rangeland Productivity and Plant Composition--Continued _____________________________________________________________________________________________________________________________________ | | Total dry-weight production | | Map symbol | Ecological site |___________________________________| Characteristic vegetation | Rangeland and soil name | | Favorable | Normal |Unfavorable| | composition | | year | year | year | | _________________________|_________________________|___________|___________|___________|_______________________________|_____________ | | Lb/acre | Lb/acre | Lb/acre | | Pct | | | | | | Mustang-----------------|Low Coastal Sand | 4,000 | 3,000 | 2,000 |Marshhay cordgrass-------------| 30 | PE 31-44 | | | |Sedge--------------------------| 25 | | | | |Gulfdune paspalum--------------| 10 | | | | |Miscellaneous perennial forbs--| 10 | | | | |Mushy bluestem-----------------| 5 | | | | |Miscellaneous perennial grasses| 5 | | | | |Scribner panicum---------------| 5 | | | | |Seacoast bluestem--------------| 5 | | | | |Seashore dropseed--------------| 5 | | | | | | 402: | | | | | | Tatton------------------|Wind-Tidal Flat | 10 | 0 | 0 |Dwarf saltwort-----------------| 100 | PE 31-44 | | | | | | | | | | | Beaches, washover fan---| --- | --- | --- | --- | --- | --- | | | | | | 491: | | | | | | Mustang-----------------|Low Coastal Sand | 4,000 | 3,000 | 2,000 |Marshhay cordgrass-------------| 30 | PE 31-44 | | | |Sedge--------------------------| 25 | | | | |Gulfdune paspalum--------------| 10 | | | | |Miscellaneous perennial forbs--| 10 | | | | |Bushy bluestem-----------------| 5 | | | | |Miscellaneous perennial grasses| 5 | | | | |Scribner panicum---------------| 5 | | | | |Seacoast bluestem--------------| 5 | | | | |Seashore dropseed--------------| 5 | | | | | | Panam-------------------|Coastal Sand | 4,500 | 3,500 | 1,500 |Seacoast bluestem--------------| 40 | PE 31-44 | | | |Miscellaneous perennial forbs--| 15 | | | | |Gulfdune paspalum--------------| 10 | | | | |Broomsedge bluestem------------| 5 | | | | |Brownseed paspalum-------------| 5 | | | | |False indigo-------------------| 5 | | | | |Marshhay cordgrass-------------| 5 | | | | |Miscellaneous perennial grasses| 5 | | | | |Partridge pea------------------| 5 | | | | |Scribner panicum---------------| 5 | | | | | |
Padre Island N
ational Seashore, Texas
197
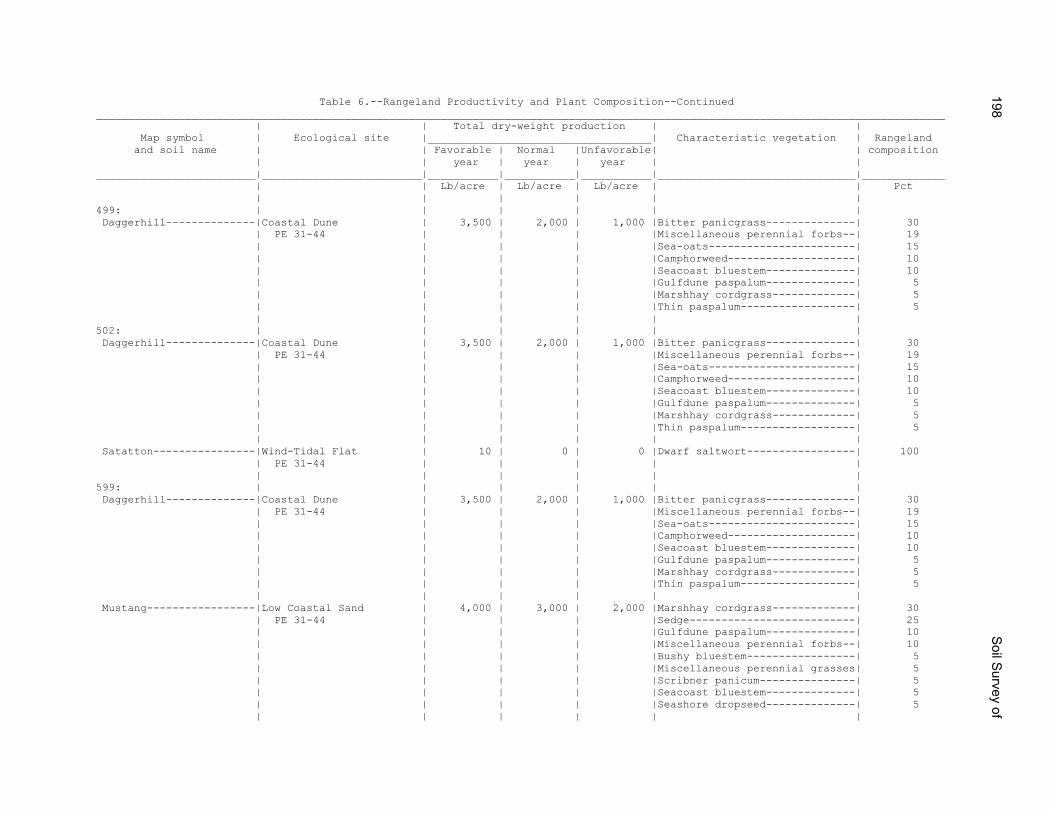
Table 6.--Rangeland Productivity and Plant Composition--Continued _____________________________________________________________________________________________________________________________________ | | Total dry-weight production | | Map symbol | Ecological site |___________________________________| Characteristic vegetation | Rangeland and soil name | | Favorable | Normal |Unfavorable| | composition | | year | year | year | | _________________________|_________________________|___________|___________|___________|_______________________________|_____________ | | Lb/acre | Lb/acre | Lb/acre | | Pct | | | | | | 499: | | | | | | Daggerhill--------------|Coastal Dune | 3,500 | 2,000 | 1,000 |Bitter panicgrass--------------| 30 | PE 31-44 | | | |Miscellaneous perennial forbs--| 19 | | | | |Sea-oats-----------------------| 15 | | | | |Camphorweed--------------------| 10 | | | | |Seacoast bluestem--------------| 10 | | | | |Gulfdune paspalum--------------| 5 | | | | |Marshhay cordgrass-------------| 5 | | | | |Thin paspalum------------------| 5 | | | | | | 502: | | | | | | Daggerhill--------------|Coastal Dune | 3,500 | 2,000 | 1,000 |Bitter panicgrass--------------| 30 | PE 31-44 | | | |Miscellaneous perennial forbs--| 19 | | | | |Sea-oats-----------------------| 15 | | | | |Camphorweed--------------------| 10 | | | | |Seacoast bluestem--------------| 10 | | | | |Gulfdune paspalum--------------| 5 | | | | |Marshhay cordgrass-------------| 5 | | | | |Thin paspalum------------------| 5 | | | | | | Satatton----------------|Wind-Tidal Flat | 10 | 0 | 0 |Dwarf saltwort-----------------| 100 | PE 31-44 | | | | | | | | | | | 599: | | | | | | Daggerhill--------------|Coastal Dune | 3,500 | 2,000 | 1,000 |Bitter panicgrass--------------| 30 | PE 31-44 | | | |Miscellaneous perennial forbs--| 19 | | | | |Sea-oats-----------------------| 15 | | | | |Camphorweed--------------------| 10 | | | | |Seacoast bluestem--------------| 10 | | | | |Gulfdune paspalum--------------| 5 | | | | |Marshhay cordgrass-------------| 5 | | | | |Thin paspalum------------------| 5 | | | | | | Mustang-----------------|Low Coastal Sand | 4,000 | 3,000 | 2,000 |Marshhay cordgrass-------------| 30 | PE 31-44 | | | |Sedge--------------------------| 25 | | | | |Gulfdune paspalum--------------| 10 | | | | |Miscellaneous perennial forbs--| 10 | | | | |Bushy bluestem-----------------| 5 | | | | |Miscellaneous perennial grasses| 5 | | | | |Scribner panicum---------------| 5 | | | | |Seacoast bluestem--------------| 5 | | | | |Seashore dropseed--------------| 5 | | | | | |
198S
oil Survey of
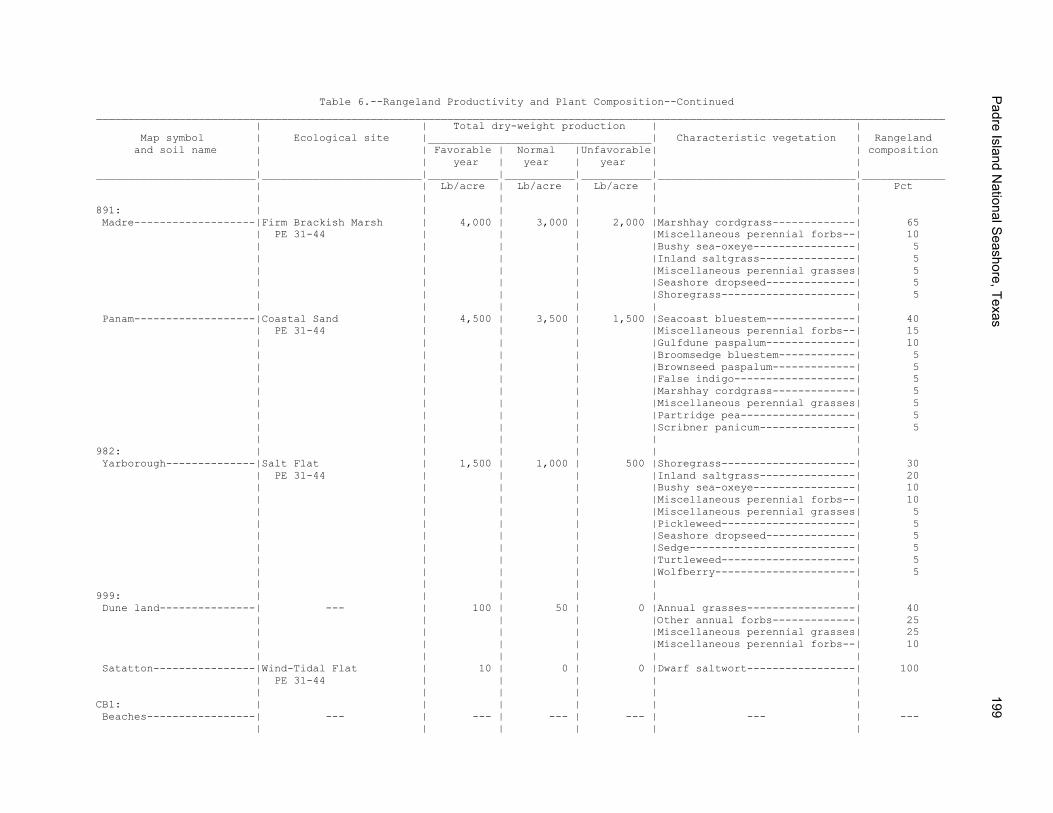
Table 6.--Rangeland Productivity and Plant Composition--Continued _____________________________________________________________________________________________________________________________________ | | Total dry-weight production | | Map symbol | Ecological site |___________________________________| Characteristic vegetation | Rangeland and soil name | | Favorable | Normal |Unfavorable| | composition | | year | year | year | | _________________________|_________________________|___________|___________|___________|_______________________________|_____________ | | Lb/acre | Lb/acre | Lb/acre | | Pct | | | | | | 891: | | | | | | Madre-------------------|Firm Brackish Marsh | 4,000 | 3,000 | 2,000 |Marshhay cordgrass-------------| 65 | PE 31-44 | | | |Miscellaneous perennial forbs--| 10 | | | | |Bushy sea-oxeye----------------| 5 | | | | |Inland saltgrass---------------| 5 | | | | |Miscellaneous perennial grasses| 5 | | | | |Seashore dropseed--------------| 5 | | | | |Shoregrass---------------------| 5 | | | | | | Panam-------------------|Coastal Sand | 4,500 | 3,500 | 1,500 |Seacoast bluestem--------------| 40 | PE 31-44 | | | |Miscellaneous perennial forbs--| 15 | | | | |Gulfdune paspalum--------------| 10 | | | | |Broomsedge bluestem------------| 5 | | | | |Brownseed paspalum-------------| 5 | | | | |False indigo-------------------| 5 | | | | |Marshhay cordgrass-------------| 5 | | | | |Miscellaneous perennial grasses| 5 | | | | |Partridge pea------------------| 5 | | | | |Scribner panicum---------------| 5 | | | | | | 982: | | | | | | Yarborough--------------|Salt Flat | 1,500 | 1,000 | 500 |Shoregrass---------------------| 30 | PE 31-44 | | | |Inland saltgrass---------------| 20 | | | | |Bushy sea-oxeye----------------| 10 | | | | |Miscellaneous perennial forbs--| 10 | | | | |Miscellaneous perennial grasses| 5 | | | | |Pickleweed---------------------| 5 | | | | |Seashore dropseed--------------| 5 | | | | |Sedge--------------------------| 5 | | | | |Turtleweed---------------------| 5 | | | | |Wolfberry----------------------| 5 | | | | | | 999: | | | | | | Dune land---------------| --- | 100 | 50 | 0 |Annual grasses-----------------| 40 | | | | |Other annual forbs-------------| 25 | | | | |Miscellaneous perennial grasses| 25 | | | | |Miscellaneous perennial forbs--| 10 | | | | | | Satatton----------------|Wind-Tidal Flat | 10 | 0 | 0 |Dwarf saltwort-----------------| 100 | PE 31-44 | | | | | | | | | | | CB1: | | | | | | Beaches-----------------| --- | --- | --- | --- | --- | --- | | | | | |
Padre Island N
ational Seashore, Texas
199
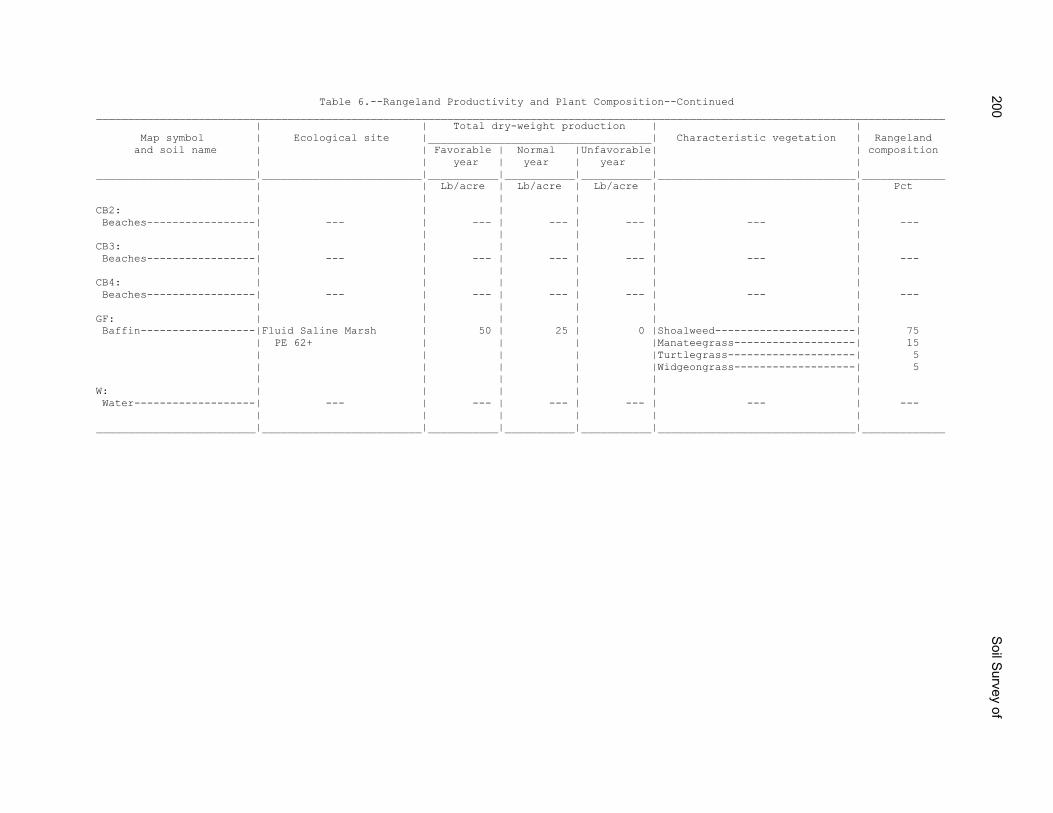
Table 6.--Rangeland Productivity and Plant Composition--Continued _____________________________________________________________________________________________________________________________________ | | Total dry-weight production | | Map symbol | Ecological site |___________________________________| Characteristic vegetation | Rangeland and soil name | | Favorable | Normal |Unfavorable| | composition | | year | year | year | | _________________________|_________________________|___________|___________|___________|_______________________________|_____________ | | Lb/acre | Lb/acre | Lb/acre | | Pct | | | | | | CB2: | | | | | | Beaches-----------------| --- | --- | --- | --- | --- | --- | | | | | | CB3: | | | | | | Beaches-----------------| --- | --- | --- | --- | --- | --- | | | | | | CB4: | | | | | | Beaches-----------------| --- | --- | --- | --- | --- | --- | | | | | | GF: | | | | | | Baffin------------------|Fluid Saline Marsh | 50 | 25 | 0 |Shoalweed----------------------| 75 | PE 62+ | | | |Manateegrass-------------------| 15 | | | | |Turtlegrass--------------------| 5 | | | | |Widgeongrass-------------------| 5 | | | | | | W: | | | | | | Water-------------------| --- | --- | --- | --- | --- | --- | | | | | | _________________________|_________________________|___________|___________|___________|_______________________________|_____________
200S
oil Survey of
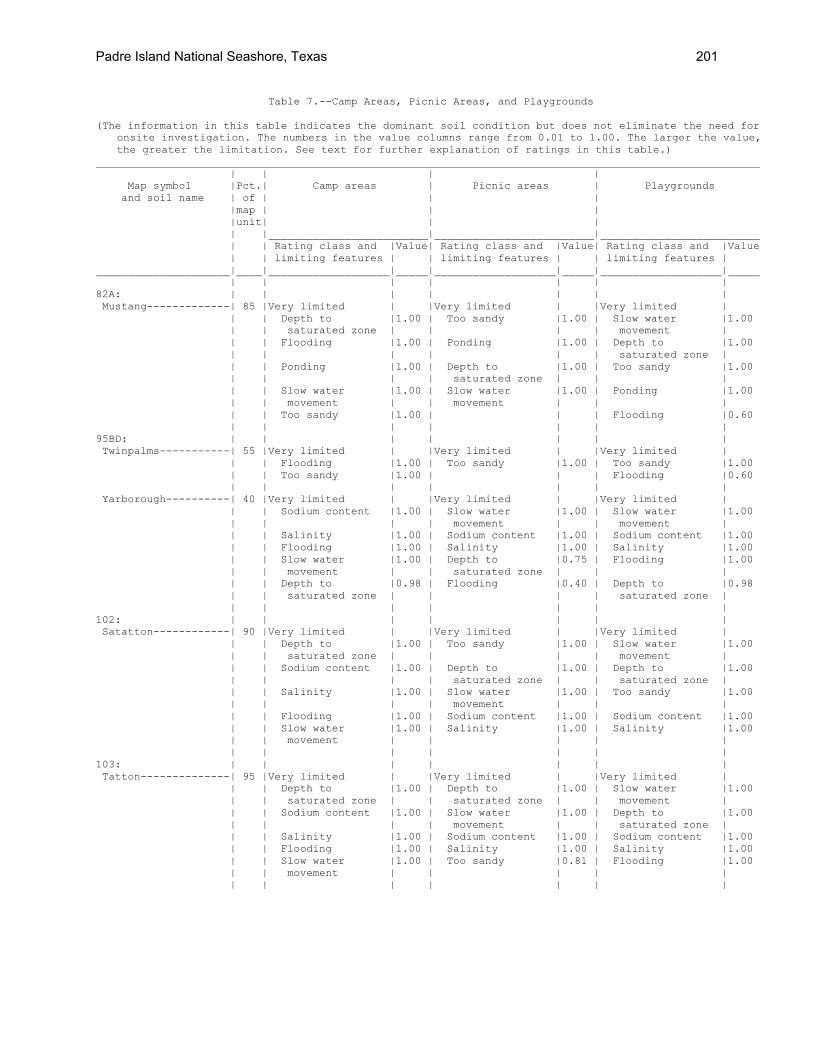
Table 7.--Camp Areas, Picnic Areas, and Playgrounds (The information in this table indicates the dominant soil condition but does not eliminate the need for
onsite investigation. The numbers in the value columns range from 0.01 to 1.00. The larger the value, the greater the limitation. See text for further explanation of ratings in this table.)
________________________________________________________________________________________________________ | | | | Map symbol |Pct.| Camp areas | Picnic areas | Playgrounds and soil name | of | | | |map | | | |unit| | | | |_________________________|_________________________|_________________________ | | Rating class and |Value| Rating class and |Value| Rating class and |Value | | limiting features | | limiting features | | limiting features | _____________________|____|___________________|_____|___________________|_____|___________________|_____ | | | | | | | 82A: | | | | | | | Mustang-------------| 85 |Very limited | |Very limited | |Very limited | | | Depth to |1.00 | Too sandy |1.00 | Slow water |1.00 | | saturated zone | | | | movement | | | Flooding |1.00 | Ponding |1.00 | Depth to |1.00 | | | | | | saturated zone | | | Ponding |1.00 | Depth to |1.00 | Too sandy |1.00 | | | | saturated zone | | | | | Slow water |1.00 | Slow water |1.00 | Ponding |1.00 | | movement | | movement | | | | | Too sandy |1.00 | | | Flooding |0.60 | | | | | | | 95BD: | | | | | | | Twinpalms-----------| 55 |Very limited | |Very limited | |Very limited | | | Flooding |1.00 | Too sandy |1.00 | Too sandy |1.00 | | Too sandy |1.00 | | | Flooding |0.60 | | | | | | | Yarborough----------| 40 |Very limited | |Very limited | |Very limited | | | Sodium content |1.00 | Slow water |1.00 | Slow water |1.00 | | | | movement | | movement | | | Salinity |1.00 | Sodium content |1.00 | Sodium content |1.00 | | Flooding |1.00 | Salinity |1.00 | Salinity |1.00 | | Slow water |1.00 | Depth to |0.75 | Flooding |1.00 | | movement | | saturated zone | | | | | Depth to |0.98 | Flooding |0.40 | Depth to |0.98 | | saturated zone | | | | saturated zone | | | | | | | | 102: | | | | | | | Satatton------------| 90 |Very limited | |Very limited | |Very limited | | | Depth to |1.00 | Too sandy |1.00 | Slow water |1.00 | | saturated zone | | | | movement | | | Sodium content |1.00 | Depth to |1.00 | Depth to |1.00 | | | | saturated zone | | saturated zone | | | Salinity |1.00 | Slow water |1.00 | Too sandy |1.00 | | | | movement | | | | | Flooding |1.00 | Sodium content |1.00 | Sodium content |1.00 | | Slow water |1.00 | Salinity |1.00 | Salinity |1.00 | | movement | | | | | | | | | | | | 103: | | | | | | | Tatton--------------| 95 |Very limited | |Very limited | |Very limited | | | Depth to |1.00 | Depth to |1.00 | Slow water |1.00 | | saturated zone | | saturated zone | | movement | | | Sodium content |1.00 | Slow water |1.00 | Depth to |1.00 | | | | movement | | saturated zone | | | Salinity |1.00 | Sodium content |1.00 | Sodium content |1.00 | | Flooding |1.00 | Salinity |1.00 | Salinity |1.00 | | Slow water |1.00 | Too sandy |0.81 | Flooding |1.00 | | movement | | | | | | | | | | | |
Padre Island National Seashore, Texas 201
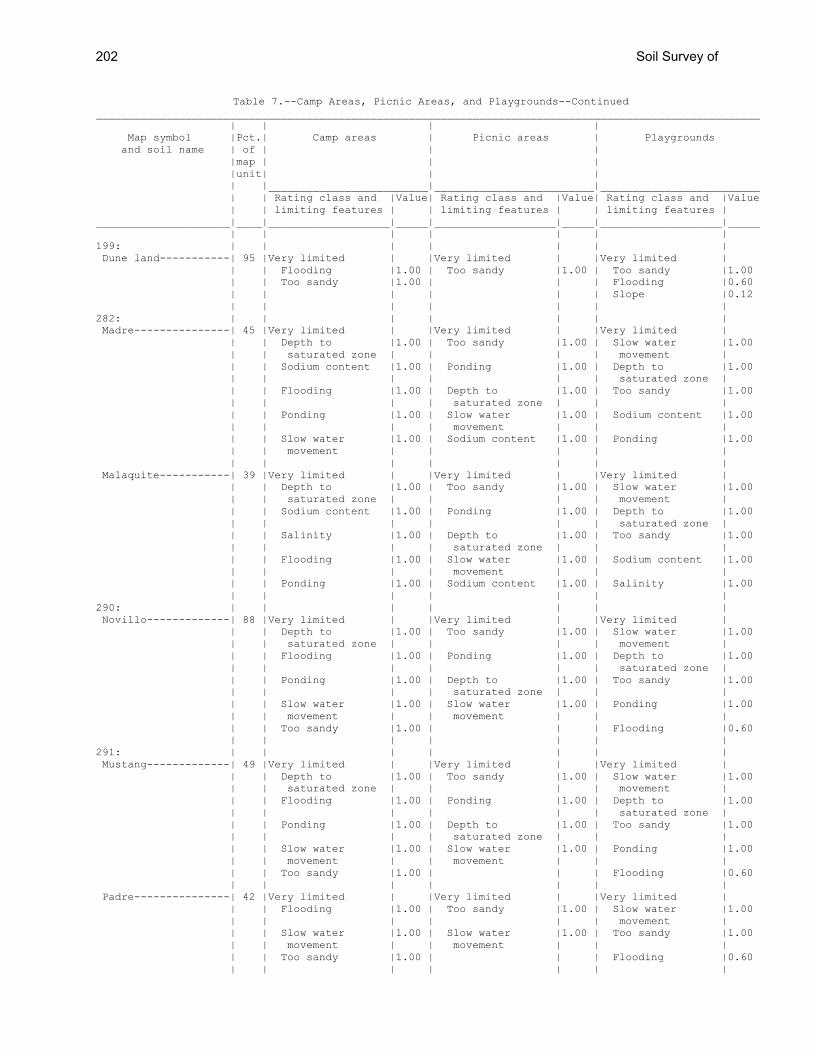
Table 7.--Camp Areas, Picnic Areas, and Playgrounds--Continued ________________________________________________________________________________________________________ | | | | Map symbol |Pct.| Camp areas | Picnic areas | Playgrounds and soil name | of | | | |map | | | |unit| | | | |_________________________|_________________________|_________________________ | | Rating class and |Value| Rating class and |Value| Rating class and |Value | | limiting features | | limiting features | | limiting features | _____________________|____|___________________|_____|___________________|_____|___________________|_____ | | | | | | | 199: | | | | | | | Dune land-----------| 95 |Very limited | |Very limited | |Very limited | | | Flooding |1.00 | Too sandy |1.00 | Too sandy |1.00 | | Too sandy |1.00 | | | Flooding |0.60 | | | | | | Slope |0.12 | | | | | | | 282: | | | | | | | Madre---------------| 45 |Very limited | |Very limited | |Very limited | | | Depth to |1.00 | Too sandy |1.00 | Slow water |1.00 | | saturated zone | | | | movement | | | Sodium content |1.00 | Ponding |1.00 | Depth to |1.00 | | | | | | saturated zone | | | Flooding |1.00 | Depth to |1.00 | Too sandy |1.00 | | | | saturated zone | | | | | Ponding |1.00 | Slow water |1.00 | Sodium content |1.00 | | | | movement | | | | | Slow water |1.00 | Sodium content |1.00 | Ponding |1.00 | | movement | | | | | | | | | | | | Malaquite-----------| 39 |Very limited | |Very limited | |Very limited | | | Depth to |1.00 | Too sandy |1.00 | Slow water |1.00 | | saturated zone | | | | movement | | | Sodium content |1.00 | Ponding |1.00 | Depth to |1.00 | | | | | | saturated zone | | | Salinity |1.00 | Depth to |1.00 | Too sandy |1.00 | | | | saturated zone | | | | | Flooding |1.00 | Slow water |1.00 | Sodium content |1.00 | | | | movement | | | | | Ponding |1.00 | Sodium content |1.00 | Salinity |1.00 | | | | | | | 290: | | | | | | | Novillo-------------| 88 |Very limited | |Very limited | |Very limited | | | Depth to |1.00 | Too sandy |1.00 | Slow water |1.00 | | saturated zone | | | | movement | | | Flooding |1.00 | Ponding |1.00 | Depth to |1.00 | | | | | | saturated zone | | | Ponding |1.00 | Depth to |1.00 | Too sandy |1.00 | | | | saturated zone | | | | | Slow water |1.00 | Slow water |1.00 | Ponding |1.00 | | movement | | movement | | | | | Too sandy |1.00 | | | Flooding |0.60 | | | | | | | 291: | | | | | | | Mustang-------------| 49 |Very limited | |Very limited | |Very limited | | | Depth to |1.00 | Too sandy |1.00 | Slow water |1.00 | | saturated zone | | | | movement | | | Flooding |1.00 | Ponding |1.00 | Depth to |1.00 | | | | | | saturated zone | | | Ponding |1.00 | Depth to |1.00 | Too sandy |1.00 | | | | saturated zone | | | | | Slow water |1.00 | Slow water |1.00 | Ponding |1.00 | | movement | | movement | | | | | Too sandy |1.00 | | | Flooding |0.60 | | | | | | | Padre---------------| 42 |Very limited | |Very limited | |Very limited | | | Flooding |1.00 | Too sandy |1.00 | Slow water |1.00 | | | | | | movement | | | Slow water |1.00 | Slow water |1.00 | Too sandy |1.00 | | movement | | movement | | | | | Too sandy |1.00 | | | Flooding |0.60 | | | | | | |
202 Soil Survey of
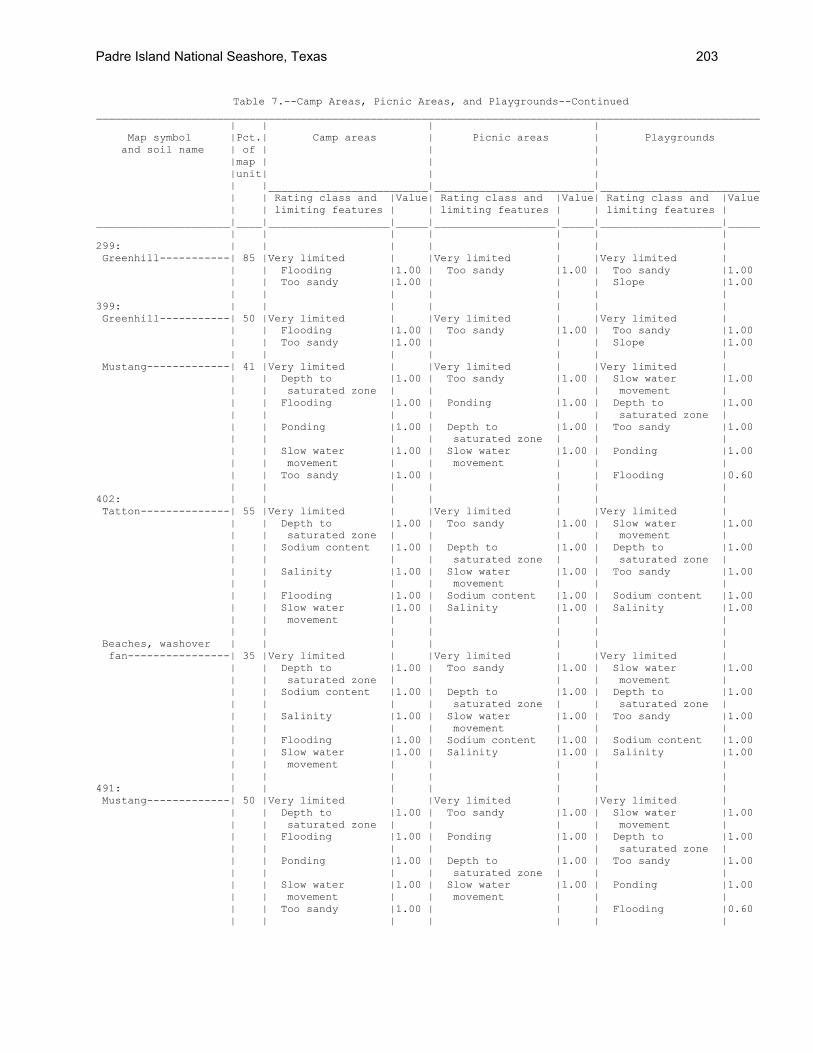
Table 7.--Camp Areas, Picnic Areas, and Playgrounds--Continued ________________________________________________________________________________________________________ | | | | Map symbol |Pct.| Camp areas | Picnic areas | Playgrounds and soil name | of | | | |map | | | |unit| | | | |_________________________|_________________________|_________________________ | | Rating class and |Value| Rating class and |Value| Rating class and |Value | | limiting features | | limiting features | | limiting features | _____________________|____|___________________|_____|___________________|_____|___________________|_____ | | | | | | | 299: | | | | | | | Greenhill-----------| 85 |Very limited | |Very limited | |Very limited | | | Flooding |1.00 | Too sandy |1.00 | Too sandy |1.00 | | Too sandy |1.00 | | | Slope |1.00 | | | | | | | 399: | | | | | | | Greenhill-----------| 50 |Very limited | |Very limited | |Very limited | | | Flooding |1.00 | Too sandy |1.00 | Too sandy |1.00 | | Too sandy |1.00 | | | Slope |1.00 | | | | | | | Mustang-------------| 41 |Very limited | |Very limited | |Very limited | | | Depth to |1.00 | Too sandy |1.00 | Slow water |1.00 | | saturated zone | | | | movement | | | Flooding |1.00 | Ponding |1.00 | Depth to |1.00 | | | | | | saturated zone | | | Ponding |1.00 | Depth to |1.00 | Too sandy |1.00 | | | | saturated zone | | | | | Slow water |1.00 | Slow water |1.00 | Ponding |1.00 | | movement | | movement | | | | | Too sandy |1.00 | | | Flooding |0.60 | | | | | | | 402: | | | | | | | Tatton--------------| 55 |Very limited | |Very limited | |Very limited | | | Depth to |1.00 | Too sandy |1.00 | Slow water |1.00 | | saturated zone | | | | movement | | | Sodium content |1.00 | Depth to |1.00 | Depth to |1.00 | | | | saturated zone | | saturated zone | | | Salinity |1.00 | Slow water |1.00 | Too sandy |1.00 | | | | movement | | | | | Flooding |1.00 | Sodium content |1.00 | Sodium content |1.00 | | Slow water |1.00 | Salinity |1.00 | Salinity |1.00 | | movement | | | | | | | | | | | | Beaches, washover | | | | | | | fan----------------| 35 |Very limited | |Very limited | |Very limited | | | Depth to |1.00 | Too sandy |1.00 | Slow water |1.00 | | saturated zone | | | | movement | | | Sodium content |1.00 | Depth to |1.00 | Depth to |1.00 | | | | saturated zone | | saturated zone | | | Salinity |1.00 | Slow water |1.00 | Too sandy |1.00 | | | | movement | | | | | Flooding |1.00 | Sodium content |1.00 | Sodium content |1.00 | | Slow water |1.00 | Salinity |1.00 | Salinity |1.00 | | movement | | | | | | | | | | | | 491: | | | | | | | Mustang-------------| 50 |Very limited | |Very limited | |Very limited | | | Depth to |1.00 | Too sandy |1.00 | Slow water |1.00 | | saturated zone | | | | movement | | | Flooding |1.00 | Ponding |1.00 | Depth to |1.00 | | | | | | saturated zone | | | Ponding |1.00 | Depth to |1.00 | Too sandy |1.00 | | | | saturated zone | | | | | Slow water |1.00 | Slow water |1.00 | Ponding |1.00 | | movement | | movement | | | | | Too sandy |1.00 | | | Flooding |0.60 | | | | | | |
Padre Island National Seashore, Texas 203
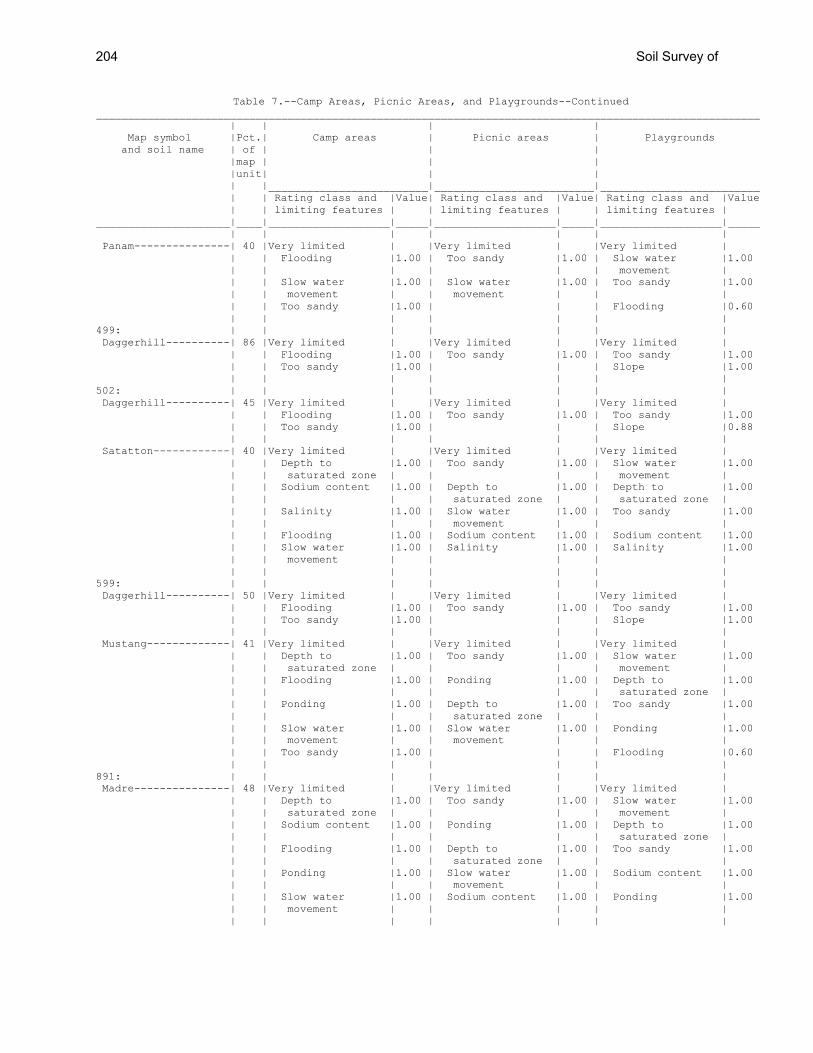
Table 7.--Camp Areas, Picnic Areas, and Playgrounds--Continued ________________________________________________________________________________________________________ | | | | Map symbol |Pct.| Camp areas | Picnic areas | Playgrounds and soil name | of | | | |map | | | |unit| | | | |_________________________|_________________________|_________________________ | | Rating class and |Value| Rating class and |Value| Rating class and |Value | | limiting features | | limiting features | | limiting features | _____________________|____|___________________|_____|___________________|_____|___________________|_____ | | | | | | | Panam---------------| 40 |Very limited | |Very limited | |Very limited | | | Flooding |1.00 | Too sandy |1.00 | Slow water |1.00 | | | | | | movement | | | Slow water |1.00 | Slow water |1.00 | Too sandy |1.00 | | movement | | movement | | | | | Too sandy |1.00 | | | Flooding |0.60 | | | | | | | 499: | | | | | | | Daggerhill----------| 86 |Very limited | |Very limited | |Very limited | | | Flooding |1.00 | Too sandy |1.00 | Too sandy |1.00 | | Too sandy |1.00 | | | Slope |1.00 | | | | | | | 502: | | | | | | | Daggerhill----------| 45 |Very limited | |Very limited | |Very limited | | | Flooding |1.00 | Too sandy |1.00 | Too sandy |1.00 | | Too sandy |1.00 | | | Slope |0.88 | | | | | | | Satatton------------| 40 |Very limited | |Very limited | |Very limited | | | Depth to |1.00 | Too sandy |1.00 | Slow water |1.00 | | saturated zone | | | | movement | | | Sodium content |1.00 | Depth to |1.00 | Depth to |1.00 | | | | saturated zone | | saturated zone | | | Salinity |1.00 | Slow water |1.00 | Too sandy |1.00 | | | | movement | | | | | Flooding |1.00 | Sodium content |1.00 | Sodium content |1.00 | | Slow water |1.00 | Salinity |1.00 | Salinity |1.00 | | movement | | | | | | | | | | | | 599: | | | | | | | Daggerhill----------| 50 |Very limited | |Very limited | |Very limited | | | Flooding |1.00 | Too sandy |1.00 | Too sandy |1.00 | | Too sandy |1.00 | | | Slope |1.00 | | | | | | | Mustang-------------| 41 |Very limited | |Very limited | |Very limited | | | Depth to |1.00 | Too sandy |1.00 | Slow water |1.00 | | saturated zone | | | | movement | | | Flooding |1.00 | Ponding |1.00 | Depth to |1.00 | | | | | | saturated zone | | | Ponding |1.00 | Depth to |1.00 | Too sandy |1.00 | | | | saturated zone | | | | | Slow water |1.00 | Slow water |1.00 | Ponding |1.00 | | movement | | movement | | | | | Too sandy |1.00 | | | Flooding |0.60 | | | | | | | 891: | | | | | | | Madre---------------| 48 |Very limited | |Very limited | |Very limited | | | Depth to |1.00 | Too sandy |1.00 | Slow water |1.00 | | saturated zone | | | | movement | | | Sodium content |1.00 | Ponding |1.00 | Depth to |1.00 | | | | | | saturated zone | | | Flooding |1.00 | Depth to |1.00 | Too sandy |1.00 | | | | saturated zone | | | | | Ponding |1.00 | Slow water |1.00 | Sodium content |1.00 | | | | movement | | | | | Slow water |1.00 | Sodium content |1.00 | Ponding |1.00 | | movement | | | | | | | | | | | |
204 Soil Survey of
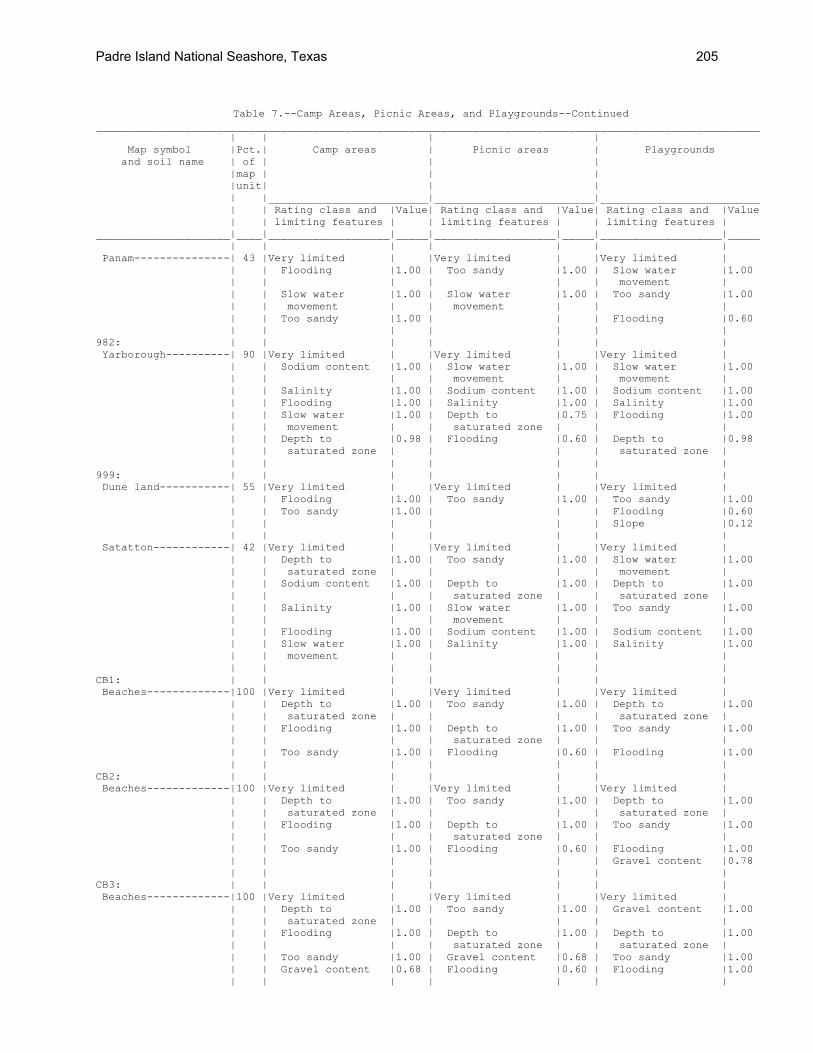
Table 7.--Camp Areas, Picnic Areas, and Playgrounds--Continued
________________________________________________________________________________________________________ | | | | Map symbol |Pct.| Camp areas | Picnic areas | Playgrounds and soil name | of | | | |map | | | |unit| | | | |_________________________|_________________________|_________________________ | | Rating class and |Value| Rating class and |Value| Rating class and |Value | | limiting features | | limiting features | | limiting features | _____________________|____|___________________|_____|___________________|_____|___________________|_____ | | | | | | | Panam---------------| 43 |Very limited | |Very limited | |Very limited | | | Flooding |1.00 | Too sandy |1.00 | Slow water |1.00 | | | | | | movement | | | Slow water |1.00 | Slow water |1.00 | Too sandy |1.00 | | movement | | movement | | | | | Too sandy |1.00 | | | Flooding |0.60 | | | | | | | 982: | | | | | | | Yarborough----------| 90 |Very limited | |Very limited | |Very limited | | | Sodium content |1.00 | Slow water |1.00 | Slow water |1.00 | | | | movement | | movement | | | Salinity |1.00 | Sodium content |1.00 | Sodium content |1.00 | | Flooding |1.00 | Salinity |1.00 | Salinity |1.00 | | Slow water |1.00 | Depth to |0.75 | Flooding |1.00 | | movement | | saturated zone | | | | | Depth to |0.98 | Flooding |0.60 | Depth to |0.98 | | saturated zone | | | | saturated zone | | | | | | | | 999: | | | | | | | Dune land-----------| 55 |Very limited | |Very limited | |Very limited | | | Flooding |1.00 | Too sandy |1.00 | Too sandy |1.00 | | Too sandy |1.00 | | | Flooding |0.60 | | | | | | Slope |0.12 | | | | | | | Satatton------------| 42 |Very limited | |Very limited | |Very limited | | | Depth to |1.00 | Too sandy |1.00 | Slow water |1.00 | | saturated zone | | | | movement | | | Sodium content |1.00 | Depth to |1.00 | Depth to |1.00 | | | | saturated zone | | saturated zone | | | Salinity |1.00 | Slow water |1.00 | Too sandy |1.00 | | | | movement | | | | | Flooding |1.00 | Sodium content |1.00 | Sodium content |1.00 | | Slow water |1.00 | Salinity |1.00 | Salinity |1.00 | | movement | | | | | | | | | | | | CB1: | | | | | | | Beaches-------------|100 |Very limited | |Very limited | |Very limited | | | Depth to |1.00 | Too sandy |1.00 | Depth to |1.00 | | saturated zone | | | | saturated zone | | | Flooding |1.00 | Depth to |1.00 | Too sandy |1.00 | | | | saturated zone | | | | | Too sandy |1.00 | Flooding |0.60 | Flooding |1.00 | | | | | | | CB2: | | | | | | | Beaches-------------|100 |Very limited | |Very limited | |Very limited | | | Depth to |1.00 | Too sandy |1.00 | Depth to |1.00 | | saturated zone | | | | saturated zone | | | Flooding |1.00 | Depth to |1.00 | Too sandy |1.00 | | | | saturated zone | | | | | Too sandy |1.00 | Flooding |0.60 | Flooding |1.00 | | | | | | Gravel content |0.78 | | | | | | | CB3: | | | | | | | Beaches-------------|100 |Very limited | |Very limited | |Very limited | | | Depth to |1.00 | Too sandy |1.00 | Gravel content |1.00 | | saturated zone | | | | | | | Flooding |1.00 | Depth to |1.00 | Depth to |1.00 | | | | saturated zone | | saturated zone | | | Too sandy |1.00 | Gravel content |0.68 | Too sandy |1.00 | | Gravel content |0.68 | Flooding |0.60 | Flooding |1.00 | | | | | | |
Padre Island National Seashore, Texas 205
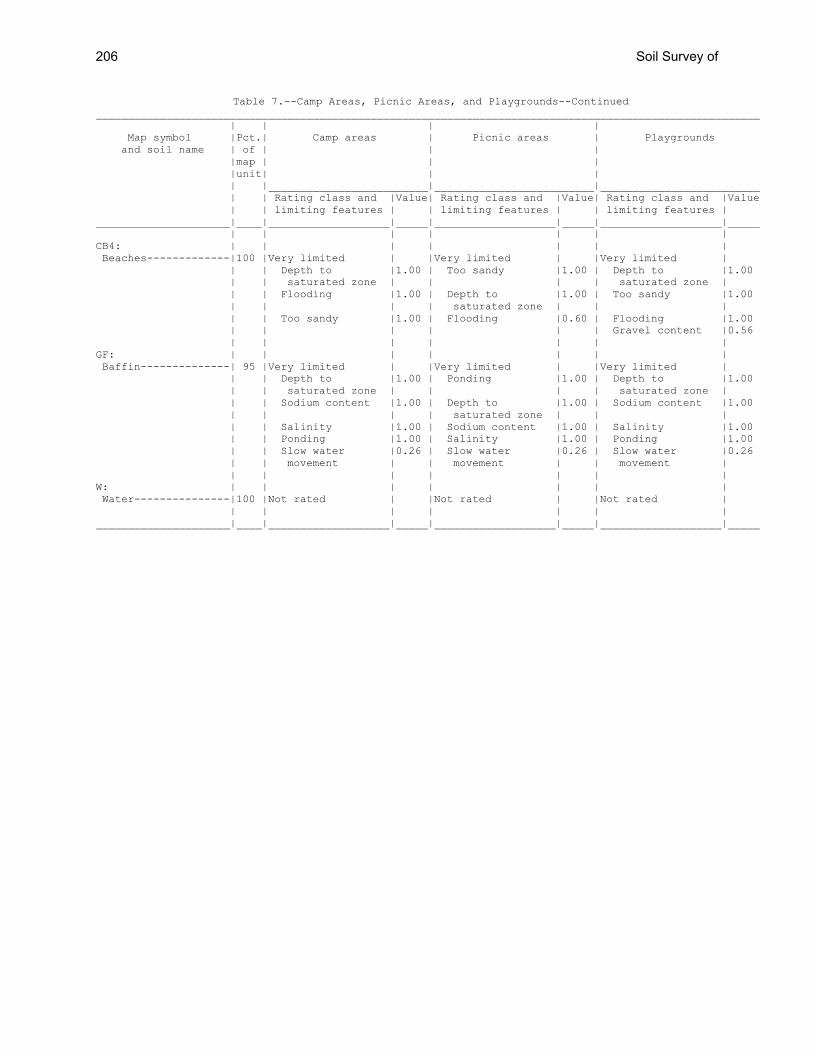
Table 7.--Camp Areas, Picnic Areas, and Playgrounds--Continued ________________________________________________________________________________________________________ | | | | Map symbol |Pct.| Camp areas | Picnic areas | Playgrounds and soil name | of | | | |map | | | |unit| | | | |_________________________|_________________________|_________________________ | | Rating class and |Value| Rating class and |Value| Rating class and |Value | | limiting features | | limiting features | | limiting features | _____________________|____|___________________|_____|___________________|_____|___________________|_____ | | | | | | | CB4: | | | | | | | Beaches-------------|100 |Very limited | |Very limited | |Very limited | | | Depth to |1.00 | Too sandy |1.00 | Depth to |1.00 | | saturated zone | | | | saturated zone | | | Flooding |1.00 | Depth to |1.00 | Too sandy |1.00 | | | | saturated zone | | | | | Too sandy |1.00 | Flooding |0.60 | Flooding |1.00 | | | | | | Gravel content |0.56 | | | | | | | GF: | | | | | | | Baffin--------------| 95 |Very limited | |Very limited | |Very limited | | | Depth to |1.00 | Ponding |1.00 | Depth to |1.00 | | saturated zone | | | | saturated zone | | | Sodium content |1.00 | Depth to |1.00 | Sodium content |1.00 | | | | saturated zone | | | | | Salinity |1.00 | Sodium content |1.00 | Salinity |1.00 | | Ponding |1.00 | Salinity |1.00 | Ponding |1.00 | | Slow water |0.26 | Slow water |0.26 | Slow water |0.26 | | movement | | movement | | movement | | | | | | | | W: | | | | | | | Water---------------|100 |Not rated | |Not rated | |Not rated | | | | | | | | _____________________|____|___________________|_____|___________________|_____|___________________|_____
206 Soil Survey of
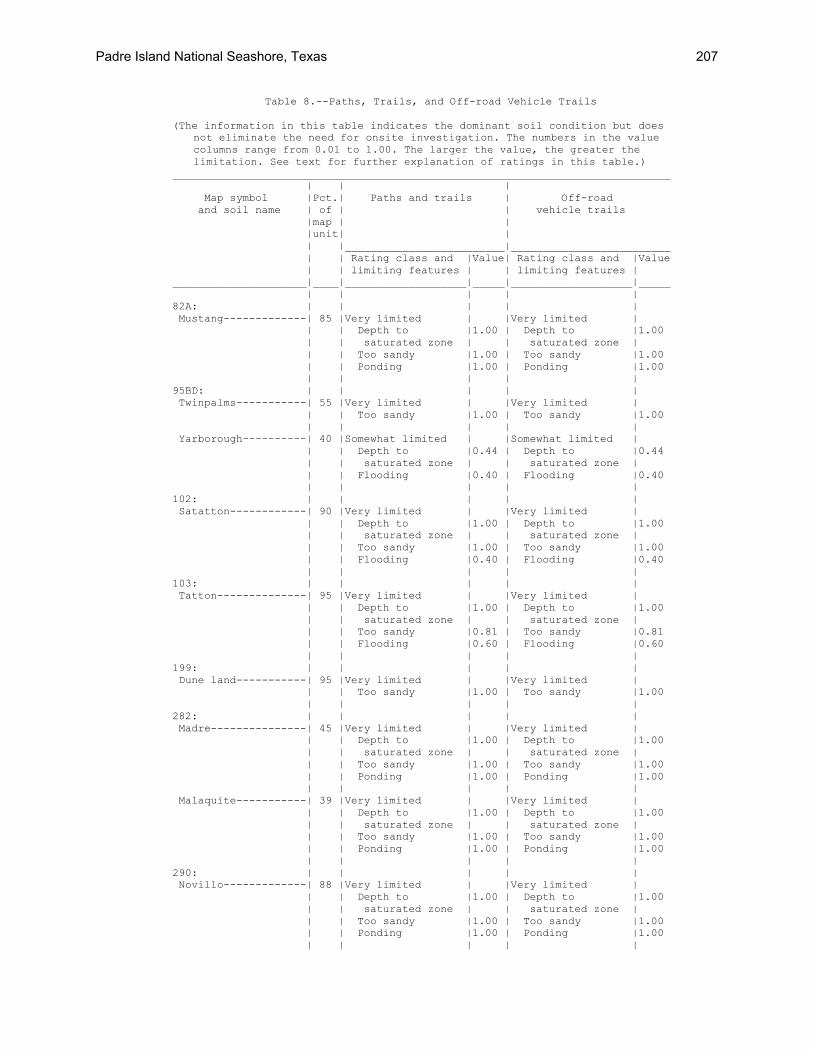
Table 8.--Paths, Trails, and Off-road Vehicle Trails (The information in this table indicates the dominant soil condition but does
not eliminate the need for onsite investigation. The numbers in the value columns range from 0.01 to 1.00. The larger the value, the greater the limitation. See text for further explanation of ratings in this table.)
______________________________________________________________________________ | | | Map symbol |Pct.| Paths and trails | Off-road and soil name | of | | vehicle trails |map | | |unit| | | |_________________________|_________________________ | | Rating class and |Value| Rating class and |Value | | limiting features | | limiting features | _____________________|____|___________________|_____|___________________|_____ | | | | | 82A: | | | | | Mustang-------------| 85 |Very limited | |Very limited | | | Depth to |1.00 | Depth to |1.00 | | saturated zone | | saturated zone | | | Too sandy |1.00 | Too sandy |1.00 | | Ponding |1.00 | Ponding |1.00 | | | | | 95BD: | | | | | Twinpalms-----------| 55 |Very limited | |Very limited | | | Too sandy |1.00 | Too sandy |1.00 | | | | | Yarborough----------| 40 |Somewhat limited | |Somewhat limited | | | Depth to |0.44 | Depth to |0.44 | | saturated zone | | saturated zone | | | Flooding |0.40 | Flooding |0.40 | | | | | 102: | | | | | Satatton------------| 90 |Very limited | |Very limited | | | Depth to |1.00 | Depth to |1.00 | | saturated zone | | saturated zone | | | Too sandy |1.00 | Too sandy |1.00 | | Flooding |0.40 | Flooding |0.40 | | | | | 103: | | | | | Tatton--------------| 95 |Very limited | |Very limited | | | Depth to |1.00 | Depth to |1.00 | | saturated zone | | saturated zone | | | Too sandy |0.81 | Too sandy |0.81 | | Flooding |0.60 | Flooding |0.60 | | | | | 199: | | | | | Dune land-----------| 95 |Very limited | |Very limited | | | Too sandy |1.00 | Too sandy |1.00 | | | | | 282: | | | | | Madre---------------| 45 |Very limited | |Very limited | | | Depth to |1.00 | Depth to |1.00 | | saturated zone | | saturated zone | | | Too sandy |1.00 | Too sandy |1.00 | | Ponding |1.00 | Ponding |1.00 | | | | | Malaquite-----------| 39 |Very limited | |Very limited | | | Depth to |1.00 | Depth to |1.00 | | saturated zone | | saturated zone | | | Too sandy |1.00 | Too sandy |1.00 | | Ponding |1.00 | Ponding |1.00 | | | | | 290: | | | | | Novillo-------------| 88 |Very limited | |Very limited | | | Depth to |1.00 | Depth to |1.00 | | saturated zone | | saturated zone | | | Too sandy |1.00 | Too sandy |1.00 | | Ponding |1.00 | Ponding |1.00 | | | | |
Padre Island National Seashore, Texas 207
Table 8.--Paths, Trails, and Off-road Vehicle Trails--Continued
______________________________________________________________________________ | | | Map symbol |Pct.| Paths and trails | Off-road and soil name | of | | vehicle trails |map | | |unit| | | |_________________________|_________________________ | | Rating class and |Value| Rating class and |Value | | limiting features | | limiting features | _____________________|____|___________________|_____|___________________|_____ | | | | | 291: | | | | | Mustang-------------| 49 |Very limited | |Very limited | | | Depth to |1.00 | Depth to |1.00 | | saturated zone | | saturated zone | | | Too sandy |1.00 | Too sandy |1.00 | | Ponding |1.00 | Ponding |1.00 | | | | | Padre---------------| 42 |Very limited | |Very limited | | | Too sandy |1.00 | Too sandy |1.00 | | | | | 299: | | | | | Greenhill-----------| 85 |Very limited | |Very limited | | | Too sandy |1.00 | Too sandy |1.00 | | | | | 399: | | | | | Greenhill-----------| 50 |Very limited | |Very limited | | | Too sandy |1.00 | Too sandy |1.00 | | | | | Mustang-------------| 41 |Very limited | |Very limited | | | Depth to |1.00 | Depth to |1.00 | | saturated zone | | saturated zone | | | Too sandy |1.00 | Too sandy |1.00 | | Ponding |1.00 | Ponding |1.00 | | | | | 402: | | | | | Tatton--------------| 55 |Very limited | |Very limited | | | Depth to |1.00 | Depth to |1.00 | | saturated zone | | saturated zone | | | Too sandy |1.00 | Too sandy |1.00 | | Flooding |0.60 | Flooding |0.60 Beaches, washover | | | | | fan----------------| 35 |Very limited | |Very limited | | | Depth to |1.00 | Depth to |1.00 | | saturated zone | | saturated zone | | | Too sandy |1.00 | Too sandy |1.00 | | Flooding |0.60 | Flooding |0.60 | | | | | 491: | | | | | Mustang-------------| 50 |Very limited | |Very limited | | | Depth to |1.00 | Depth to |1.00 | | saturated zone | | saturated zone | | | Too sandy |1.00 | Too sandy |1.00 | | Ponding |1.00 | Ponding |1.00 | | | | | Panam---------------| 40 |Very limited | |Very limited | | | Too sandy |1.00 | Too sandy |1.00 | | | | | 499: | | | | | Daggerhill----------| 86 |Very limited | |Very limited | | | Too sandy |1.00 | Too sandy |1.00 | | | | | 502: | | | | | Daggerhill----------| 45 |Very limited | |Very limited | | | Too sandy |1.00 | Too sandy |1.00 | | | | |
208 Soil Survey of
Table 8.--Paths, Trails, and Off-road Vehicle Trails--Continued ______________________________________________________________________________ | | | Map symbol |Pct.| Paths and trails | Off-road and soil name | of | | vehicle trails |map | | |unit| | | |_________________________|_________________________ | | Rating class and |Value| Rating class and |Value | | limiting features | | limiting features | _____________________|____|___________________|_____|___________________|_____ | | | | | Satatton------------| 40 |Very limited | |Very limited | | | Depth to |1.00 | Depth to |1.00 | | saturated zone | | saturated zone | | | Too sandy |1.00 | Too sandy |1.00 | | Flooding |0.40 | Flooding |0.40 | | | | | 599: | | | | | Daggerhill----------| 50 |Very limited | |Very limited | | | Too sandy |1.00 | Too sandy |1.00 | | | | | Mustang-------------| 41 |Very limited | |Very limited | | | Depth to |1.00 | Depth to |1.00 | | saturated zone | | saturated zone | | | Too sandy |1.00 | Too sandy |1.00 | | Ponding |1.00 | Ponding |1.00 | | | | | 891: | | | | | Madre---------------| 48 |Very limited | |Very limited | | | Depth to |1.00 | Depth to |1.00 | | saturated zone | | saturated zone | | | Too sandy |1.00 | Too sandy |1.00 | | Ponding |1.00 | Ponding |1.00 | | | | | Panam---------------| 43 |Very limited | |Very limited | | | Too sandy |1.00 | Too sandy |1.00 | | | | | 982: | | | | | Yarborough----------| 90 |Somewhat limited | |Somewhat limited | | | Flooding |0.60 | Flooding |0.60 | | Depth to |0.44 | Depth to |0.44 | | saturated zone | | saturated zone | | | | | | 999: | | | | | Dune land-----------| 55 |Very limited | |Very limited | | | Too sandy |1.00 | Too sandy |1.00 | | | | | Satatton------------| 42 |Very limited | |Very limited | | | Depth to |1.00 | Depth to |1.00 | | saturated zone | | saturated zone | | | Too sandy |1.00 | Too sandy |1.00 | | Flooding |0.40 | Flooding |0.40 | | | | | CB1: | | | | | Beaches-------------|100 |Very limited | |Very limited | | | Depth to |1.00 | Depth to |1.00 | | saturated zone | | saturated zone | | | Too sandy |1.00 | Too sandy |1.00 | | Flooding |0.60 | Flooding |0.60 | | | | | CB2: | | | | | Beaches-------------|100 |Very limited | |Very limited | | | Depth to |1.00 | Depth to |1.00 | | saturated zone | | saturated zone | | | Too sandy |1.00 | Too sandy |1.00 | | Flooding |0.60 | Flooding |0.60 | | | | |
Padre Island National Seashore, Texas 209
Table 8.--Paths, Trails, and Off-road Vehicle Trails--Continued ______________________________________________________________________________ | | | Map symbol |Pct.| Paths and trails | Off-road and soil name | of | | vehicle trails |map | | |unit| | | |_________________________|_________________________ | | Rating class and |Value| Rating class and |Value | | limiting features | | limiting features | _____________________|____|___________________|_____|___________________|_____ | | | | | CB3: | | | | | Beaches-------------|100 |Very limited | |Very limited | | | Depth to |1.00 | Depth to |1.00 | | saturated zone | | saturated zone | | | Too sandy |1.00 | Too sandy |1.00 | | Flooding |0.60 | Flooding |0.60 | | | | | CB4: | | | | | Beaches-------------|100 |Very limited | |Very limited | | | Depth to |1.00 | Depth to |1.00 | | saturated zone | | saturated zone | | | Too sandy |1.00 | Too sandy |1.00 | | Flooding |0.60 | Flooding |0.60 | | | | | GF: | | | | | Baffin--------------| 95 |Very limited | |Very limited | | | Depth to |1.00 | Depth to |1.00 | | saturated zone | | saturated zone | | | Ponding |1.00 | Ponding |1.00 | | | | | W: | | | | | Water---------------|100 |Not rated | |Not rated | | | | | | _____________________|____|___________________|_____|___________________|_____
210 Soil Survey of
Table 9.--Burrowing Mammals and Reptiles, and Saline Water Wetland Plants (The information in this table indicates the dominant soil condition but does
not eliminate the need for onsite investigation. The numbers in the value columns range from 0.01 to 1.00. The larger the value, the greater the limitation. See text for further explanation of ratings in this table.)
_________________________________________________________________________ | | Map symbol | Burrowing mammals and | Saline water wetland and soil name | reptiles | plants |_________________________|_________________________ | Rating class and |Value| Rating class and |Value | limiting features | | limiting features | _____________________|___________________|_____|___________________|_____ | | | | 82A: | | | | Mustang-------------|Very limited | |Very limited | | Ponding |1.00 | Low salt |1.00 | Wetness |1.00 | Low sodium |1.00 | Flooding |1.00 | Too sandy |0.50 | Too Sandy |0.50 | | | | | | 95BD: | | | | Twinpalms-----------|Very limited | |Very limited | | Flooding |1.00 | Too dry |1.00 | Too Sandy |0.50 | Low salt |1.00 | | | Low sodium |1.00 | | | Too sandy |0.50 | | | | | | | | Yarborough----------|Very limited | |Somewhat limited | | Flooding |1.00 | Too dry |0.14 | Wetness |0.99 | | | | | | 102: | | | | Satatton------------|Very limited | |Somewhat limited | | Wetness |1.00 | Too sandy |0.50 | Flooding |1.00 | | | Too Sandy |0.50 | | | | | | 103: | | | | Tatton--------------|Very limited | |Not limited | | Wetness |1.00 | | | Flooding |1.00 | | | | | | 199: | | | | Dune land-----------|Very limited | |Very limited | | Flooding |1.00 | Too dry |1.00 | Too Sandy |0.50 | Low salt |1.00 | | | Low sodium |1.00 | | | Too sandy |0.50 | | | | 282: | | | | Madre---------------|Very limited | |Very limited | | Ponding |1.00 | Low salt |1.00 | Wetness |1.00 | Low sodium |0.93 | Flooding |1.00 | Too sandy |0.50 | Too Sandy |0.50 | | | | | | Malaquite-----------|Very limited | |Somewhat limited | | Ponding |1.00 | Too sandy |0.50 | Wetness |1.00 | Low sodium |0.01 | Flooding |1.00 | | | Too Sandy |0.50 | | | | | | 290: | | | | Novillo-------------|Very limited | |Very limited | | Ponding |1.00 | Low salt |1.00 | Wetness |1.00 | Low sodium |1.00 | Flooding |1.00 | Ponding |0.50 | Too Sandy |0.50 | | | | | |
Padre Island National Seashore, Texas 211
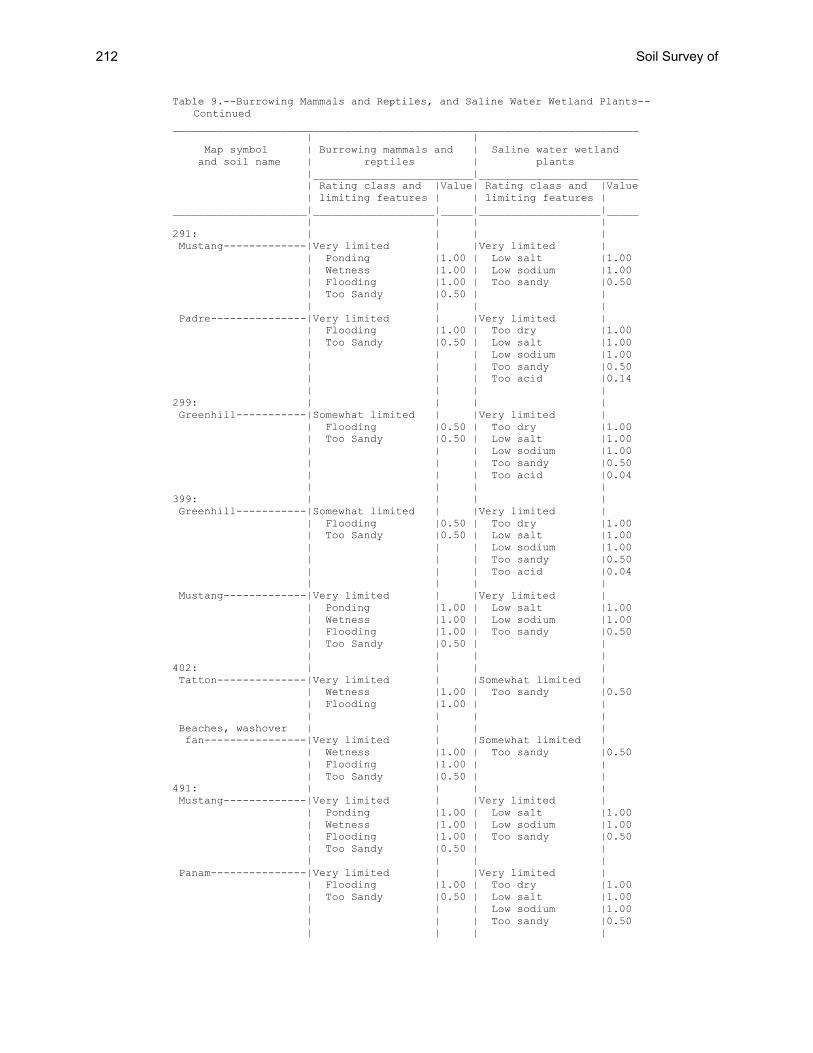
Table 9.--Burrowing Mammals and Reptiles, and Saline Water Wetland Plants--Continued
_________________________________________________________________________ | | Map symbol | Burrowing mammals and | Saline water wetland and soil name | reptiles | plants |_________________________|_________________________ | Rating class and |Value| Rating class and |Value | limiting features | | limiting features | _____________________|___________________|_____|___________________|_____ | | | | 291: | | | | Mustang-------------|Very limited | |Very limited | | Ponding |1.00 | Low salt |1.00 | Wetness |1.00 | Low sodium |1.00 | Flooding |1.00 | Too sandy |0.50 | Too Sandy |0.50 | | | | | | Padre---------------|Very limited | |Very limited | | Flooding |1.00 | Too dry |1.00 | Too Sandy |0.50 | Low salt |1.00 | | | Low sodium |1.00 | | | Too sandy |0.50 | | | Too acid |0.14 | | | | 299: | | | | Greenhill-----------|Somewhat limited | |Very limited | | Flooding |0.50 | Too dry |1.00 | Too Sandy |0.50 | Low salt |1.00 | | | Low sodium |1.00 | | | Too sandy |0.50 | | | Too acid |0.04 | | | | 399: | | | | Greenhill-----------|Somewhat limited | |Very limited | | Flooding |0.50 | Too dry |1.00 | Too Sandy |0.50 | Low salt |1.00 | | | Low sodium |1.00 | | | Too sandy |0.50 | | | Too acid |0.04 | | | | Mustang-------------|Very limited | |Very limited | | Ponding |1.00 | Low salt |1.00 | Wetness |1.00 | Low sodium |1.00 | Flooding |1.00 | Too sandy |0.50 | Too Sandy |0.50 | | | | | | 402: | | | | Tatton--------------|Very limited | |Somewhat limited | | Wetness |1.00 | Too sandy |0.50 | Flooding |1.00 | | | | | | Beaches, washover | | | | fan----------------|Very limited | |Somewhat limited | | Wetness |1.00 | Too sandy |0.50 | Flooding |1.00 | | | Too Sandy |0.50 | | 491: | | | | Mustang-------------|Very limited | |Very limited | | Ponding |1.00 | Low salt |1.00 | Wetness |1.00 | Low sodium |1.00 | Flooding |1.00 | Too sandy |0.50 | Too Sandy |0.50 | | | | | | Panam---------------|Very limited | |Very limited | | Flooding |1.00 | Too dry |1.00 | Too Sandy |0.50 | Low salt |1.00 | | | Low sodium |1.00 | | | Too sandy |0.50 | | | |
212 Soil Survey of
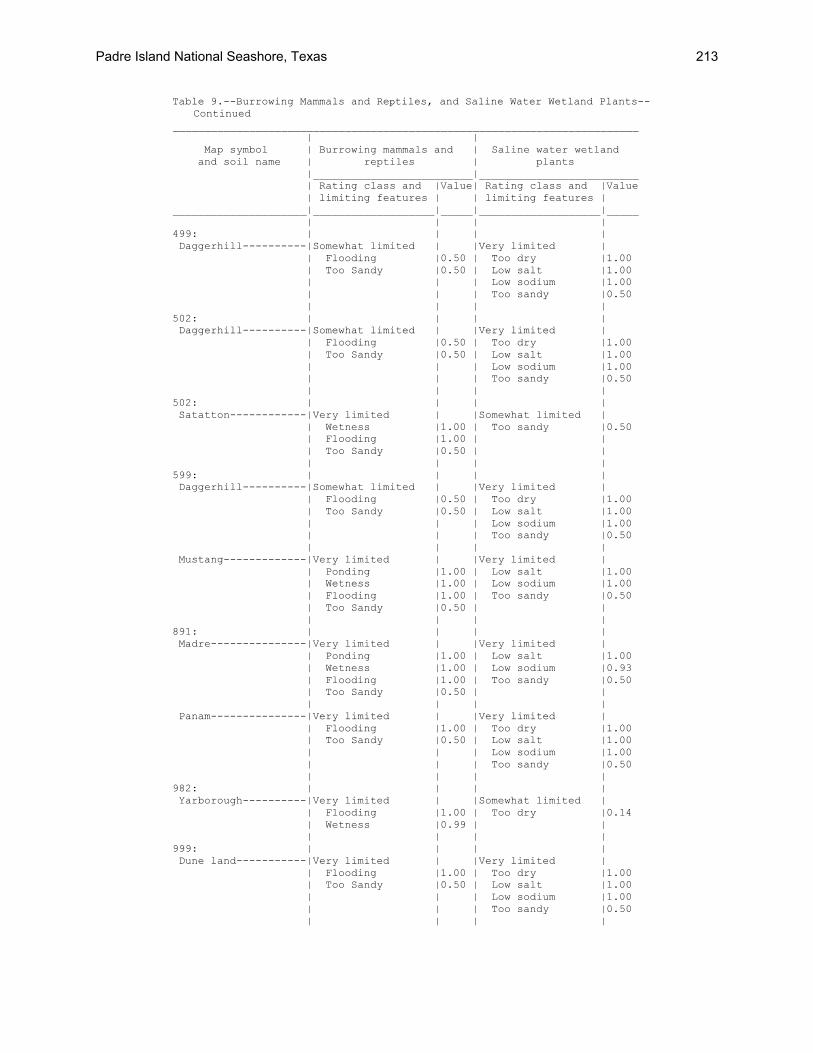
Table 9.--Burrowing Mammals and Reptiles, and Saline Water Wetland Plants--Continued
_________________________________________________________________________ | | Map symbol | Burrowing mammals and | Saline water wetland and soil name | reptiles | plants |_________________________|_________________________ | Rating class and |Value| Rating class and |Value | limiting features | | limiting features | _____________________|___________________|_____|___________________|_____ | | | | 499: | | | | Daggerhill----------|Somewhat limited | |Very limited | | Flooding |0.50 | Too dry |1.00 | Too Sandy |0.50 | Low salt |1.00 | | | Low sodium |1.00 | | | Too sandy |0.50 | | | | 502: | | | | Daggerhill----------|Somewhat limited | |Very limited | | Flooding |0.50 | Too dry |1.00 | Too Sandy |0.50 | Low salt |1.00 | | | Low sodium |1.00 | | | Too sandy |0.50 | | | | 502: | | | | Satatton------------|Very limited | |Somewhat limited | | Wetness |1.00 | Too sandy |0.50 | Flooding |1.00 | | | Too Sandy |0.50 | | | | | | 599: | | | | Daggerhill----------|Somewhat limited | |Very limited | | Flooding |0.50 | Too dry |1.00 | Too Sandy |0.50 | Low salt |1.00 | | | Low sodium |1.00 | | | Too sandy |0.50 | | | | Mustang-------------|Very limited | |Very limited | | Ponding |1.00 | Low salt |1.00 | Wetness |1.00 | Low sodium |1.00 | Flooding |1.00 | Too sandy |0.50 | Too Sandy |0.50 | | | | | | 891: | | | | Madre---------------|Very limited | |Very limited | | Ponding |1.00 | Low salt |1.00 | Wetness |1.00 | Low sodium |0.93 | Flooding |1.00 | Too sandy |0.50 | Too Sandy |0.50 | | | | | | Panam---------------|Very limited | |Very limited | | Flooding |1.00 | Too dry |1.00 | Too Sandy |0.50 | Low salt |1.00 | | | Low sodium |1.00 | | | Too sandy |0.50 | | | | 982: | | | | Yarborough----------|Very limited | |Somewhat limited | | Flooding |1.00 | Too dry |0.14 | Wetness |0.99 | | | | | | 999: | | | | Dune land-----------|Very limited | |Very limited | | Flooding |1.00 | Too dry |1.00 | Too Sandy |0.50 | Low salt |1.00 | | | Low sodium |1.00 | | | Too sandy |0.50 | | | |
Padre Island National Seashore, Texas 213
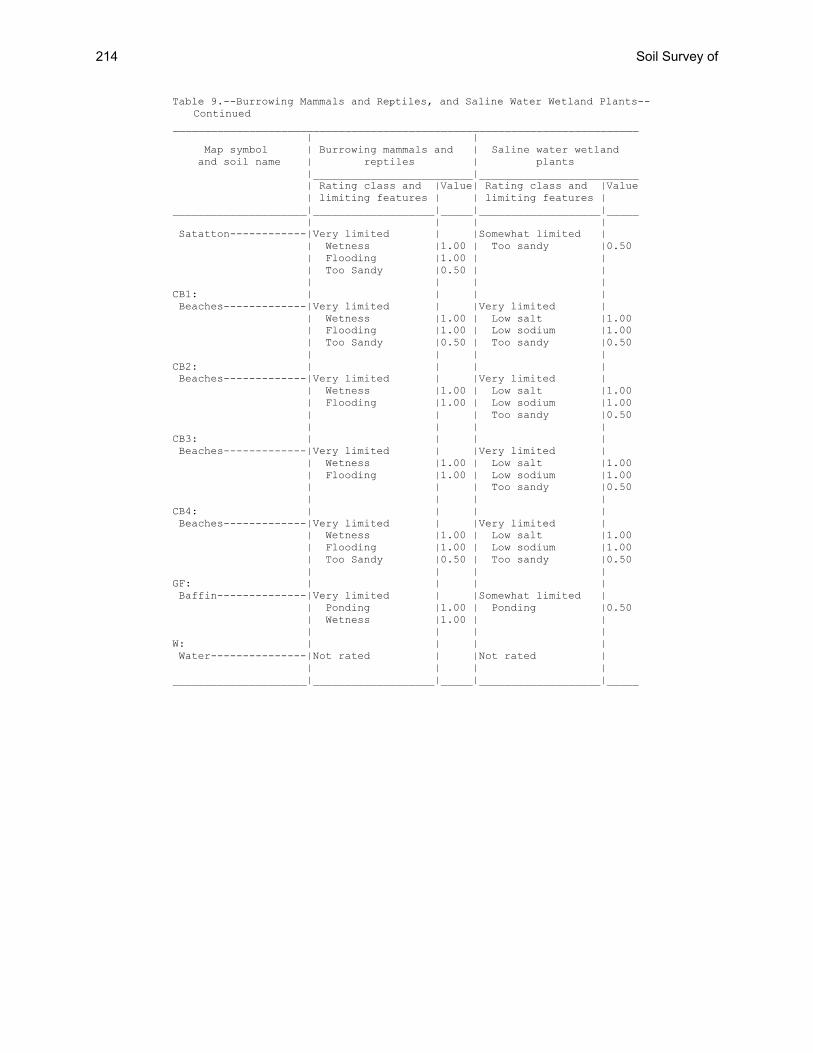
Table 9.--Burrowing Mammals and Reptiles, and Saline Water Wetland Plants--Continued
_________________________________________________________________________ | | Map symbol | Burrowing mammals and | Saline water wetland and soil name | reptiles | plants |_________________________|_________________________ | Rating class and |Value| Rating class and |Value | limiting features | | limiting features | _____________________|___________________|_____|___________________|_____ | | | | Satatton------------|Very limited | |Somewhat limited | | Wetness |1.00 | Too sandy |0.50 | Flooding |1.00 | | | Too Sandy |0.50 | | | | | | CB1: | | | | Beaches-------------|Very limited | |Very limited | | Wetness |1.00 | Low salt |1.00 | Flooding |1.00 | Low sodium |1.00 | Too Sandy |0.50 | Too sandy |0.50 | | | | CB2: | | | | Beaches-------------|Very limited | |Very limited | | Wetness |1.00 | Low salt |1.00 | Flooding |1.00 | Low sodium |1.00 | | | Too sandy |0.50 | | | | CB3: | | | | Beaches-------------|Very limited | |Very limited | | Wetness |1.00 | Low salt |1.00 | Flooding |1.00 | Low sodium |1.00 | | | Too sandy |0.50 | | | | CB4: | | | | Beaches-------------|Very limited | |Very limited | | Wetness |1.00 | Low salt |1.00 | Flooding |1.00 | Low sodium |1.00 | Too Sandy |0.50 | Too sandy |0.50 | | | | GF: | | | | Baffin--------------|Very limited | |Somewhat limited | | Ponding |1.00 | Ponding |0.50 | Wetness |1.00 | | | | | | W: | | | | Water---------------|Not rated | |Not rated | | | | | _____________________|___________________|_____|___________________|_____
214 Soil Survey of
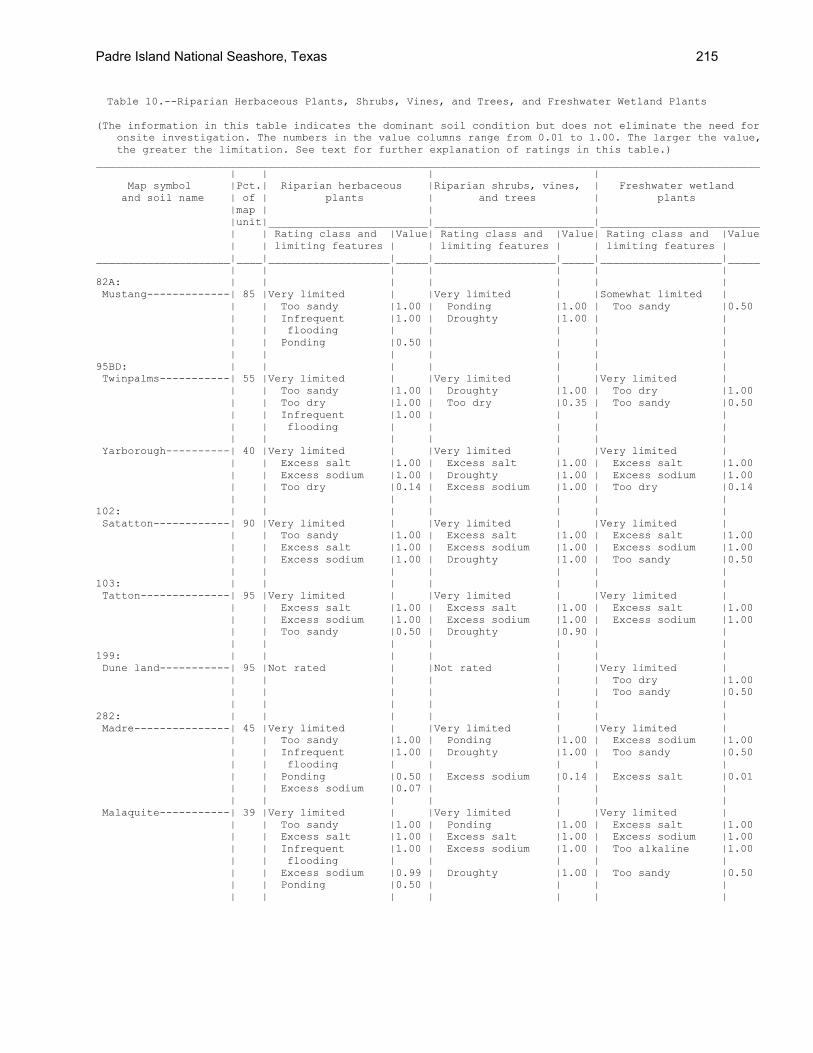
Table 10.--Riparian Herbaceous Plants, Shrubs, Vines, and Trees, and Freshwater Wetland Plants
(The information in this table indicates the dominant soil condition but does not eliminate the need for onsite investigation. The numbers in the value columns range from 0.01 to 1.00. The larger the value, the greater the limitation. See text for further explanation of ratings in this table.)
________________________________________________________________________________________________________ | | | | Map symbol |Pct.| Riparian herbaceous |Riparian shrubs, vines, | Freshwater wetland and soil name | of | plants | and trees | plants |map | | | |unit|_________________________|_________________________|_________________________ | | Rating class and |Value| Rating class and |Value| Rating class and |Value | | limiting features | | limiting features | | limiting features | _____________________|____|___________________|_____|___________________|_____|___________________|_____ | | | | | | | 82A: | | | | | | | Mustang-------------| 85 |Very limited | |Very limited | |Somewhat limited | | | Too sandy |1.00 | Ponding |1.00 | Too sandy |0.50 | | Infrequent |1.00 | Droughty |1.00 | | | | flooding | | | | | | | Ponding |0.50 | | | | | | | | | | | 95BD: | | | | | | | Twinpalms-----------| 55 |Very limited | |Very limited | |Very limited | | | Too sandy |1.00 | Droughty |1.00 | Too dry |1.00 | | Too dry |1.00 | Too dry |0.35 | Too sandy |0.50 | | Infrequent |1.00 | | | | | | flooding | | | | | | | | | | | | Yarborough----------| 40 |Very limited | |Very limited | |Very limited | | | Excess salt |1.00 | Excess salt |1.00 | Excess salt |1.00 | | Excess sodium |1.00 | Droughty |1.00 | Excess sodium |1.00 | | Too dry |0.14 | Excess sodium |1.00 | Too dry |0.14 | | | | | | | 102: | | | | | | | Satatton------------| 90 |Very limited | |Very limited | |Very limited | | | Too sandy |1.00 | Excess salt |1.00 | Excess salt |1.00 | | Excess salt |1.00 | Excess sodium |1.00 | Excess sodium |1.00 | | Excess sodium |1.00 | Droughty |1.00 | Too sandy |0.50 | | | | | | | 103: | | | | | | | Tatton--------------| 95 |Very limited | |Very limited | |Very limited | | | Excess salt |1.00 | Excess salt |1.00 | Excess salt |1.00 | | Excess sodium |1.00 | Excess sodium |1.00 | Excess sodium |1.00 | | Too sandy |0.50 | Droughty |0.90 | | | | | | | | | 199: | | | | | | | Dune land-----------| 95 |Not rated | |Not rated | |Very limited | | | | | | | Too dry |1.00 | | | | | | Too sandy |0.50 | | | | | | | 282: | | | | | | | Madre---------------| 45 |Very limited | |Very limited | |Very limited | | | Too sandy |1.00 | Ponding |1.00 | Excess sodium |1.00 | | Infrequent |1.00 | Droughty |1.00 | Too sandy |0.50 | | flooding | | | | | | | Ponding |0.50 | Excess sodium |0.14 | Excess salt |0.01 | | Excess sodium |0.07 | | | | | | | | | | | Malaquite-----------| 39 |Very limited | |Very limited | |Very limited | | | Too sandy |1.00 | Ponding |1.00 | Excess salt |1.00 | | Excess salt |1.00 | Excess salt |1.00 | Excess sodium |1.00 | | Infrequent |1.00 | Excess sodium |1.00 | Too alkaline |1.00 | | flooding | | | | | | | Excess sodium |0.99 | Droughty |1.00 | Too sandy |0.50 | | Ponding |0.50 | | | | | | | | | | |
Padre Island National Seashore, Texas 215
Table 10.--Riparian Herbaceous Plants, Shrubs, Vines, and Trees, and Freshwater Wetland Plants--Continued
________________________________________________________________________________________________________ | | | | Map symbol |Pct.| Riparian herbaceous |Riparian shrubs, vines, | Freshwater wetland and soil name | of | plants | and trees | plants |map | | | |unit|_________________________|_________________________|_________________________ | | Rating class and |Value| Rating class and |Value| Rating class and |Value | | limiting features | | limiting features | | limiting features | _____________________|____|___________________|_____|___________________|_____|___________________|_____ | | | | | | | 290: | | | | | | | Novillo-------------| 88 |Very limited | |Very limited | |Somewhat limited | | | Ponding |1.00 | Ponding |1.00 | Ponding |0.50 | | Infrequent |1.00 | Droughty |0.99 | | | | flooding | | | | | | | Excess humus |0.50 | | | | | | | | | | | 291: | | | | | | | Mustang-------------| 49 |Very limited | |Very limited | |Somewhat limited | | | Too sandy |1.00 | Ponding |1.00 | Too sandy |0.50 | | Infrequent |1.00 | Droughty |1.00 | | | | flooding | | | | | | | Ponding |0.50 | | | | | | | | | | | Padre---------------| 42 |Very limited | |Somewhat limited | |Very limited | | | Too sandy |1.00 | Droughty |0.32 | Too dry |1.00 | | Too dry |1.00 | Too dry |0.06 | Too sandy |0.50 | | Infrequent |1.00 | | | Too acid |0.14 | | flooding | | | | | | | | | | | | 299: | | | | | | | Greenhill-----------| 85 |Very limited | |Very limited | |Very limited | | | Too sandy |1.00 | Too dry |1.00 | Too dry |1.00 | | Too dry |1.00 | Droughty |0.99 | Too sandy |0.50 | | Infrequent |1.00 | | | Too acid |0.04 | | flooding | | | | | | | | | | | | 399: | | | | | | | Greenhill-----------| 50 |Very limited | |Very limited | |Very limited | | | Too sandy |1.00 | Too dry |1.00 | Too dry |1.00 | | Too dry |1.00 | Droughty |0.99 | Too sandy |0.50 | | Infrequent |1.00 | | | Too acid |0.04 | | flooding | | | | | | | | | | | | Mustang-------------| 41 |Very limited | |Very limited | |Somewhat limited | | | Too sandy |1.00 | Ponding |1.00 | Too sandy |0.50 | | Infrequent |1.00 | Droughty |1.00 | | | | flooding | | | | | | | Ponding |0.50 | | | | | | | | | | | 402: | | | | | | | Tatton--------------| 55 |Very limited | |Very limited | |Very limited | | | Too sandy |1.00 | Excess salt |1.00 | Excess salt |1.00 | | Excess salt |1.00 | Excess sodium |1.00 | Excess sodium |1.00 | | Excess sodium |1.00 | Droughty |0.87 | Too sandy |0.50 | | Long flooding |0.50 | Flooding |0.50 | | | | | | | | | Beaches, washover | | | | | | | fan----------------| 35 |Not rated | |Not rated | |Very limited | | | | | | | Excess salt |1.00 | | | | | | Excess sodium |1.00 | | | | | | Too sandy |0.50 | | | | | | | 491: | | | | | | | Mustang-------------| 50 |Very limited | |Very limited | |Very limited | | | Too sandy |1.00 | Ponding |1.00 | Too alkaline |1.00 | | Infrequent |1.00 | Droughty |1.00 | Too sandy |0.50 | | flooding | | | | | | | Ponding |0.50 | | | Excess salt |0.02
216 Soil Survey of
Table 10.--Riparian Herbaceous Plants, Shrubs, Vines, and Trees, and Freshwater Wetland Plants--Continued
________________________________________________________________________________________________________ | | | | Map symbol |Pct.| Riparian herbaceous |Riparian shrubs, vines, | Freshwater wetland and soil name | of | plants | and trees | plants |map | | | |unit|_________________________|_________________________|_________________________ | | Rating class and |Value| Rating class and |Value| Rating class and |Value | | limiting features | | limiting features | | limiting features | _____________________|____|___________________|_____|___________________|_____|___________________|_____ | | | | | | | Panam---------------| 40 |Very limited | |Somewhat limited | |Very limited | | | Too sandy |1.00 | Droughty |0.32 | Too dry |1.00 | | Too dry |1.00 | Too dry |0.06 | Too alkaline |1.00 | | Infrequent |1.00 | | | Too sandy |0.50 | | flooding | | | | | | | | | | | | 499: | | | | | | | Daggerhill----------| 86 |Very limited | |Very limited | |Very limited | | | Too sandy |1.00 | Too dry |1.00 | Too dry |1.00 | | Too dry |1.00 | Droughty |0.99 | Too alkaline |1.00 | | Infrequent |1.00 | | | Too sandy |0.50 | | flooding | | | | | | | | | | | | 502: | | | | | | | Daggerhill----------| 45 |Very limited | |Very limited | |Very limited | | | Too sandy |1.00 | Too dry |1.00 | Too dry |1.00 | | Too dry |1.00 | Droughty |0.99 | Too alkaline |1.00 | | Infrequent |1.00 | | | Too sandy |0.50 | | flooding | | | | | | | | | | | | Satatton------------| 40 |Very limited | |Very limited | |Very limited | | | Too sandy |1.00 | Excess salt |1.00 | Excess salt |1.00 | | Excess salt |1.00 | Excess sodium |1.00 | Excess sodium |1.00 | | Excess sodium |1.00 | Droughty |1.00 | Too sandy |0.50 | | | | | | | 599: | | | | | | | Daggerhill----------| 50 |Very limited | |Very limited | |Very limited | | | Too sandy |1.00 | Too dry |1.00 | Too dry |1.00 | | Too dry |1.00 | Droughty |0.99 | Too alkaline |1.00 | | Infrequent |1.00 | | | Too sandy |0.50 | | flooding | | | | | | | | | | | | Mustang-------------| 41 |Very limited | |Very limited | |Very limited | | | Too sandy |1.00 | Ponding |1.00 | Too alkaline |1.00 | | Infrequent |1.00 | Droughty |1.00 | Too sandy |0.50 | | flooding | | | | | | | Ponding |0.50 | | | Excess salt |0.02 | | | | | | | 891: | | | | | | | Madre---------------| 48 |Very limited | |Very limited | |Very limited | | | Too sandy |1.00 | Ponding |1.00 | Excess sodium |1.00 | | Infrequent |1.00 | Droughty |1.00 | Too sandy |0.50 | | flooding | | | | | | | Ponding |0.50 | Excess sodium |0.14 | Excess salt |0.01 | | Excess sodium |0.07 | | | | | | | | | | | Panam---------------| 43 |Very limited | |Somewhat limited | |Very limited | | | Too sandy |1.00 | Droughty |0.32 | Too dry |1.00 | | Too dry |1.00 | Too dry |0.06 | Too sandy |0.50 | | Infrequent |1.00 | | | | | | flooding | | | | | | | | | | | | 982: | | | | | | | Yarborough----------| 90 |Very limited | |Very limited | |Very limited | | | Excess salt |1.00 | Excess salt |1.00 | Excess salt |1.00 | | Excess sodium |1.00 | Droughty |1.00 | Excess sodium |1.00 | | Too dry |0.14 | Excess sodium |1.00 | Too dry |0.14 | | | | | | |
Padre Island National Seashore, Texas 217
Table 10.--Riparian Herbaceous Plants, Shrubs, Vines, and Trees, and Freshwater Wetland Plants--Continued
________________________________________________________________________________________________________ | | | | Map symbol |Pct.| Riparian herbaceous |Riparian shrubs, vines, | Freshwater wetland and soil name | of | plants | and trees | plants |map | | | |unit|_________________________|_________________________|_________________________ | | Rating class and |Value| Rating class and |Value| Rating class and |Value | | limiting features | | limiting features | | limiting features | _____________________|____|___________________|_____|___________________|_____|___________________|_____ | | | | | | | 999: | | | | | | | Dune land-----------| 55 |Not rated | |Not rated | |Very limited | | | | | | | Too dry |1.00 | | | | | | Too sandy |0.50 | | | | | | | Satatton------------| 42 |Very limited | |Very limited | |Very limited | | | Too sandy |1.00 | Excess salt |1.00 | Excess salt |1.00 | | Excess salt |1.00 | Excess sodium |1.00 | Excess sodium |1.00 | | Excess sodium |1.00 | Droughty |1.00 | Too sandy |0.50 | | | | | | | CB1: | | | | | | | Beaches-------------|100 |Not rated | |Not rated | |Somewhat limited | | | | | | | Too sandy |0.50 | | | | | | Too acid |0.08 | | | | | | | CB2: | | | | | | | Beaches-------------|100 |Not rated | |Not rated | |Somewhat limited | | | | | | | Too sandy |0.50 | | | | | | Too acid |0.08 | | | | | | | CB3: | | | | | | | Beaches-------------|100 |Not rated | |Not rated | |Somewhat limited | | | | | | | Too sandy |0.50 | | | | | | Too acid |0.08 | | | | | | | CB4: | | | | | | | Beaches-------------|100 |Not rated | |Not rated | |Somewhat limited | | | | | | | Too sandy |0.50 | | | | | | Too acid |0.08 | | | | | | | GF: | | | | | | | Baffin--------------| 95 |Very limited | |Very limited | |Very limited | | | Ponding |1.00 | Ponding |1.00 | Excess salt |1.00 | | Excess salt |1.00 | Excess salt |1.00 | Excess sodium |1.00 | | Excess sodium |1.00 | Excess sodium |1.00 | Ponding |0.50 | | Infrequent |1.00 | | | | | | flooding | | | | | | | | | | | | W: | | | | | | | Water---------------|100 |Not rated | |Not rated | |Not rated | | | | | | | | _____________________|____|___________________|_____|___________________|_____|___________________|_____
218 Soil Survey of
Table 11.--Dwellings and Small Commercial Buildings (The information in this table indicates the dominant soil condition but does not eliminate the need for
onsite investigation. The numbers in the value columns range from 0.01 to 1.00. The larger the value, the greater the limitation. See text for further explanation of ratings in this table.)
________________________________________________________________________________________________________ | | | | Map symbol |Pct.| Dwellings without | Dwellings with | Small commercial and soil name | of | basements | basements | buildings |map | | | |unit| | | | |_________________________|_________________________|_________________________ | | Rating class and |Value| Rating class and |Value| Rating class and |Value | | limiting features | | limiting features | | limiting features | _____________________|____|___________________|_____|___________________|_____|___________________|_____ | | | | | | | 82A: | | | | | | | Mustang-------------| 85 |Very limited | |Very limited | |Very limited | | | Ponding |1.00 | Ponding |1.00 | Ponding |1.00 | | Flooding |1.00 | Flooding |1.00 | Flooding |1.00 | | Depth to |1.00 | Depth to |1.00 | Depth to |1.00 | | saturated zone | | saturated zone | | saturated zone | | | | | | | | 95BD: | | | | | | | Twinpalms-----------| 55 |Very limited | |Very limited | |Very limited | | | Flooding |1.00 | Flooding |1.00 | Flooding |1.00 | | | | Depth to |0.72 | | | | | | saturated zone | | | | | | | | | | Yarborough----------| 40 |Very limited | |Very limited | |Very limited | | | Flooding |1.00 | Flooding |1.00 | Flooding |1.00 | | Depth to |0.98 | Depth to |1.00 | Depth to |0.98 | | saturated zone | | saturated zone | | saturated zone | | | | | | | | 102: | | | | | | | Satatton------------| 90 |Very limited | |Very limited | |Very limited | | | Flooding |1.00 | Flooding |1.00 | Flooding |1.00 | | Depth to |1.00 | Depth to |1.00 | Depth to |1.00 | | saturated zone | | saturated zone | | saturated zone | | | | | | | | 103: | | | | | | | Tatton--------------| 95 |Very limited | |Very limited | |Very limited | | | Flooding |1.00 | Flooding |1.00 | Flooding |1.00 | | Depth to |1.00 | Depth to |1.00 | Depth to |1.00 | | saturated zone | | saturated zone | | saturated zone | | | | | | | | 199: | | | | | | | Dune land-----------| 95 |Very limited | |Very limited | |Very limited | | | Flooding |1.00 | Flooding |1.00 | Flooding |1.00 | | | | | | | 282: | | | | | | | Madre---------------| 45 |Very limited | |Very limited | |Very limited | | | Ponding |1.00 | Ponding |1.00 | Ponding |1.00 | | Flooding |1.00 | Flooding |1.00 | Flooding |1.00 | | Depth to |1.00 | Depth to |1.00 | Depth to |1.00 | | saturated zone | | saturated zone | | saturated zone | | | | | | | | Malaquite-----------| 39 |Very limited | |Very limited | |Very limited | | | Ponding |1.00 | Ponding |1.00 | Ponding |1.00 | | Flooding |1.00 | Flooding |1.00 | Flooding |1.00 | | Depth to |1.00 | Depth to |1.00 | Depth to |1.00 | | saturated zone | | saturated zone | | saturated zone | | | | | | | |
Padre Island National Seashore, Texas 219
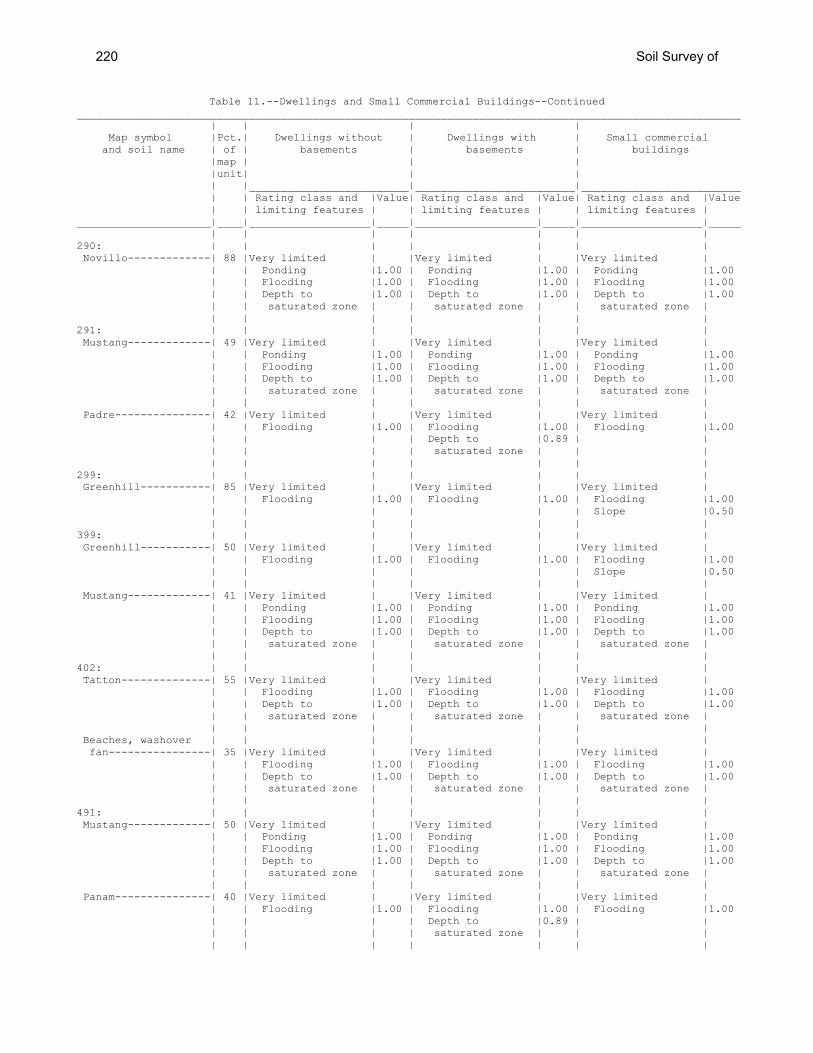
Table 11.--Dwellings and Small Commercial Buildings--Continued ________________________________________________________________________________________________________ | | | | Map symbol |Pct.| Dwellings without | Dwellings with | Small commercial and soil name | of | basements | basements | buildings |map | | | |unit| | | | |_________________________|_________________________|_________________________ | | Rating class and |Value| Rating class and |Value| Rating class and |Value | | limiting features | | limiting features | | limiting features | _____________________|____|___________________|_____|___________________|_____|___________________|_____ | | | | | | | 290: | | | | | | | Novillo-------------| 88 |Very limited | |Very limited | |Very limited | | | Ponding |1.00 | Ponding |1.00 | Ponding |1.00 | | Flooding |1.00 | Flooding |1.00 | Flooding |1.00 | | Depth to |1.00 | Depth to |1.00 | Depth to |1.00 | | saturated zone | | saturated zone | | saturated zone | | | | | | | | 291: | | | | | | | Mustang-------------| 49 |Very limited | |Very limited | |Very limited | | | Ponding |1.00 | Ponding |1.00 | Ponding |1.00 | | Flooding |1.00 | Flooding |1.00 | Flooding |1.00 | | Depth to |1.00 | Depth to |1.00 | Depth to |1.00 | | saturated zone | | saturated zone | | saturated zone | | | | | | | | Padre---------------| 42 |Very limited | |Very limited | |Very limited | | | Flooding |1.00 | Flooding |1.00 | Flooding |1.00 | | | | Depth to |0.89 | | | | | | saturated zone | | | | | | | | | | 299: | | | | | | | Greenhill-----------| 85 |Very limited | |Very limited | |Very limited | | | Flooding |1.00 | Flooding |1.00 | Flooding |1.00 | | | | | | Slope |0.50 | | | | | | | 399: | | | | | | | Greenhill-----------| 50 |Very limited | |Very limited | |Very limited | | | Flooding |1.00 | Flooding |1.00 | Flooding |1.00 | | | | | | Slope |0.50 | | | | | | | Mustang-------------| 41 |Very limited | |Very limited | |Very limited | | | Ponding |1.00 | Ponding |1.00 | Ponding |1.00 | | Flooding |1.00 | Flooding |1.00 | Flooding |1.00 | | Depth to |1.00 | Depth to |1.00 | Depth to |1.00 | | saturated zone | | saturated zone | | saturated zone | | | | | | | | 402: | | | | | | | Tatton--------------| 55 |Very limited | |Very limited | |Very limited | | | Flooding |1.00 | Flooding |1.00 | Flooding |1.00 | | Depth to |1.00 | Depth to |1.00 | Depth to |1.00 | | saturated zone | | saturated zone | | saturated zone | | | | | | | | Beaches, washover | | | | | | | fan----------------| 35 |Very limited | |Very limited | |Very limited | | | Flooding |1.00 | Flooding |1.00 | Flooding |1.00 | | Depth to |1.00 | Depth to |1.00 | Depth to |1.00 | | saturated zone | | saturated zone | | saturated zone | | | | | | | | 491: | | | | | | | Mustang-------------| 50 |Very limited | |Very limited | |Very limited | | | Ponding |1.00 | Ponding |1.00 | Ponding |1.00 | | Flooding |1.00 | Flooding |1.00 | Flooding |1.00 | | Depth to |1.00 | Depth to |1.00 | Depth to |1.00 | | saturated zone | | saturated zone | | saturated zone | | | | | | | | Panam---------------| 40 |Very limited | |Very limited | |Very limited | | | Flooding |1.00 | Flooding |1.00 | Flooding |1.00 | | | | Depth to |0.89 | | | | | | saturated zone | | | | | | | | | |
220 Soil Survey of
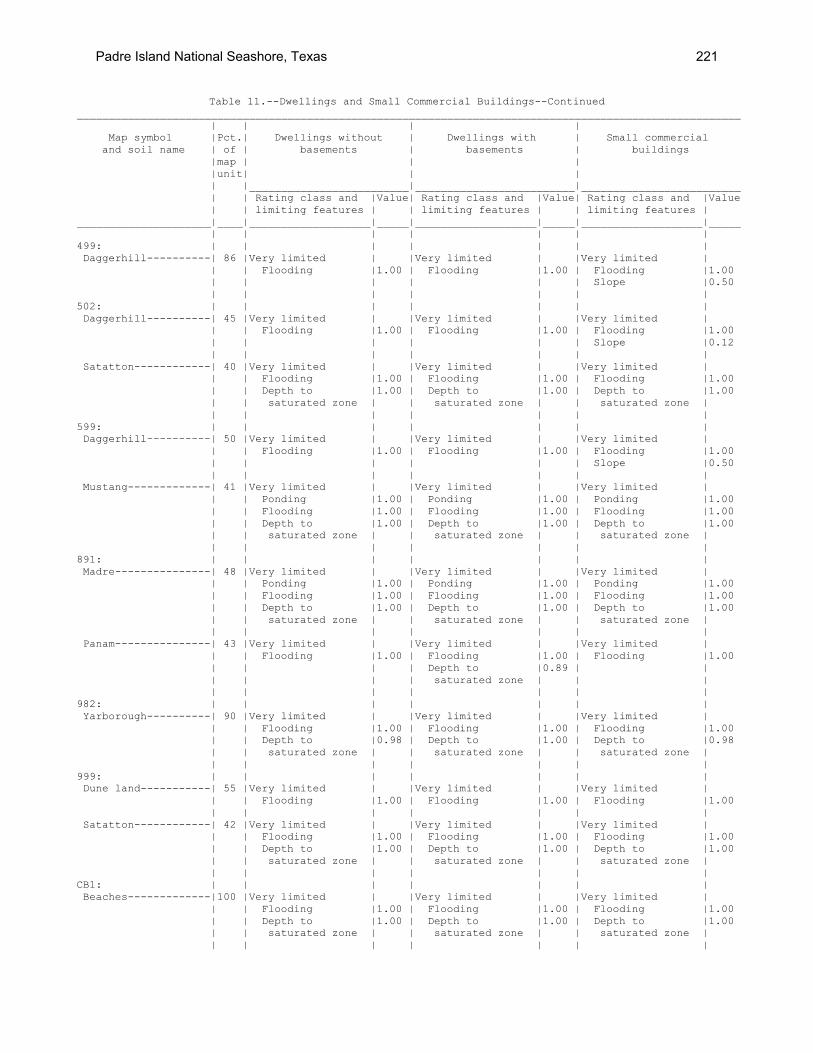
Table 11.--Dwellings and Small Commercial Buildings--Continued ________________________________________________________________________________________________________ | | | | Map symbol |Pct.| Dwellings without | Dwellings with | Small commercial and soil name | of | basements | basements | buildings |map | | | |unit| | | | |_________________________|_________________________|_________________________ | | Rating class and |Value| Rating class and |Value| Rating class and |Value | | limiting features | | limiting features | | limiting features | _____________________|____|___________________|_____|___________________|_____|___________________|_____ | | | | | | | 499: | | | | | | | Daggerhill----------| 86 |Very limited | |Very limited | |Very limited | | | Flooding |1.00 | Flooding |1.00 | Flooding |1.00 | | | | | | Slope |0.50 | | | | | | | 502: | | | | | | | Daggerhill----------| 45 |Very limited | |Very limited | |Very limited | | | Flooding |1.00 | Flooding |1.00 | Flooding |1.00 | | | | | | Slope |0.12 | | | | | | | Satatton------------| 40 |Very limited | |Very limited | |Very limited | | | Flooding |1.00 | Flooding |1.00 | Flooding |1.00 | | Depth to |1.00 | Depth to |1.00 | Depth to |1.00 | | saturated zone | | saturated zone | | saturated zone | | | | | | | | 599: | | | | | | | Daggerhill----------| 50 |Very limited | |Very limited | |Very limited | | | Flooding |1.00 | Flooding |1.00 | Flooding |1.00 | | | | | | Slope |0.50 | | | | | | | Mustang-------------| 41 |Very limited | |Very limited | |Very limited | | | Ponding |1.00 | Ponding |1.00 | Ponding |1.00 | | Flooding |1.00 | Flooding |1.00 | Flooding |1.00 | | Depth to |1.00 | Depth to |1.00 | Depth to |1.00 | | saturated zone | | saturated zone | | saturated zone | | | | | | | | 891: | | | | | | | Madre---------------| 48 |Very limited | |Very limited | |Very limited | | | Ponding |1.00 | Ponding |1.00 | Ponding |1.00 | | Flooding |1.00 | Flooding |1.00 | Flooding |1.00 | | Depth to |1.00 | Depth to |1.00 | Depth to |1.00 | | saturated zone | | saturated zone | | saturated zone | | | | | | | | Panam---------------| 43 |Very limited | |Very limited | |Very limited | | | Flooding |1.00 | Flooding |1.00 | Flooding |1.00 | | | | Depth to |0.89 | | | | | | saturated zone | | | | | | | | | | 982: | | | | | | | Yarborough----------| 90 |Very limited | |Very limited | |Very limited | | | Flooding |1.00 | Flooding |1.00 | Flooding |1.00 | | Depth to |0.98 | Depth to |1.00 | Depth to |0.98 | | saturated zone | | saturated zone | | saturated zone | | | | | | | | 999: | | | | | | | Dune land-----------| 55 |Very limited | |Very limited | |Very limited | | | Flooding |1.00 | Flooding |1.00 | Flooding |1.00 | | | | | | | Satatton------------| 42 |Very limited | |Very limited | |Very limited | | | Flooding |1.00 | Flooding |1.00 | Flooding |1.00 | | Depth to |1.00 | Depth to |1.00 | Depth to |1.00 | | saturated zone | | saturated zone | | saturated zone | | | | | | | | CB1: | | | | | | | Beaches-------------|100 |Very limited | |Very limited | |Very limited | | | Flooding |1.00 | Flooding |1.00 | Flooding |1.00 | | Depth to |1.00 | Depth to |1.00 | Depth to |1.00 | | saturated zone | | saturated zone | | saturated zone | | | | | | | |
Padre Island National Seashore, Texas 221
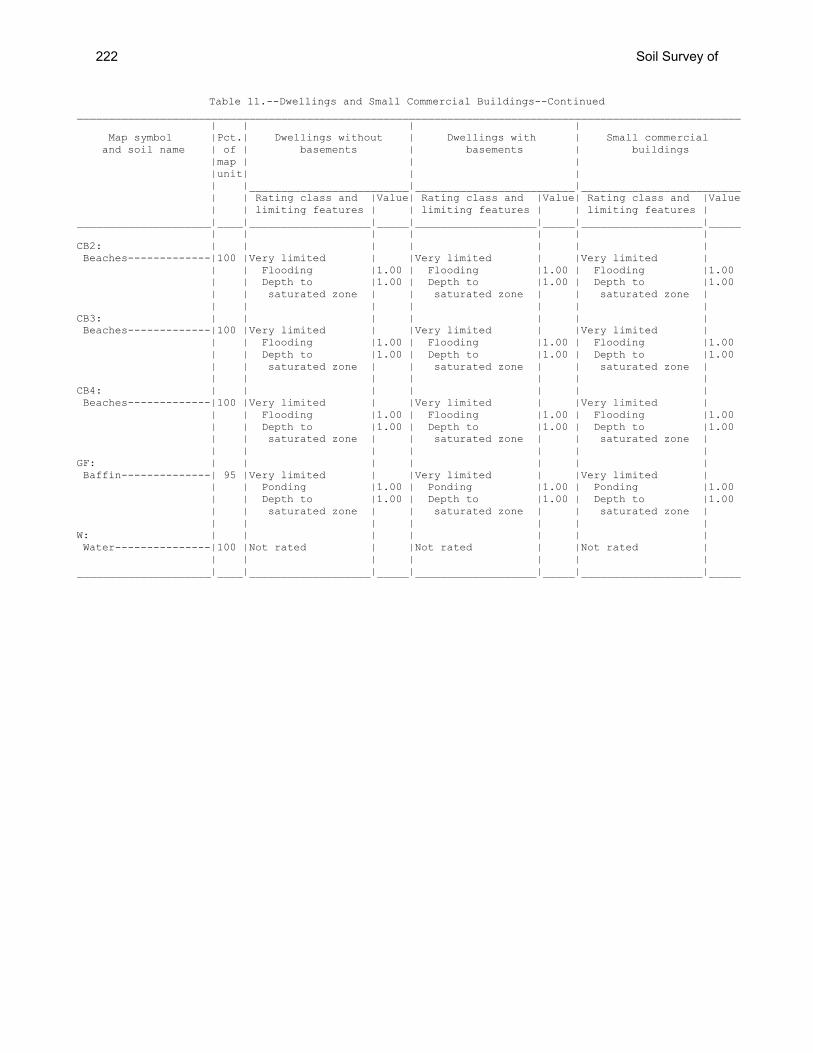
Table 11.--Dwellings and Small Commercial Buildings--Continued ________________________________________________________________________________________________________ | | | | Map symbol |Pct.| Dwellings without | Dwellings with | Small commercial and soil name | of | basements | basements | buildings |map | | | |unit| | | | |_________________________|_________________________|_________________________ | | Rating class and |Value| Rating class and |Value| Rating class and |Value | | limiting features | | limiting features | | limiting features | _____________________|____|___________________|_____|___________________|_____|___________________|_____ | | | | | | | CB2: | | | | | | | Beaches-------------|100 |Very limited | |Very limited | |Very limited | | | Flooding |1.00 | Flooding |1.00 | Flooding |1.00 | | Depth to |1.00 | Depth to |1.00 | Depth to |1.00 | | saturated zone | | saturated zone | | saturated zone | | | | | | | | CB3: | | | | | | | Beaches-------------|100 |Very limited | |Very limited | |Very limited | | | Flooding |1.00 | Flooding |1.00 | Flooding |1.00 | | Depth to |1.00 | Depth to |1.00 | Depth to |1.00 | | saturated zone | | saturated zone | | saturated zone | | | | | | | | CB4: | | | | | | | Beaches-------------|100 |Very limited | |Very limited | |Very limited | | | Flooding |1.00 | Flooding |1.00 | Flooding |1.00 | | Depth to |1.00 | Depth to |1.00 | Depth to |1.00 | | saturated zone | | saturated zone | | saturated zone | | | | | | | | GF: | | | | | | | Baffin--------------| 95 |Very limited | |Very limited | |Very limited | | | Ponding |1.00 | Ponding |1.00 | Ponding |1.00 | | Depth to |1.00 | Depth to |1.00 | Depth to |1.00 | | saturated zone | | saturated zone | | saturated zone | | | | | | | | W: | | | | | | | Water---------------|100 |Not rated | |Not rated | |Not rated | | | | | | | | _____________________|____|___________________|_____|___________________|_____|___________________|_____
222 Soil Survey of
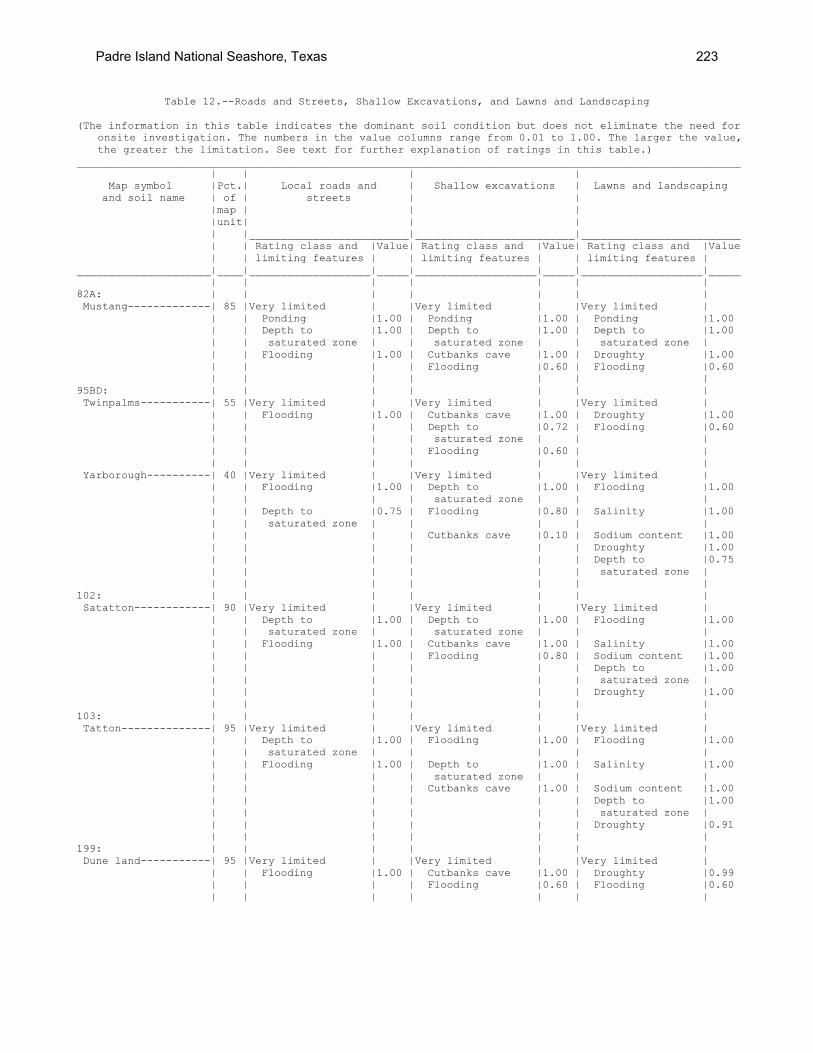
Table 12.--Roads and Streets, Shallow Excavations, and Lawns and Landscaping (The information in this table indicates the dominant soil condition but does not eliminate the need for
onsite investigation. The numbers in the value columns range from 0.01 to 1.00. The larger the value, the greater the limitation. See text for further explanation of ratings in this table.)
________________________________________________________________________________________________________ | | | | Map symbol |Pct.| Local roads and | Shallow excavations | Lawns and landscaping and soil name | of | streets | | |map | | | |unit| | | | |_________________________|_________________________|_________________________ | | Rating class and |Value| Rating class and |Value| Rating class and |Value | | limiting features | | limiting features | | limiting features | _____________________|____|___________________|_____|___________________|_____|___________________|_____ | | | | | | | 82A: | | | | | | | Mustang-------------| 85 |Very limited | |Very limited | |Very limited | | | Ponding |1.00 | Ponding |1.00 | Ponding |1.00 | | Depth to |1.00 | Depth to |1.00 | Depth to |1.00 | | saturated zone | | saturated zone | | saturated zone | | | Flooding |1.00 | Cutbanks cave |1.00 | Droughty |1.00 | | | | Flooding |0.60 | Flooding |0.60 | | | | | | | 95BD: | | | | | | | Twinpalms-----------| 55 |Very limited | |Very limited | |Very limited | | | Flooding |1.00 | Cutbanks cave |1.00 | Droughty |1.00 | | | | Depth to |0.72 | Flooding |0.60 | | | | saturated zone | | | | | | | Flooding |0.60 | | | | | | | | | Yarborough----------| 40 |Very limited | |Very limited | |Very limited | | | Flooding |1.00 | Depth to |1.00 | Flooding |1.00 | | | | saturated zone | | | | | Depth to |0.75 | Flooding |0.80 | Salinity |1.00 | | saturated zone | | | | | | | | | Cutbanks cave |0.10 | Sodium content |1.00 | | | | | | Droughty |1.00 | | | | | | Depth to |0.75 | | | | | | saturated zone | | | | | | | | 102: | | | | | | | Satatton------------| 90 |Very limited | |Very limited | |Very limited | | | Depth to |1.00 | Depth to |1.00 | Flooding |1.00 | | saturated zone | | saturated zone | | | | | Flooding |1.00 | Cutbanks cave |1.00 | Salinity |1.00 | | | | Flooding |0.80 | Sodium content |1.00 | | | | | | Depth to |1.00 | | | | | | saturated zone | | | | | | | Droughty |1.00 | | | | | | | 103: | | | | | | | Tatton--------------| 95 |Very limited | |Very limited | |Very limited | | | Depth to |1.00 | Flooding |1.00 | Flooding |1.00 | | saturated zone | | | | | | | Flooding |1.00 | Depth to |1.00 | Salinity |1.00 | | | | saturated zone | | | | | | | Cutbanks cave |1.00 | Sodium content |1.00 | | | | | | Depth to |1.00 | | | | | | saturated zone | | | | | | | Droughty |0.91 | | | | | | | 199: | | | | | | | Dune land-----------| 95 |Very limited | |Very limited | |Very limited | | | Flooding |1.00 | Cutbanks cave |1.00 | Droughty |0.99 | | | | Flooding |0.60 | Flooding |0.60 | | | | | | |
Padre Island National Seashore, Texas 223
Table 12.--Roads and Streets, Shallow Excavations, and Lawns and Landscaping--Continued ________________________________________________________________________________________________________ | | | | Map symbol |Pct.| Local roads and | Shallow excavations | Lawns and landscaping and soil name | of | streets | | |map | | | |unit| | | | |_________________________|_________________________|_________________________ | | Rating class and |Value| Rating class and |Value| Rating class and |Value | | limiting features | | limiting features | | limiting features | _____________________|____|___________________|_____|___________________|_____|___________________|_____ | | | | | | | 282: | | | | | | | Madre---------------| 45 |Very limited | |Very limited | |Very limited | | | Ponding |1.00 | Ponding |1.00 | Ponding |1.00 | | Depth to |1.00 | Depth to |1.00 | Sodium content |1.00 | | saturated zone | | saturated zone | | | | | Flooding |1.00 | Cutbanks cave |1.00 | Depth to |1.00 | | | | | | saturated zone | | | | | Flooding |0.60 | Droughty |1.00 | | | | | | Flooding |0.60 | | | | | | | Malaquite-----------| 39 |Very limited | |Very limited | |Very limited | | | Ponding |1.00 | Ponding |1.00 | Ponding |1.00 | | Depth to |1.00 | Depth to |1.00 | Salinity |1.00 | | saturated zone | | saturated zone | | | | | Flooding |1.00 | Cutbanks cave |1.00 | Sodium content |1.00 | | | | Flooding |0.60 | Depth to |1.00 | | | | | | saturated zone | | | | | | | Droughty |1.00 | | | | | | | 290: | | | | | | | Novillo-------------| 88 |Very limited | |Very limited | |Very limited | | | Ponding |1.00 | Ponding |1.00 | Ponding |1.00 | | Depth to |1.00 | Depth to |1.00 | Depth to |1.00 | | saturated zone | | saturated zone | | saturated zone | | | Flooding |1.00 | Cutbanks cave |1.00 | Droughty |0.99 | | | | Flooding |0.60 | Flooding |0.60 | | | | | | | 291: | | | | | | | Mustang-------------| 49 |Very limited | |Very limited | |Very limited | | | Ponding |1.00 | Ponding |1.00 | Ponding |1.00 | | Depth to |1.00 | Depth to |1.00 | Depth to |1.00 | | saturated zone | | saturated zone | | saturated zone | | | Flooding |1.00 | Cutbanks cave |1.00 | Droughty |1.00 | | | | Flooding |0.60 | Flooding |0.60 | | | | | | | Padre---------------| 42 |Very limited | |Very limited | |Somewhat limited | | | Flooding |1.00 | Cutbanks cave |1.00 | Flooding |0.60 | | | | Depth to |0.89 | Droughty |0.34 | | | | saturated zone | | | | | | | Flooding |0.60 | | | | | | | | | 299: | | | | | | | Greenhill-----------| 85 |Somewhat limited | |Very limited | |Very limited | | | Flooding |0.40 | Cutbanks cave |1.00 | Droughty |0.99 | | | | | | | 399: | | | | | | | Greenhill-----------| 50 |Somewhat limited | |Very limited | |Very limited | | | Flooding |0.40 | Cutbanks cave |1.00 | Droughty |0.99 | | | | | | | Mustang-------------| 41 |Very limited | |Very limited | |Very limited | | | Ponding |1.00 | Ponding |1.00 | Ponding |1.00 | | Depth to |1.00 | Depth to |1.00 | Depth to |1.00 | | saturated zone | | saturated zone | | saturated zone | | | Flooding |1.00 | Cutbanks cave |1.00 | Droughty |1.00 | | | | Flooding |0.60 | Flooding |0.60 | | | | | | |
224 Soil Survey of
Table 12.--Roads and Streets, Shallow Excavations, and Lawns and Landscaping--Continued ________________________________________________________________________________________________________ | | | | Map symbol |Pct.| Local roads and | Shallow excavations | Lawns and landscaping and soil name | of | streets | | |map | | | |unit| | | | |_________________________|_________________________|_________________________ | | Rating class and |Value| Rating class and |Value| Rating class and |Value | | limiting features | | limiting features | | limiting features | _____________________|____|___________________|_____|___________________|_____|___________________|_____ | | | | | | | 402: | | | | | | | Tatton--------------| 55 |Very limited | |Very limited | |Very limited | | | Depth to |1.00 | Flooding |1.00 | Flooding |1.00 | | saturated zone | | | | | | | Flooding |1.00 | Depth to |1.00 | Salinity |1.00 | | | | saturated zone | | | | | | | Cutbanks cave |1.00 | Sodium content |1.00 | | | | | | Depth to |1.00 | | | | | | saturated zone | | | | | | | Droughty |0.87 | | | | | | | Beaches, washover | | | | | | | fan----------------| 35 |Very limited | |Very limited | |Very limited | | | Depth to |1.00 | Flooding |1.00 | Flooding |1.00 | | saturated zone | | | | | | | Flooding |1.00 | Depth to |1.00 | Salinity |1.00 | | | | saturated zone | | | | | | | Cutbanks cave |1.00 | Sodium content |1.00 | | | | | | Depth to |1.00 | | | | | | saturated zone | | | | | | | Droughty |0.69 | | | | | | | 491: | | | | | | | Mustang-------------| 50 |Very limited | |Very limited | |Very limited | | | Ponding |1.00 | Ponding |1.00 | Ponding |1.00 | | Depth to |1.00 | Depth to |1.00 | Depth to |1.00 | | saturated zone | | saturated zone | | saturated zone | | | Flooding |1.00 | Cutbanks cave |1.00 | Droughty |1.00 | | | | Flooding |0.60 | Flooding |0.60 | | | | | | | Panam---------------| 40 |Very limited | |Very limited | |Somewhat limited | | | Flooding |1.00 | Cutbanks cave |1.00 | Flooding |0.60 | | | | Depth to |0.89 | Droughty |0.34 | | | | saturated zone | | | | | | | Flooding |0.60 | | | | | | | | | 499: | | | | | | | Daggerhill----------| 86 |Somewhat limited | |Very limited | |Very limited | | | Flooding |0.40 | Cutbanks cave |1.00 | Droughty |0.99 | | | | | | | 502: | | | | | | | Daggerhill----------| 45 |Somewhat limited | |Very limited | |Very limited | | | Flooding |0.40 | Cutbanks cave |1.00 | Droughty |0.99 | | | | | | | Satatton------------| 40 |Very limited | |Very limited | |Very limited | | | Depth to |1.00 | Depth to |1.00 | Flooding |1.00 | | saturated zone | | saturated zone | | | | | Flooding |1.00 | Cutbanks cave |1.00 | Salinity |1.00 | | | | Flooding |0.80 | Sodium content |1.00 | | | | | | Depth to |1.00 | | | | | | saturated zone | | | | | | | Droughty |1.00 | | | | | | | 599: | | | | | | | Daggerhill----------| 50 |Somewhat limited | |Very limited | |Very limited | | | Flooding |0.40 | Cutbanks cave |1.00 | Droughty |0.99 | | | | | | |
Padre Island National Seashore, Texas 225
Table 12.--Roads and Streets, Shallow Excavations, and Lawns and Landscaping--Continued ________________________________________________________________________________________________________ | | | | Map symbol |Pct.| Local roads and | Shallow excavations | Lawns and landscaping and soil name | of | streets | | |map | | | |unit| | | | |_________________________|_________________________|_________________________ | | Rating class and |Value| Rating class and |Value| Rating class and |Value | | limiting features | | limiting features | | limiting features | _____________________|____|___________________|_____|___________________|_____|___________________|_____ | | | | | | | Mustang-------------| 41 |Very limited | |Very limited | |Very limited | | | Ponding |1.00 | Ponding |1.00 | Ponding |1.00 | | Depth to |1.00 | Depth to |1.00 | Depth to |1.00 | | saturated zone | | saturated zone | | saturated zone | | | Flooding |1.00 | Cutbanks cave |1.00 | Droughty |1.00 | | | | Flooding |0.60 | Flooding |0.60 | | | | | | | 891: | | | | | | | Madre---------------| 48 |Very limited | |Very limited | |Very limited | | | Ponding |1.00 | Ponding |1.00 | Ponding |1.00 | | Depth to |1.00 | Depth to |1.00 | Sodium content |1.00 | | saturated zone | | saturated zone | | | | | Flooding |1.00 | Cutbanks cave |1.00 | Depth to |1.00 | | | | | | saturated zone | | | | | Flooding |0.60 | Droughty |1.00 | | | | | | Flooding |0.60 | | | | | | | Panam---------------| 43 |Very limited | |Very limited | |Somewhat limited | | | Flooding |1.00 | Cutbanks cave |1.00 | Flooding |0.60 | | | | Depth to |0.89 | Droughty |0.34 | | | | saturated zone | | | | | | | Flooding |0.60 | | | | | | | | | 982: | | | | | | | Yarborough----------| 90 |Very limited | |Very limited | |Very limited | | | Flooding |1.00 | Flooding |1.00 | Flooding |1.00 | | Depth to |0.75 | Depth to |1.00 | Salinity |1.00 | | saturated zone | | saturated zone | | | | | | | Cutbanks cave |0.10 | Sodium content |1.00 | | | | | | Droughty |1.00 | | | | | | Depth to |0.75 | | | | | | saturated zone | | | | | | | | 999: | | | | | | | Dune land-----------| 55 |Very limited | |Very limited | |Very limited | | | Flooding |1.00 | Cutbanks cave |1.00 | Droughty |0.99 | | | | Flooding |0.60 | Flooding |0.60 | | | | | | | Satatton------------| 42 |Very limited | |Very limited | |Very limited | | | Depth to |1.00 | Depth to |1.00 | Flooding |1.00 | | saturated zone | | saturated zone | | | | | Flooding |1.00 | Cutbanks cave |1.00 | Salinity |1.00 | | | | Flooding |0.80 | Sodium content |1.00 | | | | | | Depth to |1.00 | | | | | | saturated zone | | | | | | | Droughty |1.00 | | | | | | | CB1: | | | | | | | Beaches-------------|100 |Very limited | |Very limited | |Very limited | | | Depth to |1.00 | Flooding |1.00 | Flooding |1.00 | | saturated zone | | | | | | | Flooding |1.00 | Depth to |1.00 | Depth to |1.00 | | | | saturated zone | | saturated zone | | | | | Cutbanks cave |1.00 | Droughty |0.34 | | | | | | |
226 Soil Survey of
Table 12.--Roads and Streets, Shallow Excavations, and Lawns and Landscaping--Continued ________________________________________________________________________________________________________ | | | | Map symbol |Pct.| Local roads and | Shallow excavations | Lawns and landscaping and soil name | of | streets | | |map | | | |unit| | | | |_________________________|_________________________|_________________________ | | Rating class and |Value| Rating class and |Value| Rating class and |Value | | limiting features | | limiting features | | limiting features | _____________________|____|___________________|_____|___________________|_____|___________________|_____ | | | | | | | CB2: | | | | | | | Beaches-------------|100 |Very limited | |Very limited | |Very limited | | | Depth to |1.00 | Flooding |1.00 | Flooding |1.00 | | saturated zone | | | | | | | Flooding |1.00 | Depth to |1.00 | Depth to |1.00 | | | | saturated zone | | saturated zone | | | | | Cutbanks cave |1.00 | Droughty |0.34 | | | | | | | CB3: | | | | | | | Beaches-------------|100 |Very limited | |Very limited | |Very limited | | | Depth to |1.00 | Flooding |1.00 | Flooding |1.00 | | saturated zone | | | | | | | Flooding |1.00 | Depth to |1.00 | Depth to |1.00 | | | | saturated zone | | saturated zone | | | | | Cutbanks cave |1.00 | Gravel content |0.68 | | | | | | Droughty |0.34 | | | | | | | CB4: | | | | | | | Beaches-------------|100 |Very limited | |Very limited | |Very limited | | | Depth to |1.00 | Flooding |1.00 | Flooding |1.00 | | saturated zone | | | | | | | Flooding |1.00 | Depth to |1.00 | Depth to |1.00 | | | | saturated zone | | saturated zone | | | | | Cutbanks cave |1.00 | Droughty |0.34 | | | | | | | GF: | | | | | | | Baffin--------------| 95 |Very limited | |Very limited | |Very limited | | | Ponding |1.00 | Ponding |1.00 | Ponding |1.00 | | Depth to |1.00 | Depth to |1.00 | Salinity |1.00 | | saturated zone | | saturated zone | | | | | | | Cutbanks cave |0.10 | Sodium content |1.00 | | | | | | Depth to |1.00 | | | | | | saturated zone | | | | | | | | W: | | | | | | | Water---------------|100 |Not rated | |Not rated | |Not rated | | | | | | | | _____________________|____|___________________|_____|___________________|_____|___________________|_____
Padre Island National Seashore, Texas 227
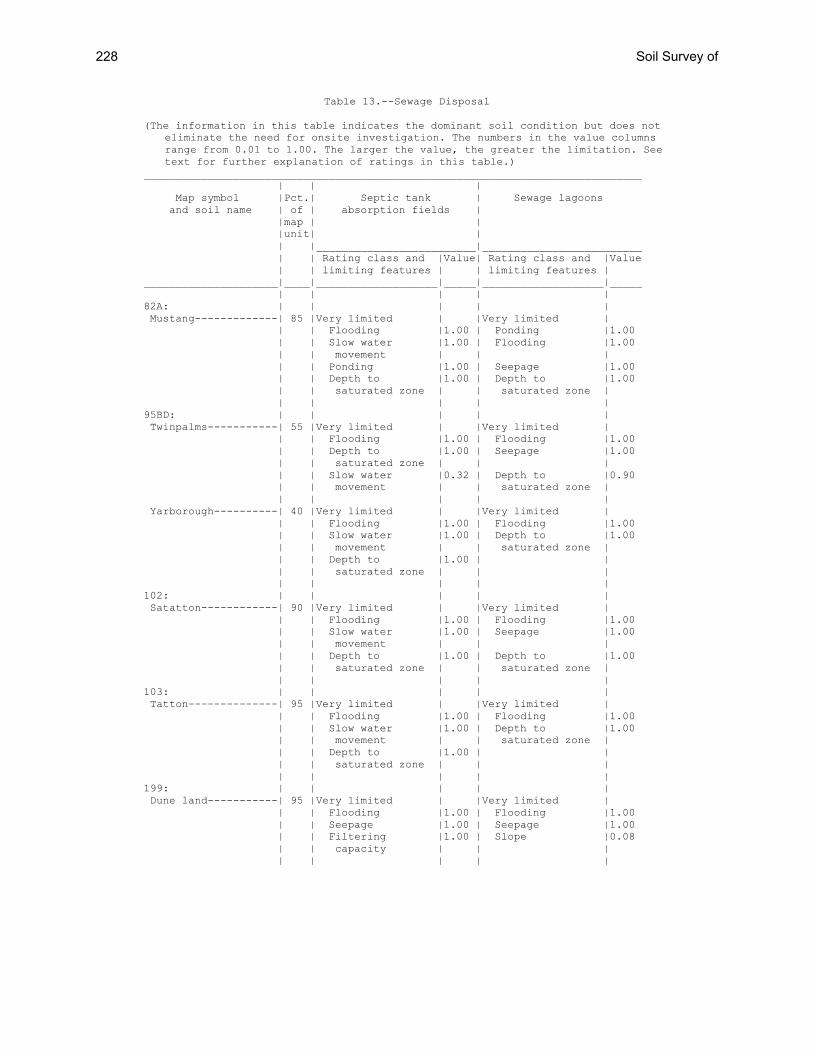
Table 13.--Sewage Disposal
(The information in this table indicates the dominant soil condition but does not eliminate the need for onsite investigation. The numbers in the value columns range from 0.01 to 1.00. The larger the value, the greater the limitation. See text for further explanation of ratings in this table.)
______________________________________________________________________________ | | | Map symbol |Pct.| Septic tank | Sewage lagoons and soil name | of | absorption fields | |map | | |unit| | | |_________________________|_________________________ | | Rating class and |Value| Rating class and |Value | | limiting features | | limiting features | _____________________|____|___________________|_____|___________________|_____ | | | | | 82A: | | | | | Mustang-------------| 85 |Very limited | |Very limited | | | Flooding |1.00 | Ponding |1.00 | | Slow water |1.00 | Flooding |1.00 | | movement | | | | | Ponding |1.00 | Seepage |1.00 | | Depth to |1.00 | Depth to |1.00 | | saturated zone | | saturated zone | | | | | | 95BD: | | | | | Twinpalms-----------| 55 |Very limited | |Very limited | | | Flooding |1.00 | Flooding |1.00 | | Depth to |1.00 | Seepage |1.00 | | saturated zone | | | | | Slow water |0.32 | Depth to |0.90 | | movement | | saturated zone | | | | | | Yarborough----------| 40 |Very limited | |Very limited | | | Flooding |1.00 | Flooding |1.00 | | Slow water |1.00 | Depth to |1.00 | | movement | | saturated zone | | | Depth to |1.00 | | | | saturated zone | | | | | | | | 102: | | | | | Satatton------------| 90 |Very limited | |Very limited | | | Flooding |1.00 | Flooding |1.00 | | Slow water |1.00 | Seepage |1.00 | | movement | | | | | Depth to |1.00 | Depth to |1.00 | | saturated zone | | saturated zone | | | | | | 103: | | | | | Tatton--------------| 95 |Very limited | |Very limited | | | Flooding |1.00 | Flooding |1.00 | | Slow water |1.00 | Depth to |1.00 | | movement | | saturated zone | | | Depth to |1.00 | | | | saturated zone | | | | | | | | 199: | | | | | Dune land-----------| 95 |Very limited | |Very limited | | | Flooding |1.00 | Flooding |1.00 | | Seepage |1.00 | Seepage |1.00 | | Filtering |1.00 | Slope |0.08 | | capacity | | | | | | | |
228 Soil Survey of
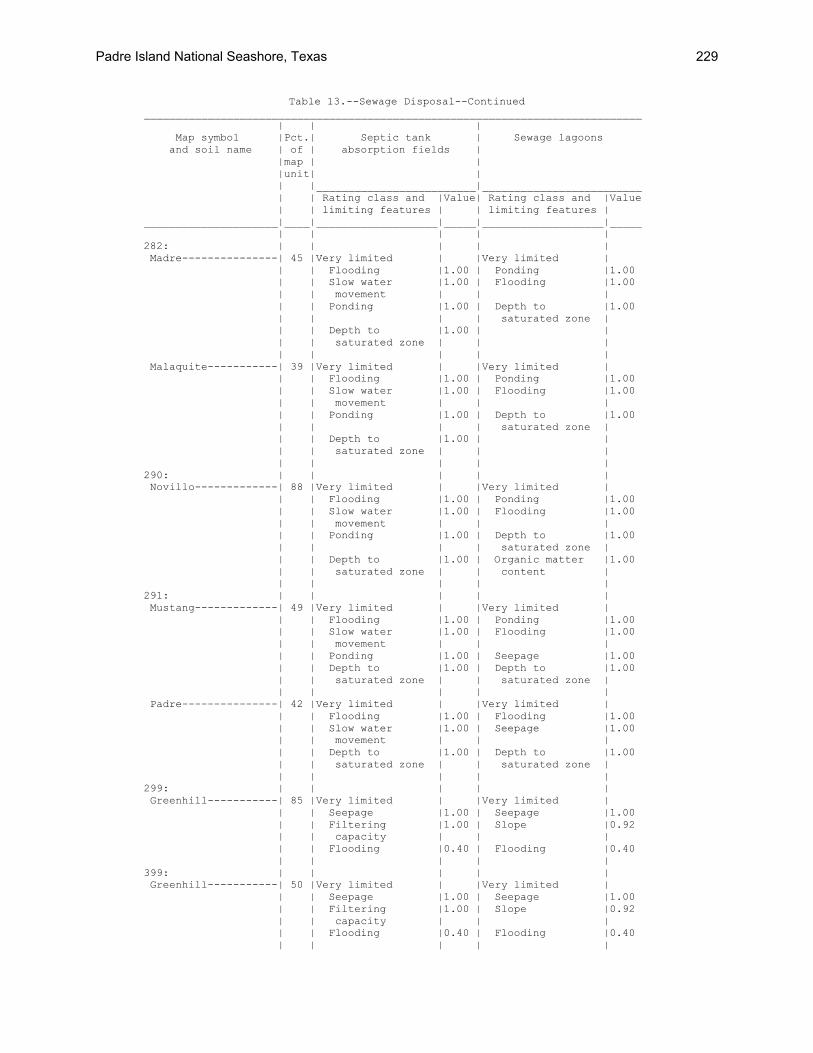
Table 13.--Sewage Disposal--Continued ______________________________________________________________________________ | | | Map symbol |Pct.| Septic tank | Sewage lagoons and soil name | of | absorption fields | |map | | |unit| | | |_________________________|_________________________ | | Rating class and |Value| Rating class and |Value | | limiting features | | limiting features | _____________________|____|___________________|_____|___________________|_____ | | | | | 282: | | | | | Madre---------------| 45 |Very limited | |Very limited | | | Flooding |1.00 | Ponding |1.00 | | Slow water |1.00 | Flooding |1.00 | | movement | | | | | Ponding |1.00 | Depth to |1.00 | | | | saturated zone | | | Depth to |1.00 | | | | saturated zone | | | | | | | | Malaquite-----------| 39 |Very limited | |Very limited | | | Flooding |1.00 | Ponding |1.00 | | Slow water |1.00 | Flooding |1.00 | | movement | | | | | Ponding |1.00 | Depth to |1.00 | | | | saturated zone | | | Depth to |1.00 | | | | saturated zone | | | | | | | | 290: | | | | | Novillo-------------| 88 |Very limited | |Very limited | | | Flooding |1.00 | Ponding |1.00 | | Slow water |1.00 | Flooding |1.00 | | movement | | | | | Ponding |1.00 | Depth to |1.00 | | | | saturated zone | | | Depth to |1.00 | Organic matter |1.00 | | saturated zone | | content | | | | | | 291: | | | | | Mustang-------------| 49 |Very limited | |Very limited | | | Flooding |1.00 | Ponding |1.00 | | Slow water |1.00 | Flooding |1.00 | | movement | | | | | Ponding |1.00 | Seepage |1.00 | | Depth to |1.00 | Depth to |1.00 | | saturated zone | | saturated zone | | | | | | Padre---------------| 42 |Very limited | |Very limited | | | Flooding |1.00 | Flooding |1.00 | | Slow water |1.00 | Seepage |1.00 | | movement | | | | | Depth to |1.00 | Depth to |1.00 | | saturated zone | | saturated zone | | | | | | 299: | | | | | Greenhill-----------| 85 |Very limited | |Very limited | | | Seepage |1.00 | Seepage |1.00 | | Filtering |1.00 | Slope |0.92 | | capacity | | | | | Flooding |0.40 | Flooding |0.40 | | | | | 399: | | | | | Greenhill-----------| 50 |Very limited | |Very limited | | | Seepage |1.00 | Seepage |1.00 | | Filtering |1.00 | Slope |0.92 | | capacity | | | | | Flooding |0.40 | Flooding |0.40 | | | | |
Padre Island National Seashore, Texas 229
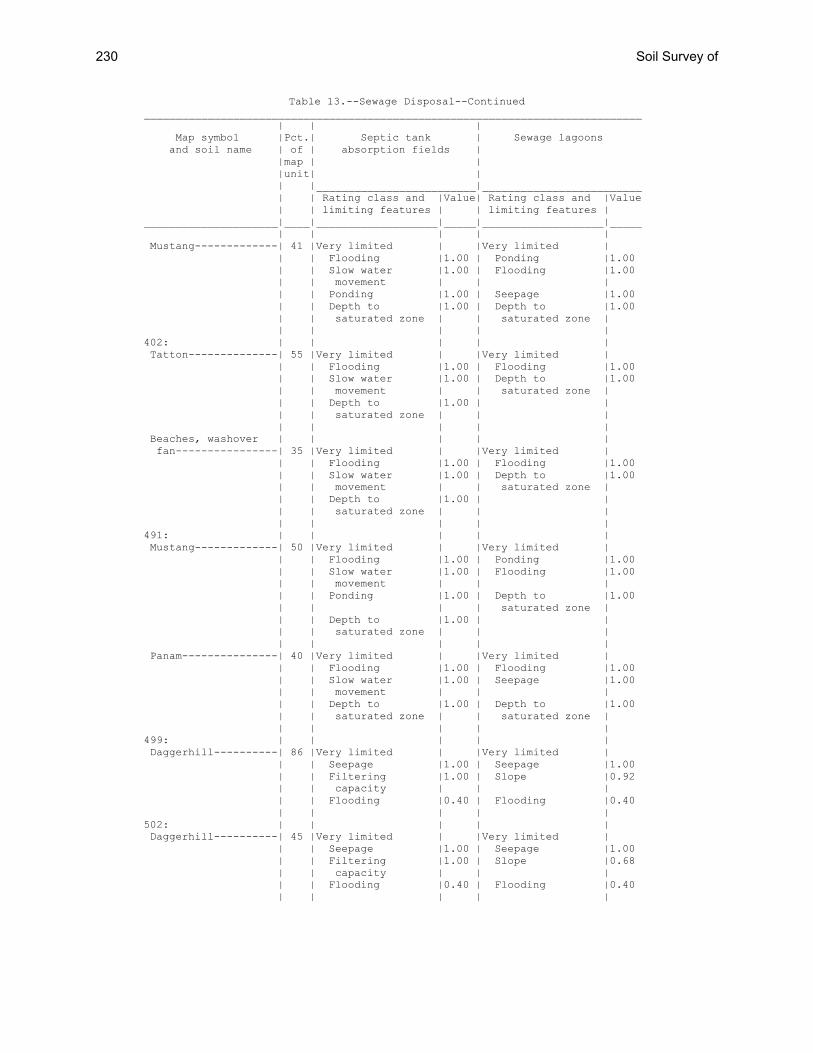
Table 13.--Sewage Disposal--Continued ______________________________________________________________________________ | | | Map symbol |Pct.| Septic tank | Sewage lagoons and soil name | of | absorption fields | |map | | |unit| | | |_________________________|_________________________ | | Rating class and |Value| Rating class and |Value | | limiting features | | limiting features | _____________________|____|___________________|_____|___________________|_____ | | | | | Mustang-------------| 41 |Very limited | |Very limited | | | Flooding |1.00 | Ponding |1.00 | | Slow water |1.00 | Flooding |1.00 | | movement | | | | | Ponding |1.00 | Seepage |1.00 | | Depth to |1.00 | Depth to |1.00 | | saturated zone | | saturated zone | | | | | | 402: | | | | | Tatton--------------| 55 |Very limited | |Very limited | | | Flooding |1.00 | Flooding |1.00 | | Slow water |1.00 | Depth to |1.00 | | movement | | saturated zone | | | Depth to |1.00 | | | | saturated zone | | | | | | | | Beaches, washover | | | | | fan----------------| 35 |Very limited | |Very limited | | | Flooding |1.00 | Flooding |1.00 | | Slow water |1.00 | Depth to |1.00 | | movement | | saturated zone | | | Depth to |1.00 | | | | saturated zone | | | | | | | | 491: | | | | | Mustang-------------| 50 |Very limited | |Very limited | | | Flooding |1.00 | Ponding |1.00 | | Slow water |1.00 | Flooding |1.00 | | movement | | | | | Ponding |1.00 | Depth to |1.00 | | | | saturated zone | | | Depth to |1.00 | | | | saturated zone | | | | | | | | Panam---------------| 40 |Very limited | |Very limited | | | Flooding |1.00 | Flooding |1.00 | | Slow water |1.00 | Seepage |1.00 | | movement | | | | | Depth to |1.00 | Depth to |1.00 | | saturated zone | | saturated zone | | | | | | 499: | | | | | Daggerhill----------| 86 |Very limited | |Very limited | | | Seepage |1.00 | Seepage |1.00 | | Filtering |1.00 | Slope |0.92 | | capacity | | | | | Flooding |0.40 | Flooding |0.40 | | | | | 502: | | | | | Daggerhill----------| 45 |Very limited | |Very limited | | | Seepage |1.00 | Seepage |1.00 | | Filtering |1.00 | Slope |0.68 | | capacity | | | | | Flooding |0.40 | Flooding |0.40 | | | | |
230 Soil Survey of
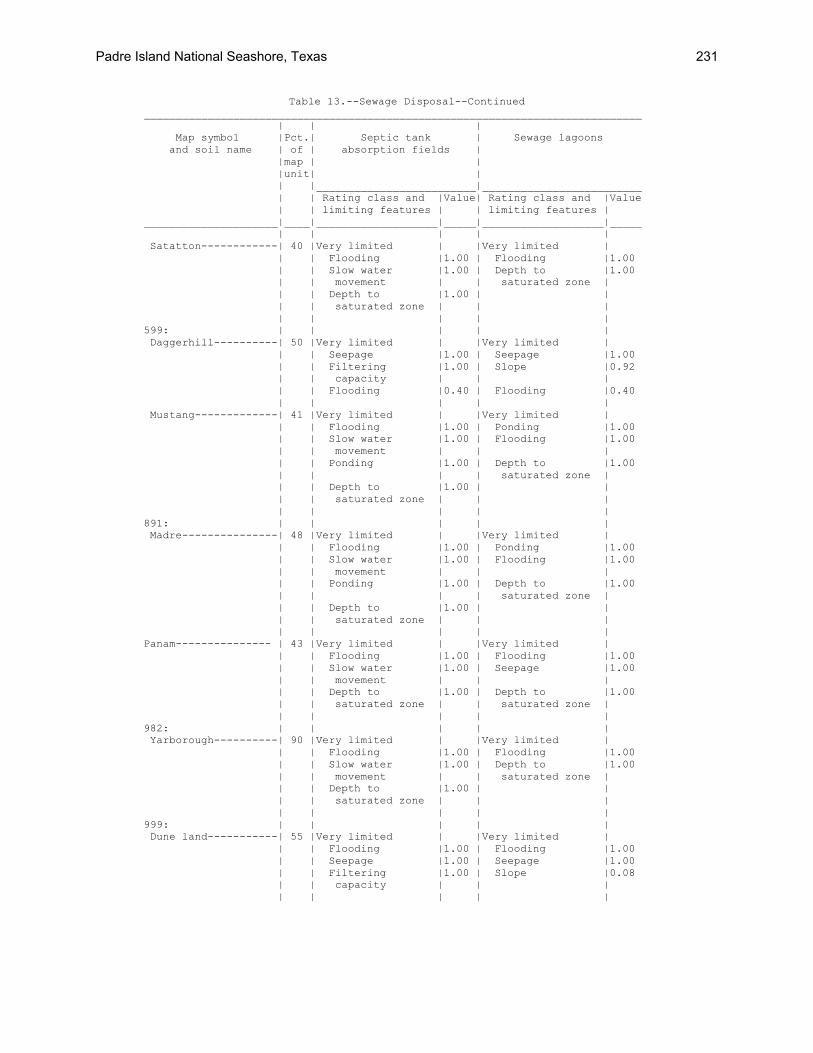
Table 13.--Sewage Disposal--Continued ______________________________________________________________________________ | | | Map symbol |Pct.| Septic tank | Sewage lagoons and soil name | of | absorption fields | |map | | |unit| | | |_________________________|_________________________ | | Rating class and |Value| Rating class and |Value | | limiting features | | limiting features | _____________________|____|___________________|_____|___________________|_____ | | | | | Satatton------------| 40 |Very limited | |Very limited | | | Flooding |1.00 | Flooding |1.00 | | Slow water |1.00 | Depth to |1.00 | | movement | | saturated zone | | | Depth to |1.00 | | | | saturated zone | | | | | | | | 599: | | | | | Daggerhill----------| 50 |Very limited | |Very limited | | | Seepage |1.00 | Seepage |1.00 | | Filtering |1.00 | Slope |0.92 | | capacity | | | | | Flooding |0.40 | Flooding |0.40 | | | | | Mustang-------------| 41 |Very limited | |Very limited | | | Flooding |1.00 | Ponding |1.00 | | Slow water |1.00 | Flooding |1.00 | | movement | | | | | Ponding |1.00 | Depth to |1.00 | | | | saturated zone | | | Depth to |1.00 | | | | saturated zone | | | | | | | | 891: | | | | | Madre---------------| 48 |Very limited | |Very limited | | | Flooding |1.00 | Ponding |1.00 | | Slow water |1.00 | Flooding |1.00 | | movement | | | | | Ponding |1.00 | Depth to |1.00 | | | | saturated zone | | | Depth to |1.00 | | | | saturated zone | | | | | | | | Panam--------------- | 43 |Very limited | |Very limited | | | Flooding |1.00 | Flooding |1.00 | | Slow water |1.00 | Seepage |1.00 | | movement | | | | | Depth to |1.00 | Depth to |1.00 | | saturated zone | | saturated zone | | | | | | 982: | | | | | Yarborough----------| 90 |Very limited | |Very limited | | | Flooding |1.00 | Flooding |1.00 | | Slow water |1.00 | Depth to |1.00 | | movement | | saturated zone | | | Depth to |1.00 | | | | saturated zone | | | | | | | | 999: | | | | | Dune land-----------| 55 |Very limited | |Very limited | | | Flooding |1.00 | Flooding |1.00 | | Seepage |1.00 | Seepage |1.00 | | Filtering |1.00 | Slope |0.08 | | capacity | | | | | | | |
Padre Island National Seashore, Texas 231
Table 13.--Sewage Disposal--Continued ______________________________________________________________________________ | | | Map symbol |Pct.| Septic tank | Sewage lagoons and soil name | of | absorption fields | |map | | |unit| | | |_________________________|_________________________ | | Rating class and |Value| Rating class and |Value | | limiting features | | limiting features | _____________________|____|___________________|_____|___________________|_____ | | | | | Satatton------------| 42 |Very limited | |Very limited | | | Flooding |1.00 | Flooding |1.00 | | Slow water |1.00 | Depth to |1.00 | | movement | | saturated zone | | | Depth to |1.00 | | | | saturated zone | | | | | | | | CB1: | | | | | Beaches-------------|100 |Very limited | |Very limited | | | Flooding |1.00 | Flooding |1.00 | | Depth to |1.00 | Seepage |1.00 | | saturated zone | | | | | Seepage |1.00 | Depth to |1.00 | | | | saturated zone | | | Filtering |1.00 | | | | capacity | | | | | | | | CB2: | | | | | Beaches-------------|100 |Very limited | |Very limited | | | Flooding |1.00 | Flooding |1.00 | | Depth to |1.00 | Seepage |1.00 | | saturated zone | | | | | Seepage |1.00 | Depth to |1.00 | | | | saturated zone | | | Filtering |1.00 | | | | capacity | | | | | | | | CB3: | | | | | Beaches-------------|100 |Very limited | |Very limited | | | Flooding |1.00 | Flooding |1.00 | | Depth to |1.00 | Seepage |1.00 | | saturated zone | | | | | Seepage |1.00 | Depth to |1.00 | | | | saturated zone | | | Filtering |1.00 | | | | capacity | | | | | | | | CB4: | | | | | Beaches-------------|100 |Very limited | |Very limited | | | Flooding |1.00 | Flooding |1.00 | | Depth to |1.00 | Seepage |1.00 | | saturated zone | | | | | Seepage |1.00 | Depth to |1.00 | | | | saturated zone | | | Filtering |1.00 | | | | capacity | | | | | | | | GF: | | | | | Baffin--------------| 95 |Very limited | |Very limited | | | Ponding |1.00 | Ponding |1.00 | | Depth to |1.00 | Depth to |1.00 | | saturated zone | | saturated zone | | | Slow water |1.00 | | | | movement | | | | | | | | W: | | | | | Water---------------|100 |Not rated | |Not rated | | | | | | _____________________|____|___________________|_____|___________________|_____
232 Soil Survey of
Table 14.--Landfills
(The information in this table indicates the dominant soil condition but does not eliminate the need for onsite investigation. The numbers in the value columns range from 0.01 to 1.00. The larger the value, the greater the limitation. See text for further explanation of ratings in this table.)
________________________________________________________________________________________________________ | | | | Map symbol |Pct.| Trench sanitary | Area sanitary | Daily cover for and soil name | of | landfill | landfill | landfill |map | | | |unit| | | | |_________________________|_________________________|_________________________ | | Rating class and |Value| Rating class and |Value| Rating class and |Value | | limiting features | | limiting features | | limiting features | _____________________|____|___________________|_____|___________________|_____|___________________|_____ | | | | | | | 82A: | | | | | | | Mustang-------------| 85 |Very limited | |Very limited | |Very limited | | | Flooding |1.00 | Flooding |1.00 | Ponding |1.00 | | Depth to |1.00 | Ponding |1.00 | Depth to |1.00 | | saturated zone | | | | saturated zone | | | Ponding |1.00 | Depth to |1.00 | Too sandy |1.00 | | | | saturated zone | | | | | Too sandy |1.00 | | | | | | | | | | | 95BD: | | | | | | | Twinpalms-----------| 55 |Very limited | |Very limited | |Very limited | | | Flooding |1.00 | Flooding |1.00 | Too sandy |1.00 | | Depth to |1.00 | Depth to |1.00 | Gravel content |0.01 | | saturated zone | | saturated zone | | | | | Too sandy |1.00 | Seepage |1.00 | | | | | | | | | Yarborough----------| 40 |Very limited | |Very limited | |Very limited | | | Flooding |1.00 | Flooding |1.00 | Salinity |1.00 | | Depth to |1.00 | Depth to |1.00 | Sodium content |1.00 | | saturated zone | | saturated zone | | | | | Excess sodium |1.00 | | | Depth to |0.99 | | | | | | saturated zone | | | Excess salt |1.00 | | | | | | | | | | | 102: | | | | | | | Satatton------------| 90 |Very limited | |Very limited | |Very limited | | | Flooding |1.00 | Flooding |1.00 | Depth to |1.00 | | | | | | saturated zone | | | Depth to |1.00 | Depth to |1.00 | Too sandy |1.00 | | saturated zone | | saturated zone | | | | | Excess sodium |1.00 | | | Salinity |1.00 | | Excess salt |1.00 | | | Sodium content |1.00 | | Too sandy |1.00 | | | | | | | | | | | 103: | | | | | | | Tatton--------------| 95 |Very limited | |Very limited | |Very limited | | | Flooding |1.00 | Flooding |1.00 | Depth to |1.00 | | | | | | saturated zone | | | Depth to |1.00 | Depth to |1.00 | Salinity |1.00 | | saturated zone | | saturated zone | | | | | Excess sodium |1.00 | | | Sodium content |1.00 | | Excess salt |1.00 | | | Too sandy |0.50 | | Too sandy |0.50 | | | | | | | | | | | 199: | | | | | | | Dune land-----------| 95 |Very limited | |Very limited | |Very limited | | | Flooding |1.00 | Flooding |1.00 | Too sandy |1.00 | | Seepage |1.00 | Seepage |1.00 | Seepage |1.00 | | Too sandy |1.00 | | | | | | | | | | |
Padre Island National Seashore, Texas 233
Table 14.--Landfills--Continued ________________________________________________________________________________________________________ | | | | Map symbol |Pct.| Trench sanitary | Area sanitary | Daily cover for and soil name | of | landfill | landfill | landfill |map | | | |unit| | | | |_________________________|_________________________|_________________________ | | Rating class and |Value| Rating class and |Value| Rating class and |Value | | limiting features | | limiting features | | limiting features | _____________________|____|___________________|_____|___________________|_____|___________________|_____ | | | | | | | 282: | | | | | | | Madre---------------| 45 |Very limited | |Very limited | |Very limited | | | Flooding |1.00 | Flooding |1.00 | Ponding |1.00 | | Depth to |1.00 | Ponding |1.00 | Depth to |1.00 | | saturated zone | | | | saturated zone | | | Ponding |1.00 | Depth to |1.00 | Too sandy |1.00 | | | | saturated zone | | | | | Too sandy |1.00 | | | Sodium content |1.00 | | Excess sodium |1.00 | | | | | | | | | | | Malaquite-----------| 39 |Very limited | |Very limited | |Very limited | | | Flooding |1.00 | Flooding |1.00 | Ponding |1.00 | | Depth to |1.00 | Ponding |1.00 | Depth to |1.00 | | saturated zone | | | | saturated zone | | | Ponding |1.00 | Depth to |1.00 | Too sandy |1.00 | | | | saturated zone | | | | | Excess sodium |1.00 | | | Salinity |1.00 | | Excess salt |1.00 | | | Sodium content |1.00 | | | | | | | 290: | | | | | | | Novillo-------------| 88 |Very limited | |Very limited | |Very limited | | | Flooding |1.00 | Flooding |1.00 | Ponding |1.00 | | Depth to |1.00 | Ponding |1.00 | Depth to |1.00 | | saturated zone | | | | saturated zone | | | Ponding |1.00 | Depth to |1.00 | Too sandy |1.00 | | | | saturated zone | | | | | Too sandy |1.00 | | | | | | | | | | | 291: | | | | | | | Mustang-------------| 49 |Very limited | |Very limited | |Very limited | | | Flooding |1.00 | Flooding |1.00 | Ponding |1.00 | | Depth to |1.00 | Ponding |1.00 | Depth to |1.00 | | saturated zone | | | | saturated zone | | | Ponding |1.00 | Depth to |1.00 | Too sandy |1.00 | | | | saturated zone | | | | | Too sandy |1.00 | | | | | | | | | | | Padre---------------| 42 |Very limited | |Very limited | |Very limited | | | Flooding |1.00 | Flooding |1.00 | Too sandy |1.00 | | Depth to |1.00 | Depth to |1.00 | Depth to |0.01 | | saturated zone | | saturated zone | | saturated zone | | | Too sandy |1.00 | Seepage |1.00 | | | | | | | | | 299: | | | | | | | Greenhill-----------| 85 |Very limited | |Very limited | |Very limited | | | Seepage |1.00 | Seepage |1.00 | Too sandy |1.00 | | Too sandy |1.00 | Flooding |0.40 | Seepage |1.00 | | Flooding |0.40 | | | | | | | | | | | 399: | | | | | | | Greenhill-----------| 50 |Very limited | |Very limited | |Very limited | | | Seepage |1.00 | Seepage |1.00 | Too sandy |1.00 | | Too sandy |1.00 | Flooding |0.40 | Seepage |1.00 | | Flooding |0.40 | | | | | | | | | | |
234 Soil Survey of
Table 14.--Landfills--Continued ________________________________________________________________________________________________________ | | | | Map symbol |Pct.| Trench sanitary | Area sanitary | Daily cover for and soil name | of | landfill | landfill | landfill |map | | | |unit| | | | |_________________________|_________________________|_________________________ | | Rating class and |Value| Rating class and |Value| Rating class and |Value | | limiting features | | limiting features | | limiting features | _____________________|____|___________________|_____|___________________|_____|___________________|_____ | | | | | | | Mustang-------------| 41 |Very limited | |Very limited | |Very limited | | | Flooding |1.00 | Flooding |1.00 | Ponding |1.00 | | Depth to |1.00 | Ponding |1.00 | Depth to |1.00 | | saturated zone | | | | saturated zone | | | Ponding |1.00 | Depth to |1.00 | Too sandy |1.00 | | | | saturated zone | | | | | Too sandy |1.00 | | | | | | | | | | | 402: | | | | | | | Tatton--------------| 55 |Very limited | |Very limited | |Very limited | | | Flooding |1.00 | Flooding |1.00 | Depth to |1.00 | | | | | | saturated zone | | | Depth to |1.00 | Depth to |1.00 | Salinity |1.00 | | saturated zone | | saturated zone | | | | | Excess sodium |1.00 | | | Sodium content |1.00 | | Excess salt |1.00 | | | Too sandy |0.50 | | Too sandy |0.50 | | | | | | | | | | | Beaches, washover | | | | | | | fan----------------| 35 |Very limited | |Very limited | |Very limited | | | Flooding |1.00 | Flooding |1.00 | Depth to |1.00 | | | | | | saturated zone | | | Depth to |1.00 | Depth to |1.00 | Too sandy |1.00 | | saturated zone | | saturated zone | | | | | Excess sodium |1.00 | | | Salinity |1.00 | | Excess salt |1.00 | | | Sodium content |1.00 | | Too sandy |1.00 | | | | | | | | | | | 491: | | | | | | | Mustang-------------| 50 |Very limited | |Very limited | |Very limited | | | Flooding |1.00 | Flooding |1.00 | Ponding |1.00 | | Depth to |1.00 | Ponding |1.00 | Depth to |1.00 | | saturated zone | | | | saturated zone | | | Ponding |1.00 | Depth to |1.00 | Too sandy |1.00 | | | | saturated zone | | | | | Too sandy |1.00 | | | | | | | | | | | Panam---------------| 40 |Very limited | |Very limited | |Very limited | | | Flooding |1.00 | Flooding |1.00 | Too sandy |1.00 | | Depth to |1.00 | Depth to |1.00 | Depth to |0.01 | | saturated zone | | saturated zone | | saturated zone | | | Too sandy |1.00 | Seepage |1.00 | | | | | | | | | 499: | | | | | | | Daggerhill----------| 86 |Very limited | |Very limited | |Very limited | | | Seepage |1.00 | Seepage |1.00 | Too sandy |1.00 | | Too sandy |1.00 | Flooding |0.40 | Seepage |1.00 | | Flooding |0.40 | | | | | | | | | | | 502: | | | | | | | Daggerhill----------| 45 |Very limited | |Very limited | |Very limited | | | Seepage |1.00 | Seepage |1.00 | Too sandy |1.00 | | Too sandy |1.00 | Flooding |0.40 | Seepage |1.00 | | Flooding |0.40 | | | | | | | | | | |
Padre Island National Seashore, Texas 235
Table 14.--Landfills--Continued ________________________________________________________________________________________________________ | | | | Map symbol |Pct.| Trench sanitary | Area sanitary | Daily cover for and soil name | of | landfill | landfill | landfill |map | | | |unit| | | | |_________________________|_________________________|_________________________ | | Rating class and |Value| Rating class and |Value| Rating class and |Value | | limiting features | | limiting features | | limiting features | _____________________|____|___________________|_____|___________________|_____|___________________|_____ | | | | | | | Satatton------------| 40 |Very limited | |Very limited | |Very limited | | | Flooding |1.00 | Flooding |1.00 | Depth to |1.00 | | | | | | saturated zone | | | Depth to |1.00 | Depth to |1.00 | Too sandy |1.00 | | saturated zone | | saturated zone | | | | | Excess sodium |1.00 | | | Salinity |1.00 | | Excess salt |1.00 | | | Sodium content |1.00 | | Too sandy |1.00 | | | | | | | | | | | 599: | | | | | | | Daggerhill----------| 50 |Very limited | |Very limited | |Very limited | | | Seepage |1.00 | Seepage |1.00 | Too sandy |1.00 | | Too sandy |1.00 | Flooding |0.40 | Seepage |1.00 | | Flooding |0.40 | | | | | | | | | | | Mustang-------------| 41 |Very limited | |Very limited | |Very limited | | | Flooding |1.00 | Flooding |1.00 | Ponding |1.00 | | Depth to |1.00 | Ponding |1.00 | Depth to |1.00 | | saturated zone | | | | saturated zone | | | Ponding |1.00 | Depth to |1.00 | Too sandy |1.00 | | | | saturated zone | | | | | Too sandy |1.00 | | | | | | | | | | | 891: | | | | | | | Madre---------------| 48 |Very limited | |Very limited | |Very limited | | | Flooding |1.00 | Flooding |1.00 | Ponding |1.00 | | Depth to |1.00 | Ponding |1.00 | Depth to |1.00 | | saturated zone | | | | saturated zone | | | Ponding |1.00 | Depth to |1.00 | Too sandy |1.00 | | | | saturated zone | | | | | Too sandy |1.00 | | | Sodium content |1.00 | | Excess sodium |1.00 | | | | | | | | | | | Panam---------------| 43 |Very limited | |Very limited | |Very limited | | | Flooding |1.00 | Flooding |1.00 | Too sandy |1.00 | | Depth to |1.00 | Depth to |1.00 | Depth to |0.01 | | saturated zone | | saturated zone | | saturated zone | | | Too sandy |1.00 | Seepage |1.00 | | | | | | | | | 982: | | | | | | | Yarborough----------| 90 |Very limited | |Very limited | |Very limited | | | Flooding |1.00 | Flooding |1.00 | Salinity |1.00 | | Depth to |1.00 | Depth to |1.00 | Sodium content |1.00 | | saturated zone | | saturated zone | | | | | Excess sodium |1.00 | | | Depth to |0.99 | | | | | | saturated zone | | | Excess salt |1.00 | | | | | | | | | | | 999: | | | | | | | Dune land-----------| 55 |Very limited | |Very limited | |Very limited | | | Flooding |1.00 | Flooding |1.00 | Too sandy |1.00 | | Seepage |1.00 | Seepage |1.00 | Seepage |1.00 | | Too sandy |1.00 | | | | | | | | | | |
236 Soil Survey of
Table 14.--Landfills--Continued ________________________________________________________________________________________________________ | | | | Map symbol |Pct.| Trench sanitary | Area sanitary | Daily cover for and soil name | of | landfill | landfill | landfill |map | | | |unit| | | | |_________________________|_________________________|_________________________ | | Rating class and |Value| Rating class and |Value| Rating class and |Value | | limiting features | | limiting features | | limiting features | _____________________|____|___________________|_____|___________________|_____|___________________|_____ | | | | | | | Satatton------------| 42 |Very limited | |Very limited | |Very limited | | | Flooding |1.00 | Flooding |1.00 | Depth to |1.00 | | | | | | saturated zone | | | Depth to |1.00 | Depth to |1.00 | Too sandy |1.00 | | saturated zone | | saturated zone | | | | | Excess sodium |1.00 | | | Salinity |1.00 | | Excess salt |1.00 | | | Sodium content |1.00 | | Too sandy |1.00 | | | | | | | | | | | CB1: | | | | | | | Beaches-------------|100 |Very limited | |Very limited | |Very limited | | | Flooding |1.00 | Flooding |1.00 | Depth to |1.00 | | | | | | saturated zone | | | Depth to |1.00 | Depth to |1.00 | Too sandy |1.00 | | saturated zone | | saturated zone | | | | | Seepage |1.00 | Seepage |1.00 | Seepage |1.00 | | Too sandy |1.00 | | | | | | | | | | | CB2: | | | | | | | Beaches-------------|100 |Very limited | |Very limited | |Very limited | | | Flooding |1.00 | Flooding |1.00 | Depth to |1.00 | | | | | | saturated zone | | | Depth to |1.00 | Depth to |1.00 | Seepage |1.00 | | saturated zone | | saturated zone | | | | | Seepage |1.00 | Seepage |1.00 | | | | | | | | | CB3: | | | | | | | Beaches-------------|100 |Very limited | |Very limited | |Very limited | | | Flooding |1.00 | Flooding |1.00 | Depth to |1.00 | | | | | | saturated zone | | | Depth to |1.00 | Depth to |1.00 | Seepage |1.00 | | saturated zone | | saturated zone | | | | | Seepage |1.00 | Seepage |1.00 | | | | | | | | | CB4: | | | | | | | Beaches-------------|100 |Very limited | |Very limited | |Very limited | | | Flooding |1.00 | Flooding |1.00 | Depth to |1.00 | | | | | | saturated zone | | | Depth to |1.00 | Depth to |1.00 | Too sandy |1.00 | | saturated zone | | saturated zone | | | | | Seepage |1.00 | Seepage |1.00 | Seepage |1.00 | | Too sandy |1.00 | | | | | | | | | | | GF: | | | | | | | Baffin--------------| 95 |Very limited | |Very limited | |Very limited | | | Depth to |1.00 | Ponding |1.00 | Ponding |1.00 | | saturated zone | | | | | | | Ponding |1.00 | Depth to |1.00 | Depth to |1.00 | | | | saturated zone | | saturated zone | | | Excess sodium |1.00 | | | Salinity |1.00 | | Excess salt |1.00 | | | Sodium content |1.00 | | | | | | | W: | | | | | | | Water---------------|100 |Not rated | |Not rated | |Not rated | | | | | | | | _____________________|____|___________________|_____|___________________|_____|___________________|_____
Padre Island National Seashore, Texas 237
Table 15.--Source of Gravel and Sand (The information in this table indicates the dominant soil condition but does
not eliminate the need for onsite investigation. The ratings given for the thickest layer are for the thickest layer above and excluding the bottom layer. The numbers in the value columns range from 0.00 to 0.99. The greater the value, the greater the likelihood that the bottom layer or thickest layer of the soil is a source of sand or gravel. See text for further explanation of ratings in this table.)
______________________________________________________________________________ | | | Map symbol |Pct.| Potential source of | Potential source of and soil name | of | gravel | sand |map | | |unit| | | |_________________________|_________________________ | | Rating class |Value| Rating class |Value _____________________|____|___________________|_____|___________________|_____ | | | | | 82A: | | | | | Mustang-------------| 85 |Poor | |Fair | | | Bottom layer |0.00 | Bottom layer |0.30 | | Thickest layer |0.00 | Thickest layer |0.30 | | | | | 95BD: | | | | | Twinpalms-----------| 55 |Poor | |Fair | | | Bottom layer |0.00 | Bottom layer |0.11 | | Thickest layer |0.00 | Thickest layer |0.27 | | | | | Yarborough----------| 40 |Poor | |Fair | | | Bottom layer |0.00 | Bottom layer |0.03 | | Thickest layer |0.00 | Thickest layer |0.06 | | | | | 102: | | | | | Satatton------------| 90 |Poor | |Fair | | | Bottom layer |0.00 | Thickest layer |0.11 | | Thickest layer |0.00 | Bottom layer |0.13 | | | | | 103: | | | | | Tatton--------------| 95 |Poor | |Fair | | | Bottom layer |0.00 | Bottom layer |0.07 | | Thickest layer |0.00 | Thickest layer |0.07 | | | | | 199: | | | | | Dune land-----------| 95 |Poor | |Fair | | | Bottom layer |0.00 | Bottom layer |0.35 | | Thickest layer |0.00 | Thickest layer |0.35 | | | | | 282: | | | | | Madre---------------| 45 |Poor | |Fair | | | Bottom layer |0.00 | Bottom layer |0.35 | | Thickest layer |0.00 | Thickest layer |0.35 | | | | | Malaquite-----------| 39 |Poor | |Fair | | | Bottom layer |0.00 | Bottom layer |0.30 | | Thickest layer |0.00 | Thickest layer |0.30 | | | | | 290: | | | | | Novillo-------------| 88 |Poor | |Fair | | | Bottom layer |0.00 | Bottom layer |0.35 | | Thickest layer |0.00 | Thickest layer |0.35 | | | | | 291: | | | | | Mustang-------------| 49 |Poor | |Fair | | | Bottom layer |0.00 | Thickest layer |0.30 | | Thickest layer |0.00 | Bottom layer |0.35 | | | | |
238 Soil Survey of
Table 15.--Source of Gravel and Sand--Continued ______________________________________________________________________________ | | | Map symbol |Pct.| Potential source of | Potential source of and soil name | of | gravel | sand |map | | |unit| | | |_________________________|_________________________ | | Rating class |Value| Rating class |Value _____________________|____|___________________|_____|___________________|_____ | | | | | Padre---------------| 42 |Poor | |Fair | | | Bottom layer |0.00 | Bottom layer |0.35 | | Thickest layer |0.00 | Thickest layer |0.35 | | | | | 299: | | | | | Greenhill-----------| 85 |Poor | |Fair | | | Bottom layer |0.00 | Bottom layer |0.40 | | Thickest layer |0.00 | Thickest layer |0.40 | | | | | 399: | | | | | Greenhill-----------| 50 |Poor | |Fair | | | Bottom layer |0.00 | Bottom layer |0.40 | | Thickest layer |0.00 | Thickest layer |0.40 | | | | | Mustang-------------| 41 |Poor | |Fair | | | Bottom layer |0.00 | Thickest layer |0.30 | | Thickest layer |0.00 | Bottom layer |0.35 | | | | | 402: | | | | | Tatton--------------| 55 |Poor | |Fair | | | Bottom layer |0.00 | Thickest layer |0.13 | | Thickest layer |0.00 | Bottom layer |0.15 | | | | | Beaches, washover | | | | | fan----------------| 35 |Poor | |Fair | | | Bottom layer |0.00 | Bottom layer |0.12 | | Thickest layer |0.00 | Thickest layer |0.12 | | | | | 491: | | | | | Mustang-------------| 50 |Poor | |Fair | | | Bottom layer |0.00 | Thickest layer |0.30 | | Thickest layer |0.00 | Bottom layer |0.40 | | | | | Panam----------------| 40 |Poor | |Fair | | | Bottom layer |0.00 | Bottom layer |0.40 | | Thickest layer |0.00 | Thickest layer |0.40 | | | | | 499: | | | | | Daggerhill----------| 86 |Poor | |Fair | | | Bottom layer |0.00 | Bottom layer |0.35 | | Thickest layer |0.00 | Thickest layer |0.35 | | | | | 502: | | | | | Daggerhill----------| 45 |Poor | |Fair | | | Bottom layer |0.00 | Bottom layer |0.35 | | Thickest layer |0.00 | Thickest layer |0.35 | | | | | Satatton------------| 40 |Poor | |Fair | | | Bottom layer |0.00 | Thickest layer |0.11 | | Thickest layer |0.00 | Bottom layer |0.13 | | | | | 599: | | | | | Daggerhill----------| 50 |Poor | |Fair | | | Bottom layer |0.00 | Bottom layer |0.35 | | Thickest layer |0.00 | Thickest layer |0.35 | | | | | Mustang-------------| 41 |Poor | |Fair | | | Bottom layer |0.00 | Thickest layer |0.30 | | Thickest layer |0.00 | Bottom layer |0.40 | | | | |
Padre Island National Seashore, Texas 239
Table 15.--Source of Gravel and Sand--Continued ______________________________________________________________________________ | | | Map symbol |Pct.| Potential source of | Potential source of and soil name | of | gravel | sand |map | | |unit| | | |_________________________|_________________________ | | Rating class |Value| Rating class |Value _____________________|____|___________________|_____|___________________|_____ | | | | | 891: | | | | | Madre---------------| 48 |Poor | |Fair | | | Bottom layer |0.00 | Bottom layer |0.35 | | Thickest layer |0.00 | Thickest layer |0.35 | | | | | Panam---------------| 43 |Poor | |Fair | | | Bottom layer |0.00 | Bottom layer |0.35 | | Thickest layer |0.00 | Thickest layer |0.35 | | | | | 982: | | | | | Yarborough----------| 90 |Poor | |Fair | | | Bottom layer |0.00 | Bottom layer |0.03 | | Thickest layer |0.00 | Thickest layer |0.06 | | | | | 999: | | | | | Dune land-----------| 55 |Poor | |Fair | | | Bottom layer |0.00 | Bottom layer |0.35 | | Thickest layer |0.00 | Thickest layer |0.35 | | | | | Satatton------------| 42 |Poor | |Fair | | | Bottom layer |0.00 | Thickest layer |0.11 | | Thickest layer |0.00 | Bottom layer |0.13 | | | | | CB1: | | | | | Beaches-------------|100 |Poor | |Fair | | | Bottom layer |0.00 | Bottom layer |0.35 | | Thickest layer |0.00 | Thickest layer |0.35 | | | | | CB2: | | | | | Beaches-------------|100 |Poor | |Fair | | | Bottom layer |0.00 | Bottom layer |0.00 | | Thickest layer |0.00 | Thickest layer |0.35 | | | | | CB3: | | | | | Beaches-------------|100 |Poor | |Fair | | | Bottom layer |0.00 | Bottom layer |0.00 | | Thickest layer |0.00 | Thickest layer |0.35 | | | | | CB4: | | | | | Beaches-------------|100 |Poor | |Fair | | | Bottom layer |0.00 | Bottom layer |0.00 | | Thickest layer |0.00 | Thickest layer |0.35 | | | | | GF: | | | | | Baffin--------------| 95 |Poor | |Fair | | | Bottom layer |0.00 | Thickest layer |0.05 | | Thickest layer |0.00 | Bottom layer |0.06 | | | | | W: | | | | | Water---------------|100 |Not rated | |Not rated | | | | | | | | | | | _____________________|____|___________________|_____|___________________|_____
240 Soil Survey of
Table 16.--Source of Reclamation Material, Roadfill, and Topsoil (The information in this table indicates the dominant soil condition but does not eliminate the need
for onsite investigation. The numbers in the value columns range from 0.00 to 0.99. The smaller the value, the greater the limitation. See text for further explanation of ratings in this table.)
________________________________________________________________________________________________________ | | | | Map symbol |Pct.| Potential source of | Potential source of | Potential source of and soil name | of | reclamation material | roadfill | topsoil |map | | | |unit| | | | |_________________________|_________________________|_________________________ | | Rating class and |Value| Rating class and |Value| Rating class and |Value | | limiting features | | limiting features | | limiting features | _____________________|____|___________________|_____|___________________|_____|___________________|_____ | | | | | | | 82A: | | | | | | | Mustang-------------| 85 |Poor | |Poor | |Poor | | | Too sandy |0.00 | Wetness depth |0.00 | Too sandy |0.00 | | Wind erosion |0.00 | | | Wetness depth |0.00 | | Droughty |0.01 | | | | | | Organic matter |0.18 | | | | | | content low | | | | | | | | | | | | 95BD: | | | | | | | Twinpalms-----------| 55 |Poor | |Good | |Poor | | | Too sandy |0.00 | | | Too sandy |0.00 | | Wind erosion |0.00 | | | Hard to reclaim |0.68 | | | | | | (rock fragments)| | | Droughty |0.01 | | | | | | Organic matter |0.18 | | | | | | content low | | | | | | | | | | | | Yarborough----------| 40 |Poor | |Fair | |Poor | | | Salinity |0.00 | Wetness depth |0.14 | Sodium content |0.00 | | Sodium content |0.00 | | | Salinity |0.00 | | Droughty |0.01 | | | Wetness depth |0.14 | | Organic matter |0.18 | | | Rock fragments |0.98 | | content low | | | | | | | | | | | | 102: | | | | | | | Satatton------------| 90 |Poor | |Poor | |Not rated | | | Wind erosion |0.00 | Wetness depth |0.00 | | | | Droughty |0.00 | | | | | | Salinity |0.00 | | | | | | Sodium content |0.00 | | | | | | Too sandy |0.00 | | | | | | Organic matter |0.68 | | | | | | content low | | | | | | | | | | | | 103: | | | | | | | Tatton--------------| 95 |Poor | |Poor | |Not rated | | | Wind erosion |0.00 | Wetness depth |0.00 | | | | Salinity |0.00 | | | | | | Sodium content |0.00 | | | | | | Too sandy |0.00 | | | | | | Organic matter |0.08 | | | | | | content low | | | | | | | Droughty |0.74 | | | | | | | | | | | 199: | | | | | | | Dune land-----------| 95 |Poor | |Good | |Not rated | | | Too sandy |0.00 | | | | | | Wind erosion |0.00 | | | | | | Organic matter |0.12 | | | | | | content low | | | | | | | Droughty |0.25 | | | | | | | | | | |
Padre Island National Seashore, Texas 241
Table 16.--Source of Reclamation Material, Roadfill, and Topsoil--Continued ________________________________________________________________________________________________________ | | | | Map symbol |Pct.| Potential source of | Potential source of | Potential source of and soil name | of | reclamation material | roadfill | topsoil |map | | | |unit| | | | |_________________________|_________________________|_________________________ | | Rating class and |Value| Rating class and |Value| Rating class and |Value | | limiting features | | limiting features | | limiting features | _____________________|____|___________________|_____|___________________|_____|___________________|_____ | | | | | | | 282: | | | | | | | Madre---------------| 45 |Poor | |Poor | |Poor | | | Too sandy |0.00 | Wetness depth |0.00 | Too sandy |0.00 | | Wind erosion |0.00 | | | Wetness depth |0.00 | | Sodium content |0.00 | | | Sodium content |0.00 | | Droughty |0.01 | | | | | | Organic matter |0.18 | | | | | | content low | | | | | | | | | | | | Malaquite-----------| 39 |Poor | |Poor | |Poor | | | Too sandy |0.00 | Wetness depth |0.00 | Too sandy |0.00 | | Wind erosion |0.00 | | | Wetness depth |0.00 | | Salinity |0.00 | | | Sodium content |0.00 | | Sodium content |0.00 | | | Salinity |0.00 | | Droughty |0.00 | | | | | | Organic matter |0.18 | | | | | | content low | | | | | | | | | | | | 290: | | | | | | | Novillo-------------| 88 |Poor | |Poor | |Poor | | | Too sandy |0.00 | Wetness depth |0.00 | Too sandy |0.00 | | Wind erosion |0.00 | | | Wetness depth |0.00 | | Droughty |0.13 | | | Sodium content |0.66 | | Organic matter |0.18 | | | | | | content low | | | | | | | Sodium content |0.66 | | | | | | Too acid |0.99 | | | | | | | | | | | 291: | | | | | | | Mustang-------------| 49 |Poor | |Poor | |Poor | | | Too sandy |0.00 | Wetness depth |0.00 | Too sandy |0.00 | | Wind erosion |0.00 | | | Wetness depth |0.00 | | Droughty |0.01 | | | | | | Organic matter |0.18 | | | | | | content low | | | | | | | | | | | | Padre---------------| 42 |Poor | |Good | |Poor | | | Too sandy |0.00 | | | Too sandy |0.00 | | Wind erosion |0.00 | | | | | | Organic matter |0.12 | | | | | | content low | | | | | | | Too acid |0.74 | | | | | | | | | | | 299: | | | | | | | Greenhill-----------| 85 |Poor | |Good | |Poor | | | Too sandy |0.00 | | | Too sandy |0.00 | | Wind erosion |0.00 | | | | | | Droughty |0.25 | | | | | | Too acid |0.84 | | | | | | Organic matter |0.88 | | | | | | content low | | | | | | | | | | | |
242 Soil Survey of
Table 16.--Source of Reclamation Material, Roadfill, and Topsoil--Continued ________________________________________________________________________________________________________ | | | | Map symbol |Pct.| Potential source of | Potential source of | Potential source of and soil name | of | reclamation material | roadfill | topsoil |map | | | |unit| | | | |_________________________|_________________________|_________________________ | | Rating class and |Value| Rating class and |Value| Rating class and |Value | | limiting features | | limiting features | | limiting features | _____________________|____|___________________|_____|___________________|_____|___________________|_____ | | | | | | | 399: | | | | | | | Greenhill-----------| 50 |Poor | |Good | |Poor | | | Too sandy |0.00 | | | Too sandy |0.00 | | Wind erosion |0.00 | | | | | | Droughty |0.25 | | | | | | Too acid |0.84 | | | | | | Organic matter |0.88 | | | | | | content low | | | | | | | | | | | | Mustang-------------| 41 |Poor | |Poor | |Poor | | | Too sandy |0.00 | Wetness depth |0.00 | Too sandy |0.00 | | Wind erosion |0.00 | | | Wetness depth |0.00 | | Droughty |0.01 | | | | | | Organic matter |0.18 | | | | | | content low | | | | | | | | | | | | 402: | | | | | | | Tatton--------------| 55 |Poor | |Poor | |Not rated | | | Wind erosion |0.00 | Wetness depth |0.00 | | | | Salinity |0.00 | | | | | | Sodium content |0.00 | | | | | | Too sandy |0.00 | | | | | | Organic matter |0.08 | | | | | | content low | | | | | | | Droughty |0.77 | | | | | | | | | | | Beaches, washover | | | | | | | fan----------------| 35 |Poor | |Poor | |Not rated | | | Wind erosion |0.00 | Wetness depth |0.00 | | | | Salinity |0.00 | | | | | | Sodium content |0.00 | | | | | | Too sandy |0.00 | | | | | | Organic matter |0.75 | | | | | | content low | | | | | | | Droughty |0.98 | | | | | | | | | | | 491: | | | | | | | Mustang-------------| 50 |Poor | |Poor | |Poor | | | Too sandy |0.00 | Wetness depth |0.00 | Too sandy |0.00 | | Wind erosion |0.00 | | | Wetness depth |0.00 | | Too alkaline |0.00 | | | Sodium content |0.97 | | Droughty |0.01 | | | | | | Organic matter |0.18 | | | | | | content low | | | | | | | Sodium content |0.78 | | | | | | | | | | | Panam---------------| 40 |Poor | |Good | |Poor | | | Too sandy |0.00 | | | Too sandy |0.00 | | Wind erosion |0.00 | | | | | | Organic matter |0.12 | | | | | | content low | | | | | | | | | | | |
Padre Island National Seashore, Texas 243
Table 16.--Source of Reclamation Material, Roadfill, and Topsoil--Continued ________________________________________________________________________________________________________ | | | | Map symbol |Pct.| Potential source of | Potential source of | Potential source of and soil name | of | reclamation material | roadfill | topsoil |map | | | |unit| | | | |_________________________|_________________________|_________________________ | | Rating class and |Value| Rating class and |Value| Rating class and |Value | | limiting features | | limiting features | | limiting features | _____________________|____|___________________|_____|___________________|_____|___________________|_____ | | | | | | | 499: | | | | | | | Daggerhill----------| 86 |Poor | |Good | |Poor | | | Too sandy |0.00 | | | Too sandy |0.00 | | Wind erosion |0.00 | | | | | | Too alkaline |0.00 | | | | | | Droughty |0.25 | | | | | | Organic matter |0.88 | | | | | | content low | | | | | | | | | | | | 502: | | | | | | | Daggerhill----------| 45 |Poor | |Good | |Poor | | | Too sandy |0.00 | | | Too sandy |0.00 | | Wind erosion |0.00 | | | | | | Too alkaline |0.00 | | | | | | Droughty |0.25 | | | | | | Organic matter |0.88 | | | | | | content low | | | | | | | | | | | | Satatton------------| 40 |Poor | |Poor | |Not rated | | | Wind erosion |0.00 | Wetness depth |0.00 | | | | Droughty |0.00 | | | | | | Salinity |0.00 | | | | | | Sodium content |0.00 | | | | | | Too sandy |0.00 | | | | | | Organic matter |0.68 | | | | | | content low | | | | | | | | | | | | 599: | | | | | | | Daggerhill----------| 50 |Poor | |Good | |Poor | | | Too sandy |0.00 | | | Too sandy |0.00 | | Wind erosion |0.00 | | | | | | Too alkaline |0.00 | | | | | | Droughty |0.25 | | | | | | Organic matter |0.88 | | | | | | content low | | | | | | | | | | | | Mustang-------------| 41 |Poor | |Poor | |Poor | | | Too alkaline |0.00 | Wetness depth |0.00 | Too sandy |0.00 | | Too sandy |0.00 | | | Wetness depth |0.00 | | Wind erosion |0.00 | | | Sodium content |0.97 | | Droughty |0.01 | | | | | | Organic matter |0.18 | | | | | | content low | | | | | | | Sodium content |0.78 | | | | | | | | | | | 891: | | | | | | | Madre---------------| 48 |Poor | |Poor | |Poor | | | Too sandy |0.00 | Wetness depth |0.00 | Too sandy |0.00 | | Wind erosion |0.00 | | | Wetness depth |0.00 | | Sodium content |0.00 | | | Sodium content |0.00 | | Droughty |0.01 | | | | | | Organic matter |0.18 | | | | | | content low | | | | | | | | | | | |
244 Soil Survey of
Table 16.--Source of Reclamation Material, Roadfill, and Topsoil--Continued ________________________________________________________________________________________________________ | | | | Map symbol |Pct.| Potential source of | Potential source of | Potential source of and soil name | of | reclamation material | roadfill | topsoil |map | | | |unit| | | | |_________________________|_________________________|_________________________ | | Rating class and |Value| Rating class and |Value| Rating class and |Value | | limiting features | | limiting features | | limiting features | _____________________|____|___________________|_____|___________________|_____|___________________|_____ | | | | | | | Panam---------------| 43 |Poor | |Good | |Poor | | | Too sandy |0.00 | | | Too sandy |0.00 | | Wind erosion |0.00 | | | | | | Organic matter |0.12 | | | | | | content low | | | | | | | | | | | | 982: | | | | | | | Yarborough----------| 90 |Poor | |Fair | |Poor | | | Salinity |0.00 | Wetness depth |0.14 | Sodium content |0.00 | | Sodium content |0.00 | | | Salinity |0.00 | | Droughty |0.01 | | | Wetness depth |0.14 | | Organic matter |0.18 | | | Rock fragments |0.98 | | content low | | | | | | | | | | | | 999: | | | | | | | Dune land-----------| 55 |Poor | |Good | |Not rated | | | Too sandy |0.00 | | | | | | Wind erosion |0.00 | | | | | | Organic matter |0.12 | | | | | | content low | | | | | | | Droughty |0.25 | | | | | | | | | | | Satatton------------| 42 |Poor | |Poor | |Not rated | | | Wind erosion |0.00 | Wetness depth |0.00 | | | | Droughty |0.00 | | | | | | Salinity |0.00 | | | | | | Sodium content |0.00 | | | | | | Too sandy |0.00 | | | | | | Organic matter |0.68 | | | | | | content low | | | | | | | | | | | | CB1: | | | | | | | Beaches-------------|100 |Poor | |Poor | |Poor | | | Too sandy |0.00 | Wetness depth |0.00 | Too sandy |0.00 | | Wind erosion |0.00 | | | Wetness depth |0.00 | | Organic matter |0.12 | | | | | | content low | | | | | | | Too acid |0.80 | | | | | | | | | | | CB2: | | | | | | | Beaches-------------|100 |Poor | |Poor | |Poor | | | Too sandy |0.00 | Wetness depth |0.00 | Too sandy |0.00 | | Organic matter |0.12 | | | Wetness depth |0.00 | | content low | | | | | | | Too acid |0.80 | | | | | | | | | | | CB3: | | | | | | | Beaches-------------|100 |Poor | |Poor | |Poor | | | Too sandy |0.00 | Wetness depth |0.00 | Too sandy |0.00 | | Organic matter |0.12 | | | Wetness depth |0.00 | | content low | | | | | | | Too acid |0.80 | | | | | | | | | | |
Padre Island National Seashore, Texas 245
Table 16.--Source of Reclamation Material, Roadfill, and Topsoil--Continued ________________________________________________________________________________________________________ | | | | Map symbol |Pct.| Potential source of | Potential source of | Potential source of and soil name | of | reclamation material | roadfill | topsoil |map | | | |unit| | | | |_________________________|_________________________|_________________________ | | Rating class and |Value| Rating class and |Value| Rating class and |Value | | limiting features | | limiting features | | limiting features | _____________________|____|___________________|_____|___________________|_____|___________________|_____ | | | | | | | CB4: | | | | | | | Beaches-------------|100 |Poor | |Poor | |Poor | | | Too sandy |0.00 | Wetness depth |0.00 | Too sandy |0.00 | | Organic matter |0.12 | | | Wetness depth |0.00 | | content low | | | | | | | Too acid |0.80 | | | | | | | | | | | GF: | | | | | | | Baffin--------------| 95 |Poor | |Poor | |Not rated | | | Salinity |0.00 | Wetness depth |0.00 | | | | Sodium content |0.00 | | | | | | Organic matter |0.18 | | | | | | content low | | | | | | | Too sandy |0.32 | | | | | | Water erosion |0.99 | | | | | | | | | | | W: | | | | | | | Water---------------|100 |Not rated | |Not rated | |Not rated | | | | | | | | | | | | | | | _____________________|____|___________________|_____|___________________|_____|___________________|_____
246 Soil Survey of
Table 17.--Engineering Index Properties
(Absence of an entry indicates that the data were not estimated.) _____________________________________________________________________________________________________________________________ | | | Classification | Fragments | Percentage passing | | Map symbol | Depth | USDA texture |___________________________|_____________| sieve number-- |Liquid| Plas- and soil name | | | | | >10 | 3-10 |___________________________|limit |ticity | | | Unified | AASHTO |inches|inches| 4 | 10 | 40 | 200 | |index _________________|_______|_______________|_____________|_____________|______|______|______|______|______|______|______|______ | In | | | | Pct | Pct | | | | | Pct | | | | | | | | | | | | | 82A: | | | | | | | | | | | | Mustang---------| 0-19 |Fine sand |SP, SP-SM |A-2-4, A-3 | 0 | 0-3 |85-100|80-100|50-80 | 2-12 | 8-12 | NP | 19-80 |Fine sand |SP, SP-SM |A-2-4, A-3 | 0 | 0-3 |85-100|80-100|50-80 | 2-12 | 8-12 | NP | | | | | | | | | | | | 95BD: | | | | | | | | | | | | Twinpalms-------| 0-18 |Fine sand |SP, SP-SM |A-2-4 | 0 | 0 |85-100|85-100|50-80 | 2-15 |12-18 | NP | 18-30 |Fine sandy |SC-SM, SM, |A-2-4 | 0 | 0 |85-100|85-100|60-80 | 2-20 |12-20 |NP-5 | | loam, gravelly| SP-SM | | | | | | | | | | | loamy fine | | | | | | | | | | | | sand, gravelly| | | | | | | | | | | | fine sandy | | | | | | | | | | | | loam, loamy | | | | | | | | | | | | fine sand | | | | | | | | | | | 30-80 |Gravelly fine |SC-SM, SM, |A-2-4 | 0 | 0 |70-100|65-75 |60-70 | 2-20 |12-20 |NP-5 | | sand, gravelly| SP-SM | | | | | | | | | | | loamy fine | | | | | | | | | | | | sand, gravelly| | | | | | | | | | | | fine sandy | | | | | | | | | | | | loam, fine | | | | | | | | | | | | sand, loamy | | | | | | | | | | | | fine sand, | | | | | | | | | | | | fine sandy | | | | | | | | | | | | loam | | | | | | | | | | | | | | | | | | | | | | Yarborough------| 0-7 |Fine sandy loam|SM, SP-SM |A-3 | 0 | 0 |96-100|90-99 |46-70 | 5-15 |14-20 |NP-5 | 7-80 |Fine sandy |SP-SM |A-3 | 0 | 0 |86-100|80-97 |42-70 | 4-12 |12-20 |NP-5 | | loam, gravelly| | | | | | | | | | | | loamy fine | | | | | | | | | | | | sand, loamy | | | | | | | | | | | | fine sand, | | | | | | | | | | | | gravelly fine | | | | | | | | | | | | sandy loam | | | | | | | | | | | | | | | | | | | | | | 102: | | | | | | | | | | | | Satatton--------| 0-17 |Fine sand |SM |A-2-4 | 0 | 0 |85-100|80-100|80-98 |13-35 |16-20 |NP-3 | 17-80 |Fine sand |SM |A-2-4, A-4 | 0 | 0 |85-100|80-100|80-98 |13-40 |16-20 |NP-3 | | | | | | | | | | | |
Padre Island N
ational Seashore, Texas
247
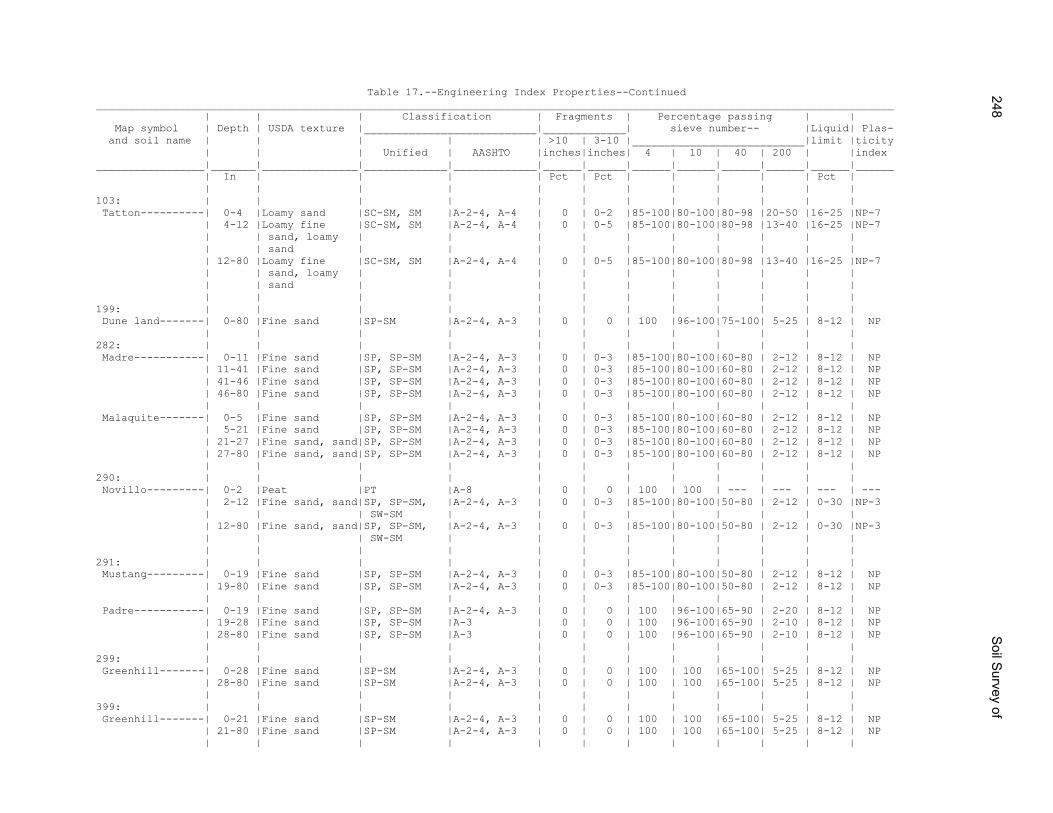
Table 17.--Engineering Index Properties--Continued _____________________________________________________________________________________________________________________________ | | | Classification | Fragments | Percentage passing | | Map symbol | Depth | USDA texture |___________________________|_____________| sieve number-- |Liquid| Plas- and soil name | | | | | >10 | 3-10 |___________________________|limit |ticity | | | Unified | AASHTO |inches|inches| 4 | 10 | 40 | 200 | |index _________________|_______|_______________|_____________|_____________|______|______|______|______|______|______|______|______ | In | | | | Pct | Pct | | | | | Pct | | | | | | | | | | | | | 103: | | | | | | | | | | | | Tatton----------| 0-4 |Loamy sand |SC-SM, SM |A-2-4, A-4 | 0 | 0-2 |85-100|80-100|80-98 |20-50 |16-25 |NP-7 | 4-12 |Loamy fine |SC-SM, SM |A-2-4, A-4 | 0 | 0-5 |85-100|80-100|80-98 |13-40 |16-25 |NP-7 | | sand, loamy | | | | | | | | | | | | sand | | | | | | | | | | | 12-80 |Loamy fine |SC-SM, SM |A-2-4, A-4 | 0 | 0-5 |85-100|80-100|80-98 |13-40 |16-25 |NP-7 | | sand, loamy | | | | | | | | | | | | sand | | | | | | | | | | | | | | | | | | | | | | 199: | | | | | | | | | | | | Dune land-------| 0-80 |Fine sand |SP-SM |A-2-4, A-3 | 0 | 0 | 100 |96-100|75-100| 5-25 | 8-12 | NP | | | | | | | | | | | | 282: | | | | | | | | | | | | Madre-----------| 0-11 |Fine sand |SP, SP-SM |A-2-4, A-3 | 0 | 0-3 |85-100|80-100|60-80 | 2-12 | 8-12 | NP | 11-41 |Fine sand |SP, SP-SM |A-2-4, A-3 | 0 | 0-3 |85-100|80-100|60-80 | 2-12 | 8-12 | NP | 41-46 |Fine sand |SP, SP-SM |A-2-4, A-3 | 0 | 0-3 |85-100|80-100|60-80 | 2-12 | 8-12 | NP | 46-80 |Fine sand |SP, SP-SM |A-2-4, A-3 | 0 | 0-3 |85-100|80-100|60-80 | 2-12 | 8-12 | NP | | | | | | | | | | | | Malaquite-------| 0-5 |Fine sand |SP, SP-SM |A-2-4, A-3 | 0 | 0-3 |85-100|80-100|60-80 | 2-12 | 8-12 | NP | 5-21 |Fine sand |SP, SP-SM |A-2-4, A-3 | 0 | 0-3 |85-100|80-100|60-80 | 2-12 | 8-12 | NP | 21-27 |Fine sand, sand|SP, SP-SM |A-2-4, A-3 | 0 | 0-3 |85-100|80-100|60-80 | 2-12 | 8-12 | NP | 27-80 |Fine sand, sand|SP, SP-SM |A-2-4, A-3 | 0 | 0-3 |85-100|80-100|60-80 | 2-12 | 8-12 | NP | | | | | | | | | | | | 290: | | | | | | | | | | | | Novillo---------| 0-2 |Peat |PT |A-8 | 0 | 0 | 100 | 100 | --- | --- | --- | --- | 2-12 |Fine sand, sand|SP, SP-SM, |A-2-4, A-3 | 0 | 0-3 |85-100|80-100|50-80 | 2-12 | 0-30 |NP-3 | | | SW-SM | | | | | | | | | | 12-80 |Fine sand, sand|SP, SP-SM, |A-2-4, A-3 | 0 | 0-3 |85-100|80-100|50-80 | 2-12 | 0-30 |NP-3 | | | SW-SM | | | | | | | | | | | | | | | | | | | | | 291: | | | | | | | | | | | | Mustang---------| 0-19 |Fine sand |SP, SP-SM |A-2-4, A-3 | 0 | 0-3 |85-100|80-100|50-80 | 2-12 | 8-12 | NP | 19-80 |Fine sand |SP, SP-SM |A-2-4, A-3 | 0 | 0-3 |85-100|80-100|50-80 | 2-12 | 8-12 | NP | | | | | | | | | | | | Padre-----------| 0-19 |Fine sand |SP, SP-SM |A-2-4, A-3 | 0 | 0 | 100 |96-100|65-90 | 2-20 | 8-12 | NP | 19-28 |Fine sand |SP, SP-SM |A-3 | 0 | 0 | 100 |96-100|65-90 | 2-10 | 8-12 | NP | 28-80 |Fine sand |SP, SP-SM |A-3 | 0 | 0 | 100 |96-100|65-90 | 2-10 | 8-12 | NP | | | | | | | | | | | | 299: | | | | | | | | | | | | Greenhill-------| 0-28 |Fine sand |SP-SM |A-2-4, A-3 | 0 | 0 | 100 | 100 |65-100| 5-25 | 8-12 | NP | 28-80 |Fine sand |SP-SM |A-2-4, A-3 | 0 | 0 | 100 | 100 |65-100| 5-25 | 8-12 | NP | | | | | | | | | | | | 399: | | | | | | | | | | | | Greenhill-------| 0-21 |Fine sand |SP-SM |A-2-4, A-3 | 0 | 0 | 100 | 100 |65-100| 5-25 | 8-12 | NP | 21-80 |Fine sand |SP-SM |A-2-4, A-3 | 0 | 0 | 100 | 100 |65-100| 5-25 | 8-12 | NP | | | | | | | | | | | |
248S
oil Survey of
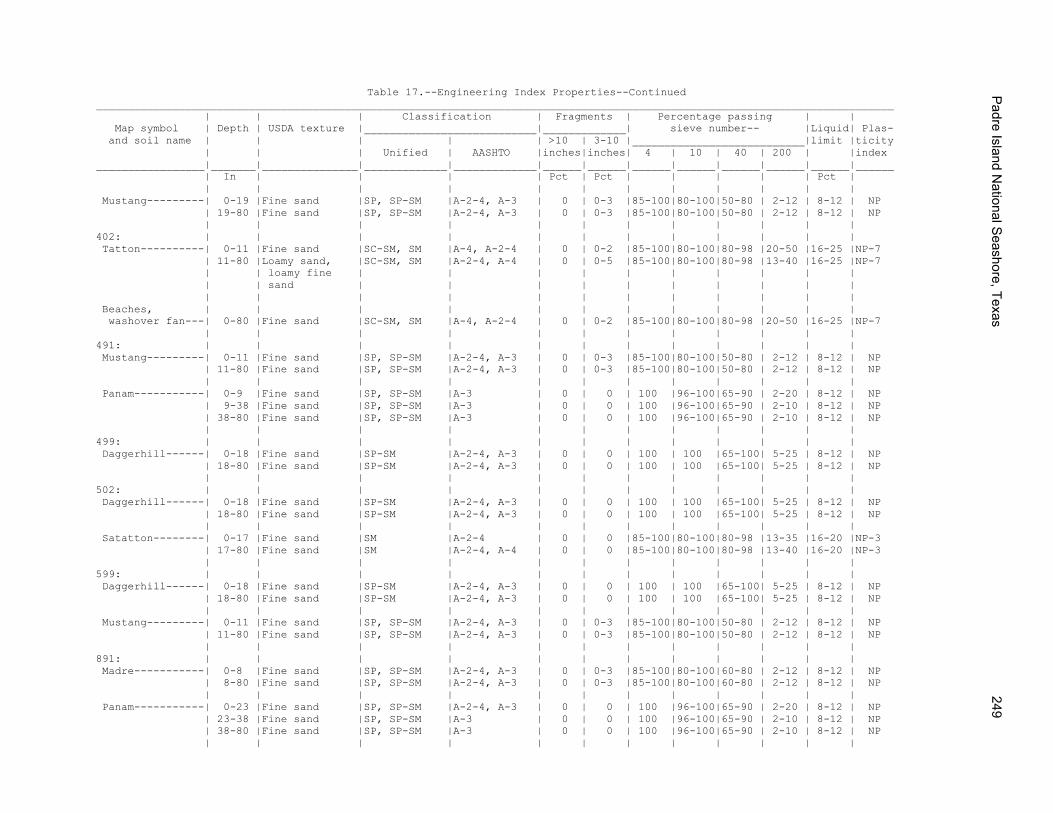
Table 17.--Engineering Index Properties--Continued _____________________________________________________________________________________________________________________________ | | | Classification | Fragments | Percentage passing | | Map symbol | Depth | USDA texture |___________________________|_____________| sieve number-- |Liquid| Plas- and soil name | | | | | >10 | 3-10 |___________________________|limit |ticity | | | Unified | AASHTO |inches|inches| 4 | 10 | 40 | 200 | |index _________________|_______|_______________|_____________|_____________|______|______|______|______|______|______|______|______ | In | | | | Pct | Pct | | | | | Pct | | | | | | | | | | | | | Mustang---------| 0-19 |Fine sand |SP, SP-SM |A-2-4, A-3 | 0 | 0-3 |85-100|80-100|50-80 | 2-12 | 8-12 | NP | 19-80 |Fine sand |SP, SP-SM |A-2-4, A-3 | 0 | 0-3 |85-100|80-100|50-80 | 2-12 | 8-12 | NP | | | | | | | | | | | | 402: | | | | | | | | | | | | Tatton----------| 0-11 |Fine sand |SC-SM, SM |A-4, A-2-4 | 0 | 0-2 |85-100|80-100|80-98 |20-50 |16-25 |NP-7 | 11-80 |Loamy sand, |SC-SM, SM |A-2-4, A-4 | 0 | 0-5 |85-100|80-100|80-98 |13-40 |16-25 |NP-7 | | loamy fine | | | | | | | | | | | | sand | | | | | | | | | | | | | | | | | | | | | | Beaches, | | | | | | | | | | | | washover fan---| 0-80 |Fine sand |SC-SM, SM |A-4, A-2-4 | 0 | 0-2 |85-100|80-100|80-98 |20-50 |16-25 |NP-7 | | | | | | | | | | | | 491: | | | | | | | | | | | | Mustang---------| 0-11 |Fine sand |SP, SP-SM |A-2-4, A-3 | 0 | 0-3 |85-100|80-100|50-80 | 2-12 | 8-12 | NP | 11-80 |Fine sand |SP, SP-SM |A-2-4, A-3 | 0 | 0-3 |85-100|80-100|50-80 | 2-12 | 8-12 | NP | | | | | | | | | | | | Panam-----------| 0-9 |Fine sand |SP, SP-SM |A-3 | 0 | 0 | 100 |96-100|65-90 | 2-20 | 8-12 | NP | 9-38 |Fine sand |SP, SP-SM |A-3 | 0 | 0 | 100 |96-100|65-90 | 2-10 | 8-12 | NP | 38-80 |Fine sand |SP, SP-SM |A-3 | 0 | 0 | 100 |96-100|65-90 | 2-10 | 8-12 | NP | | | | | | | | | | | | 499: | | | | | | | | | | | | Daggerhill------| 0-18 |Fine sand |SP-SM |A-2-4, A-3 | 0 | 0 | 100 | 100 |65-100| 5-25 | 8-12 | NP | 18-80 |Fine sand |SP-SM |A-2-4, A-3 | 0 | 0 | 100 | 100 |65-100| 5-25 | 8-12 | NP | | | | | | | | | | | | 502: | | | | | | | | | | | | Daggerhill------| 0-18 |Fine sand |SP-SM |A-2-4, A-3 | 0 | 0 | 100 | 100 |65-100| 5-25 | 8-12 | NP | 18-80 |Fine sand |SP-SM |A-2-4, A-3 | 0 | 0 | 100 | 100 |65-100| 5-25 | 8-12 | NP | | | | | | | | | | | | Satatton--------| 0-17 |Fine sand |SM |A-2-4 | 0 | 0 |85-100|80-100|80-98 |13-35 |16-20 |NP-3 | 17-80 |Fine sand |SM |A-2-4, A-4 | 0 | 0 |85-100|80-100|80-98 |13-40 |16-20 |NP-3 | | | | | | | | | | | | 599: | | | | | | | | | | | | Daggerhill------| 0-18 |Fine sand |SP-SM |A-2-4, A-3 | 0 | 0 | 100 | 100 |65-100| 5-25 | 8-12 | NP | 18-80 |Fine sand |SP-SM |A-2-4, A-3 | 0 | 0 | 100 | 100 |65-100| 5-25 | 8-12 | NP | | | | | | | | | | | | Mustang---------| 0-11 |Fine sand |SP, SP-SM |A-2-4, A-3 | 0 | 0-3 |85-100|80-100|50-80 | 2-12 | 8-12 | NP | 11-80 |Fine sand |SP, SP-SM |A-2-4, A-3 | 0 | 0-3 |85-100|80-100|50-80 | 2-12 | 8-12 | NP | | | | | | | | | | | | 891: | | | | | | | | | | | | Madre-----------| 0-8 |Fine sand |SP, SP-SM |A-2-4, A-3 | 0 | 0-3 |85-100|80-100|60-80 | 2-12 | 8-12 | NP | 8-80 |Fine sand |SP, SP-SM |A-2-4, A-3 | 0 | 0-3 |85-100|80-100|60-80 | 2-12 | 8-12 | NP | | | | | | | | | | | | Panam-----------| 0-23 |Fine sand |SP, SP-SM |A-2-4, A-3 | 0 | 0 | 100 |96-100|65-90 | 2-20 | 8-12 | NP | 23-38 |Fine sand |SP, SP-SM |A-3 | 0 | 0 | 100 |96-100|65-90 | 2-10 | 8-12 | NP | 38-80 |Fine sand |SP, SP-SM |A-3 | 0 | 0 | 100 |96-100|65-90 | 2-10 | 8-12 | NP | | | | | | | | | | | |
Padre Island N
ational Seashore, Texas
249
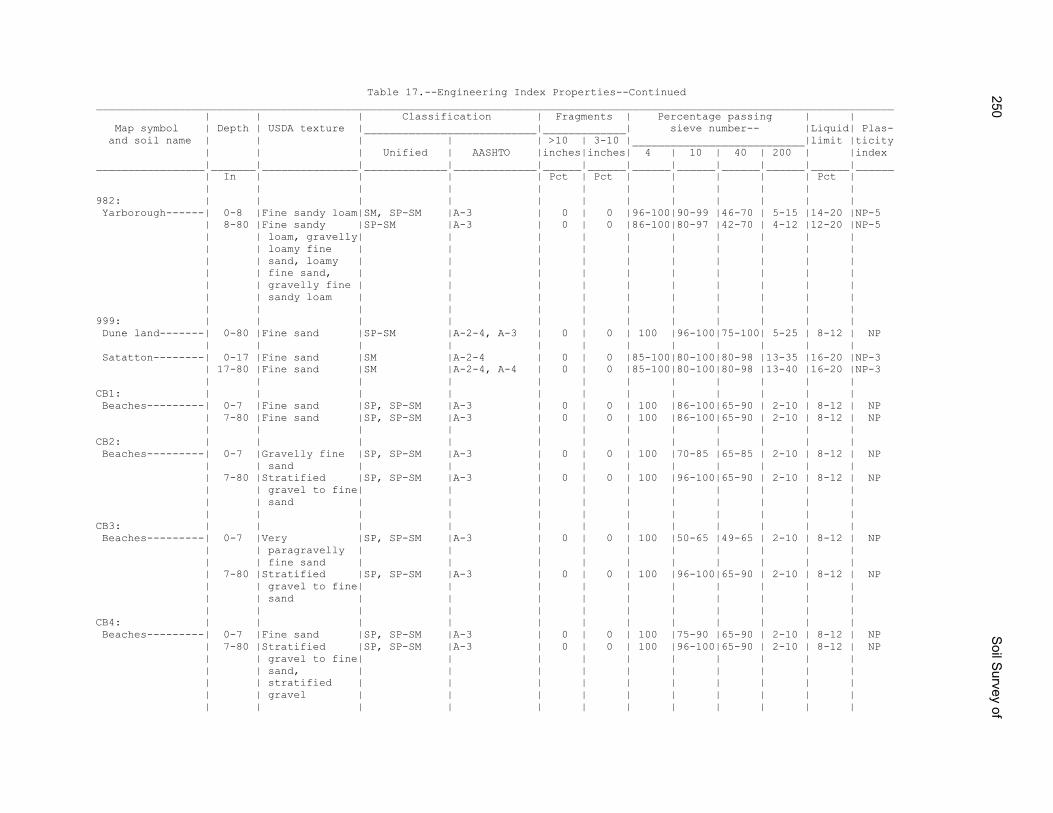
Table 17.--Engineering Index Properties--Continued _____________________________________________________________________________________________________________________________ | | | Classification | Fragments | Percentage passing | | Map symbol | Depth | USDA texture |___________________________|_____________| sieve number-- |Liquid| Plas- and soil name | | | | | >10 | 3-10 |___________________________|limit |ticity | | | Unified | AASHTO |inches|inches| 4 | 10 | 40 | 200 | |index _________________|_______|_______________|_____________|_____________|______|______|______|______|______|______|______|______ | In | | | | Pct | Pct | | | | | Pct | | | | | | | | | | | | | 982: | | | | | | | | | | | | Yarborough------| 0-8 |Fine sandy loam|SM, SP-SM |A-3 | 0 | 0 |96-100|90-99 |46-70 | 5-15 |14-20 |NP-5 | 8-80 |Fine sandy |SP-SM |A-3 | 0 | 0 |86-100|80-97 |42-70 | 4-12 |12-20 |NP-5 | | loam, gravelly| | | | | | | | | | | | loamy fine | | | | | | | | | | | | sand, loamy | | | | | | | | | | | | fine sand, | | | | | | | | | | | | gravelly fine | | | | | | | | | | | | sandy loam | | | | | | | | | | | | | | | | | | | | | | 999: | | | | | | | | | | | | Dune land-------| 0-80 |Fine sand |SP-SM |A-2-4, A-3 | 0 | 0 | 100 |96-100|75-100| 5-25 | 8-12 | NP | | | | | | | | | | | | Satatton--------| 0-17 |Fine sand |SM |A-2-4 | 0 | 0 |85-100|80-100|80-98 |13-35 |16-20 |NP-3 | 17-80 |Fine sand |SM |A-2-4, A-4 | 0 | 0 |85-100|80-100|80-98 |13-40 |16-20 |NP-3 | | | | | | | | | | | | CB1: | | | | | | | | | | | | Beaches---------| 0-7 |Fine sand |SP, SP-SM |A-3 | 0 | 0 | 100 |86-100|65-90 | 2-10 | 8-12 | NP | 7-80 |Fine sand |SP, SP-SM |A-3 | 0 | 0 | 100 |86-100|65-90 | 2-10 | 8-12 | NP | | | | | | | | | | | | CB2: | | | | | | | | | | | | Beaches---------| 0-7 |Gravelly fine |SP, SP-SM |A-3 | 0 | 0 | 100 |70-85 |65-85 | 2-10 | 8-12 | NP | | sand | | | | | | | | | | | 7-80 |Stratified |SP, SP-SM |A-3 | 0 | 0 | 100 |96-100|65-90 | 2-10 | 8-12 | NP | | gravel to fine| | | | | | | | | | | | sand | | | | | | | | | | | | | | | | | | | | | | CB3: | | | | | | | | | | | | Beaches---------| 0-7 |Very |SP, SP-SM |A-3 | 0 | 0 | 100 |50-65 |49-65 | 2-10 | 8-12 | NP | | paragravelly | | | | | | | | | | | | fine sand | | | | | | | | | | | 7-80 |Stratified |SP, SP-SM |A-3 | 0 | 0 | 100 |96-100|65-90 | 2-10 | 8-12 | NP | | gravel to fine| | | | | | | | | | | | sand | | | | | | | | | | | | | | | | | | | | | | CB4: | | | | | | | | | | | | Beaches---------| 0-7 |Fine sand |SP, SP-SM |A-3 | 0 | 0 | 100 |75-90 |65-90 | 2-10 | 8-12 | NP | 7-80 |Stratified |SP, SP-SM |A-3 | 0 | 0 | 100 |96-100|65-90 | 2-10 | 8-12 | NP | | gravel to fine| | | | | | | | | | | | sand, | | | | | | | | | | | | stratified | | | | | | | | | | | | gravel | | | | | | | | | | | | | | | | | | | | | |
250S
oil Survey of
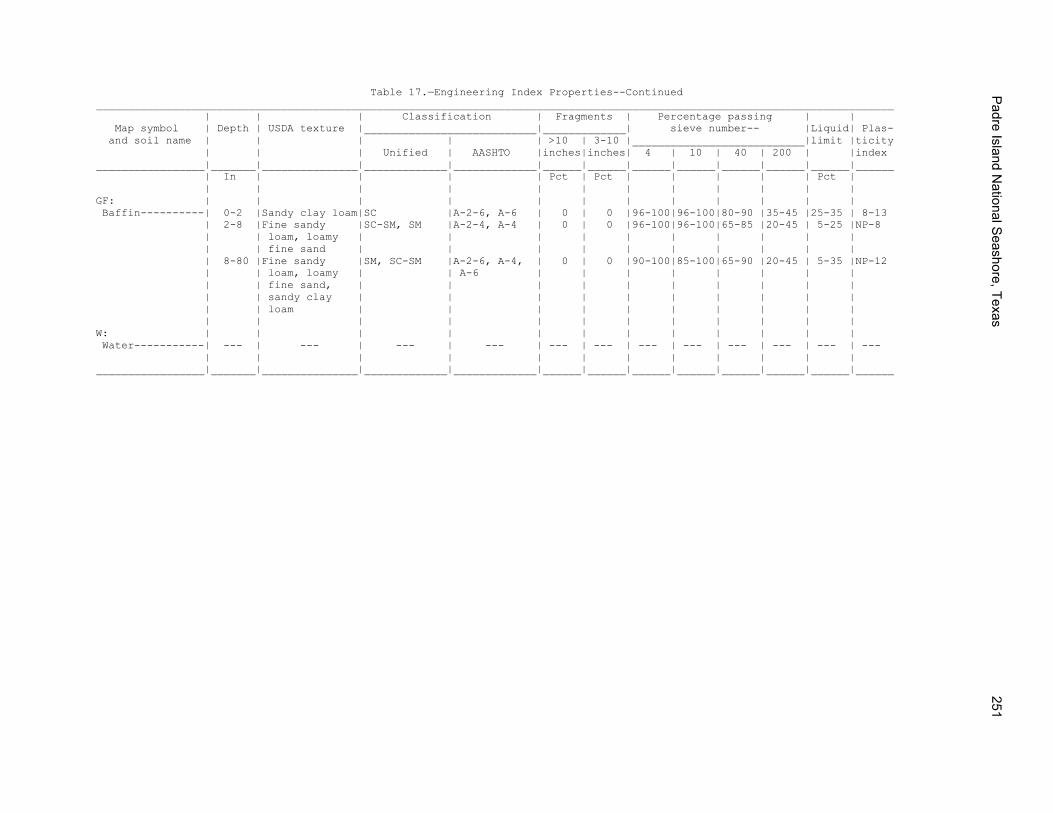
Table 17.—Engineering Index Properties--Continued _____________________________________________________________________________________________________________________________ | | | Classification | Fragments | Percentage passing | | Map symbol | Depth | USDA texture |___________________________|_____________| sieve number-- |Liquid| Plas- and soil name | | | | | >10 | 3-10 |___________________________|limit |ticity | | | Unified | AASHTO |inches|inches| 4 | 10 | 40 | 200 | |index _________________|_______|_______________|_____________|_____________|______|______|______|______|______|______|______|______ | In | | | | Pct | Pct | | | | | Pct | | | | | | | | | | | | | GF: | | | | | | | | | | | | Baffin----------| 0-2 |Sandy clay loam|SC |A-2-6, A-6 | 0 | 0 |96-100|96-100|80-90 |35-45 |25-35 | 8-13 | 2-8 |Fine sandy |SC-SM, SM |A-2-4, A-4 | 0 | 0 |96-100|96-100|65-85 |20-45 | 5-25 |NP-8 | | loam, loamy | | | | | | | | | | | | fine sand | | | | | | | | | | | 8-80 |Fine sandy |SM, SC-SM |A-2-6, A-4, | 0 | 0 |90-100|85-100|65-90 |20-45 | 5-35 |NP-12 | | loam, loamy | | A-6 | | | | | | | | | | fine sand, | | | | | | | | | | | | sandy clay | | | | | | | | | | | | loam | | | | | | | | | | | | | | | | | | | | | | W: | | | | | | | | | | | | Water-----------| --- | --- | --- | --- | --- | --- | --- | --- | --- | --- | --- | --- | | | | | | | | | | | | _________________|_______|_______________|_____________|_____________|______|______|______|______|______|______|______|______
Padre Island N
ational Seashore, Texas
251
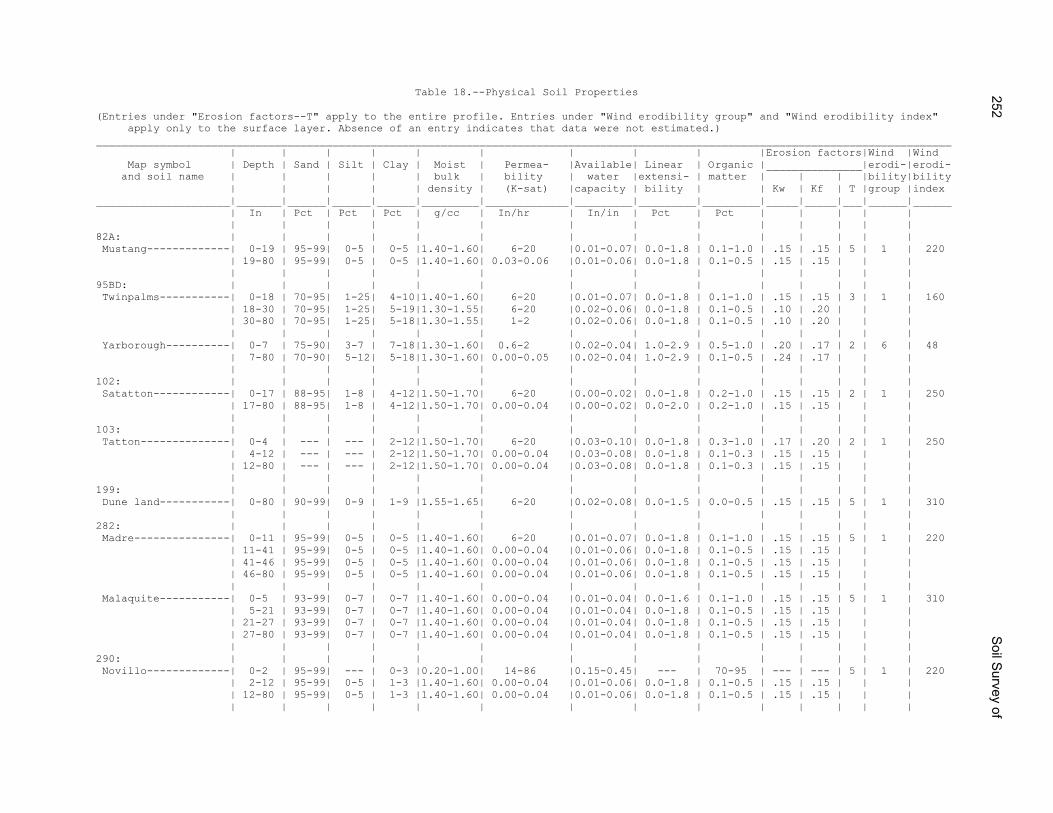
Table 18.--Physical Soil Properties (Entries under "Erosion factors--T" apply to the entire profile. Entries under "Wind erodibility group" and "Wind erodibility index" apply only to the surface layer. Absence of an entry indicates that data were not estimated.) ______________________________________________________________________________________________________________________________________ | | | | | | | | | |Erosion factors|Wind |Wind Map symbol | Depth | Sand | Silt | Clay | Moist | Permea- |Available| Linear | Organic |_______________|erodi-|erodi- and soil name | | | | | bulk | bility | water |extensi- | matter | | | |bility|bility | | | | | density | (K-sat) |capacity | bility | | Kw | Kf | T |group |index _____________________|_______|______|______|______|_________|_____________|_________|_________|_________|_____|_____|___|______|______ | In | Pct | Pct | Pct | g/cc | In/hr | In/in | Pct | Pct | | | | | | | | | | | | | | | | | | | 82A: | | | | | | | | | | | | | | Mustang-------------| 0-19 | 95-99| 0-5 | 0-5 |1.40-1.60| 6-20 |0.01-0.07| 0.0-1.8 | 0.1-1.0 | .15 | .15 | 5 | 1 | 220 | 19-80 | 95-99| 0-5 | 0-5 |1.40-1.60| 0.03-0.06 |0.01-0.06| 0.0-1.8 | 0.1-0.5 | .15 | .15 | | | | | | | | | | | | | | | | | 95BD: | | | | | | | | | | | | | | Twinpalms-----------| 0-18 | 70-95| 1-25| 4-10|1.40-1.60| 6-20 |0.01-0.07| 0.0-1.8 | 0.1-1.0 | .15 | .15 | 3 | 1 | 160 | 18-30 | 70-95| 1-25| 5-19|1.30-1.55| 6-20 |0.02-0.06| 0.0-1.8 | 0.1-0.5 | .10 | .20 | | | | 30-80 | 70-95| 1-25| 5-18|1.30-1.55| 1-2 |0.02-0.06| 0.0-1.8 | 0.1-0.5 | .10 | .20 | | | | | | | | | | | | | | | | | Yarborough----------| 0-7 | 75-90| 3-7 | 7-18|1.30-1.60| 0.6-2 |0.02-0.04| 1.0-2.9 | 0.5-1.0 | .20 | .17 | 2 | 6 | 48 | 7-80 | 70-90| 5-12| 5-18|1.30-1.60| 0.00-0.05 |0.02-0.04| 1.0-2.9 | 0.1-0.5 | .24 | .17 | | | | | | | | | | | | | | | | | 102: | | | | | | | | | | | | | | Satatton------------| 0-17 | 88-95| 1-8 | 4-12|1.50-1.70| 6-20 |0.00-0.02| 0.0-1.8 | 0.2-1.0 | .15 | .15 | 2 | 1 | 250 | 17-80 | 88-95| 1-8 | 4-12|1.50-1.70| 0.00-0.04 |0.00-0.02| 0.0-2.0 | 0.2-1.0 | .15 | .15 | | | | | | | | | | | | | | | | | 103: | | | | | | | | | | | | | | Tatton--------------| 0-4 | --- | --- | 2-12|1.50-1.70| 6-20 |0.03-0.10| 0.0-1.8 | 0.3-1.0 | .17 | .20 | 2 | 1 | 250 | 4-12 | --- | --- | 2-12|1.50-1.70| 0.00-0.04 |0.03-0.08| 0.0-1.8 | 0.1-0.3 | .15 | .15 | | | | 12-80 | --- | --- | 2-12|1.50-1.70| 0.00-0.04 |0.03-0.08| 0.0-1.8 | 0.1-0.3 | .15 | .15 | | | | | | | | | | | | | | | | | 199: | | | | | | | | | | | | | | Dune land-----------| 0-80 | 90-99| 0-9 | 1-9 |1.55-1.65| 6-20 |0.02-0.08| 0.0-1.5 | 0.0-0.5 | .15 | .15 | 5 | 1 | 310 | | | | | | | | | | | | | | 282: | | | | | | | | | | | | | | Madre---------------| 0-11 | 95-99| 0-5 | 0-5 |1.40-1.60| 6-20 |0.01-0.07| 0.0-1.8 | 0.1-1.0 | .15 | .15 | 5 | 1 | 220 | 11-41 | 95-99| 0-5 | 0-5 |1.40-1.60| 0.00-0.04 |0.01-0.06| 0.0-1.8 | 0.1-0.5 | .15 | .15 | | | | 41-46 | 95-99| 0-5 | 0-5 |1.40-1.60| 0.00-0.04 |0.01-0.06| 0.0-1.8 | 0.1-0.5 | .15 | .15 | | | | 46-80 | 95-99| 0-5 | 0-5 |1.40-1.60| 0.00-0.04 |0.01-0.06| 0.0-1.8 | 0.1-0.5 | .15 | .15 | | | | | | | | | | | | | | | | | Malaquite-----------| 0-5 | 93-99| 0-7 | 0-7 |1.40-1.60| 0.00-0.04 |0.01-0.04| 0.0-1.6 | 0.1-1.0 | .15 | .15 | 5 | 1 | 310 | 5-21 | 93-99| 0-7 | 0-7 |1.40-1.60| 0.00-0.04 |0.01-0.04| 0.0-1.8 | 0.1-0.5 | .15 | .15 | | | | 21-27 | 93-99| 0-7 | 0-7 |1.40-1.60| 0.00-0.04 |0.01-0.04| 0.0-1.8 | 0.1-0.5 | .15 | .15 | | | | 27-80 | 93-99| 0-7 | 0-7 |1.40-1.60| 0.00-0.04 |0.01-0.04| 0.0-1.8 | 0.1-0.5 | .15 | .15 | | | | | | | | | | | | | | | | | 290: | | | | | | | | | | | | | | Novillo-------------| 0-2 | 95-99| --- | 0-3 |0.20-1.00| 14-86 |0.15-0.45| --- | 70-95 | --- | --- | 5 | 1 | 220 | 2-12 | 95-99| 0-5 | 1-3 |1.40-1.60| 0.00-0.04 |0.01-0.06| 0.0-1.8 | 0.1-0.5 | .15 | .15 | | | | 12-80 | 95-99| 0-5 | 1-3 |1.40-1.60| 0.00-0.04 |0.01-0.06| 0.0-1.8 | 0.1-0.5 | .15 | .15 | | | | | | | | | | | | | | | | |
252S
oil Survey of
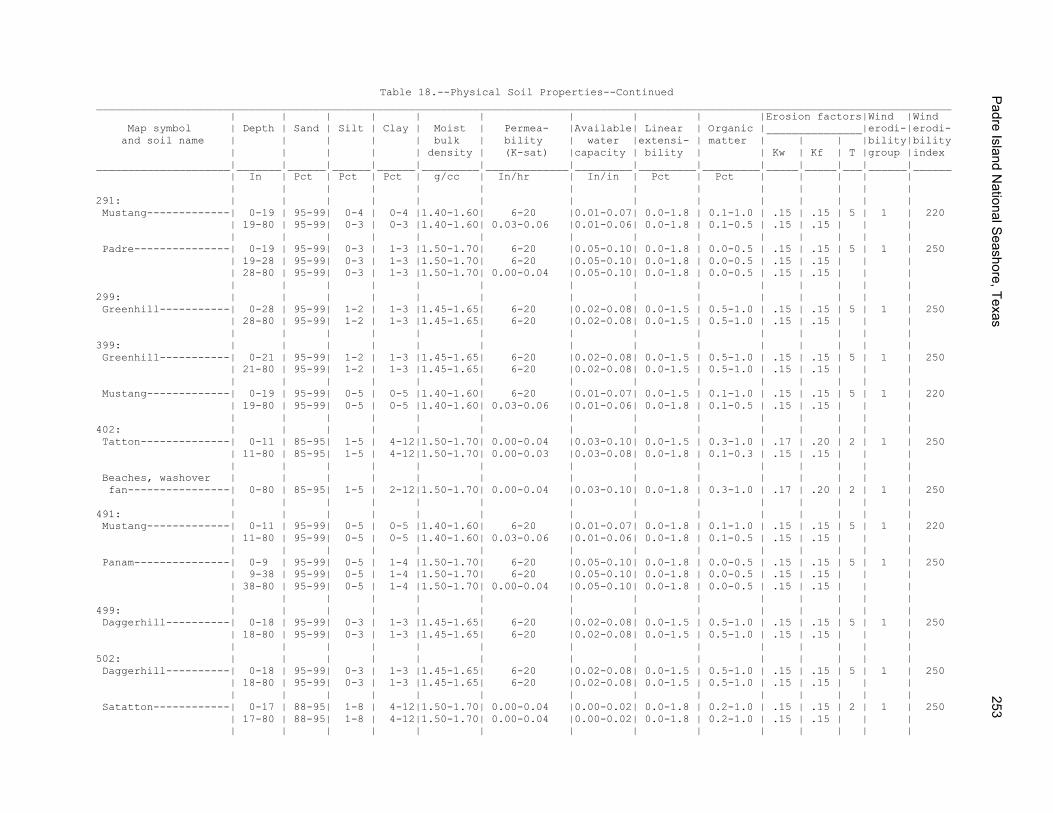
Table 18.--Physical Soil Properties--Continued ______________________________________________________________________________________________________________________________________ | | | | | | | | | |Erosion factors|Wind |Wind Map symbol | Depth | Sand | Silt | Clay | Moist | Permea- |Available| Linear | Organic |_______________|erodi-|erodi- and soil name | | | | | bulk | bility | water |extensi- | matter | | | |bility|bility | | | | | density | (K-sat) |capacity | bility | | Kw | Kf | T |group |index _____________________|_______|______|______|______|_________|_____________|_________|_________|_________|_____|_____|___|______|______ | In | Pct | Pct | Pct | g/cc | In/hr | In/in | Pct | Pct | | | | | | | | | | | | | | | | | | | 291: | | | | | | | | | | | | | | Mustang-------------| 0-19 | 95-99| 0-4 | 0-4 |1.40-1.60| 6-20 |0.01-0.07| 0.0-1.8 | 0.1-1.0 | .15 | .15 | 5 | 1 | 220 | 19-80 | 95-99| 0-3 | 0-3 |1.40-1.60| 0.03-0.06 |0.01-0.06| 0.0-1.8 | 0.1-0.5 | .15 | .15 | | | | | | | | | | | | | | | | | Padre---------------| 0-19 | 95-99| 0-3 | 1-3 |1.50-1.70| 6-20 |0.05-0.10| 0.0-1.8 | 0.0-0.5 | .15 | .15 | 5 | 1 | 250 | 19-28 | 95-99| 0-3 | 1-3 |1.50-1.70| 6-20 |0.05-0.10| 0.0-1.8 | 0.0-0.5 | .15 | .15 | | | | 28-80 | 95-99| 0-3 | 1-3 |1.50-1.70| 0.00-0.04 |0.05-0.10| 0.0-1.8 | 0.0-0.5 | .15 | .15 | | | | | | | | | | | | | | | | | 299: | | | | | | | | | | | | | | Greenhill-----------| 0-28 | 95-99| 1-2 | 1-3 |1.45-1.65| 6-20 |0.02-0.08| 0.0-1.5 | 0.5-1.0 | .15 | .15 | 5 | 1 | 250 | 28-80 | 95-99| 1-2 | 1-3 |1.45-1.65| 6-20 |0.02-0.08| 0.0-1.5 | 0.5-1.0 | .15 | .15 | | | | | | | | | | | | | | | | | 399: | | | | | | | | | | | | | | Greenhill-----------| 0-21 | 95-99| 1-2 | 1-3 |1.45-1.65| 6-20 |0.02-0.08| 0.0-1.5 | 0.5-1.0 | .15 | .15 | 5 | 1 | 250 | 21-80 | 95-99| 1-2 | 1-3 |1.45-1.65| 6-20 |0.02-0.08| 0.0-1.5 | 0.5-1.0 | .15 | .15 | | | | | | | | | | | | | | | | | Mustang-------------| 0-19 | 95-99| 0-5 | 0-5 |1.40-1.60| 6-20 |0.01-0.07| 0.0-1.5 | 0.1-1.0 | .15 | .15 | 5 | 1 | 220 | 19-80 | 95-99| 0-5 | 0-5 |1.40-1.60| 0.03-0.06 |0.01-0.06| 0.0-1.8 | 0.1-0.5 | .15 | .15 | | | | | | | | | | | | | | | | | 402: | | | | | | | | | | | | | | Tatton--------------| 0-11 | 85-95| 1-5 | 4-12|1.50-1.70| 0.00-0.04 |0.03-0.10| 0.0-1.5 | 0.3-1.0 | .17 | .20 | 2 | 1 | 250 | 11-80 | 85-95| 1-5 | 4-12|1.50-1.70| 0.00-0.03 |0.03-0.08| 0.0-1.8 | 0.1-0.3 | .15 | .15 | | | | | | | | | | | | | | | | | Beaches, washover | | | | | | | | | | | | | | fan----------------| 0-80 | 85-95| 1-5 | 2-12|1.50-1.70| 0.00-0.04 |0.03-0.10| 0.0-1.8 | 0.3-1.0 | .17 | .20 | 2 | 1 | 250 | | | | | | | | | | | | | | 491: | | | | | | | | | | | | | | Mustang-------------| 0-11 | 95-99| 0-5 | 0-5 |1.40-1.60| 6-20 |0.01-0.07| 0.0-1.8 | 0.1-1.0 | .15 | .15 | 5 | 1 | 220 | 11-80 | 95-99| 0-5 | 0-5 |1.40-1.60| 0.03-0.06 |0.01-0.06| 0.0-1.8 | 0.1-0.5 | .15 | .15 | | | | | | | | | | | | | | | | | Panam---------------| 0-9 | 95-99| 0-5 | 1-4 |1.50-1.70| 6-20 |0.05-0.10| 0.0-1.8 | 0.0-0.5 | .15 | .15 | 5 | 1 | 250 | 9-38 | 95-99| 0-5 | 1-4 |1.50-1.70| 6-20 |0.05-0.10| 0.0-1.8 | 0.0-0.5 | .15 | .15 | | | | 38-80 | 95-99| 0-5 | 1-4 |1.50-1.70| 0.00-0.04 |0.05-0.10| 0.0-1.8 | 0.0-0.5 | .15 | .15 | | | | | | | | | | | | | | | | | 499: | | | | | | | | | | | | | | Daggerhill----------| 0-18 | 95-99| 0-3 | 1-3 |1.45-1.65| 6-20 |0.02-0.08| 0.0-1.5 | 0.5-1.0 | .15 | .15 | 5 | 1 | 250 | 18-80 | 95-99| 0-3 | 1-3 |1.45-1.65| 6-20 |0.02-0.08| 0.0-1.5 | 0.5-1.0 | .15 | .15 | | | | | | | | | | | | | | | | | 502: | | | | | | | | | | | | | | Daggerhill----------| 0-18 | 95-99| 0-3 | 1-3 |1.45-1.65| 6-20 |0.02-0.08| 0.0-1.5 | 0.5-1.0 | .15 | .15 | 5 | 1 | 250 | 18-80 | 95-99| 0-3 | 1-3 |1.45-1.65| 6-20 |0.02-0.08| 0.0-1.5 | 0.5-1.0 | .15 | .15 | | | | | | | | | | | | | | | | | Satatton------------| 0-17 | 88-95| 1-8 | 4-12|1.50-1.70| 0.00-0.04 |0.00-0.02| 0.0-1.8 | 0.2-1.0 | .15 | .15 | 2 | 1 | 250 | 17-80 | 88-95| 1-8 | 4-12|1.50-1.70| 0.00-0.04 |0.00-0.02| 0.0-1.8 | 0.2-1.0 | .15 | .15 | | | | | | | | | | | | | | | | |
Padre Island N
ational Seashore, Texas
253
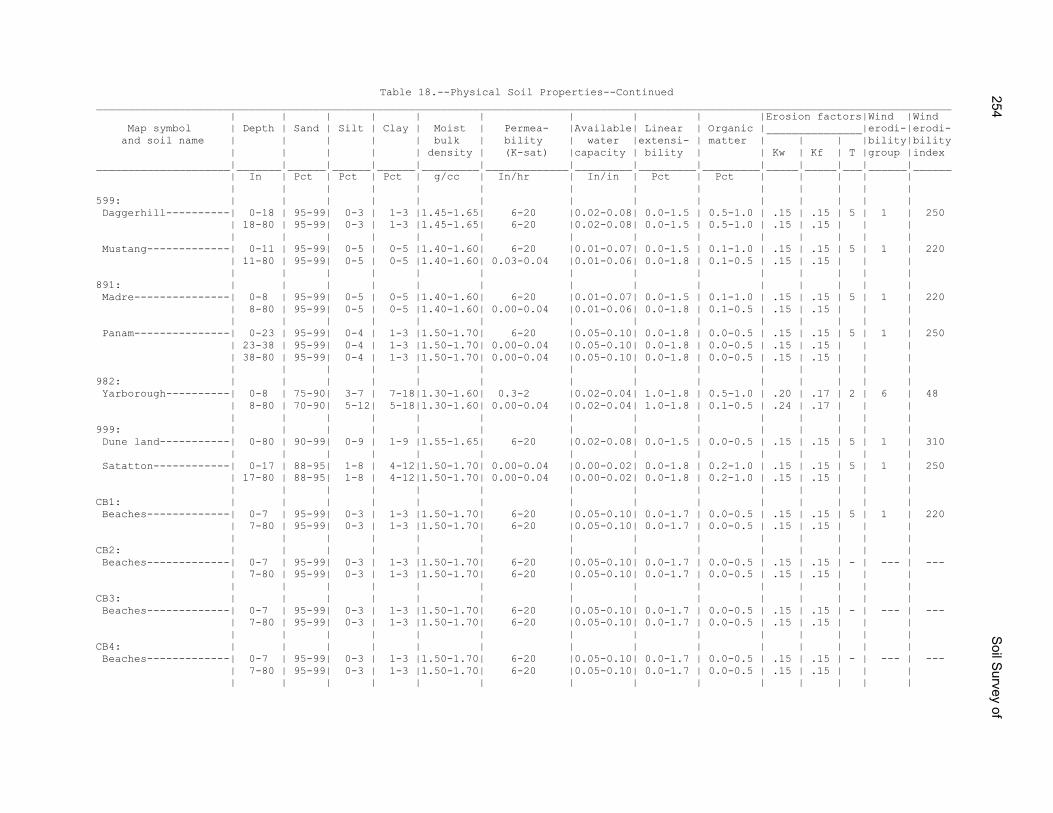
Table 18.--Physical Soil Properties--Continued ______________________________________________________________________________________________________________________________________ | | | | | | | | | |Erosion factors|Wind |Wind Map symbol | Depth | Sand | Silt | Clay | Moist | Permea- |Available| Linear | Organic |_______________|erodi-|erodi- and soil name | | | | | bulk | bility | water |extensi- | matter | | | |bility|bility | | | | | density | (K-sat) |capacity | bility | | Kw | Kf | T |group |index _____________________|_______|______|______|______|_________|_____________|_________|_________|_________|_____|_____|___|______|______ | In | Pct | Pct | Pct | g/cc | In/hr | In/in | Pct | Pct | | | | | | | | | | | | | | | | | | | 599: | | | | | | | | | | | | | | Daggerhill----------| 0-18 | 95-99| 0-3 | 1-3 |1.45-1.65| 6-20 |0.02-0.08| 0.0-1.5 | 0.5-1.0 | .15 | .15 | 5 | 1 | 250 | 18-80 | 95-99| 0-3 | 1-3 |1.45-1.65| 6-20 |0.02-0.08| 0.0-1.5 | 0.5-1.0 | .15 | .15 | | | | | | | | | | | | | | | | | Mustang-------------| 0-11 | 95-99| 0-5 | 0-5 |1.40-1.60| 6-20 |0.01-0.07| 0.0-1.5 | 0.1-1.0 | .15 | .15 | 5 | 1 | 220 | 11-80 | 95-99| 0-5 | 0-5 |1.40-1.60| 0.03-0.04 |0.01-0.06| 0.0-1.8 | 0.1-0.5 | .15 | .15 | | | | | | | | | | | | | | | | | 891: | | | | | | | | | | | | | | Madre---------------| 0-8 | 95-99| 0-5 | 0-5 |1.40-1.60| 6-20 |0.01-0.07| 0.0-1.5 | 0.1-1.0 | .15 | .15 | 5 | 1 | 220 | 8-80 | 95-99| 0-5 | 0-5 |1.40-1.60| 0.00-0.04 |0.01-0.06| 0.0-1.8 | 0.1-0.5 | .15 | .15 | | | | | | | | | | | | | | | | | Panam---------------| 0-23 | 95-99| 0-4 | 1-3 |1.50-1.70| 6-20 |0.05-0.10| 0.0-1.8 | 0.0-0.5 | .15 | .15 | 5 | 1 | 250 | 23-38 | 95-99| 0-4 | 1-3 |1.50-1.70| 0.00-0.04 |0.05-0.10| 0.0-1.8 | 0.0-0.5 | .15 | .15 | | | | 38-80 | 95-99| 0-4 | 1-3 |1.50-1.70| 0.00-0.04 |0.05-0.10| 0.0-1.8 | 0.0-0.5 | .15 | .15 | | | | | | | | | | | | | | | | | 982: | | | | | | | | | | | | | | Yarborough----------| 0-8 | 75-90| 3-7 | 7-18|1.30-1.60| 0.3-2 |0.02-0.04| 1.0-1.8 | 0.5-1.0 | .20 | .17 | 2 | 6 | 48 | 8-80 | 70-90| 5-12| 5-18|1.30-1.60| 0.00-0.04 |0.02-0.04| 1.0-1.8 | 0.1-0.5 | .24 | .17 | | | | | | | | | | | | | | | | | 999: | | | | | | | | | | | | | | Dune land-----------| 0-80 | 90-99| 0-9 | 1-9 |1.55-1.65| 6-20 |0.02-0.08| 0.0-1.5 | 0.0-0.5 | .15 | .15 | 5 | 1 | 310 | | | | | | | | | | | | | | Satatton------------| 0-17 | 88-95| 1-8 | 4-12|1.50-1.70| 0.00-0.04 |0.00-0.02| 0.0-1.8 | 0.2-1.0 | .15 | .15 | 5 | 1 | 250 | 17-80 | 88-95| 1-8 | 4-12|1.50-1.70| 0.00-0.04 |0.00-0.02| 0.0-1.8 | 0.2-1.0 | .15 | .15 | | | | | | | | | | | | | | | | | CB1: | | | | | | | | | | | | | | Beaches-------------| 0-7 | 95-99| 0-3 | 1-3 |1.50-1.70| 6-20 |0.05-0.10| 0.0-1.7 | 0.0-0.5 | .15 | .15 | 5 | 1 | 220 | 7-80 | 95-99| 0-3 | 1-3 |1.50-1.70| 6-20 |0.05-0.10| 0.0-1.7 | 0.0-0.5 | .15 | .15 | | | | | | | | | | | | | | | | | CB2: | | | | | | | | | | | | | | Beaches-------------| 0-7 | 95-99| 0-3 | 1-3 |1.50-1.70| 6-20 |0.05-0.10| 0.0-1.7 | 0.0-0.5 | .15 | .15 | - | --- | --- | 7-80 | 95-99| 0-3 | 1-3 |1.50-1.70| 6-20 |0.05-0.10| 0.0-1.7 | 0.0-0.5 | .15 | .15 | | | | | | | | | | | | | | | | | CB3: | | | | | | | | | | | | | | Beaches-------------| 0-7 | 95-99| 0-3 | 1-3 |1.50-1.70| 6-20 |0.05-0.10| 0.0-1.7 | 0.0-0.5 | .15 | .15 | - | --- | --- | 7-80 | 95-99| 0-3 | 1-3 |1.50-1.70| 6-20 |0.05-0.10| 0.0-1.7 | 0.0-0.5 | .15 | .15 | | | | | | | | | | | | | | | | | CB4: | | | | | | | | | | | | | | Beaches-------------| 0-7 | 95-99| 0-3 | 1-3 |1.50-1.70| 6-20 |0.05-0.10| 0.0-1.7 | 0.0-0.5 | .15 | .15 | - | --- | --- | 7-80 | 95-99| 0-3 | 1-3 |1.50-1.70| 6-20 |0.05-0.10| 0.0-1.7 | 0.0-0.5 | .15 | .15 | | | | | | | | | | | | | | | | |
254S
oil Survey of
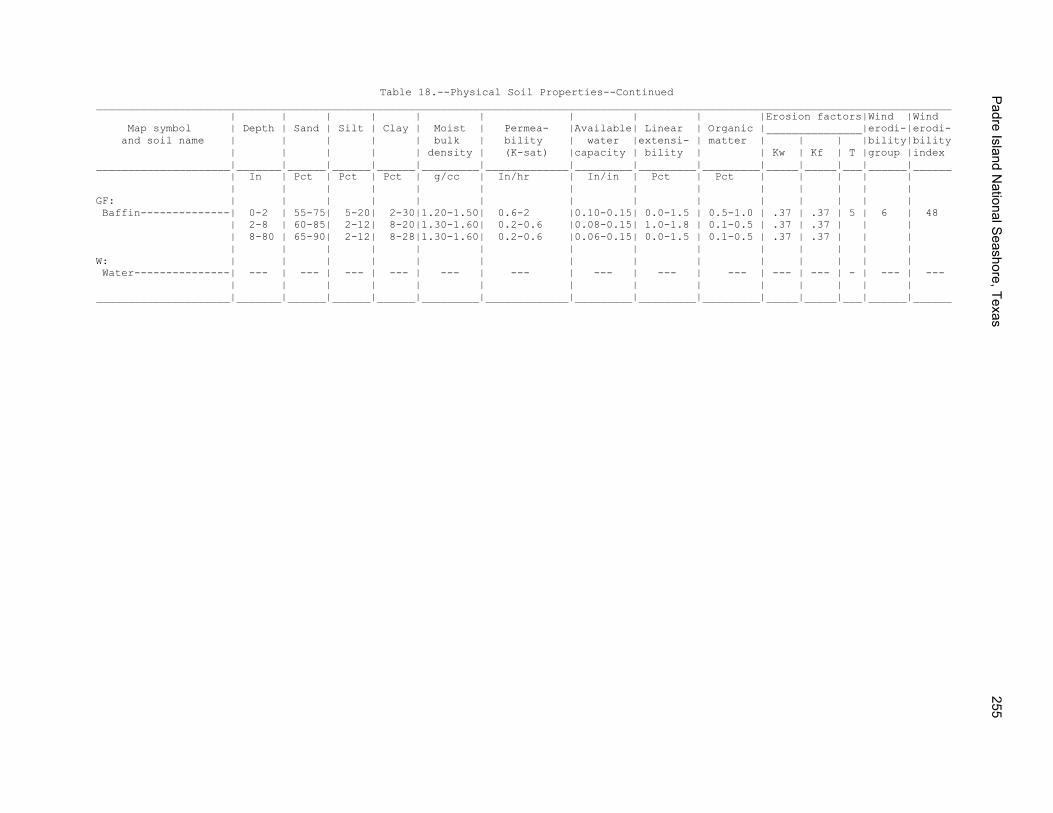
Table 18.--Physical Soil Properties--Continued ______________________________________________________________________________________________________________________________________ | | | | | | | | | |Erosion factors|Wind |Wind Map symbol | Depth | Sand | Silt | Clay | Moist | Permea- |Available| Linear | Organic |_______________|erodi-|erodi- and soil name | | | | | bulk | bility | water |extensi- | matter | | | |bility|bility | | | | | density | (K-sat) |capacity | bility | | Kw | Kf | T |group |index _____________________|_______|______|______|______|_________|_____________|_________|_________|_________|_____|_____|___|______|______ | In | Pct | Pct | Pct | g/cc | In/hr | In/in | Pct | Pct | | | | | | | | | | | | | | | | | | | GF: | | | | | | | | | | | | | | Baffin--------------| 0-2 | 55-75| 5-20| 2-30|1.20-1.50| 0.6-2 |0.10-0.15| 0.0-1.5 | 0.5-1.0 | .37 | .37 | 5 | 6 | 48 | 2-8 | 60-85| 2-12| 8-20|1.30-1.60| 0.2-0.6 |0.08-0.15| 1.0-1.8 | 0.1-0.5 | .37 | .37 | | | | 8-80 | 65-90| 2-12| 8-28|1.30-1.60| 0.2-0.6 |0.06-0.15| 0.0-1.5 | 0.1-0.5 | .37 | .37 | | | | | | | | | | | | | | | | | W: | | | | | | | | | | | | | | Water---------------| --- | --- | --- | --- | --- | --- | --- | --- | --- | --- | --- | - | --- | --- | | | | | | | | | | | | | | _____________________|_______|______|______|______|_________|_____________|_________|_________|_________|_____|_____|___|______|______
Padre Island N
ational Seashore, Texas
255
Table 19.--Chemical Soil Properties
(Absence of an entry indicates that data were not estimated.) _______________________________________________________________________________________________________ | | | | | | | | Map symbol | Depth | Cation |Effective| Soil |Calcium| Gypsum | Salinity | Sodium and soil name | |exchange | cation |reaction |carbon-| | | adsorp- | |capacity |exchange | | ate | | | tion | | |capacity | | | | | ratio ______________________|________|_________|_________|_________|_______|________|_______________|_________ | In |meq/100 g|meq/100 g| pH | Pct | Pct | mmhos/cm | | | | | | | | | 82A: | | | | | | | | Mustang--------------| 0-19 | 1.0-5.0 | --- | 6.6-9.0 | 1-5 | 0 | 0.0-4.0 | 0-10 | 19-80 | 1.0-5.0 | --- | 6.6-9.0 | 1-5 | 0 | 0.0-4.0 | 0-8 | | | | | | | | 95BD: | | | | | | | | Twinpalms------------| 0-18 | 1.0-5.0 | --- | 7.4-9.0 | 5-15 | 0 | 0.0-4.0 | 0-8 | 18-30 | 2.0-6.0 | --- | 7.4-9.0 | 5-15 | 0 | 0.0-4.0 | 0-8 | 30-80 | 2.0-6.0 | --- | 6.6-9.0 | 5-15 | 0 | 0.0-4.0 | 0-8 | | | | | | | | Yarborough-----------| 0-7 | 3.8-9.7 | --- | 7.4-8.4 | 5-15 | 0 | 15.0-60.0 | 20-60 | 7-80 | 2.6-9.6 | --- | 7.4-8.4 | 5-15 | 0 | 20.0-60.0 | 20-60 | | | | | | | | 102: | | | | | | | | Satatton-------------| 0-17 | 2.0-5.0 | --- | 6.6-9.0 | 3-15 | 0 | 60.0-175.0 | 60-125 | 17-80 | 2.0-5.0 | --- | 6.6-9.0 | 3-15 | 0-1 | 60.0-175.0 | 60-125 | | | | | | | | 103: | | | | | | | | Tatton---------------| 0-4 | 1.0-7.0 | --- | 6.6-9.0 | 5-15 | 0 | 60.0-175.0 | 60-125 | 4-12 | 1.0-5.0 | --- | 6.6-9.0 | 5-15 | 0 | 60.0-175.0 | 60-125 | 12-80 | 1.0-5.0 | --- | 6.6-9.0 | 5-15 | 0 | 60.0-175.0 | 60-125 | | | | | | | | 199: | | | | | | | | Dune land------------| 0-80 | 0.0-10 | --- | 6.1-8.4 | 0 | 0 | 0.0-2.0 | 0 | | | | | | | | 282: | | | | | | | | Madre----------------| 0-11 | 1.0-5.0 | --- | 6.6-9.0 | 5-15 | 0 | 0.0-4.0 | 5-20 | 11-41 | 1.0-5.0 | --- | 6.6-9.0 | 5-15 | 0 | 2.0-8.0 | 13-40 | 41-46 | 1.0-5.0 | --- | 6.6-9.0 | 5-15 | 0 | 2.0-8.0 | 13-40 | 46-80 | 1.0-5.0 | --- | 6.6-9.0 | 5-15 | 0 | 2.0-8.0 | 13-40 | | | | | | | | Malaquite------------| 0-5 | 1.0-5.0 | --- | 6.6-9.0 | 1-10 | 0 | 10.0-45.0 | 30-50 | 5-21 | 1.0-5.0 | --- | 6.6-9.0 | 1-10 | 0 | 15.0-75.0 | 30-60 | 21-27 | 1.0-5.0 | --- | 6.6-9.0 | 1-10 | 0 | 20.0-75.0 | 35-70 | 27-80 | 1.0-5.0 | --- | 6.6-9.0 | 1-10 | 0 | 20.0-75.0 | 35-70 | | | | | | | | 290: | | | | | | | | Novillo--------------| 0-2 | 50-90 | --- | 5.6-6.5 | 0 | 0 | 0.0-2.0 | 0 | 2-12 | 1.0-5.0 | --- | 5.6-7.3 | 0 | 0 | 0.0-4.0 | 0-8 | 12-80 | 1.0-5.0 | --- | 6.1-7.8 | 0 | 0 | 0.0-4.0 | 2-10 | | | | | | | | 291: | | | | | | | | Mustang--------------| 0-19 | 1.0-5.0 | --- | 6.6-9.0 | 1-5 | 0 | 0.0-4.0 | 0-10 | 19-80 | 1.0-5.0 | --- | 6.6-9.0 | 1-5 | 0 | 0.0-4.0 | 0-8 | | | | | | | | Padre----------------| 0-19 | 1.0-5.0 | --- | 5.1-7.3 | 1-5 | 0 | 0.0-2.0 | 0-4 | 19-28 | 1.0-5.0 | --- | 5.1-7.3 | 1-5 | 0 | 0.0-2.0 | 0-4 | | | | | | | | | 28-80 | 1.0-5.0 | --- | 5.1-7.3 | 1-5 | 0 | 0.0-2.0 | 0-4 | | | | | | | | 299: | | | | | | | | Greenhill------------| 0-28 | 1.0-5.0 | --- | 5.1-6.5 | 0 | 0 | 0.0-2.0 | 0-4 | 28-80 | 1.0-5.0 | --- | 5.1-6.5 | 0 | 0 | 0.0-2.0 | 0-4 | | | | | | | | 399: | | | | | | | | Greenhill------------| 0-21 | 1.0-5.0 | --- | 5.1-6.5 | 0 | 0 | 0.0-2.0 | 0-4 | 21-80 | 1.0-5.0 | --- | 5.1-6.5 | 0 | 0 | 0.0-2.0 | 0-4 | | | | | | | |
256 Soil Survey of
Table 19.--Chemical Soil Properties--Continued _______________________________________________________________________________________________________ | | | | | | | | Map symbol | Depth | Cation |Effective| Soil |Calcium| Gypsum | Salinity | Sodium and soil name | |exchange | cation |reaction |carbon-| | | adsorp- | |capacity |exchange | | ate | | | tion | | |capacity | | | | | ratio ______________________|________|_________|_________|_________|_______|________|_______________|________ | In |meq/100 g|meq/100 g| pH | Pct | Pct | mmhos/cm | | | | | | | | | Mustang--------------| 0-19 | 1.0-5.0 | --- | 6.6-9.0 | 1-5 | 0 | 0.0-4.0 | 0-10 | 19-80 | 1.0-5.0 | --- | 6.6-9.0 | 1-5 | 0 | 0.0-4.0 | 0-8 | | | | | | | | 402: | | | | | | | | Tatton---------------| 0-11 | 1.0-7.0 | --- | 6.6-9.0 | 1-3 | 0 | 60.0-175.0 | 60-100 | 11-80 | 1.0-5.0 | --- | 6.6-9.0 | 1-5 | 0 | 60.0-175.0 | 60-100 | | | | | | | | Beaches, washover fan| 0-80 | 1.0-7.0 | --- | 6.6-9.0 | 5-15 | 0 | 60.0-175.0 | 60-100 | | | | | | | | 491: | | | | | | | | Mustang--------------| 0-11 | 1.0-5.0 | --- | 6.6-9.0 | 1-5 | 0 | 0.0-4.0 | 0-10 | 11-80 | 1.0-5.0 | --- | 6.6-9.0 | 1-5 | 0 | 0.0-4.0 | 0-8 | | | | | | | | Panam----------------| 0-9 | 1.0-5.0 | --- | 7.4-9.0 | 5-15 | 0 | 0.0-2.0 | 0-4 | 9-38 | 1.0-5.0 | --- | 7.4-9.0 | 5-15 | 0 | 0.0-4.0 | 0-8 | 38-80 | 1.0-5.0 | --- | 7.4-9.0 | 5-15 | 0 | 0.0-4.0 | 0-8 | | | | | | | | 499: | | | | | | | | Daggerhill-----------| 0-18 | 1.0-5.0 | --- | 6.6-9.0 | 1-10 | 0 | 0.0-2.0 | 0-8 | 18-80 | 1.0-5.0 | --- | 6.6-9.0 | 1-10 | 0 | 0.0-2.0 | 0-8 | | | | | | | | 502: | | | | | | | | Daggerhill-----------| 0-18 | 1.0-5.0 | --- | 6.6-9.0 | 1-10 | 0 | 0.0-2.0 | 0-8 | 18-80 | 1.0-5.0 | --- | 6.6-9.0 | 1-10 | 0 | 0.0-2.0 | 0-8 | | | | | | | | Satatton-------------| 0-17 | 2.0-5.0 | --- | 6.6-9.0 | 5-15 | 0 | 60.0-175.0 | 60-125 | 17-80 | 2.0-5.0 | --- | 6.6-9.0 | 5-15 | 0-1 | 60.0-175.0 | 60-125 | | | | | | | | 599: | | | | | | | | Daggerhill-----------| 0-18 | 1.0-5.0 | --- | 6.6-9.0 | 1-10 | 0 | 0.0-2.0 | 0-8 | 18-80 | 1.0-5.0 | --- | 6.6-9.0 | 1-10 | 0 | 0.0-2.0 | 0-8 | | | | | | | | Mustang--------------| 0-11 | 1.0-5.0 | --- | 6.6-9.0 | 1-5 | 0 | 0.0-4.0 | 0-10 | 11-80 | 1.0-5.0 | --- | 6.6-9.0 | 1-5 | 0 | 0.0-4.0 | 0-8 | | | | | | | | 891: | | | | | | | | Madre----------------| 0-8 | 1.0-5.0 | --- | 6.6-9.0 | 1-5 | 0 | 0.0-4.0 | 5-20 | 8-80 | 1.0-5.0 | --- | 6.6-9.0 | 1-5 | 0 | 2.0-8.0 | 13-40 | | | | | | | | Panam----------------| 0-23 | 1.0-5.0 | --- | 7.4-9.0 | 5-15 | 0 | 0.0-2.0 | 0-4 | 23-38 | 1.0-5.0 | --- | 7.4-9.0 | 5-15 | 0 | 0.0-4.0 | 0-8 | 38-80 | 1.0-5.0 | --- | 7.4-9.0 | 5-15 | 0 | 0.0-4.0 | 0-8 | | | | | | | | 982: | | | | | | | | Yarborough-----------| 0-8 | 3.8-9.7 | --- | 7.4-8.4 | 5-15 | 0 | 15.0-60.0 | 20-60 | 8-80 | 2.6-9.6 | --- | 7.4-8.4 | 5-15 | 0 | 20.0-60.0 | 20-60 | | | | | | | | 999: | | | | | | | | Dune land------------| 0-80 | 0.0-10 | --- | 6.1-8.4 | 0 | 0 | 0.0-2.0 | 0 | | | | | | | | Satatton-------------| 0-17 | 2.0-5.0 | --- | 6.6-9.0 | 3-15 | 0 | 60.0-175.0 | 60-125 | 17-80 | 2.0-5.0 | --- | 6.6-9.0 | 3-15 | 0-1 | 60.0-175.0 | 60-125 | | | | | | | | CB1: | | | | | | | | Beaches--------------| 0-7 | 1.0-5.0 | --- | 5.1-7.3 | 5-15 | 0 | 10.0-20.0 | 15-30 | 7-80 | 1.0-5.0 | --- | 5.1-7.3 | 5-15 | 0 | 10.0-20.0 | 15-30 | | | | | | | | CB2: | | | | | | | | Beaches--------------| 0-7 | 1.0-5.0 | --- | 5.1-7.3 | 5-15 | 0 | 10.0-20.0 | 15-30 | 7-80 | 1.0-5.0 | --- | 5.1-7.3 | 5-15 | 0 | 10.0-20.0 | 15-30 | | | | | | | |
Padre Island National Seashore, Texas 257
Table 19.--Chemical Soil Properties--Continued _______________________________________________________________________________________________________ | | | | | | | | Map symbol | Depth | Cation |Effective| Soil |Calcium| Gypsum | Salinity | Sodium and soil name | |exchange | cation |reaction |carbon-| | | adsorp- | |capacity |exchange | | ate | | | tion | | |capacity | | | | | ratio ______________________|________|_________|_________|_________|_______|________|_______________|________ | In |meq/100 g|meq/100 g| pH | Pct | Pct | mmhos/cm | | | | | | | | | CB3: | | | | | | | | Beaches--------------| 0-7 | 1.0-5.0 | --- | 5.1-7.3 | 5-15 | 0 | 10.0-20.0 | 15-30 | 7-80 | 1.0-5.0 | --- | 5.1-7.3 | 5-15 | 0 | 10.0-20.0 | 15-30 | | | | | | | | CB4: | | | | | | | | Beaches--------------| 0-7 | 1.0-5.0 | --- | 5.1-7.3 | 5-15 | 0 | 10.0-20.0 | 15-30 | 7-80 | 1.0-5.0 | --- | 5.1-7.3 | 5-15 | 0 | 10.0-20.0 | 15-30 | | | | | | | | GF: | | | | | | | | Baffin---------------| 0-2 | 1.0-7.0 | --- | 7.4-8.4 | 0-15 | 0 | 40.0-50.0 | 35-70 | 2-8 | 1.0-7.0 | --- | 7.4-8.4 | 0-15 | 0 | 40.0-50.0 | 35-70 | 8-80 | 1.0-7.0 | --- | 6.6-8.4 | 0-15 | 0 | 35.0-85.0 | 45-75 | | | | | | | | W: | | | | | | | | Water----------------| --- | --- | --- | --- | --- | --- | --- | --- | | | | | | | | ______________________|________|_________|_________|_________|_______|________|_______________|________
258 Soil Survey of
Table 20.--Water Features (Depths of layers are in feet. See text for definitions of terms used in this table. Estimates of the frequency of ponding and flooding
apply to the whole year rather than to individual months. Absence of an entry indicates that the feature is not a concern or that data were not estimated.)
___________________________________________________________________________________________________________________________________ | | | | Water table | Ponding | Flooding | | | |_______________|_____________________________|__________________________ Map symbol |Hydro-| Surface | Month | Upper | Lower |Surface| Duration |Frequency | Duration | Frequency and soil name |logic | runoff | | limit | limit | water | | | | |group | | | | | depth | | | | ___________________________|______|____________|__________|_______|_______|_______|__________|__________|____________|_____________ | | | | Ft | Ft | Ft | | | | | | | | | | | | | | 82A: | | | | | | | | | | Mustang-------------------| D | Negligible |January |0.0-0.5| >6.0 | --- | --- | None | --- | --- | | |February |0.0-0.5| >6.0 | --- | --- | None | --- | --- | | |March |0.0-0.5| >6.0 | --- | --- | None | --- | --- | | |April |0.0-0.5| >6.0 | --- | --- | None | --- | --- | | |May |0.0-0.5| >6.0 | --- | --- | None | --- | --- | | |June |0.0-0.5| >6.0 | --- | --- | None | Brief | Occasional | | |July |0.0-0.5| >6.0 | --- | --- | None | Brief | Occasional | | |August |0.0-0.5| >6.0 | --- | --- | None | Brief | Occasional | | |September |0.0-0.5| >6.0 |0.0-0.5| Long | Frequent | Brief | Occasional | | |October |0.0-0.5| >6.0 |0.0-0.5| Long | Frequent | Brief | Occasional | | |November |0.0-0.5| >6.0 |0.0-0.5| Long | Frequent | Brief | Occasional | | |December |0.0-0.5| >6.0 |0.0-0.5| Long | Frequent | --- | --- | | | | | | | | | | 95BD: | | | | | | | | | | Twinpalms-----------------| C | Low |January |2.5-5.0| >6.0 | --- | --- | None | --- | --- | | |February |2.5-5.0| >6.0 | --- | --- | None | --- | --- | | |March |2.5-5.0| >6.0 | --- | --- | None | --- | --- | | |April |2.5-5.0| >6.0 | --- | --- | None | --- | --- | | |May |2.5-5.0| >6.0 | --- | --- | None | --- | --- | | |June |2.5-5.0| >6.0 | --- | --- | None | Brief | Occasional | | |July |2.5-5.0| >6.0 | --- | --- | None | Brief | Occasional | | |August |2.5-5.0| >6.0 | --- | --- | None | Brief | Occasional | | |September |2.5-5.0| >6.0 | --- | --- | None | Brief | Occasional | | |October |2.5-5.0| >6.0 | --- | --- | None | Brief | Occasional | | |November |2.5-5.0| >6.0 | --- | --- | None | Brief | Occasional | | |December |2.5-5.0| >6.0 | --- | --- | None | --- | --- | | | | | | | | | | Yarborough----------------| D | High |January |0.8-2.0| >6.0 | --- | --- | None | Very brief | Frequent | | |February |0.8-2.0| >6.0 | --- | --- | None | Very brief | Frequent | | |March |0.8-2.0| >6.0 | --- | --- | None | Very brief | Frequent | | |April |0.8-2.0| >6.0 | --- | --- | None | Very brief | Frequent | | |May |0.8-2.0| >6.0 | --- | --- | None | Very brief | Frequent | | |June |0.8-2.0| >6.0 | --- | --- | None | Very brief | Frequent | | |July |0.8-2.0| >6.0 | --- | --- | None | Very brief | Frequent | | |August |0.8-2.0| >6.0 | --- | --- | None | Very brief | Frequent | | |September |0.8-2.0| >6.0 | --- | --- | None | Very brief | Frequent | | |October |0.8-2.0| >6.0 | --- | --- | None | Very brief | Frequent | | |November |0.8-2.0| >6.0 | --- | --- | None | Very brief | Frequent | | |December |0.8-2.0| >6.0 | --- | --- | None | Very brief | Frequent | | | | | | | | | |
Padre Island N
ational Seashore, Texas
259
Table 20.--Water Features--Continued __________________________________________________________________________________________________________________________________ | | | | Water table | Ponding | Flooding | | | |_______________|_____________________________|_________________________ Map symbol |Hydro-| Surface | Month | Upper | Lower |Surface| Duration |Frequency | Duration | Frequency and soil name |logic | runoff | | limit | limit | water | | | | |group | | | | | depth | | | | ___________________________|______|____________|__________|_______|_______|_______|__________|__________|____________|____________ | | | | Ft | Ft | Ft | | | | | | | | | | | | | | 102: | | | | | | | | | | Satatton------------------| D | Negligible |January |0.0-1.5| >6.0 | --- | --- | None | Brief | Frequent | | |February |0.0-1.5| >6.0 | --- | --- | None | Brief | Frequent | | |March |0.0-1.5| >6.0 | --- | --- | None | Brief | Frequent | | |April |0.0-1.5| >6.0 | --- | --- | None | Brief | Frequent | | |May |0.0-1.5| >6.0 | --- | --- | None | Brief | Frequent | | |June |0.0-1.5| >6.0 | --- | --- | None | Brief | Frequent | | |July |0.0-1.5| >6.0 | --- | --- | None | Brief | Frequent | | |August |0.0-1.5| >6.0 | --- | --- | None | Brief | Frequent | | |September |0.0-1.5| >6.0 | --- | --- | None | Brief | Frequent | | |October |0.0-1.5| >6.0 | --- | --- | None | Brief | Frequent | | |November |0.0-1.5| >6.0 | --- | --- | None | Brief | Frequent | | |December |0.0-1.5| >6.0 | --- | --- | None | Brief | Frequent | | | | | | | | | | 103: | | | | | | | | | | Tatton--------------------| D | Negligible |January |0.0-0.8| >6.0 | --- | --- | None | Very brief |Very frequent | | |February |0.0-0.8| >6.0 | --- | --- | None | Very brief |Very frequent | | |March |0.0-0.8| >6.0 | --- | --- | None | Very brief |Very frequent | | |April |0.0-0.8| >6.0 | --- | --- | None | Very brief |Very frequent | | |May |0.0-0.8| >6.0 | --- | --- | None | Very brief |Very frequent | | |June |0.0-0.8| >6.0 | --- | --- | None | Very brief |Very frequent | | |July |0.0-0.8| >6.0 | --- | --- | None | Very brief |Very frequent | | |August |0.0-0.8| >6.0 | --- | --- | None | Very brief |Very frequent | | |September |0.0-0.8| >6.0 | --- | --- | None | Very brief |Very frequent | | |October |0.0-0.8| >6.0 | --- | --- | None | Very brief |Very frequent | | |November |0.0-0.8| >6.0 | --- | --- | None | Very brief |Very frequent | | |December |0.0-0.8| >6.0 | --- | --- | None | Very brief |Very frequent | | | | | | | | | | 199: | | | | | | | | | | Dune land-----------------| A | Negligible |January | --- | --- | --- | --- | None | --- | Occasional | | |February | --- | --- | --- | --- | None | --- | Occasional | | |March | --- | --- | --- | --- | None | --- | Occasional | | |April | --- | --- | --- | --- | None | --- | Occasional | | |May | --- | --- | --- | --- | None | --- | Occasional | | |June | --- | --- | --- | --- | None | --- | Occasional | | |July | --- | --- | --- | --- | None | --- | Occasional | | |August | --- | --- | --- | --- | None | --- | Occasional | | |September | --- | --- | --- | --- | None | --- | Occasional | | |October | --- | --- | --- | --- | None | --- | Occasional | | |November | --- | --- | --- | --- | None | --- | Occasional | | |December | --- | --- | --- | --- | None | --- | Occasional | | | | | | | | | |
260S
oil Survey of
Table 20.--Water Features--Continued __________________________________________________________________________________________________________________________________ | | | | Water table | Ponding | Flooding | | | |_______________|_____________________________|_________________________ Map symbol |Hydro-| Surface | Month | Upper | Lower |Surface| Duration |Frequency | Duration | Frequency and soil name |logic | runoff | | limit | limit | water | | | | |group | | | | | depth | | | | ___________________________|______|____________|__________|_______|_______|_______|__________|__________|____________|____________ | | | | Ft | Ft | Ft | | | | | | | | | | | | | | 282: | | | | | | | | | | Madre---------------------| D | Negligible |January |0.0-0.5| >6.0 | --- | --- | None | --- | --- | | |February |0.0-0.5| >6.0 | --- | --- | None | --- | --- | | |March |0.0-0.5| >6.0 | --- | --- | None | --- | --- | | |April |0.0-0.5| >6.0 | --- | --- | None | --- | --- | | |May |0.0-0.5| >6.0 | --- | --- | None | --- | --- | | |June |0.0-0.5| >6.0 | --- | --- | None | Brief | Occasional | | |July |0.0-0.5| >6.0 | --- | --- | None | Brief | Occasional | | |August |0.0-0.5| >6.0 | --- | --- | None | Brief | Occasional | | |September |0.0-0.5| >6.0 |0.0-0.5| Long | Frequent | Brief | Occasional | | |October |0.0-0.5| >6.0 |0.0-0.5| Long | Frequent | Brief | Occasional | | |November |0.0-0.5| >6.0 |0.0-0.5| Long | Frequent | Brief | Occasional | | |December |0.0-0.5| >6.0 |0.0-0.5| Long | Frequent | --- | --- | | | | | | | | | | Malaquite-----------------| D | Negligible |January |0.0-0.5| >6.0 | --- | --- | None | --- | --- | | |February |0.0-0.5| >6.0 | --- | --- | None | --- | --- | | |March |0.0-0.5| >6.0 | --- | --- | None | --- | --- | | |April |0.0-0.5| >6.0 | --- | --- | None | --- | --- | | |May |0.0-0.5| >6.0 | --- | --- | None | --- | --- | | |June |0.0-0.5| >6.0 | --- | --- | None | Brief | Occasional | | |July |0.0-0.5| >6.0 | --- | --- | None | Brief | Occasional | | |August |0.0-0.5| >6.0 | --- | --- | None | Brief | Occasional | | |August |0.0-0.5| >6.0 | --- | --- | None | Brief | Occasional | | |September |0.0-0.5| >6.0 |0.0-0.5| Long | Frequent | Brief | Occasional | | |October |0.0-0.5| >6.0 |0.0-0.5| Long | Frequent | Brief | Occasional | | |November |0.0-0.5| >6.0 |0.0-0.5| Long | Frequent | Brief | Occasional | | |December |0.0-0.5| >6.0 |0.0-0.5| Long | Frequent | --- | --- | | | | | | | | | | 290: | | | | | | | | | | Novillo-------------------| D | Negligible |January |0.0-0.5| >6.0 |0.0-2.5|Very long | Frequent | --- | --- | | |February |0.0-0.5| >6.0 |0.0-2.5|Very long | Frequent | --- | --- | | |March |0.0-0.5| >6.0 |0.0-2.5|Very long | Frequent | --- | --- | | |April |0.0-0.5| >6.0 |0.0-2.5|Very long | Frequent | --- | --- | | |May |0.0-0.5| >6.0 |0.0-2.5|Very long | Frequent | --- | --- | | |June |0.0-0.5| >6.0 |0.0-2.5|Very long | Frequent | Brief | Occasional | | |July |0.0-0.5| >6.0 |0.0-2.5|Very long | Frequent | Brief | Occasional | | |August |0.0-0.5| >6.0 |0.0-2.5|Very long | Frequent | Brief | Occasional | | |September |0.0-0.5| >6.0 |0.0-2.5|Very long | Frequent | Brief | Occasional | | |October |0.0-0.5| >6.0 |0.0-2.5|Very long | Frequent | Brief | Occasional | | |November |0.0-0.5| >6.0 |0.0-2.5|Very long | Frequent | Brief | Occasional | | |December |0.0-0.5| >6.0 |0.0-2.5|Very long | Frequent | --- | --- | | | | | | | | | |
Padre Island N
ational Seashore, Texas
261
Table 20.--Water Features--Continued __________________________________________________________________________________________________________________________________ | | | | Water table | Ponding | Flooding | | | |_______________|_____________________________|_________________________ Map symbol |Hydro-| Surface | Month | Upper | Lower |Surface| Duration |Frequency | Duration | Frequency and soil name |logic | runoff | | limit | limit | water | | | | |group | | | | | depth | | | | ___________________________|______|____________|__________|_______|_______|_______|__________|__________|____________|____________ | | | | Ft | Ft | Ft | | | | | | | | | | | | | | 291: | | | | | | | | | | Mustang-------------------| D | Negligible |January |0.0-0.5| >6.0 | --- | --- | None | --- | --- | | |February |0.0-0.5| >6.0 | --- | --- | None | --- | --- | | |March |0.0-0.5| >6.0 | --- | --- | None | --- | --- | | |April |0.0-0.5| >6.0 | --- | --- | None | --- | --- | | |May |0.0-0.5| >6.0 | --- | --- | None | --- | --- | | |June |0.0-0.5| >6.0 | --- | --- | None | Brief | Occasional | | |July |0.0-0.5| >6.0 | --- | --- | None | Brief | Occasional | | |August |0.0-0.5| >6.0 | --- | --- | None | Brief | Occasional | | |September |0.0-0.5| >6.0 |0.0-0.5| Long | Frequent | Brief | Occasional | | |October |0.0-0.5| >6.0 |0.0-0.5| Long | Frequent | Brief | Occasional | | |November |0.0-0.5| >6.0 |0.0-0.5| Long | Frequent | Brief | Occasional | | |December |0.0-0.5| >6.0 |0.0-0.5| Long | Frequent | --- | --- | | | | | | | | | | Padre---------------------| A | Negligible |January |2.5-4.0| >6.0 | --- | --- | None | --- | --- | | |February |2.5-4.0| >6.0 | --- | --- | None | --- | --- | | |March |2.5-4.0| >6.0 | --- | --- | None | --- | --- | | |April |2.5-4.0| >6.0 | --- | --- | None | --- | --- | | |May |2.5-4.0| >6.0 | --- | --- | None | --- | --- | | |June |2.5-4.0| >6.0 | --- | --- | None | Very brief | Occasional | | |July |2.5-4.0| >6.0 | --- | --- | None | Very brief | Occasional | | |August |2.5-4.0| >6.0 | --- | --- | None | Very brief | Occasional | | |September |2.5-4.0| >6.0 | --- | --- | None | Very brief | Occasional | | |October |2.5-4.0| >6.0 | --- | --- | None | Very brief | Occasional | | |November |2.5-4.0| >6.0 | --- | --- | None | Very brief | Occasional | | |December |2.5-4.0| >6.0 | --- | --- | None | --- | --- | | | | | | | | | | 299: | | | | | | | | | | Greenhill-----------------| A | Very low |June | --- | --- | --- | --- | None | --- | Rare | | |July | --- | --- | --- | --- | None | --- | Rare | | |August | --- | --- | --- | --- | None | --- | Rare | | |September | --- | --- | --- | --- | None | --- | Rare | | |October | --- | --- | --- | --- | None | --- | Rare | | |November | --- | --- | --- | --- | None | --- | Rare | | | | | | | | | | 399: | | | | | | | | | | Greenhill-----------------| A | Very low |June | --- | --- | --- | --- | None | --- | Rare | | |July | --- | --- | --- | --- | None | --- | Rare | | |August | --- | --- | --- | --- | None | --- | Rare | | |September | --- | --- | --- | --- | None | --- | Rare | | |October | --- | --- | --- | --- | None | --- | Rare | | |November | --- | --- | --- | --- | None | --- | Rare | | | | | | | | | |
262S
oil Survey of
Table 20.--Water Features--Continued __________________________________________________________________________________________________________________________________ | | | | Water table | Ponding | Flooding | | | |_______________|_____________________________|_________________________ Map symbol |Hydro-| Surface | Month | Upper | Lower |Surface| Duration |Frequency | Duration | Frequency and soil name |logic | runoff | | limit | limit | water | | | | |group | | | | | depth | | | | ___________________________|______|____________|__________|_______|_______|_______|__________|__________|____________|____________ | | | | Ft | Ft | Ft | | | | | | | | | | | | | | Mustang-------------------| D | Negligible |January |0.0-0.5| >6.0 | --- | --- | None | --- | --- | | |February |0.0-0.5| >6.0 | --- | --- | None | --- | --- | | |March |0.0-0.5| >6.0 | --- | --- | None | --- | --- | | |April |0.0-0.5| >6.0 | --- | --- | None | --- | --- | | |May |0.0-0.5| >6.0 | --- | --- | None | --- | --- | | |June |0.0-0.5| >6.0 | --- | --- | None | Brief | Occasional | | |July |0.0-0.5| >6.0 | --- | --- | None | Brief | Occasional | | |August |0.0-0.5| >6.0 | --- | --- | None | Brief | Occasional | | |September |0.0-0.5| >6.0 |0.0-0.5| Long | Frequent | Brief | Occasional | | |October |0.0-0.5| >6.0 |0.0-0.5| Long | Frequent | Brief | Occasional | | |November |0.0-0.5| >6.0 |0.0-0.5| Long | Frequent | Brief | Occasional | | |December |0.0-0.5| >6.0 |0.0-0.5| Long | Frequent | --- | --- | | | | | | | | | | 402: | | | | | | | | | | Tatton--------------------| D | Negligible |January |0.0-0.8| >6.0 | --- | --- | None | Long |Very frequent | | |February |0.0-0.8| >6.0 | --- | --- | None | Long |Very frequent | | |March |0.0-0.8| >6.0 | --- | --- | None | Long |Very frequent | | |April |0.0-0.8| >6.0 | --- | --- | None | Long |Very frequent | | |May |0.0-0.8| >6.0 | --- | --- | None | Long |Very frequent | | |June |0.0-0.8| >6.0 | --- | --- | None | Long |Very frequent | | |July |0.0-0.8| >6.0 | --- | --- | None | Long |Very frequent | | |August |0.0-0.8| >6.0 | --- | --- | None | Long |Very frequent | | |September |0.0-0.8| >6.0 | --- | --- | None | Long |Very frequent | | |October |0.0-0.8| >6.0 | --- | --- | None | Long |Very frequent | | |November |0.0-0.8| >6.0 | --- | --- | None | Long |Very frequent | | |December |0.0-0.8| >6.0 | --- | --- | None | Long |Very frequent | | | | | | | | | | Beaches, washover fan-----| D | --- |January |0.0-0.8| >6.0 | --- | --- | None | Long |Very frequent | | |February |0.0-0.8| >6.0 | --- | --- | None | Long |Very frequent | | |March |0.0-0.8| >6.0 | --- | --- | None | Long |Very frequent | | |April |0.0-0.8| >6.0 | --- | --- | None | Long |Very frequent | | |May |0.0-0.8| >6.0 | --- | --- | None | Long |Very frequent | | |June |0.0-0.8| >6.0 | --- | --- | None | Long |Very frequent | | |July |0.0-0.8| >6.0 | --- | --- | None | Long |Very frequent | | |August |0.0-0.8| >6.0 | --- | --- | None | Long |Very frequent | | |September |0.0-0.8| >6.0 | --- | --- | None | Long |Very frequent | | |October |0.0-0.8| >6.0 | --- | --- | None | Long |Very frequent | | |November |0.0-0.8| >6.0 | --- | --- | None | Long |Very frequent | | |December |0.0-0.8| >6.0 | --- | --- | None | Long |Very frequent | | | | | | | | | | 491: | | | | | | | | | | Mustang-------------------| D | Negligible |January |0.0-0.5| >6.0 | --- | --- | None | --- | --- | | |February |0.0-0.5| >6.0 | --- | --- | None | --- | --- | | |March |0.0-0.5| >6.0 | --- | --- | None | --- | --- | | |April |0.0-0.5| >6.0 | --- | --- | None | --- | ---
Padre Island N
ational Seashore, Texas
263
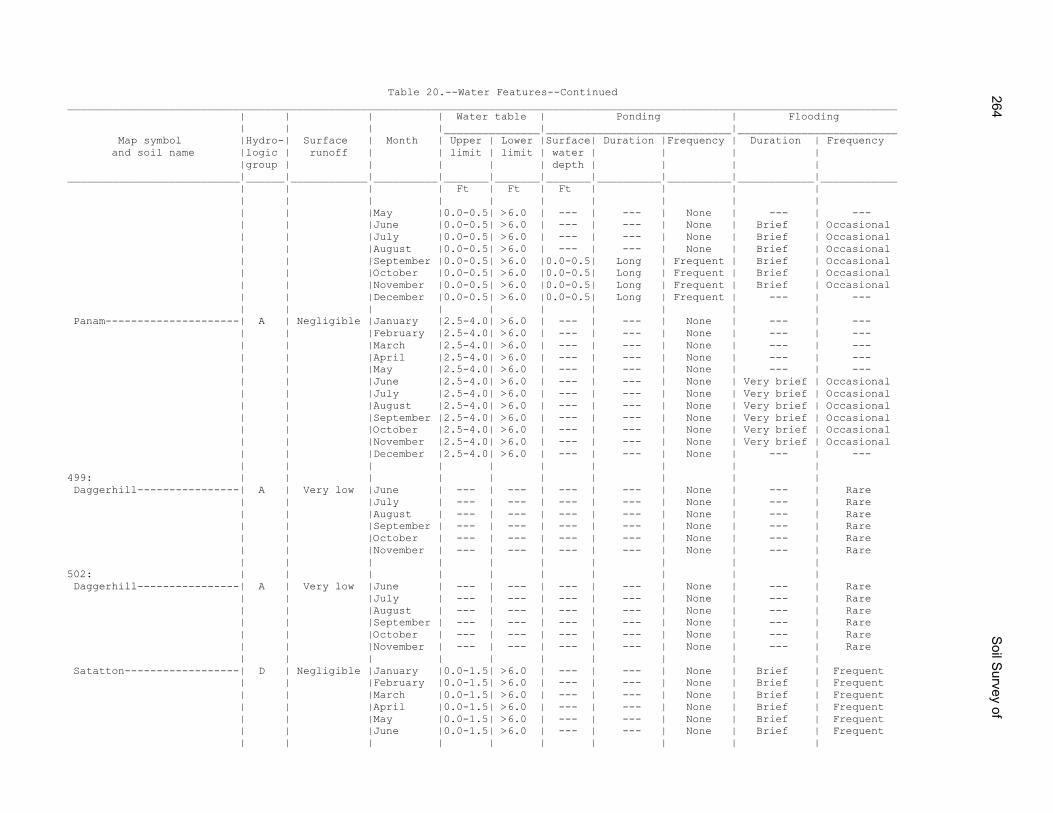
Table 20.--Water Features--Continued __________________________________________________________________________________________________________________________________ | | | | Water table | Ponding | Flooding | | | |_______________|_____________________________|_________________________ Map symbol |Hydro-| Surface | Month | Upper | Lower |Surface| Duration |Frequency | Duration | Frequency and soil name |logic | runoff | | limit | limit | water | | | | |group | | | | | depth | | | | ___________________________|______|____________|__________|_______|_______|_______|__________|__________|____________|____________ | | | | Ft | Ft | Ft | | | | | | | | | | | | | | | | |May |0.0-0.5| >6.0 | --- | --- | None | --- | --- | | |June |0.0-0.5| >6.0 | --- | --- | None | Brief | Occasional | | |July |0.0-0.5| >6.0 | --- | --- | None | Brief | Occasional | | |August |0.0-0.5| >6.0 | --- | --- | None | Brief | Occasional | | |September |0.0-0.5| >6.0 |0.0-0.5| Long | Frequent | Brief | Occasional | | |October |0.0-0.5| >6.0 |0.0-0.5| Long | Frequent | Brief | Occasional | | |November |0.0-0.5| >6.0 |0.0-0.5| Long | Frequent | Brief | Occasional | | |December |0.0-0.5| >6.0 |0.0-0.5| Long | Frequent | --- | --- | | | | | | | | | | Panam---------------------| A | Negligible |January |2.5-4.0| >6.0 | --- | --- | None | --- | --- | | |February |2.5-4.0| >6.0 | --- | --- | None | --- | --- | | |March |2.5-4.0| >6.0 | --- | --- | None | --- | --- | | |April |2.5-4.0| >6.0 | --- | --- | None | --- | --- | | |May |2.5-4.0| >6.0 | --- | --- | None | --- | --- | | |June |2.5-4.0| >6.0 | --- | --- | None | Very brief | Occasional | | |July |2.5-4.0| >6.0 | --- | --- | None | Very brief | Occasional | | |August |2.5-4.0| >6.0 | --- | --- | None | Very brief | Occasional | | |September |2.5-4.0| >6.0 | --- | --- | None | Very brief | Occasional | | |October |2.5-4.0| >6.0 | --- | --- | None | Very brief | Occasional | | |November |2.5-4.0| >6.0 | --- | --- | None | Very brief | Occasional | | |December |2.5-4.0| >6.0 | --- | --- | None | --- | --- | | | | | | | | | | 499: | | | | | | | | | | Daggerhill----------------| A | Very low |June | --- | --- | --- | --- | None | --- | Rare | | |July | --- | --- | --- | --- | None | --- | Rare | | |August | --- | --- | --- | --- | None | --- | Rare | | |September | --- | --- | --- | --- | None | --- | Rare | | |October | --- | --- | --- | --- | None | --- | Rare | | |November | --- | --- | --- | --- | None | --- | Rare | | | | | | | | | | 502: | | | | | | | | | | Daggerhill----------------| A | Very low |June | --- | --- | --- | --- | None | --- | Rare | | |July | --- | --- | --- | --- | None | --- | Rare | | |August | --- | --- | --- | --- | None | --- | Rare | | |September | --- | --- | --- | --- | None | --- | Rare | | |October | --- | --- | --- | --- | None | --- | Rare | | |November | --- | --- | --- | --- | None | --- | Rare | | | | | | | | | | Satatton------------------| D | Negligible |January |0.0-1.5| >6.0 | --- | --- | None | Brief | Frequent | | |February |0.0-1.5| >6.0 | --- | --- | None | Brief | Frequent | | |March |0.0-1.5| >6.0 | --- | --- | None | Brief | Frequent | | |April |0.0-1.5| >6.0 | --- | --- | None | Brief | Frequent | | |May |0.0-1.5| >6.0 | --- | --- | None | Brief | Frequent | | |June |0.0-1.5| >6.0 | --- | --- | None | Brief | Frequent | | | | | | | | | |
264S
oil Survey of
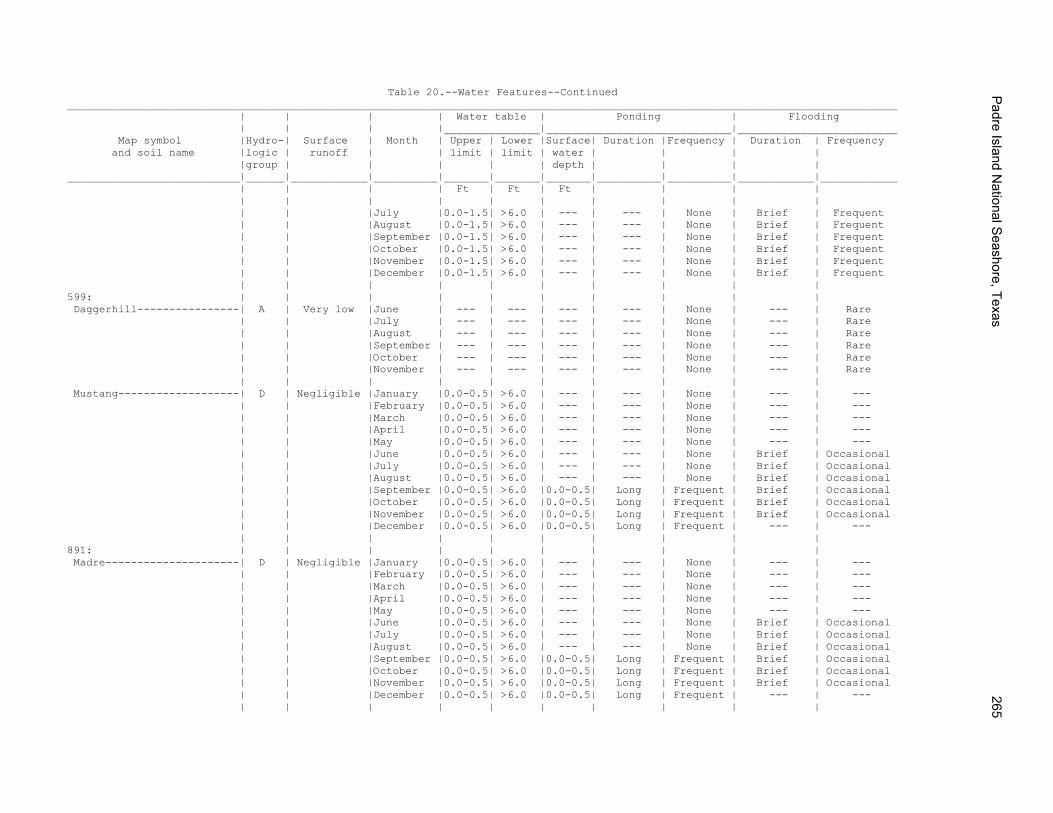
Table 20.--Water Features--Continued __________________________________________________________________________________________________________________________________ | | | | Water table | Ponding | Flooding | | | |_______________|_____________________________|_________________________ Map symbol |Hydro-| Surface | Month | Upper | Lower |Surface| Duration |Frequency | Duration | Frequency and soil name |logic | runoff | | limit | limit | water | | | | |group | | | | | depth | | | | ___________________________|______|____________|__________|_______|_______|_______|__________|__________|____________|____________ | | | | Ft | Ft | Ft | | | | | | | | | | | | | | | | |July |0.0-1.5| >6.0 | --- | --- | None | Brief | Frequent | | |August |0.0-1.5| >6.0 | --- | --- | None | Brief | Frequent | | |September |0.0-1.5| >6.0 | --- | --- | None | Brief | Frequent | | |October |0.0-1.5| >6.0 | --- | --- | None | Brief | Frequent | | |November |0.0-1.5| >6.0 | --- | --- | None | Brief | Frequent | | |December |0.0-1.5| >6.0 | --- | --- | None | Brief | Frequent | | | | | | | | | | 599: | | | | | | | | | | Daggerhill----------------| A | Very low |June | --- | --- | --- | --- | None | --- | Rare | | |July | --- | --- | --- | --- | None | --- | Rare | | |August | --- | --- | --- | --- | None | --- | Rare | | |September | --- | --- | --- | --- | None | --- | Rare | | |October | --- | --- | --- | --- | None | --- | Rare | | |November | --- | --- | --- | --- | None | --- | Rare | | | | | | | | | | Mustang-------------------| D | Negligible |January |0.0-0.5| >6.0 | --- | --- | None | --- | --- | | |February |0.0-0.5| >6.0 | --- | --- | None | --- | --- | | |March |0.0-0.5| >6.0 | --- | --- | None | --- | --- | | |April |0.0-0.5| >6.0 | --- | --- | None | --- | --- | | |May |0.0-0.5| >6.0 | --- | --- | None | --- | --- | | |June |0.0-0.5| >6.0 | --- | --- | None | Brief | Occasional | | |July |0.0-0.5| >6.0 | --- | --- | None | Brief | Occasional | | |August |0.0-0.5| >6.0 | --- | --- | None | Brief | Occasional | | |September |0.0-0.5| >6.0 |0.0-0.5| Long | Frequent | Brief | Occasional | | |October |0.0-0.5| >6.0 |0.0-0.5| Long | Frequent | Brief | Occasional | | |November |0.0-0.5| >6.0 |0.0-0.5| Long | Frequent | Brief | Occasional | | |December |0.0-0.5| >6.0 |0.0-0.5| Long | Frequent | --- | --- | | | | | | | | | | 891: | | | | | | | | | | Madre---------------------| D | Negligible |January |0.0-0.5| >6.0 | --- | --- | None | --- | --- | | |February |0.0-0.5| >6.0 | --- | --- | None | --- | --- | | |March |0.0-0.5| >6.0 | --- | --- | None | --- | --- | | |April |0.0-0.5| >6.0 | --- | --- | None | --- | --- | | |May |0.0-0.5| >6.0 | --- | --- | None | --- | --- | | |June |0.0-0.5| >6.0 | --- | --- | None | Brief | Occasional | | |July |0.0-0.5| >6.0 | --- | --- | None | Brief | Occasional | | |August |0.0-0.5| >6.0 | --- | --- | None | Brief | Occasional | | |September |0.0-0.5| >6.0 |0.0-0.5| Long | Frequent | Brief | Occasional | | |October |0.0-0.5| >6.0 |0.0-0.5| Long | Frequent | Brief | Occasional | | |November |0.0-0.5| >6.0 |0.0-0.5| Long | Frequent | Brief | Occasional | | |December |0.0-0.5| >6.0 |0.0-0.5| Long | Frequent | --- | --- | | | | | | | | | |
Padre Island N
ational Seashore, Texas
265
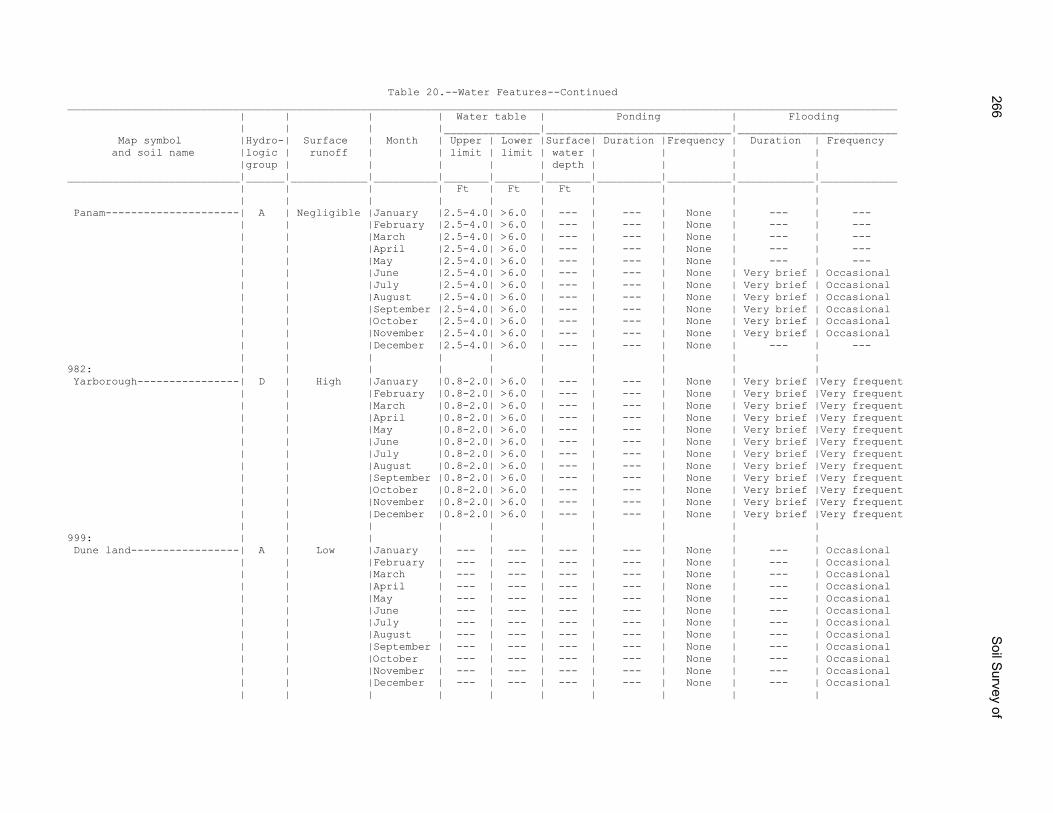
Table 20.--Water Features--Continued __________________________________________________________________________________________________________________________________ | | | | Water table | Ponding | Flooding | | | |_______________|_____________________________|_________________________ Map symbol |Hydro-| Surface | Month | Upper | Lower |Surface| Duration |Frequency | Duration | Frequency and soil name |logic | runoff | | limit | limit | water | | | | |group | | | | | depth | | | | ___________________________|______|____________|__________|_______|_______|_______|__________|__________|____________|____________ | | | | Ft | Ft | Ft | | | | | | | | | | | | | | Panam---------------------| A | Negligible |January |2.5-4.0| >6.0 | --- | --- | None | --- | --- | | |February |2.5-4.0| >6.0 | --- | --- | None | --- | --- | | |March |2.5-4.0| >6.0 | --- | --- | None | --- | --- | | |April |2.5-4.0| >6.0 | --- | --- | None | --- | --- | | |May |2.5-4.0| >6.0 | --- | --- | None | --- | --- | | |June |2.5-4.0| >6.0 | --- | --- | None | Very brief | Occasional | | |July |2.5-4.0| >6.0 | --- | --- | None | Very brief | Occasional | | |August |2.5-4.0| >6.0 | --- | --- | None | Very brief | Occasional | | |September |2.5-4.0| >6.0 | --- | --- | None | Very brief | Occasional | | |October |2.5-4.0| >6.0 | --- | --- | None | Very brief | Occasional | | |November |2.5-4.0| >6.0 | --- | --- | None | Very brief | Occasional | | |December |2.5-4.0| >6.0 | --- | --- | None | --- | --- | | | | | | | | | | 982: | | | | | | | | | | Yarborough----------------| D | High |January |0.8-2.0| >6.0 | --- | --- | None | Very brief |Very frequent | | |February |0.8-2.0| >6.0 | --- | --- | None | Very brief |Very frequent | | |March |0.8-2.0| >6.0 | --- | --- | None | Very brief |Very frequent | | |April |0.8-2.0| >6.0 | --- | --- | None | Very brief |Very frequent | | |May |0.8-2.0| >6.0 | --- | --- | None | Very brief |Very frequent | | |June |0.8-2.0| >6.0 | --- | --- | None | Very brief |Very frequent | | |July |0.8-2.0| >6.0 | --- | --- | None | Very brief |Very frequent | | |August |0.8-2.0| >6.0 | --- | --- | None | Very brief |Very frequent | | |September |0.8-2.0| >6.0 | --- | --- | None | Very brief |Very frequent | | |October |0.8-2.0| >6.0 | --- | --- | None | Very brief |Very frequent | | |November |0.8-2.0| >6.0 | --- | --- | None | Very brief |Very frequent | | |December |0.8-2.0| >6.0 | --- | --- | None | Very brief |Very frequent | | | | | | | | | | 999: | | | | | | | | | | Dune land-----------------| A | Low |January | --- | --- | --- | --- | None | --- | Occasional | | |February | --- | --- | --- | --- | None | --- | Occasional | | |March | --- | --- | --- | --- | None | --- | Occasional | | |April | --- | --- | --- | --- | None | --- | Occasional | | |May | --- | --- | --- | --- | None | --- | Occasional | | |June | --- | --- | --- | --- | None | --- | Occasional | | |July | --- | --- | --- | --- | None | --- | Occasional | | |August | --- | --- | --- | --- | None | --- | Occasional | | |September | --- | --- | --- | --- | None | --- | Occasional | | |October | --- | --- | --- | --- | None | --- | Occasional | | |November | --- | --- | --- | --- | None | --- | Occasional | | |December | --- | --- | --- | --- | None | --- | Occasional | | | | | | | | | |
266S
oil Survey of
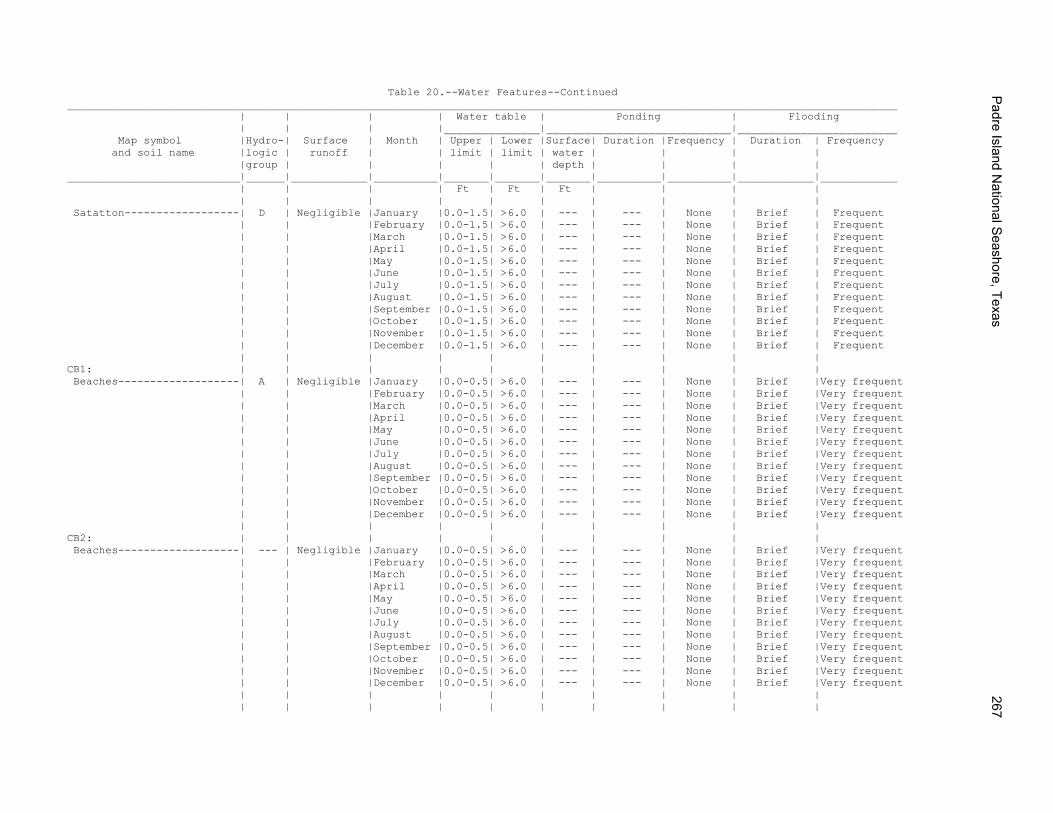
Table 20.--Water Features--Continued __________________________________________________________________________________________________________________________________ | | | | Water table | Ponding | Flooding | | | |_______________|_____________________________|_________________________ Map symbol |Hydro-| Surface | Month | Upper | Lower |Surface| Duration |Frequency | Duration | Frequency and soil name |logic | runoff | | limit | limit | water | | | | |group | | | | | depth | | | | ___________________________|______|____________|__________|_______|_______|_______|__________|__________|____________|____________ | | | | Ft | Ft | Ft | | | | | | | | | | | | | | Satatton------------------| D | Negligible |January |0.0-1.5| >6.0 | --- | --- | None | Brief | Frequent | | |February |0.0-1.5| >6.0 | --- | --- | None | Brief | Frequent | | |March |0.0-1.5| >6.0 | --- | --- | None | Brief | Frequent | | |April |0.0-1.5| >6.0 | --- | --- | None | Brief | Frequent | | |May |0.0-1.5| >6.0 | --- | --- | None | Brief | Frequent | | |June |0.0-1.5| >6.0 | --- | --- | None | Brief | Frequent | | |July |0.0-1.5| >6.0 | --- | --- | None | Brief | Frequent | | |August |0.0-1.5| >6.0 | --- | --- | None | Brief | Frequent | | |September |0.0-1.5| >6.0 | --- | --- | None | Brief | Frequent | | |October |0.0-1.5| >6.0 | --- | --- | None | Brief | Frequent | | |November |0.0-1.5| >6.0 | --- | --- | None | Brief | Frequent | | |December |0.0-1.5| >6.0 | --- | --- | None | Brief | Frequent | | | | | | | | | | CB1: | | | | | | | | | | Beaches-------------------| A | Negligible |January |0.0-0.5| >6.0 | --- | --- | None | Brief |Very frequent | | |February |0.0-0.5| >6.0 | --- | --- | None | Brief |Very frequent | | |March |0.0-0.5| >6.0 | --- | --- | None | Brief |Very frequent | | |April |0.0-0.5| >6.0 | --- | --- | None | Brief |Very frequent | | |May |0.0-0.5| >6.0 | --- | --- | None | Brief |Very frequent | | |June |0.0-0.5| >6.0 | --- | --- | None | Brief |Very frequent | | |July |0.0-0.5| >6.0 | --- | --- | None | Brief |Very frequent | | |August |0.0-0.5| >6.0 | --- | --- | None | Brief |Very frequent | | |September |0.0-0.5| >6.0 | --- | --- | None | Brief |Very frequent | | |October |0.0-0.5| >6.0 | --- | --- | None | Brief |Very frequent | | |November |0.0-0.5| >6.0 | --- | --- | None | Brief |Very frequent | | |December |0.0-0.5| >6.0 | --- | --- | None | Brief |Very frequent | | | | | | | | | | CB2: | | | | | | | | | | Beaches-------------------| --- | Negligible |January |0.0-0.5| >6.0 | --- | --- | None | Brief |Very frequent | | |February |0.0-0.5| >6.0 | --- | --- | None | Brief |Very frequent | | |March |0.0-0.5| >6.0 | --- | --- | None | Brief |Very frequent | | |April |0.0-0.5| >6.0 | --- | --- | None | Brief |Very frequent | | |May |0.0-0.5| >6.0 | --- | --- | None | Brief |Very frequent | | |June |0.0-0.5| >6.0 | --- | --- | None | Brief |Very frequent | | |July |0.0-0.5| >6.0 | --- | --- | None | Brief |Very frequent | | |August |0.0-0.5| >6.0 | --- | --- | None | Brief |Very frequent | | |September |0.0-0.5| >6.0 | --- | --- | None | Brief |Very frequent | | |October |0.0-0.5| >6.0 | --- | --- | None | Brief |Very frequent | | |November |0.0-0.5| >6.0 | --- | --- | None | Brief |Very frequent | | |December |0.0-0.5| >6.0 | --- | --- | None | Brief |Very frequent | | | | | | | | | | | | | | | | | | | |
Padre Island N
ational Seashore, Texas
267
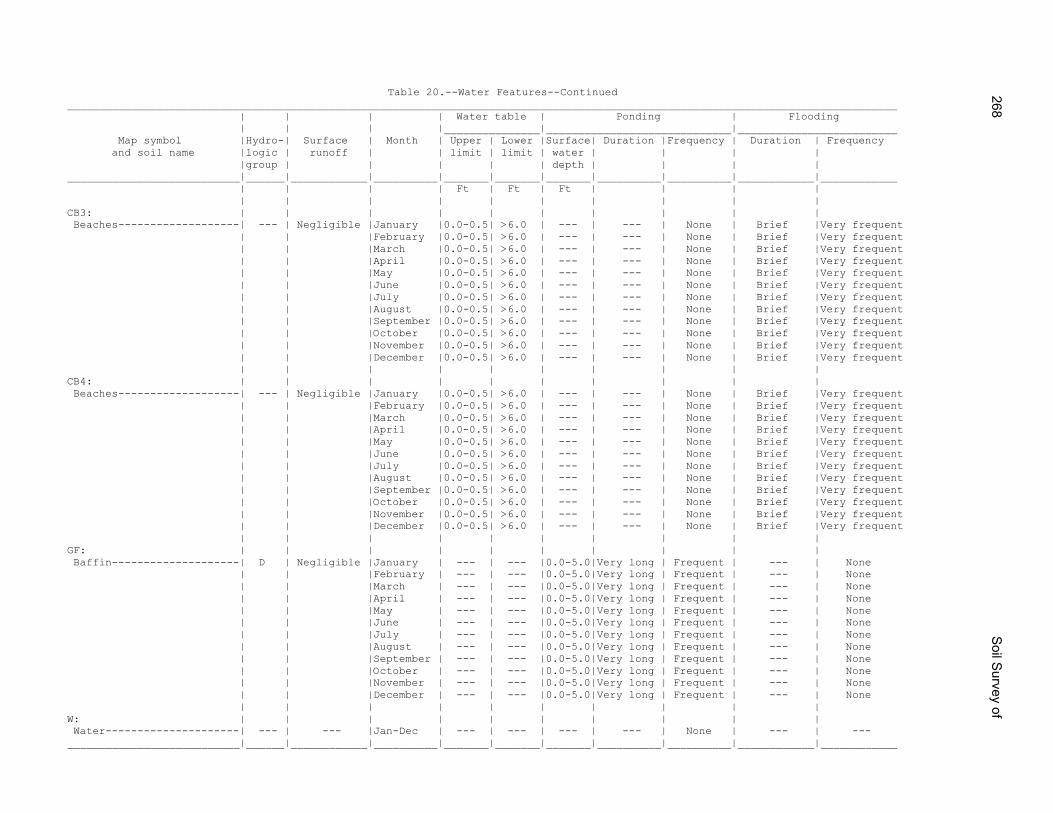
Table 20.--Water Features--Continued __________________________________________________________________________________________________________________________________ | | | | Water table | Ponding | Flooding | | | |_______________|_____________________________|_________________________ Map symbol |Hydro-| Surface | Month | Upper | Lower |Surface| Duration |Frequency | Duration | Frequency and soil name |logic | runoff | | limit | limit | water | | | | |group | | | | | depth | | | | ___________________________|______|____________|__________|_______|_______|_______|__________|__________|____________|____________ | | | | Ft | Ft | Ft | | | | | | | | | | | | | | CB3: | | | | | | | | | | Beaches-------------------| --- | Negligible |January |0.0-0.5| >6.0 | --- | --- | None | Brief |Very frequent | | |February |0.0-0.5| >6.0 | --- | --- | None | Brief |Very frequent | | |March |0.0-0.5| >6.0 | --- | --- | None | Brief |Very frequent | | |April |0.0-0.5| >6.0 | --- | --- | None | Brief |Very frequent | | |May |0.0-0.5| >6.0 | --- | --- | None | Brief |Very frequent | | |June |0.0-0.5| >6.0 | --- | --- | None | Brief |Very frequent | | |July |0.0-0.5| >6.0 | --- | --- | None | Brief |Very frequent | | |August |0.0-0.5| >6.0 | --- | --- | None | Brief |Very frequent | | |September |0.0-0.5| >6.0 | --- | --- | None | Brief |Very frequent | | |October |0.0-0.5| >6.0 | --- | --- | None | Brief |Very frequent | | |November |0.0-0.5| >6.0 | --- | --- | None | Brief |Very frequent | | |December |0.0-0.5| >6.0 | --- | --- | None | Brief |Very frequent | | | | | | | | | | CB4: | | | | | | | | | | Beaches-------------------| --- | Negligible |January |0.0-0.5| >6.0 | --- | --- | None | Brief |Very frequent | | |February |0.0-0.5| >6.0 | --- | --- | None | Brief |Very frequent | | |March |0.0-0.5| >6.0 | --- | --- | None | Brief |Very frequent | | |April |0.0-0.5| >6.0 | --- | --- | None | Brief |Very frequent | | |May |0.0-0.5| >6.0 | --- | --- | None | Brief |Very frequent | | |June |0.0-0.5| >6.0 | --- | --- | None | Brief |Very frequent | | |July |0.0-0.5| >6.0 | --- | --- | None | Brief |Very frequent | | |August |0.0-0.5| >6.0 | --- | --- | None | Brief |Very frequent | | |September |0.0-0.5| >6.0 | --- | --- | None | Brief |Very frequent | | |October |0.0-0.5| >6.0 | --- | --- | None | Brief |Very frequent | | |November |0.0-0.5| >6.0 | --- | --- | None | Brief |Very frequent | | |December |0.0-0.5| >6.0 | --- | --- | None | Brief |Very frequent | | | | | | | | | | GF: | | | | | | | | | | Baffin--------------------| D | Negligible |January | --- | --- |0.0-5.0|Very long | Frequent | --- | None | | |February | --- | --- |0.0-5.0|Very long | Frequent | --- | None | | |March | --- | --- |0.0-5.0|Very long | Frequent | --- | None | | |April | --- | --- |0.0-5.0|Very long | Frequent | --- | None | | |May | --- | --- |0.0-5.0|Very long | Frequent | --- | None | | |June | --- | --- |0.0-5.0|Very long | Frequent | --- | None | | |July | --- | --- |0.0-5.0|Very long | Frequent | --- | None | | |August | --- | --- |0.0-5.0|Very long | Frequent | --- | None | | |September | --- | --- |0.0-5.0|Very long | Frequent | --- | None | | |October | --- | --- |0.0-5.0|Very long | Frequent | --- | None | | |November | --- | --- |0.0-5.0|Very long | Frequent | --- | None | | |December | --- | --- |0.0-5.0|Very long | Frequent | --- | None | | | | | | | | | | W: | | | | | | | | | | Water---------------------| --- | --- |Jan-Dec | --- | --- | --- | --- | None | --- | --- ___________________________|______|____________|__________|_______|_______|_______|__________|__________|____________|____________
268S
oil Survey of
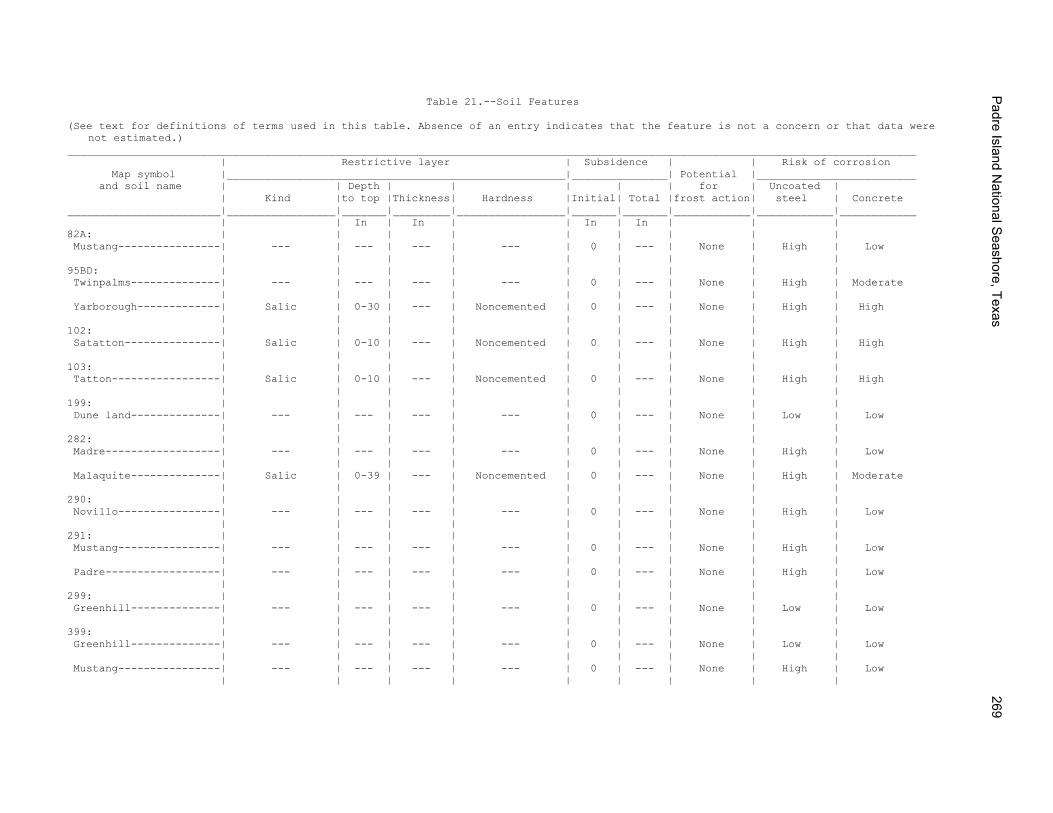
Table 21.--Soil Features (See text for definitions of terms used in this table. Absence of an entry indicates that the feature is not a concern or that data were
not estimated.) _____________________________________________________________________________________________________________________________________ | Restrictive layer | Subsidence | | Risk of corrosion Map symbol |_____________________________________________________|_______________| Potential |_________________________ and soil name | | Depth | | | | | for | Uncoated | | Kind |to top |Thickness| Hardness |Initial| Total |frost action| steel | Concrete ________________________|_________________|_______|_________|_________________|_______|_______|____________|____________|____________ | | In | In | | In | In | | | 82A: | | | | | | | | | Mustang----------------| --- | --- | --- | --- | 0 | --- | None | High | Low | | | | | | | | | 95BD: | | | | | | | | | Twinpalms--------------| --- | --- | --- | --- | 0 | --- | None | High | Moderate | | | | | | | | | Yarborough-------------| Salic | 0-30 | --- | Noncemented | 0 | --- | None | High | High | | | | | | | | | 102: | | | | | | | | | Satatton---------------| Salic | 0-10 | --- | Noncemented | 0 | --- | None | High | High | | | | | | | | | 103: | | | | | | | | | Tatton-----------------| Salic | 0-10 | --- | Noncemented | 0 | --- | None | High | High | | | | | | | | | 199: | | | | | | | | | Dune land--------------| --- | --- | --- | --- | 0 | --- | None | Low | Low | | | | | | | | | 282: | | | | | | | | | Madre------------------| --- | --- | --- | --- | 0 | --- | None | High | Low | | | | | | | | | Malaquite--------------| Salic | 0-39 | --- | Noncemented | 0 | --- | None | High | Moderate | | | | | | | | | 290: | | | | | | | | | Novillo----------------| --- | --- | --- | --- | 0 | --- | None | High | Low | | | | | | | | | 291: | | | | | | | | | Mustang----------------| --- | --- | --- | --- | 0 | --- | None | High | Low | | | | | | | | | Padre------------------| --- | --- | --- | --- | 0 | --- | None | High | Low | | | | | | | | | 299: | | | | | | | | | Greenhill--------------| --- | --- | --- | --- | 0 | --- | None | Low | Low | | | | | | | | | 399: | | | | | | | | | Greenhill--------------| --- | --- | --- | --- | 0 | --- | None | Low | Low | | | | | | | | | Mustang----------------| --- | --- | --- | --- | 0 | --- | None | High | Low | | | | | | | | |
Padre Island N
ational Seashore, Texas
269
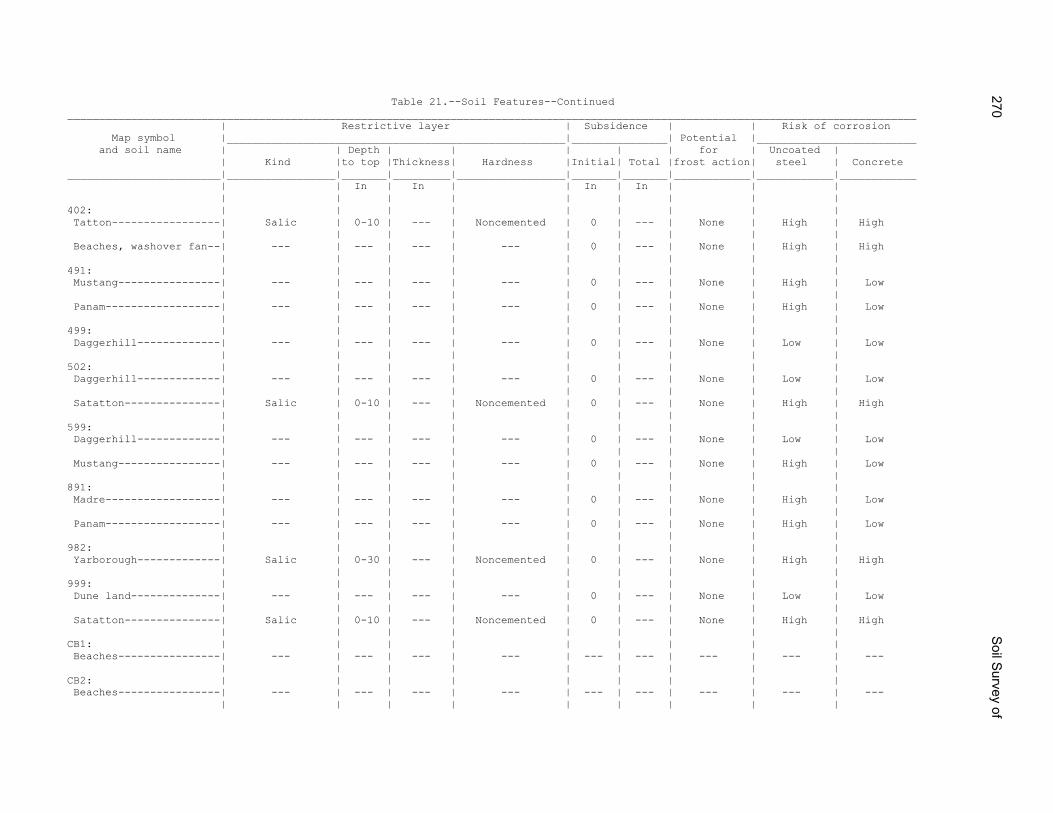
Table 21.--Soil Features--Continued _____________________________________________________________________________________________________________________________________ | Restrictive layer | Subsidence | | Risk of corrosion Map symbol |_____________________________________________________|_______________| Potential |_________________________ and soil name | | Depth | | | | | for | Uncoated | | Kind |to top |Thickness| Hardness |Initial| Total |frost action| steel | Concrete ________________________|_________________|_______|_________|_________________|_______|_______|____________|____________|____________ | | In | In | | In | In | | | | | | | | | | | | 402: | | | | | | | | | Tatton-----------------| Salic | 0-10 | --- | Noncemented | 0 | --- | None | High | High | | | | | | | | | Beaches, washover fan--| --- | --- | --- | --- | 0 | --- | None | High | High | | | | | | | | | 491: | | | | | | | | | Mustang----------------| --- | --- | --- | --- | 0 | --- | None | High | Low | | | | | | | | | Panam------------------| --- | --- | --- | --- | 0 | --- | None | High | Low | | | | | | | | | 499: | | | | | | | | | Daggerhill-------------| --- | --- | --- | --- | 0 | --- | None | Low | Low | | | | | | | | | 502: | | | | | | | | | Daggerhill-------------| --- | --- | --- | --- | 0 | --- | None | Low | Low | | | | | | | | | Satatton---------------| Salic | 0-10 | --- | Noncemented | 0 | --- | None | High | High | | | | | | | | | 599: | | | | | | | | | Daggerhill-------------| --- | --- | --- | --- | 0 | --- | None | Low | Low | | | | | | | | | Mustang----------------| --- | --- | --- | --- | 0 | --- | None | High | Low | | | | | | | | | 891: | | | | | | | | | Madre------------------| --- | --- | --- | --- | 0 | --- | None | High | Low | | | | | | | | | Panam------------------| --- | --- | --- | --- | 0 | --- | None | High | Low | | | | | | | | | 982: | | | | | | | | | Yarborough-------------| Salic | 0-30 | --- | Noncemented | 0 | --- | None | High | High | | | | | | | | | 999: | | | | | | | | | Dune land--------------| --- | --- | --- | --- | 0 | --- | None | Low | Low | | | | | | | | | Satatton---------------| Salic | 0-10 | --- | Noncemented | 0 | --- | None | High | High | | | | | | | | | CB1: | | | | | | | | | Beaches----------------| --- | --- | --- | --- | --- | --- | --- | --- | --- | | | | | | | | | CB2: | | | | | | | | | Beaches----------------| --- | --- | --- | --- | --- | --- | --- | --- | --- | | | | | | | | |
270S
oil Survey of
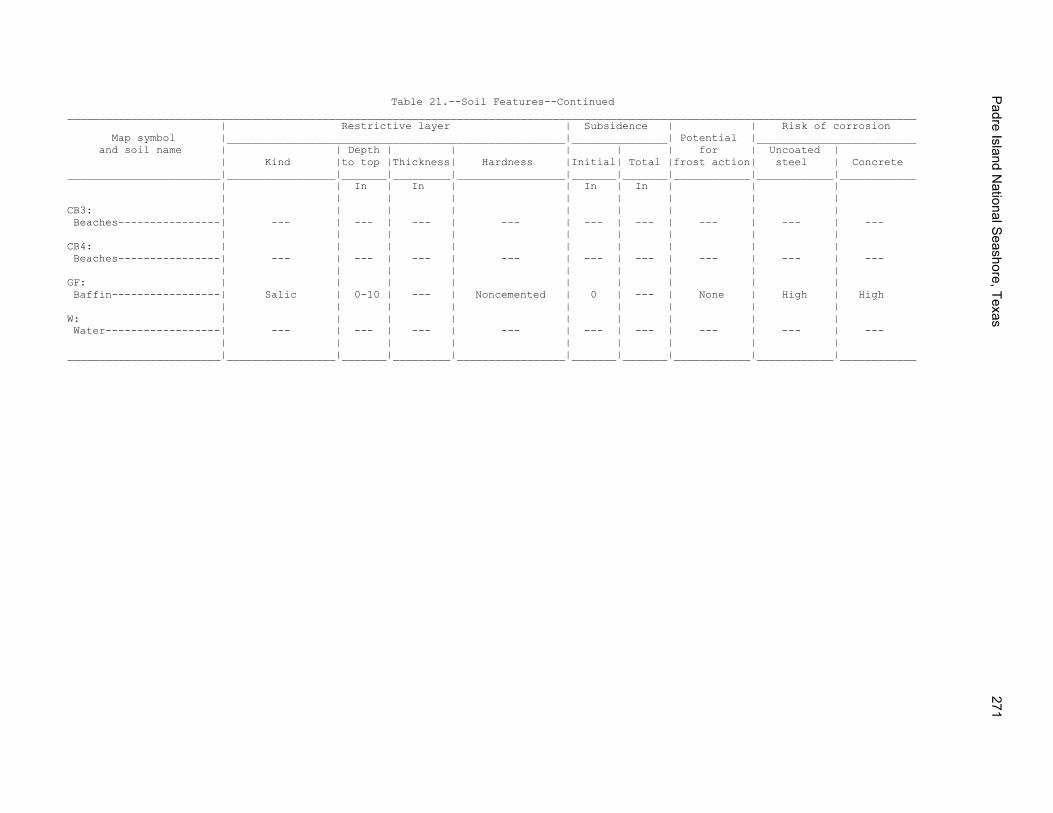
Table 21.--Soil Features--Continued _____________________________________________________________________________________________________________________________________ | Restrictive layer | Subsidence | | Risk of corrosion Map symbol |_____________________________________________________|_______________| Potential |_________________________ and soil name | | Depth | | | | | for | Uncoated | | Kind |to top |Thickness| Hardness |Initial| Total |frost action| steel | Concrete ________________________|_________________|_______|_________|_________________|_______|_______|____________|____________|____________ | | In | In | | In | In | | | | | | | | | | | | CB3: | | | | | | | | | Beaches----------------| --- | --- | --- | --- | --- | --- | --- | --- | --- | | | | | | | | | CB4: | | | | | | | | | Beaches----------------| --- | --- | --- | --- | --- | --- | --- | --- | --- | | | | | | | | | GF: | | | | | | | | | Baffin-----------------| Salic | 0-10 | --- | Noncemented | 0 | --- | None | High | High | | | | | | | | | W: | | | | | | | | | Water------------------| --- | --- | --- | --- | --- | --- | --- | --- | --- | | | | | | | | | ________________________|_________________|_______|_________|_________________|_______|_______|____________|____________|____________
Padre Island N
ational Seashore, Texas
271
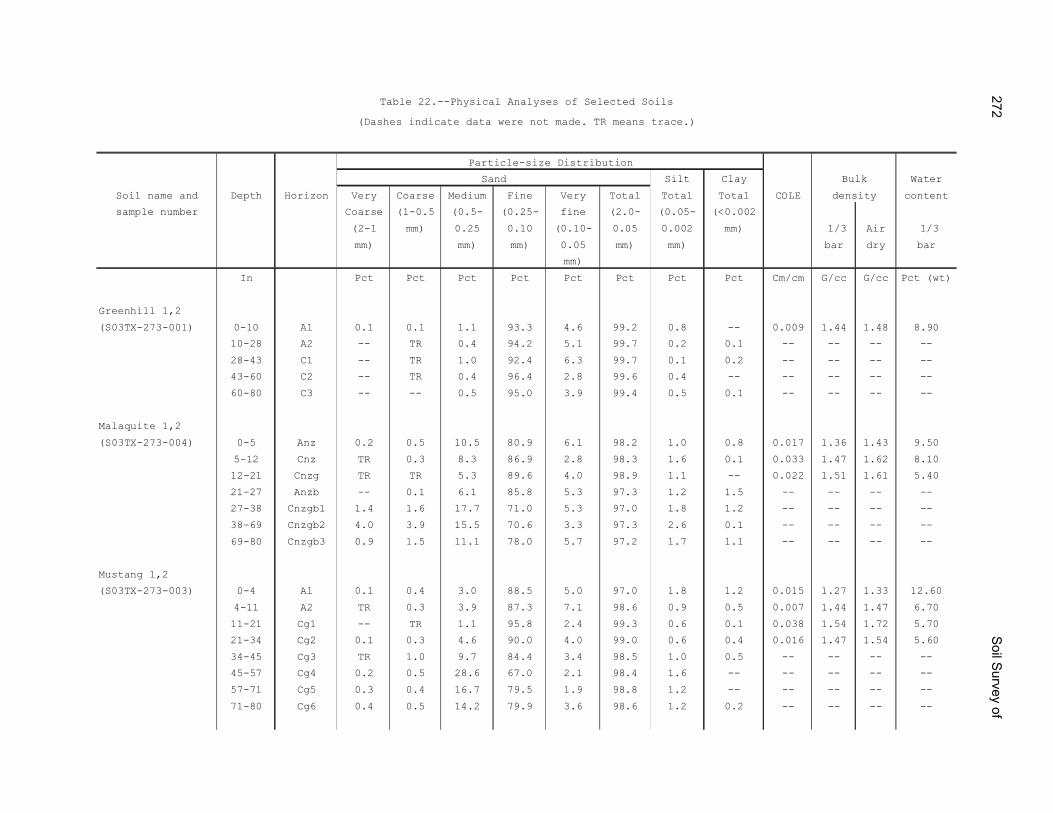
Table 22.--Physical Analyses of Selected Soils
(Dashes indicate data were not made. TR means trace.)
Silt Clay Water
Soil name and Depth Horizon Very Coarse Medium Fine Very Total Total Total COLE content
sample number Coarse (1-0.5 (0.5- (0.25- fine (2.0- (0.05- (<0.002
(2-1 mm) 0.25 0.10 (0.10- 0.05 0.002 mm) 1/3 Air 1/3
mm) mm) mm) 0.05 mm) mm) bar dry bar
mm)
In Pct Pct Pct Pct Pct Pct Pct Pct Cm/cm G/cc G/cc Pct (wt)
Greenhill 1,2
(S03TX-273-001) 0-10 A1 0.1 0.1 1.1 93.3 4.6 99.2 0.8 -- 0.009 1.44 1.48 8.90
10-28 A2 -- TR 0.4 94.2 5.1 99.7 0.2 0.1 -- -- -- --
28-43 C1 -- TR 1.0 92.4 6.3 99.7 0.1 0.2 -- -- -- --
43-60 C2 -- TR 0.4 96.4 2.8 99.6 0.4 -- -- -- -- --
60-80 C3 -- -- 0.5 95.0 3.9 99.4 0.5 0.1 -- -- -- --
Malaquite 1,2
(S03TX-273-004) 0-5 Anz 0.2 0.5 10.5 80.9 6.1 98.2 1.0 0.8 0.017 1.36 1.43 9.50
5-12 Cnz TR 0.3 8.3 86.9 2.8 98.3 1.6 0.1 0.033 1.47 1.62 8.10
12-21 Cnzg TR TR 5.3 89.6 4.0 98.9 1.1 -- 0.022 1.51 1.61 5.40
21-27 Anzb -- 0.1 6.1 85.8 5.3 97.3 1.2 1.5 -- -- -- --
27-38 Cnzgb1 1.4 1.6 17.7 71.0 5.3 97.0 1.8 1.2 -- -- -- --
38-69 Cnzgb2 4.0 3.9 15.5 70.6 3.3 97.3 2.6 0.1 -- -- -- --
69-80 Cnzgb3 0.9 1.5 11.1 78.0 5.7 97.2 1.7 1.1 -- -- -- --
Mustang 1,2
(S03TX-273-003) 0-4 A1 0.1 0.4 3.0 88.5 5.0 97.0 1.8 1.2 0.015 1.27 1.33 12.60
4-11 A2 TR 0.3 3.9 87.3 7.1 98.6 0.9 0.5 0.007 1.44 1.47 6.70
11-21 Cg1 -- TR 1.1 95.8 2.4 99.3 0.6 0.1 0.038 1.54 1.72 5.70
21-34 Cg2 0.1 0.3 4.6 90.0 4.0 99.0 0.6 0.4 0.016 1.47 1.54 5.60
34-45 Cg3 TR 1.0 9.7 84.4 3.4 98.5 1.0 0.5 -- -- -- --
45-57 Cg4 0.2 0.5 28.6 67.0 2.1 98.4 1.6 -- -- -- -- --
57-71 Cg5 0.3 0.4 16.7 79.5 1.9 98.8 1.2 -- -- -- -- --
71-80 Cg6 0.4 0.5 14.2 79.9 3.6 98.6 1.2 0.2 -- -- -- --
Sand Bulk
Particle-size Distribution
density
272S
oil Survey of
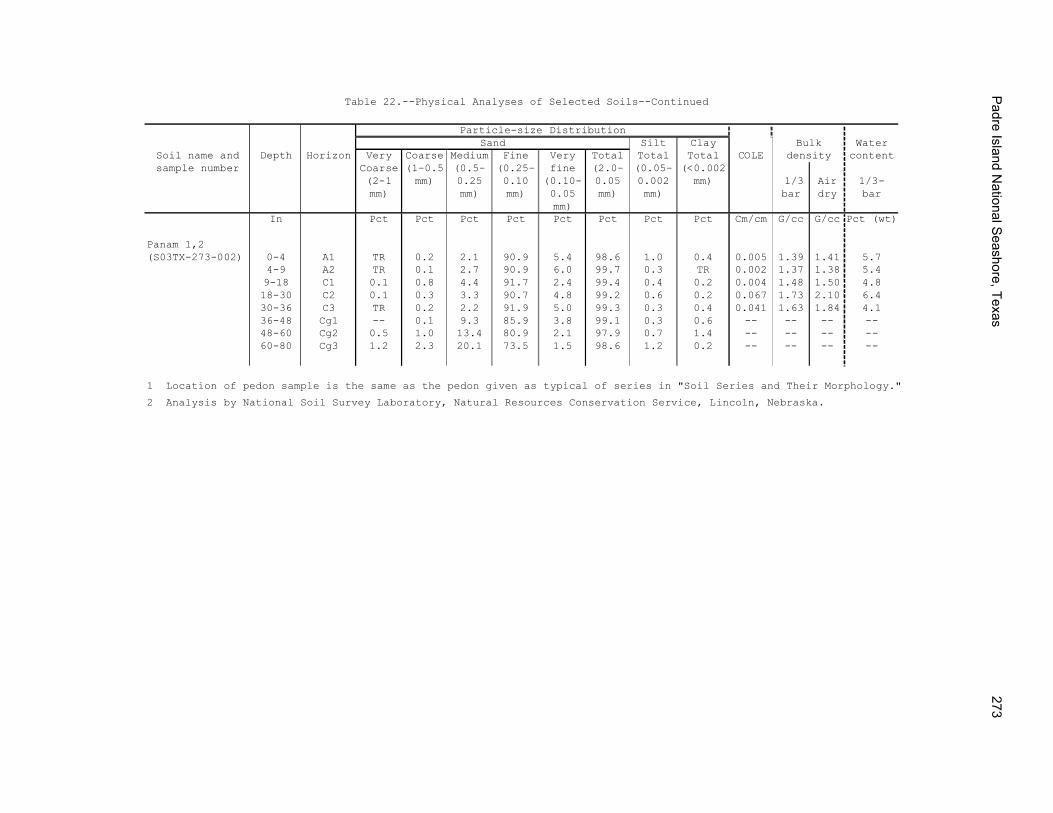
Table 22.--Physical Analyses of Selected Soils--Continued
Silt Clay WaterSoil name and Depth Horizon Very Coarse Medium Fine Very Total Total Total COLE contentsample number Coarse (1-0.5 (0.5- (0.25- fine (2.0- (0.05- (<0.002
(2-1 mm) 0.25 0.10 (0.10- 0.05 0.002 mm) 1/3 Air 1/3-mm) mm) mm) 0.05 mm) mm) bar dry bar
mm)In Pct Pct Pct Pct Pct Pct Pct Pct Cm/cm G/cc G/cc Pct (wt)
Panam 1,2(S03TX-273-002) 0-4 A1 TR 0.2 2.1 90.9 5.4 98.6 1.0 0.4 0.005 1.39 1.41 5.7
4-9 A2 TR 0.1 2.7 90.9 6.0 99.7 0.3 TR 0.002 1.37 1.38 5.49-18 C1 0.1 0.8 4.4 91.7 2.4 99.4 0.4 0.2 0.004 1.48 1.50 4.818-30 C2 0.1 0.3 3.3 90.7 4.8 99.2 0.6 0.2 0.067 1.73 2.10 6.430-36 C3 TR 0.2 2.2 91.9 5.0 99.3 0.3 0.4 0.041 1.63 1.84 4.136-48 Cg1 -- 0.1 9.3 85.9 3.8 99.1 0.3 0.6 -- -- -- --48-60 Cg2 0.5 1.0 13.4 80.9 2.1 97.9 0.7 1.4 -- -- -- --60-80 Cg3 1.2 2.3 20.1 73.5 1.5 98.6 1.2 0.2 -- -- -- --
1 Location of pedon sample is the same as the pedon given as typical of series in "Soil Series and Their Morphology."
2 Analysis by National Soil Survey Laboratory, Natural Resources Conservation Service, Lincoln, Nebraska.
density
Particle-size DistributionSand Bulk
Padre Island N
ational Seashore, Texas
273
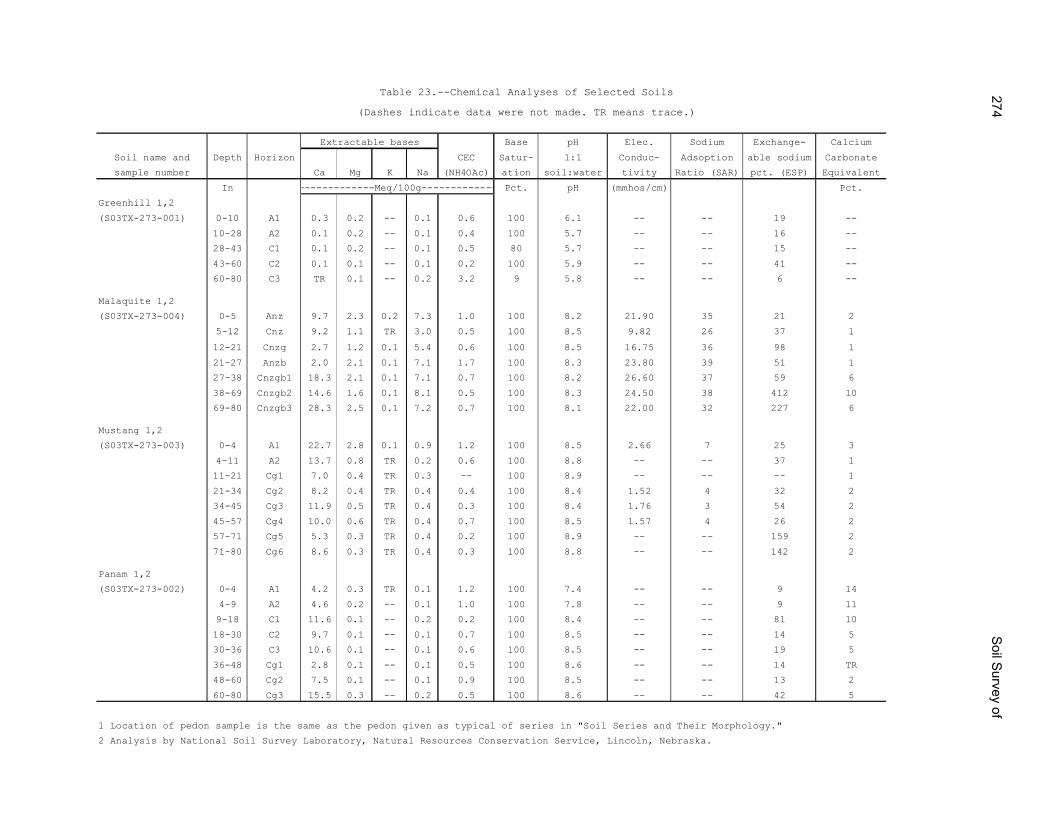
Table 23.--Chemical Analyses of Selected Soils
(Dashes indicate data were not made. TR means trace.)
Base pH Elec. Sodium Exchange- Calcium
Soil name and Depth Horizon CEC Satur- 1:1 Conduc- Adsoption able sodium Carbonate
sample number Ca Mg K Na (NH4OAc) ation soil:water tivity Ratio (SAR) pct. (ESP) Equivalent
In Pct. pH (mmhos/cm) Pct.
Greenhill 1,2
(S03TX-273-001) 0-10 A1 0.3 0.2 -- 0.1 0.6 100 6.1 -- -- 19 --
10-28 A2 0.1 0.2 -- 0.1 0.4 100 5.7 -- -- 16 --
28-43 C1 0.1 0.2 -- 0.1 0.5 80 5.7 -- -- 15 --
43-60 C2 0.1 0.1 -- 0.1 0.2 100 5.9 -- -- 41 --
60-80 C3 TR 0.1 -- 0.2 3.2 9 5.8 -- -- 6 --
Malaquite 1,2
(S03TX-273-004) 0-5 Anz 9.7 2.3 0.2 7.3 1.0 100 8.2 21.90 35 21 2
5-12 Cnz 9.2 1.1 TR 3.0 0.5 100 8.5 9.82 26 37 1
12-21 Cnzg 2.7 1.2 0.1 5.4 0.6 100 8.5 16.75 36 98 1
21-27 Anzb 2.0 2.1 0.1 7.1 1.7 100 8.3 23.80 39 51 1
27-38 Cnzgb1 18.3 2.1 0.1 7.1 0.7 100 8.2 26.60 37 59 6
38-69 Cnzgb2 14.6 1.6 0.1 8.1 0.5 100 8.3 24.50 38 412 10
69-80 Cnzgb3 28.3 2.5 0.1 7.2 0.7 100 8.1 22.00 32 227 6
Mustang 1,2
(S03TX-273-003) 0-4 A1 22.7 2.8 0.1 0.9 1.2 100 8.5 2.66 7 25 3
4-11 A2 13.7 0.8 TR 0.2 0.6 100 8.8 -- -- 37 1
11-21 Cg1 7.0 0.4 TR 0.3 -- 100 8.9 -- -- -- 1
21-34 Cg2 8.2 0.4 TR 0.4 0.4 100 8.4 1.52 4 32 2
34-45 Cg3 11.9 0.5 TR 0.4 0.3 100 8.4 1.76 3 54 2
45-57 Cg4 10.0 0.6 TR 0.4 0.7 100 8.5 1.57 4 26 2
57-71 Cg5 5.3 0.3 TR 0.4 0.2 100 8.9 -- -- 159 2
71-80 Cg6 8.6 0.3 TR 0.4 0.3 100 8.8 -- -- 142 2
Panam 1,2
(S03TX-273-002) 0-4 A1 4.2 0.3 TR 0.1 1.2 100 7.4 -- -- 9 14
4-9 A2 4.6 0.2 -- 0.1 1.0 100 7.8 -- -- 9 11
9-18 C1 11.6 0.1 -- 0.2 0.2 100 8.4 -- -- 81 10
18-30 C2 9.7 0.1 -- 0.1 0.7 100 8.5 -- -- 14 5
30-36 C3 10.6 0.1 -- 0.1 0.6 100 8.5 -- -- 19 5
36-48 Cg1 2.8 0.1 -- 0.1 0.5 100 8.6 -- -- 14 TR
48-60 Cg2 7.5 0.1 -- 0.1 0.9 100 8.5 -- -- 13 2
60-80 Cg3 15.5 0.3 -- 0.2 0.5 100 8.6 -- -- 42 5
1 Location of pedon sample is the same as the pedon given as typical of series in "Soil Series and Their Morphology."
2 Analysis by National Soil Survey Laboratory, Natural Resources Conservation Service, Lincoln, Nebraska.
-------------Meq/100g-------------
Extractable bases
274S
oil Survey of
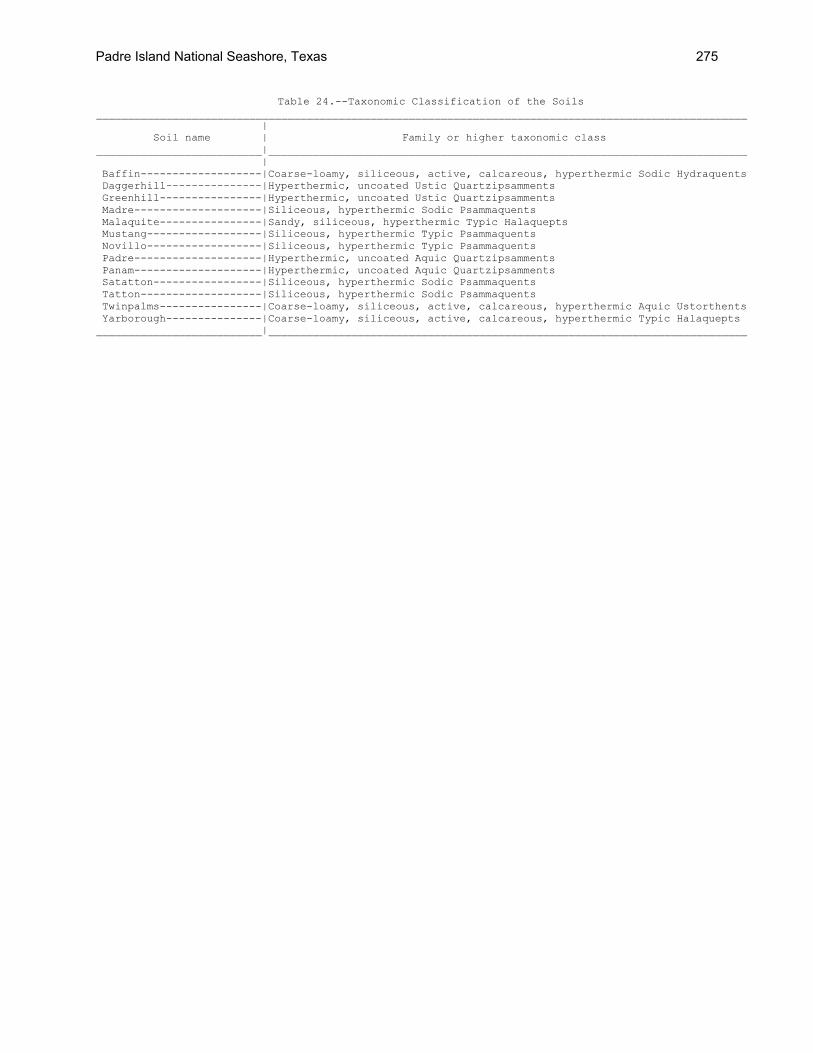
Table 24.--Taxonomic Classification of the Soils ______________________________________________________________________________________________________ | Soil name | Family or higher taxonomic class __________________________|___________________________________________________________________________ | Baffin-------------------|Coarse-loamy, siliceous, active, calcareous, hyperthermic Sodic Hydraquents Daggerhill---------------|Hyperthermic, uncoated Ustic Quartzipsamments Greenhill----------------|Hyperthermic, uncoated Ustic Quartzipsamments Madre--------------------|Siliceous, hyperthermic Sodic Psammaquents Malaquite----------------|Sandy, siliceous, hyperthermic Typic Halaquepts Mustang------------------|Siliceous, hyperthermic Typic Psammaquents Novillo------------------|Siliceous, hyperthermic Typic Psammaquents Padre--------------------|Hyperthermic, uncoated Aquic Quartzipsamments Panam--------------------|Hyperthermic, uncoated Aquic Quartzipsamments Satatton-----------------|Siliceous, hyperthermic Sodic Psammaquents Tatton-------------------|Siliceous, hyperthermic Sodic Psammaquents Twinpalms----------------|Coarse-loamy, siliceous, active, calcareous, hyperthermic Aquic Ustorthents Yarborough---------------|Coarse-loamy, siliceous, active, calcareous, hyperthermic Typic Halaquepts __________________________|___________________________________________________________________________
Padre Island National Seashore, Texas 275


The Natural Resources Conservation Service (NRCS) is committed to making itsinformation accessible to all of its customers and employees. If you are experiencingaccessibility issues and need assistance, please contact our Helpdesk by phone at1-800-457-3642 or by e-mail at [email protected]. For assistance withpublications that include maps, graphs, or similar forms of information, you may alsowish to contact our State or local office. You can locate the correct office and phonenumber at http://offices.sc.egov.usda.gov/locator/app.
NRCS Accessibility Statement