Embed Size (px)
Citation preview
Manufacturing Service Quality: An Internal Customer Perspective
Gyan Prakash ABV-Indian Institute of Information Technology and Management Gwalior,
Gwalior, India e-mail:[email protected]
Abstract- We conceptualize the role of service quality in manufacturing organizations, present a model that proposes and validates that internal and external service quality initiatives lead to loyalty and satisfaction of employees, which in turn are determinants of organization’s competitive advantage and performance. This study would be of interest to manufacturing industry practitioners interested in internal and external service quality improvements.
Keywords- Service Quality, Manufacturing, Internal Customers
I. INTRODUCTION Conventionally employee performance has been viewed
in terms of productivity improvement rather than understanding the specific needs of employees and serving them. Focal organizations (i.e. manufactures) are beginning to recognize the value of “viewing the next operation as customer”, as a competitive weapon to improve intra-organizational as well as interorganizational service [1]. It has been argued that a high level of internal service quality leads to employee satisfaction and results in higher level of performance, lower waste, lower costs, thereby resulting in improved external service quality [2, 3, 4]. Enhanced level of internal and external service quality include overall organizational quality and competitive performance [1]. This underlines the importance of a customer-driven system that matches internal service with users’ needs [5].
II. METHODOLOGY
A. Survey Design It emerges from the review of literature that service
quality is not universally applied - it is context specific [6, 7].The various dimensions along with their literature sources which are used for measurement of service quality are depicted in Appendix I. We collected data using snowball approach from three automobile companies in North India (Maruti Suzuki India Limited, Gurgaon; Hero Honda India Limited, Gurgaon; and Tata Motors, Lucknow). 80% respondents had engineering, 14% had management while 6% had both engineering and management qualifications. Around 10 % had less than five years of work experience, 60 % had between 5-10 years of work experience and remaining had more than 10 years of work experience. We approached 250 internal employees and were able to elicit data from 160 of them, thereby achieving a response rate of 64% which was quite encouraging. A total of 148 questionnaires were found
to be complete and were used for further analysis. We have used SPSS v13 and LISREL v8.7 for data analysis.
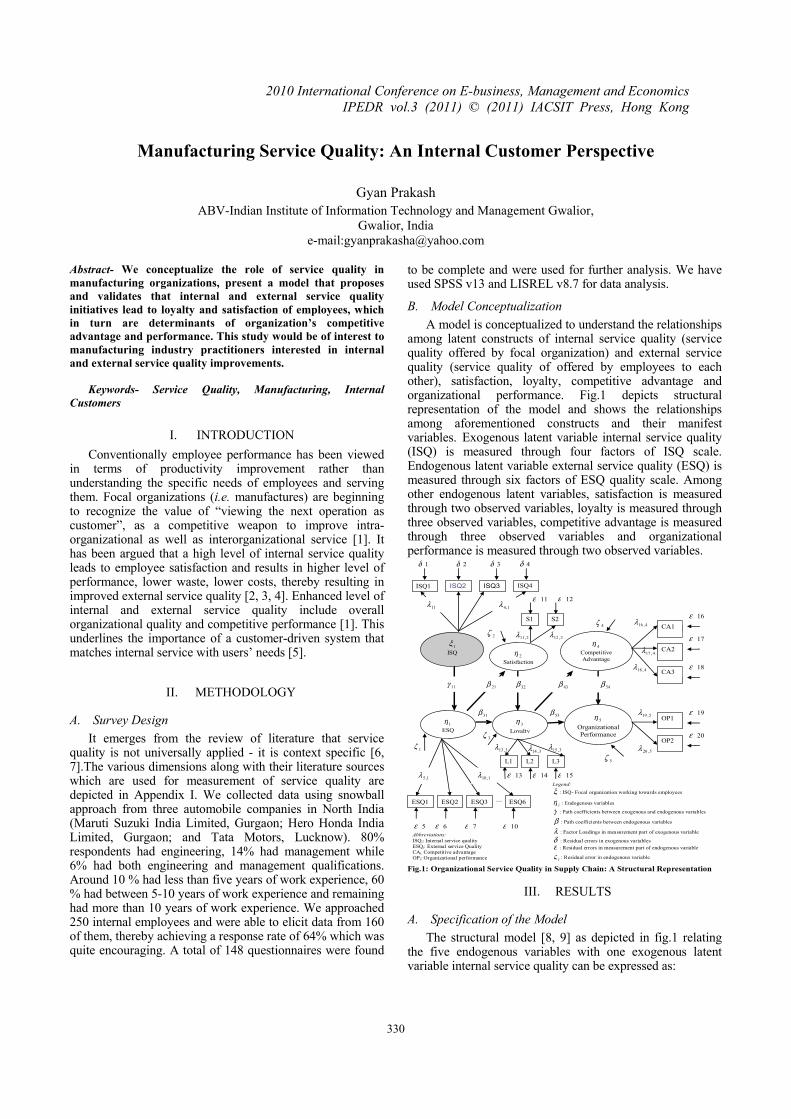
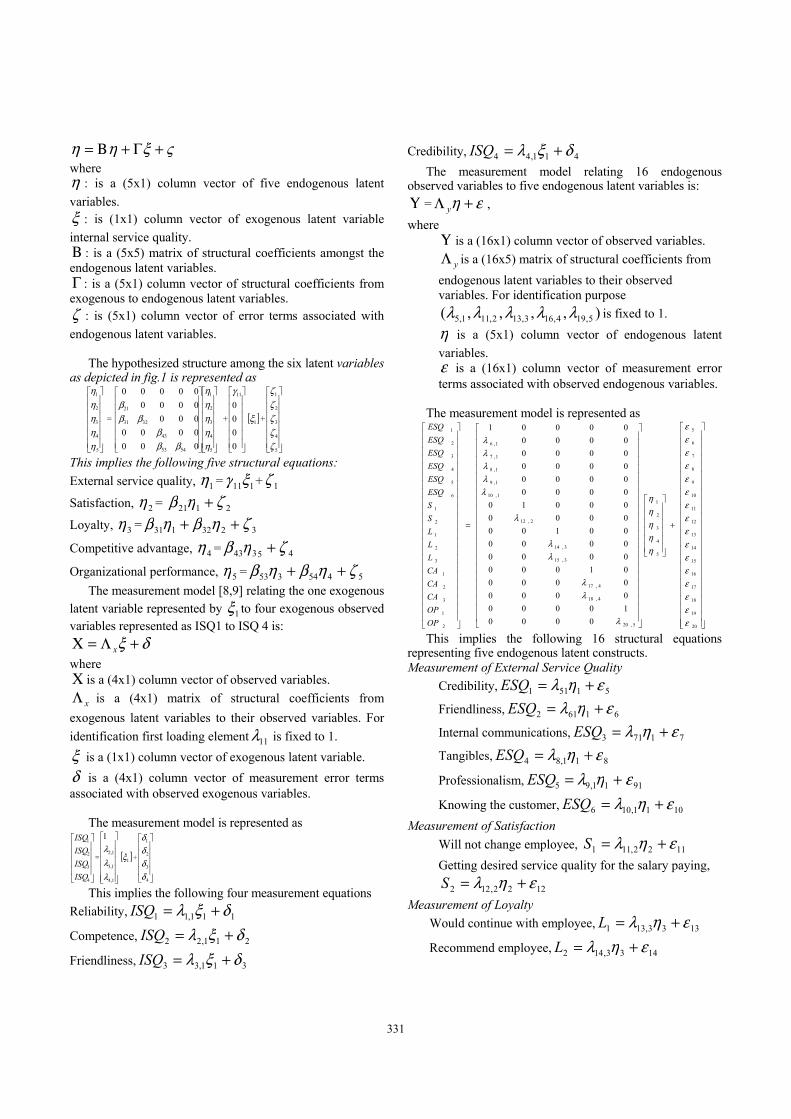
B. Model Conceptualization A model is conceptualized to understand the relationships
among latent constructs of internal service quality (service quality offered by focal organization) and external service quality (service quality of offered by employees to each other), satisfaction, loyalty, competitive advantage and organizational performance. Fig.1 depicts structural representation of the model and shows the relationships among aforementioned constructs and their manifest variables. Exogenous latent variable internal service quality (ISQ) is measured through four factors of ISQ scale. Endogenous latent variable external service quality (ESQ) is measured through six factors of ESQ quality scale. Among other endogenous latent variables, satisfaction is measured through two observed variables, loyalty is measured through three observed variables, competitive advantage is measured through three observed variables and organizational performance is measured through two observed variables.
Fig.1: Organizational Service Quality in Supply Chain: A Structural Representation
31β
…
ISQ1 ISQ2 ISQ3
ESQ1 ESQ2 ESQ3 ESQ6
CA1
CA3
S2
1η ESQ
1ξ ISQ
δ 1
ε 13 ε 14 ε 15
ε 11 ε 12
ε 16
ε 17
ε 18
ε 19
ε 20
δ 2 δ 3 δ 4
ISQ4
ε 10 ε 7 ε 6 ε 5
11γ 21β 32β 43β 54β
53β 5η
Organizational Performance
Legend: ξ : ISQ- Focal organization working towards employees
iη : Endogenous variables
γ : Path coefficients between exogenous and endogenous variables
β : Path coefficients between endogenous variables
λ : Factor Loadings in measurement part of exogenous variable
δ : Residual errors in exogenous variables ε : Residual errors in measurement part of endogenous variable
iς : Residual error in endogenous variable
4ζ 2ζ
5ζ 1ζ
3ζ
11λ 1,4λ
1,5λ 1,10λ
5,20λ
5,19λ
4,18λ
4,16λ
OP1
4,17λ
2,12λ 2,11λ
S1
2η Satisfaction
4η Competitive Advantage
CA2
OP2
3η Loyalty
3,14λ 3,15λ 3,13λ
L3 L2 L1
Abbreviations: ISQi: Internal service quality ESQi: External service Quality CAi: Competitive advantage OPi: Organizational performance
III. RESULTS
A. Specification of the Model The structural model [8, 9] as depicted in fig.1 relating
the five endogenous variables with one exogenous latent variable internal service quality can be expressed as:
330
2010 International Conference on E-business, Management and Economics IPEDR vol.3 (2011) © (2011) IACSIT Press, Hong Kong
ςξηη +Γ+Β= where η : is a (5x1) column vector of five endogenous latent variables. ξ : is (1x1) column vector of exogenous latent variable internal service quality. Β : is a (5x5) matrix of structural coefficients amongst the endogenous latent variables. Γ : is a (5x1) column vector of structural coefficients from exogenous to endogenous latent variables. ζ : is (5x1) column vector of error terms associated with endogenous latent variables.
The hypothesized structure among the six latent variables as depicted in fig.1 is represented as
⎥⎥⎥⎥⎥⎥
⎦
⎤
⎢⎢⎢⎢⎢⎢
⎣
⎡
5
4
3
2
1
ηηηηη
=
⎥⎥⎥⎥⎥⎥
⎦
⎤
⎢⎢⎢⎢⎢⎢
⎣
⎡
⎥⎥⎥⎥⎥⎥
⎦
⎤
⎢⎢⎢⎢⎢⎢
⎣
⎡
5
4
3
2
1
5453
43
3231
21
0000000000000000000
ηηηηη
βββ
βββ
+
⎥⎥⎥⎥⎥⎥
⎦
⎤
⎢⎢⎢⎢⎢⎢
⎣
⎡
0000
11γ
[ ]1ξ +
⎥⎥⎥⎥⎥⎥
⎦
⎤
⎢⎢⎢⎢⎢⎢
⎣
⎡
5
4
3
2
1
ζζζζζ
This implies the following five structural equations: External service quality, 1η = 111ξγ + 1ζ
Satisfaction, 2η = 2121 ζηβ +
Loyalty, 3η = 3232131 ζηβηβ ++
Competitive advantage, 4η = 45343 ζηβ +
Organizational performance, 5η = 5454353 ζηβηβ ++ The measurement model [8,9] relating the one exogenous
latent variable represented by 1ξ to four exogenous observed variables represented as ISQ1 to ISQ 4 is:
δξ +Λ=Χ x where Χ is a (4x1) column vector of observed variables.
xΛ is a (4x1) matrix of structural coefficients from exogenous latent variables to their observed variables. For identification first loading element 11λ is fixed to 1. ξ is a (1x1) column vector of exogenous latent variable. δ is a (4x1) column vector of measurement error terms associated with observed exogenous variables.
The measurement model is represented as
⎥⎥⎥⎥
⎦
⎤
⎢⎢⎢⎢
⎣
⎡
4
3
2
1
ISQISQISQISQ
=
⎥⎥⎥⎥⎥
⎦
⎤
⎢⎢⎢⎢⎢
⎣
⎡
1,4
1,3
1,2
1
λλλ
[ ]1ξ +
⎥⎥⎥⎥
⎦
⎤
⎢⎢⎢⎢
⎣
⎡
4
3
2
1
δδδδ
This implies the following four measurement equations
Reliability, 111,11 δξλ +=ISQ
Competence, 211,22 δξλ +=ISQ
Friendliness, 311,33 δξλ +=ISQ
Credibility, 411,44 δξλ +=ISQ The measurement model relating 16 endogenous
observed variables to five endogenous latent variables is: Υ = εη +Λ y , where
Υ is a (16x1) column vector of observed variables.
yΛ is a (16x5) matrix of structural coefficients from endogenous latent variables to their observed variables. For identification purpose
),,,,( 5,194,163,132,111,5 λλλλλ is fixed to 1. η is a (5x1) column vector of endogenous latent variables. ε is a (16x1) column vector of measurement error terms associated with observed endogenous variables.
The measurement model is represented as
⎥⎥⎥⎥⎥⎥⎥⎥⎥⎥⎥⎥⎥⎥⎥⎥⎥⎥⎥⎥⎥⎥⎥⎥
⎦
⎤
⎢⎢⎢⎢⎢⎢⎢⎢⎢⎢⎢⎢⎢⎢⎢⎢⎢⎢⎢⎢⎢⎢⎢⎢
⎣
⎡
+
⎥⎥⎥⎥⎥⎥
⎦
⎤
⎢⎢⎢⎢⎢⎢
⎣
⎡
⎥⎥⎥⎥⎥⎥⎥⎥⎥⎥⎥⎥⎥⎥⎥⎥⎥⎥⎥⎥⎥⎥⎥
⎦
⎤
⎢⎢⎢⎢⎢⎢⎢⎢⎢⎢⎢⎢⎢⎢⎢⎢⎢⎢⎢⎢⎢⎢⎢
⎣
⎡
=
⎥⎥⎥⎥⎥⎥⎥⎥⎥⎥⎥⎥⎥⎥⎥⎥⎥⎥⎥⎥⎥⎥⎥
⎦
⎤
⎢⎢⎢⎢⎢⎢⎢⎢⎢⎢⎢⎢⎢⎢⎢⎢⎢⎢⎢⎢⎢⎢⎢
⎣
⎡
20
19
18
17
16
15
14
13
12
11
10
9
8
7
6
5
5
4
3
2
1
5,20
4,18
4,17
3,15
3,14
2,12
1,10
1,9
1,8
1,7
1,6
2
1
3
2
1
3
2
1
2
1
6
5
4
3
2
1
000010000000000000100000000000001000000000100000000000000000000000001
εεεεεεεεεεεεεεεε
ηηηηη
λ
λλ
λλ
λ
λλλλλ
OPOPCACACALLLSSESQESQESQESQESQESQ
This implies the following 16 structural equations
representing five endogenous latent constructs. Measurement of External Service Quality
Credibility, 51511 εηλ +=ESQ
Friendliness, 61612 εηλ +=ESQ
Internal communications, 71713 εηλ +=ESQ
Tangibles, 811,84 εηλ +=ESQ
Professionalism, 9111,95 εηλ +=ESQ
Knowing the customer, 1011,106 εηλ +=ESQ Measurement of Satisfaction
Will not change employee, 1122,111 εηλ +=S Getting desired service quality for the salary paying,
1222,122 εηλ +=S Measurement of Loyalty
Would continue with employee, 1333,131 εηλ +=L
Recommend employee, 1433,142 εηλ +=L
331
Would not change employee for cost while compromising on quality, 1533,153 εηλ +=L
Measurement of competitive advantage Employees deliver excellent quality,
1644,161 εηλ +=CA Employees deliver products on time,
1744,172 εηλ +=CA Employees accommodate changing requirement,
1844,183 εηλ +=CA Measurement of organizational performance
Employees help in achieving market share,
1955,191 εηλ +=OP Employees help in achieving profit,
2055,202 εηλ +=OP In addition to these,
ξΦ is a variance of exogenous latent variable.
ξΦ = 12
ξσ
ςΨ is a (5x5) variance matrix of error terms associated with the model implied five structural equations.
⎥⎥⎥⎥⎥⎥
⎦
⎤
⎢⎢⎢⎢⎢⎢
⎣
⎡
=Ψ
5
4
3
2
1
2
2
2
2
2
ς
ς
ς
ς
ς
ς
σσ
σσ
σ
δΘ is a (4x4) variance matrix of measurement errors of the observed exogenous latent variables.
⎥⎥⎥⎥⎥
⎦
⎤
⎢⎢⎢⎢⎢
⎣
⎡
=Θ
4
3
2
1
2
2
2
2
δ
δ
δ
δ
δ
σσ
σσ
εΘ is a (16x16) variance matrix of measurement errors of
the observed endogenous latent variables representing six elements of ESQ, two elements of satisfaction, three elements of loyalty, three elements of competitive advantage and two elements of organizational performance.
⎥⎥⎥⎥⎥⎥⎥⎥
⎦
⎤
⎢⎢⎢⎢⎢⎢⎢⎢
⎣
⎡
=Θ
16
15
3
2
1
2
2
2
2
2
...
ε
ε
ε
ε
ε
ε
σσ
σσ
σ
The sum of the direct and total indirect effect components is
given by following (5x5) matrix:
⎥⎥⎥⎥⎥⎥
⎦
⎤
⎢⎢⎢⎢⎢⎢
⎣
⎡
++++++
+
000000000000000
545443535332545432544331533221533154433221
4343324331433221
32213231
21
βββββββββββββββββββββββββββββ
βββββ
And the sum of direct and total indirect effect components is given by the following (5x1) matrix:
⎥⎥⎥⎥⎥⎥
⎦
⎤
⎢⎢⎢⎢⎢⎢
⎣
⎡
++++
+=
54433111533111533221115443322111
43311143322111
3221113111
2111
11
βββγββγβββγββββγββγβββγ
ββγβγβγ
γ
ηξTE
B. Analysis of the Model
In the model there are 52 free parameters and 153 non redundant variances. Units of measurement are assigned to the latent variables in the model by specifying reference variables. One fixed element in ( 1,1λ ) in xΛ matrix implies units of measurement for the exogenous latent variable. Similarly ),,,,( 5,194,163,132,111,5 λλλλλ in yΛ matrix assign units of measurement to the endogenous latent variables.
Moving from conceptual level structural representation to empirical level following hypotheses are tested. H01: Path coefficient 11γ between ISQ and ESQ is positive
H02a: Path coefficient 21β between ESQ and satisfaction is positive. H02b: Path coefficient 31β between ESQ and loyalty is positive. H03: Path coefficient 32β between satisfaction and loyalty is positive. H04a: Path coefficient 43β between loyalty and competitive advantage is positive. H04b: Path coefficient 53β between competitive advantage and is organizational performance is positive. H04c: Path coefficient 54β between competitive advantage and organizational performance is positive.
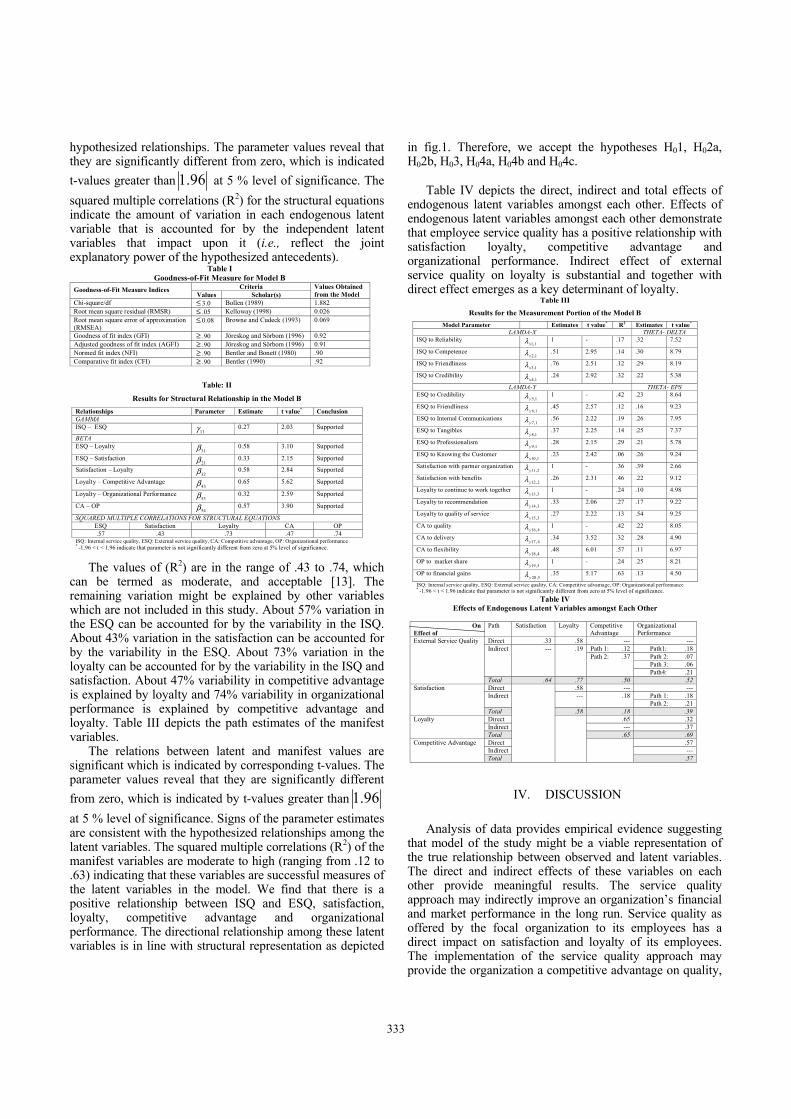
The chi-square statistics for the model is 306.89 with 163 degree of freedom. The ratio of chi-square per degree of freedom is 1.882, which represents a good fit [10, 11]. Given the sensitivity of chi-square statistics for sample size, researchers have proposed a variety of alternative fit indices [12]. Root mean square residual (RMSR) value of 0.026 and root mean square error of approximation (RMSEA) value of 0.069 indicates a reasonable fit. The goodness-of-fit index (GFI) is 0.92 and adjusted goodness-of-fit index (AGFI) is 0.91 and these values are above the recommended threshold of 0.90 therefore reflecting overall fit of the model. The normed fit index (NFI) value of 0.90 and comparative fit index (CFI) value of 0.92 indicate a reasonable fit. Various goodness of fit statistics vis-à-vis their recommended values as given by various scholars is depicted in Table I. From these values it is inferred that model represent an acceptable fit. Various path estimates among latent variables of the model are depicted in table II.
The positive signs of the parameters representing the paths between the latent variables are in line with hypothesized relationships. The magnitude of the estimated parameters provides information on the strength of the
332
hypothesized relationships. The parameter values reveal that they are significantly different from zero, which is indicated t-values greater than 96.1 at 5 % level of significance. The squared multiple correlations (R2) for the structural equations indicate the amount of variation in each endogenous latent variable that is accounted for by the independent latent variables that impact upon it (i.e., reflect the joint explanatory power of the hypothesized antecedents).
Table I Goodness-of-Fit Measure for Model B
Criteria
Goodness-of-Fit Measure Indices Values Scholar(s)
Values Obtained from the Model
Chi-square/df ≤ 3.0 Bollen (1989) 1.882 Root mean square residual (RMSR) ≤ .05 Kelloway (1998) 0.026 Root mean square error of approximation (RMSEA)
≤ 0.08 Browne and Cudeck (1993) 0.069
Goodness of fit index (GFI) ≥ .90 Jöreskog and Sörbom (1996) 0.92 Adjusted goodness of fit index (AGFI) ≥ .90 Jöreskog and Sörbom (1996) 0.91 Normed fit index (NFI) ≥ .90 Bentler and Bonett (1980) .90 Comparative fit index (CFI) ≥ .90 Bentler (1990) .92
Table: II
Results for Structural Relationship in the Model B Relationships Parameter Estimate t value* Conclusion GAMMA ISQ – ESQ
11γ 0.27 2.03 Supported
BETA ESQ – Loyalty
31β 0.58 3.10 Supported ESQ – Satisfaction
21β 0.33 2.15 Supported Satisfaction – Loyalty
32β 0.58 2.84 Supported Loyalty – Competitive Advantage
43β 0.65 5.62 Supported Loyalty – Organizational Performance
53β 0.32 2.59 Supported CA – OP
54β 0.57 3.90 Supported SQUARED MULTIPLE CORRELATIONS FOR STRUCTURAL EQUATIONS
ESQ Satisfaction Loyalty CA OP .57 .43 .73 .47 .74
ISQ: Internal service quality, ESQ: External service quality, CA: Competitive advantage, OP: Organizational performance * -1.96 < t < 1.96 indicate that parameter is not significantly different from zero at 5% level of significance.
The values of (R2) are in the range of .43 to .74, which can be termed as moderate, and acceptable [13]. The remaining variation might be explained by other variables which are not included in this study. About 57% variation in the ESQ can be accounted for by the variability in the ISQ. About 43% variation in the satisfaction can be accounted for by the variability in the ESQ. About 73% variation in the loyalty can be accounted for by the variability in the ISQ and satisfaction. About 47% variability in competitive advantage is explained by loyalty and 74% variability in organizational performance is explained by competitive advantage and loyalty. Table III depicts the path estimates of the manifest variables.
The relations between latent and manifest values are significant which is indicated by corresponding t-values. The parameter values reveal that they are significantly different from zero, which is indicated by t-values greater than 96.1 at 5 % level of significance. Signs of the parameter estimates are consistent with the hypothesized relationships among the latent variables. The squared multiple correlations (R2) of the manifest variables are moderate to high (ranging from .12 to .63) indicating that these variables are successful measures of the latent variables in the model. We find that there is a positive relationship between ISQ and ESQ, satisfaction, loyalty, competitive advantage and organizational performance. The directional relationship among these latent variables is in line with structural representation as depicted
in fig.1. Therefore, we accept the hypotheses H01, H02a, H02b, H03, H04a, H04b and H04c.
Table IV depicts the direct, indirect and total effects of endogenous latent variables amongst each other. Effects of endogenous latent variables amongst each other demonstrate that employee service quality has a positive relationship with satisfaction loyalty, competitive advantage and organizational performance. Indirect effect of external service quality on loyalty is substantial and together with direct effect emerges as a key determinant of loyalty.
Table III
Results for the Measurement Portion of the Model B Model Parameter Estimates t value* R2 Estimates t value*
LAMDA-X THETA- DELTA ISQ to Reliability
1,1xλ 1 - .17 .32 7.52
ISQ to Competence 1,2xλ .51 2.95 .14 .30 8.79
ISQ to Friendliness 1,3xλ .76 2.51 .12 .29 8.19
ISQ to Credibility 1,4xλ .24 2.92 .32 .22 5.38
LAMDA-Y THETA- EPS ESQ to Credibility
1,5yλ 1 - .42 .23 8.64
ESQ to Friendliness 1,6yλ .45 2.57 .12 .16 9.23
ESQ to Internal Communications 1,7yλ .56 2.22 .19 .26 7.95
ESQ to Tangibles 1,8yλ .37 2.25 .14 .25 7.37
ESQ to Professionalism 1,9yλ .28 2.15 .29 .21 5.78
ESQ to Knowing the Customer 1,10yλ .23 2.42 .06 .26 9.24
Satisfaction with partner organization 2,11yλ 1 - .36 .39 2.66
Satisfaction with benefits 2,12yλ .26 2.31 .46 .22 9.12
Loyalty to continue to work together 3,13yλ 1 - .24 .10 4.98
Loyalty to recommendation 3,14yλ .33 2.06 .27 .17 9.22
Loyalty to quality of service 3,15yλ .27 2.22 .13 .54 9.25
CA to quality 4,16yλ 1 - .42 .22 8.05
CA to delivery 4,17yλ .34 3.52 .32 .28 4.90
CA to flexibility 4,18yλ .48 6.01 .57 .11 6.97
OP to market share 5,19yλ 1 - .24 .25 8.21
OP to financial gains 5,20yλ .35 5.17 .63 .13 4.50
ISQ: Internal service quality, ESQ: External service quality, CA: Competitive advantage, OP: Organizational performance * -1.96 < t < 1.96 indicate that parameter is not significantly different from zero at 5% level of significance.
Table IV Effects of Endogenous Latent Variables amongst Each Other
On
Effect of Path Satisfaction Loyalty Competitive
Advantage Organizational Performance
Direct .33 .58 --- --- Path 1: .12 Path1: .18
Path 2: .07 Path 3: .06
Indirect --- .19 Path 2: .37
Path4: .21
External Service Quality
Total .64 .77 .50 .52 Direct .58 --- ---
Path 1: .18 Indirect --- .18 Path 2: .21
Satisfaction
Total .58 .18 .39 Direct .65 .32 Indirect --- .37
Loyalty
Total .65 .69 Direct .57 Indirect ---
Competitive Advantage
Total
.57
IV. DISCUSSION
Analysis of data provides empirical evidence suggesting that model of the study might be a viable representation of the true relationship between observed and latent variables. The direct and indirect effects of these variables on each other provide meaningful results. The service quality approach may indirectly improve an organization’s financial and market performance in the long run. Service quality as offered by the focal organization to its employees has a direct impact on satisfaction and loyalty of its employees. The implementation of the service quality approach may provide the organization a competitive advantage on quality,
333
delivery and flexibility dimensions. Service quality offered by the focal organization has a direct impact on satisfaction and loyalty of its employees. Employees realize that their ability to provide good service quality to each other reflects in their enhanced level of satisfaction which inspires their loyalty to each other. There are many ways to obtain loyalty; however, the common denominator is employee friendliness, their competence, credibility and reliability. These findings are in line with those of [14] who conducted their study in a small engineering organization and found that employee loyalty results not only in serving internal customers but also serving external customers and is one of the enablers of competitive advantage. This study finds a link between service quality and loyalty through an intervening variable of satisfaction. This could be true because the three automobile organizations from which data have been collected are situated in National Capital Region (NCR) in North India and these organizations are top organizations in their segment of industry and follow best in class processes and practices. Employees of these organizations value the locational advantage of these organizations, have faith in these organizations and would like to continue to work in these organizations. The results also indicate that higher levels of competitive advantage may lead to improved organizational performance. Based on the effects, service quality may have a direct impact on satisfaction and loyalty than on competitive advantage and organizational performance. This could be true because competitive advantage and organizational performance is usually influenced by several factors and it is difficult to surmise whether any factor such as service quality will dominantly determine the competitive advantage and overall performance of an organization.
V. CONCLUSION In the manufacturing context, the role of ISQ and its
relationship with ESQ, competitive advantage and organizational performance has not been conceptualized previously. Future researchers can take a cue from this research, and empirically test this model at other interfaces in a manufacturing setup to demonstrate the strength and direction of the proposed linkages. This study should be of interest to manufacturing industry practitioners interested in developing internal customer orientation- in a form of ISQ and ESQ. Managers should assess internal and external relationships with employees and take action where necessary. Employees should be developed to identify their primary customers and then assess the level of service and product quality. A single manufacturing setting with three automobile organizations under investigation, a small sample size and snowballing based sampling preclude much of the generalizability of the study findings. Organizations across various industries may differ in organizational structures, roles and responsibilities, business processes and
organizational structures, and the conceptualization of service quality may be moulded accordingly.
[1] L. L. Stanley, J.D.Wisner, “The determinants of service quality: issues for purchasing”, European Journal of Purchasing and Supply Management, vol. 8, no.2, pp.97-109, 2001.
[2] C. Hart, “The power of internal guarantees”, Harvard Business Review, vol. 73, no.1, pp.64-73, 1995.
[3] J. L. Heskett, T. O. Jones, G. W. Loveman, W. E. Sasser, L. A. Schlesinger, “Putting the service profit chain to work”, Harvard Business Review, vol. 72, no. 2, pp. 31-41, 1994.
[4] R. J. Varey, “Internal marketing: a review and some interdisciplinary research challenges”, International Journal of Service Industry Management, vol. 6, no.1, pp.40-63, 1995.
[5] S. Vandermerwe, D. Gilbert, “Making internal services market driven”, Business Horizons, vol.32, no.6, pp.83-89 1989.
[6] J. J. Cronin, S. A. Taylor, “Measuring service quality: a reexamination and extension”, Journal of Marketing, vol. 56, no. 3, pp. 55-68, 1992.
[7] F. Buttle, “SERVQUAL: review, critique, research agenda”, European Journal of Marketing, vol. 30, no. 1, pp. 8-25, 1996.
[8] J. S. Long, Covariance Structure Models: An Introduction to LISREL, Sage Publications. Beverly Hills, 1983.
[9] R. O. Mueller, Basic Principles of Structural Equation Modelling, Springer-Verlag, New York, NY, 1996.
[10] J. S. Tanaka, “How big is big enough?: sample size and goodness of fit in structural equation models with latent variables”, Child Development, vol. 58, no.1, pp.134-146, 1987.
[11] K. A. Bollen, Structural Equations with Latent Variables. Wiley, New York, 1989.
[12] P. Barrett, “Structural equation modelling: adjudging model fit”, Personality and Individual Differences, vol. 42 no.5, pp. 815-824, 2007.
[13] R.P. Bagozzi, Y. Youjae, “On the evaluation of structural equation models”, Academy of Marketing Science, vol.16, no.1, pp.74-94, 1988.
[14] P. Maclaran, P. McGowan, “Managing service quality for competitive advantage in small engineering firms”, International Journal of Entrepreneurial Behaviour and Research, vol.5, no.2, pp 35-47, 1999.
[15] W. Boulding, A. Kalra, R. Staelin, V.A. Zeithamal, “A dynamic process model of service quality: from expectations to behavioral intensions”, Journal of Marketing Research, vol.30 no.1, pp.7-27, 1993. Annexure I
334
REFERENCES
Likert Scale
et al(
Satisfaction
services
you receive from your organization.
Loyalty
et al
et al.1994
conditions/service quality.
et al.
Employees do their work on time You are helpful in solving employees’ problems Quality
Responsiveness
Credibility et al.,
et al
Flexibility
et al.
et al
Your employees accommodate your organization’s changing
Achieving Organizational Performance
Market Share
market share
Tangibles et al Financial Gains
Employees possess needed knowledge, expertise and skills
Employees demand just salary and allowances
Employees maintain a positive work environment
Employees demand excellent service terms and conditions
Knowing the customer
Employees understand the impeccable reputation of your
organization
Table V: Items for Measurement of Internal, External Service Quality and Consequence of Organizational Service Quality in manufacturing Supply Chain. Measurement on five-point
External Service Quality: Service Quality Offered by Internal Service Quality: Service Quality Offered by Consequence of Service QualityManufacturer Employees
(Ghobadian 1994; (Parasuraman ., 1988) Heskett,et al., 1997)et al., et al
Employees in your organization are reliable You are committed towards your employees
Employees are consistent in delivering high quality products and You are consistent in working towards your employees You are satisfied with your organization.
Employees are prompt in action You take fast decisions You are satisfied in terms of salary and other benefits that
Employees deliver correct quality at right time You show respect and positive attitude towards your employees
Competence (
Employees maintain confidentiality in operations You show willingness to work towards organizational goals You would recommend your organization to others.
Competence of employees You possess required skills and knowledge You would like to change your organization, if other
organizations offer higher salary but offer moderate service
(Haywood and Farmer, 1988; Johnston, 1995) You maintain proper communication with subordinates You would continue to work in this organization.
Employees have willingness to work for the organization Haywood and Farmer, 1988; Johnston, 1995)
Employees understand the requirements of the organization You have faith and trust in working of employees Your employees deliver excellent service quality
Employees have positive attitude towards organization You protect your employees in case of emergency
Employees are courteous You help your employees in getting required equipment and tools Your employees deliver products/ service on time
Grönroos, 1988; Parasuraman ., 1985)
Internal communications
Employees are prompt in informing about progress/feedback You care for training needs of employees
Employee share relevant information among colleagues You can be easily contacted
Use of ICT based tools Your employees help your organization in achieving its target
Employees possess right tools and equipments Your employees help your organization in achieving profit
Professionalism (Grönroos, 1988)
(Grönroos 1988)
Employees are prompt in handling complaints
Friendliness
(Ghobadian 1994; You are accepted by all in your department
Friendliness ( Achieving Competitive Advantage
(Parasuraman . 1988)
Ghobadian ; Johnston, 1995)
Employees are trustworthy Parasuraman . 1985; You would continue to work in this organization.
Employees understand their work (Ghobadian 1994;
Grönroos, 1988; Parasuraman ., 1985)
Credibility Reliability Satisfaction and Loyalty
(McGinnis , 1999, Tracey, 1999)
Haywood and Farmer, 1988; Parasur aman ., 1985) requirements.