Embed Size (px)
Citation preview
Cleveland State University Cleveland State University
EngagedScholarship@CSU EngagedScholarship@CSU
Urban Publications Maxine Goodman Levin College of Urban Affairs
1-1-2004
Manufacturing Pennsylvania's Future: Regional Strategies That Manufacturing Pennsylvania's Future: Regional Strategies That
Build From Current Strengths and Address Competitive Build From Current Strengths and Address Competitive
Challenges - Executive Summary Challenges - Executive Summary
Edward W. Hill Cleveland State University, [email protected]
Follow this and additional works at: https://engagedscholarship.csuohio.edu/urban_facpub
Part of the Urban Studies Commons
How does access to this work benefit you? Let us know! How does access to this work benefit you? Let us know!
Repository Citation Repository Citation Hill, Edward W., "Manufacturing Pennsylvania's Future: Regional Strategies That Build From Current Strengths and Address Competitive Challenges - Executive Summary" (2004). Urban Publications. 0 1 2 3 512. https://engagedscholarship.csuohio.edu/urban_facpub/512
This Report is brought to you for free and open access by the Maxine Goodman Levin College of Urban Affairs at EngagedScholarship@CSU. It has been accepted for inclusion in Urban Publications by an authorized administrator of EngagedScholarship@CSU. For more information, please contact [email protected].
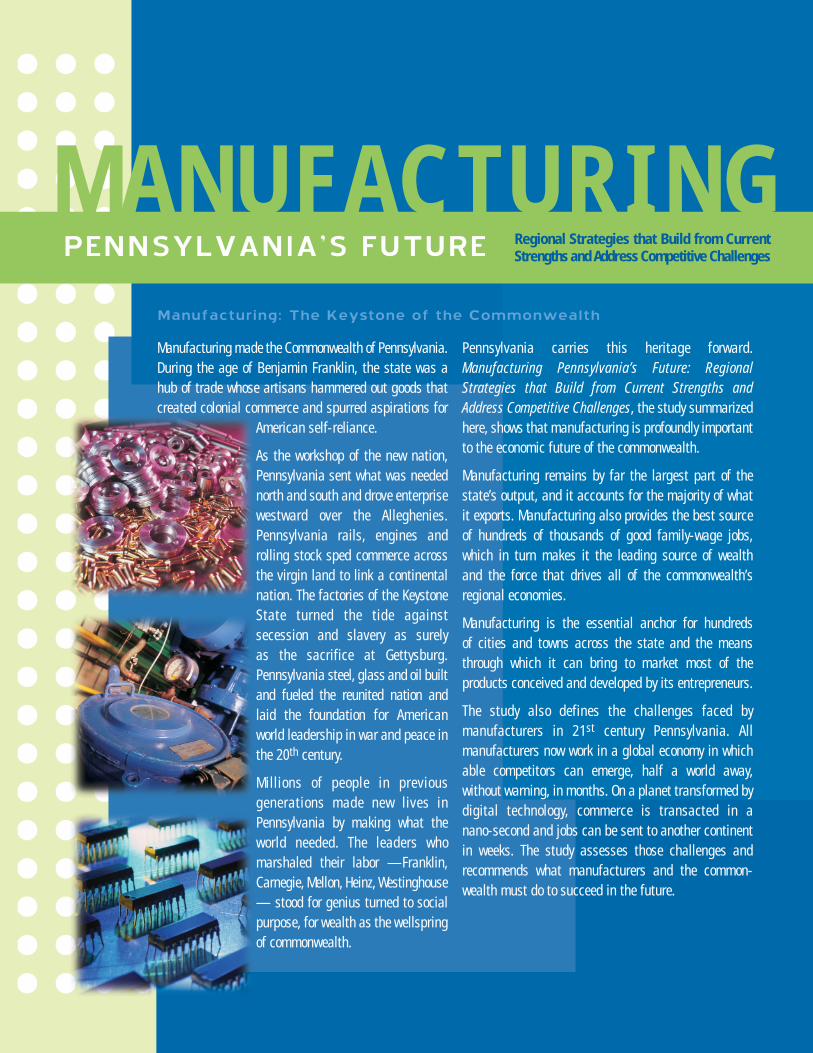
M A N U FA C T U R I N GPENNSYLVANIA’S FUTURE Regional Strategies that Build from Current
Strengths and Address Competitive Challenges
Manufacturing: The Keystone of the Commonwealth
Manufacturing made the Commonwealth of Pennsylvania.During the age of Benjamin Franklin, the state was a hub of trade whose artisans hammered out goods thatcreated colonial commerce and spurred aspirations for
American self-reliance.
As the workshop of the new nation,Pennsylvania sent what was needednorth and south and drove enterprisewestward over the Alleghenies.Pennsylvania rails, engines androlling stock sped commerce acrossthe virgin land to link a continentalnation. The factories of the KeystoneState turned the tide against secession and slavery as surely as the sacrifice at Gettysburg.Pennsylvania steel, glass and oil builtand fueled the reunited nation andlaid the foundation for Americanworld leadership in war and peace inthe 20th century.
Millions of people in previous generations made new lives inPennsylvania by making what theworld needed. The leaders who marshaled their labor —Franklin,Carnegie, Mellon, Heinz, Westinghouse— stood for genius turned to socialpurpose, for wealth as the wellspringof commonwealth.
Pennsylvania carries this heritage forward.Manufacturing Pennsylvania’s Future: RegionalStrategies that Build from Current Strengths andAddress Competitive Challenges, the study summarizedhere, shows that manufacturing is profoundly importantto the economic future of the commonwealth.
Manufacturing remains by far the largest part of thestate’s output, and it accounts for the majority of whatit exports. Manufacturing also provides the best sourceof hundreds of thousands of good family-wage jobs, which in turn makes it the leading source of wealth and the force that drives all of the commonwealth’sregional economies.
Manufacturing is the essential anchor for hundreds of cities and towns across the state and the meansthrough which it can bring to market most of the products conceived and developed by its entrepreneurs.
The study also defines the challenges faced by manufacturers in 21st century Pennsylvania. All manufacturers now work in a global economy in whichable competitors can emerge, half a world away, without warning, in months. On a planet transformed bydigital technology, commerce is transacted in a nano-second and jobs can be sent to another continentin weeks. The study assesses those challenges and recommends what manufacturers and the common-wealth must do to succeed in the future.
The analysis summarized here delves
deep into comprehensive, detailed data
to define Pennsylvania’s manufacturing
economy, and it presents compelling
graphics that support the findings.
This analysis may well be the most
substantial study ever done of the
manufacturing endowment of an
industrial state.
To read the complete, comprehensive
report, visit www.catalystconnection.org/
bkh/report.htm.
?QUESTIONSManufacturing Pennsylvania’s Future: Regional Strategies that Build from Current Strengths andAddress Competitive Challenges was produced by Deloitte & Touche, the international consultingcorporation with the largest manufacturing practice in the world. The study was sponsored andoverseen by the Pennsylvania Industrial Resource Centers Network, the TEAM PA Foundation andthe Pennsylvania Department of Community and Economic Development. Hundreds of questionswere posed during the design phase of the study, including the following:
> How should the significance of manufacturing to the Pennsylvania economy be measured?> How and why has that significance evolved in the last decade?> How does the performance of Pennsylvania manufacturing compare to that of other states?> How significant is the threat of foreign competition to various Pennsylvania industries?> How likely are customers of Pennsylvania manufacturers to shift to offshore suppliers?> How have various industries performed in Pennsylvania?> Which industries have a comparative advantage in Pennsylvania?> What types of firms within the state support industries with a comparative advantage?> What distinctions are there between the needs of larger and smaller manufacturers?> What industries are most important in each region of Pennsylvania?> What dynamics now shape the possible futures of manufacturing in Pennsylvania?> What can state government do to help secure the best future?
The study attempted to answer these questions using a very broad range of data, the industrialexperts of Deloitte, the 15-year experience of the Industrial Resource Centers and the perspectivesof more than 75 manufacturing executives throughout the various regions of Pennsylvania.
Submitted to:-The Industrial Resource Centers(IRCs) of Pennsylvania
-Department of Community andEconomic Development,Commonwealth of Pennsylvania
-Team PA Foundation
January, 2004
25�
20�
15�
10�
5�
0
0.87
19.86
labor ($/hr)
4.61
100�
80�
60�
40�
20�
017.23
59.4
construction ($/hr)
17.6
0.05�
0.04�
0.03�
0.02�
0.01�
0
0.03
0.04
electricity ($/hr)
0.03
5�
4�
3�
2�
1�
0
3.72
4.5
industrial rent ($/hr)
3.96
WHY OFF-SHORING? - Comparative Cost Data
U.S. is increasingly becoming uncompetitive as a production base. ■ China ■ Mexico ■ US
Source: EIU and Deloitte Fantas Analysis
16,000�
14,000�
12,000�
10,000�
8,000�
6,000�
4,000�
2,000�
0�
�
1989 20031999199819971996199519941993199219911990 200220012000
$ m
illion
$14.8 billion
$789 million
June 1990�through�
March 1991
March 2002�through�
November 2001
MONTHLY IMPORTS FROM CHINA GROW EXPONENTIALLY
U.S. imports from China, current dollars, January 1989 to September 2003.
Source: U.S. Bureau of Economic Analysis
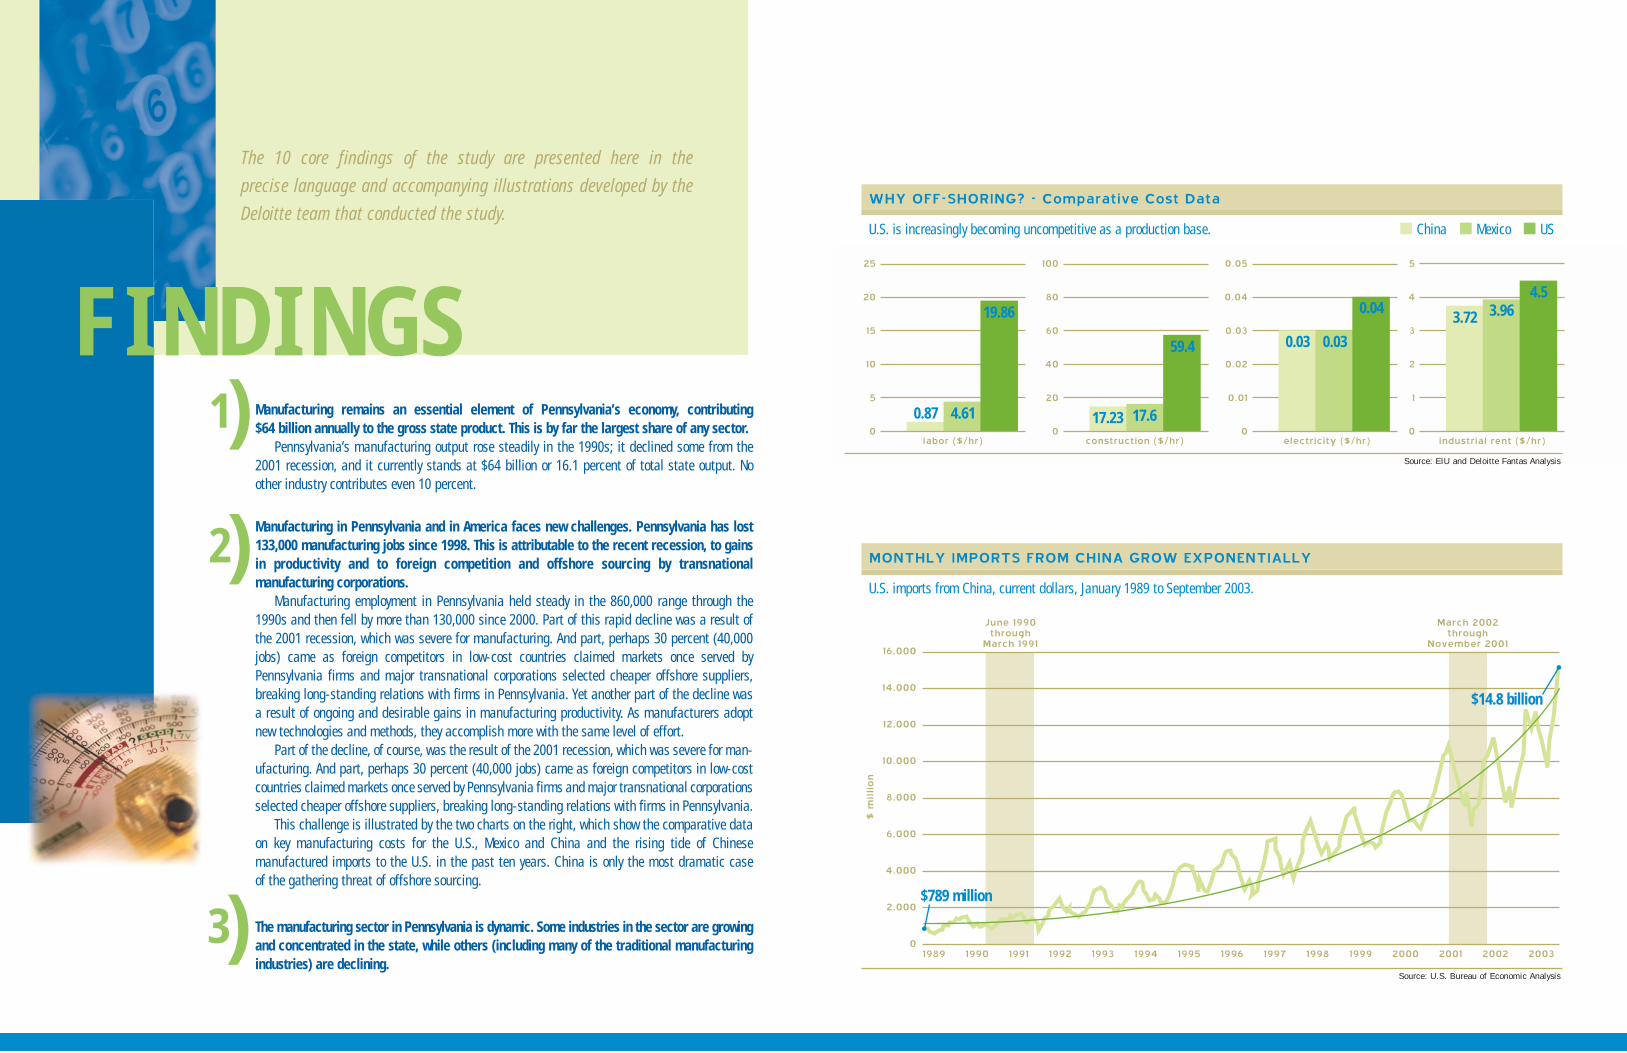
Manufacturing remains an essential element of Pennsylvania’s economy, contributing $64 billion annually to the gross state product. This is by far the largest share of any sector.
Pennsylvania’s manufacturing output rose steadily in the 1990s; it declined some from the2001 recession, and it currently stands at $64 billion or 16.1 percent of total state output. Noother industry contributes even 10 percent.
Manufacturing in Pennsylvania and in America faces new challenges. Pennsylvania has lost133,000 manufacturing jobs since 1998. This is attributable to the recent recession, to gainsin productivity and to foreign competition and offshore sourcing by transnational manufacturing corporations.
Manufacturing employment in Pennsylvania held steady in the 860,000 range through the1990s and then fell by more than 130,000 since 2000. Part of this rapid decline was a result ofthe 2001 recession, which was severe for manufacturing. And part, perhaps 30 percent (40,000jobs) came as foreign competitors in low-cost countries claimed markets once served byPennsylvania firms and major transnational corporations selected cheaper offshore suppliers,breaking long-standing relations with firms in Pennsylvania. Yet another part of the decline wasa result of ongoing and desirable gains in manufacturing productivity. As manufacturers adoptnew technologies and methods, they accomplish more with the same level of effort.
Part of the decline, of course, was the result of the 2001 recession, which was severe for man-ufacturing. And part, perhaps 30 percent (40,000 jobs) came as foreign competitors in low-costcountries claimed markets once served by Pennsylvania firms and major transnational corporationsselected cheaper offshore suppliers, breaking long-standing relations with firms in Pennsylvania.
This challenge is illustrated by the two charts on the right, which show the comparative dataon key manufacturing costs for the U.S., Mexico and China and the rising tide of Chinese manufactured imports to the U.S. in the past ten years. China is only the most dramatic case of the gathering threat of offshore sourcing.
The manufacturing sector in Pennsylvania is dynamic. Some industries in the sector are growingand concentrated in the state, while others (including many of the traditional manufacturingindustries) are declining.
2)
1)
The 10 core findings of the study are presented here in the
precise language and accompanying illustrations developed by the
Deloitte team that conducted the study.
3)
FINDINGS
6)
100,000�
95,000�
90,000�
85,000�
80,000�
75,000�
70,000�
65,000�
60,00020031999�1998�1997�1996�1995�1994�1993 2002�2001�2000�
pro
ducti
vit
y (
outp
ut/
em
plo
yee)
$96,549
$86,814
$9,735
WHILE MANUFACTURING PRODUCTIVITY IN PENNSYLVANIA HAS GROWN, IT LAGS IN THE NATION
■ U.S.: Real Gross Product Per Manufacturing Job ■ PA: Real Gross Product Per Manufacturing Job
Source: Economy.com
FINDINGS
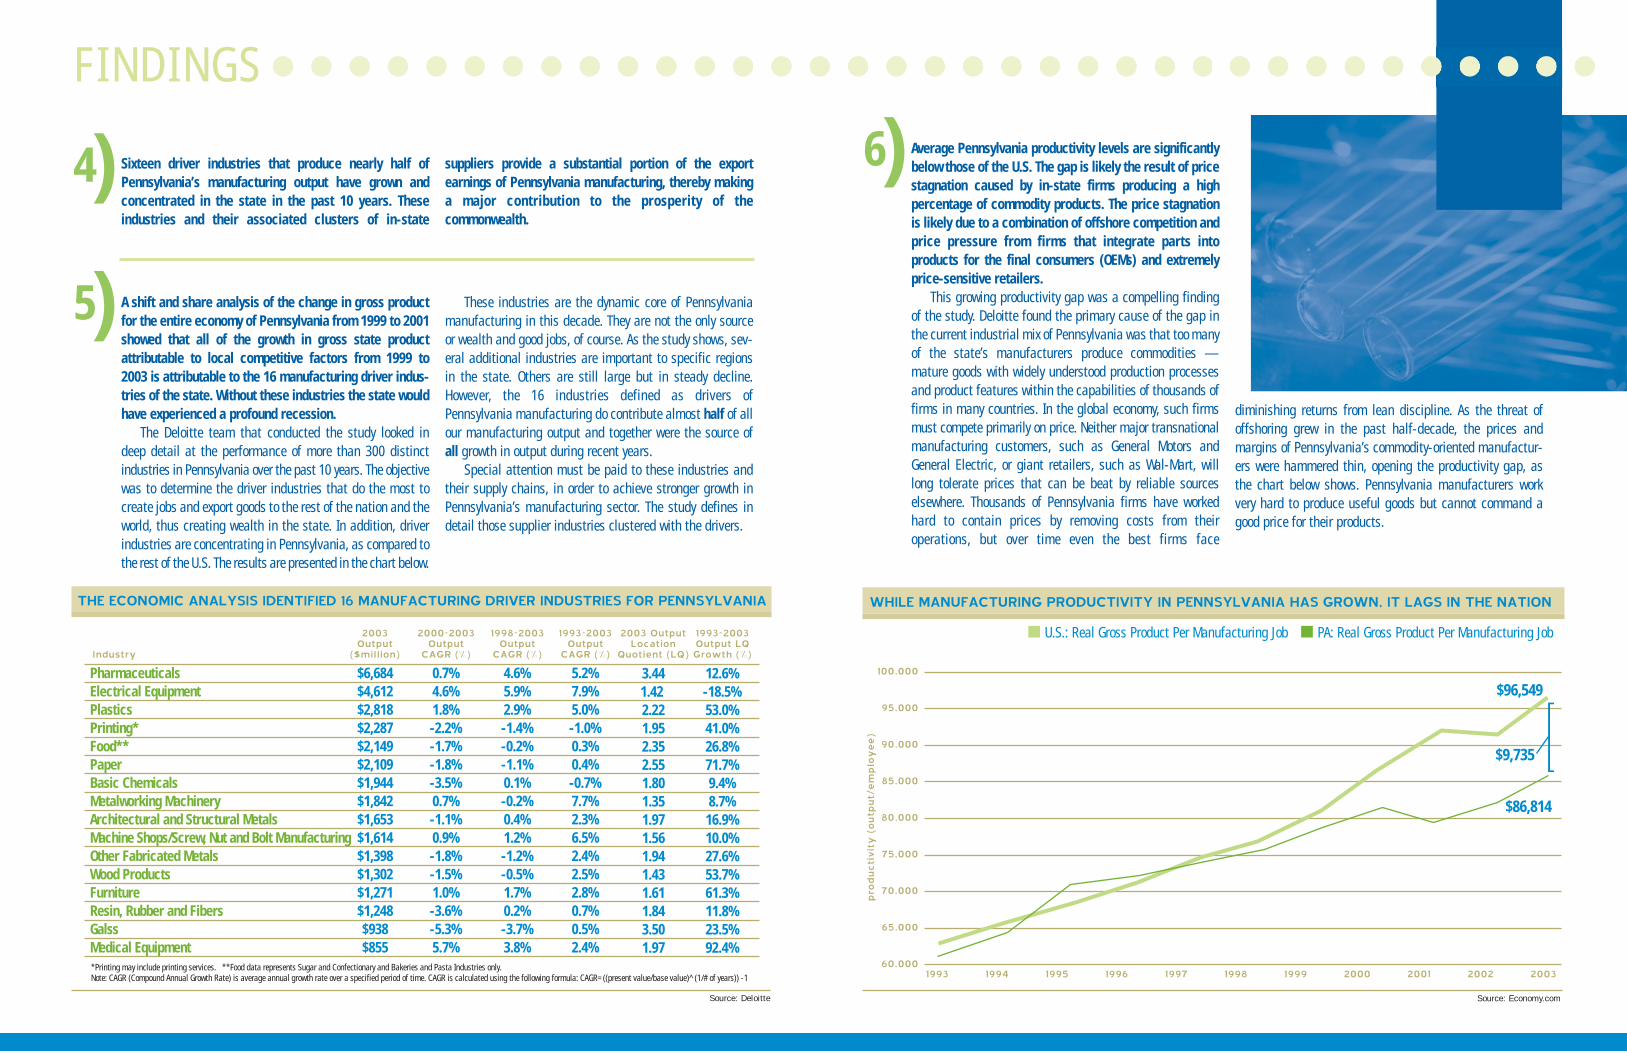
Average Pennsylvania productivity levels are significantlybelow those of the U.S. The gap is likely the result of pricestagnation caused by in-state firms producing a high percentage of commodity products. The price stagnationis likely due to a combination of offshore competition andprice pressure from firms that integrate parts into products for the final consumers (OEMs) and extremelyprice-sensitive retailers.
This growing productivity gap was a compelling findingof the study. Deloitte found the primary cause of the gap inthe current industrial mix of Pennsylvania was that too manyof the state’s manufacturers produce commodities —mature goods with widely understood production processesand product features within the capabilities of thousands offirms in many countries. In the global economy, such firmsmust compete primarily on price. Neither major transnationalmanufacturing customers, such as General Motors andGeneral Electric, or giant retailers, such as Wal-Mart, willlong tolerate prices that can be beat by reliable sources elsewhere. Thousands of Pennsylvania firms have workedhard to contain prices by removing costs from their operations, but over time even the best firms face
diminishing returns from lean discipline. As the threat ofoffshoring grew in the past half-decade, the prices and margins of Pennsylvania’s commodity-oriented manufactur-ers were hammered thin, opening the productivity gap, asthe chart below shows. Pennsylvania manufacturers workvery hard to produce useful goods but cannot command agood price for their products.
4)
5)
Industry
PharmaceuticalsElectrical EquipmentPlasticsPrinting*Food**PaperBasic ChemicalsMetalworking MachineryArchitectural and Structural MetalsMachine Shops/Screw, Nut and Bolt ManufacturingOther Fabricated MetalsWood ProductsFurnitureResin, Rubber and FibersGalssMedical Equipment
2003�Output�
($million)
$6,684$4,612$2,818$2,287$2,149$2,109$1,944$1,842$1,653$1,614$1,398$1,302$1,271$1,248$938$855
2000-2003�Output�
CAGR (%)�
0.7%4.6%1.8%-2.2%-1.7%-1.8%-3.5%0.7%-1.1%0.9%-1.8%-1.5%1.0%-3.6%-5.3%5.7%
1998-2003�Output�
CAGR (%)�
4.6%5.9%2.9%-1.4%-0.2%-1.1%0.1%-0.2%0.4%1.2%-1.2%-0.5%1.7%0.2%-3.7%3.8%
1993-2003�Output�
CAGR (%)�
5.2%7.9%5.0%-1.0%0.3%0.4%-0.7%7.7%2.3%6.5%2.4%2.5%2.8%0.7%0.5%2.4%
2003 Output�Location�
Quotient (LQ)�
3.441.422.221.952.352.551.801.351.971.561.941.431.611.843.501.97
1993-2003�Output LQ�Growth (%)�
12.6%-18.5%53.0%41.0%26.8%71.7%9.4%8.7%
16.9%10.0%27.6%53.7%61.3%11.8%23.5%92.4%
*Printing may include printing services. **Food data represents Sugar and Confectionary and Bakeries and Pasta Industries only.Note: CAGR (Compound Annual Growth Rate) is average annual growth rate over a specified period of time. CAGR is calculated using the following formula: CAGR=((present value/base value)^(1/# of years)) -1
THE ECONOMIC ANALYSIS IDENTIFIED 16 MANUFACTURING DRIVER INDUSTRIES FOR PENNSYLVANIA
Source: Deloitte
A shift and share analysis of the change in gross productfor the entire economy of Pennsylvania from 1999 to 2001showed that all of the growth in gross state product attributable to local competitive factors from 1999 to2003 is attributable to the 16 manufacturing driver indus-tries of the state. Without these industries the state wouldhave experienced a profound recession.
The Deloitte team that conducted the study looked indeep detail at the performance of more than 300 distinctindustries in Pennsylvania over the past 10 years. The objectivewas to determine the driver industries that do the most tocreate jobs and export goods to the rest of the nation and theworld, thus creating wealth in the state. In addition, driverindustries are concentrating in Pennsylvania, as compared tothe rest of the U.S. The results are presented in the chart below.
These industries are the dynamic core of Pennsylvaniamanufacturing in this decade. They are not the only sourceor wealth and good jobs, of course. As the study shows, sev-eral additional industries are important to specific regionsin the state. Others are still large but in steady decline.However, the 16 industries defined as drivers ofPennsylvania manufacturing do contribute almost half of allour manufacturing output and together were the source ofall growth in output during recent years.
Special attention must be paid to these industries andtheir supply chains, in order to achieve stronger growth inPennsylvania’s manufacturing sector. The study defines indetail those supplier industries clustered with the drivers.
Sixteen driver industries that produce nearly half ofPennsylvania’s manufacturing output have grown andconcentrated in the state in the past 10 years. Theseindustries and their associated clusters of in-state
suppliers provide a substantial portion of the export earnings of Pennsylvania manufacturing, thereby makinga major contribution to the prosperity of the commonwealth.
FINDINGS
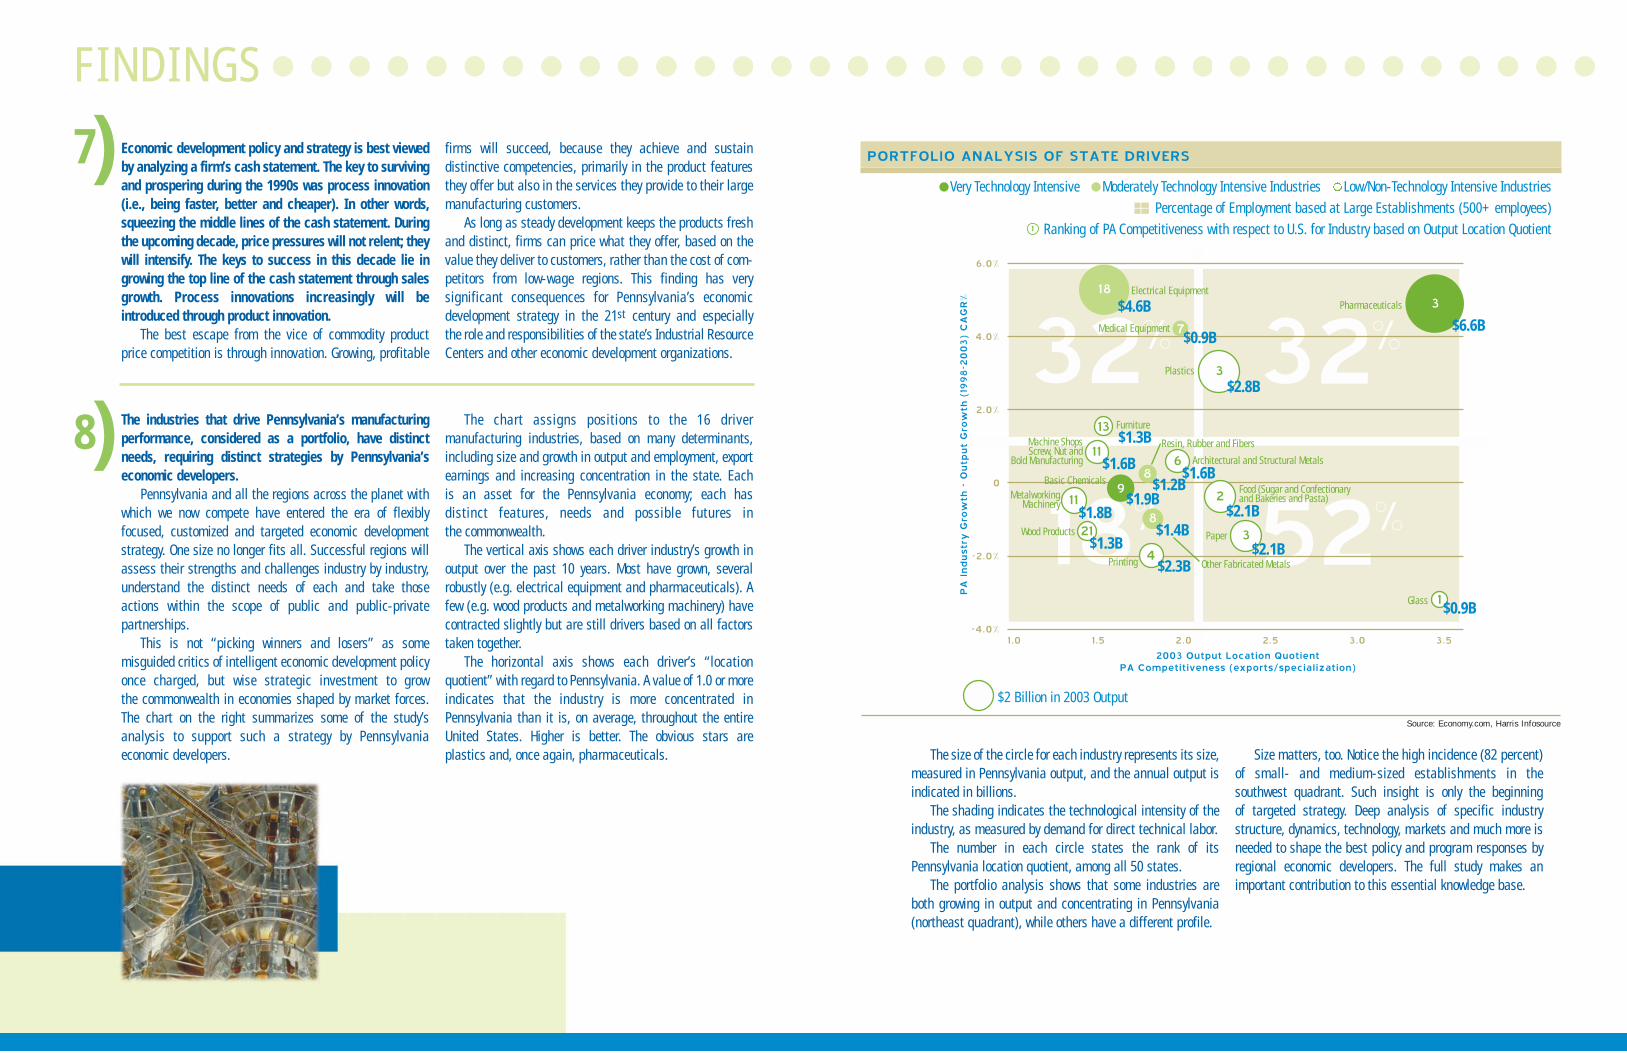
8)52%18%
32%32%
6.0%�
4.0%�
2.0%�
0�
-2.0%�
-4.0%3.01.0 3.52.52.01.5
PA
Indust
ry G
row
th -
Outp
ut
Gro
wth
(19
98-2
00
3)
CA
GR
%
2003 Output Location Quotient�PA Competitiveness (exports/specialization)
3�
$6.6B
9$1.9B
6$1.6B
4$2.3B
13$1.3B
7$0.9B
8$1.2B
18$4.6B
1$0.9B
21$1.3B
8$1.4B
11$1.6B
11$1.8B
2$2.1B
3$2.1B
3$2.8B
Glass
Food (Sugar and Confectionary and Bakeries and Pasta)��
Pharmaceuticals
Plastics
Paper
Printing
Architectural and Structural Metals
Medical Equipment
Resin, Rubber and Fibers
Other Fabricated Metals
Basic Chemicals
Machine ShopsScrew, Nut and
Bold Manufacturing
MetalworkingMachinery
Furniture
Electrical Equipment
Wood Products
PORTFOLIO ANALYSIS OF STATE DRIVERS
Very Technology Intensive Moderately Technology Intensive Industries Low/Non-Technology Intensive IndustriesPercentage of Employment based at Large Establishments (500+ employees)
Ranking of PA Competitiveness with respect to U.S. for Industry based on Output Location Quotient1
Source: Economy.com, Harris Infosource
The size of the circle for each industry represents its size,measured in Pennsylvania output, and the annual output is indicated in billions.
The shading indicates the technological intensity of theindustry, as measured by demand for direct technical labor.
The number in each circle states the rank of itsPennsylvania location quotient, among all 50 states.
The portfolio analysis shows that some industries areboth growing in output and concentrating in Pennsylvania(northeast quadrant), while others have a different profile.
Size matters, too. Notice the high incidence (82 percent)of small- and medium-sized establishments in the southwest quadrant. Such insight is only the beginning of targeted strategy. Deep analysis of specific industrystructure, dynamics, technology, markets and much more isneeded to shape the best policy and program responses byregional economic developers. The full study makes animportant contribution to this essential knowledge base.
7) Economic development policy and strategy is best viewedby analyzing a firm’s cash statement. The key to survivingand prospering during the 1990s was process innovation(i.e., being faster, better and cheaper). In other words, squeezing the middle lines of the cash statement. Duringthe upcoming decade, price pressures will not relent; theywill intensify. The keys to success in this decade lie ingrowing the top line of the cash statement through salesgrowth. Process innovations increasingly will be introduced through product innovation.
The best escape from the vice of commodity productprice competition is through innovation. Growing, profitable
firms will succeed, because they achieve and sustain distinctive competencies, primarily in the product featuresthey offer but also in the services they provide to their largemanufacturing customers.
As long as steady development keeps the products freshand distinct, firms can price what they offer, based on thevalue they deliver to customers, rather than the cost of com-petitors from low-wage regions. This finding has very significant consequences for Pennsylvania’s economicdevelopment strategy in the 21st century and especially the role and responsibilities of the state’s Industrial ResourceCenters and other economic development organizations.
The industries that drive Pennsylvania’s manufacturingperformance, considered as a portfolio, have distinctneeds, requiring distinct strategies by Pennsylvania’seconomic developers.
Pennsylvania and all the regions across the planet withwhich we now compete have entered the era of flexiblyfocused, customized and targeted economic developmentstrategy. One size no longer fits all. Successful regions willassess their strengths and challenges industry by industry,understand the distinct needs of each and take thoseactions within the scope of public and public-private partnerships.
This is not “picking winners and losers” as some misguided critics of intelligent economic development policyonce charged, but wise strategic investment to grow the commonwealth in economies shaped by market forces.The chart on the right summarizes some of the study’sanalysis to support such a strategy by Pennsylvania economic developers.
The chart assigns positions to the 16 driver manufacturing industries, based on many determinants,including size and growth in output and employment, exportearnings and increasing concentration in the state. Each is an asset for the Pennsylvania economy; each has distinct features, needs and possible futures in the commonwealth.
The vertical axis shows each driver industry’s growth in output over the past 10 years. Most have grown, severalrobustly (e.g. electrical equipment and pharmaceuticals). Afew (e.g. wood products and metalworking machinery) havecontracted slightly but are still drivers based on all factorstaken together.
The horizontal axis shows each driver’s “location quotient” with regard to Pennsylvania. A value of 1.0 or moreindicates that the industry is more concentrated inPennsylvania than it is, on average, throughout the entireUnited States. Higher is better. The obvious stars are plastics and, once again, pharmaceuticals.
$2 Billion in 2003 Output
10)
Key Macro Issue
Strategy
New Product Development
Process Improvement
Workforce Development
Strategic Advocacy
�
�
Currently this capability is drawn from a few IRC staff or outsourced to a variety of independent consultancies.
IRC Capability SME Needs PA Economy IRC ModelPotential Impact on…�
Action Required
Two IRCs offer skills and services on a modest scale for new product development. There is no organized capability in funding, market strategy or technical design.
The IRC network specializes in process improvement for SME. It has significant strength in Lean Manufacturing at the shop floor and supply chain levels.
Currently, IRCs offer services at the Firm level. There is some activity to serve as an intermediary to bring organizations and educational institutions together.
Currently, IRCs offer services at the Firm level. There is no organized capability to advocate the importance of, or address key issues for, SME manufacturing across industries.
1. Develop a robust strategyand planning capability specializing in SMEstrategy.
2. Develop an IRC Network or regional capability offering cradle-to-grave new product development assistance.
3. Continue to support and build out consistent process improvement capabilities across the network.
4. Develop an IRC capability to support SMEs in attracting, developing, and retaining workers with the skills needed for future success.
5. Develop an IRC Network capability to provide SME-focused research and analysis on key issues and strategic thought leadership for manufacturing across industries.
IRC CAPABILITIES GAP ANALYSIS
Moderate Significant
Source: Deloitte
FINDINGS
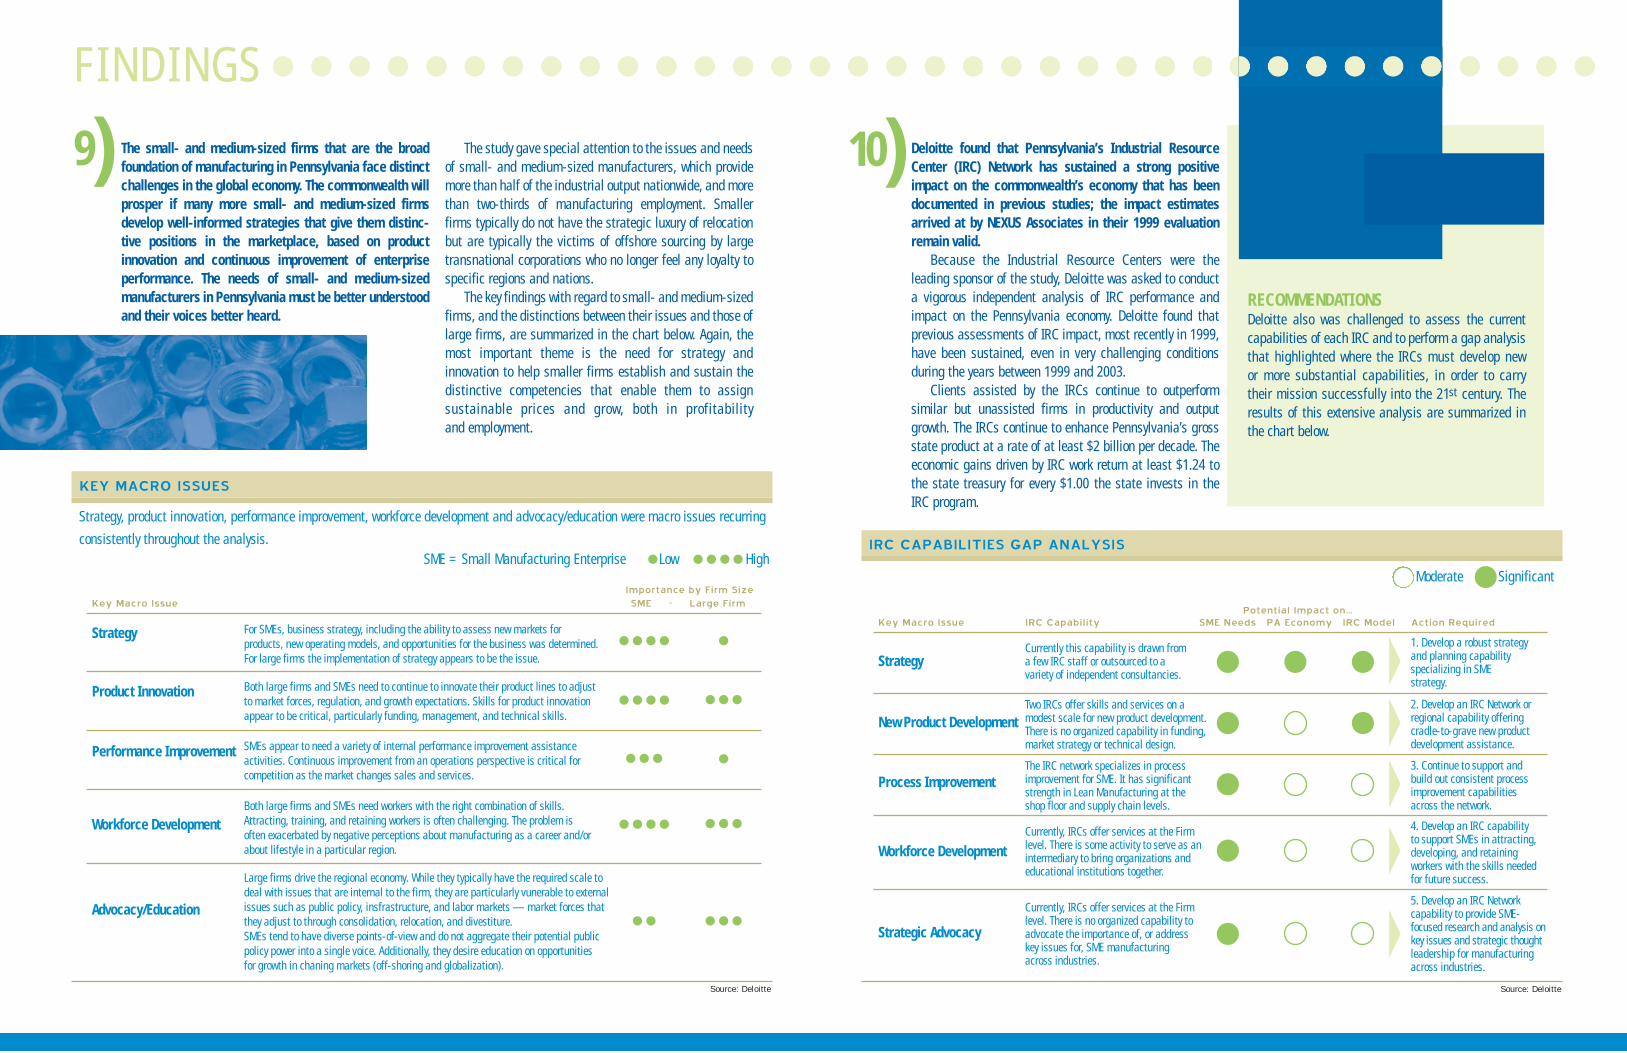
Deloitte found that Pennsylvania’s Industrial ResourceCenter (IRC) Network has sustained a strong positiveimpact on the commonwealth’s economy that has beendocumented in previous studies; the impact estimatesarrived at by NEXUS Associates in their 1999 evaluationremain valid.
Because the Industrial Resource Centers were the leading sponsor of the study, Deloitte was asked to conducta vigorous independent analysis of IRC performance andimpact on the Pennsylvania economy. Deloitte found thatprevious assessments of IRC impact, most recently in 1999,have been sustained, even in very challenging conditionsduring the years between 1999 and 2003.
Clients assisted by the IRCs continue to outperform similar but unassisted firms in productivity and outputgrowth. The IRCs continue to enhance Pennsylvania’s grossstate product at a rate of at least $2 billion per decade. Theeconomic gains driven by IRC work return at least $1.24 tothe state treasury for every $1.00 the state invests in the IRC program.
The small- and medium-sized firms that are the broadfoundation of manufacturing in Pennsylvania face distinctchallenges in the global economy. The commonwealth willprosper if many more small- and medium-sized firmsdevelop well-informed strategies that give them distinc-tive positions in the marketplace, based on product innovation and continuous improvement of enterpriseperformance. The needs of small- and medium-sized manufacturers in Pennsylvania must be better understoodand their voices better heard.
The study gave special attention to the issues and needsof small- and medium-sized manufacturers, which providemore than half of the industrial output nationwide, and morethan two-thirds of manufacturing employment. Smallerfirms typically do not have the strategic luxury of relocationbut are typically the victims of offshore sourcing by largetransnational corporations who no longer feel any loyalty tospecific regions and nations.
The key findings with regard to small- and medium-sizedfirms, and the distinctions between their issues and those oflarge firms, are summarized in the chart below. Again, themost important theme is the need for strategy and innovation to help smaller firms establish and sustain thedistinctive competencies that enable them to assign sustainable prices and grow, both in profitability and employment.
9)
Key Macro Issue
Strategy
Product Innovation
Performance Improvement
Workforce Development
Advocacy/Education
SME - Large Firm�
�
For SMEs, business strategy, including the ability to assess new markets for products, new operating models, and opportunities for the business was determined.For large firms the implementation of strategy appears to be the issue.
Both large firms and SMEs need to continue to innovate their product lines to adjust to market forces, regulation, and growth expectations. Skills for product innovation appear to be critical, particularly funding, management, and technical skills.
SMEs appear to need a variety of internal performance improvement assistance activities. Continuous improvement from an operations perspective is critical for competition as the market changes sales and services.
Both large firms and SMEs need workers with the right combination of skills. Attracting, training, and retaining workers is often challenging. The problem is often exacerbated by negative perceptions about manufacturing as a career and/or about lifestyle in a particular region.
Large firms drive the regional economy. While they typically have the required scale to deal with issues that are internal to the firm, they are particularly vunerable to external issues such as public policy, insfrastructure, and labor markets — market forces that they adjust to through consolidation, relocation, and divestiture.SMEs tend to have diverse points-of-view and do not aggregate their potential public policy power into a single voice. Additionally, they desire education on opportunities for growth in chaning markets (off-shoring and globalization).
Importance by Firm Size
KEY MACRO ISSUES
Strategy, product innovation, performance improvement, workforce development and advocacy/education were macro issues recurring
consistently throughout the analysis.SME = Small Manufacturing Enterprise Low High
Source: Deloitte
RECOMMENDATIONSDeloitte also was challenged to assess the currentcapabilities of each IRC and to perform a gap analysisthat highlighted where the IRCs must develop new or more substantial capabilities, in order to carry their mission successfully into the 21st century. Theresults of this extensive analysis are summarized inthe chart below.
CONCLUSIONCOOPERATION FOR COMMONWEALTH
Manufacturing remains profoundly important to the Pennsylvania economy and the life chances of millions ofPennsylvanians. While some manufacturing industries continue a long-term decline, others are growing in output and employment in the commonwealth. Sixteen growth industries have concentrated even more in Pennsylvania during the past ten years. These industries deliver nearly half of the $64 billion that manufacturing contributes annually to the Pennsylvania gross state product.
As Pennsylvania economic developers serve all enterprises in the state, they should give special attention tothese sixteen driver industries and to the Pennsylvania manufacturers that supply them with key inputs.Enhancing these value chains will do the most to create wealth in the state. The present forces acting on andwithin Pennsylvania industries could produce several distinctly different futures for manufacturing.Pennsylvania has an opportunity now to support the strategic vigor and innovation of thousands of manufacturers and thereby assure the best possible future for the economy of the commonwealth.
The study summarized here was the most substantial analysis ever undertaken of the manufacturing endowmentof a state. It was conduced at a time when regions everywhere in the global economy have begun to discoverthat they must compete as surely as the enterprises they host. To prosper now, manufacturing regions must:
> understand deeply the capabilities and performance of the manufacturers located there.> analyze where smart services can provide advantages to viable manufacturers in the region.> develop, deliver and evolve those services for maximum impact on the region.
The analysis and recommendations offered here can give Pennsylvania a competitive advantage in the next few years, but only if Pennsylvanians cooperate. In the demanding global economy, public and private sectorleaders, enterprises with a common commitment to regional success and economic developers responsible forgrowing the commonwealth can, working together, create a more secure and rewarding future.
To read the complete, comprehensive report, visitwww.catalystconnection.org/bkh/report.htm.
P.O.Box 3066Business & Technology Resource Center2401 Reach Road, Suite 450Williamsport, PA 17701
Phone: 570.329.3200Fax: [email protected]