Embed Size (px)
Citation preview

1 | P a g e
Economic Advisory Council to the Prime Minister
Manufacturing,
Emerging
Industries,
Trade,
Technology,
Services and
Skill
Development

2 | P a g e
3 | P a g e
Contents
Acknowledgements ........................................................................................................................................ 7
List of Tables and Figures ............................................................................................................................... 9
List of Members of the Working Group ........................................................................................................ 11
List of Abbreviations .................................................................................................................................... 13
Executive Summary ...................................................................................................................................... 15
Chapter 1. Blue Trade .................................................................................................................................. 21
1.1 Blue Trade in Goods: Emerging Trends ....................................................................................... 21
1.2 Issues in Blue Trade ........................................................................................................................ 21
1.3 Broad Blue Trade Sectors .............................................................................................................. 23
1.4 Trends in Global Maritime Service Trade ................................................................................... 26
1.5 Marine Service Trade in India ....................................................................................................... 28
1.6 Opportunities and Challenges in Marine Services Trade ........................................................... 29
1.7 Recommendations ........................................................................................................................... 31
Chapter 2. Blue Investment .......................................................................................................................... 33
2.1 Sectoral Relevance .......................................................................................................................... 33
2.2 Domestic Blue Initiatives ................................................................................................................ 34
2.3 Global Experience ........................................................................................................................... 37
2.4 Recommendations ........................................................................................................................... 38
Chapter 3. Blue SMEs ................................................................................................................................... 41
3.1 Emerging Sectors ............................................................................................................................ 41
3.2 Opportunities and Challenges........................................................................................................ 42
3.3 Global Strategies ............................................................................................................................. 45
3.4 Recommendations ........................................................................................................................... 45
Chapter 4. Blue Technologies ....................................................................................................................... 47
4.1 Relevance of Technology in Blue Economy .................................................................................. 47
4.2 Existing Potential and Status in Different Sectors ....................................................................... 48
4.2.1 Fishing Industry ....................................................................................................................... 48
4.2.2 Marine natural products ......................................................................................................... 48
4.2.3 Multidimensional Seaweed biorefinery design ...................................................................... 49
4.2.4 Gas Hydrate exploration ......................................................................................................... 49
4 | P a g e
4.2.5 Placer Minerals ........................................................................................................................ 50
4.3 Recommendations ........................................................................................................................... 51
Chapter 5. Marine Manufacturing ................................................................................................................ 53
5.1 Traditional Sectors .......................................................................................................................... 53
5.1.1 Fisheries .................................................................................................................................... 53
5.1.2 Shipping and Port Facilities .................................................................................................... 56
5.2 Emerging Sectors ............................................................................................................................ 58
5.2.1 Aquaculture .............................................................................................................................. 58
5.2.2 Energy ....................................................................................................................................... 58
5.2.3 Biotechnology ........................................................................................................................... 59
5.2.4 Mineral Prospecting ................................................................................................................. 60
5.3 Prospects for India .......................................................................................................................... 62
5.4 Recommendations ........................................................................................................................... 63
Chapter 6. Skill Development and Employment ........................................................................................... 67
6.1 Overview .......................................................................................................................................... 67
6.2 Nature and Types of Jobs in Blue Economy ................................................................................. 67
6.3 Employment in Blue Economy Sectors ......................................................................................... 72
6.3.1 Marine Fisheries ....................................................................................................................... 72
6.3.2 Ports and Shipping ................................................................................................................... 74
6.3.3 Ocean Renewable Energy ........................................................................................................ 76
6.4 Recommendations ........................................................................................................................... 79
Chapter 7. Marine Services .......................................................................................................................... 81
7.1 Introduction ..................................................................................................................................... 81
7.2 Potential and Dynamics in Maritime Services Sectors ................................................................ 81
7.2.1 Ship Repair ............................................................................................................................... 82
7.2.2 Coastal Shipping ...................................................................................................................... 83
7.2.3 Port Services ............................................................................................................................. 85
7.2.4 Reception Facility ..................................................................................................................... 88
7.2.5 Seafarer Facilitation ................................................................................................................ 88
7.2.6 Pilotage ...................................................................................................................................... 88
7.2.7 Automation Traffic Control in the Maritime Sector ............................................................ 89
7.2.8 Logistics and Supply Chain Management ............................................................................. 89
5 | P a g e
7.2.9 Marine Finance and Insurance ............................................................................................... 90
7.2.10 Maritime Consultancy and Certification ............................................................................. 92
7.2.11 Maritime Personnel Services ................................................................................................. 92
7.2.12 Maritime Legal Services ........................................................................................................ 93
7.2.13 Marine Salvage Services ........................................................................................................ 94
7.2.14 Maritime Classification Services .......................................................................................... 95
7.2.15 Tourism and Recreation ........................................................................................................ 96
7.2.16 Public Administration ............................................................................................................ 96
7.3 Recommendations ........................................................................................................................... 97
References ................................................................................................................................................... 99

6 | P a g e
7 | P a g e
Acknowledgements The Economic Advisory Council to Prime Minister constituted seven working groups on
National Blue Economy and Sustainable Development Policy vide their memorandum dated 30th
August 2018. The Working Group 4 was constituted under my Chairmanship to prepare a report
on Manufacturing, Emerging Industries, Trade, technology, Services and Skill Development.
This Working Group consists of 11 Members and one Member Convener.
The report of this Working Group is the result of team-work and consultation with key
stakeholders.
Contributions to this report include all Members of the Working Group namely; Representatives
from Department of Science & Technology, Representatives from Department of Heavy
Industries, Representatives from Department of Commerce and Representatives from
Department of Financial Services.
The group benefitted immensely from the comments and inputs from other members of the
Working Group namely; Dr. Akhilesh Gupta, Head, SPLICE, Department of Science &
Technology, Dr. Nitya Nanda, Associate Director, The Energy & Resources Institute, Prof. Rupa
Chanda, Indian Institute of Management Ahmedabad, Dr. H. Purushotham, Chairman &
Managing Director, National Research Development Corporation, Dr. Satyaki Roy, Associate
Professor, Institute for Studies in Industrial Development (ISID), Dr. Bala Pisupati, Research and
Information System for Developing Countries (RIS), Ms. Madhura Roy, Deputy Director, Skill
Development & Women Entrepreneurship.
This Working Group extends its gratitude to Dr. S.K. Mohanty, Professor, Research and
Information System for Developing Countries (RIS) for putting together the material and
bringing out a concise, comprehensive and insightful document.
I also gracefully acknowledge the academic support of RIS for the preparation of the report. RIS
team comprises of Dr. Priyadarshi Dash, Assistant Professor, Ms. Pankhuri Gaur, Consultant and
Ms. Chandni Dawani, Research Assistant.
I especially thank Shri B.N. Satpathy, Senior Consultant, EAC to PM and Shri Suneet Mohan,
Assistant Consultant, EAC to PM for coordinating activities in bringing out this document.
My special gratitude to Shri Ratan P. Watal, Principal Adviser, NITI Aayog and Member
Secretary, EAC to PM for leading this initiative.
(Dr. Vishwapati Trivedi)
Chairman Blue Economy
Working Group- 4

8 | P a g e
9 | P a g e
List of Tables and Figures
List of Tables
Table 1: World Sea Transport Services Trade, 2013-17 ............................................................................. 27
Table 2: Sea Transport Services Trade in Coastal Economies ................................................................... 27
Table 3: Trade in Blue Economy Services, 2011-17 .................................................................................. 28
Table 4: Definitions of MSMEs .................................................................................................................. 43
Table 5. Placer Mineral Reserves in India .................................................................................................. 60
Table 6. Placer mineral annual production and its value in global market ................................................. 61
Table 7: Blue Economy Sectors to be prioritise in India ............................................................................ 62
Table 8: Type and Nature of Jobs in Blue Economy Sectors ..................................................................... 69
Table 9: Jobs Relying on Ecosystem Services (2014) ................................................................................ 71
Table 10: Dependence on Marine Fisheries in Coastal States of India ....................................................... 72
Table 11: Employment in Fisheries in Coastal States of India ................................................................... 73
Table 12: Employment in Major Ports in India .......................................................................................... 74
Table 13: Employment in Non-Major Ports in India .................................................................................. 75
Table 14: Port Labour Productivity (Output Per Gang Shift) (2016-17) .................................................... 78
Table 15: Estimated Additional Workforce Required in Solar and Wind Energy Sectors in India ............ 79
Table 16: Port Performance Indicators, 2016-17 ........................................................................................ 86
List of Figures
Figure 1: Proposed Solar Power Generation Capacity by 2020 ................................................................ 366
Figure 2: Overseas and Coastal Traffic at Indian Ports, 2016-17 ............. Error! Bookmark not defined.4
Figure 3: Cargo Handling Cost at Indian Ports ......................................... Error! Bookmark not defined.7

10 | P a g e
11 | P a g e
List of Members of the Working Group
1. Dr. Vishwapati Trivedi, Former Secretary to Govt of India… Chairman
2. Secretary, Department of Science & Technology, Ministry of Science and Technology
3. Secretary (HI), Department of Heavy Industries, Ministry of Heavy Industries and Public
Enterprises
4. Commerce Secretary, Department of Commerce, Ministry of Commerce and Industry
5. Secretary (FS), Department of Financial Services, Ministry of Finance
6. Dr. Nitya Nanda, Associate Director, The Energy and Resources Institute
7. Prof. S.K Mohanty, Research and Information System for Developing Countries (RIS)
8. Prof. Rupa Chanda, Economics & Social Sciences, Indian Institute of Management
9. Dr. H. Purushotham, Chairman & Managing Director, National Research Development
Corporation
10. Dr. Satyaki Roy, Associate Professor, Institute for Studies in Industrial Development
(ISID)
11. Dr. Bala Pisupati, Research and Information System for Developing Countries (RIS)
12. Ms. Madhura Roy, Deputy Director, Ministry of Skill Development
13. Shri B.N. Satpathy, Sr. Consultant (EAC-PM) … Nodal Officer
1

12 | P a g e
13 | P a g e
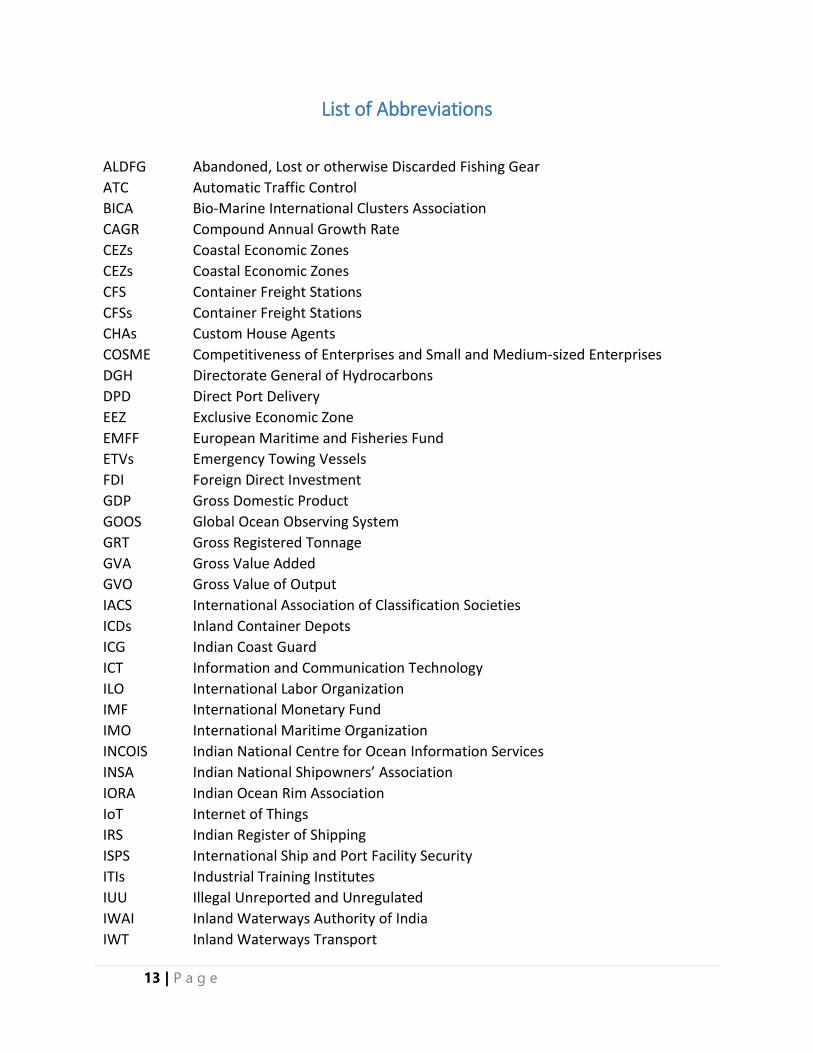
List of Abbreviations
ALDFG Abandoned, Lost or otherwise Discarded Fishing Gear
ATC Automatic Traffic Control
BICA Bio-Marine International Clusters Association
CAGR Compound Annual Growth Rate
CEZs Coastal Economic Zones
CEZs Coastal Economic Zones
CFS Container Freight Stations
CFSs Container Freight Stations
CHAs Custom House Agents
COSME Competitiveness of Enterprises and Small and Medium-sized Enterprises
DGH Directorate General of Hydrocarbons
DPD Direct Port Delivery
EEZ Exclusive Economic Zone
EMFF European Maritime and Fisheries Fund
ETVs Emergency Towing Vessels
FDI Foreign Direct Investment
GDP Gross Domestic Product
GOOS Global Ocean Observing System
GRT Gross Registered Tonnage
GVA Gross Value Added
GVO Gross Value of Output
IACS International Association of Classification Societies
ICDs Inland Container Depots
ICG Indian Coast Guard
ICT Information and Communication Technology
ILO International Labor Organization
IMF International Monetary Fund
IMO International Maritime Organization
INCOIS Indian National Centre for Ocean Information Services
INSA Indian National Shipowners’ Association
IORA Indian Ocean Rim Association
IoT Internet of Things
IRS Indian Register of Shipping
ISPS International Ship and Port Facility Security
ITIs Industrial Training Institutes
IUU Illegal Unreported and Unregulated
IWAI Inland Waterways Authority of India
IWT Inland Waterways Transport
14 | P a g e
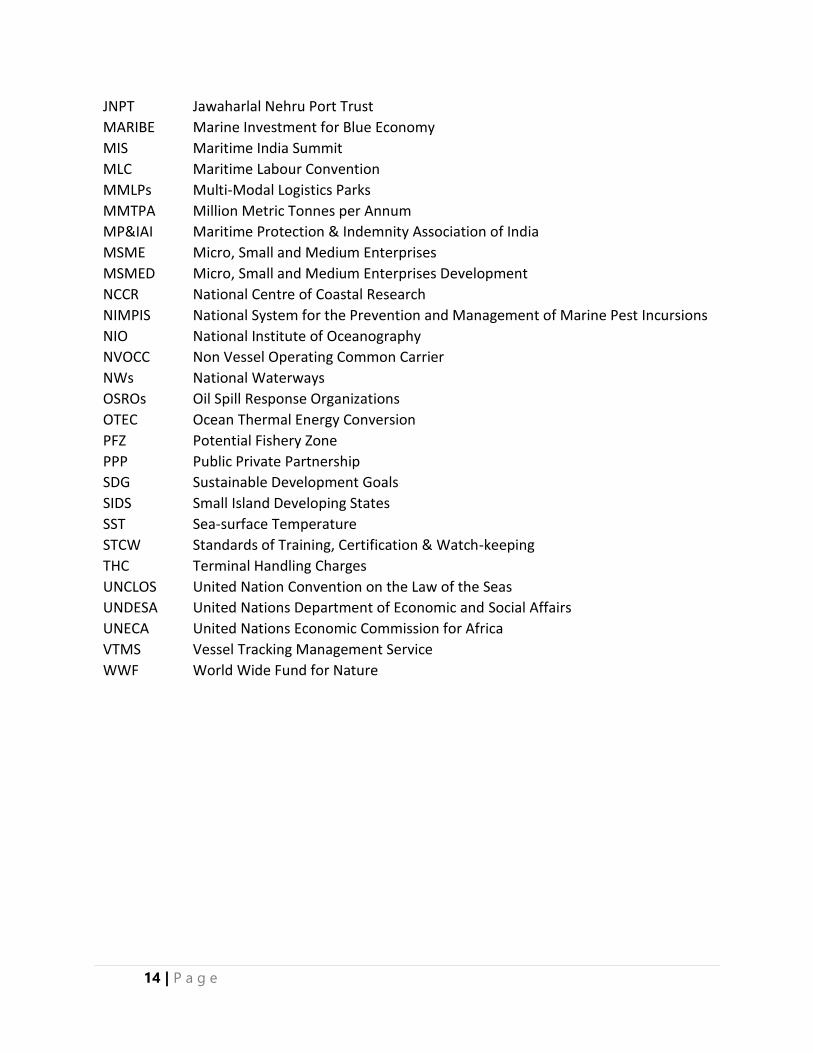
JNPT Jawaharlal Nehru Port Trust
MARIBE Marine Investment for Blue Economy
MIS Maritime India Summit
MLC Maritime Labour Convention
MMLPs Multi-Modal Logistics Parks
MMTPA Million Metric Tonnes per Annum
MP&IAI Maritime Protection & Indemnity Association of India
MSME Micro, Small and Medium Enterprises
MSMED Micro, Small and Medium Enterprises Development
NCCR National Centre of Coastal Research
NIMPIS National System for the Prevention and Management of Marine Pest Incursions
NIO National Institute of Oceanography
NVOCC Non Vessel Operating Common Carrier
NWs National Waterways
OSROs Oil Spill Response Organizations
OTEC Ocean Thermal Energy Conversion
PFZ Potential Fishery Zone
PPP Public Private Partnership
SDG Sustainable Development Goals
SIDS Small Island Developing States
SST Sea-surface Temperature
STCW Standards of Training, Certification & Watch-keeping
THC Terminal Handling Charges
UNCLOS United Nation Convention on the Law of the Seas
UNDESA United Nations Department of Economic and Social Affairs
UNECA United Nations Economic Commission for Africa
VTMS Vessel Tracking Management Service
WWF World Wide Fund for Nature
15 | P a g e
Executive Summary
The Blue Economy is an inter-disciplinary concept emerging as an alternative development
paradigm. And there is yet to be a universally agreed definition of Blue Economy. It is also
important that each country defines Blue Economy and its specific relevant aspects in its own
context. A working definition of the Blue Economy as relevant for India can be as follows.
“The Blue Economy refers to exploring and optimizing the potential of the oceans
and seas which are under India’s legal jurisdiction for socio-economic development
while preserving the health of the oceans. The Blue Economy links production and
consumption to capacity and envisages an integrated approach to economic
development and environmental sustainability. It covers both the marine that is
offshore resources as well as the coastal that is onshore resources and involves:-
(i) A framework for proper measurement of Blue Economy activities and their
contribution to the national income;
(ii) Spatially oriented planning along with scientific assessment of resources and their
replenishment;
(iii) Investment in financial capital, physical capital, natural capital and human capital
to harness the potential of the Blue Economy;
(iv) Innovation to ensure zero waste, low carbon technologies that yield economic
dividend for large sections of the population.”
The current report highlights potential of the Blue Economy sector in Indian Economy while
using the above definition. It underlines that a well-integrated policy to develop Blue Economy
in India would have a very promising future. The governments at the central and at the state level
have embarked upon with many programmes to leverage the untapped potential of the sector.
Sagarmala Project of the Ministry of Shipping is one such a gigantic effort in this direction.
Marine and offshore mineral resources are considered as new sources of economic growth in the
country. Blue Economy encompasses multiple sectors and all types of economic activities—
primary, secondary and tertiary with varying levels of technological applications, capital
requirements, skill development, trade prospects, and so on. Investments and explorations in the
state-of-the-art technologies in Blue Economy and in marine resource management can broaden
frontiers of marine manufacturing sector and would boost trade in marine goods, minerals and
services.
India’s participation in global trade of marine goods and services has improved considerably
regardless of the annual fluctuations in export proceeds and trade balance. Global trade in marine
services, particularly, sea transport services rebounded in 2017 after registering a steady decline
during 2014-16; in this, exports of sea transport services had declined sharper than imports.
Among sub-sectors, sea-transport freight registered the sharpest decline in both exports and
16 | P a g e
imports. Barring the Philippines and Bangladesh, India is one of the leading trading nations in
global trade in blue services. While it seems that India’s payments are apparently higher than
receipts on different blue services, still the overall balance of payment position on account of
blue services cannot be conclusively assessed owing to insufficient data.
Among services sectors, ship repair, marine finance and insurance, marine ICT, coastal tourism
and port services can unleash a huge potential for investments and job-creation under an
integrated policy to develop and harness potential of Blue Economy. As an example to be more
specific, with a robust infrastructure and timely supply of parts and components, the ship repair
sector in India can be improved to be beneficial. With India’s strategic location in the Indian
Ocean, an efficient well-geared ship repair facility closer to the international shipping routes can
attract foreign ships and vessel calling on the Indian ports as well as those passing through the
vicinity of the Indian waters. With the progressive implementation of the policies and the
initiatives on the Blue Economy, demand for the world-class port services can be developed. For
global competitiveness, there is a need for creating competition among ports and building in port
specialization.
With a fast pick-up in awareness about business and investment opportunities in the country,
there would be demand for loans and other financial services for marine and other related
sectors. A strong and a deep market for supporting and satiating demand for finance and
financial services is the need of the hour. In addition to the traditional financial products, the
opportunity for financing new technology development projects for harnessing ocean energy
sources and deep-sea exploration may require substantial funding and commercialization support
from traditional sources of finance and venture capitalists. Applications of artificial intelligence,
internet of things, big data analytics, block-chain and related technologies may trigger growth of
marine ICT in India.
Investment is the crucial determinant of the future of Blue Economy in India. Blue investments
are primarily needed in the form of R&D and technology development, manufacturing, and for
the development of necessary infrastructure. For living resources, there are immense investment
opportunities for seafood production, aquaculture, trade in fish products, fishing-net and gear-
making, ice production and supply, boat construction and maintenance, fish-processing
equipment, packaging, marketing and distribution. Investments in marine living resources can be
aptly used in production of pharmaceutical products and for chemical applications. Likewise,
desalination, extraction of minerals and oil and gas, renewable energy sources (wind, wave, and
tidal energy), transport and trade (shipping, ship building and breaking, maritime transport, port
infrastructure and related services), tourism and recreation (tourism and coastal
development/urbanisation) are green-field areas for investments in non-living resources.
The major sectors with strong investment prospects are shipping, including capacity expansion
of vessels, ship-building, repairing and breaking, coastal shipping, ship chartering and ship
brokerage services, warehousing, freight forwarding, bunkering and storage facilities, developing
dedicated coastal shipping, and dedicated coastal berths management. But, investments in Blue
17 | P a g e
Economy sectors involve many unknown risks as more than 80 per cent of the oceans stay
unmapped, unobserved and unexplored. This sector also requires comprehensive assessment of
the associated environmental, social and governance risks and adoption of suitable risk-
management strategies. Dedicated regulation and enforcement regimes across the exclusive
economic zones (EEZs) and innovative financing models, e.g. blue bonds, would be desirable for
providing congenial environment for the growth of the Blue Economy.
The Government of India has set out a vision for promotion of Blue Economy. Some of the
major initiatives in this endeavour include the Sagarmala project, SAGAR, Blue Revolution and
Development of Coastal Economic Zones (CEZs). Sagarmala aims at port-led industrialization
and development with massive investment plans for port modernization, development of
industrial corridors and strengthening of regional value- chains. Likewise, SAGAR envisages a
secure maritime space for achieving sustainable development in the country. The 13 identified
Coastal Economic Zones can be a game changer for synergistic growth of Blue Economy.
Foreign Direct Investment (FDI) through the automatic route has been permitted in Blue
Economy-related sectors such as mining and petroleum and natural gas, industrial parks, duty-
free shops and railway infrastructure. Smart Industrial Port Cities, Dedicated Freight Corridor
(Eastern and Western), construction of inland ports and inland water transport projects are other
sunrise sectors for investment.
At the regional level, IORA and ASEAN are two important regional organizations for fostering
international cooperation. ASEAN would facilitate maritime transport, promotion of coastal
shipping services, investment in marine ICT, research and innovation in marine biotechnology,
greater access to sea-bed resources, proper integration of coastal tourism and other services,
renewable energy, coastal management and marine resource conservation. African countries
have also prioritized Blue Economy as a prospective sector of economic diversification and
employment generation in the Agenda 2063. In Europe, the European Commission has funded
MARIBE (Marine Investment for Blue Economy) to explore cooperation opportunities for
companies to invest in blue biotechnology, aquaculture, seabed mining, ocean energy and coastal
tourism. Further, the European Maritime and Fisheries’ Fund has boosted EC’s maritime
priorities, and has helped pilot the Blue Growth strategy.
The Micro, Small and Medium Enterprises (MSME) in Blue Economy sectors offer immense
potential for industrial growth in the country. Countries and international blocs are making
efforts to rope MSMEs into the Blue Economy ecosystem. The Nairobi Statement of Intent on
Advancing the Global Sustainable Blue Economy 2018 supports growth of SMEs for building a
sustainable Blue Economy. In 2015, the IORA Jakarta Declaration on Blue Economy reiterated
importance of promoting entrepreneurship, innovation and SMEs with a special focus on
promoting youth and women’s engagement in the sustainable development of Blue Economy. To
promote MSME sector, the initiatives like Innovation Union, provision of funds through the
European Maritime and Fisheries Fund (EMFF), Competitiveness of Enterprises and Small and
18 | P a g e
Medium-sized Enterprises (COSME) programme, Horizon 2020 and the SME Instrument would
be important catalysts.
Marine manufacturing is a relatively untapped field of Blue Economy. It covers a range of
activities such as ship building, development of marine compounds and drugs, manufacturing of
equipment and instrumentation, exploration equipments for deep-sea mining, net making, boat
making, and fish processing and aquaculture equipments. While marine manufacturing industries
are potentially high-growth sectors, they would inflict several environmental challenges.
For expanding Blue Economy, India needs to focus on the sustainable development of the coastal
areas where most of the blue MSMEs are localized. However, MSME sector faces some of the
following challenges — poor access to finance, technology and skills. Lack of information and
knowledge about Blue Economy is also a core reason behind negligence of this sector in overall
economy. In the marine products segments, MSMEs grapple with problems of identification of
new sources of marine bio-products, development of new screening, optimization of production,
sustainable supply and recovery of bio-products. Public private partnerships (PPPs) in Blue
Economy sectors, like shipyard development and fisheries, definitely offer major opportunities
for the growth of MSMEs.
The success of Blue Economy is organically linked to technology and innovation. Proper
scientific knowledge and mapping of marine resources and development of technologies for
commercialization of industrial applications of those resources would determine contribution of
the Blue Economy to national income. Along with the technologies for efficient economic use of
marine resources, the capacity to curb greenhouse gas emissions by the environment-friendly
technologies would play a crucial role in monitoring and conserving ocean resources. For the
measurement of the ocean asset-base, the techniques like Acoustics, Optics and Radar are used
for bathymetry to get data and potential of different sources from the oceans. Other technologies
like Remotely Operated Underwater Vehicles, Satellite Oceanography, GIS, SONAR and
Animal Telemetry would help in mapping ocean resources. Desalination technology and Ocean
Thermal Energy Conversion (OTEC) would benefit in harnessing simultaneously energy and
freshwater production. Digitisation in marine sector by enhancing efficiency of transit with
technologies, like blockchain, Internet of Things (IoT) is vital. Marine-based products, gas
hydrate-based technology for various applications, including gas recovery, sequestration, water
purification etc., are under R&D worldwide. With huge deposits of placer minerals, India has
ventured into a systematic approach in exploring with new deposits and improved mining
procedures. In line with many years of technical advancements, India has developed appropriate
capability to technologically support Indian Ocean Rim Countries for such offshore mineral
exploration and exploitation in an eco-friendly and economically feasible framework. In India,
coastal states such as Andhra Pradesh, Kerala, Maharashtra, Odisha and Tamil Nadu have rich
placer deposits in beaches and offshore regions.
Employment generation in Blue Economy is the most attractive public policy attraction for
countries like India with abundant young workforce. Some of the potential high-employment
19 | P a g e
sectors in the sector are fisheries, port and shipping, marine biotechnology, renewable ocean
energy, deep-sea mining, coastal tourism and marine services. Along with the domestic
expansion of Blue Economy, the greater market access for exports and scope for value addition
would contribute indirectly to the competition-induced catch- up of local labour force to global
standards. In absolute terms, the fishing sector in India employs significantly larger number of
people; and female-labour participation in fishing-related activities is much more than the male-
labour participation.
In summing up, a well-coordinated and focused ‘Blue Revolution’ programme can transform not
just the traditional sectors such as fishing, but also can open up several new sub-sectors with the
use of technology and frontline financial innovative methodologies.. This would also have a
higher employment and income multiplier effect on both the coastal areas and the hinterland.

20 | P a g e
21 | P a g e
Chapter 1. Blue Trade
1.1 Blue Trade in Goods: Emerging Trends
Blue Economy is becoming the main stay of many littoral countries, and Blue Trade is likely to
be the growth driver for many of them. Norway and others countries have large exports, mostly
steaming from marine sector. Blue trade has not been that intensely discussed as the accounting
framework issues of Blue Economy in the literature. Several studies have indicated sectoral
performance of blue trade, such as fishery, transport, coastal tourism, hotels and restaurants,
shipping, etc. which are part of the Blue Economy sector. There is hardly any study that has
examined the entire spectrum of Blue Trade in a stylised framework of Blue Economy. In
Denmark (Danish Government, 2006; 2010), there are certain estimates of Blue Trade sectors,
covering direct and indirect exports of the country. Still, the study covers only those trade sectors
which are considered established trade sectors of Blue Economy. But this report presents a
framework for Blue Trade in India.
1.2 Issues in Blue Trade
Blue Trade is unevenly spread in the entire range of tradable sectors. Since trade sector is more
disaggregated than economic activity sectors, identification of products (Based on HS) in Blue
Trade is somewhat more convenient than identification of industries under economic activity
sectors (ISIC). International comparison of Blue Trade is more tenable than Blue Economy
sectors as HS codes are more disaggregated than ISIC industries.
Expansion of economic activity and trade codes favours the latter since it is more thinly sliced
than the other. Despite having relatively easy solution to identify Blue Trade product codes over
activities, there is very little work done globally in this sector. In Blue Economy, certain sectors
are linked traditionally to ocean, and such sectors are often identified in the literature as fishery,
transport, coastal tourism, etc. These established sectors have been operating since last several
centuries, but sustainability and growth dynamism are the main issues (EU, 2018). There are
several emerging sectors, which are gradually coming up with considerable growth prospects and
also confirming with environmental sustainability issues.
The Blue Trade is different from the normal trade because of the geographical factor and other
intricacies. Blue Trade may loosely be expressed as one which is directly or indirectly liked with
incoming/outgoing resources or activities from/to ocean or water -bodies. Thus Blue Trade
covers both trade in goods and services together. Like the System of National Accounts (SNA),
UN, normal trade follows same pattern where trade in goods and trade in services (TIS) is
presented separately to show contribution of the external sector to the GDP of the country. In the
literature, Blue Economy has its own classification of sectors such as living, non-living sectors,
etc. among others, which are somewhat unconventional than other classifications like production,
22 | P a g e
trade, end-use, etc. Moreover, in each of the defined sector of the Blue Economy, all activities
within the sector, including goods and services, are taken together.
Activity and location of the occurrence are necessary and sufficient conditions to designate an
activity as part of the Blue Economy in the literature. It is not just customary to emphasize on
linkage of the products directly to oceans, which is necessary to be labelled as part of the Blue
Economy, but it also cover those products which are indirectly associated with oceans. While
choosing products under the Blue Trade, the land-based and ocean-based industries are
categorically discussed. The reason is that the nature of production function would differ
significantly for land and water for a given ocean-cased industry. This would lead to variations in
cost prices of the product originating from two production bases. Production function of
hydrocarbon from land and ocean would differ significantly. Moreover, possibility of the spread
of environmental pollution can be more acute in water than on land, and therefore, environmental
regulations would need to be more stringent in water than land-based operations. In a way,
coverage of products in Blue Trade would have- some linkages with the ocean or waterbodies.
Many sectors conventionally part of the Blue Trade are fisheries, coastal minerals, shipping,
port, coastal tourism, etc. and hence, products falling within them are part of the Blue Trade.
While certain other products, which are contributing to Blue Trade sectors, should be taken
partly in estimating contribution of the product to Blue Trade. Therefore, product weights may
be used to account for partial contribution of the product to Blue Trade. For example, beach
placer is part of the Blue Trade but not desert placers. Hydrocarbon coming from offshore can be
part of Blue Trade, but not from the land. Similarly, several sectors and products exist in Indian
economy where part of these products can be part of the Blue Trade. Apportioning of a product
has to be undertaken on the basis of its contribution to Blue Trade by assigning appropriate
weights to products. Therefore, difficulty arises while assigning weight to tradable products,
which are partly linked to Blue Trade.
Experiences of countries indicate that Blue Economy is the fastest growing segment of a littoral
country (Mohanty, Dash, Gupta and Gaur, 2015). During the last 40 years, international trade has
grown much faster than the global output (Dean and Sebastia-Barriel, 2004; Mohanty and Saha,
2019). In a similar vein, Blue Trade is likely to dominate the global trade scene in future, if not
so far. Contrary to the conventional view, Blue Trade exists in almost all trade sectors and sub-
sectors, including goods and services. Since the global economy has not concluded in mapping
the coverage of ocean-related economic activities, estimation of Blue Trade would continue to
remain underestimated. There are several industries contributing directly or indirectly to trade
activities, which are yet to be in the framework of Blue Trade. However, known sources of trade
activities in the sector are many, and several spotty evidences linked to Blue Trade have been
discussed in the literature. Some sectors are rather better known than others, and reorganisation
of such evidences can form a framework for estimating contribution of Blue Trade in India.
23 | P a g e
1.3 Broad Blue Trade Sectors
For a large number of products, place of production and place of consumption are linked through
trade. The worth of marine products is growing faster as the local market for these products is
gradually expanding to the global market through trade. In the absence of international trade,
several countries of the world would have been deprived of products in the form of consumption.
The trade holds the key for setting the stage for economic growth for new product innovation for
trade, generation of a modern entrepreneurial class, export diversification, employment
generation and fresh investment.
One of the most important sectors under the Blue Trade is aquatic animals and plants which are
in the agricultural sector. Fishery sector is the most dominant segment of the global food trade.
Growth rate of fishery trade is very high and intra-regional trade in finfish and shellfish has been
very strong in Asia, including India (Mohanty, Dash and Gaur, 2019). In the fishery sector,
robust trade has been shown by seafood, but trade in aquatic products and seaweeds is gaining
momentum (Ferdouse et al., 2018). India has been a major player in the global production and
trade in fisheries. Rising demand for fishery products, particularly processed fish, is due to
enhanced demand for such products across the developing and the developed countries, growing
preference for consumption of fish on health grounds, shortage of wild fish as the result of
depletion of species, freezing technology, fish preparation, improved control in harvesting
process and transportation break-through, etc. among many factors (UNCTAD, 2014).
Fishery trade is emerging as one of the most valuable non-hydrocarbon sector traded globally
(Potts et al., 2014). Since trade in wild fish is declining owing to slowing down of catch, it is
being increasingly replaced by fish from aquaculture (Asche and Khatun, 2006; Asche and
Smith, 2010; Hughes et al., 2016). As Aquaculture is the largest contributor to global supply of
seafood, it is likely to bridge protein gap by 2020 (Bush et al., 2013). Global demand for fish
consumption is specific to certain species, and only countries specialised in the production and
export of those products, would benefit from global trade. It is empirically examined that as
many as 1471 fishery species are traded globally, but ten top species account for 36 per cent of
the global trade in this sector (Wabnitz et al., 2003). Global trade in fishery sector is picking up
in the processed food sector where specialisation in body parts, refrigeration system, quality of
preparation and packaging and species type matter in accessing global fish market (Mohanty,
Dash and Gaur, 2019). Fishery has a large number of sectors where several products are traded,
and some of them are – fishery catch, aquatic products, seafood, hatcheries, retail and wholesale
trade of seafood, etc. Living resources sector covers both goods and services in the Blue Trade.
Imprints of Blue Trade are very much felt in the mining sector. In the context of Blue Economy,
placer minerals are important for both domestic consumption and for foreign trade. Placers are
found from deposits of sand or gravel in the river bed, streams, lake and sea coast, and they are
valuable minerals. It is observed that stream and beach placers are important sources of placer
deposits in India. In the coastal region, sea wave plays an important role in shifting materials
through shore currents; and thus heavy metals get concentrated at the shore. India is a leading
24 | P a g e
country in the production and trade in placer and placer-related products along with a few others,
including Australia, Brazil, the US, etc. India is presently exporting and importing several placer
metals and placer-related products.
Minerals are sub-divided into metals and non-metals. Metals are further classified into
radioactive and non-radioactive products. Some metals are radioactive (i.e., uranium, thorium,
Ilmenite, Rutile, Monazite, etc.) and others are non-radioactive (Hematite, Magnetite, Tin,
Platinum, gold, etc.). Among non-metal marine minerals, some of them are linked to marine
chemicals and some are non-chemicals, like sand and gravels. Moreover, marine minerals can be
classified into several groups on the basis of unique properties such as electronic, optical and
magnetic characteristics of these metals.
Placer minerals have a large market in India, and its potential is of about INR 900 billion lately.
Such materials are exceptionally useful for enhancing manufacturing base in India, particularly
becoming important in the context of Make in India Initiative and Industry 4.0. India had
initiated significant liberalisation in the mineral sector in 1998, but the reform process was
reversed in 2006. Mining of such minerals in India is undertaken primarily with two public
sector companies— Indian Rare Earth (IRE) and Kerala Minerals and Metal Limited (KMML),
operating under Department of Atomic Energy. Extraction of radioactive-placer is a capital-
intensive venture. The sector in India can absorb a capital investment of INR 1,200 billion and
has export potential of INR 500 billion in a year. Since China has the largest holding of rare
earth minerals compared to India, the latter needs to focus more on creation of value -added
products using placer metals for exports. As the basic raw material is markedly available within
the country compared to many other countries in the world, India has a strategic advantage in the
area of coastal placer.
India has evolved advance technology in desalination of water from sea. Ministry of Earth
Sciences, National Research Development Corporation (NRDC) and several public and private
sector companies have developed a low- cost technology in the sector. This has been effective in
dealing with water scarcity in coastal regions and small islands. Many such technologies are
experimented in Lakshadweep and have been found successful and also cost -effective. This
sector has large potential for Blue exports.
Demand for offshore renewable trade is growing fast because of depleting reserves of fossil fuel
in the world. Among known offshore energy sources of production, wind energy is leading,
expanding almost at the rate of 40 per cent per annum (UNCTAD, 2014). At present, commercial
production of alternative source of offshore energy is low, and is focused mostly on algae biofuel
(Halvorson et al., 2001). In 2013, annual production of algae biofuel was 3 million gallon and
this expected to reach 61 million gallon per annum by 2020. In terms of value such biodiesel
from algae would be $1.3 billion (UNCTAD, 2014). Among many other characteristics of
biodiesel, it has the capacity to reduce CO2 emission. There is a large potential of trade in new
products in areas like high-valued bio-products in medicine, food and in the cosmetic industry,
using microalgae (Commonwealth, 2016).
25 | P a g e
Marine manufacturing covers wide range of industries classified into established and emerging
industries, producing a large number of products. These products directly or indirectly are
associated with ocean-related manufacturing activities. As experiments with the ocean and its
resources are relatively recent phenomenon, several new industries and activities are coming up.
In some of the existing cases, proper mapping of industries and their marine-linked products
have not been properly identified. Gradually many such actives have unveiled and therefore, they
are being consistently added to the inventory of Blue Trade. Because of this trend, Blue Trade
would continue to be underestimated, until all activities under this sector are identified fully and
accounted for estimation.
A designate taskforce may be formed to examine the sectors and activities under Blue Trade,
including the manufacturing sector. Manufacturing sector is a major contributor to Blue Trade.
Deep-sea capture fishing, hatchery, aquaria products, and processed fish products are part of the
manufacturing Blue Trade. Biotechnology products from biopharma, food additives, cosmetics
and bio-fuel, are included in the manufacturing sector. Offshore petroleum and gas from shallow
water and services for maintaining production site are also important. Building of merchant and
military ships, boats, dredging equipments, fishing ships/boast, trawler, spare parts and repair
services are associated with ocean, and domestic waterways are also covered under the sector.
Activities involved in shipbreaking industry is also fragment of the sector. Sea cabling and its
servicing have merged as import for the trade sector. Ice-making, rope, net, gear, marine
equipments, etc. are also traded internationally. There are other products which can be part of
blue trade.
Various sectors under Blue Trade require special treatment because they are different from the
normal trade. For example, fishery sector is a growing sector in global food trade. Fishery sector
is outside the purview of WTO agricultural trade negotiation. Most of the countries have adopted
protected trade regime for the fish sector. The sector faces stringent Non-Tariff Barriers (NTBs),
mostly in the form of SPS and TBT measures. Fishery sector is subject to subsidy reduction for
conservation and sustainable fisheries. It has not only implications for fishery trade but also on
industrial fishing as well as production/trade of fishing vessels.
Similarly species trade in biodiversity is often restricted taking into account conservation
measures. In many cases, entire plants or animals are not traded; they are rather done partially.
Trade in this sector is limited to leaves, roots, steams, bark, seeds, flower, and body parts of
plants as well as animals. While undertaking trade, exporters have to pass through stringent
regulatory processes. In many cases, trade is allowed for specific purposes only. Certain
medicinal varieties of rice, wheat, fish, etc. are allowed to be exported for edible purpose and not
for research. Several biodiversity species like sponge, coral, algae, fish, cereals, etc. fall in this
category. From the point of trade, several products under Blue Trade are subject to more
stringent regulations than the normal trade.
The multilateral trade regime is mostly opposed to use of subsidy in trade. The practice of
providing subsidy brings distortion to global trade, and contrary to the principle of laissez faire.
26 | P a g e
Restriction on subsidy to the agricultural sector is regulated by special Article on Agreement on
Agriculture (AoA). Similarly, fishery subsidy is a major issue in WTO, falling under Non-
Agriculture Market Access (NAMA). Such provisions on the use of subsidy are also applicable
to manufacturing sector. However, this principle is not uniformly applied to all tradable sectors.
Shipbuilding sector is not subject to subsidy commitments under the WTO. Domestic
governments can give production subsidy to the sector without any capping. For this reason, the
sector is thriving in China, Japan and South Korea, and only because of patronage by the state
through subsidy, even when the sector is passing through the phase of global recession.
Blue Trade is likely to be the most dynamic sector in the overall trade sector of the littoral
economies. In India, some attempts have been made to discuss about the framework of
estimating contribution of Blue Economy to GDP, but more discussions are required to create a
framework for Blue Trade (Mohanty, 2018). However, the sector has huge trade prospects as
complete potential of the sector is yet to be tapped. Global trade barriers are too much stringent
for products of Blue Trade. To overcome the constraints related to market access for Blue Trade
products, technology related solutions are to be evolved. Innovations, technology, product
development and quality of products would pave the way for rapid expansion in Blue Trade.
Trade in Services has a great potential in India, particularly in the Blue Trade sector.
1.4 Trends in Global Maritime Service Trade
Like marine goods, trade in marine services can help expand the frontiers of activity in blue
economy. Currently, little knowledge exists on exports and imports in marine services globally
except some coastal nations for which some statistics for certain sectors are available. For India,
there is no such systematic account of exports and imports in marine services even though data
for a few sectors are presented separately by concerned ministries or departments. While all
sectors of marine services are not tradable, a number of sectors including coastal tourism, sea
transport, marine finance and insurance, shipping services including freight operations, ship
repair and other port services may unleash huge prospects for trade expansion. Moreover, as the
contribution of services to gross domestic product in India is growing, the demand for marine
services would also get a boost along with overall spurt in blue economy activities.
Given data limitations, it is difficult to properly assess the trends in global exports and imports of
marine services. Based on standard Global Database on trade in marine services (IMF), it is clear
that data on trade are available for only four services (including both broad and sub-sectors).
This includes sea transport and three of its sub-sectors such as sea transport freight, sea transport
passenger, and sea transport other. Global exports and imports of all the four marine services
have registered steady decline during 2014-16; more specifically in 2015 and 2016. In particular,
sea transport exports dropped by around 11.5 per cent in these two years whereas imports of sea
transport services decreased by around 9 per cent. Among the sub-sectors, both exports and
imports of sea transport freight registered the sharpest decline. However, this trend was reversed
in 2017 with modest rise in exports and imports of all the four services (Table 1).
27 | P a g e
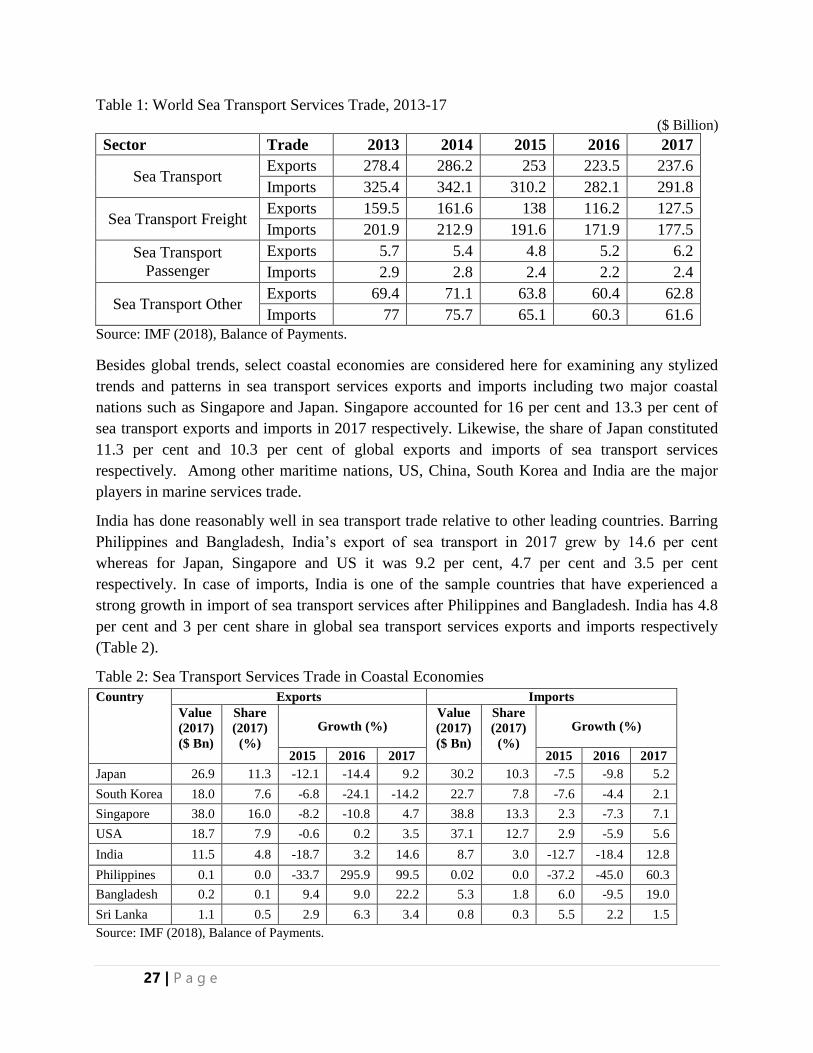
Table 1: World Sea Transport Services Trade, 2013-17
($ Billion)
Sector Trade 2013 2014 2015 2016 2017
Sea Transport Exports 278.4 286.2 253 223.5 237.6
Imports 325.4 342.1 310.2 282.1 291.8
Sea Transport Freight Exports 159.5 161.6 138 116.2 127.5
Imports 201.9 212.9 191.6 171.9 177.5
Sea Transport
Passenger
Exports 5.7 5.4 4.8 5.2 6.2
Imports 2.9 2.8 2.4 2.2 2.4
Sea Transport Other Exports 69.4 71.1 63.8 60.4 62.8
Imports 77 75.7 65.1 60.3 61.6
Source: IMF (2018), Balance of Payments.
Besides global trends, select coastal economies are considered here for examining any stylized
trends and patterns in sea transport services exports and imports including two major coastal
nations such as Singapore and Japan. Singapore accounted for 16 per cent and 13.3 per cent of
sea transport exports and imports in 2017 respectively. Likewise, the share of Japan constituted
11.3 per cent and 10.3 per cent of global exports and imports of sea transport services
respectively. Among other maritime nations, US, China, South Korea and India are the major
players in marine services trade.
India has done reasonably well in sea transport trade relative to other leading countries. Barring
Philippines and Bangladesh, India’s export of sea transport in 2017 grew by 14.6 per cent
whereas for Japan, Singapore and US it was 9.2 per cent, 4.7 per cent and 3.5 per cent
respectively. In case of imports, India is one of the sample countries that have experienced a
strong growth in import of sea transport services after Philippines and Bangladesh. India has 4.8
per cent and 3 per cent share in global sea transport services exports and imports respectively
(Table 2).
Table 2: Sea Transport Services Trade in Coastal Economies
Country Exports Imports
Value
(2017)
($ Bn)
Share
(2017)
(%)
Growth (%) Value
(2017)
($ Bn)
Share
(2017)
(%)
Growth (%)
2015 2016 2017 2015 2016 2017
Japan 26.9 11.3 -12.1 -14.4 9.2 30.2 10.3 -7.5 -9.8 5.2
South Korea 18.0 7.6 -6.8 -24.1 -14.2 22.7 7.8 -7.6 -4.4 2.1
Singapore 38.0 16.0 -8.2 -10.8 4.7 38.8 13.3 2.3 -7.3 7.1
USA 18.7 7.9 -0.6 0.2 3.5 37.1 12.7 2.9 -5.9 5.6
India 11.5 4.8 -18.7 3.2 14.6 8.7 3.0 -12.7 -18.4 12.8
Philippines 0.1 0.0 -33.7 295.9 99.5 0.02 0.0 -37.2 -45.0 60.3
Bangladesh 0.2 0.1 9.4 9.0 22.2 5.3 1.8 6.0 -9.5 19.0
Sri Lanka 1.1 0.5 2.9 6.3 3.4 0.8 0.3 5.5 2.2 1.5
Source: IMF (2018), Balance of Payments.
28 | P a g e
1.5 Marine Service Trade in India
Blue economy covers a diverse set of maritime services (also mentioned as blue services) with
huge potential for growth and job creation. The size of different sectors and sub-sectors of blue
services vary across the coastal nations. Based on available data, it is clear that India’s trade in
blue services is growing over the years. However, the complete picture of the evolving trends
and patterns in blue services trade is hard to present at this stage due to lack of comprehensive
data. It is worth noting that some services have shown substantial activity in exports and imports
in the recent years.
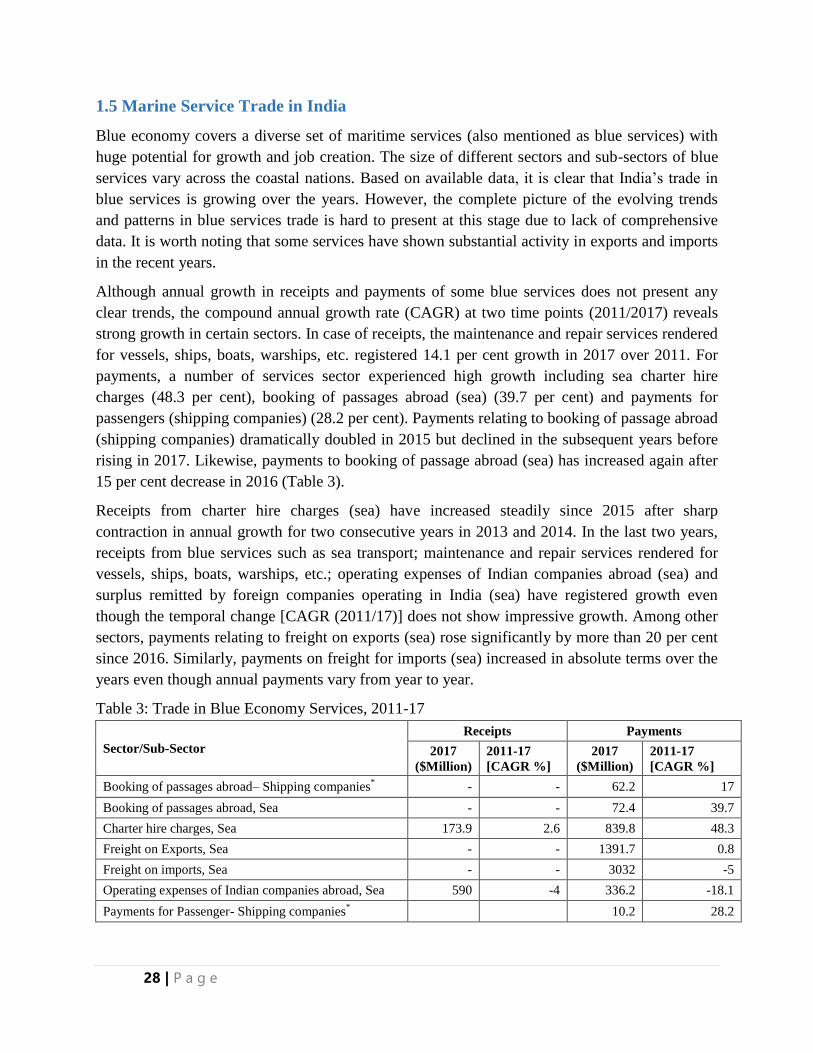
Although annual growth in receipts and payments of some blue services does not present any
clear trends, the compound annual growth rate (CAGR) at two time points (2011/2017) reveals
strong growth in certain sectors. In case of receipts, the maintenance and repair services rendered
for vessels, ships, boats, warships, etc. registered 14.1 per cent growth in 2017 over 2011. For
payments, a number of services sector experienced high growth including sea charter hire
charges (48.3 per cent), booking of passages abroad (sea) (39.7 per cent) and payments for
passengers (shipping companies) (28.2 per cent). Payments relating to booking of passage abroad
(shipping companies) dramatically doubled in 2015 but declined in the subsequent years before
rising in 2017. Likewise, payments to booking of passage abroad (sea) has increased again after
15 per cent decrease in 2016 (Table 3).
Receipts from charter hire charges (sea) have increased steadily since 2015 after sharp
contraction in annual growth for two consecutive years in 2013 and 2014. In the last two years,
receipts from blue services such as sea transport; maintenance and repair services rendered for
vessels, ships, boats, warships, etc.; operating expenses of Indian companies abroad (sea) and
surplus remitted by foreign companies operating in India (sea) have registered growth even
though the temporal change [CAGR (2011/17)] does not show impressive growth. Among other
sectors, payments relating to freight on exports (sea) rose significantly by more than 20 per cent
since 2016. Similarly, payments on freight for imports (sea) increased in absolute terms over the
years even though annual payments vary from year to year.
Table 3: Trade in Blue Economy Services, 2011-17
Sector/Sub-Sector
Receipts Payments
2017
($Million)
2011-17
[CAGR %]
2017
($Million)
2011-17
[CAGR %]
Booking of passages abroad– Shipping companies* - - 62.2 17
Booking of passages abroad, Sea - - 72.4 39.7
Charter hire charges, Sea 173.9 2.6 839.8 48.3
Freight on Exports, Sea - - 1391.7 0.8
Freight on imports, Sea - - 3032 -5
Operating expenses of Indian companies abroad, Sea 590 -4 336.2 -18.1
Payments for Passenger- Shipping companies* 10.2 28.2
29 | P a g e
Receipts on account of maintenance and repair services
rendered for Vessels, Ships, Boats, Warships, etc.®
176.5 14.1 42.5 -22.6
Sea Transport 1419.6 -2.3 8197.8 -3
Surplus remitted by Foreign companies operating in
India, Sea 655.7 -1.8 2525.8 -3.7
Source: RBI (Various Issues).
Note: ‘*’ & ‘®’ denote 2013-17 and 2012-17 respectively.
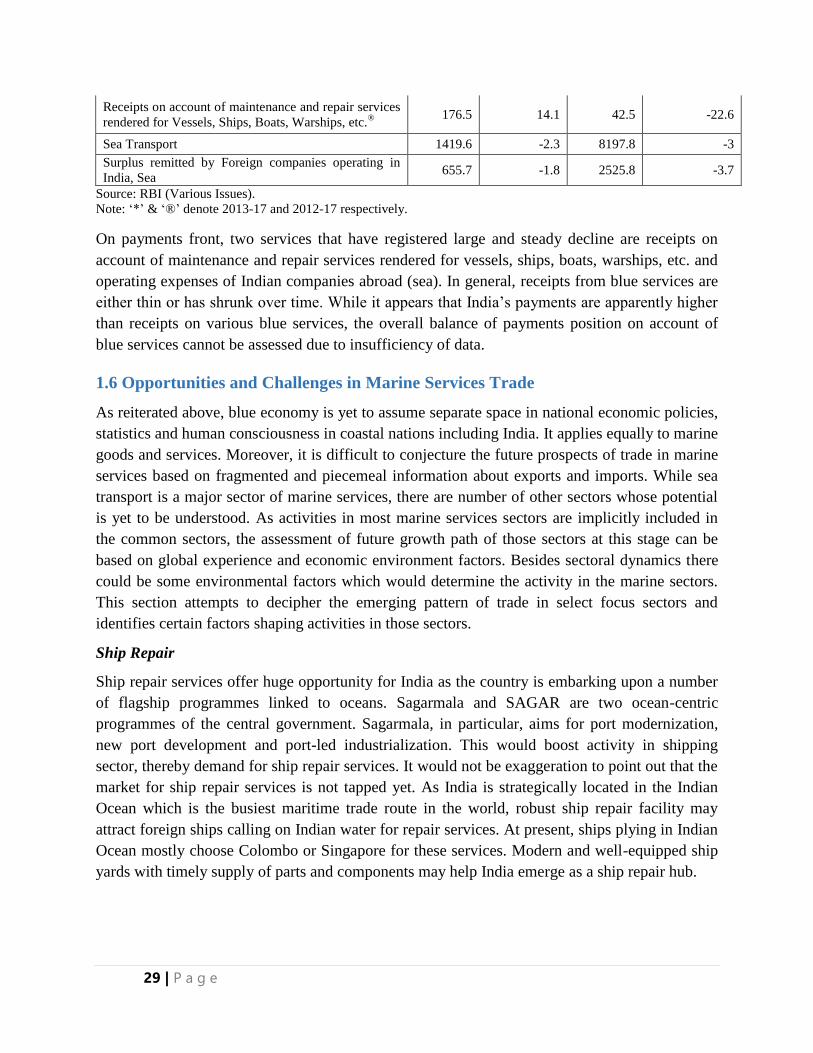
On payments front, two services that have registered large and steady decline are receipts on
account of maintenance and repair services rendered for vessels, ships, boats, warships, etc. and
operating expenses of Indian companies abroad (sea). In general, receipts from blue services are
either thin or has shrunk over time. While it appears that India’s payments are apparently higher
than receipts on various blue services, the overall balance of payments position on account of
blue services cannot be assessed due to insufficiency of data.
1.6 Opportunities and Challenges in Marine Services Trade
As reiterated above, blue economy is yet to assume separate space in national economic policies,
statistics and human consciousness in coastal nations including India. It applies equally to marine
goods and services. Moreover, it is difficult to conjecture the future prospects of trade in marine
services based on fragmented and piecemeal information about exports and imports. While sea
transport is a major sector of marine services, there are number of other sectors whose potential
is yet to be understood. As activities in most marine services sectors are implicitly included in
the common sectors, the assessment of future growth path of those sectors at this stage can be
based on global experience and economic environment factors. Besides sectoral dynamics there
could be some environmental factors which would determine the activity in the marine sectors.
This section attempts to decipher the emerging pattern of trade in select focus sectors and
identifies certain factors shaping activities in those sectors.
Ship Repair
Ship repair services offer huge opportunity for India as the country is embarking upon a number
of flagship programmes linked to oceans. Sagarmala and SAGAR are two ocean-centric
programmes of the central government. Sagarmala, in particular, aims for port modernization,
new port development and port-led industrialization. This would boost activity in shipping
sector, thereby demand for ship repair services. It would not be exaggeration to point out that the
market for ship repair services is not tapped yet. As India is strategically located in the Indian
Ocean which is the busiest maritime trade route in the world, robust ship repair facility may
attract foreign ships calling on Indian water for repair services. At present, ships plying in Indian
Ocean mostly choose Colombo or Singapore for these services. Modern and well-equipped ship
yards with timely supply of parts and components may help India emerge as a ship repair hub.
30 | P a g e
Port Services
Port services are backbones of a port as it determines the attractiveness of a port for cargo and
related businesses. The major ports of the world such as Rotterdam, Singapore, Colombo and
others have emerged as hub ports for maritime trade because of the efficient port services even
though location of the ports in global maritime space does matter for concentration of cargo.
Indian ports have experienced notable progress in operations and services. However, there are
many areas that need improvement. As blue economy is being viewed as prospective sectors for
investment and growth in India, the demand for world-class port services is likely to pick up.
Moreover, the resurgence of the seaborne trade would accelerate activity in the port and shipping
sector which would also require more port services. As port services involve highly-technical
and semi-skilled jobs the priority to ship repair services in India is timely and consistent with the
current government policy. Since the demand for port services is derived, the central and state
governments can push activity in blue economy sectors so as to activate ports as the centre of
economic activity. Another dimension to transform port and port services for trade is the relative
attraction of Indian ports vis-à-vis other nearby foreign ports. From experience of other countries
it is observed that port service issues were mostly around price not on quality. In that light, there
is a need for injecting competition among ports and encourage port specialization.
Marine Finance and Insurance
Marine finance and insurance is a virgin segment of the financial sector in India. In sync with
overall financial development in the country, marine finance may offer tremendous opportunities
for investment, trade and job creation. Given the difficulty faced by the shipping companies, it is
natural to expect that the financing needs of the shipping sector and other marine sectors would
grow in the near future. Since awareness about business and investment opportunities are
spreading fast in the country, there would be demand for loans and other financial services. In
addition to traditional financial products, the opportunity for developing sector-specific financial
products particularly in emerging high-technology sectors like marine biotechnology, ocean
energy, deep-sea mining, marine construction, and so on may be unleashed over the years. Along
with lending, insurance sector is very much likely as certain risks are unique to the marine
sectors. For instance, ship accidents, breakdown, sinking, piracy, armed robbery, etc. could result
in significant losses to the shipping companies. Likewise, new compound development in marine
pharmaceuticals requires long-term investment with better packaging of known and unknown
risks. Financing of new technology development projects for harnessing ocean energy sources
and deep sea exploration may require substantial funding and commercialization support.
Similarly, other sectors of blue economy may gradually open up new areas of lending and
financing.
Marine ICT
With development of artificial intelligence, internet of things, big data analytics, blockchain and
related technologies, the information and communication technology (ICT) sector is undergoing
massive transformation. The implications of this new technologies and technological platforms
31 | P a g e
are profound on every sector of the economy including the bleu economy. Blue economy has
potential for a wide range of ICT applications in almost all areas such as port operations,
shipping, biotechnology, marine finance, among others. The pace of digitization in marine
sectors is growing worldwide which could unleash huge market for IT software services. India
being a leading exporter of software services can tap this market for marine ICT applications. In
order to capitalize on the ‘first-mover’ advantage, India should identify all possible fields of ICT
applications in different sectors of blue economy and encourage firms to explore business
opportunities in those fields.
1.7 Recommendations
Include separate chapters on Blue Industry in the industrial policies of Government of
India and State Governments. The Coastal states may be the first ones to formulate such a
policy.
Introduce a separate chapter on Blue Trade in the export-import policy which is due for
revision in 2020. The list of exports-imports items falling under the group of 160
identified industries can be recorded in the document.
Improve India’s rank in Ease of Doing Business in the parameter relating to trading
across borders from 80 to 40 by 2022. Ease of Doing Business at district level will
benefit coastal districts in attracting FDI in blue sectors.
Double FDI for sea transport and ports by 2022.
Expand exports of Blue Trade using sea transport for which an adaptive port ecosystem
emphasizing on port competition, robust infrastructure and efficient port services should
be developed.
Adopt sector approach marine services strength
Focused sector approach should be followed for promoting trade in marine services. To
begin with, the sectors like ship repair, port services, marine finance & insurance, and
marine ICT may be considered.
Develop a statistical reporting system for all the ministries relating to blue economy
sectors for record of exports and imports information. The database would be the
repository for both Blue Trade in goods and trade in marine services.
Put digitisation on high priority to empower Blue Economy sectors. India’s talent pool in
software services can be deployed to tap the market for applications of blockchain, big
data, artificial intelligence, internet of things and cloud computing.

32 | P a g e
33 | P a g e
Chapter 2. Blue Investment
2.1 Sectoral Relevance
There are huge investment opportunities in a host of blue- economy segments. Some of these are
in living resources —pertaining to seafood involving primary fish production, aquaculture, trade
of edible and non-edible seafood items, fisheries-related activities, such as processing, net- and
gear- making, ice production and supply, boat construction and maintenance, manufacturing of
fish processing equipment, packaging, marketing and distribution, as well as use of marine-
living resources for pharmaceutical products and chemical applications. Other sectors with major
potential include non-living resources (freshwater generation through desalination as well as
extraction of minerals and oil and gas), renewable energy sources (wind, wave, and tidal energy),
transport and trade (shipping, ship building and breaking, maritime transport, port infrastructure
and related services), tourism and recreation (tourism and coastal development/urbanisation).
And indirect sectors with good prospects for investments are: coastal protection, carbon
sequestration, waste disposal for land-based industry as well as conservation of species and
habitat (World Bank and UNDESA, 2017).
The global market for just one of the emerging blue economy sectors, marine biotechnology,
alone would touch USD 5.9 billion by 2022due to growing demand for natural marine
ingredients for the production of cosmetics, pharmaceuticals, new foods and bio energy. This is
thus leading to huge investments into marine biotechnology research (UNECA, 2016).
It is much easier to invest in land-based sectors than in ocean economy as many of the risks
regarding the former are known ones. However, since oceans are under-explored and not-so-
well-developed, investments in the ocean economy are fraught with several unknown risks. More
than 80 per cent of the oceans stay unmapped, unobserved, and unexplored (NOAA, 2018). Even
an estimate of 91 per cent of ocean species have not yet been classified (Mora, et al, 2011).
Therefore, prior to making blue investments, it is important, to comprehensively assess
associated environmental, social and governance risks and firm up with risk-management
strategies as well as make appropriate allocations to improve ocean health. The policy -makers,
on their part, need to roll out dedicated regulation and enforcement regimes across the exclusive
economic zones (EEZs) to save the investors from the trouble of inconsistent standards. Besides
it is important to push innovative financing models including bringing in export credit agencies
and development banks to manage risks, especially at the initial stages of projects as well as in
promoting instruments such as blue bonds (Economist Intelligence Unit, 2015). Blue bonds are
defined as debt instruments issued by governments, development banks or others to raise money
from impact investors to fund marine and ocean-based projects that would have positive
environmental, economic and climate benefits. Incidentally, Seychelles has already come out
with a sovereign blue bond with the help of the World Bank and the Global Environment Facility
(World Bank, 2018).
34 | P a g e
2.2 Domestic Blue Initiatives
With a 7,516 kilo metre-long coastline and 14,500 km of waterways, India aims to be a global
maritime hub and a blue economy giant. Towards this objective, the government of India has
rolled out a port-led development initiative, called ‘Sagarmala’, and has marked out more than
600 projects, which would attract investments to the tune of USD120 billion (around Rs 8 lakh
crore) by the year 2020. One of the main objectives is to generate around 10 million new jobs.
Also, the Sagarmala initiative is expected to help India save on USD six billion per year through
the costs related to logistics. It is projected that the programme would enhance country’s port
capacity from 800 Million Metric Tonnes per Annum (MMTPA) to an overall 3500 MMTPA.
It also envisages in the development of 13 Coastal Economic Zones (CEZs), each entailing an
investment worth USD 150 million. These would house not only townships but also several
industries, which would contribute to global trade; through sea links. In addition, investment of
more than USD one billion is proposed for setting-up skilling centres and bringing out skill
development programmes across several coastal districts of the country. There is also a plan to
green blue economy initiatives through following projects — 31 MW of captive solar power
generation at various ports; setting -up of oil- spill response facilities and proposals for waste
water reuse at ports (GoI, 2018e). In order to develop India’s maritime ecosystem, the
government is prioritizing sectors, such as CEZ, ports, shipping, shipbuilding, cruise and
lighthouse tourism, Container Freight Stations/Inland Container Depots, road, rail and coastal
connectivity, investments, advisory, technology and training (GoI, 2017a).
Under the Foreign Direct Investment Policy, 100 per cent FDI allowed through the automatic
route (without government approval) is permitted in the shipping sector for port and harbour
construction and maintenance. The government has also incentivised port and inland waterways
development through a 10-year tax holiday to firms developing, maintaining and operating ports,
inland waterways and inland ports. In order to make port-projects more attractive to investors,
the government is considering revision of the Model Concession Agreement. To improve
operations of major ports, project UNNATI has been flagged off, which aims at boosting the
shipping sector, by permitting the foreign flagged ships to carry containers for transhipment
(IBEF, 2018).
Similarly, 100 per cent FDI allowed through the automatic route is permitted in blue economy-
related sectors such as mining and petroleum and natural gas, industrial parks, duty- free shops
and railway infrastructure (GoI, 2017b). In India, between April 2000 and June 2018, sea-
transport sector received FDI inflows of $3.82 billion, while ports sector got FDI worth $1.63
billion (GoI, 2018f). To highlight investment opportunities in the maritime sector, the Ministry
of Shipping organised a Maritime India Summit (MIS) in April 2016 in Mumbai for the first
time. Of the 141 business agreements with proposed investments to the tune of INR 83,000 crore
were inked during the Summit; out of which 49 MoUs, entailing investments worth around INR
35,539.79 crore, could be completed by July 2017 (IPA, 2017). Some of the major global
investors in India’s ports and shipping sector include Maersk, DP World, Jan De Nul Group,
35 | P a g e
Hyundai, Boskalis, Saab, Van Oord and Wartsila. For investment in the maritime sector,
investors can choose several routes — (a) engineering, procurement and construction mode, (b)
public private partnership mode, (c) captive mode and (d) fully privately owned ventures.
Several state maritime boards have offered dedicated parks/plots on concessional terms to boost
ship- building activity. The government of India, on its part, has brought out a Shipbuilding
Financial Assistance Policy to provide financial assistance to Indian shipyards for shipbuilding
contracts inked from April 1, 2016 to March 31, 2026 (InvestIndia, 2018).
It has been estimated that modernization of existing ports (12 Major Ports administered by the
Central Government, and around 200 notified Non-Major Ports, administered by the State
Governments) can add around 100 MMTPA of additional capacity. Towards this, Sagarmala
initiative is promoting mechanization (new mobile harbour cranes at major ports, and
replacement of other old equipment), increasing drafts (by dredging to around 18-23 metres from
the current average of 12-14 metres) at the existing ports to help them handle super-max/new
generation container vessels as well as by developing new terminals. Building of new ports near
the existing ones such as Paradip and JNPT – which were troubled by increased traffic and
limitations in capacity expansion—would help cater to the growing demand. It is planned to
build international container transhipment hubs in south India (Vizhinjam in Kerala and Enayam
in Tamil Nadu) to take advantage of the region as it is strategically situated under the East-West
trade route. Currently, a majority of transhipment cargo from India relies on Singapore and
Colombo ports. Additionally, there are proposals to build new ports along India’s vast coastline
to save time and cost (India Maritimeplus, 2018).
With projections of a robust growth in India’s maritime trade, there would be several investment
opportunities in shipping, including capacity expansion across different categories of vessels
(very large crude and gas carriers, LNG carriers, etc.). Ship chartering and ship brokerage
services are other sectors with potential, besides warehousing and freight forwarding. The
opportunities in coastal shipping include in bunkering and storage facilities, developing
dedicated coastal shipping, providing last -mile connectivity projects with industrial clusters,
ship -building, repairing and breaking as well as dedicated coastal berths management. Ship
building / maintenance, repair and overhaul clusters, such as the ones in Gujarat, Tamil Nadu and
Andaman and Nicobar Islands, would be providing employment opportunities to 150,000 people
living in coastal communities and generating revenues to the tune of INR 30,000 crore. With the
government move towards green initiatives at major ports, there would be potential opportunities
to invest in the solar energy projects (land-based and roof-top); planned at various ports across
the country (See Figure 1).
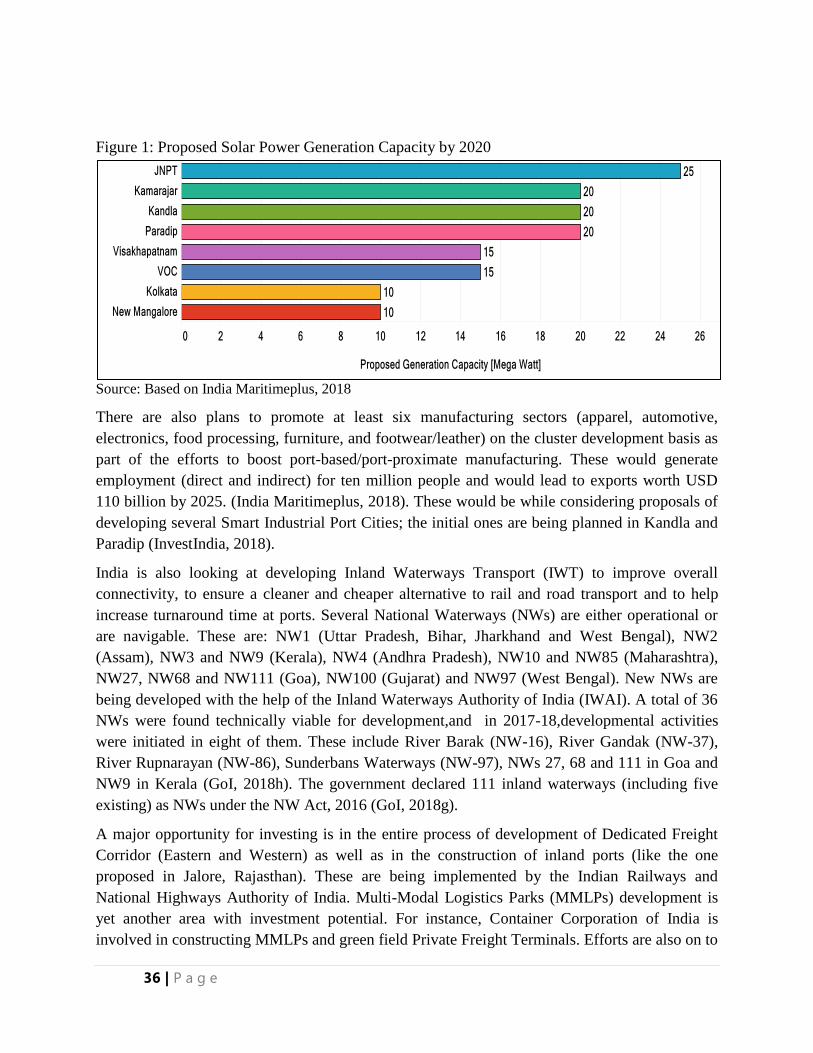
36 | P a g e
Figure 1: Proposed Solar Power Generation Capacity by 2020
Source: Based on India Maritimeplus, 2018
There are also plans to promote at least six manufacturing sectors (apparel, automotive,
electronics, food processing, furniture, and footwear/leather) on the cluster development basis as
part of the efforts to boost port-based/port-proximate manufacturing. These would generate
employment (direct and indirect) for ten million people and would lead to exports worth USD
110 billion by 2025. (India Maritimeplus, 2018). These would be while considering proposals of
developing several Smart Industrial Port Cities; the initial ones are being planned in Kandla and
Paradip (InvestIndia, 2018).
India is also looking at developing Inland Waterways Transport (IWT) to improve overall
connectivity, to ensure a cleaner and cheaper alternative to rail and road transport and to help
increase turnaround time at ports. Several National Waterways (NWs) are either operational or
are navigable. These are: NW1 (Uttar Pradesh, Bihar, Jharkhand and West Bengal), NW2
(Assam), NW3 and NW9 (Kerala), NW4 (Andhra Pradesh), NW10 and NW85 (Maharashtra),
NW27, NW68 and NW111 (Goa), NW100 (Gujarat) and NW97 (West Bengal). New NWs are
being developed with the help of the Inland Waterways Authority of India (IWAI). A total of 36
NWs were found technically viable for development,and in 2017-18,developmental activities
were initiated in eight of them. These include River Barak (NW-16), River Gandak (NW-37),
River Rupnarayan (NW-86), Sunderbans Waterways (NW-97), NWs 27, 68 and 111 in Goa and
NW9 in Kerala (GoI, 2018h). The government declared 111 inland waterways (including five
existing) as NWs under the NW Act, 2016 (GoI, 2018g).
A major opportunity for investing is in the entire process of development of Dedicated Freight
Corridor (Eastern and Western) as well as in the construction of inland ports (like the one
proposed in Jalore, Rajasthan). These are being implemented by the Indian Railways and
National Highways Authority of India. Multi-Modal Logistics Parks (MMLPs) development is
yet another area with investment potential. For instance, Container Corporation of India is
involved in constructing MMLPs and green field Private Freight Terminals. Efforts are also on to
37 | P a g e
link IWT with roads and railways to ensure an integrated- and- efficient transportation network
to help reduce transaction costs and time.
These domestic policies are backed by several initiatives on the external front. India is a member
of the Indian Ocean Rim Association (IORA), which aims to boost economic cooperation among
its members to ensure sustained development and balanced economic growth. And it has already
taken the initiative to help prioritize six sectors — Maritime Safety and Security, Trade and
Investment Facilitation, Fisheries Management, Disaster Risk Management, Academic, Science
and Technology, and Tourism and Cultural Exchange — as focus areas of cooperation in future.
IORA has become an area of regional maritime cooperation for India in line with its concept
called ‘SAGAR’ (meaning ocean), an abbreviation for ‘Security and Growth for All in the
Region’. Besides, the country has taken efforts to raise cooperation among the Small and
Medium Enterprises in the IORA region (GoI, 2017c).
Another external sector initiative to promote blue investment is India’s efforts to forge closer ties
with the ASEAN bloc. In the pipeline are initiatives like an India-ASEAN maritime transport
agreement, more maritime cargo routes, promotion of coastal shipping services, investment in
marine information, communication and technology services, research and innovation in marine
biotechnology, greater access to sea-bed resources, proper integration of coastal tourism and
other services, renewable energy, coastal management and marine resource conservation (GoI,
2017a).
2.3 Global Experience
While many countries across the world, including India, are assessing merits of bringing out a
comprehensive Blue Economy Policy, economies in IOR, such as Mauritius and Seychelles,
have been proactive in this regard. Also pitching in is international organisations, like the UN,
which has brought out a policy handbook on Africa’s blue economy. The policy guidance for
African economies include increasing investments in climate and environmental information
services for ensuring greater access of information regarding them. The other suggestions
include development of green ports, promoting use of renewable energy technologies,
development of Natural Capital Accounting systems for countries to promote blue energy
(hydropower and ocean energy) as well as applying carbon taxes to support Blue and green
technology investment (UNECA, 2016). Meanwhile, the African Union’s (AU, 2015) Agenda
2063 has also recognised importance of blue economy as a growth driver. It has identified
priority areas such as marine and aquatic biotechnology, shipping, river and lake transport,
fishing, deep -sea mineral and other resources (AU, 2015). Development of blue economy in a
secure and environmentally sustainable manner is a part of the vision statement of the AU’s 2050
Africa’s Integrated Maritime Strategy. It has a focus on the maritime spatial planning with a
view to ensure greater legal certainty for investors, and in a way of boosting blue investment
(AU, 2012).
38 | P a g e
Among the initiatives to boost blue investments are MARIBE (Marine Investment for Blue
Economy)— a project funded by the European Commission (EC) to explore cooperation
opportunities for companies that go in for blue growth by choosing to invest in blue
biotechnology, aquaculture, seabed mining, ocean energy and coastal tourism. The EC has also
brought out a host of voluntary principles on ‘sustainable blue economy finance’ and raised
concerns over the adverse impacts of the poorly planned port development on fisheries. The
inter-linkages in the ocean environment and the associated complexities were also brought out by
the EC as it showed that unsustainable fishing harmed ecosystems, including coral reefs and
weakened their coastal protection abilities that, in turn, affected business prospects of sectors,
such as tourism. The voluntary principles (including on protection of environment, compliance
with national and international norms, promoting risk-awareness and transparency, forging
partnerships, being science-led, inclusive, cooperative, purposeful, diversified and solution-
driven) also aim to ensure reduction of carbon emissions. They also support innovative financial
instruments as well as development models to help accelerate sustainable blue investments (EC,
2018).
The EC has also brought out a long-term sustainable and inclusive blue growth strategy. The
identified essential components to provide legal certainty, security and appropriate knowledge in
the blue economy include marine knowledge (to improve access to information about the sea),
maritime spatial planning (for an efficient and sustainable management of activities at sea) and
integrated maritime surveillance (to give authorities a better picture of what is happening at sea)
(EC, 2012). The EC has a specialized fund called European Regional Development Fund to
promote blue investment through support to small businesses, for innovations and greenhouse
gas emission reduction. Another fund, called the European Maritime and Fisheries Fund, boosted
EC’s maritime priorities and helped pilot the Blue Growth strategy. The EC has identified that
among the many, the main challenge is access to finance; especially considering several of these
high-potential ventures have huge risks associated with them. It, therefore, has come out with an
Investment Plan for Europe to support mega projects, including construction of ports and
offshore wind. However, on understanding that small businesses have difficulty in arranging
finance, specialised investment vehicles are being looked at for closing funding gap, including in
research, by attracting investments from private and public sources on a priority basis (EC,
2017).
2.4 Recommendations
One of the main factors that can catalyse blue economy investment is through a fully secure
maritime environment. Therefore, care has to be taken to avoid disruption of peace by
preventing crimes, such as IUU (illegal, unreported and unregulated) fishing, illicit trafficking of
people and goods, piracy and armed robbery at sea and environmental crimes as well as border
skirmishes (collaborative efforts with other countries and proper border demarcation can help in
this regard). Blue investments can be sustained only when all the concerned stakeholders are
fully committed to each and every project. So adopting a transparent and accountable process as
39 | P a g e
well as communicating with stakeholders and bringing in their involvement right from the initial
stages of projects would be crucial for ensuring successful blue investments.
Utilisation of blue resources has to be done in a manner that not only helps generate good returns
on investment, but also meet the United Nation’s Sustainable Development Goals (SDG) —
especially SDG 14 pertaining to conservation and sustainable use of the oceans, seas and marine
resources — by 2030 (UN, 2018). Such an approach right from the planning stage of any blue
economy project would help maintain a balance between investors’ interest on the one hand and
social and environmental concerns on the other. This can be achieved by relying on innovative
technologies, which would lessen environmental risks and help optimal management of blue
resources. What can catalyse this process would be a holistic Blue Investment Policy with an
inclusive growth strategy that incentivises private investment into green technology-related
Research and Development and simultaneously promotes Micro, Small and Medium Enterprises
(MSME). Following recommendations are made:
Initiate to form Blue Development Fund to promote blue sectoral activities in the coastal
region.
Promote pool of resources to initiate development activities in blue sectors through credit
instruments like Blue Bonds.
Evaluate environmental, social and governance risks to form risk management strategies
for Blue investment to improve ocean health.

40 | P a g e
41 | P a g e
Chapter 3. Blue SMEs
3.1 Emerging Sectors
Micro, Small and Medium Enterprises (MSME) contribute significantly to the world economic
output, employment, exports, entrepreneurialism, innovation, inclusive growth, skilling and
sustainable development. It is estimated that globally, there are around 420-510 million formal
and informal MSMEs (IFC, 2013). MSMEs contribute to around 50 per cent and 35 per cent of
the GDP in developed and developing countries, respectively. These enterprises also account for
approximately two-thirds of the total employment in both developing and developed nations.
While MSMEs account for 34 per cent of exports on an average of developed nations; trade
participation of SMEs in developing countries is low; with their direct and indirect exports
accounting for 7.6 per cent and 2.4 per cent, respectively, to manufacturing sales (WTR, 2016).
Definition of MSME varies across and even within countries. However, an IFC study (2014)
defined MSME on the basis of the number of employees—the most common thresholds were 10
employees for microenterprises, 50 employees for small enterprises and 250 employees for
medium enterprises. In terms of annual turnover, the common threshold values for classifying an
MSME were: USD 50 million to 70 million (mainly driven by high-income countries); as well as
USD 1 million to 5 million; and below USD 1 million (both were most common in lower income
developing countries). It was also found that the most common threshold values for value of
assets were in the range of USD 50 million to 62 million; with lower thresholds being used by
lower income countries (IFC, 2014).
While the term ‘Blue MSME’ has not yet been explicitly defined; many countries and
international blocs are taking note of the blue economy’s enormous potential and are making
efforts to rope MSMEs into blue economy ecosystem. According to the 2018, Nairobi Statement
of Intent on Advancing the Global Sustainable Blue Economy, ‘support growth of SMEs in the
blue economy’ has been recognised as a key element in the ‘principles of building a sustainable
blue economy’. It had recommended that governments should incentivise SMEs by considering
them for the development of blue economy projects. This would help these private sector players
gain greater knowledge and better understanding of the value of the blue economy and, in turn,
strengthen their social and environmental responsibility. This follows the realisation about the
limitations of the public sector to finance huge investments required to realize a sustainable blue
economy. Therefore, the private sector needs to be encouraged to bridge the financing gap
through various incentives. Entities such as the Caribbean Development Bank are looking at
facilitating setting up of shared facilities for upcoming entrepreneurs and mentorship of young
entrepreneurs to help bridge the gap between big firms and SMEs. (Nairobi Statement of Intent,
2018).
Similarly, the IORA Jakarta Declaration on Blue Economy had recognised the importance of
promoting entrepreneurship, innovation and SMEs, with a special focus on promoting youth and
42 | P a g e
women’s engagement in the sustainable development of the Blue Economy. It had stated that
women and youth in the IORA member- nations should be encouraged, especially by supporting
MSMEs and small-scale fisheries. This is with a view to help them to be equitably included in
the sustainable economic growth (IORA, 2017).
The European Commission (EC) has several initiatives to encourage greater participation of
SMEs in the blue economy. Some of these initiatives are Innovation Union, provision of funds
through the European Maritime and Fisheries Fund (EMFF), Competitiveness of Enterprises and
Small and Medium-sized Enterprises (COSME) programme, Horizon 2020 and the SME
Instrument offers. The focus is on five areas — aquaculture, blue biotechnology, renewable
energy, the ocean’s mineral resources as well as coastal and maritime tourism — that the EC
opinionated to have the maximum potential for growth. The EC’s initiatives are to help
encourage SMEs to be internationally oriented by entering new markets as well as by taking up
high-risk and high-potential innovation ideas (EC, 2014).
While the common challenges faced by MSMEs across the world relate to hurdles regarding
acquiring the latest skill-sets and technology, the major trouble is in fetching timely and adequate
finance. According to the IFC study, the potential demand for MSME finance is around USD 8.9
trillion, as against the current credit supply of USD 3.7 trillion to MSMEs; leaving an USD 5.2
trillion-worth finance gap from formal MSMEs in 128 developing countries, which is equivalent
to almost a fifth of the gross domestic product (GDP) of these countries. This calls for greater
government efforts to develop and enhance financial system, including through a targeted
MSME strategy to boost lending to this segment (IFC, 2017a).
3.2 Opportunities and Challenges
In India, MSMEs contributed to 31.6 per cent of Gross Value Added (GVA), 28.77 per cent of
Gross Domestic Product (GDP), 33 per cent of the total Manufacturing GVO (Gross Value of
Output) at current prices (2015-16) and 40 per cent of the total exports. Definition of micro,
small and medium enterprise varies (See Table 4). A vast majority of the enterprises in India
were recorded as MSMEs (around 63.388 million) in 2015-16, as only 4,000 out of the 63.392
million enterprises in the country were large. This means that there were 63.388 million MSMEs
in India (2015-16). The break-up of the aggregate MSME showed that 19.664 million were in
manufacturing (31 per cent), 23.035 million were in trade (36 per cent) and 20.684 million were
in other services (33 per cent), and 0.003 million were in non-captive electricity generation and
transmission. Micro sector with 63.052 million enterprises constituted over 99 per cent of the
total estimated MSMEs, while small sector with 0.331 million and medium sector with 0.005
million MSMEs accounted for 0.52 per cent and 0.01 per cent of the total estimated MSMEs,
respectively. The sector also generated 111 million jobs in the country (36.04 million in
manufacturing, 38.72 million in trade, 36.28 million in other services and 0.007 million in non-
captive electricity generation and transmission). Micro sector generated 107.62 million jobs,
thereby contributing to around 97 per cent of the total employment in the MSME sector. Small
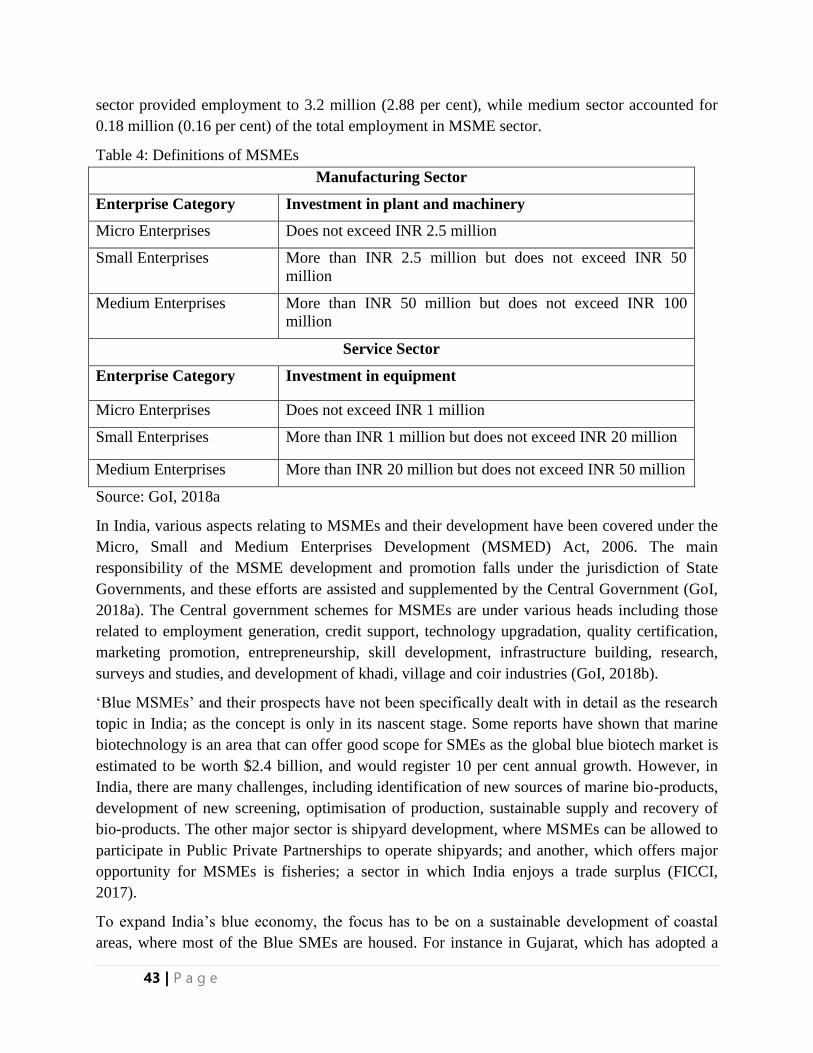
43 | P a g e
sector provided employment to 3.2 million (2.88 per cent), while medium sector accounted for
0.18 million (0.16 per cent) of the total employment in MSME sector.
Table 4: Definitions of MSMEs
Manufacturing Sector
Enterprise Category Investment in plant and machinery
Micro Enterprises Does not exceed INR 2.5 million
Small Enterprises More than INR 2.5 million but does not exceed INR 50
million
Medium Enterprises More than INR 50 million but does not exceed INR 100
million
Service Sector
Enterprise Category Investment in equipment
Micro Enterprises Does not exceed INR 1 million
Small Enterprises More than INR 1 million but does not exceed INR 20 million
Medium Enterprises More than INR 20 million but does not exceed INR 50 million
Source: GoI, 2018a
In India, various aspects relating to MSMEs and their development have been covered under the
Micro, Small and Medium Enterprises Development (MSMED) Act, 2006. The main
responsibility of the MSME development and promotion falls under the jurisdiction of State
Governments, and these efforts are assisted and supplemented by the Central Government (GoI,
2018a). The Central government schemes for MSMEs are under various heads including those
related to employment generation, credit support, technology upgradation, quality certification,
marketing promotion, entrepreneurship, skill development, infrastructure building, research,
surveys and studies, and development of khadi, village and coir industries (GoI, 2018b).
‘Blue MSMEs’ and their prospects have not been specifically dealt with in detail as the research
topic in India; as the concept is only in its nascent stage. Some reports have shown that marine
biotechnology is an area that can offer good scope for SMEs as the global blue biotech market is
estimated to be worth $2.4 billion, and would register 10 per cent annual growth. However, in
India, there are many challenges, including identification of new sources of marine bio-products,
development of new screening, optimisation of production, sustainable supply and recovery of
bio-products. The other major sector is shipyard development, where MSMEs can be allowed to
participate in Public Private Partnerships to operate shipyards; and another, which offers major
opportunity for MSMEs is fisheries; a sector in which India enjoys a trade surplus (FICCI,
2017).
To expand India’s blue economy, the focus has to be on a sustainable development of coastal
areas, where most of the Blue SMEs are housed. For instance in Gujarat, which has adopted a
44 | P a g e
port-led development strategy, coastal districts account for a majority of MSME operating units
(Research Collective, 2018). Another factor that has to be taken into consideration while
formulating a policy to help MSMEs is that around 97 per cent of them operate in the informal
sector, and they include a majority of micro enterprises and daily wage earners. In value terms,
the informal sector account for around a third of the gross output of the MSMEs (Behera and
Wahi, 2018). Among blue economy-related sectors, where a major presence of informal sector
MSMEs is, is tourism. However, their concerns and ambitions are not entirely addressed by
policies and strategies. The formal tourism sector is benefitted the most from subsidies and tax
sops (Research Collective, 2018).
The other challenge include difficulties in accessing to credit. The MSME finance gap in India is
estimated to be $230 billion (IFC, 2017b). It has also been found that several Indian MSMEs are
losing out on export competitiveness to their rival firms, especially in neighbouring countries,
owing to lack of use of the latest technologies, poor investments in advanced technology,
research and development as well as skill development, inadequate usage of latest digital and
technology enabled platforms, besides infrastructural gaps and complicated regulations
(Mukherjee, 2018).
To address various challenges, the government has been undertaking initiatives such as holding
job fairs, skill development programmes, launching an online portal on employment-related
issues, interacting with delegations of countries including from the developed and developing
world to share and gain knowledge about best practices, promoting ‘ecomark’ labelling to make
the products environment friendly, recording, sharing and publicising success stories of MSMEs
across the country on media outlets including social media, engaging with MSME sector
stakeholders on social media, promoting innovation and cluster-development, taking efforts to
boost government procurement from MSMEs, providing subsidies, and collaborating with state
governments (GoI, 2018c).
Besides, the government has floated out measures, such as expediting lending (loans upto INR
10 million within 59 minutes through an online portal), encouraging formalisation through two
per cent interest subvention for all GST (Goods and Services Tax)-registered MSMEs on fresh or
incremental loans, and promoting ease of doing business (once a year filing of returns under
eight labour laws and ten Union regulations; inspector visits to establishments to be decided via a
computerised random allotment; single consent under air and water pollution laws; and for
minor violations under the Companies Act, entrepreneurs can correct them through simple
procedures and need not approach courts). The government is also implementing a World Bank-
assisted project to establish new Technology Centres (with the latest machinery and facilities for
3D printing, artificial intelligence, virtual reality, internet of things, etc.) and upgrading existing
ones as well as providing training, consultancy, incubation, tooling support and other production
related services to MSMEs (GoI, 2018d).
45 | P a g e
3.3 Global Strategies
Estimates show that USD 28 trillion is the contribution of coastal and marine resources annually
to the world economy (UN, 2018). While MSMEs will have to play a crucial role to ensure that
the development of blue economy is sustainable and inclusive, they can be consistently
successful, if they forge win-win partnerships with leading players in the global blue economy
and facilitate taking forward a sustainable blue economy ecosystem. Some initiatives have been
taken at the global level to help MSMEs in providing access to finance. For instance, an
international organisation called BioMarine International Clusters Association (BICA) was
formed as a meeting place for SMEs and investors to ink deals in a manner that would help
SMEs get better access to finance (Aquaculturists, 2013). There is also evidence regarding
formation of blue tech clusters form in the U.S. and China. These clusters aim to strengthen ties
for sustainable blue technology development in these regions (Spalding, 2016). Recognising the
importance of SMEs in the blue economy is one of the voluntary principles in the set of 14
Sustainable Blue Economy Finance Principles - a voluntary set of principles developed by the
European Commission (EC), WWF (World Wide Fund for Nature), the Prince of Wales’s
International Sustainability Unit and the European Investment Bank. To promote SMEs, the
principle states that the endeavour has to be to diversify investment instruments to reach a wider
range of sustainable development projects, for example in traditional and non-traditional
maritime sectors and in small and large-scale projects (EC, 2018). Then, there is the EC-backed
innovation action project called NEPTUNE (New Cross Sectoral Value Chains Creation across
Europe Facilitated by Clusters for SMEs’ Innovation in Blue Growth). NEPTUNE is an
accelerator to support the development of three key aspects of ‘Blue Growth’ considered with
high potential—these include (a) water management in urban and rural areas; (b) fluvial and
maritime transport and port; and (c) environment and renewable marine energy. The NEPTUNE
aims to offer SMEs an opportunity to extend their markets worldwide and support setting- up of
fertile regional ecosystems, called Smart Specialization Strategies, to provide the framework
conditions for supporting and funding the emergence of collaboration actions between SMEs and
the cluster partners (EC, 2016). Another international project that aims to provide services and
technologies to boost the growth of local SMEs is BLUEMED, which is jointly developed and
agreed between Cyprus, Croatia, France, Greece, Italy, Malta, Portugal, Slovenia, and Spain and
facilitated with the support of the EC. BLUEMED is the research and innovation initiative to
promote blue economy in the Mediterranean Basin in a healthy, safe and productive manner
through cooperation. By implementing its Strategic Research and Innovation Agenda (or the
BLUEMED SRIA), it aims to help create new ‘blue’ jobs, and a sustainable growth in the marine
and maritime sectors.
3.4 Recommendations
To ensure that a blue growth strategy that would be brought out by the government of India is
inclusive and sustainable, a blue economy policy targeting MSMEs is vital, especially
considering key role they would play in the country. The low level of participation of MSMEs in
46 | P a g e
India’s blue economy is owing to poor access to finance, technology and skills. However, the
core reason is the lack of information and knowledge about blue economy; and one of the
suggestions to overcome this is to make blue economy / marine data more accessible to MSMEs
and encourage them to bring out innovative models and solutions in the fields such as marine
spatial planning as well as mapping the seabed and overlying water column under India’s
jurisdiction. Hence the following recommendations are made:
Identify sectors for participation of blue SMEs under the principles of inclusive and
sustainable growth, particularly in emerging technology intensive areas.
Facilitate new innovation models to develop and adopt blue technologies for engaging
SMEs.
Encourage SMEs by raising special blue fund in various marine sectors to diversify
investment in environmental friendly projects.
Create institutional mechanisms for credit facilities for Blue SMEs in range of activities
to enhance their production and export competitiveness
Establish Marine Data Portal to provide information and sharing knowledge with the
SMEs, working in blue sectors for resource accessibility.
Advance Blue SMEs in marine clusters with the support of skill development centres to
augment employment opportunities.
47 | P a g e
Chapter 4. Blue Technologies
4.1 Relevance of Technology in Blue Economy
The role of Blue Economy is vividly seen in different sectors in a national economy. The Blue
Economy sectors are widely spread across major economic activities like agriculture, mining,
manufacturing and services. Technology is one area, which has a crosscutting edge in all marine
sectors. It has the capacity to increase efficiency of the marine industries and reduce carbon
emissions in all sectors. Technology and innovation has the capacity to not only curb greenhouse
gas emissions by using environment-friendly technologies but also helps in monitoring and
conserving ocean resources. Blue Economy has been characterised with limited market size and
scale, issues related to environment and climate change and measurement of potentials from the
oceans. But, research and development and technological innovations have the capacity to cater
to these challenges.
The foremost challenge among these is the measurement of the ocean asset- base. In this case,
techniques like Acoustics, Optics and Radar have been used worldwide for bathymetry to get
data and potential of various sources from oceans. Remotely Operated Underwater Vehicles,
Satellite Oceanography, GIS, SONAR and Animal Telemetry, among others, would help in
mapping varied ocean resource base. The second challenge is to protect and preserve marine
environment and ecosystem. For this, technologies relating to wastewater treatment and removal
of pollution for oceans and other water- bodies would help improving current status of ocean
environment. In addition, use of renewable technologies would also reduce dependence on fossil
fuels for energy requirements and help in mitigating climate change issue. Innovations in marine
energy technologies have provided hybrid technologies where two forms of energy can be
harnessed concurrently like the wind energy and wave energy. Desalination technology would
help providing freshwater, especially to the SIDS. There are technologies like Ocean Thermal
Energy Conversion (OTEC), which would provide benefits of harnessing energy and production
of freshwater simultaneously.
Deep-Sea ocean vessels for fishing and mining are being used to operate beyond the EEZ
boundaries of the nation, which would enhance availability of raw materials for the related
industries. Digitisation in marine sector would also act as a trade facilitator by enhancing the
efficiency of transit with technologies like blockchain, Internet of Things (IoT) etc. With
Industry 4.0, the global market is experiencing a new phase where every industry is working on
automation, robotics, cyber-enabled system and many more. A similar trend is also seen in
marine sector where marine industries like shipping and logistics are using technologies with
smart ships, blockchains, IoT, Big Data, etc. This Blue Technology Revolution would enhance
the capacity and capability of industries in a sustainable manner, protect bio-diversity, and
reduce effect of other environmental issues like greenhouse gas emission, climate change, etc.
48 | P a g e
As mentioned earlier, blue technologies used in various blue economy sectors. A very brief
discussion on some of the technologies are presented in the next session.
4.2 Existing Potential and Status in Different Sectors
4.2.1 Fishing Industry
At present, the “technology” used for fisheries forecasting is the PFZ (Potential Fishery Zone)
advisory issued by INCOIS (Indian National Centre for Ocean Information Services). This
system uses satellite data on sea-surface temperature (SST) and chlorophyll to advice fishermen
on where to fish within the Indian Exclusive Economic Zone (EEZ). An advisory is valid for
three days. In the XII Plan, CSIR-NIO carried out a research programme called OCEAN
FINDER to understand what happens in these PFZs, particularly on SST fronts. The leads from
this project have led to the formulation of a national mission-mode research project on ‘Trans-
disciplinary Research for improved forecasting of Indian Marine Fisheries (TRIMFish)’, which
is a multi-institutional, end-to-end, trans-disciplinary programme on Indian fishery.
This programme aims at linking research on ocean processes and fisheries, which are
traditionally done separately in silos. Taken to its logical conclusion, the programme can make a
significant contribution to the national economy, well-being of our population, conserving
resources, and protecting health of the oceans. Therefore, this programme aims to achieve two
goals— economical fishing and sustainable fishing. Under economical fishing, the objective is
to make short-term forecasts to enable fishermen to decide when to fish and how much, not
merely where to fish, improving overall efficiency. Addition of forecasts on seasonal and
decadal time scales would aid planning and sustainable fishing. For sustainable fishing, it is also
important to make improvements in our stock assessments— this programme plans to use
sensors on fishing boats to enable real-time monitoring and surveillance of these boats and
estimate of their catch.
4.2.2 Marine natural products
Although research on the marine natural products had started about 50 years ago, they were used
in the traditional system of medicine much before that. In most countries with the ancient
civilizations, such as India, a system of medicine indigenous to the country exists. In spite of all
the recent advances in medicine, indigenous medicine still caters to the needs of a large section
of the population. Marine products are those products or those substances, which are obtained
from sea. They have many properties due to which they are used therapeutically in Ayurveda
since antiquity. Some of the important marine products having use in Ayurvedic formulations
are: Shankha, Kapardika, Pravala, Mukta, Sambuka, Samudraphena, Agnijvar, Kurmasthi, etc.
Similarly, in Sidha medicines also there are marine products like Amber, Muthu Parpam etc.
49 | P a g e
Though there are several marine- based products reported in Indian traditional medicines, there is
very limited information available with respect to their origin / source as well as chemical
constituents and bioactivity. The proposed project would be helpful in exploring marine natural
products, reported in the Indian traditional medicines in a very systematic way. The involvement
of marine biologists, natural product chemist, Ayurvedic & Sidha doctors and pharmacologists to
study marine- based traditional medicinal substances would completely be a novel approach.
4.2.3 Multidimensional Seaweed biorefinery design
India’s reliance on oil imports is expected to reach 90 per cent by 2040 (IEA, 2017). The
increasing energy import and rising population, has made the development of bioenergy
infrastructure, and the balance between energy and food security, a Nation’s key priority. Thus,
diversification of the country’s energy portfolio to include 3rd
generation resources is essential.
However, unavailability of the substantial amount of the biomass is a critical challenge. Further,
diverting arable land for cultivation of energy crops along with infra-developments may be
impractical. Marine macroalgae (seaweeds) in this regard can be an alternative 3rd generation
resource for fuel production. Seaweeds can be cultivated at a much faster rate than terrestrial
plants and with lower costs, as no land, fresh water, and fertilizers inputs are required.
To further enhance our biomass quality, India should use cutting-edge technology (omics) to
define or map the functional traits which can further be utilized for improvement in the biomass
quality, quantity and biorefinery potentials. Genomics and proteomic resources are limited for
seaweeds and could be established through this proposal. This will overcome the current
bottleneck in defining the functional traits, which can be further utilized for future developments
of breeding/biotechnological programmes.
4.2.4 Gas Hydrate exploration
The conventional hydrocarbon reserves in India estimated so far are grossly inadequate to meet
their growing demand. Being a non-renewable, hydrocarbon reserve is expected to dwindle out
with growing global consumption and industrial development. India being a rapidly growing
country is expected to be affected due to global shortage in hydrocarbon production and
enhanced cost in future. The rising cost of oil import will hamper the industrial growth. India has
a substantial gas hydrate reserve along the continental margins. India is set to enter NGHP-03
targeting the production technology for extraction of gas hydrates. Successful and economically
feasible exploitation technology would enhance utility and industrial application of gas hydrate.
The latter is expected to create jobs in both upstream and downstream sectors as well as in
research.
Other petroliferous basin like Cauvery-Mannar, Mahanadi and Andaman offshore should also be
studied in sufficient details for gas hydrate exploration. Once the deposits are established, the
blocks can be further developed by leasing out to interested companies for exploitation of gas
50 | P a g e
hydrates under the aegis of DGH. Adaptability of the gas hydrate-based technology for various
applications, including gas recovery, sequestration, water purification etc., are in R&D stage
worldwide. Pursuance of R&D activities with focused objectives is essential for self-sustenance
and for growth in cutting -edge technologies.
The gas-hydrate project would provide an opportunity to recruit and train researchers to work in
diverse fields of gas hydrate research and contribute towards increasing understanding on the
underlying processes (small and large-scale) associated with the development of gas- hydrate
system in marine environments. The geo-microbiological findings would be useful for the oil
industry, hydrate-mining industry, and also in the application of the bio-potential of these
organisms in e agricultural food and medical industry.
4.2.5 Placer Minerals
Among the various components of "Sustainable Blue Economy", the mineral resource from
oceans is one of the prominent aspects. In the fast depletion of land- based mineral resources, the
oceans are the best alternative resource as seas and oceans have huge mineral potential. India has
vast marine mineral reserves in coastal and deep-sea areas. Indian is blessed with huge coastal
placer mineral reserves in beaches and offshore areas. Generally, coastal placer minerals include
ilmenite, Rutile zircon, garnet, monazite and sillimanite. These minerals are widely distributed in
the beaches and offshore regions along the Indian coast. The offshore placer mineral deposits in
vast oceanic regions are deemed to be considerable and vital for high economic returns due to its
higher values and essential usages in the hi-tech industries.
The available technological capabilities make the operation easier for exploitation of these
mineral resources. Provided with huge deposits of placer minerals, India has ventured into a
systematic approach in exploring new deposits and improved mining procedures. In recent years,
the economic growth in marine mineral has doubled and fetched significant economic returns to
the country. In line with many years of technical advancements, India has developed an
appropriate capability to technologically support the Indian Ocean Rim Countries for such
offshore mineral exploration and exploitation in an eco-friendly and economically feasible
framework.
Out of ~7500-km long coastline, about 4500- km coastal stretch has been surveyed in detail till
now and many new deposits are reported. Still about 45-55 per cent coastal zone needs to be
explored in details. However, in offshore exploration, GSI has carried out reconnaissance survey
covering about 95 per cent of the 2.012 million sq.km in EEZ, including about 1,05,000 sq.km of
territorial waters of India, and the reserves have been estimated to the tune of around 92 million
tonnes worth of about Rs 28,000 crore (Indian Bureau of Mines, 2014). The National Institute of
Oceanography (NIO) is involved in offshore placer mineral exploration-right from 1980s; and a
few areas - off Ratnagiri, Maharashtra and Off Kerala with NCESS - have been explored up to
12-20m water depth and minerals such as ilmenite, magnetite, zircon etc., have been reported.
51 | P a g e
Following the above-detailed study in Ratnagiri offshore, the Ministry of Mines, Government of
India, has considered approving nearly 10 PL (Prospecting Licence) / ML (Mining Licence) for
offshore mining. In continuation, NIO has proposed to take up detailed studies in different
offshore areas along the Indian coast. Since, most of the offshore exploratory equipment’s and
research vessels are already available with the NIO, the operational cost of exploration and
demonstration of indigenous mining technology are required. Also, since indigenous
technologies are available, the offshore exploration needs to be taken-up sector-wise
systematically. The estimated cost of detailed offshore exploration would be at Rs.62 crore.
4.3 Recommendations
Blue Economy is an uncharted area. In order to mobilize the resources lying across the oceans
for development, it is essential that continuous research and development is undertaken.
R&D
Initiate an encompassing plan to cover different maritime science and technology related
programmes to establish synergies with different stakeholders including government to
stimulate innovation and strengthen sustainable ocean economy.
Create R&D Hubs in nine coastal states to attract FDI with suitable incentives.
Promote exports of R&D service related to Blue Economy as an Industry in the global
market.
Promote research to identify potential lead molecules in marine macro and microorganisms
for therapeutic areas, like cancer and infectious diseases. The presently identified lead
molecules may also be taken further for preclinical development with industrial
collaborators.
Introduce Smart-ship technologies and pollution-free ship propulsion to ease operation and
maintenance of ships and reduce pollution from ships.
Use of technologies like Automation, Robotics, blockchains and IoT to facilitate marine
sectors like ocean mineral wealth including deep-sea mining, marine logistics and shipping,
etc.
Develop pharmacopeia for marine products having applications in Ayurveda and Sidha
formulations.
Use for lightweight non-corrosive and self-healing damage resistant placer alloys for the sea-
going vessels and inland water vessels.
Promote marine bio-technology for the cultivation of seaweed to enhance its commercial use
in areas like aquaculture, bio-pharma, marine cosmetics, bio-fertilizers, etc.
52 | P a g e
Capacity Building: Knowledge Centre
Develop Marine Science and Technology Clusters at the National and the Regional levels to
share available technologies in marine sector and collaborate with other organisations for
innovations.
Establish several premier institutes of oceanography for capacity building and promoting
marine technical services including modelling future trends, assessment of future challenges
among others.
Data
Establish Blue Economy Data Portal to improve statistical and methodological base at the
national level for measuring the scale and performance of ocean-based industries and their
contribution to overall economy.
Build capabilities for big data analytics in blue sectors for uncovering and analysing the
trends, correlations and patterns for determining marine data.
53 | P a g e
Chapter 5. Marine Manufacturing
A Blue Economy includes diverse components and sectors ranging from established ocean
industries, such as fisheries, tourism and maritime transport, to emerging industries, such as
offshore renewable energy, aquaculture, deep seabed extractive activities and marine
biotechnology among others. The following section details manufacturing sectors in Blue
Economy in traditional and emerging sectors.
5.1 Traditional Sectors
5.1.1 Fisheries
Globally, 350 million jobs are linked to marine fisheries, with ninety per cent of fishers living in
developing countries. The value of fish traded by developing countries is estimated at US$ 25
billion, making it their largest single trade item. Global catch rose from 4 million tonnes in 1900,
through 16.7 million tonnes in 1950, 62 million tonnes in 1980 to 86.7 million tonnes in 2000,
but has stagnated subsequently (GOC, 2008).
India has the world’s largest population of fishing communities, spread over 3,400 fishing
villages. About 4 million people are directly dependent on marine fisheries. Marine bio-resources
based products constitute significant component of Indian export basket. India exports more than
$5 billion worth of fish & crustacean, mollusc & other aquatic invertebrate and their products.
Indian fish production grew from 520 thousand tonnes in 1950 to 3.44 million tonnes in 2014.
This has been higher than the growth in food grains, milk, eggs and other food products, except
for inland fishing production, where the growth was even more dramatic. Yet, India’s annual
catch (3.44 million metric tonnes in 2013-14) is still substantially lower than its potential (4.41
million metric tonnes). This means that sustainable fishing is alarming and needs proper attention
for managing marine resources sustainably.
In the IOR, near to Indian sub-continent, the actual catches have seen relatively limited growth
of 12.3 per cent since 1990 despite increase in fishing frequency (Michel and Sticklor, 2012).
Although the actual reason for the same is subject for more research, lack of a robust fishery
management plan and oil spills/fires have been attributed as few of the causes of the same. Also,
catches and subsequent exploitation from non-littoral states such as France, Uruguay, Spain, and
Japan have seen an increase in recent times (FAO 2005). The recent advances in technology in
fishing industry such as fishing lines, trawlers, use of GPS, and high technology system to
venture in unexplored deep oceans in the fishing industry have also resulted in exacerbating the
fish catch exploitation both in terms of spread and volume. Hence, this poses a security challenge
to ensure that ‘over exploitation’ of open seas does not occur. Many of these fishing companies
receive huge subsidies from their governments. Though there have been discussions on banning
or at least reducing fisheries subsidies in different fora, including the WTO, there is virtually no
progress in this regard.
54 | P a g e
Environmental Challenges
The marine environment is facing a number of pressures, arising out of the needs of people, and
the multiple ways that coastal and marine areas are being utilized. According to some evaluation,
majority of mangroves and associated plant species are being endangered, and most of the plant
species are being threatened. Indiscriminate cutting, reclamation for agriculture and urbanization,
fuel and overgrazing by domestic cattle have long been threatening mangroves in India. The
globally-agreed goal (SDG14) is to achieve a 10 per cent target of marine protected areas by
2020. While the global achievement (3.41 per cent) is far below the target, Indian achievement
(1.65 per cent) is even far below the global average.
Overfishing
Overall catch risks declined with 75 per cent of stocks fully exploited or depleted (FAO, 2010).
Human activity has directly and markedly reduced ocean productivity; additional deficits may be
owing to climate change increased ocean stratification and reduction in nutrient mixing in open
seas. Global Ocean Observing System (GOOS) and related assessments show significant
warming trends from which model projections for 2040-2060 forecast a steady decline in ocean
productivity (IOC/UNESCO, IMO, FAO, UNDP, 2011).
It is estimated that 50 US$ billion per annum is lost owing to overfishing, and could be
progressively recovered through stock restoration. The implementation of sound management
measures brings promise of increased sustainable catches, lower energy utilisation and costs;
thereby securing livelihood and enhancing food security.
The Eastern Indian Ocean is still showing a high growth rate in catches. The Bay of Bengal and
Andaman Sea regions have seen steadily total catches increase, and there are no signs of the
catch levelling off. However, about 42 per cent of the catches in this area are attributed to the
category “marine fishes not identified”, which is a cause for concern as the proper assessment
becomes difficult. In the Western Indian Ocean, total catch seems to have reached an optimum.
A recent assessment has shown that narrow-barred Spanish mackerel, a migratory species found
in the Red Sea, Arabian Sea, Gulf of Oman, Persian Gulf, and off the coast along Pakistan and
India, has been fully fished to overfished. The Southwest Indian Ocean Fisheries Commission
conducted stock assessments for 140 species in its mandatory area in 2010 and found that
overall, 75 per cent of fish stocks are estimated to be fully fished or underfished, and 25 per cent
fished at unsustainable levels.
IUU and Population pressure
Declining and plateauing of marine resources has also been observed regarding certain species.
Unregulated increase in size of vessel and engine power, capture of juveniles, bycatch issues and
IUU fishing are leading to over exploitation of resources like Myctophids and Oceanic squids.
Lax enforcement of India’s Maritime Fishing Regulation Act that also needs effective
involvement of state and local governments, coastal pollution and population pressure are some
of the factors that keep India away to be able to have sustainable use of marine resources. In
55 | P a g e
India, most of coastal regions are low-lying and densely populated; with nearly 250 million
people living within 50 km of the coast. Average population density in coastal areas in India is
80 persons/sq. km (twice the global average). In some of the coastal states of India, the
population density reaches more than 1,000 people. As coastal population grows, sewage and
agriculture run-off (food production, aquaculture) become a threat to coastal waters, impacting
nursery habitat for already suffering fish Coastal development and shoreline hardening also
increases runoff (pollutants).
Plastic Use
There is an increasing concern about the risks and possible adverse effects of (micro) plastics to
organisms and human health. Plastics are generally divided into macroplastics and the smaller
microplastics, which include plastic particles <5 mm in diameter including nanoplastics.
Microplastics are of two types— primary microplastics that have been made intentionally and
secondary microplastics. Primary microplastics such as microbeads used in personal care and
cosmetic products are a significant direct source to the environment, especially if there is no
wastewater treatment in place. Secondary microplastics, on the other hand, are the result of the
gradual fragmentation, abrasion, or weathering of larger plastics. Land-based macroplastics and
microplastics are of global concern and their sources are diverse.
Sources of sea-based macroplastics are dominated by the fisheries sectors abandoned, lost or
otherwise discarded fishing gear (ALDFG) followed by aquaculture, shipping and offshore
industry and ship-based tourism. A very rough estimation indicates that ALDFG comprises up to
10 per cent of global marine litter by volume. The amount, distribution and effects of ALDFG
have risen substantially in the past decades with the rapid expansion of fishing effort and fishing
grounds, and the transition to synthetic, more durable and more buoyant materials used for
fishing gear. Marine species also get entangled in such ALDFG and are killed in the process.
According to a recent NCCR (National Centre of Coastal Research), after tourism, fishing was
the next biggest source of litter. While fishing nets were the major contributor, the processing of
fish on the beach also produced a lot of litter. Fishing litter accounted for 10%-22% of the total
plastic litter on the beaches.
Inter-ministerial coordination
There are several governance and institutional issues that need to be addressed, for example,
National Policy on Marine Fisheries. It aims at promoting livelihoods of fishing communities,
conservation of fishery resources, as well as maintaining ecological integrity of the marine
environment. Among other things, it recognised the role of the 2014 Voluntary Guidelines for
Securing Sustainable Small-scale Fisheries in the Context of Food Security and Poverty
Eradication. It recognizes ILO Work in Fishing Convention, 2007, and the need for international
cooperation. It also recognised the need to address the impact of land- and sea-based pollution as
well as climate change on fish stocks. However, a clear action plan for implementing the policy
is not yet developed. Though the Policy was developed by the Ministry of Agriculture, many of
the actions remain in the domain of several other ministries. For example, coastal zone regulation
56 | P a g e
is administered by the Ministry of Environment, Forests and Climate Change, and international
cooperation is the job of the Ministry of External Affairs.
The implementation of integrated, ecosystem-based approaches based on the best available
science in a precautionary context, plus the removal of fishery subsidies that drive
overexploitation offer the prospect of restoring key stocks and increasing catches.
5.1.2 Shipping and Port Facilities
Port-based global trade in both value and volume accounts for significant proportion. Sea-based
trading accounts for about eighty per cent of the global trade by volume and over seventy per
cent by value. For developing countries, on a national basis, these percentages are typically
higher. World seaborne trade grew by 4% in 2011 to 8.7 billion tonnes (UNCTAD, 2012);
despite global economic crisis. Additionally, container traffic is projected to triple by 2030
(OECD, 2012). In support of both trade and sustainability of sea and ocean-based trading, the
International Maritime Organization (IMO) has brought in new industry wide measures to
increase efficiency, reduce green-house gas emission and pollution. Though the management of
invasive alien species (IAS) from ballast water and hull fouling has been receiving some
attention, more needs to be done at the regional and global levels.
While in most countries in the Indian Ocean region, the issue is yet to take a prominent place in
policy discourse, Australia has not only adopted measures to treat ballast water before it is
released, and has also developed an online information repository system called National
System for the Prevention and Management of Marine Pest Incursions (NIMPIS). The system
provides information on biology, ecology and distribution (international and national) of invasive
marine pest species. The information within NIMPIS is used to support rapid responses to new
incursions, and assist in the management of existing introduced species in Australian waters.
This kind of information system can be developed in India.
Environmental Challenges
The Indian Ocean region witnesses around 70,000 ships in a year. This number may increase in
future due to ever- increasing trade routes, economic expansion, and collaborations among
countries. These increasing numbers in trade routes in recent years over the IOR and towards
Indian Coastline have also led to increase in ballast water release in the water surrounding Indian
coastline. Ballast water is used to provide stability to ships during transit and is flushed out in
every port of call. This is a primary source of introduction of invasive species. IUCN report of
2009 estimates movement of around 7000 species worldwide every day via ballast and a
transport of 10 billion tonnes of ballast water each year globally. The introduction of invasive
species results in environmental impacts by degradation of quality of water by changing in the
nutrient cycle, which results in biodiversity loss in the region. It also results in health impacts by
deteriorating the quality of drinking water by introducing certain harmful pathogens, disease -
causing bacteria and viruses, toxic phytoplankton, and coastal plants that may cause water
57 | P a g e
poisoning. The invasive species also results in economic impacts by disrupting local biological
water cycle affecting fish catch. These may also affect tourism and hamper infrastructural
progress owing to biofouling. Cultural impacts by hampering the native species that are
important for subsistence harvesting and degradation of indigenous habitats and waterways are
also associated with invasive species introduction. Ballast waters sometimes also contain oil,
solvents and other hazardous substances.
Another environmental damage that is associated with shipping is accidental oil spill. With major
source being the marine ships; the impacts of oil spills are widespread over marine bio-diversity
and bio-ecology and on regional economics. The facts that Indian Ocean Region not only
produces about 60 per cent of global oil and that about 70 per cent of global trade petroleum
products transit though this region indicate that this region is relatively more vulnerable to oil
spills.
Ship building, repair and dismantling
Ship recycling is an important activity for sustainable development perspective, and ship scraps
contribute to meet a good part of steel demand in India. India became an important country for
ship breaking due to its geographical advantage especially at a stretch in Gujarat. However, it
was soon realised that ship-breaking is a polluting activity, primarily because ships are not
manufactured keeping in mind implications of dismantling. To mandate construction of
sustainable ships, in December 2005, the 24th assembly of the IMO passed a resolution
requesting the MEPC to develop a “new legally binding instrument on ship recycling” for
regulating the “design, construction, operation and preparation of ships so as to facilitate safe and
environmentally sound recycling.
In 2013, India came up with a new regulatory instrument called the Ship Breaking Code 2013,
which is designed to improve working practices of the ship- recycling industry. The code is
inspired by and structured around the Hong Kong Convention, 2009. However, tangible benefits
sought to be achieved through it are yet to be materialised. The presence of multiple authorities
for obtaining certifications without any inter-se co-ordination has also created a gap.
Dry-docking can address most of the concerns associated with ship-breaking as it minimises the
release of toxins into the environment. This is because in dry-docking the ship is removed from
waters and dismantled only within a cement enclosure. The essential benefit of the enclosure is
that waste material can be stored in individual docks, which can then be cleaned regularly.
However, dry-docking is a more mechanised process and wholesale adoption of it could affect
livelihood of people engaged in ship- breaking in India.
Environmental Challenges
The building of ships depends on a large number of processes which by themselves constitute
significant risks of damage to the surrounding environment of shipyards. In addition, ship-
building uses some materials which not only may carry serious implications for environmental
58 | P a g e
pollution during their production and usage in ship construction process, but may also
subsequently result in pollution during ship repairing, operation, and recycling activities.
Construction, maintenance, and repair activities involve generation and daily handling of a large
number of toxic materials, fumes and fluids. Metal work and surface treatment operations, for
example, generate particulate matter (PM) emissions and may lead to discharge of toxic
compounds to soil and water. Routine maintenance activities generate waste engine fluids, such
as oil, hydraulic fluids, lubricants, and anti-freeze. Fuelling activities generate waste liquids and
vapour releases to the air. The extensive use of underground storage tanks likewise carries the
risk of the release of pollutants, which may harm aquatic life.
5.2 Emerging Sectors
5.2.1 Aquaculture
Aquaculture provides for forty-seven per cent of fish for human consumption (FAO, 2010). Fish
used for human consumption was more than 90 million tonnes in the period 1960-2009 (from 27
to 118 million tonnes), and aquaculture is projected to soon surpass capture fisheries as the
primary provider of such a protein source. This is in spite of decreasing diversity and size of fish
being harvested from the oceans.
To maintain its viability and growth without undermining wild fisheries, the aquaculture industry
must actively reduce proportion of industrial fish in fishmeal (IFFO, 2013). Research indicates
that at least 50 per cent of fishmeal and 50-80 per cent of oil in salmonid (the largest component
of aquaculture production) and 30-80 per cent off fishmeal and up to 60 per cent of oil in marine
fish diets can ultimately be replaced with vegetable substitutes, thus greatly increasing the scope
for industry expansion (PARM, 2004).
Environmental Challenges
Aquaculture is emerging, but has potential threats to environment. Over-fishing and
environmentally-harmful fishing practices are the other major environmental concerns. Such
problems normally increase with increased mechanisation of fishing techniques. Accidentally, in
India, degree of mechanization is still quite low compared to the global practices. For example,
in 2011, the annual average production of fish farmers in Norway was 195 tonnes per person,
compared with 55 tonnes in Chile, 25 tonnes in Turkey, 10 tonnes in Malaysia, about 7 tonnes in
China, about 4 tonnes in Thailand, and only about 1 tonne in India and Indonesia.
5.2.2 Energy
The offshore fields accounted for 32 per cent of worldwide crude oil production, and this is
projected to rise to 34 per cent in 2025 (IEA, 2010) and further higher subsequently, as almost
half of the remaining recoverable conventional oil is estimated to be in offshore fields - a quarter
of that in deep water (IEA, 2012). The market pressures for deep water oil drilling are making
59 | P a g e
exploration for and tapping of evermore remote reserves cost- effective, bringing the most
isolated areas under consideration.
About 40 per cent of global off-shore production of oil takes place in the Indian Ocean region in
several off-shore sites in India, Saudi Arabia, Iran, Malaysia, Indonesia and Australia
(Venkatshamy 2016). In the Persian Gulf region, the off-shore reserves are not yet exploited due
to existence of substantial on-shore reserves, but in future, they are likely to be exploited
(Herbert-Burns 2012). Similarly, this region is also contributing hugely in natural gas
production. Recent discovery of natural gas off Tanzania and discovery of gas hydrates near
Andaman in India indicate that production of oil and gas is going to increase in this region.
In addition to non-renewables, the oceans offer enormous potential for the generation of
renewable energy – wind, wave, tidal, biomass, thermal conversion and salinity gradients. Of
these, the offshore wind energy industry is the most developed of the ocean-based energy
sources. Global installed capacity was only a little over 6 GW in 2012, but this quadrupled in
2014; relatively conservative estimates suggest that this can grow to 175 GW by 2035 (IEA,
2012). Additionally, Seabed exploration for methane hydrates, a potentially enormous source of
hydrocarbons, is on the increase.
On the energy front, algal biofuels offer promising prospects. The European science Foundation
postulates a production volume of 20-80 thousand litres of oil per hectare per year, which can be
achieved from microalgal culture; with even lower part of this range being considerably higher
than terrestrial biofuel crops.
5.2.3 Biotechnology
Along the 7516 km- long coast line, India has its exclusive economic zone of about 2.172 million
square kilometres, which is rich in marine bio-resources. The coastal and offshore environment
of India supports rich biodiversity as benthic fauna, bacteria, fungi, and zooplankton species are
abundantly available. Over 630 species of marine algae have been reported.
The global market for marine biotechnology products and processes has grown to around US$
4.6 billion in 2017. Marine biotech has the potential to address a suite of global challenges such
as sustainable food supplies, human health, energy security and environmental remediation
(IOC/UNESCO, IMO, FAO, UNDP, 2011).
Marine biodiversity is a rich source of potential drugs. In 2011, there were over 36 marine
derived drugs in clinical development, including 15 for treatment of cancer. One area where
marine biotech may make a critical contribution is the development of new antibiotics (Hunt &
Vincent, 2006; Leary et al., 2009).
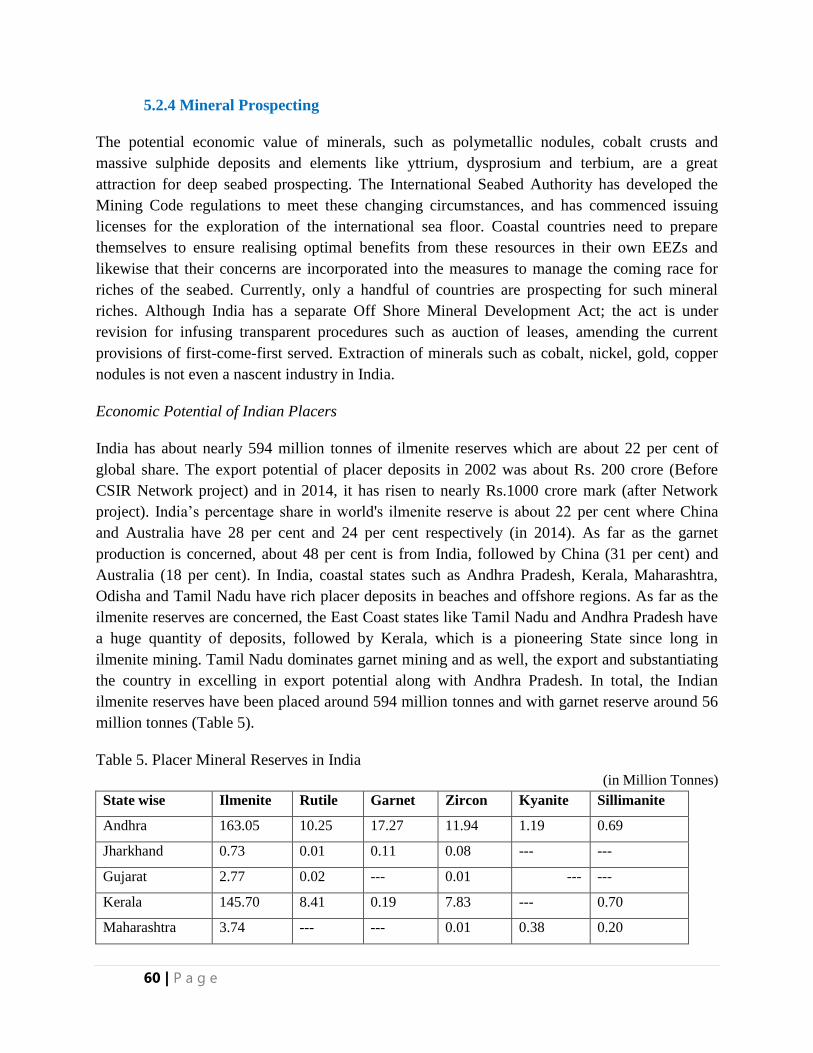
60 | P a g e
5.2.4 Mineral Prospecting
The potential economic value of minerals, such as polymetallic nodules, cobalt crusts and
massive sulphide deposits and elements like yttrium, dysprosium and terbium, are a great
attraction for deep seabed prospecting. The International Seabed Authority has developed the
Mining Code regulations to meet these changing circumstances, and has commenced issuing
licenses for the exploration of the international sea floor. Coastal countries need to prepare
themselves to ensure realising optimal benefits from these resources in their own EEZs and
likewise that their concerns are incorporated into the measures to manage the coming race for
riches of the seabed. Currently, only a handful of countries are prospecting for such mineral
riches. Although India has a separate Off Shore Mineral Development Act; the act is under
revision for infusing transparent procedures such as auction of leases, amending the current
provisions of first-come-first served. Extraction of minerals such as cobalt, nickel, gold, copper
nodules is not even a nascent industry in India.
Economic Potential of Indian Placers
India has about nearly 594 million tonnes of ilmenite reserves which are about 22 per cent of
global share. The export potential of placer deposits in 2002 was about Rs. 200 crore (Before
CSIR Network project) and in 2014, it has risen to nearly Rs.1000 crore mark (after Network
project). India’s percentage share in world's ilmenite reserve is about 22 per cent where China
and Australia have 28 per cent and 24 per cent respectively (in 2014). As far as the garnet
production is concerned, about 48 per cent is from India, followed by China (31 per cent) and
Australia (18 per cent). In India, coastal states such as Andhra Pradesh, Kerala, Maharashtra,
Odisha and Tamil Nadu have rich placer deposits in beaches and offshore regions. As far as the
ilmenite reserves are concerned, the East Coast states like Tamil Nadu and Andhra Pradesh have
a huge quantity of deposits, followed by Kerala, which is a pioneering State since long in
ilmenite mining. Tamil Nadu dominates garnet mining and as well, the export and substantiating
the country in excelling in export potential along with Andhra Pradesh. In total, the Indian
ilmenite reserves have been placed around 594 million tonnes and with garnet reserve around 56
million tonnes (Table 5).
Table 5. Placer Mineral Reserves in India
(in Million Tonnes)
State wise Ilmenite Rutile Garnet Zircon Kyanite Sillimanite
Andhra 163.05 10.25 17.27 11.94 1.19 0.69
Jharkhand 0.73 0.01 0.11 0.08 --- ---
Gujarat 2.77 0.02 --- 0.01 --- ---
Kerala 145.70 8.41 0.19 7.83 --- 0.70
Maharashtra 3.74 --- --- 0.01 0.38 0.20
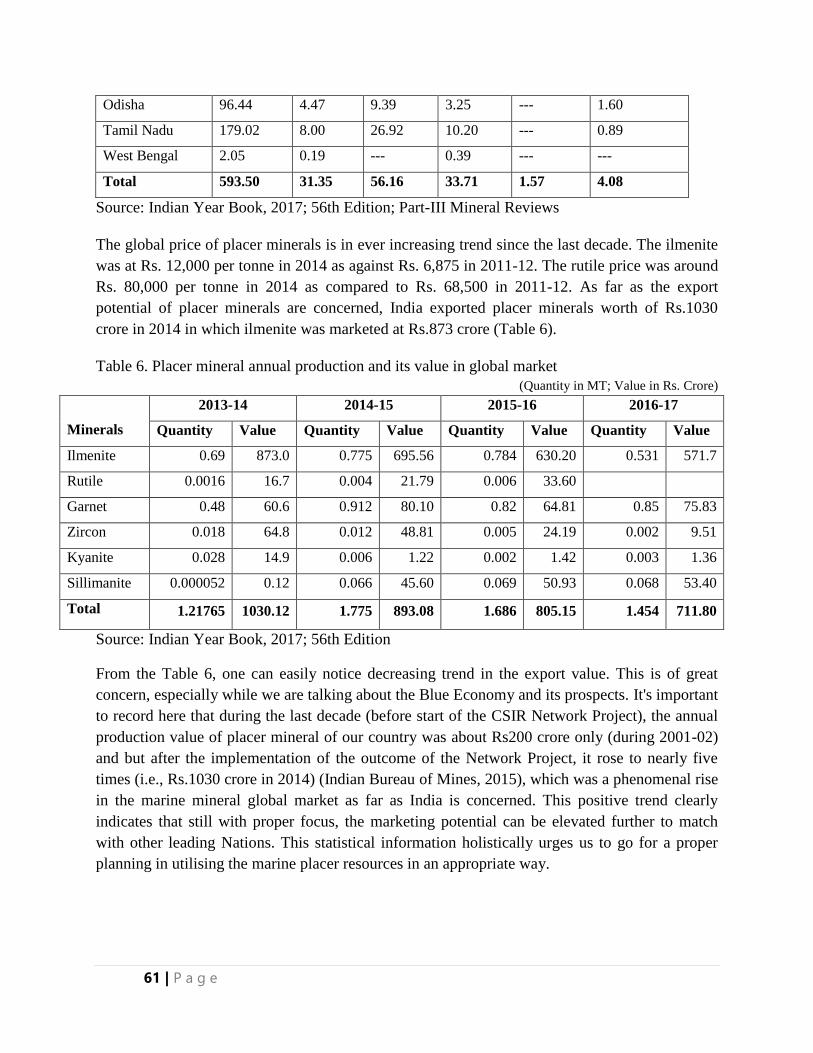
61 | P a g e
Odisha 96.44 4.47 9.39 3.25 --- 1.60
Tamil Nadu 179.02 8.00 26.92 10.20 --- 0.89
West Bengal 2.05 0.19 --- 0.39 --- ---
Total 593.50 31.35 56.16 33.71 1.57 4.08
Source: Indian Year Book, 2017; 56th Edition; Part-III Mineral Reviews
The global price of placer minerals is in ever increasing trend since the last decade. The ilmenite
was at Rs. 12,000 per tonne in 2014 as against Rs. 6,875 in 2011-12. The rutile price was around
Rs. 80,000 per tonne in 2014 as compared to Rs. 68,500 in 2011-12. As far as the export
potential of placer minerals are concerned, India exported placer minerals worth of Rs.1030
crore in 2014 in which ilmenite was marketed at Rs.873 crore (Table 6).
Table 6. Placer mineral annual production and its value in global market
(Quantity in MT; Value in Rs. Crore)
Minerals
2013-14 2014-15 2015-16 2016-17
Quantity Value Quantity Value Quantity Value Quantity Value
Ilmenite 0.69 873.0 0.775 695.56 0.784 630.20 0.531 571.7
Rutile 0.0016 16.7 0.004 21.79 0.006 33.60
Garnet 0.48 60.6 0.912 80.10 0.82 64.81 0.85 75.83
Zircon 0.018 64.8 0.012 48.81 0.005 24.19 0.002 9.51
Kyanite 0.028 14.9 0.006 1.22 0.002 1.42 0.003 1.36
Sillimanite 0.000052 0.12 0.066 45.60 0.069 50.93 0.068 53.40
Total 1.21765 1030.12 1.775 893.08 1.686 805.15 1.454 711.80
Source: Indian Year Book, 2017; 56th Edition
From the Table 6, one can easily notice decreasing trend in the export value. This is of great
concern, especially while we are talking about the Blue Economy and its prospects. It's important
to record here that during the last decade (before start of the CSIR Network Project), the annual
production value of placer mineral of our country was about Rs200 crore only (during 2001-02)
and but after the implementation of the outcome of the Network Project, it rose to nearly five
times (i.e., Rs.1030 crore in 2014) (Indian Bureau of Mines, 2015), which was a phenomenal rise
in the marine mineral global market as far as India is concerned. This positive trend clearly
indicates that still with proper focus, the marketing potential can be elevated further to match
with other leading Nations. This statistical information holistically urges us to go for a proper
planning in utilising the marine placer resources in an appropriate way.
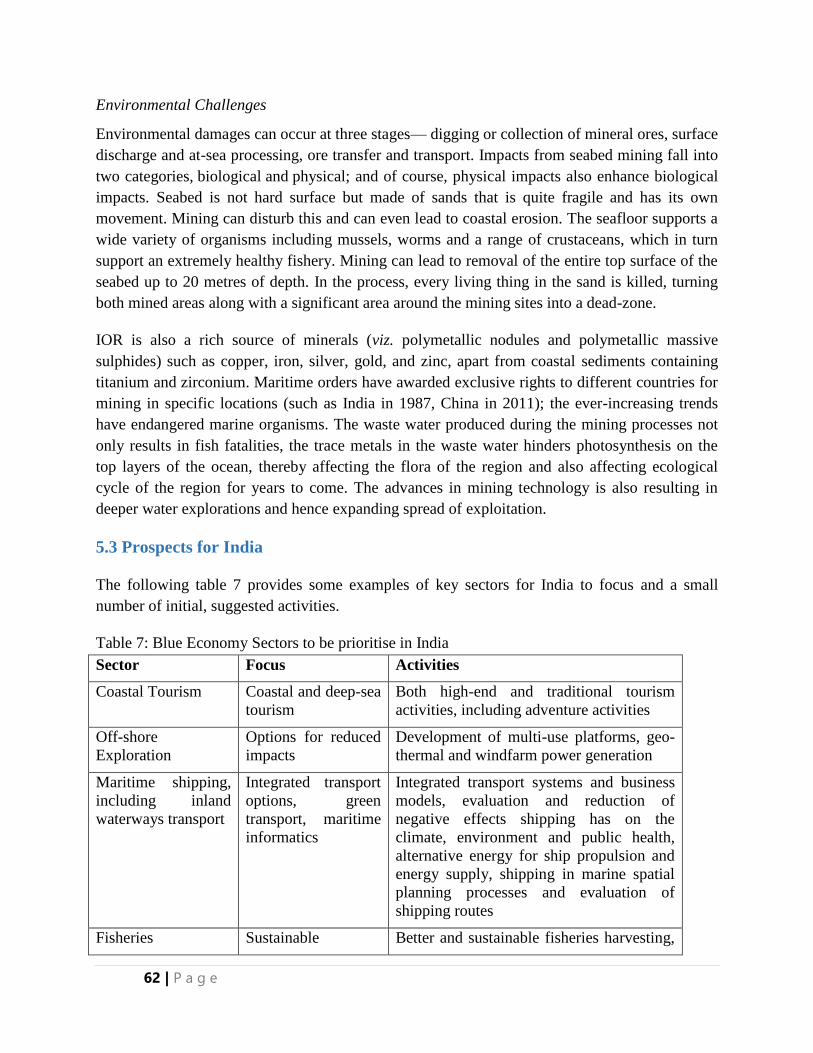
62 | P a g e
Environmental Challenges
Environmental damages can occur at three stages— digging or collection of mineral ores, surface
discharge and at-sea processing, ore transfer and transport. Impacts from seabed mining fall into
two categories, biological and physical; and of course, physical impacts also enhance biological
impacts. Seabed is not hard surface but made of sands that is quite fragile and has its own
movement. Mining can disturb this and can even lead to coastal erosion. The seafloor supports a
wide variety of organisms including mussels, worms and a range of crustaceans, which in turn
support an extremely healthy fishery. Mining can lead to removal of the entire top surface of the
seabed up to 20 metres of depth. In the process, every living thing in the sand is killed, turning
both mined areas along with a significant area around the mining sites into a dead-zone.
IOR is also a rich source of minerals (viz. polymetallic nodules and polymetallic massive
sulphides) such as copper, iron, silver, gold, and zinc, apart from coastal sediments containing
titanium and zirconium. Maritime orders have awarded exclusive rights to different countries for
mining in specific locations (such as India in 1987, China in 2011); the ever-increasing trends
have endangered marine organisms. The waste water produced during the mining processes not
only results in fish fatalities, the trace metals in the waste water hinders photosynthesis on the
top layers of the ocean, thereby affecting the flora of the region and also affecting ecological
cycle of the region for years to come. The advances in mining technology is also resulting in
deeper water explorations and hence expanding spread of exploitation.
5.3 Prospects for India
The following table 7 provides some examples of key sectors for India to focus and a small
number of initial, suggested activities.
Table 7: Blue Economy Sectors to be prioritise in India
Sector Focus Activities
Coastal Tourism Coastal and deep-sea
tourism
Both high-end and traditional tourism
activities, including adventure activities
Off-shore
Exploration
Options for reduced
impacts
Development of multi-use platforms, geo-
thermal and windfarm power generation
Maritime shipping,
including inland
waterways transport
Integrated transport
options, green
transport, maritime
informatics
Integrated transport systems and business
models, evaluation and reduction of
negative effects shipping has on the
climate, environment and public health,
alternative energy for ship propulsion and
energy supply, shipping in marine spatial
planning processes and evaluation of
shipping routes
Fisheries Sustainable Better and sustainable fisheries harvesting,
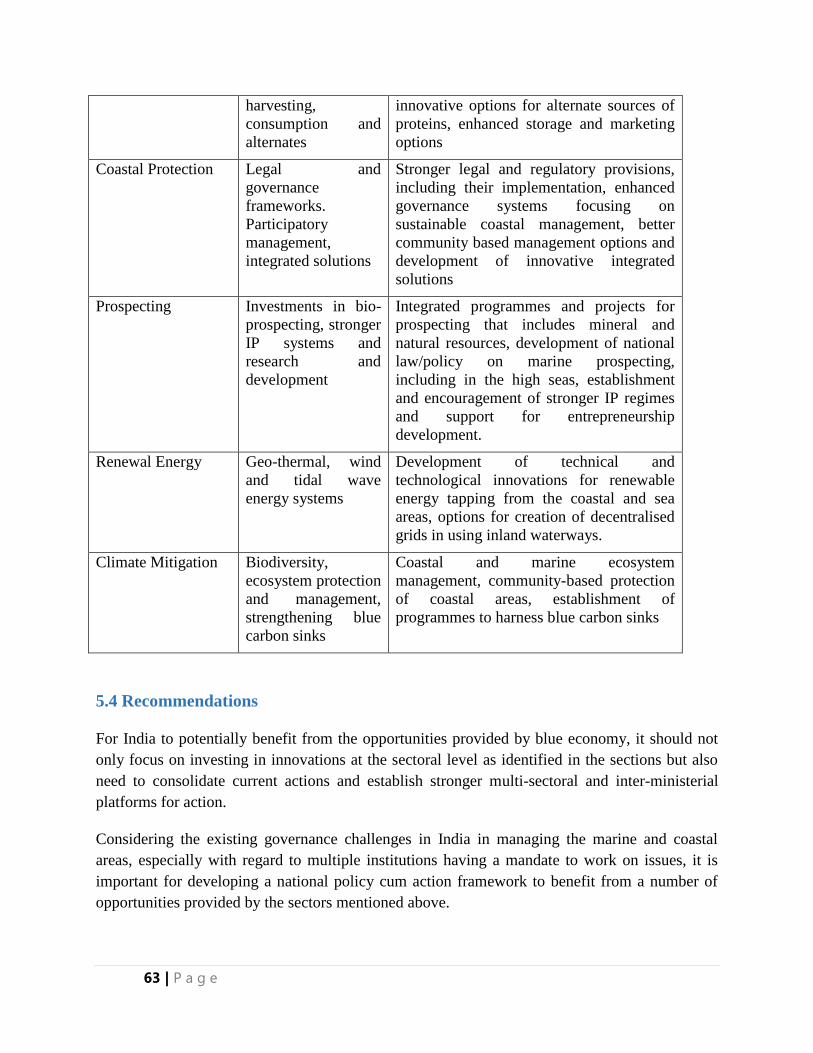
63 | P a g e
harvesting,
consumption and
alternates
innovative options for alternate sources of
proteins, enhanced storage and marketing
options
Coastal Protection
Legal and
governance
frameworks.
Participatory
management,
integrated solutions
Stronger legal and regulatory provisions,
including their implementation, enhanced
governance systems focusing on
sustainable coastal management, better
community based management options and
development of innovative integrated
solutions
Prospecting
Investments in bio-
prospecting, stronger
IP systems and
research and
development
Integrated programmes and projects for
prospecting that includes mineral and
natural resources, development of national
law/policy on marine prospecting,
including in the high seas, establishment
and encouragement of stronger IP regimes
and support for entrepreneurship
development.
Renewal Energy
Geo-thermal, wind
and tidal wave
energy systems
Development of technical and
technological innovations for renewable
energy tapping from the coastal and sea
areas, options for creation of decentralised
grids in using inland waterways.
Climate Mitigation
Biodiversity,
ecosystem protection
and management,
strengthening blue
carbon sinks
Coastal and marine ecosystem
management, community-based protection
of coastal areas, establishment of
programmes to harness blue carbon sinks
5.4 Recommendations
For India to potentially benefit from the opportunities provided by blue economy, it should not
only focus on investing in innovations at the sectoral level as identified in the sections but also
need to consolidate current actions and establish stronger multi-sectoral and inter-ministerial
platforms for action.
Considering the existing governance challenges in India in managing the marine and coastal
areas, especially with regard to multiple institutions having a mandate to work on issues, it is
important for developing a national policy cum action framework to benefit from a number of
opportunities provided by the sectors mentioned above.
64 | P a g e
Though some of the current legal frameworks are focusing on some sectors of blue economy,
their implementation has been weak and disconnected. There is, therefore, a need for
strengthening synergies among relevant policies, regulatory and legal frameworks in the country.
Some recommendations are provided below:
Fishing
Set up mechanisms to implement Maritime Fishing Regulation Act to promote
sustainable fishery industry with control on depletion of resources.
Promote industrial fishing through planned approach for mechanisation of fishing vessels
incorporated with environment-friendly technologies.
Prepare an Action Plan to implement the 2017 National Policy on Marine Fisheries.
Consolidate existing and proposed fisheries management measures to reduce adverse
effects of ALDFG which is contributing to marine debris by using bio-degradable fishing
nets and other fiscal measures.
Appropriate data collection mechanism to be evolved to collect information on various
aspects of ALDFG.
Marine Bio-diversity
Set up a task force to look at the possibility of expanding the marine protected areas
without affecting economic activities and livelihood.
Enforce measures to reduce plastic pollution from seas, coastal and land based activities,
by invoking extended producers’ responsibility for recycling plastics and packaging
materials to reduce marine and coastal litter.
Mining
Take measures to regulate mining activities in the areas having rich bio-diversity to
minimise environmental impacts.
Develop regulatory mechanisms to ensure minimal discharge of mining and discharge
back onto the actual area mined or into low current areas.
Evolve appropriate regulations for mining of offshore oil and gas to reduce the content of
chemicals having hazardous impact on environment.
Shipping and Ports
Enforce compulsory use of technologies to treat ballast water on board in maritime acts
or laws for reducing incursion of invasive species. State governments may implement
technology solution to ballast water to safeguard biodiversity through coherent and robust
coordination among each other.
65 | P a g e
Introduce measures for early detection and response to eradicated spread of invasive alien
species. Encourage baseline surveys, surveillance, monitoring and contingency planning
for preventing adverse effects of ballast water discharge on marine ecosystem.
Use environment friendly technologies and practices, to curb oil spills, which may be
promoted through National environmental and legal framework.
Enforce regulations on safety of ships to prevent oil spill, in the event of accidents.
Formulate a disaster management plan for preparedness, response and recovery to deal
with oil spills through an agreement between States and Centre to lessen the impact.
Implement use of renewable energy to replace bunker fuel in order to avoid occurrences
of oil spill and emission of NOx and SOx.
Adopt use of renewable energy as part of the Green Port Project to supply port-to-ship
power in all ports in a time bound manner in India.
Coordinate and implement Ship Breaking Code 2013 through beaching process for ship
breaking industry in the country.
Adopt dry dock facilities for harbouring relatively more hazardous ships.

66 | P a g e
67 | P a g e
Chapter 6. Skill Development and Employment
6.1 Overview
As blue economy is increasingly viewed as a new source of economic growth and diversification
in India, it is imperative to explore employment opportunities that different sectors of blue
economy offer and the specific skills that are needed to match job profiles in those sectors. The
level of technological sophistication and human labour component vary widely across marine
manufacturing sectors, which determine the nature and type of job roles created in those sectors.
And the services sectors of blue economy also have a strong technology component including
information technology applications. However, this would certainly need professionals with
specific domain knowledge to carry out various functions. It entails that the number of people
employed and the diversity of required skill sets involving engineering, technical, managerial,
operational and other semi-skilled functions differ significantly in high-technology sectors like
deep-sea mining, marine biotechnology, ship- building and repairing and marine engineering,
and services sectors such as coastal tourism, banking and insurance, legal services, and others.
Employment generation is one of the key objectives of promoting blue economy in India. Given
the large workforce in the country, the additional job creation in blue economy sectors would
contribute to livelihood diversification and raise standard of living of the people. It assumes
significance in view of the prolonged stagnation in manufacturing and disguised unemployment
in agriculture and informal sectors. As per the international experience, it is not an exaggeration
in noting that the potential employment in blue economy sectors is much higher than the existing
level of employment. Besides, scope for job- creation in the domestic economy, trade in blue
goods and services can create millions of jobs. For instance, the sectors such as fisheries, port
and shipping, marine biotechnology, renewable ocean energy, deep sea mining, coastal tourism
and marine services have strong forward and backward linkages. Moreover, value- addition can
strengthen employability of local labour force as expanded market access for exports may inspire
them to acquire higher skills as competition-induced catch up to global standards intensifies. For
instance, growth in processed fish exports would not only push domestic fishing industry to
match the global standards but enable augmentation of skills and capabilities of the existing
workforce in the fishing sector.
6.2 Nature and Types of Jobs in Blue Economy
As highlighted above, blue economy includes several sectors with varying levels of
technological applications and human labour requirement. Broadly, the job roles in blue
economy can be classified into six categories — operative grades, administration, skilled trades,
associate professional & technical, professional, and management. However, there may be
several sub-categories under each job category (EGFSN, 2015). The varieties of job roles in five
broad sectors including seafood and bio-products; maritime transport, shipbuilding and services;
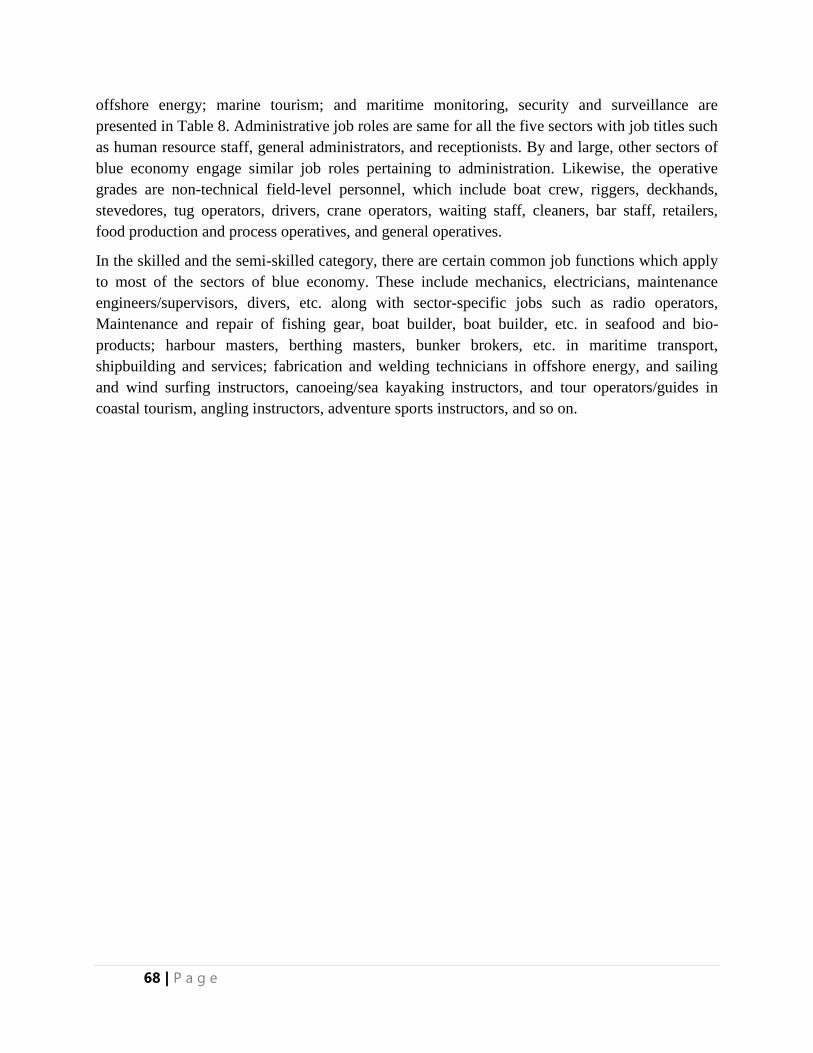
68 | P a g e
offshore energy; marine tourism; and maritime monitoring, security and surveillance are
presented in Table 8. Administrative job roles are same for all the five sectors with job titles such
as human resource staff, general administrators, and receptionists. By and large, other sectors of
blue economy engage similar job roles pertaining to administration. Likewise, the operative
grades are non-technical field-level personnel, which include boat crew, riggers, deckhands,
stevedores, tug operators, drivers, crane operators, waiting staff, cleaners, bar staff, retailers,
food production and process operatives, and general operatives.
In the skilled and the semi-skilled category, there are certain common job functions which apply
to most of the sectors of blue economy. These include mechanics, electricians, maintenance
engineers/supervisors, divers, etc. along with sector-specific jobs such as radio operators,
Maintenance and repair of fishing gear, boat builder, boat builder, etc. in seafood and bio-
products; harbour masters, berthing masters, bunker brokers, etc. in maritime transport,
shipbuilding and services; fabrication and welding technicians in offshore energy, and sailing
and wind surfing instructors, canoeing/sea kayaking instructors, and tour operators/guides in
coastal tourism, angling instructors, adventure sports instructors, and so on.
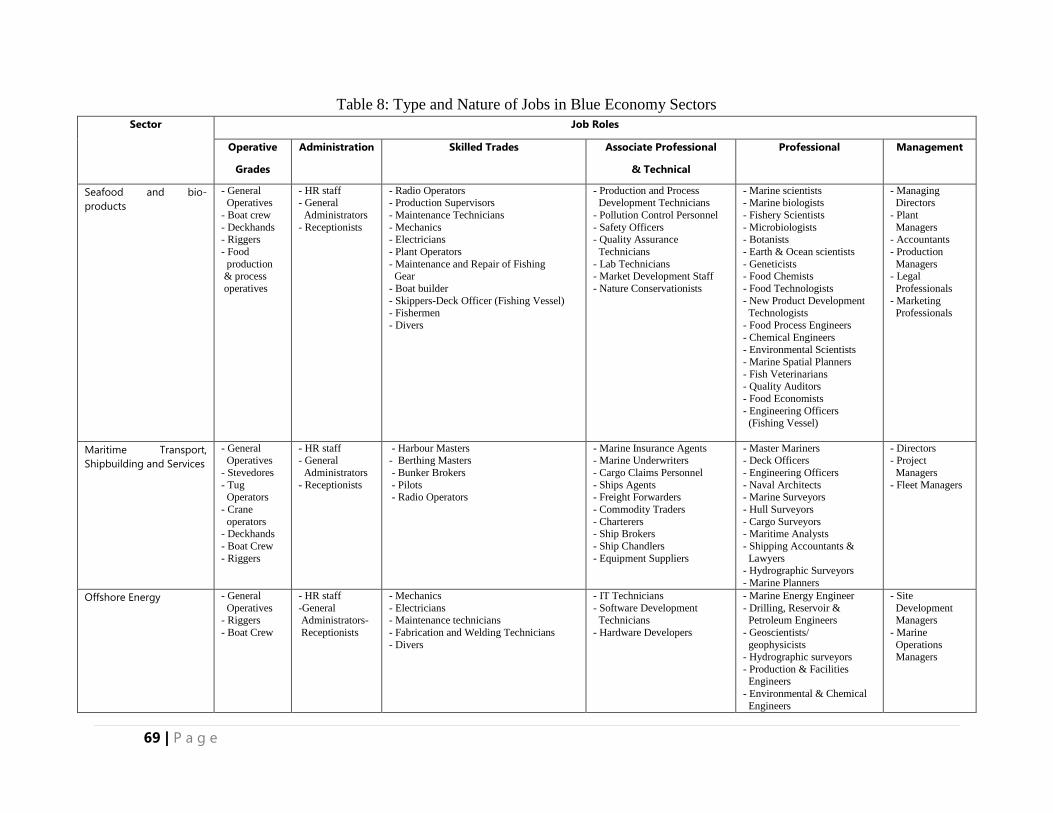
69 | P a g e
Table 8: Type and Nature of Jobs in Blue Economy Sectors
Sector Job Roles
Operative
Grades
Administration Skilled Trades Associate Professional
& Technical
Professional Management
Seafood and bio-
products
- General Operatives
- Boat crew
- Deckhands - Riggers
- Food
production & process
operatives
- HR staff - General
Administrators
- Receptionists
- Radio Operators - Production Supervisors
- Maintenance Technicians
- Mechanics - Electricians
- Plant Operators
- Maintenance and Repair of Fishing Gear
- Boat builder
- Skippers-Deck Officer (Fishing Vessel) - Fishermen
- Divers
- Production and Process Development Technicians
- Pollution Control Personnel
- Safety Officers - Quality Assurance
Technicians
- Lab Technicians - Market Development Staff
- Nature Conservationists
- Marine scientists - Marine biologists
- Fishery Scientists
- Microbiologists - Botanists
- Earth & Ocean scientists
- Geneticists - Food Chemists
- Food Technologists
- New Product Development Technologists
- Food Process Engineers
- Chemical Engineers - Environmental Scientists
- Marine Spatial Planners
- Fish Veterinarians - Quality Auditors
- Food Economists
- Engineering Officers (Fishing Vessel)
- Managing Directors
- Plant
Managers - Accountants
- Production
Managers - Legal
Professionals
- Marketing Professionals
Maritime Transport,
Shipbuilding and Services
- General Operatives
- Stevedores
- Tug Operators
- Crane
operators - Deckhands
- Boat Crew
- Riggers
- HR staff - General
Administrators
- Receptionists
- Harbour Masters - Berthing Masters
- Bunker Brokers
- Pilots - Radio Operators
- Marine Insurance Agents - Marine Underwriters
- Cargo Claims Personnel
- Ships Agents - Freight Forwarders
- Commodity Traders
- Charterers - Ship Brokers
- Ship Chandlers
- Equipment Suppliers
- Master Mariners - Deck Officers
- Engineering Officers
- Naval Architects - Marine Surveyors
- Hull Surveyors
- Cargo Surveyors - Maritime Analysts
- Shipping Accountants &
Lawyers - Hydrographic Surveyors
- Marine Planners
- Directors - Project
Managers
- Fleet Managers
Offshore Energy - General
Operatives
- Riggers
- Boat Crew
- HR staff
-General
Administrators-
Receptionists
- Mechanics
- Electricians
- Maintenance technicians
- Fabrication and Welding Technicians
- Divers
- IT Technicians
- Software Development
Technicians
- Hardware Developers
- Marine Energy Engineer
- Drilling, Reservoir &
Petroleum Engineers
- Geoscientists/
geophysicists - Hydrographic surveyors
- Production & Facilities Engineers
- Environmental & Chemical
Engineers
- Site
Development
Managers
- Marine
Operations Managers
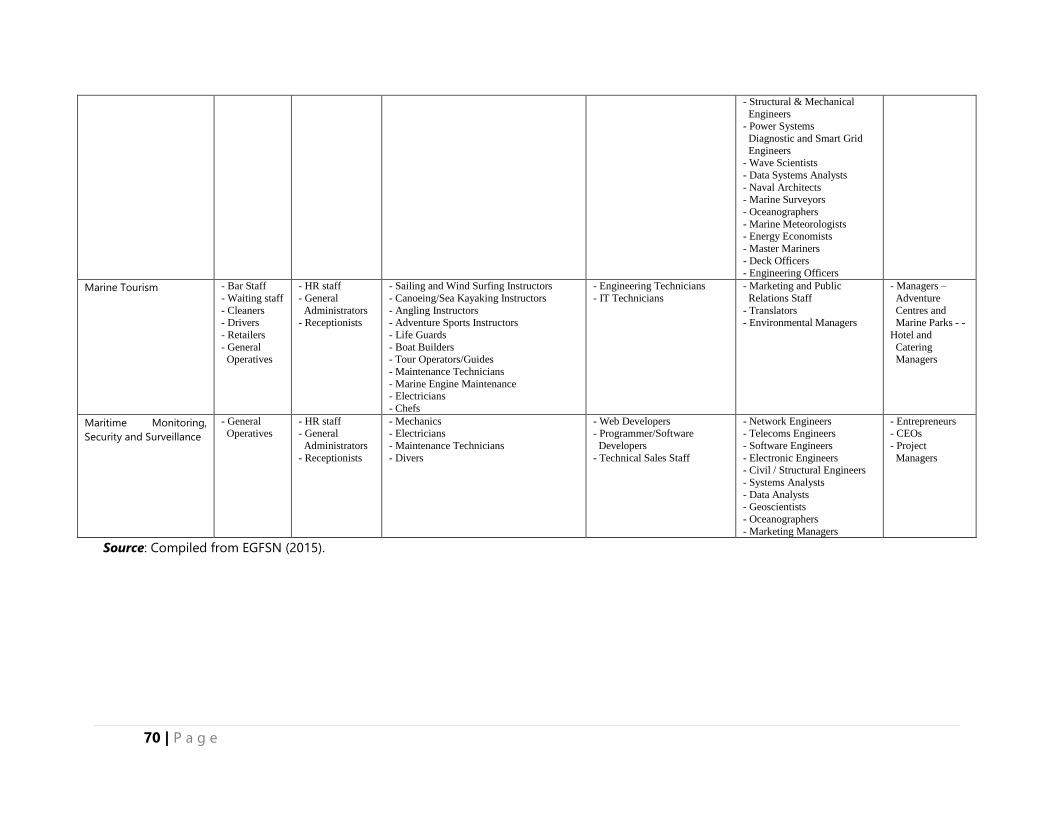
70 | P a g e
- Structural & Mechanical
Engineers - Power Systems
Diagnostic and Smart Grid
Engineers - Wave Scientists
- Data Systems Analysts
- Naval Architects - Marine Surveyors
- Oceanographers
- Marine Meteorologists - Energy Economists
- Master Mariners
- Deck Officers - Engineering Officers
Marine Tourism - Bar Staff
- Waiting staff
- Cleaners - Drivers
- Retailers
- General Operatives
- HR staff
- General
Administrators - Receptionists
- Sailing and Wind Surfing Instructors
- Canoeing/Sea Kayaking Instructors
- Angling Instructors - Adventure Sports Instructors
- Life Guards
- Boat Builders - Tour Operators/Guides
- Maintenance Technicians
- Marine Engine Maintenance - Electricians
- Chefs
- Engineering Technicians
- IT Technicians
- Marketing and Public
Relations Staff
- Translators - Environmental Managers
- Managers –
Adventure
Centres and Marine Parks - -
Hotel and
Catering Managers
Maritime Monitoring,
Security and Surveillance
- General Operatives
- HR staff - General
Administrators
- Receptionists
- Mechanics - Electricians
- Maintenance Technicians
- Divers
- Web Developers - Programmer/Software
Developers
- Technical Sales Staff
- Network Engineers - Telecoms Engineers
- Software Engineers
- Electronic Engineers - Civil / Structural Engineers
- Systems Analysts
- Data Analysts - Geoscientists
- Oceanographers
- Marketing Managers
- Entrepreneurs - CEOs
- Project
Managers
Source: Compiled from EGFSN (2015).
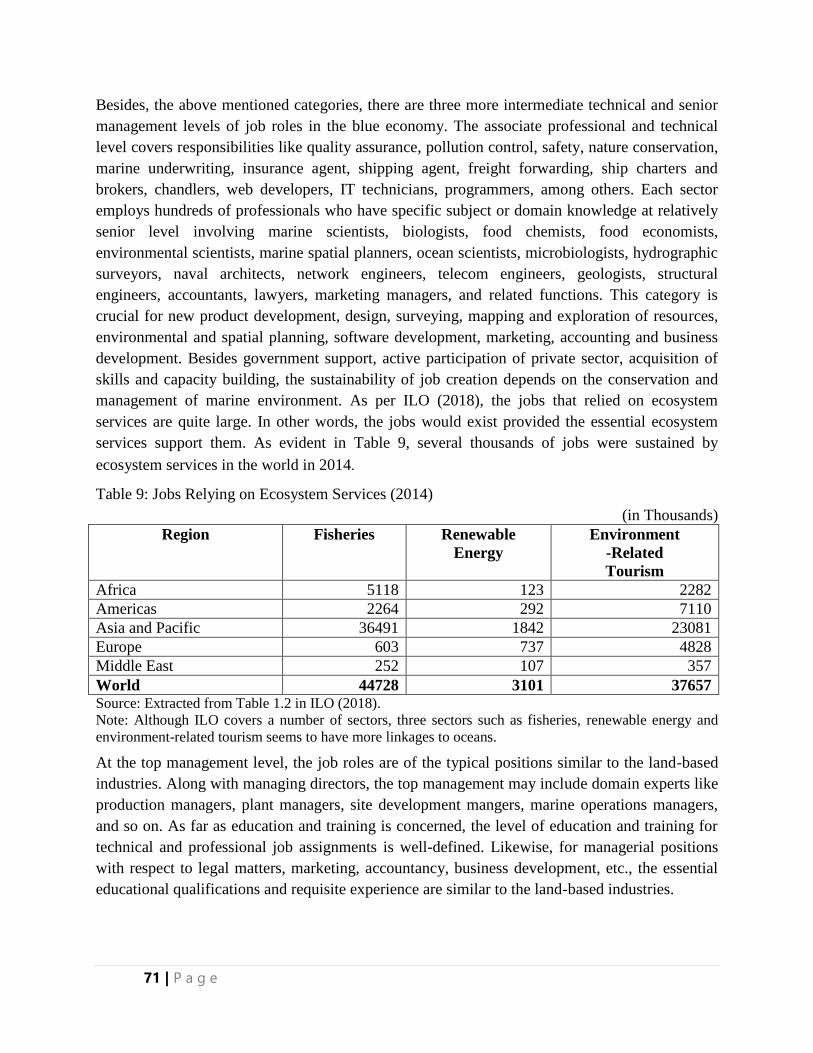
71 | P a g e
Besides, the above mentioned categories, there are three more intermediate technical and senior
management levels of job roles in the blue economy. The associate professional and technical
level covers responsibilities like quality assurance, pollution control, safety, nature conservation,
marine underwriting, insurance agent, shipping agent, freight forwarding, ship charters and
brokers, chandlers, web developers, IT technicians, programmers, among others. Each sector
employs hundreds of professionals who have specific subject or domain knowledge at relatively
senior level involving marine scientists, biologists, food chemists, food economists,
environmental scientists, marine spatial planners, ocean scientists, microbiologists, hydrographic
surveyors, naval architects, network engineers, telecom engineers, geologists, structural
engineers, accountants, lawyers, marketing managers, and related functions. This category is
crucial for new product development, design, surveying, mapping and exploration of resources,
environmental and spatial planning, software development, marketing, accounting and business
development. Besides government support, active participation of private sector, acquisition of
skills and capacity building, the sustainability of job creation depends on the conservation and
management of marine environment. As per ILO (2018), the jobs that relied on ecosystem
services are quite large. In other words, the jobs would exist provided the essential ecosystem
services support them. As evident in Table 9, several thousands of jobs were sustained by
ecosystem services in the world in 2014.
Table 9: Jobs Relying on Ecosystem Services (2014)
(in Thousands)
Region Fisheries Renewable
Energy
Environment
-Related
Tourism
Africa 5118 123 2282
Americas 2264 292 7110
Asia and Pacific 36491 1842 23081
Europe 603 737 4828
Middle East 252 107 357
World 44728 3101 37657 Source: Extracted from Table 1.2 in ILO (2018).
Note: Although ILO covers a number of sectors, three sectors such as fisheries, renewable energy and
environment-related tourism seems to have more linkages to oceans.
At the top management level, the job roles are of the typical positions similar to the land-based
industries. Along with managing directors, the top management may include domain experts like
production managers, plant managers, site development mangers, marine operations managers,
and so on. As far as education and training is concerned, the level of education and training for
technical and professional job assignments is well-defined. Likewise, for managerial positions
with respect to legal matters, marketing, accountancy, business development, etc., the essential
educational qualifications and requisite experience are similar to the land-based industries.
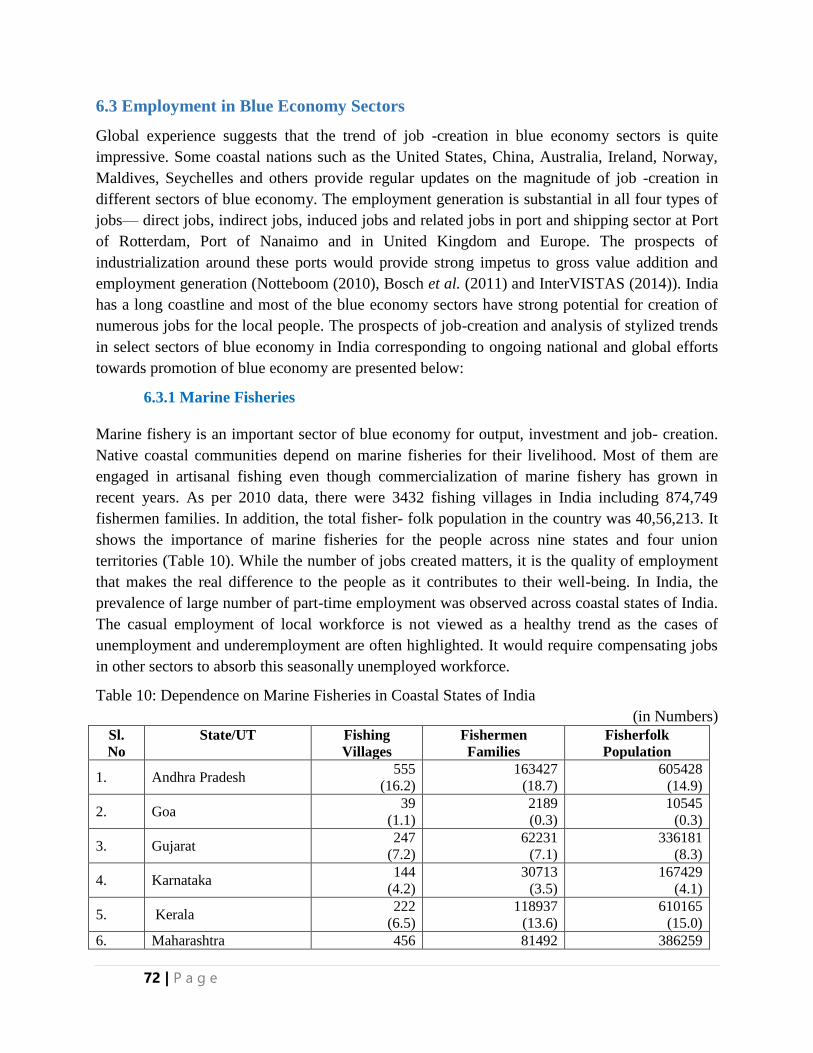
72 | P a g e
6.3 Employment in Blue Economy Sectors
Global experience suggests that the trend of job -creation in blue economy sectors is quite
impressive. Some coastal nations such as the United States, China, Australia, Ireland, Norway,
Maldives, Seychelles and others provide regular updates on the magnitude of job -creation in
different sectors of blue economy. The employment generation is substantial in all four types of
jobs— direct jobs, indirect jobs, induced jobs and related jobs in port and shipping sector at Port
of Rotterdam, Port of Nanaimo and in United Kingdom and Europe. The prospects of
industrialization around these ports would provide strong impetus to gross value addition and
employment generation (Notteboom (2010), Bosch et al. (2011) and InterVISTAS (2014)). India
has a long coastline and most of the blue economy sectors have strong potential for creation of
numerous jobs for the local people. The prospects of job-creation and analysis of stylized trends
in select sectors of blue economy in India corresponding to ongoing national and global efforts
towards promotion of blue economy are presented below:
6.3.1 Marine Fisheries
Marine fishery is an important sector of blue economy for output, investment and job- creation.
Native coastal communities depend on marine fisheries for their livelihood. Most of them are
engaged in artisanal fishing even though commercialization of marine fishery has grown in
recent years. As per 2010 data, there were 3432 fishing villages in India including 874,749
fishermen families. In addition, the total fisher- folk population in the country was 40,56,213. It
shows the importance of marine fisheries for the people across nine states and four union
territories (Table 10). While the number of jobs created matters, it is the quality of employment
that makes the real difference to the people as it contributes to their well-being. In India, the
prevalence of large number of part-time employment was observed across coastal states of India.
The casual employment of local workforce is not viewed as a healthy trend as the cases of
unemployment and underemployment are often highlighted. It would require compensating jobs
in other sectors to absorb this seasonally unemployed workforce.
Table 10: Dependence on Marine Fisheries in Coastal States of India
(in Numbers)
Sl.
No
State/UT Fishing
Villages
Fishermen
Families
Fisherfolk
Population
1. Andhra Pradesh 555
(16.2)
163427
(18.7)
605428
(14.9)
2. Goa 39
(1.1)
2189
(0.3)
10545
(0.3)
3. Gujarat 247
(7.2)
62231
(7.1)
336181
(8.3)
4. Karnataka 144
(4.2)
30713
(3.5)
167429
(4.1)
5. Kerala 222
(6.5)
118937
(13.6)
610165
(15.0)
6. Maharashtra 456 81492 386259
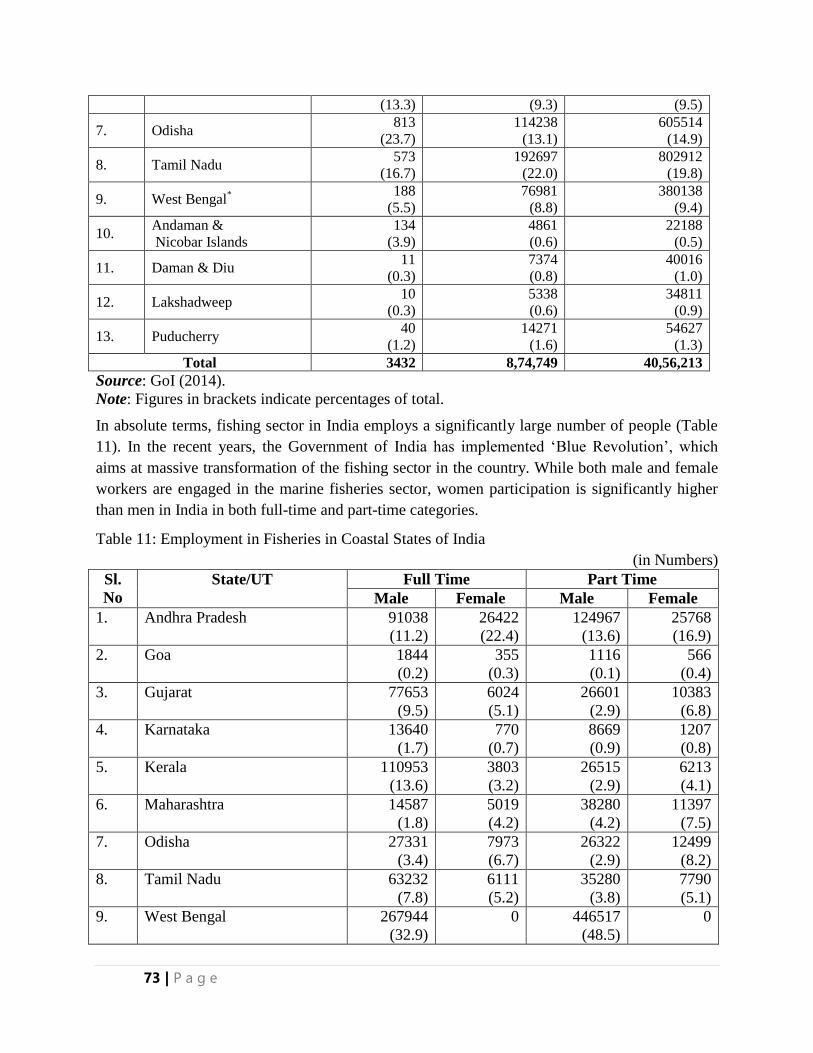
73 | P a g e
(13.3) (9.3) (9.5)
7. Odisha 813
(23.7)
114238
(13.1)
605514
(14.9)
8. Tamil Nadu 573
(16.7)
192697
(22.0)
802912
(19.8)
9. West Bengal*
188
(5.5)
76981
(8.8)
380138
(9.4)
10. Andaman &
Nicobar Islands
134
(3.9)
4861
(0.6)
22188
(0.5)
11. Daman & Diu 11
(0.3)
7374
(0.8)
40016
(1.0)
12. Lakshadweep 10
(0.3)
5338
(0.6)
34811
(0.9)
13. Puducherry 40
(1.2)
14271
(1.6)
54627
(1.3)
Total 3432 8,74,749 40,56,213
Source: GoI (2014).
Note: Figures in brackets indicate percentages of total.
In absolute terms, fishing sector in India employs a significantly large number of people (Table
11). In the recent years, the Government of India has implemented ‘Blue Revolution’, which
aims at massive transformation of the fishing sector in the country. While both male and female
workers are engaged in the marine fisheries sector, women participation is significantly higher
than men in India in both full-time and part-time categories.
Table 11: Employment in Fisheries in Coastal States of India
(in Numbers)
Sl.
No
State/UT Full Time Part Time
Male Female Male Female
1. Andhra Pradesh 91038
(11.2)
26422
(22.4)
124967
(13.6)
25768
(16.9)
2. Goa 1844
(0.2)
355
(0.3)
1116
(0.1)
566
(0.4)
3. Gujarat 77653
(9.5)
6024
(5.1)
26601
(2.9)
10383
(6.8)
4. Karnataka 13640
(1.7)
770
(0.7)
8669
(0.9)
1207
(0.8)
5. Kerala 110953
(13.6)
3803
(3.2)
26515
(2.9)
6213
(4.1)
6. Maharashtra 14587
(1.8)
5019
(4.2)
38280
(4.2)
11397
(7.5)
7. Odisha 27331
(3.4)
7973
(6.7)
26322
(2.9)
12499
(8.2)
8. Tamil Nadu 63232
(7.8)
6111
(5.2)
35280
(3.8)
7790
(5.1)
9. West Bengal 267944
(32.9)
0 446517
(48.5)
0
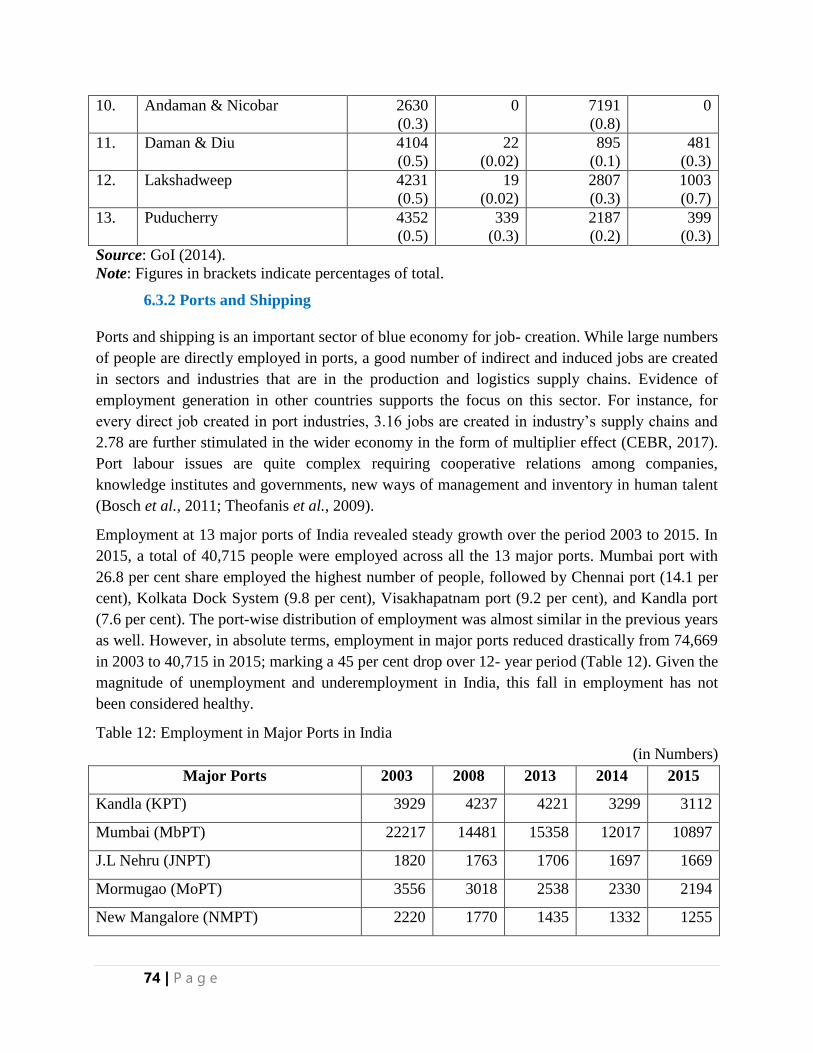
74 | P a g e
10. Andaman & Nicobar 2630
(0.3)
0 7191
(0.8)
0
11. Daman & Diu 4104
(0.5)
22
(0.02)
895
(0.1)
481
(0.3)
12. Lakshadweep 4231
(0.5)
19
(0.02)
2807
(0.3)
1003
(0.7)
13. Puducherry 4352
(0.5)
339
(0.3)
2187
(0.2)
399
(0.3)
Source: GoI (2014).
Note: Figures in brackets indicate percentages of total.
6.3.2 Ports and Shipping
Ports and shipping is an important sector of blue economy for job- creation. While large numbers
of people are directly employed in ports, a good number of indirect and induced jobs are created
in sectors and industries that are in the production and logistics supply chains. Evidence of
employment generation in other countries supports the focus on this sector. For instance, for
every direct job created in port industries, 3.16 jobs are created in industry’s supply chains and
2.78 are further stimulated in the wider economy in the form of multiplier effect (CEBR, 2017).
Port labour issues are quite complex requiring cooperative relations among companies,
knowledge institutes and governments, new ways of management and inventory in human talent
(Bosch et al., 2011; Theofanis et al., 2009).
Employment at 13 major ports of India revealed steady growth over the period 2003 to 2015. In
2015, a total of 40,715 people were employed across all the 13 major ports. Mumbai port with
26.8 per cent share employed the highest number of people, followed by Chennai port (14.1 per
cent), Kolkata Dock System (9.8 per cent), Visakhapatnam port (9.2 per cent), and Kandla port
(7.6 per cent). The port-wise distribution of employment was almost similar in the previous years
as well. However, in absolute terms, employment in major ports reduced drastically from 74,669
in 2003 to 40,715 in 2015; marking a 45 per cent drop over 12- year period (Table 12). Given the
magnitude of unemployment and underemployment in India, this fall in employment has not
been considered healthy.
Table 12: Employment in Major Ports in India
(in Numbers)
Major Ports 2003 2008 2013 2014 2015
Kandla (KPT) 3929 4237 4221 3299 3112
Mumbai (MbPT) 22217 14481 15358 12017 10897
J.L Nehru (JNPT) 1820 1763 1706 1697 1669
Mormugao (MoPT) 3556 3018 2538 2330 2194
New Mangalore (NMPT) 2220 1770 1435 1332 1255
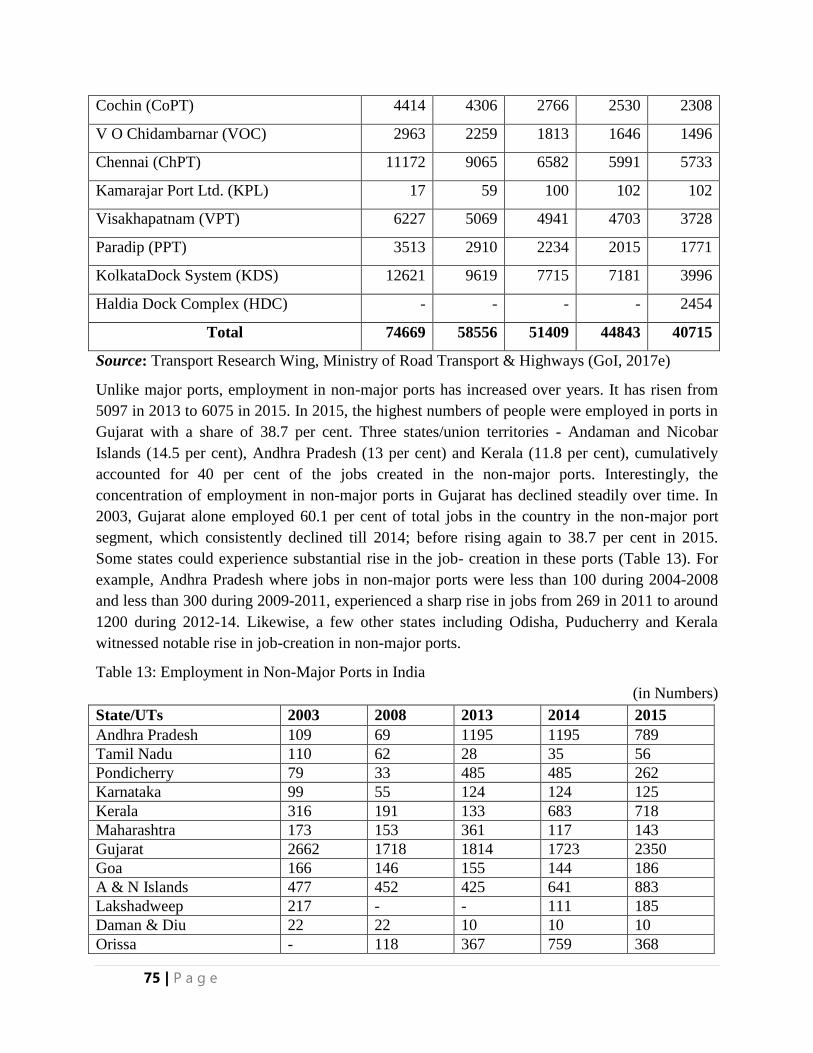
75 | P a g e
Cochin (CoPT) 4414 4306 2766 2530 2308
V O Chidambarnar (VOC) 2963 2259 1813 1646 1496
Chennai (ChPT) 11172 9065 6582 5991 5733
Kamarajar Port Ltd. (KPL) 17 59 100 102 102
Visakhapatnam (VPT) 6227 5069 4941 4703 3728
Paradip (PPT) 3513 2910 2234 2015 1771
KolkataDock System (KDS) 12621 9619 7715 7181 3996
Haldia Dock Complex (HDC) - - - - 2454
Total 74669 58556 51409 44843 40715
Source: Transport Research Wing, Ministry of Road Transport & Highways (GoI, 2017e)
Unlike major ports, employment in non-major ports has increased over years. It has risen from
5097 in 2013 to 6075 in 2015. In 2015, the highest numbers of people were employed in ports in
Gujarat with a share of 38.7 per cent. Three states/union territories - Andaman and Nicobar
Islands (14.5 per cent), Andhra Pradesh (13 per cent) and Kerala (11.8 per cent), cumulatively
accounted for 40 per cent of the jobs created in the non-major ports. Interestingly, the
concentration of employment in non-major ports in Gujarat has declined steadily over time. In
2003, Gujarat alone employed 60.1 per cent of total jobs in the country in the non-major port
segment, which consistently declined till 2014; before rising again to 38.7 per cent in 2015.
Some states could experience substantial rise in the job- creation in these ports (Table 13). For
example, Andhra Pradesh where jobs in non-major ports were less than 100 during 2004-2008
and less than 300 during 2009-2011, experienced a sharp rise in jobs from 269 in 2011 to around
1200 during 2012-14. Likewise, a few other states including Odisha, Puducherry and Kerala
witnessed notable rise in job-creation in non-major ports.
Table 13: Employment in Non-Major Ports in India
(in Numbers)
State/UTs 2003 2008 2013 2014 2015
Andhra Pradesh 109 69 1195 1195 789
Tamil Nadu 110 62 28 35 56
Pondicherry 79 33 485 485 262
Karnataka 99 55 124 124 125
Kerala 316 191 133 683 718
Maharashtra 173 153 361 117 143
Gujarat 2662 1718 1814 1723 2350
Goa 166 146 155 144 186
A & N Islands 477 452 425 641 883
Lakshadweep 217 - - 111 185
Daman & Diu 22 22 10 10 10
Orissa - 118 367 759 368
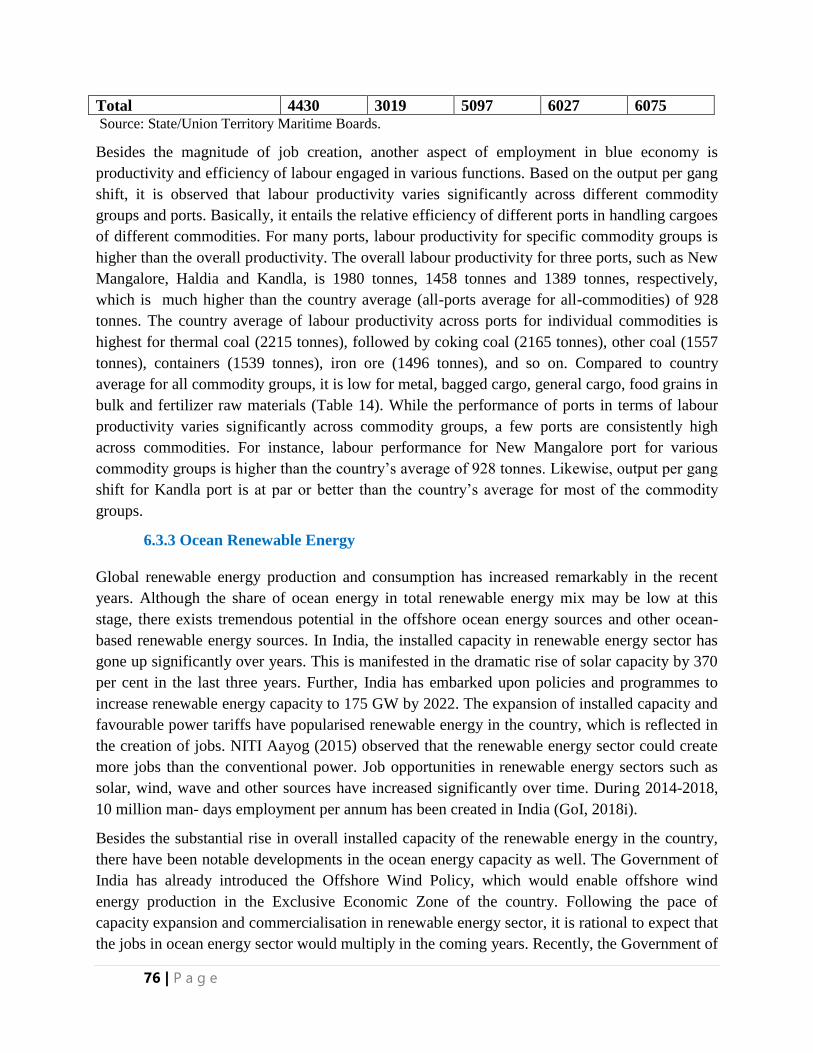
76 | P a g e
Total 4430 3019 5097 6027 6075 Source: State/Union Territory Maritime Boards.
Besides the magnitude of job creation, another aspect of employment in blue economy is
productivity and efficiency of labour engaged in various functions. Based on the output per gang
shift, it is observed that labour productivity varies significantly across different commodity
groups and ports. Basically, it entails the relative efficiency of different ports in handling cargoes
of different commodities. For many ports, labour productivity for specific commodity groups is
higher than the overall productivity. The overall labour productivity for three ports, such as New
Mangalore, Haldia and Kandla, is 1980 tonnes, 1458 tonnes and 1389 tonnes, respectively,
which is much higher than the country average (all-ports average for all-commodities) of 928
tonnes. The country average of labour productivity across ports for individual commodities is
highest for thermal coal (2215 tonnes), followed by coking coal (2165 tonnes), other coal (1557
tonnes), containers (1539 tonnes), iron ore (1496 tonnes), and so on. Compared to country
average for all commodity groups, it is low for metal, bagged cargo, general cargo, food grains in
bulk and fertilizer raw materials (Table 14). While the performance of ports in terms of labour
productivity varies significantly across commodity groups, a few ports are consistently high
across commodities. For instance, labour performance for New Mangalore port for various
commodity groups is higher than the country’s average of 928 tonnes. Likewise, output per gang
shift for Kandla port is at par or better than the country’s average for most of the commodity
groups.
6.3.3 Ocean Renewable Energy
Global renewable energy production and consumption has increased remarkably in the recent
years. Although the share of ocean energy in total renewable energy mix may be low at this
stage, there exists tremendous potential in the offshore ocean energy sources and other ocean-
based renewable energy sources. In India, the installed capacity in renewable energy sector has
gone up significantly over years. This is manifested in the dramatic rise of solar capacity by 370
per cent in the last three years. Further, India has embarked upon policies and programmes to
increase renewable energy capacity to 175 GW by 2022. The expansion of installed capacity and
favourable power tariffs have popularised renewable energy in the country, which is reflected in
the creation of jobs. NITI Aayog (2015) observed that the renewable energy sector could create
more jobs than the conventional power. Job opportunities in renewable energy sectors such as
solar, wind, wave and other sources have increased significantly over time. During 2014-2018,
10 million man- days employment per annum has been created in India (GoI, 2018i).
Besides the substantial rise in overall installed capacity of the renewable energy in the country,
there have been notable developments in the ocean energy capacity as well. The Government of
India has already introduced the Offshore Wind Policy, which would enable offshore wind
energy production in the Exclusive Economic Zone of the country. Following the pace of
capacity expansion and commercialisation in renewable energy sector, it is rational to expect that
the jobs in ocean energy sector would multiply in the coming years. Recently, the Government of

77 | P a g e
India has floated Expression of Interests for 10,000 MW floating solar power plants and 1000
MW wind power (GoI, 2018i). The development of these projects along with other similar
projects would create thousands of direct and indirect jobs in the country.
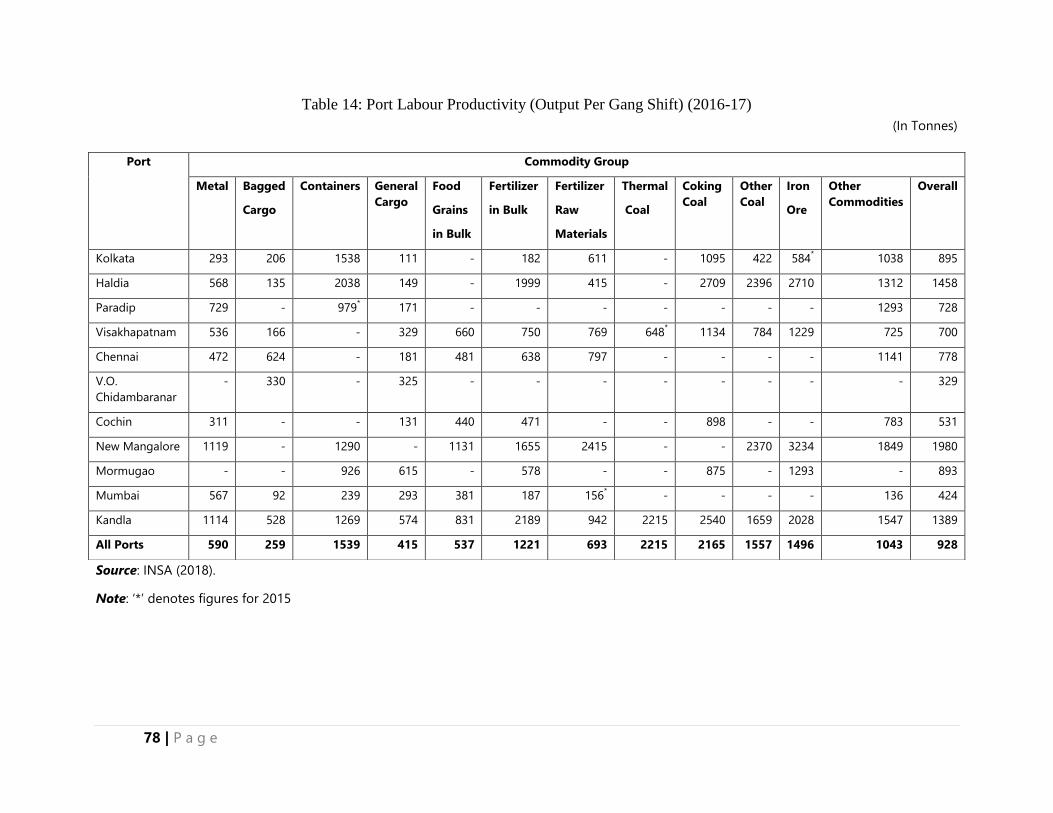
78 | P a g e
Table 14: Port Labour Productivity (Output Per Gang Shift) (2016-17)
(In Tonnes)
Source: INSA (2018).
Note: ‘*’ denotes figures for 2015
Port Commodity Group
Metal Bagged
Cargo
Containers General
Cargo
Food
Grains
in Bulk
Fertilizer
in Bulk
Fertilizer
Raw
Materials
Thermal
Coal
Coking
Coal
Other
Coal
Iron
Ore
Other
Commodities
Overall
Kolkata 293 206 1538 111 - 182 611 - 1095 422 584* 1038 895
Haldia 568 135 2038 149 - 1999 415 - 2709 2396 2710 1312 1458
Paradip 729 - 979* 171 - - - - - - - 1293 728
Visakhapatnam 536 166 - 329 660 750 769 648* 1134 784 1229 725 700
Chennai 472 624 - 181 481 638 797 - - - - 1141 778
V.O.
Chidambaranar
- 330 - 325 - - - - - - - - 329
Cochin 311 - - 131 440 471 - - 898 - - 783 531
New Mangalore 1119 - 1290 - 1131 1655 2415 - - 2370 3234 1849 1980
Mormugao - - 926 615 - 578 - - 875 - 1293 - 893
Mumbai 567 92 239 293 381 187 156* - - - - 136 424
Kandla 1114 528 1269 574 831 2189 942 2215 2540 1659 2028 1547 1389
All Ports 590 259 1539 415 537 1221 693 2215 2165 1557 1496 1043 928
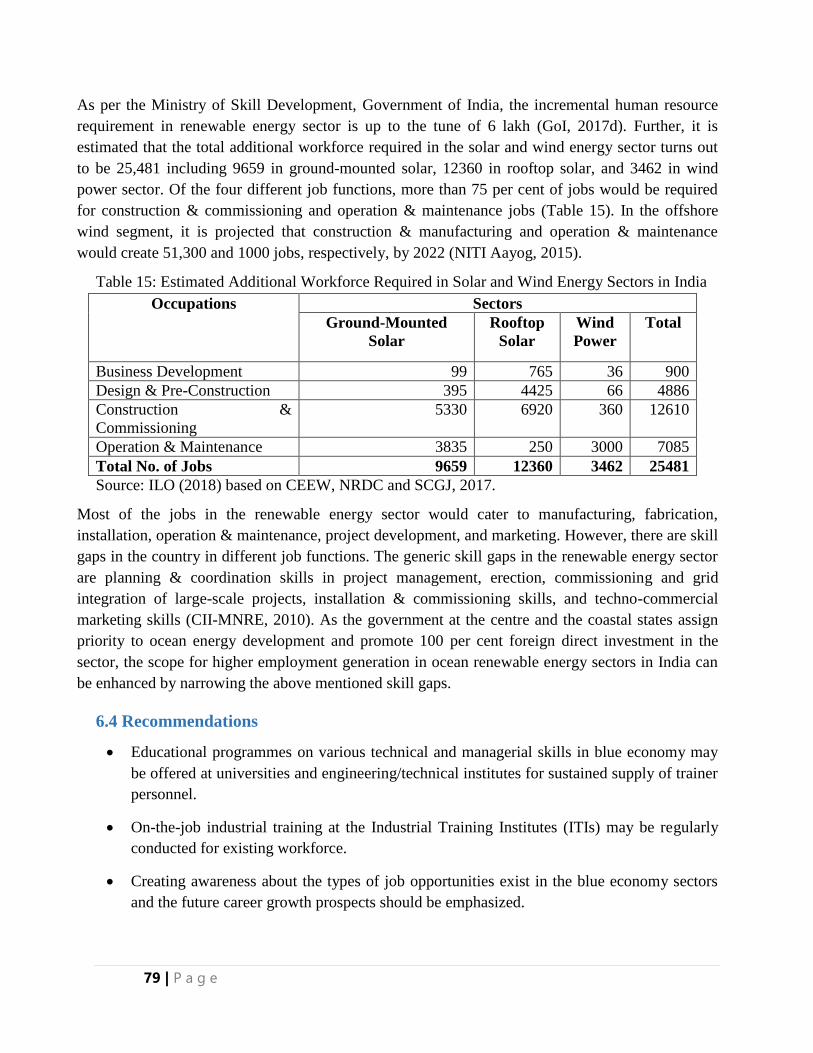
79 | P a g e
As per the Ministry of Skill Development, Government of India, the incremental human resource
requirement in renewable energy sector is up to the tune of 6 lakh (GoI, 2017d). Further, it is
estimated that the total additional workforce required in the solar and wind energy sector turns out
to be 25,481 including 9659 in ground-mounted solar, 12360 in rooftop solar, and 3462 in wind
power sector. Of the four different job functions, more than 75 per cent of jobs would be required
for construction & commissioning and operation & maintenance jobs (Table 15). In the offshore
wind segment, it is projected that construction & manufacturing and operation & maintenance
would create 51,300 and 1000 jobs, respectively, by 2022 (NITI Aayog, 2015).
Table 15: Estimated Additional Workforce Required in Solar and Wind Energy Sectors in India
Occupations Sectors
Ground-Mounted
Solar
Rooftop
Solar
Wind
Power
Total
Business Development 99 765 36 900
Design & Pre-Construction 395 4425 66 4886
Construction &
Commissioning
5330 6920 360 12610
Operation & Maintenance 3835 250 3000 7085
Total No. of Jobs 9659 12360 3462 25481
Source: ILO (2018) based on CEEW, NRDC and SCGJ, 2017.
Most of the jobs in the renewable energy sector would cater to manufacturing, fabrication,
installation, operation & maintenance, project development, and marketing. However, there are skill
gaps in the country in different job functions. The generic skill gaps in the renewable energy sector
are planning & coordination skills in project management, erection, commissioning and grid
integration of large-scale projects, installation & commissioning skills, and techno-commercial
marketing skills (CII-MNRE, 2010). As the government at the centre and the coastal states assign
priority to ocean energy development and promote 100 per cent foreign direct investment in the
sector, the scope for higher employment generation in ocean renewable energy sectors in India can
be enhanced by narrowing the above mentioned skill gaps.
6.4 Recommendations
Educational programmes on various technical and managerial skills in blue economy may
be offered at universities and engineering/technical institutes for sustained supply of trainer
personnel.
On-the-job industrial training at the Industrial Training Institutes (ITIs) may be regularly
conducted for existing workforce.
Creating awareness about the types of job opportunities exist in the blue economy sectors
and the future career growth prospects should be emphasized.

80 | P a g e
81 | P a g e
Chapter 7. Marine Services
7.1 Introduction
The untapped potential in blue economy sectors for socio-economic development in India and other
coastal nations of the world is increasingly being recognised now. As a result, the governments
worldwide are taking concerted policy actions to harness the ocean resources for accelerating
economic growth, creating employment opportunities, and promoting livelihood promotion among
the coastal communities. The Small Island Developing States (SIDS) are at the forefront of raising
global awareness and cooperation for promotion of blue economy. Like land-based sectors, blue
economy covers all the three broad sectors of economy such as agriculture and allied activities,
manufacturing, and services.
Besides agriculture (fisheries) and marine manufacturing (biotechnology, shipbuilding, marine
instrumentation, deep-sea mining, etc.), marine services offer myriad opportunities for the coastal
nations. Globally, marine services segment has not emerged as a separate discipline in academics as
well as in policymaking even though services sectors are being viewed as engines of economic
growth in many emerging markets and developing countries. Further, lack of comprehensive
database both at global and national levels on marine services constrains meaningful analysis of the
evolving trends and patterns in different sectors like coastal shipping, port services, marine finance
and insurance, marine legal services, marine construction, among others.
India is one of the leading coastal nations of the world with long coastline and a large pool of
skilled workforce. Like other countries of the world, India too faces the challenges of data and
information gap on various aspects of activity in marine services particularly with respect to
domestic consumption and trade. However, various government efforts are underway to address the
common concerns faced by the stakeholders in blue economy which apply to the marine services
also. In addition, the growing sensitization among people of India about blue economy and its
linkages with other sectors of economy by the political leadership and through national, multilateral
and inter-governmental platforms like the UN, Food and Agriculture Organisation (FAO), Indian
Ocean Rim Association (IORA), Association of Southeast Asian Nations (ASEAN), etc. would also
open up new avenues for growth and diversification of marine services sectors in the country.
7.2 Potential and Dynamics in Maritime Services Sectors
Each service sector presents unique economic opportunities, needs specialized technical and human
resource skills and faces specific challenges. Global experience on the activity in different service
sectors is also varied. This complicates proper identification and assessment of the drivers of
growth in different sectors and their economy-wide impacts in terms of gross value added, number
of jobs created, exports, level of investment, technology development, and so on. In that prism, it is
imperative to highlight the features of individual sectors of marine services.
82 | P a g e
7.2.1 Ship Repair
The demand for ship repair services is growing in India and other parts of the world as seaborne
trade has increased in the recent years. While the market for ship repair has expanded over time, the
domestic supply of these services has not increased commensurately. As a result, most Indian
shipping companies outsource the repairing services to Colombo Port. Although current capacity
constraints could be partly attributed to lack of dynamism in the shipbuilding industry in the
country, there are serious gaps in necessary infrastructure for ship repairing in India. These include
lack of good number of modern shipyards, delay in supply of parts and components, and proper
mobilization of skilled workforce. Ship repair essentially involves ship conversions, overhauls,
maintenance, major damage repairs, and minor equipment repairs. Ship maintenance is undertaken
continuously while small-scale voyage and on-board repairs are undertaken occasionally at sea and
harbour respectively. Large-scale retrofit, refurbishment and modernization are carried out at
shipyards. The ship repair industry is labour-intensive and has short delivery times. It requires large
number of trained people including skilled labour and has limited potential for automation.
Ship repair industry in the world has experienced substantial growth in recent years. Likewise, India
is also experiencing increasing demand for ship repair services. India has identified ship repairing as
a high-growth potential industry and a significant booster to the Indian economy. The potential size
of ship repair industry in India including Indian and foreign vessels calling at Indian ports is around
INR 44 billion but so far only business worth of INR 10 to INR 12 billion is realized by the Indian
ship repair industry. Currently, it constitutes 1 to 2 per cent of global ship repair industry (EXIM
Bank, 2014). Despite relatively small domestic market, Government of India has given thrust on
developing necessary ship repair infrastructure and facilities.
There are 25 major ship repair facilities in India; 18 on the Western Coast and 7 on the Eastern
Coast. In 2016-17, amongst public sector companies, Cochin Shipyard Ltd (CSL) had the highest
capacity for ship repairing (125 thousand DWT) followed by Hindustan Shipyard Ltd. (HSL) (80
thousand DWT), Garden Reach Shipbuilders and Engineers Ltd (GRSE) (26 thousand DWT) and
Goa Shipyard Ltd. (GSL) (4.5 thousand DWT). In private sector category amongst the reporting
companies, ABG Shipyard Ltd. (ABG) (120 thousand DWT) has the highest ship repairing
capacities, followed by Bharati Defence & Infrastructure Ltd. (BDIL) (20 thousand DWT), Modest
Infrastructure Pvt. Ltd. (MIPL) (6 thousand DWT) and Vedanta (2.4 thousand DWT). In 2016-17,
public sector and private sector shipyards have repaired 156 and 126 ships respectively. The major
public sector shipyards include Cochin Shipyard Ltd (CSL), and Goa Shipyard Ltd. (GSL) whereas
the major private sector shipyards include Dempo Shipbuilding & Engg. Ltd. (DSEL), A.C. Roy &
Company Ltd., (ACRCL), L&T Shipbuilding Ltd, and Bristol Boats Ltd.
In comparison with other countries, India still lags behind in terms of infrastructure and capacity.
For instance, China has 176 dedicated ship repair yards and 316 ship building yards. Moreover,
Singapore, Colombo and Dubai are the most competitive shipyards in the world. Further, clustering
of ship repair industries has been observed in various locations. South Korea, Japan and China
83 | P a g e
mostly focus on shipbuilding and Singapore, whereas Dubai, Bahrain and Colombo are largely into
ship repair. There are some countries like Russia, India and countries in Eastern Europe where both
shipbuilding and ship repair yards are operating (Govt. of India, 2007).
The strategic location of India can attract ships plying from the West to the East in the trade route
for ship repairing. In addition, there is huge domestic demand for ship repairing from the inland
waterways, coastal shipping and marine shipping which is not properly addressed due to lack of
adequate repair facility in the country. The potential for expansion of repair services from both
domestic and international sources can be efficiently harnessed by addressing some policy and
regulatory challenges. High tax rate is often blamed as a reason for low attractiveness of Indian
shipyards for repairing services as leading coastal nations like Singapore and GCC countries have
no tax as such for repair services. Taxation reform is not only necessary for creating the level
playing field for domestic entities but also for enhancing country’s competitiveness at the global
level. Further, tendering process of government-owned shipyards for ship repair is too long which is
not commercially viable for the ship owners to keep their vessels waiting for that long. In order to
make Indian ship repair industry globally competitive, it is necessary to increase investment in
critical infrastructure and build skilled human resource base, preferably in the public-private
partnership (PPP) mode (Indian Ports Association, 2017).
7.2.2 Coastal Shipping
Relative to other modes of transport like road and railways, coastal shipping is efficient in terms of
cost as well as environmental effects. Besides lower carbon emissions coastal shipping can help
reduce concentration of traffic on the strained road network and facilitate optimal use of country’s
long coastline. The growth of many blue industries depends on a strong coastal shipping network.
The Government of India in the National Perspective Plan of Sagarmala has projected that the cost
of transportation of goods by road and rail is between INR 2 to 3 and INR 1.20 to 1.50 per tonne km
respectively whereas it is INR 0.20 to INR 0.30 per tonne km for coastal shipping. In other words, it
is 80 per cent cheaper in case of coastal shipping than road and rail. Empirical studies on origin-
destination of cargo find significant potential for transport of raw materials and finished products
using coastal shipping.
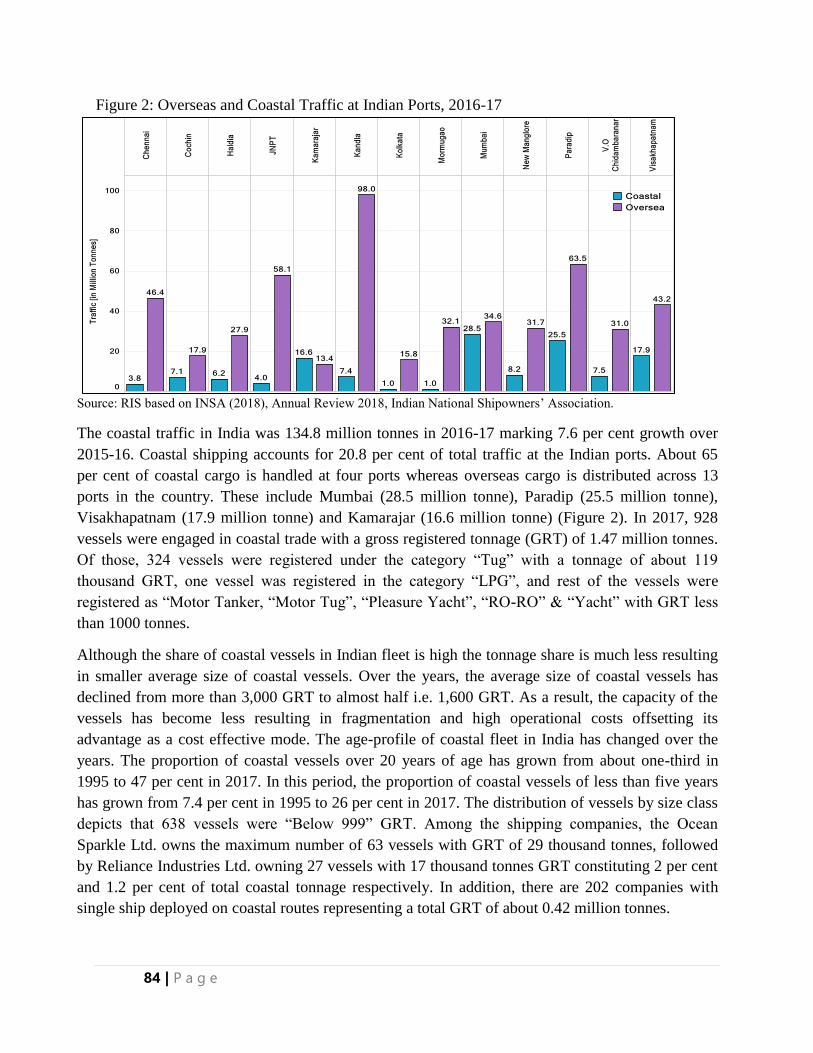
84 | P a g e
Figure 2: Overseas and Coastal Traffic at Indian Ports, 2016-17
Source: RIS based on INSA (2018), Annual Review 2018, Indian National Shipowners’ Association.
The coastal traffic in India was 134.8 million tonnes in 2016-17 marking 7.6 per cent growth over
2015-16. Coastal shipping accounts for 20.8 per cent of total traffic at the Indian ports. About 65
per cent of coastal cargo is handled at four ports whereas overseas cargo is distributed across 13
ports in the country. These include Mumbai (28.5 million tonne), Paradip (25.5 million tonne),
Visakhapatnam (17.9 million tonne) and Kamarajar (16.6 million tonne) (Figure 2). In 2017, 928
vessels were engaged in coastal trade with a gross registered tonnage (GRT) of 1.47 million tonnes.
Of those, 324 vessels were registered under the category “Tug” with a tonnage of about 119
thousand GRT, one vessel was registered in the category “LPG”, and rest of the vessels were
registered as “Motor Tanker, “Motor Tug”, “Pleasure Yacht”, “RO-RO” & “Yacht” with GRT less
than 1000 tonnes.
Although the share of coastal vessels in Indian fleet is high the tonnage share is much less resulting
in smaller average size of coastal vessels. Over the years, the average size of coastal vessels has
declined from more than 3,000 GRT to almost half i.e. 1,600 GRT. As a result, the capacity of the
vessels has become less resulting in fragmentation and high operational costs offsetting its
advantage as a cost effective mode. The age-profile of coastal fleet in India has changed over the
years. The proportion of coastal vessels over 20 years of age has grown from about one-third in
1995 to 47 per cent in 2017. In this period, the proportion of coastal vessels of less than five years
has grown from 7.4 per cent in 1995 to 26 per cent in 2017. The distribution of vessels by size class
depicts that 638 vessels were “Below 999” GRT. Among the shipping companies, the Ocean
Sparkle Ltd. owns the maximum number of 63 vessels with GRT of 29 thousand tonnes, followed
by Reliance Industries Ltd. owning 27 vessels with 17 thousand tonnes GRT constituting 2 per cent
and 1.2 per cent of total coastal tonnage respectively. In addition, there are 202 companies with
single ship deployed on coastal routes representing a total GRT of about 0.42 million tonnes.
85 | P a g e
The current level of coastal shipping is much below the potential. The erosion in the share of coastal
traffic in India could be attributed to the combined outcome of demand and supply factors. The
demand-side factors include higher transshipment cost, lack of door-to-door delivery of
consignment as in the case of road transport and absence of timeliness as coastal freight services
often ply as per the schedule. On the supply side, lack of tonnage and over-aged vessels are often
blamed for low traffic on coastal routes. To increase the costal cargo turnover, it may require
upgrading the capacity of the existing ports and efficiency of cargo handling at ports.
In recent years, the Govt. of India has undertaken several steps to promote coastal shipping. Most
importantly, 14 Coastal Economic Zones (CEZs) have been identified for development under
National Perspective Plan of Sagarmala Programme (2016-2035). The Perspective Plans for the
CEZs have been finalised. Out of the 14 identified CEZs, three are in the State of Gujarat. Out of
these three, the CEZ linked with Kandla Major Port and Mundra Port has been prioritized for
Master Planning. An additional coastal shipping potential of 115-120 million metric tonne per
annum (MMTPA) by 2025 has been identified for various cargo types (coal, petroleum, oil &
lubricant, steel, cement and fertilizer). This could lead to logistics cost savings of INR 30,000 to
INR 40,000 crore per annum by 2025. Further, it would be necessary to improve infrastructure for
coastal shipping in the country. Notably, the Ministry of Shipping in India has revised the scope of
the Coastal Berth Scheme and merged the scheme with the Sagarmala Programme. The major ports
have been asked to have dedicated coastal berths for cargo for which financial assistance is also
provided under the coastal berth scheme. Under the scheme, the financial assistance of 50 per cent
of project cost is provided to major ports/state governments for construction of coastal berths,
breakwater, mechanization of coastal berths, and capital dredging.
7.2.3 Port Services
Port services are critical for improving the performance of ports and the success of blue economy. It
covers several skilled and unskilled job roles including logistics and supply chain management,
loading and unloading of cargo, discharge and evacuation of cargo, freight forwarding, pilotage,
anchorage, among others. Since growth prospects in blue economy sectors seem to be brighter in
future, it is expected that port services would diversify in the coming years. Moreover, the focus
would be on enhancing efficiency and competitiveness of the existing workforce. Given the vast
size of India’s maritime space there is enough opportunity for expansion of port services in India in
the future.
The port ecosystem in India includes 13 major ports and 180 minor/intermediate ports. Major ports
are owned by the Government of India except the Kamarajar Port at Ennore whereas minor ports
are owned and operated by the state governments/private entities. Besides standard port services,
the major ports also provide several allied facilities such as single buoy moorings (SBMs), virtual
jetties (VJs), trans-shippers and anchorages. In terms of capacity, the major ports have 249 berths
which provide loading and unloading services of POL (petroleum, oil and lubricant) products, iron
ore, coal, fertilizer, containers, general/break-bulk etc. In addition, there are two barge jetties (BJs),
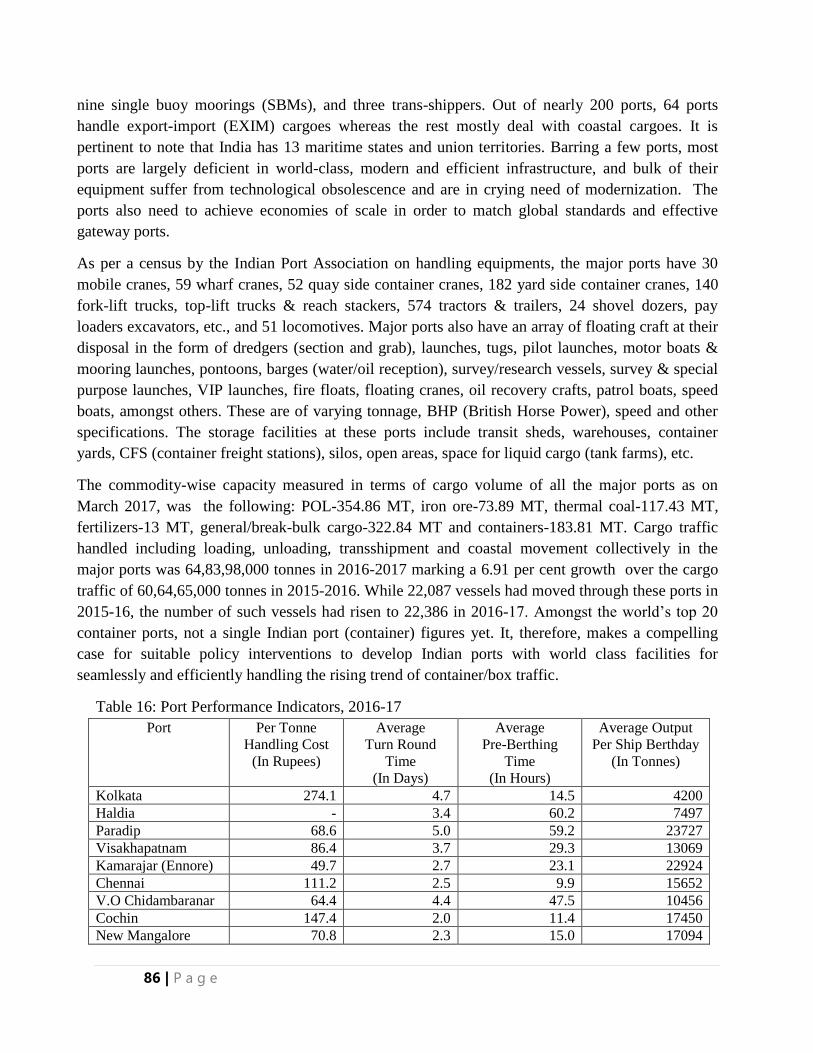
86 | P a g e
nine single buoy moorings (SBMs), and three trans-shippers. Out of nearly 200 ports, 64 ports
handle export-import (EXIM) cargoes whereas the rest mostly deal with coastal cargoes. It is
pertinent to note that India has 13 maritime states and union territories. Barring a few ports, most
ports are largely deficient in world-class, modern and efficient infrastructure, and bulk of their
equipment suffer from technological obsolescence and are in crying need of modernization. The
ports also need to achieve economies of scale in order to match global standards and effective
gateway ports.
As per a census by the Indian Port Association on handling equipments, the major ports have 30
mobile cranes, 59 wharf cranes, 52 quay side container cranes, 182 yard side container cranes, 140
fork-lift trucks, top-lift trucks & reach stackers, 574 tractors & trailers, 24 shovel dozers, pay
loaders excavators, etc., and 51 locomotives. Major ports also have an array of floating craft at their
disposal in the form of dredgers (section and grab), launches, tugs, pilot launches, motor boats &
mooring launches, pontoons, barges (water/oil reception), survey/research vessels, survey & special
purpose launches, VIP launches, fire floats, floating cranes, oil recovery crafts, patrol boats, speed
boats, amongst others. These are of varying tonnage, BHP (British Horse Power), speed and other
specifications. The storage facilities at these ports include transit sheds, warehouses, container
yards, CFS (container freight stations), silos, open areas, space for liquid cargo (tank farms), etc.
The commodity-wise capacity measured in terms of cargo volume of all the major ports as on
March 2017, was the following: POL-354.86 MT, iron ore-73.89 MT, thermal coal-117.43 MT,
fertilizers-13 MT, general/break-bulk cargo-322.84 MT and containers-183.81 MT. Cargo traffic
handled including loading, unloading, transshipment and coastal movement collectively in the
major ports was 64,83,98,000 tonnes in 2016-2017 marking a 6.91 per cent growth over the cargo
traffic of 60,64,65,000 tonnes in 2015-2016. While 22,087 vessels had moved through these ports in
2015-16, the number of such vessels had risen to 22,386 in 2016-17. Amongst the world’s top 20
container ports, not a single Indian port (container) figures yet. It, therefore, makes a compelling
case for suitable policy interventions to develop Indian ports with world class facilities for
seamlessly and efficiently handling the rising trend of container/box traffic.
Table 16: Port Performance Indicators, 2016-17
Port Per Tonne
Handling Cost
(In Rupees)
Average
Turn Round
Time
(In Days)
Average
Pre-Berthing
Time
(In Hours)
Average Output
Per Ship Berthday
(In Tonnes)
Kolkata 274.1 4.7 14.5 4200
Haldia - 3.4 60.2 7497
Paradip 68.6 5.0 59.2 23727
Visakhapatnam 86.4 3.7 29.3 13069
Kamarajar (Ennore) 49.7 2.7 23.1 22924
Chennai 111.2 2.5 9.9 15652
V.O Chidambaranar 64.4 4.4 47.5 10456
Cochin 147.4 2.0 11.4 17450
New Mangalore 70.8 2.3 15.0 17094
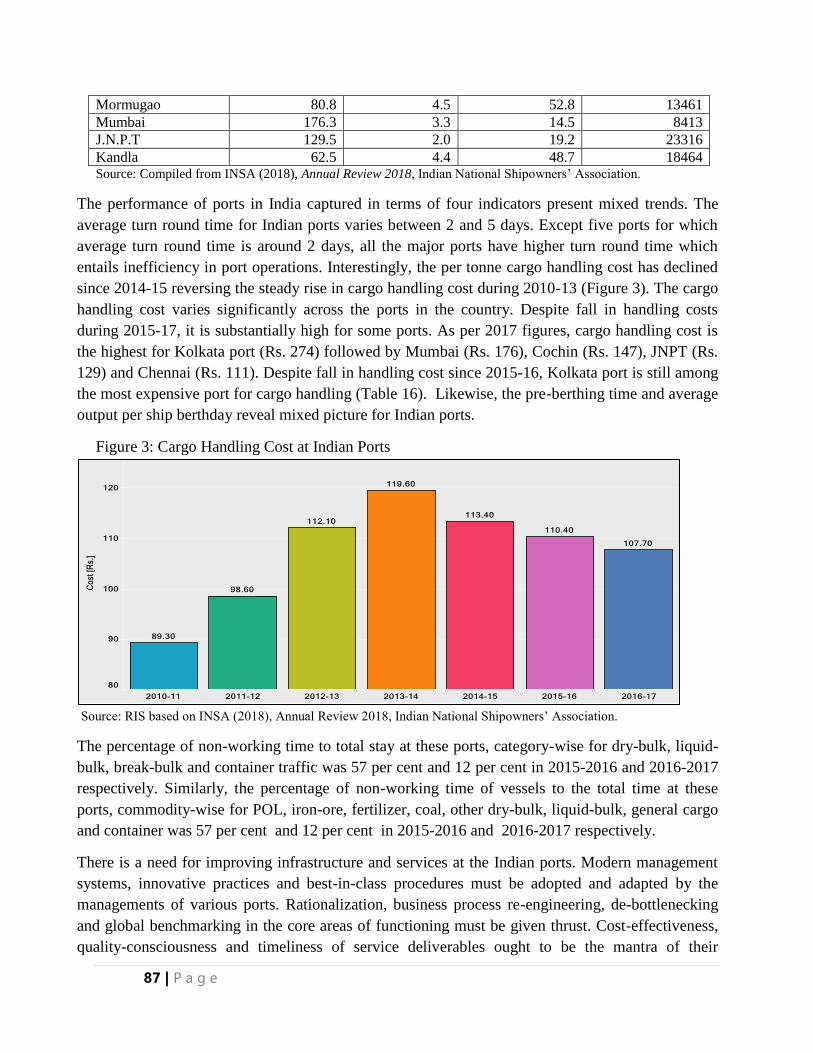
87 | P a g e
Mormugao 80.8 4.5 52.8 13461
Mumbai 176.3 3.3 14.5 8413
J.N.P.T 129.5 2.0 19.2 23316
Kandla 62.5 4.4 48.7 18464 Source: Compiled from INSA (2018), Annual Review 2018, Indian National Shipowners’ Association.
The performance of ports in India captured in terms of four indicators present mixed trends. The
average turn round time for Indian ports varies between 2 and 5 days. Except five ports for which
average turn round time is around 2 days, all the major ports have higher turn round time which
entails inefficiency in port operations. Interestingly, the per tonne cargo handling cost has declined
since 2014-15 reversing the steady rise in cargo handling cost during 2010-13 (Figure 3). The cargo
handling cost varies significantly across the ports in the country. Despite fall in handling costs
during 2015-17, it is substantially high for some ports. As per 2017 figures, cargo handling cost is
the highest for Kolkata port (Rs. 274) followed by Mumbai (Rs. 176), Cochin (Rs. 147), JNPT (Rs.
129) and Chennai (Rs. 111). Despite fall in handling cost since 2015-16, Kolkata port is still among
the most expensive port for cargo handling (Table 16). Likewise, the pre-berthing time and average
output per ship berthday reveal mixed picture for Indian ports.
Figure 3: Cargo Handling Cost at Indian Ports
Source: RIS based on INSA (2018), Annual Review 2018, Indian National Shipowners’ Association.
The percentage of non-working time to total stay at these ports, category-wise for dry-bulk, liquid-
bulk, break-bulk and container traffic was 57 per cent and 12 per cent in 2015-2016 and 2016-2017
respectively. Similarly, the percentage of non-working time of vessels to the total time at these
ports, commodity-wise for POL, iron-ore, fertilizer, coal, other dry-bulk, liquid-bulk, general cargo
and container was 57 per cent and 12 per cent in 2015-2016 and 2016-2017 respectively.
There is a need for improving infrastructure and services at the Indian ports. Modern management
systems, innovative practices and best-in-class procedures must be adopted and adapted by the
managements of various ports. Rationalization, business process re-engineering, de-bottlenecking
and global benchmarking in the core areas of functioning must be given thrust. Cost-effectiveness,
quality-consciousness and timeliness of service deliverables ought to be the mantra of their
88 | P a g e
competitive success. The Direct Port Delivery (DPD) introduced at the Jawaharlal Nehru Port
Trust (JNPT), Nhava Sheva, Mumbai in the past two years jointly by the jurisdictional customs and
port management has been a pioneering initiative. The DPD route of effecting delivery of containers
has worked well and been received very well by all the stakeholders since its introduction. This
progressive policy venture has significantly reduced dwell times and costs and quick turnaround of
vessels. With necessary policy support DVD needs to be replicated at all ports for gaining critical
mass in the sector. Further, robust security ring-fencing of ports should assume priority. Given the
geo-strategic security environment in the world now, it is imperative to adhere to the International
Ship and Port Facility Security (ISPS) Code of the International Maritime Organization (IMO).
Ports must be secured against any potential nefarious breach/intrusion in national interest, at all
times. Security awareness, due diligence & stringent audits should be non-negotiable imperatives.
7.2.4 Reception Facility
Reception facility is an important port service. At present, not even a single major port in India
provides reception facility. On the other hand, Singapore provides reception facility at most of its
ports. As a result, ships coming to India usually dump their waste in Singapore which is a loss for
the Indian industry. For example, black oil extraction from sludge is not done at Indian ports due to
lack of reception facility. There is a need to invest in reception facility at ports in India. Customs
regulations in India have made reception facilities at ports very difficult. Although Regulation 28 of
the IMO requires the countries to provide reception facilities, the level of compliance is currently
very low. An alternative way to enforce this regulation is to make budgetary allocations for
reception facilities. But currently there is no budget allocation for reception facilities and
emergency response. Since reception facilities add to the cost of port services it should be taken into
account in country’s budgeted expenses and revenue.
7.2.5 Seafarer Facilitation
Maritime Labour Convention (MLC) requires seafarer facilitation centres in every port. However,
Indian ports do not have such facilities. India is a signatory to the MLC convention mandate but
none of the Indian ports have come forward. As a result, the cost of complying with MLC is borne
by the ship owners which, in turn, increases the overall cost of operation. India needs to increase the
flow of cargo rather than establishing more ports. It would require Indian ports to be attractive by
reducing over-compliance and simplifying the process of compliance. Technological interface at
seaports should be enhanced to make the process easier. Mariners prefer Singapore to India as ports
in Singapore offer similar kinds of services more efficiently than Indian ports. In nutshell, public
support and good governance are key to raising the competitiveness of India’s shipping services.
7.2.6 Pilotage
A pilot is an advisor to the captain that helps bring the ship from anchorage to the port. The pilots
are employees of the Port Trust and around 80 per cent of them are employed on contract basis. As
a result, each pilot has a different work culture which is not the case in other countries. A policy is
89 | P a g e
required to bring pilotage across India under a national norm so that it is no longer localized. Thus,
pan-India pilot regulations are required and pilotage should be governed in a uniform way.
7.2.7 Automation Traffic Control in the Maritime Sector
Facilities like Automatic Traffic Control (ATC) for air traffic are presently not available for
merchant shipping. An ATC type system to guide ships should be developed. Vessel Tracking
Management Service (VTMS) is the forerunners to ATC in merchant shipping. VTMS has not been
globally adopted because of a number of reasons like radio communication. A pilot would not be
required to guide the ships from outside to the port if a laser can do the job. The Dover Strait in
England has adopted a similar type of system under which the whole approach of the English
Channel is now documented, laserised and VTMS is controlled from Dover. VTMS is still an
optional service and is implemented if needed.
7.2.8 Logistics and Supply Chain Management
The logistics and supply chain management includes several services including maritime cargo
handling, warehousing & storage, stevedoring, customs clearance services, freight forwarding,
container stations and depot services. Customs brokers, freight forwarders, NVOCC, MTOs,
shipping agents and similar agencies provide these auxiliary services. Multimodal operators are
agents registered with DG (Shipping) which can issue multimodal transport document (MTD). This
system was introduced to facilitate door-to-door services relieving the shippers from the worries of
international deliveries. However, there is not much success as only 1200 agents have registered.
This was so because the freight forwarders played the role of providing one-stop solution, though
they did not issue MTD. There is no regulation for freight forwarders demanding any specific
qualification or experience. In addition, there is no institutional mechanism to address the
grievances of shippers especially with regard to the performance of agents.
Freight forwarding, also known as non-vessel operating common carrier (NVOCC), involves
organising shipments for individuals or corporations for getting goods from their manufacturers or
producers to markets/customers/final points of distribution. In India, importers have to pay an
additional amount to the tune of 10 to 15 per cent on and above the vessel freight. The shipping line
or their agents or the freight forwarders levy certain charges around 30 different heads mostly as
landed charges or cost of recovery charges or terminal handling charges or local charges or
terminal-handling-charges (THC). To deal with this issue, the shipping lines should adopt the
concept of all-inclusive freight it offers to a shipper. There should be no “land side” or “cost on
actuals” or terminal handling charges (THC) component in the freight, especially for import cargo.
This system exists in some countries including Sri Lanka. Although India has two large and
efficient container terminals (viz., Tuticorin and Cochin) it is yet to transform into a transshipment
hub like Colombo.
As mentioned above, port services are diverse in nature. Cargo-handling services refer to the
physical handling of merchandise cargo in the ports including handling by cranes at the wharfs,
90 | P a g e
stacking and de-stacking through fork lift trucks, movement by heavy duty trucks/tempos out of
ports and elsewhere. Warehousing and storage is the temporary deposition of goods in identified
premises such as ports, container freight stations (CFSs), inland container depots (ICDs), etc.,
before their eventual evacuation/clearance. Stevedoring includes loading or unloading of the cargo
of a ship or to engage in the process of loading or unloading of vessels.
Customs clearance work entails the preparation, submission and clearance of documents required to
facilitate exports from or imports into the country, apart from arranging payments of the
applicable/leviable duties/taxes on such shipments. Custom House Agents (CHAs) represent the
clients (shippers etc.) during customs examination and assessment, payment of customs appraised
duties and taking delivery of cargo from customs post clearance, along with the documents
concerned with such shipments. Container stations are facilities where freight shipments in
containers/boxes/such unitized/ palletized form are consolidated or de-consolidated between the
transportation legs involved in their movements. As an adjunct, container freight stations (CFS) are
locations normally in proximity to an ocean, port or airport where cargo containers are transported
to and from.
Third Party Logistics (3PL/TPL) have emerged as efficient logistics service agents. Firms often
outsource logistics activities to another firm having core competence in logistics for optimising
costs and bringing efficiency. Third-party logistics providers typically specialize in integrated
operations, warehousing and transportation services which can be scaled up and customized to
customers' needs based on market conditions. Besides typical logistics, 3PL are also engaged in
value-added services such as production or procurement of goods, i.e., services that integrate parts
of the supply chain. The global third-party logistics market is growing fast and expected to grow by
around five per cent between 2016 and 2024. In India, the future of TPL may grow as activities
expand. Since logistics costs are higher in India, the Govt. of India is considering formulating a
National Logistics Policy which would perhaps streamline all facets of supply chain with respect to
domestic as well as international cargo.
7.2.9 Marine Finance and Insurance
Marine finance and insurance sector covers a range of services including credit facilities, risk
management, insurance, project consultancy, and other related functions. Although it is yet to
develop full-fledged as a separate branch of financial sector, the symptoms of growth and
diversification of this sector in promoting and advancing blue economy is encouraging. In
conventional lending terms, credit to port and shipping sector is viewed as a high-risk sector as it
involves huge investment and long gestation period. Since other sectors of blue economy are still
evolving, the perceived risk of lending to those sectors might be high as well. Financial services in
blue economy would cover lending and project financing in the areas like shipbuilding, ship repair,
dredging, marine pharmaceuticals, coastal tourism infrastructure and hospitality industries, deep sea
mining exploration technologies, and other greenfield and brownfield projects. In addition, the
financial institutions including commercial banks, multilateral development banks, non-banking
91 | P a g e
finance companies, venture funds and other entities can play an instrumental role in developing
customized financial products involving debt, equity and other hybrid financial instruments.
Insurance is an important component of blue economy particularly the shipping sector. There is a
huge market for marine insurance products as the nature of risks is diverse involving colossal
damages to ships/vessels in case of events such as maritime accidents, break-downs, collisions,
grounding, sinking, armed robbery attacks, piracy, hijacking and other forms of risks. It is critical
for the merchant shipping industry as it covers the potential risks to ships/vessels and other physical
assets. Basically, marine insurance covers the wear and tear and other mishaps with reference to
hull and machineries of ships that constitute the most expensive components of a ship. Besides that,
vessels are also covered for other risks arising out of cargo, crew and third party claims etc. by P&I
(protection and indemnity) insurance. Due to increasing menace of piracy and armed robbery,
kidnap & ransom (K&R) insurance also forms part of the marine insurance coverage.
In India, there is no proper record of businesses in the marine finance and insurance sector.
However, the shipping companies have often raised their concerns in raising capital for investment
in new projects, even for working capital. The demand for collateral is high for shipping projects
compared to other sectors of economy in India. In view of sector-specific constraints, Indian
shipping sector has been demanding special credit facility for shipping by the banks and financial
institutions. About 30 years ago, the Shipping Finance Corporation of India (SFCI) was established
as a subsidiary of Industrial Credit and Investment Corporation of India (ICICI) to meet the credit
requirements of the shipping sector in India. This model was not hailed as a viable option as
exposure to a single sector embodies higher concentration of risk. The recourse to such type of
single-institution model would not be tenable now as shipping industry is highly prone to random
business cycle fluctuations.
Among other financing options, consortium lending could be another option in which a group of
banks jointly offer syndicated loans. This practice is usually adopted for infrastructure projects.
Given accumulation of non-performing assets (NPAs) in public sector banks, the feasibility of
syndicated lending is also questionable. In addition, traditional commercial banks show reluctance
for loans of long tenor due to asset-liability mismatches. Another model would be to have a
dedicated financing institution at international financial centre where tax benefit under leasing
arrangement could be provided. However, the success of this institution would critically depend on
the credibility of financing facility and the stakeholders in the capital market.
Given the size of the marine insurance market, it is imperative to encourage the Indian insurance
companies to emerge as full-fledged member(s) of the IG P&I Club. This is important given the
fact that that the Ministry of Finance, Government of India accords periodic authorizations to
Indian flag and registered vessels to enable them to get P&I cover from external P&I Clubs/
Associations. The foreign based IG P& I Club members provide the bulk of insurance cover for
Indian flag & registered vessels; mostly engaged in EXIM goods. New India Assurance Co. Ltd
(NIA), a subsidiary of the GIC), offers the first P&I insurance cover in India. Further, the Maritime
92 | P a g e
Protection & Indemnity Association of India (MP&IAI) was launched in May 2018. Initially, the
vessels covered under this scheme are vessels that ply in the Indian waters such as dry cargo
vessels, tugs, barges, etc. It is believed that, this insurance cover will be extended to the ocean-
going vessels in due course. Like other sectors, the maritime sectors also face the risk of cyber
security threats. Insurance cover for ships should account for this risk as well.
At present, P&I Clubs dominate the global marine insurance industry, mostly by the IG
(International Group) P&I Club. The IG (International Group) P&I Club comprises of 13 member-
entities which form the most elite grouping in marine insurance sector worldwide. Unfortunately,
No Indian entity is part of this insurance alliance so far. Apart from them, there are several other
non-IG P&I Clubs and reinsurance bodies in the maritime insurance space. In India, the General
Insurance Corporation (GIC) of India its four subsidiaries have been providing hull and machinery
(H&M) insurance cover for past several years to Indian flag and registered ships. However, the
GIC and its subsidiaries do not cover the provisions of P&I and K&R insurance for the merchant
ships.
For old and decrepit vessels which involve potential threat from maritime safety and pollution point
of view, the Merchant Shipping [Regulation of Entry of Ships into Ports, Anchorages and Offshore
Facilities] Rules, 2012 was promulgated under the enabling provisions of the Merchant Shipping
Act, 1958, as amended. These rules stipulate that other than the IG P&I Club marine insurance
cover for vessels, it is mandatory for the ships to have valid insurance cover duly approved by the
Ministry of Shipping, Government of India for movement in Indian waters or call on Indian ports.
7.2.10 Maritime Consultancy and Certification
For orderly growth of maritime sectors, simplification and harmonization of standards and
certifications is necessary. It would create a level playing field for the domestic maritime sector in
issuance of certification (for registration of ships) for merchant ships. At present, the cost of
registration of ships is very high in case of Indian ship owners compared to the global competitors.
The Indian Register of Shipping (IRS) has absolute monopoly in this segment. Moreover, the
Mercantile Marine Department (MMD) is struggling with the existing manpower. As the number of
Indian foreign-going ships is expected to rise in the coming years, it would necessitate employment
of more personnel with MMD. Besides merchant ships, the certification for the boat operators,
pilots, etc. in the current stage is handled by various state authorities. A single authority like MMD
at the national level providing certificates for training of ship and boat operators, pilots, etc. would
help enable the persons with requisite skills for seeking employment opportunities in other
countries.
7.2.11 Maritime Personnel Services
The crew of the merchant vessels includes seafarers, both officers and ratings (non-officers). With
1.52 lakh seafarers in the country, India ranks fifth in the world and accounts for one-tenth of the
global maritime workforce. Studies suggest that there is an oversupply of ratings by about 1,19,000
93 | P a g e
and the worldwide shortage of officers is likely to rise to 92,000 and 1,47,500 by 2020 and 2025,
respectively. It provides an opportunity for India to leverage the competitive edge of its maritime
officers’ skill-sets (technical and English language) and the vast network of its Maritime Training
Institutions (MTIs). About 135 MTIs both on the pre-sea and post-sea courses, duly approved and
evaluated by the Directorate General of Shipping, Government of India would cater to this future
demand. The Government of India must draw up a time-bound and concerted plan of action to
revamp the entire paradigm of maritime education and training, on both quantity and quality fronts.
This is to ensure a steady supply of officers across all disciplines (both nautical and marine
engineering) in the future. Enhancing maritime education and training as well as wider promotion of
careers at sea would be necessary to address the issues of labour supply in the maritime sector.
Besides promoting higher intakes into maritime education programmes, the onus should be on the
quality of trainee/cadet seafarers entering the profession. In this direction, the CIP (Comprehensive
Inspection Program) has to be applied rigorously by all the MTIs. The underlying aim should be to
objectively appraise the MTIs at regular intervals to ensure quality and rigour of the educational
programmes. Thrust should be on the ability and capacity of such entities to ensure regular
structured ship-board training program (SSTP) for their cadets/trainees as an integral element of the
mandatory training under the applicable provisions of both the Standards of Training, Certification
& Watch-keeping (STCW) Convention and Protocol of the IMO and the Merchant Shipping Act,
1958 (Amended) of India.
7.2.12 Maritime Legal Services
The legal domain of blue economy is complex and multi-faceted. It is governed by the UNCLOS
(United Nation Convention on the Law of the Seas), SOLAS, MARPOL, STCW, BWM, etc. of the
International Maritime Organization (IMO), and MLC (Maritime Labor Convention) of the
International Labor Organization (ILO). In India, the Merchant Shipping Act and its Rules &
Regulations covers the legal jurisdiction of blue economy. Besides the Merchant Shipping Act,
there are Admiralty Acts which provide the legal framework for the resolution of commercial
disputes between various entities in the maritime sector. In addition, the MMTG (Multimodal
Transportation of Goods Act) covers regulations relating to transactions along the logistics supply
chain industry. Specialized trained lawyers are required for meeting the demand for marine legal
services in the country. It is an irony that there are only about one or two dozen qualified maritime
law practitioners in the country and bulk of them are based in Mumbai. Of them, about half-a-dozen
have established maritime practices. Thus, there is a need for more legal professionals with
specialization/expertise in the multifarious dimensions of maritime law. In view of the future
growth potential in the sector, the demand for lawyers in various fields of specialization in maritime
law is likely to grow in the coming years.
On the maritime legal education front, there are barely half-a-dozen colleges/universities that offer
courses in various maritime fields. Hardly any of the top National Law Universities offer this
discipline, on a stand-alone basis, in their campuses. Some academic institutions subsume this into a
94 | P a g e
cross-disciplinary package. Recently, the Maharashtra National Law University in Mumbai has
dedicated a new program to maritime law. The Directorate General of Shipping is collaborating
with the University for popularizing this program for the benefit of the industry stakeholders. Low
attendance has been cited as a major reason for running these courses in the universities. For
instance, the Indian Maritime University based in Chennai (under the administrative control of the
Ministry of Shipping, Government of India) had to close a post-graduation program in maritime law
two years back due to insufficient number of students. The Government of India may undertake
proactive steps in consultation with the National Law Universities for floating suitable academic
programmes on maritime law and spreading the awareness among students about the future
employment opportunities.
7.2.13 Marine Salvage Services
Maritime salvage services refer to activities during and after occurrence of a maritime accident or
incident. In India, post- accident the Indian Coast Guard (ICG) steps into action through its
specialized vessels deployment to contain/firefight, as the first responder. It includes a range of
functions with respect to marine environmental pollution spillage from the bunker oil/oil carried as
cargo in a merchant ship, collision between vessels, grounding/sinking of ships that are wrecked,
ship explosion/fire and other marine disasters. The Coast Guard performs such functions under the
Coast Guard Act and NOS-DCP (National Oil Spill & Disaster Contingency Plan) of the
Government of India, apart from its search and rescue (SAR) operations. Since 2011 the Directorate
General of Shipping (DGS) has put into service one or two specialized tugs on charter hire on the
West and/or the East coasts of India during the monsoon periods (normally between June and
September) for emergency towing away of stricken/crippled merchant vessels along the Indian
coastline. These ETVs (Emergency Towing Vessels) have worked well in meeting such
contingency situations. While these ETVs have been Indian flag special purpose towing vessels
(foreign flags have served in the past also) those are limited only to towing and not for salvage
operations. This is due to the fact that salvage vessels are highly advanced and customized with
highly specialized, trained and equipped technical manpower on board, unlike the normal towing
vessels.
However, in the foregoing maritime contingency response model, it is incumbent upon the
owners/managers of such victim/derelict ships to step forward to bear responsibility and take charge
of such distress situations in respect of their own respective vessels. They are expected to do so by
engaging/hiring experts and professional salvaging companies for providing highly qualified and
trained human resources, specialized vessels and equipments. Some of the marquee names in this
business (known as salvers) are ‘Schmidt’ and ‘Resolve Marine’- both foreign organizations.
Unfortunately, the only Indian firm that was earlier operating in this niche space was ‘GOL
Offshore’, which has gone bankrupt. In absence of any domestic entity, the cost of the services of
foreign salvage professionals/entities is very high. These costs are normally covered under the
marine risk insurance cover provided by P&I (protection and indemnity) clubs of marine insurance
entities.
95 | P a g e
In several advanced maritime nations there are some entities called as the OSROs (Oil Spill
Response Organizations). In the United States, in response to the catastrophic ‘Exxon Valdez’
humungous oil spill incident in 1989, the Oil Pollution Act (OPA) was enacted in 1990. This legal
framework is a crucial element of the oil spill governance program of US whereby OSROs as
highly specialized companies are contracted to respond to major oil spills. The OSROs need to be
evaluated, certified and accredited by the US Coast Guard (USCG) for salvage operations. The
services of the USCG impanelled OSROs, with all their highly sophisticated vessels, high-tech
equipments and skilled technical manpower can be availed as first responders to mitigate, contain
and remedy major oil spill incidents in the maritime space. The OSROs combat such marine
disasters efficiently even at short notices.
India needs to have a holistic and perspective policy to develop an updated NOS-DCP. An overall
strategic policy will have to be worked out to find ways and means to combat, effectively and
timely, the real and potential maritime disasters to minimize the adverse implications on human and
marine health and protect the marine ecosystem. In the pursuit of the above objectives, India should
endeavour to indigenize the response mechanism to the maximum extent feasible. It is imperative
from a national geo-security strategic perspective to insulate the country from potentially being held
to ransom (as it were) by extraneous vested interests in times of national crises.
7.2.14 Maritime Classification Services
In the blue economy sectors, classification societies conduct technical inspection, surveys and
certification of vessels as per the globally accredited standards on maritime safety, security, marine
environmental pollution control, and maritime education & training. In addition, these organizations
inspect ships for overhauls, maintenance repairs, refits, etc during regular dry-docking. The
classification societies also carry out technical inspections of merchant ships pursuant to regulations
governing flag state inspections (FSI)/port state control (PSC) inspections as mandated by the
jurisdictional/respective national maritime/flag state administrations. The societies are duly assessed
by the national maritime/flag administrations and consequently are accorded the status of
recognized organizations (ROs), through formal agreements inked between them. For instance, the
Indian National Maritime/Flag Administration and National Maritime Assistance Service viz., the
Directorate General of Shipping, Government of India has such arrangement stands renewed last in
the fiscal 2015-16.
India has its own entity for classification services known as the Indian Register of Shipping (IRS).
Although there are approximately 70 such entities worldwide, yet only 13 such bodies drawn from
different maritime countries constitute the elite global grouping of CSs/ROs; the IACS
(International Association of Classification Societies). The IACS signifies the highest levels of
conformity of its member-entities to international technical standards in relation to survey,
inspection and certification of merchant ships across the globe. Typically, every Classification
Society/Recognized Organization is cross-border/extra–territorial in the reach of its service
offerings, on a competitive basis, and is not merely localized within its own sovereign jurisdiction.
96 | P a g e
Whilst bulk of its clientele is Indian flag and registered vessels, IRS also has an impressive array of
customers worldwide. IRS has only around 900 professionally qualified surveyors, several of whom
are positioned in multiple offices across the world. The IRS also offers a range of high-end techno-
commercial services that include design and consultancy services. Since the classification services
require specially trained workforce, there should be proper training and educational programmes in
the country to cater to the demands of the industry.
7.2.15 Tourism and Recreation
Tourism is a major global industry and is a sector that continues to grow. For example, in 2012
international tourist arrivals increased by 4% despite the global economic crisis and constituted 9
per cent of Global GDP (direct, indirect and induced impact). Tourism supports 9 per cent of global
jobs and generated US$ 1.3 trillion or 6 per cent of the world’s export earnings (UNWTO, 2013a).
International tourism has grown from 25 million in 1950 to 1,035 million in 2012 and the UNWTO
forecasts further growth for 2030 at 1.8 billion. Cruise tourism is the fastest growing sector in the
leisure travel industry with an overall, average annual passenger growth rate of 7.5 per cent in the
region, and passenger expenditures are estimated in the order of US$ 18 billion per year (OECD,
2012).
Tourism has emerged as a major economic activity in some coastal states such as Goa, Kerala and
Orissa. The NCCR conducted a qualitative analysis of the litter on six different beaches on the
eastern and western coasts. It was found that plastic litter from tourism alone accounted for 40-96
per cent of all beach litter. Although sea cruise is not an important tourist activity in India so far, it
is emerging as one of tourist activities. Hotels and restaurants at coastal tourist hotspots also add to
coastal pollution apart from adding plastics to sea- water.
Tourism developments bring various problems as well. The tourism consumer, however, is driving
transformation of the sector with a 20 per cent annual growth rate in ecotourism; about 6 times the
rate of growth of the overall industry. A Blue Economy approach where ecosystem services are
properly valued and incorporated into development planning will further advance this transition,
guiding tourism development and promoting lower impact activities, such as ecotourism and nature-
based tourism, where the natural capital is maintained as an integral part of the process.
7.2.16 Public Administration
In this category, the relevant activity is security and surveillance services provided by the
government. The Indian Navy and Coast Guard are engaged in this. This is quite similar to ship
building and shipping activities. Indian Navy is engaged in building, repair and operations of ships
in Indian waters. The Indian Navy has already adopted the ‘Green Initiatives Programme’ in 2014
on the World Environment Day, June 5. The principal aim of these initiatives is to reduce the use of
equipment that can potentially damage environment and curtails energy consumption.
97 | P a g e
7.3 Recommendations
Environmental concerns related to sea cruising are similar to shipping. Hence proper
regulation of shipping sector would be effective for any pollution caused by this activity.
There are of course regulations to control pollution from such establishments like hotels
and restaurants, and it is important to ensure that they are properly implemented at
appropriate levels.
Need for proper regulations on sectors like hotels and restaurants and cruise shipping to
conserve environment by reducing pollution.
Maritime Clusters may be developed around ports to boost activity in blue economy
sectors which, in turn, would demand more marine services.
Well-equipped modern shipyards may be developed or existing shipyards may be
augmented at strategic locations.
Specific education programmes in marine legal, classification, salvage, maritime
consultancy and certification services may be designed.
Digitization of port and shipping services by application of artificial intelligence, internet
of things, big data, cloud computing, etc. may be introduced.
Specialized areas such as shipping finance, taxation, marine insurance and related fields
may be included in the merchant shipping courses.
Instead of burdening the existing workforce, third party logistic firms may be hired for
efficient provision of logistics services.
More costal berths may be constructed for promoting coastal shipping in the country.
Reception facility may be ensured at all the 13 major ports in the country.

98 | P a g e
99 | P a g e
References
Aquaculturists. (2013). New BioMarine Clusters Association launched. 3 September.
Asche, F. & Smith, Martin D. (2010). Trade and Fisheries: Key Issues for the World Trade
Organization. Staff Working Paper Staff ERSD-2010-03. WTO.
Asche, F., & Khatun, F. (2006). Aquaculture: issues and opportunities for sustainable production
and trade. Geneva: International Centre for Trade and Sustainable Development (ICTSD).
AU. (2012). 2050 Africa’s Integrated Maritime (AIM) Strategy. Version 1.0. Page 11 and 26.
AU. (2015). Agenda 2063 – The Africa We Want. September. Page 3 and 15.
Behera, H. and Wahi, G. (2018). How have MSME Sector Credit and Exports Fared? Mint Street
Memo No. 13. RBI. 17 August.
Bosch, Frans A.J. Van Den., Rick Hollen., Henk W. Volberda and Marc G. Baaij (2011). The
Strategic Value of the Port of Rotterdam for the International Competitiveness of the
Netherlands: A First Exploration. Rotterdam School of Management (RSM), Erasmus
University Rotterdam.
Bush, S. R., Belton, B., Hall, D., Vandergeest, P., Murray, F. J., Ponte, S. & Kruijssen, F. (2013).
Certify sustainable aquaculture?. Science, 341(6150), 1067-1068.
CEBR (2017). The Economic Contribution of the UK Ports Industry. Center for Economics and
Business Research, London.
CII- Govt. of India (2010). Human Resource Development Strategies for Indian Renewable
Energy Sector. Confederation of Indian Industries and Ministry of New and Renewable
Energy.
Commonwealth Secretariat. (2016). Blue Biotechnology. Commonwealth Blue Economy Series,
No. 5
Danish Government. (2006, June). The Danish Maritime Cluster – an Agenda for Growth.
Ministry of Economic and Business Affairs. The Danish Government.
Danish Government. (2010, July). Integrated maritime strategy. The Danish Government.
Dean, M., & Sebastia-Barriel, M. (2004). Why has world trade grown faster than world
output?. Bank of England. Quarterly Bulletin, 44(3), 310.
EC. (2012). Blue Growth Strategy. Available online at
https://ec.europa.eu/maritimeaffairs/policy/blue_growth_en.
100 | P a g e
EC. (2014). Small Businesses can Drive Blue Growth and Put Europe on the Road to Recovery.
Maritime Affairs and Fisheries. Online Magazine. Policy. December.
EC. (2016). NEPTUNE. At a Glance and Objectives. (Available online at www.neptune-
project.eu)
EC. (2017). Working Document – Report on the Blue Growth Strategy. 31 March. Page 4.
EC. (2018). Declaration of the Sustainable Blue Economy Finance Principles. 7 March.
EC. (2018). Sustainable Blue Economy Finance Principles. Maritime Affairs. Principle 11.
Economist Intelligence Unit. (2015). The Blue Economy -- Briefing Paper for the World Ocean
Summit 2015. Page 6.
EGFSN (2015). A Study of the Current and Future Skills Requirements of the Marine/Maritime
Economy to 2020. Expert Group on Future Skills Needs, April.
EU. (2018). The 2018 Annual Economic Report on EU Blue Economy. Joint Resource Centre,
Water and Marine Resources, European Union.
FAO. (2005).
FAO. (2010). The State of World F isheries and Aquaculture. Rome: FAO.
FAO. (2010). The State of World Fisheries and Aquaculture. Rome: FAO.
Ferdouse, F., Holdt, S. L., Smith, R., Murua, P., & Yang, Z. (2018). The global status of seaweed
production, trade and utilization.
FICCI. (2017). Blue Economy - Vision 2025. April. Pages 20, 21, 22 and 25.
GOC. (2008). Policy Brief on Fisheries and Aquaculture. Global Oceans Conference.
GoI. (2007).
GoI. (2014). Handbook of Fisheries Statistics, Ministry of Agriculture & Family Welfare.
GoI. (2017a). 2nd ASEAN-India Blue Economy Workshop Keynote Address by Secretary
(East). Ministry of External Affairs. 18 July.
GoI. (2017b). Consolidated FDI Policy. DIPP. 28 August.
GoI. (2017c). Indian Ocean Rim Association and India’s Role. Ministry of External Affairs. 7
March.
GoI. (2017d). Annual Report 2017, Ministry of Skill Development.
101 | P a g e
GoI. (2017e). Transport Research Wing. Ministry of Road Transport & Highways.
GOI. (2018a). Annual Report, 2017-18. Ministry of MSME. Page 3 (1.2), Pages 28, 29 (2.3.4)
and Page 88 (5.4.1).
GOI. (2018b). All Schemes. Ministry of MSME. (Available online at https://msme.gov.in/all-
schemes). 19 November.
GOI. (2018c). MSME Insider. Ministry of MSME. September.
GOI. (2018d). MSME Insider. Ministry of MSME. November.
GoI. (2018e). Nitin Gadkari addresses the Sustainable Blue Economy Conference in Nairobi.
Ministry of Shipping. 28 November.
GoI. (2018f). Factsheet on FDI. DIPP. June.
GoI. (2018g). Proposals for Waterways. Ministry of Shipping. 26 July.
GoI. (2018h). Status of Development of Inland Waterways in the Country. Ministry of Shipping.
20 July.
GoI. (2018i). We Care for the Planet: A Path Breaking Journey in Renewable Energy through
Last 4 Years. Ministry of New and Renewable Energy.
Halvorson, H., Alexis, M., Burgess, G., Coimbra, J., Le Gal, Y., Grealy, M., ... & Wenne, R.
(2001). Marine biotechnology: a European strategy for marine biotechnology. Marine
Board Position Paper, 4.
Hughes, A., Day, JG., Greenhill, L. & Stanley, MS. (2016), Aquaculture, Commonwealth Blue
Economy Series, No. 2. Commonwealth Secretariat, London.
Hunt, B., & Vincent, A. C. (2006). Scale and sustainability of marine bioprospecting for
pharmaceuticals. AMBIO: A Journal of the Human Environment, 35(2), 57-64.
Herbert-Burns .(2012).
IBEF. (2018). Shipping Industry and Ports in India. 14 October.
Indian Bureau of Mines. (2014). Indian Minerals Year Book 2014, Vol. I-III, Controller General,
Indian Bureau of Mines, Nagpur
Indian Bureau of Mines. (2015). Indian Minerals Year Book 2015, Vol. I-III, Controller General,
Indian Bureau of Mines, Nagpur
IEA. (2010). World Energy Outlook 2010.
102 | P a g e
IEA. (2012). World Energy Outlook 2012.
IEA. (2017). World Energy Outlook 2017.
IFC. (2013). Access To Credit Among Micro, Small, And Medium Enterprises.
IFC. (2014). MSME Country Indicators 2014 - Towards a Better Understanding of MSMEs.
Page 2.
IFC. (2017a). MSME Finance Gap. Assessment of the Shortfalls and Opportunities in Financing
MSMEs. Executive Summary and Conclusion.
IFC. (2017b). MSME Finance Gap. Assessment of the Shortfalls and Opportunities in Financing
MSMEs. Page 30.
IFFO (2013). Linkage between farmed fish and wild fish - fishmeal & fish oil as feed ingredients
in the context of sustainable aquaculture. Jonathan Shepherd, Director General,
International Fishmeal & Fish Oil Organisation, OECD Conference Paris 15th – 16th April
2010.
ILO (2018). World Employment and Social Outlook 2018: Greening with Jobs. International
Labour Organization.
India Maritimeplus. (2018). (available online at www.maritimeinvest.in).
INSA. (2018). Annual Review 2018. Indian National Shipowners’ Association, Mumbai.
Indian Ports Association. (2017).
InterVISTAS Consulting Inc. (2014). Port of Nanaimo: Economic Impact Study. October.
InvestIndia. (2018). Ports and Shipping.
IMF. (2018). Balance of Payments Statistics. International Monetary Fund, Washington D.C.
IOC/UNESCO, IMO, FAO, UNDP. (2011). A Blueprint for Ocean Sustainability, Paris.
IORA. (2017). Jakarta Declaration on Blue Economy. May.
IPA. (2017). Maritime India Summit 2016. July.
IRENA (2018). Renewable Energy and Jobs-Annual Review 2018. International Renewable
Energy Agency.
Kathijotes, N. and Sekhniashvili, D. (2017). Blue Economy: Technologies for Sustainable
Development. Conference Proceedings International Conference on Contemporary
Achievements in Civil Engineering 21. April 2017. Subotica, Serbia.
103 | P a g e
Leary et al (2009). Marine genetic resources: A review of scientific and commercial interest. Mar
Policy 33:183–194.
MARIBE. (2018). Available online at https://maribe.eu/
Michel and Sticklor. (2012).
Mohanty, S. K. (2018). Towards Estimation of the Blue Economy. Chapter 3, Eds. V. N. Attri
and Narnia Bohler-Muller, The Blue Economy Handbook of the Indian Ocean Region,
African Institute of South Africa. pp. 64-80.
Mohanty, S. K., Dash, P., & Gaur, P. (2019). Economic Dimensions of Fisheries in IORA,
Research and Information System for Developing Countries, New Delhi and IORA
Secretariat, Mauritius.
Mohanty, S. K., Dash, P., Gupta, A., & Gaur, P. (2015). Prospects of Blue Economy in the
Indian Ocean. Research and Information System for Developing Countries, New Delhi.
Mohanty, S. K., & Saha, S. (2019). Manufacturing trade and Employment Linkages in India.
(Eds.) Chaturvedi Sachin, Saha, Sabyasachi, & Saw, Prativa. in Manufacturing and Jobs in
South Asia: Strategy for Sustainable Economic Growth. Springer.
Mora, C., Tittensor, D. P., Adl, S., Simpson, A. G., & Worm, B. (2011). How many species are
there on Earth and in the ocean?. PLoS biology, 9(8), e1001127.
Mukherjee, S. (2018) Challenges to Indian micro small scale and medium enterprises in the era
of globalization. Journal of Global Entrepreneurship Research. 2 October.
Nairobi Statement of Intent. (2018). The Nairobi Statement of Intent on Advancing the Global
Sustainable Blue Economy. November. Pages 3, 8 and 12.
NITI Aayog (2015). Report of the Working Group on 175 GW RE by 2022. December.
NOAA. (2018). How Much of the Ocean have we Explored? U.S. Department of Commerce.
November. (Available online at https://oceanservice.noaa.gov/facts/exploration.html)
Notteboom, Theo (2010). Dock Labour and Port-Related Employment in the European Seaport
System: Key Factors to Port Competitiveness and Reform. ITMMA, University of
Antwerpen.
OECD (2012). The Future of the Ocean Economy – exploring the prospects for emerging ocean
industries to 2030.
Oxford Economics (2015). The Economic Value of the EU Shipping Industry- Update. A Report
for the European Community Shipowners’ Associations (ECSA), February.
104 | P a g e
PARM (2004). Assessment of the sustainability of industrial fisheries producing fishmeal and
fish oil. Poseidon Aquatic Resource Management Ltd and the University of Newcastle-
Upon-Tyne.
Potts, J., Lynch, M., Wilkings, A., Huppé, G., Cunningham, M., & Voora, V. (2014). The state
of sustainability initiatives review 2014: Standards and the green economy. International
Institute for Sustainable Development (IISD) and the International Institute for
Environment and Development (IIED), 332.
Reserve Bank of India. (2018). Handbook of Statistics on Indian Economy. Reserve Bank of
India, Mumbai.
Research Collective. (2018). Occupation of the Coast - Blue Economy in India. January.
Spalding, Mark J. (2016). The New Blue Economy: the Future of Sustainability. Journal of
Ocean and Coastal Economics: Vol. 2, Article 8. Page 14.
Theofanis, Sotiris., Maria Boile and William Laventhal (2009). Trends in Global Port Operations
and their Influence on Port Labor: Challenges and Implications for US East Coast
Longshoremen. Submitted for presentation at the 50th Annual Forum Transportation
Research Forum, Oregon.
UN General Assembly. (2017). Resolution A/RES/71/312
UN. (2018). SDG 14: Life Below Water (available online at
http://in.one.un.org/page/sustainable-development-goals/sdg-14/)
UN. (2018). UN SDG Knowledge Platform (available online at
https://sustainabledevelopment.un.org/sdg14)
UNCTAD (2012). Review of Maritime transport 2012. ISBN 978-92-1-112860-4
UNCTAD. (2014). The Ocean Economy: Opportunities and Challenges for Small and Island
States. United Nation. New York and Geneva.
UNCTAD. (2015). The Oceans Economy: A Formidable Asset for The Advancement of
Sustainable Development. December.
UNDP. (2018). Leveraging the blue economy for inclusive and sustainable growth. Policy Brief.
Issue No. 6/2018.
UNECA. (2016). Africa's Blue Economy: A policy handbook. March.
UNWTO (2013). World Tourism Barometer. Vol 11, April 2013.
UNWTO (2013a). Tourism highlights 2013 edition.
105 | P a g e
Venkatshamy. (2016).
Wabnitz, C., Taylor, M., Green, E., Razak, T. 2003. From Ocean to Aquarium. UNEP-WCMC,
Cambridge, UK.
World Bank. (2017). Infographic on 'What is the Blue Economy?', June 6.
World Bank. (2017). The Potential of the Blue Economy: Increasing Long-term Benefits of the
Sustainable Use of Marine Resources for Small Island Developing States and Coastal Least
Developed Countries. World Bank, Washington
World Bank. (2018). Sovereign Blue Bond Issuance: FAQs. October 29.
World Bank and UNDESA. (2017).
WTR. (2016). World Trade Report. Key facts and findings on SMEs.
WWF. (2015). Principles for a Sustainable Blue Economy. 28 May.