Embed Size (px)
Citation preview
Prof. A.V.Y. Mbelle
Department of Economics; University of Dar
es Salaam
4/16/2016
2016MANUFACTURING AND TRANSFORMATION IN A DEVELOPING COUNTRY CONTEXT: ASSESSING POLICY RESPONSE IN
CHANGING POLICY PARADIGMS – TANZANIA (revised version, 16.4.2016)
ii
“MANUFACTURING AND TRANSFORMATION IN A DEVELOPING COUNTRY CONTEXT: ASSESSING POLICY RESPONSE UNDER CHANGING DEVELOPMENT PARADIGMS - TANZANIA”
By Prof. A.V.Y. Mbelle
Abstract
Transformation is desired for many reasons such as creation of employment opportunities in higher productivity sectors; greater private sector role, addressing gender imbalances, etc.
At the heightened desire for transformation lies Manufacturing, with developed country experiences showing that Manufacturing remains a key driving force of overall economic growth. This is largely attributable to its higher productivity and scope for innovation; with the assertion that competitiveness of manufacturing is one of the basic determinants of long-run sustainable growth. For Manufacturing to play this role effectively, an enabling policy framework must be in place.
The urge for economic transformation in Tanzania dates back to independence days with the desire to correct the three colonial legacy ills of poverty, ignorance and disease. Tanzania Development Vision 2015 re-emphasized this urge. Further articulation has been made in subsequent development policy frameworks for achieving TDV 2025 aspirations.
The route to transformation through Manufacturing in Tanzania has been influenced by a number of developments such as changing global development paradigms that have often called for domestic policy change.
Has national policy been positioning Tanzania’s Manufacturing to play this transformational role?
This paper uses time series data for the period 1961 to 2015 to examine the influence of policy change on performance of Tanzania’s Manufacturing sector and the sector’s potential in delivering socio-economic transformation. The analysis focussed on three sets of policies: macro-economic policy, sector specific policy and non sector specific microeconomic policy.
The main finding of the paper is that policies, though generally supportive of manufacturing had not been properly sequenced. In light of this finding and Tanzania’ urge for faster socio-economic transformation, the paper suggests proper sequencing in order to exploit policy synergies.
Key words: transformation, manufacturing role, government policy

iii
CONTENTS Page
Abstract ii
Table of contents iii
Abbreviations and acronyms v
Chapter 1: Introduction and background 1
Chapter 2: Record of Policy and Manufacturing Performance in Tanzania, 1961-2015 4
Chapter 3: Literature review on interconnectedness of manufacturing performance, transformation and policy 13
Chapter 4: Methodology for assessing impact of policy on manufacturing performance 22
Chapter 5: Empirical results and discussion 24
Chapter 6: Concluding remarks 26
List of Tables
2.1: Importance of Manufacturing sector in Tanzania: 1964 to 2015 7
2.2: Manufacturing Employment 2006 and 2014 Compared 7
2.3: Employment by sector and gender, 2016 and 2014 9
2.4 Performance of Manufactured Exports in Tanzania, 1980-2014 Selected Years 10
2.5: Tanzania – Manufacturing Value Added and Export Performance 2008 and 2013 10
2.6: Tanzania – Manufacturing Value Added and Export Performance Compared with Selected LDCs, 2013 11
Competitive Industrial Performance Index 2013: World Raking Ranks – Tanzania and Selected Countries 12
2.8: Factors affecting LDCs Competitiveness in global value chains 12
2.9: COSTECH Registered Research and Development Institutions in Tanzania, 2015 13
3.1 Technology-Related Policy Dimensions 16
4.1: Relative Impact of Trade and Macroeconomic policy in Tanzania: 1970-1990 21
5.1: Empirical Results: Determinants of Manufacturing output in Tanzania, 1961-2015 24
iv
Table 5.2: Empirical Results Determinants of Manufacturing Value Added in Tanzania, 1961-2015 24
5.3: Empirical Results – Determinants of Manufacturing Exports in Tanzania 1961-2015 25
List of Figures
2.1: Long run trend of Manufacturing Performance in Tanzania: 1961-2015 6
2.2: Snapshot of Manufacturing sector’s relative importance, 2015 6
2.3: Long term trends in Manufacturing Value Added and Manufacturing Employment: 1967-2015 8
2.4: Market growth and Tanzania’s presence in EAC & SADC markets for manufactured products 2000-2010 11
3.1: Conceptual Linkages between industrial development and support organizations 14
ANNEXES 31
1: Industrialization-related SDGs 31
2: Elements of Inclusive and Sustainable Industrial Development (ISID) 32
3: Phases in industrial revolution 32
4: International Standard Industrial Classification – Codes 33
5: International Standard Industrial Classification – Sectors 33
6: Technological classification of exports, Standard International Trade Classification 33
7: Competitive Industrial Performance (CIP) index 34
8: Data characteristics: Normality Test 35
9: Data Characteristics: Unit Root Test 36
10: Trends of Exchange Rate and Manufacturing Exports in Tanzania, 1961-2015 37
11: FDI inflows in Tanzania, %change, 1961-2014 37
12: High-tech manufactures exports: Codes and description 38
v
ABBREVIATIONS AND ACRONYMS
AU African Union
ESRF Economic and Social Research Foundation
FYDP Five Year Development Plan
GCI Government of Cote d’Ivoire
ICT Information Communication Technology
MDGs Millennium Development Goals
R&D Research and Development
SDGs Sustainable Development Goals
STEM Science, Technology, Engineering, Mathematics
STI Science, Technology and Innovation
UN United Nations
UNDP United Nations Development Programme
URT United Republic of Tanzania
“MANUFACTURING AND TRANSFORMATION IN A DEVELOPING COUNTRY CONTEXT: ASSESSING POLICY RESPONSE UNDER CHANGING DEVELOPMENT PARADIGMS - TANZANIA”
I. Introduction and background
I.1 IntroductionIndustrialization is acknowledged world wide as the engine of growth. In the African continent, the imperative to industrialize in today’s global context has been spelt out in various documents such as UNIDO and UNCTAD (2011), ECA and AU (2013) and identifies commodity-based industrialization as an engine of growth and economic transformation. As a follow-up to this and other on-going processes in the African continent, over 300 development stakeholders met in Abidjan during 18-20 March 2015 to discuss Africa’s emergence and share experiences of other countries outside the Continent (GCI/UNDP, 2015). It was noted that Africa has increasingly evidenced its potential for economic emergence, with robust growth in most economies and social and political stability. Africa has enjoyed robust economic growth – outweighing the effects of low growth witnessed in the 1980s through the 1990s.
Despite this development there are issues that needed further consideration. These include minimal impact of growth on poverty reduction, structural transformation and diversification of the sources of growth; and improving quality of jobs and productivity. It was further noted that the state has a developmental role to play, to craft a vision, strategy and plans for the country.
Of particular interest were two observations. First, that Africa’s structural transformation path is unique from (predicted) normal pattern. The transformation has generally escaped industrial development and that Africa’s trade, though increasing, has shown limited diversification, generally remaining concentrated on export of primary commodities. Second, Africa has demonstrated growing signs of competitiveness for its productive sectors, enabling visibility on global trade. The signs, however, are not yet strong.
The development stakeholders saw the way forward for Africa to be Industrialization, Research and Development, and continuous investment in human resources. Manufacturing is targeted as the driving force for industrialization.
Role of Manufacturing (see also Annexes 4 and 5)From the first industrial revolution with UK serving as “workshop of the world”, Manufacturing (International Standard Industrial Classification (ISIC 3; see Annexes 4 and 5) has been an important driving force to economic development (Broadberry and Leunig (2013). Since then, the role of manufacturing in economic development continues as important as ever with new focus of growth tilting towards industry and jobs. Manufacturing is the most knowledge-intensive sector of the economy and still the most important recipient of technological progress.
2
Developed country experiences show that Manufacturing remains a key driving force of overall economic growth. This is largely attributable to its higher productivity and scope for innovation; with the assertion that competitiveness of manufacturing is one of the basic determinants of long-run sustainable growth (Leistritz, 1996; UNCTAD, 2012; UNIDO, 2015).
Moving towards inclusive and sustainable industrial development (ISID) requires pursuing rapid, long-run and stable growth and technological change within manufacturing. This has been emphasized by the The Lima Declaration adopted by UNIDO’s Member States in December 2013, (UNIDO 2014, see Annex 2). ISID has three elements: long-term (or sustained) industrialization as a driver for development; socially inclusive development offering equal opportunities and an equitable distribution of benefits - equity- adjusted wage, employment intensity; and environmental sustainability which focuses on decoupling the prosperity generated by industrial activities from excessive natural resource use and negative environmental impacts (UNIDO 2015).
As (UN 2015) points out, technology, science and capacity building are major pillars for implementing the 2030 development agenda. Technology can deliver win-win-win solutions, simultaneously balancing growth, environmental and social concerns. SDG target 9.2 sets the objective for industry, that “by 2030, significantly raise industry’s share of employment and Gross Domestic Product (GDP), in line with national circumstances, and double its share in least developed countries”. Technology and innovation now have a central role in the Sustainable Development Goals “technology, science and capacity building are major pillars for implementing the post-2015 agenda and the Rio+20 follow-up processes” (UNDESA and UNDP, 2012). See also Annex 1.
Though technology is lauded for its advantages, caution is also drawn on its challenges. In view of the unfolding technological developments (fourth industrial revolution when both industrial machines and entire factories become automated) workers will be challenged to be more educated, more flexible and more technologically savvy (UNDP ibid). See Appendix 3. Schwab (2016) is more sounding and sees the fourth industrial revolution, which will be characterized by velocity, scope, and systems impact evolving at an exponential rather than a linear pace to “fundamentally alter the way we live, work, and relate to one another. In its scale, scope, and complexity, the transformation will be unlike anything humankind has experienced before”. The author underlines the importance of utilizing the opportunity to shape the Fourth Industrial Revolution and direct it toward a future that reflects common objectives and values.
Manufacturing plays other important roles as well such as sustaining growth by lengthening its episodes and reducing its volatility. Manufacturing promotes inclusive growth through generating direct and indirect jobs in manufacturing and manufacturing-related services thus bringing more people into the growth process (Dinh and Monga, 2013; UNIDO 2013). In fact if productivity growth goes hand in hand with accelerated growth of output, the net effects on employment can be positive.
Manufacturing is also associated with lower levels of poverty, better income distribution, and better Human Development Index rankings. It is a high-productivity sector capable of absorbing large numbers of moderately skilled workers (UNIDO 2011). Perhaps the single most important
3
contribution the SDGs make to Africa is that they explicitly recognize that sustainable development means creating good jobs—jobs that pay living wages, offer dignity of work, and create a chance to develop new skills (Goal 8) (GCI and UNDP, 2015).
Countries at low and lower middle incomes have opportunities to create a large number of formal manufacturing jobs (UNIDO op.cit). This, however, depends to a large extent on the state of domestic capabilities and technologies. Developing domestic technological capabilities stands as one of the most important elements to sustain growth.
For Manufacturing to play a transformative role three factors need to be in place: ability to sustain growth (growth per capita (Szirmai 2013); ability to sustain growth over longer uninterrupted periods, lower volatility of growth); competitiveness (Lall, 2001) and enabling policy (UNIDO 2015). Countries with steady economic growth, driven by industrialization; international trade and related services managed to reduce poverty most effectively (UNECA and AU, 2013).
I.2 BackgroundThe urge for economic transformation in Tanzania dates back to independence days with the desire to correct the three colonial legacy ills of poverty, ignorance and disease. Tanzania Development Vision 2025 resounded this urge by articulating the desired state to be achieved by 2025 (URT 1999a and b). Further articulation has been made in subsequent development policy frameworks, notable being Tanzania’s Long Term Perspective Plan, LTPP, (URT 2011).
The route to transformation through Manufacturing in Tanzania has been influenced by a number of external/global and internal developments.
Globally, the paradigm of growth that characterized the 1960 and 1970s (up to mid 1980s) called for massive investments to spur growth. This period was followed by growth and human development/poverty paradigm much inspired by publication of UNDP 1990 Human Development Report. The last phase is one of sustainability and beyond paradigm inspired by the Rio Conference of 1992. For Tanzania, with respect to Manufacturing-related policies, three phases can be discerned (ODI 2016): early years of independence (1961-1966); socialist era (1967-1985) Structural adjustment and liberalization phase (1986-1995) and return to the development agenda and industrialization (1996-2015). The last two can be adjusted to 1986-1998 and 1999-2015 to reflect crafting of Tanzania Development Vision 2025 in 1999.
When the two perspectives are mirrored, Tanzania’s perspective can be categorized as growth-related policies (up to mid 1990s), sustainability-related policies from 1996 with adoption of Sustainable Industrial Development Programme, SIDP) and poverty reduction agenda after 2000 following crafting of Poverty Reduction Strategy Paper (URT 2000) and the first National Strategy for Growth and Reduction of Poverty (NSGRP/MKUKUTA) in 2005 (URT 2005). It is thus expected that policy response will reflect the development paradigm of the day.
4
Policy options for influencing Manufacturing Broadberry and Leunig (2013) point out three possible policy instruments for influencing Manufacturing: macro economic policy, sector-specific policies and manufacturing-relevant non-sector-specific microeconomic policies. These are discussed in detail in section three.
I.3 Emerging issuesFor developing countries like Tanzania development objects are many and sometimes conflicting each other. The quest for transformation through industrialization requires balancing the various policy options in order to achieve a win-win-win situation. Choice of the pattern of industrialization will influence poverty reduction, environmental sustainability and food security. Has such a rebalancing process been experienced in Tanzania?
I.4 Objective of paperThis paper examines the influence of policy on Manufacturing in a developing country context geared to achieving economic transformation through industrialization, with Tanzania as case study. Additionally assessment of coherence of chosen policies with changing development paradigms is made.
I.5 Organization of paper
Five more sections complete this paper. The next section presents record of performance of Tanzania’s Manufacturing sector, followed by section three which provides brief review of theoretical and empirical literature. Methodology is the subject of section four. Empirical findings and their discussion are presented in section five. The last section, six, provides concluding remarks.
II. Record of Policy and Tanzania’s Manufacturing Performance
OverviewThis section presents brief account of policies that had a bearing on Manufacturing and the sector’s performance for the period 1961 to 2015. The section has two sub-sections, on policy and sector performance.
II.1 Record of policyProbably one of the areas in Tanzania that has witnessed extensive research work is the area of policy. We will not attempt to add to the list mainly for avoiding redundancy. However, for purposes our paper we will only highlight some relevant aspects drawing on the treatment suggested by Broadberry and Leunig (2013). Related Tables, Figures and Annexes in this paper accomplish the task.
5
Macroeconomic policy
Macro economic policy involves a range of instruments related to monetary policy, fiscal policy, Government purchasing regional, policy; competition policy; demand management; international trade, and exchange rate regimes.
For purposes of our paper we pick exchange rate regime. The watershed to exchange rate policy regime was provided by economic reforms adopted in 1986 moving towards stability thereafter. As shown in Annexes 8 and 10, policy has had varied impacts on the exchange rate.
Sector-specific policiesSector-specific policies include encouragement of mergers to create national champions; nationalization, privatization; investments; selective taxes; public sector purchasing; and the encouragement of foreign direct investment (FDI). Detailed treatment of policy is accomplished in many works such as Rweyemamu (1976), Sharstein and Wangwe (1986), Page (2015), Page and Tarp (2016).
For purposes of our paper we peak Foreign Direct Investment. From initial wide swings, changes in inflows stabilized after mid 1990s. We attribute this to establishment of Tanzania Investment center in 1997, which created a favourable climate for investments e.g. one stop center concept. Annexes 8 and 11 show the impact. FDIs are preferred for many reasons such as technology transfer, improving competitiveness, etc.
Non-sector-specific microeconomic policiesManufacturing-relevant non-sector-specific microeconomic policies include policies on education and training; science and technology policy; regional policy and agglomeration economies; competition policy, etc.
We pick education and training to represent this group. The Education and Training Policy of 1995 liberalized education training in the country. This led to expansion of both infrastructure and enrolment. It is expected that the critical personnel for manning manufacturing tasks would thus be expanded.
II.2 Record of Manufacturing performance
Manufacturing growth and contribution to GDP, a long term trend
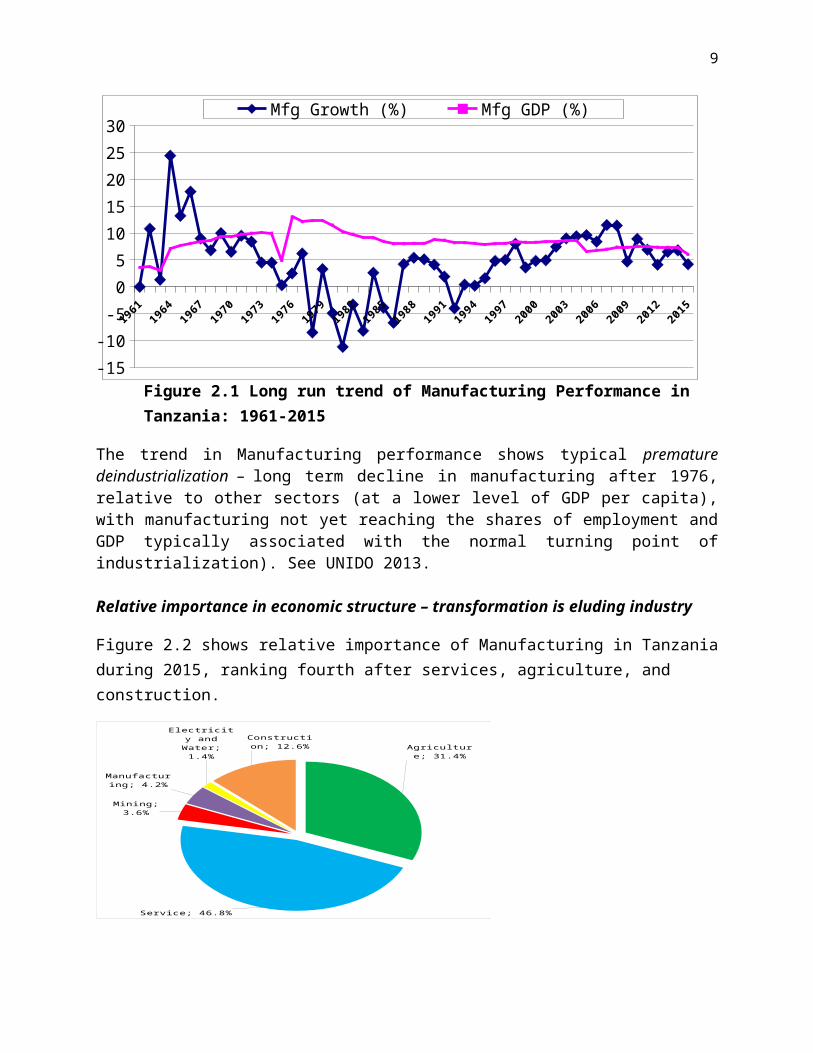
Overall, the pattern of Manufacturing performance in Tanzania shows volatility over time. Starting at high growth rate and contribution to Gross Domestic Product (GDP) in the 1960s to 1970s, the sector declined both in terms of growth in the 1980s and importance ever since
6
(Skarstein and Wangwe, 1986; Szirmai and Lappere, 2001; see Figure 2.1 which shows performance of Manufacturing sector in terms of both growth and contribution to GDP. Such “volatility” is typical of a situation where policies are not implemented in a sustainable way or are inconsistent (UNIDO 2015).
1961
1963
1965
1967
1969
1971
1973
1975
1977
1979
1981
1983
1985
1987
1989
1991
1993
1995
1997
1999
2001
2003
2005
2007
2009
2011
2013
2015
-15
-10
-5
0
5
10
15
20
25
30Mfg Growth (%) Mfg GDP (%)
Figure 2.1 Long run trend of Manufacturing Performance in Tanzania: 1961-2015
The trend in Manufacturing performance shows typical premature deindustrialization – long term decline in manufacturing after 1976, relative to other sectors (at a lower level of GDP per capita), with manufacturing not yet reaching the shares of employment and GDP typically associated with the normal turning point of industrialization). See UNIDO 2013.
Relative importance in economic structure – transformation is eluding industry
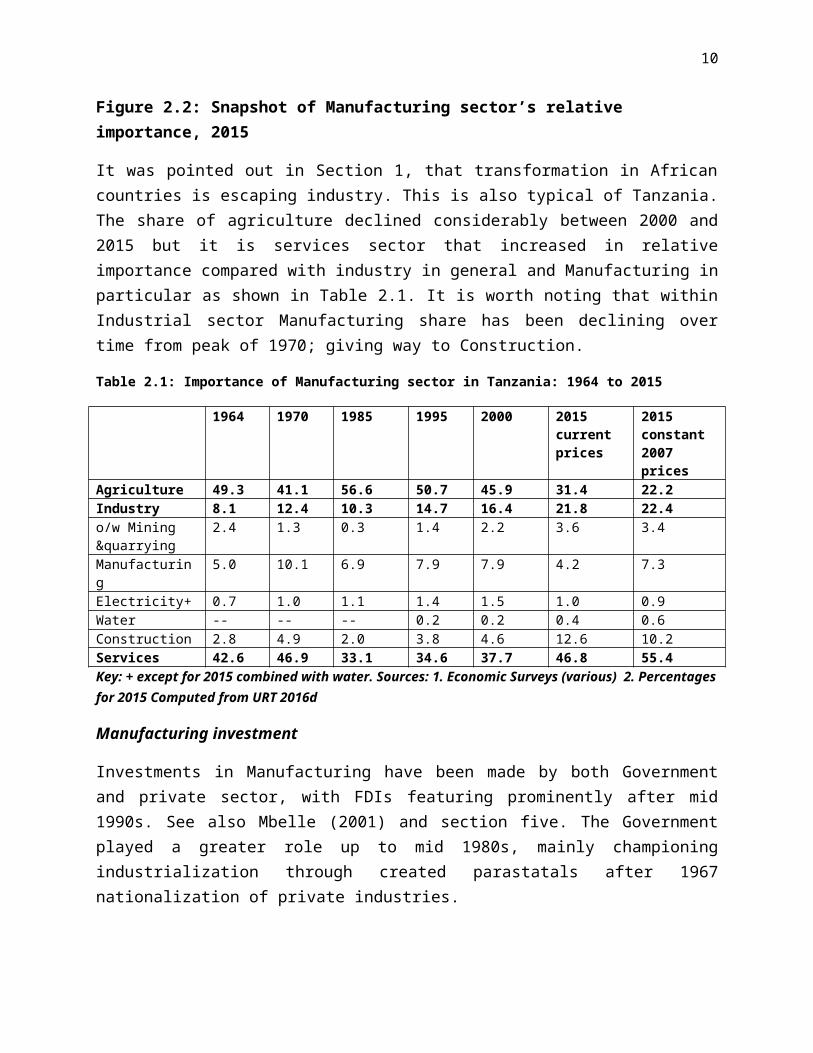
Figure 2.2 shows relative importance of Manufacturing in Tanzania during 2015, ranking fourth after services, agriculture, and construction.
Agriculture; 31.4%
Service; 46.8%
Mining; 3.6%
Manufacturing; 4.2%
Electricity and Water; 1.4%
Construction; 12.6%
Figure 2.2: Snapshot of Manufacturing sector’s relative importance, 2015
7
It was pointed out in Section 1, that transformation in African countries is escaping industry. This is also typical of Tanzania. The share of agriculture declined considerably between 2000 and 2015 but it is services sector that increased in relative importance compared with industry in general and Manufacturing in particular as shown in Table 2.1. It is worth noting that within Industrial sector Manufacturing share has been declining over time from peak of 1970; giving way to Construction.
Table 2.1: Importance of Manufacturing sector in Tanzania: 1964 to 2015
1964 1970 1985 1995 2000 2015 current prices
2015 constant 2007 prices
Agriculture 49.3 41.1 56.6 50.7 45.9 31.4 22.2Industry 8.1 12.4 10.3 14.7 16.4 21.8 22.4o/w Mining &quarrying
2.4 1.3 0.3 1.4 2.2 3.6 3.4
Manufacturing 5.0 10.1 6.9 7.9 7.9 4.2 7.3Electricity+ 0.7 1.0 1.1 1.4 1.5 1.0 0.9Water -- -- -- 0.2 0.2 0.4 0.6Construction 2.8 4.9 2.0 3.8 4.6 12.6 10.2Services 42.6 46.9 33.1 34.6 37.7 46.8 55.4Key: + except for 2015 combined with water. Sources: 1. Economic Surveys (various) 2. Percentages for 2015 Computed from URT 2016d
Manufacturing investment
Investments in Manufacturing have been made by both Government and private sector, with FDIs featuring prominently after mid 1990s. See also Mbelle (2001) and section five. The Government played a greater role up to mid 1980s, mainly championing industrialization through created parastatals after 1967 nationalization of private industries.
In recent past Manufacturing has been a significant recipient of investments. Between 1996 and 2011 Manufacturing projects registered by Tanzania Investment Center (TIC) totaled 2,217 equivalent to 31.8 percent, followed by tourism;:1,727 projects equivalent to 24.8 percent. Value wise Manufacturing projects accounted for 17 percent of total value of investments, (third to economic infrastructure, 23.5 percent and tourism, 21.7 percent). See Rwegasira et al, 2016.
Manufacturing employment
There has been a modest increase in Manufacturing employment over the years, though still at low level compared to employment growth in other sectors (Table 2.2). See also Figure 2.3.
Table 2.2: Manufacturing Employment 2006 and 2014 Compared
Year Number Share (%) Change (%) Annual growth (%)2006 434,206 2.61 -2014 615,323 3.07 0.46% 2.75Sources: URT 2014 and 2015
8
The low share of Manufacturing employment is another manifestation of pre-mature de-industrialization with the share being less than the typical turning point of industrialization which is ten percent and more.
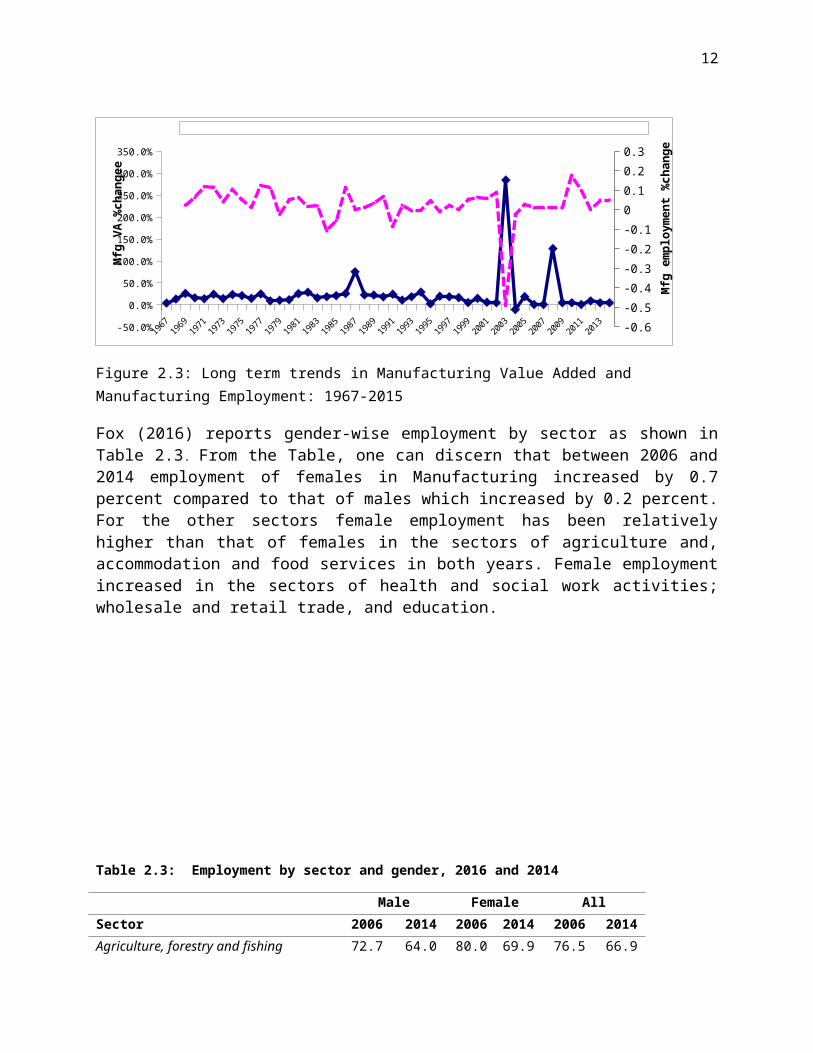
Labour productivity in ManufacturingIssue of productivity in Manufacturing sector has been treated at length in other works such as Szirmai (2001) and Rwegasira et al (2016). We will thus confine to long term trend in employment and Value Added as shown in Figure 2.3. It is interesting to note the consistently positive and high level of change in employment, while Manufacturing Value Added has been changing at low rates. This is an indication of inability to reduce costs or inability of labour to improve performance.
1967
1969
1971
1973
1975
1977
1979
1981
1983
1985
1987
1989
1991
1993
1995
1997
1999
2001
2003
2005
2007
2009
2011
2013-50.0%
0.0%
50.0%
100.0%
150.0%
200.0%
250.0%
300.0%
350.0%
-0.6
-0.5
-0.4
-0.3
-0.2
-0.1
0
0.1
0.2
0.3
Mfg VA %change Mfg employment %change
Mfg
VA
%ch
ange
e
Mfg
em
ploy
men
t %ch
ange
Figure 2.3: Long term trends in Manufacturing Value Added and Manufacturing Employment: 1967-2015
Fox (2016) reports gender-wise employment by sector as shown in Table 2.3 . From the Table, one can discern that between 2006 and 2014 employment of females in Manufacturing increased by 0.7 percent compared to that of males which increased by 0.2 percent. For the other sectors female employment has been relatively higher than that of females in the sectors of agriculture and, accommodation and food services in both years. Female employment increased in the sectors of health and social work activities; wholesale and retail trade, and education.
9
Table 2.3: Employment by sector and gender, 2016 and 2014
Male Female AllSector 2006 2014 2006 2014 2006 2014Agriculture, forestry and fishing 72.7 64.0 80.0 69.9 76.5 66.9Mining and quarrying 0.9 1.7 0.1 0.4 0.5 1.1Manufacturing 3.4 3.6 1.9 2.6 2.6 3.1Construction 2.1 4.0 0.1 0.1 1.1 2.1Wholesale and retail trade 9.3 12.4 6.1 12.8 7.6 12.7Transportation and storage 2.9 5.0 0.2 0.2 1.5 2.6Accommodation and food service 1.1 1.4 2.8 6.5 2.0 3.9Administrative and support service 1.9 1.0 0.3 0.3 1.1 0.6Education 1.6 2.1 1.2 2.1 1.4 2.1Health and social work activities 0.5 0.7 0.7 1.0 0.6 0.8Other 3.6 4.1 6.7 4.1 5.2 4.1Total 100 100 100 100 100.1 100Sources: 2006 and 2014 LFS Analytical Reports. Note: “Other” includes 'electricity, gas & water', 'financial intermediation'; 'real estate/renting & business activities'; 'other community/social & personal service activities' and 'employed persons in private households.
The low performance in employment is decried by Page (2015) that the sector that has been largely absent from the Tanzania success story is industry, a high productivity sector that has the potential to absorb large numbers of modestly skilled workers. Relative to international benchmarks Tanzania suffers a “manufacturing deficit.” Only 2.7 percent of Tanzanian workers were employed in manufacturing in 2010, compared with 12-14 percent of workers in other countries at its level of per capita income; and that the share of the labor force in manufacturing in a typical middle income country is ten times that in Tanzania.
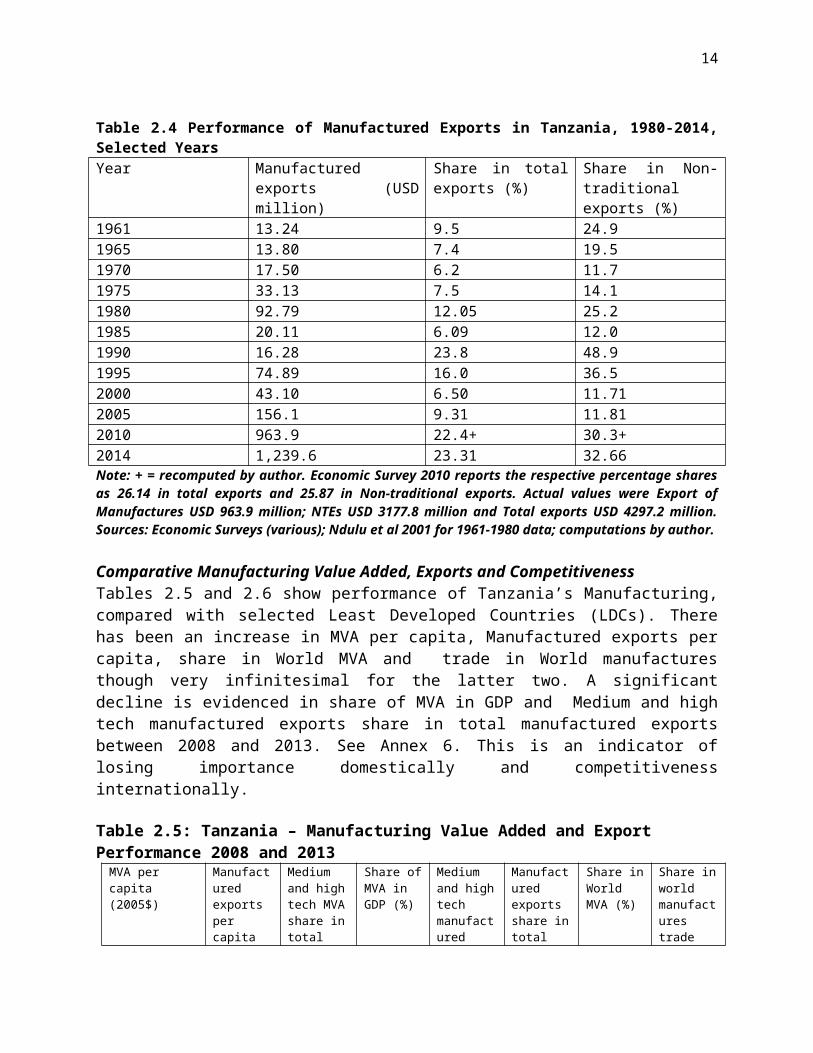
Manufactured exportsOverall, performance of export of Manufactures shows an upward trend in nominal terms from USD 13.24 million in 1961 to USD 1,239.6 million in 2014. The same can be said with respect to shares in total exports and in non-traditional exports (Table 2.4). Period-wise, Ndulu et al (2001) point out that the share of manufactures in non-traditional exports declined from an average of 24 percent during 1961-1966 to 16 percent during 1967-1975 before recovering marginally to 20 percent during 1986-1989.
10
Table 2.4 Performance of Manufactured Exports in Tanzania, 1980-2014, Selected YearsYear Manufactured exports (USD
million)Share in total exports (%)
Share in Non-traditional exports (%)
1961 13.24 9.5 24.91965 13.80 7.4 19.51970 17.50 6.2 11.71975 33.13 7.5 14.11980 92.79 12.05 25.21985 20.11 6.09 12.01990 16.28 23.8 48.91995 74.89 16.0 36.52000 43.10 6.50 11.712005 156.1 9.31 11.812010 963.9 22.4+ 30.3+2014 1,239.6 23.31 32.66Note: + = recomputed by author. Economic Survey 2010 reports the respective percentage shares as 26.14 in total exports and 25.87 in Non-traditional exports. Actual values were Export of Manufactures USD 963.9 million; NTEs USD 3177.8 million and Total exports USD 4297.2 million. Sources: Economic Surveys (various); Ndulu et al 2001 for 1961-1980 data; computations by author.
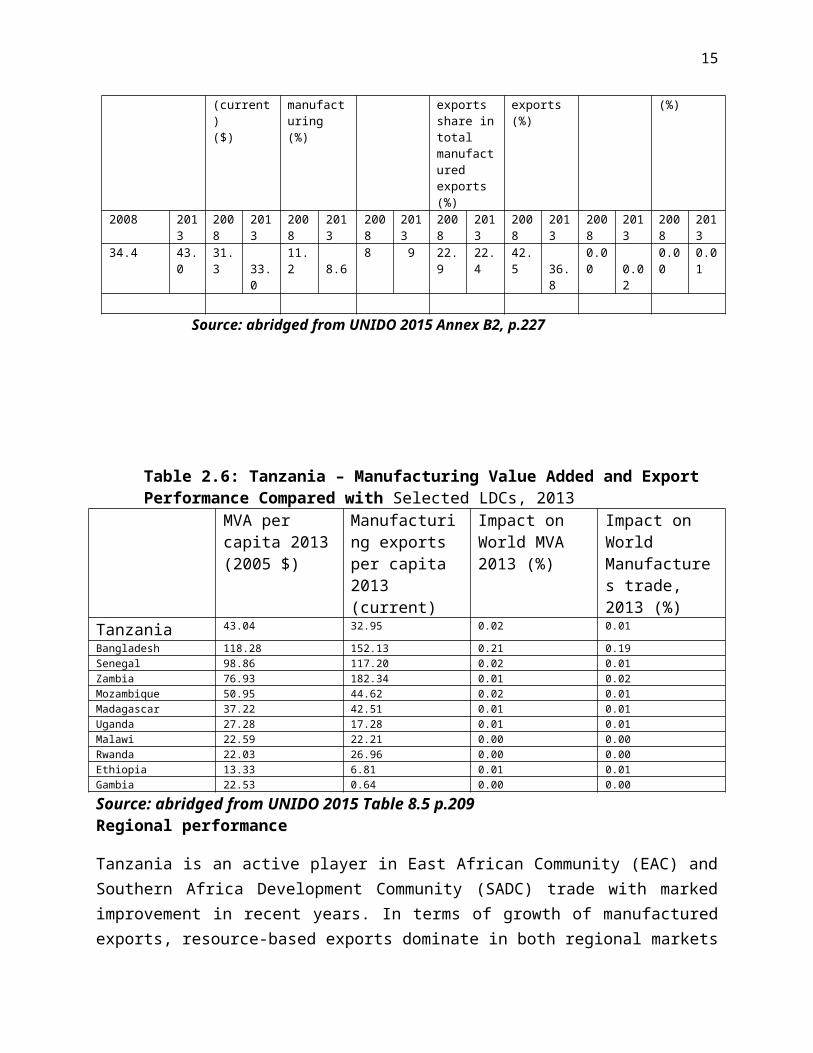
Comparative Manufacturing Value Added, Exports and Competitiveness Tables 2.5 and 2.6 show performance of Tanzania’s Manufacturing, compared with selected Least Developed Countries (LDCs). There has been an increase in MVA per capita, Manufactured exports per capita, share in World MVA and trade in World manufactures though very infinitesimal for the latter two. A significant decline is evidenced in share of MVA in GDP and Medium and high tech manufactured exports share in total manufactured exports between 2008 and 2013. See Annex 6. This is an indicator of losing importance domestically and competitiveness internationally. Table 2.5: Tanzania – Manufacturing Value Added and Export Performance 2008 and 2013
MVA per capita (2005$)
Manufactured exports per capita (current)($)
Medium and high tech MVA share in total manufacturing (%)
Share of MVA in GDP (%)
Medium and high tech manufactured exports share in total manufactured exports (%)
Manufactured exports share in total exports (%)
Share in World MVA (%)
Share in world manufactures trade (%)
2008 2013 2008 2013 2008 2013 2008 2013 2008 2013 2008 2013 2008 2013
2008 2013
34.4 43.0 31.3 33.0 11.2 8.6 8 9 22.9 22.4 42.5 36.8 0.00 0.02
0.00 0.01
Source: abridged from UNIDO 2015 Annex B2, p.227
11
Table 2.6: Tanzania – Manufacturing Value Added and Export Performance Compared with Selected LDCs, 2013
MVA per capita 2013(2005 $)
Manufacturing exports per capita 2013 (current)
Impact on World MVA 2013 (%)
Impact on World Manufactures trade, 2013 (%)
Tanzania 43.04 32.95 0.02 0.01Bangladesh 118.28 152.13 0.21 0.19Senegal 98.86 117.20 0.02 0.01Zambia 76.93 182.34 0.01 0.02Mozambique 50.95 44.62 0.02 0.01Madagascar 37.22 42.51 0.01 0.01Uganda 27.28 17.28 0.01 0.01Malawi 22.59 22.21 0.00 0.00Rwanda 22.03 26.96 0.00 0.00Ethiopia 13.33 6.81 0.01 0.01Gambia 22.53 0.64 0.00 0.00Source: abridged from UNIDO 2015 Table 8.5 p.209Regional performance
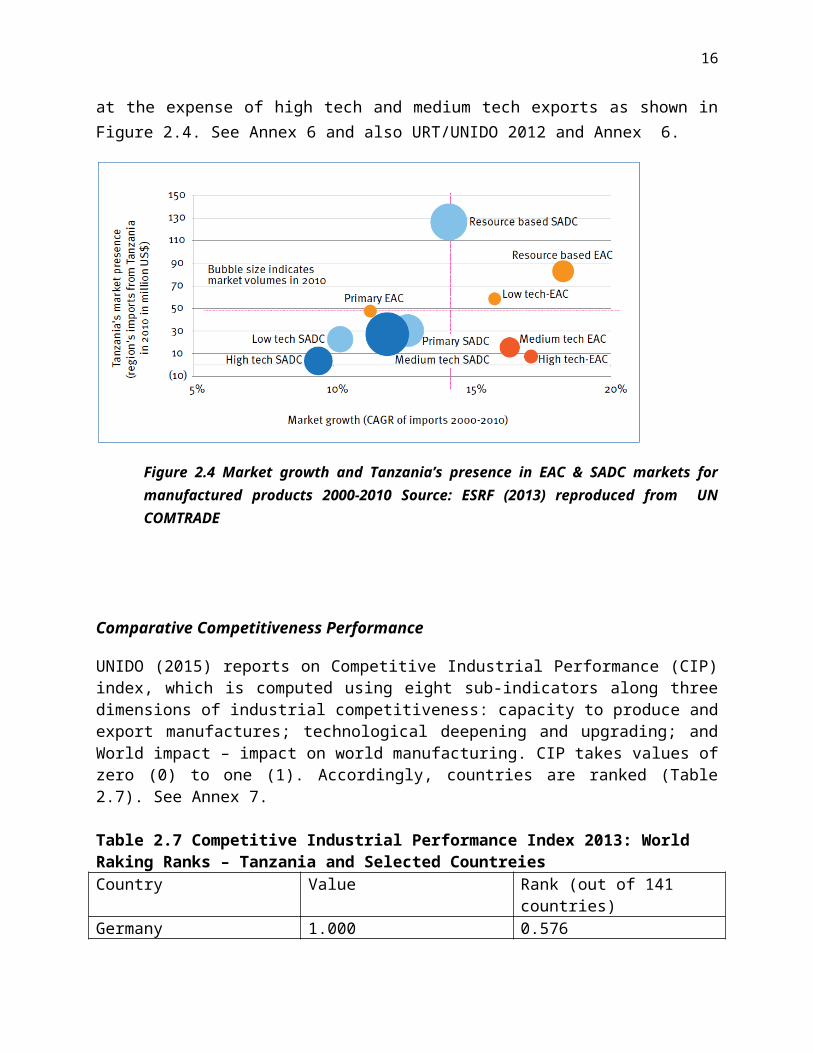
Tanzania is an active player in East African Community (EAC) and Southern Africa Development Community (SADC) trade with marked improvement in recent years. In terms of growth of manufactured exports, resource-based exports dominate in both regional markets at the expense of high tech and medium tech exports as shown in Figure 2.4. See Annex 6 and also URT/UNIDO 2012 and Annex 6.
Figure 2.4 Market growth and Tanzania’s presence in EAC & SADC markets for manufactured products 2000-2010 Source: ESRF (2013) reproduced from UN COMTRADE
12
Comparative Competitiveness Performance
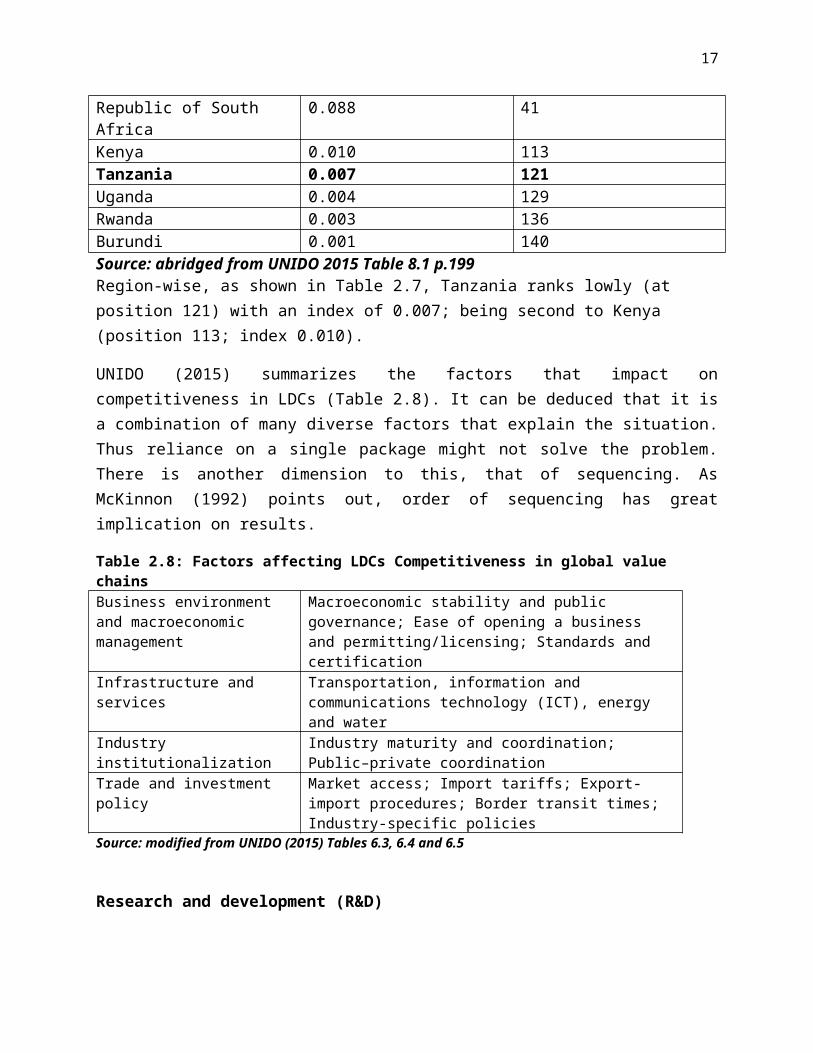
UNIDO (2015) reports on Competitive Industrial Performance (CIP) index, which is computed using eight sub-indicators along three dimensions of industrial competitiveness: capacity to produce and export manufactures; technological deepening and upgrading; and World impact – impact on world manufacturing. CIP takes values of zero (0) to one (1). Accordingly, countries are ranked (Table 2.7). See Annex 7.
Table 2.7 Competitive Industrial Performance Index 2013: World Raking Ranks – Tanzania and Selected CountreiesCountry Value Rank (out of 141 countries)Germany 1.000 0.576Republic of South Africa 0.088 41Kenya 0.010 113Tanzania 0.007 121Uganda 0.004 129Rwanda 0.003 136Burundi 0.001 140Source: abridged from UNIDO 2015 Table 8.1 p.199Region-wise, as shown in Table 2.7, Tanzania ranks lowly (at position 121) with an index of 0.007; being second to Kenya (position 113; index 0.010).
UNIDO (2015) summarizes the factors that impact on competitiveness in LDCs (Table 2.8). It can be deduced that it is a combination of many diverse factors that explain the situation. Thus reliance on a single package might not solve the problem. There is another dimension to this, that of sequencing. As McKinnon (1992) points out, order of sequencing has great implication on results.
Table 2.8: Factors affecting LDCs Competitiveness in global value chainsBusiness environment and macroeconomic management
Macroeconomic stability and public governance; Ease of opening a business and permitting/licensing; Standards and certification
Infrastructure and services Transportation, information and communications technology (ICT), energy and water
Industry institutionalization Industry maturity and coordination; Public–private coordinationTrade and investment policy Market access; Import tariffs; Export-import procedures; Border
transit times; Industry-specific policiesSource: modified from UNIDO (2015) Tables 6.3, 6.4 and 6.5
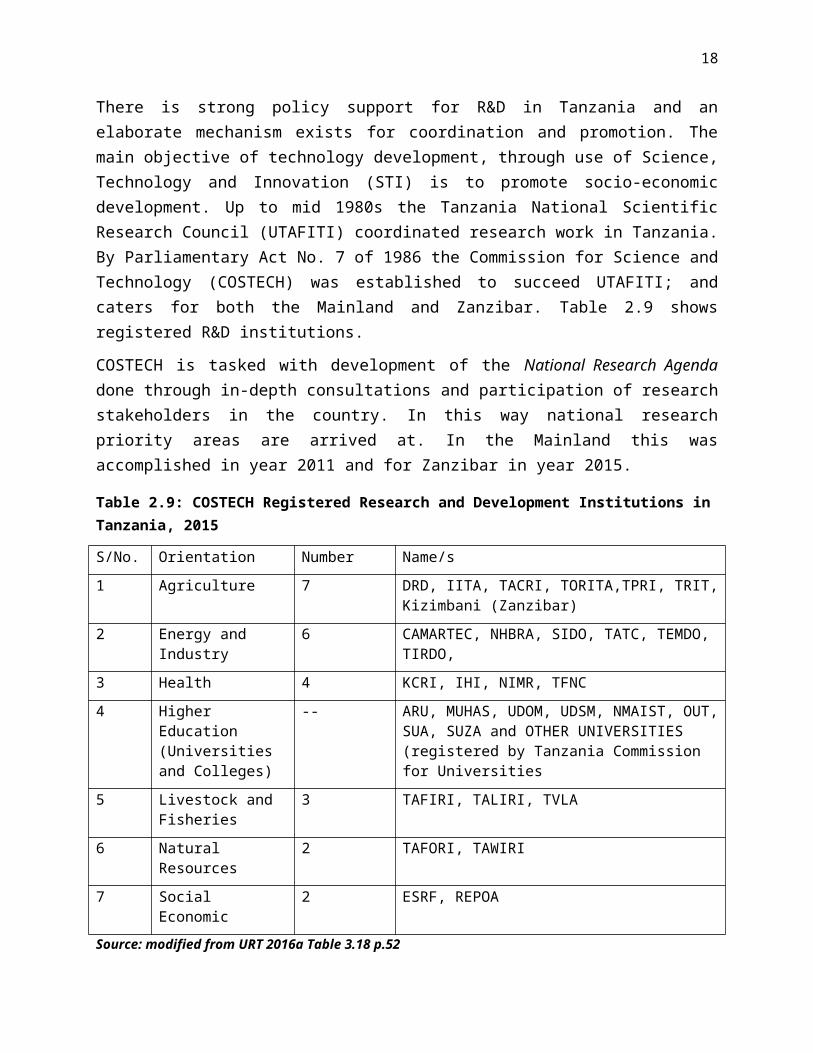
Research and development (R&D)
There is strong policy support for R&D in Tanzania and an elaborate mechanism exists for coordination and promotion. The main objective of technology development, through use of Science, Technology and Innovation (STI) is to promote socio-economic development. Up to mid 1980s the Tanzania National Scientific Research Council (UTAFITI) coordinated research work in Tanzania. By Parliamentary Act No. 7 of 1986 the Commission for Science and
13
Technology (COSTECH) was established to succeed UTAFITI; and caters for both the Mainland and Zanzibar. Table 2.9 shows registered R&D institutions.
COSTECH is tasked with development of the National Research Agenda done through in-depth consultations and participation of research stakeholders in the country. In this way national research priority areas are arrived at. In the Mainland this was accomplished in year 2011 and for Zanzibar in year 2015.
Table 2.9: COSTECH Registered Research and Development Institutions in Tanzania, 2015
S/No. Orientation Number Name/s
1 Agriculture 7 DRD, IITA, TACRI, TORITA,TPRI, TRIT, Kizimbani (Zanzibar)
2 Energy and Industry 6 CAMARTEC, NHBRA, SIDO, TATC, TEMDO, TIRDO,
3 Health 4 KCRI, IHI, NIMR, TFNC
4 Higher Education (Universities and Colleges)
-- ARU, MUHAS, UDOM, UDSM, NMAIST, OUT, SUA, SUZA and OTHER UNIVERSITIES (registered by Tanzania Commission for Universities
5 Livestock and Fisheries 3 TAFIRI, TALIRI, TVLA
6 Natural Resources 2 TAFORI, TAWIRI
7 Social Economic 2 ESRF, REPOA
Source: modified from URT 2016a Table 3.18 p.52
The main challenge for research in Energy and Industry is under-funding of the institutions.
The next Chapter presents brief literature review.
III. Literature review on inter-connectedness of manufacturing performance, transformation and policy
3.0 Overview
This section provides review of theoretical and empirical literature with the objective of informing the methodology section. The section has two sub-sections.
3.1 Literature review - theoretical
14
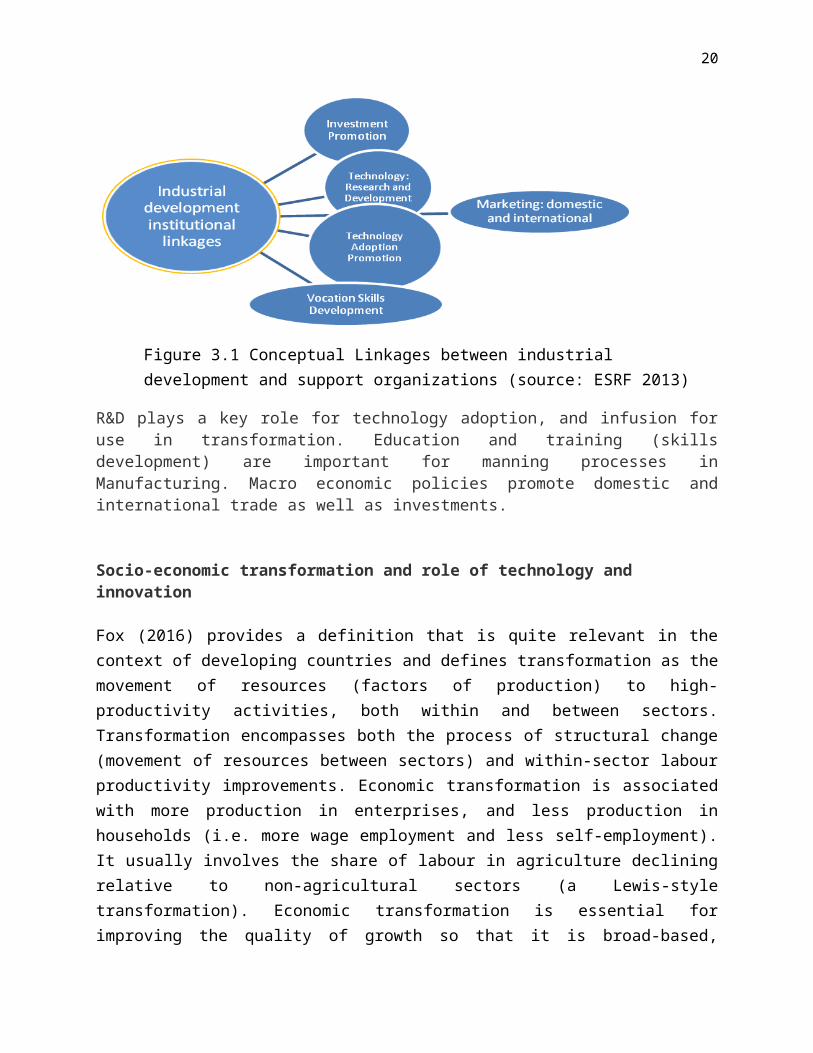
Conceptual framework
Development of Manufacturing (as sub set of industrial development) depends to a great extent on linkages with key actors outside the sector itself. Thus any policy which has a bearing on these other actors will impact Manufacturing performance.
Figure 3.1 Conceptual Linkages between industrial development and support organizations (source: ESRF 2013)
R&D plays a key role for technology adoption, and infusion for use in transformation. Education and training (skills development) are important for manning processes in Manufacturing. Macro economic policies promote domestic and international trade as well as investments.
Socio-economic transformation and role of technology and innovation
Fox (2016) provides a definition that is quite relevant in the context of developing countries and defines transformation as the movement of resources (factors of production) to high-productivity activities, both within and between sectors. Transformation encompasses both the process of structural change (movement of resources between sectors) and within-sector labour productivity improvements. Economic transformation is associated with more production in enterprises, and less production in households (i.e. more wage employment and less self-employment). It usually involves the share of labour in agriculture declining relative to non-agricultural sectors (a Lewis-style transformation). Economic transformation is essential for improving the quality of growth so that it is broad-based, resilient against shocks, and brings about opportunities for further growth. Transformation is an end in itself, and is a means to more inclusive growth.
The predicted single path to transformation is being challenged by evidence. GCI and UNDP (2015) point out that unlike the structural transformation seen in other regions, the shift away from agriculture hasn’t been towards manufacturing and industry, but rather services. This shift
15
is controversial with one camp of experts seeing this newer trend at odds with the successful development models in Asia as well as potentially hurting Africa by skipping over opportunities such as technological innovation, and policy experimentation and learning.
UNCTAD (2012) and UNIDO (2015) emphasizes the importance of technology and innovation as critical drivers of structural transformation— and as enablers of growth that is not only long-lasting but also mindful of environmental boundaries and the imperatives of social inclusion.
Industrial policy instruments (technology policies, innovation policies and competitiveness policies) offer the easiest route to structural transformation. Competitiveness policies are of key importance for absorbing innovation capabilities from global value chains (GVCs) and maximizing the expected spillovers across the whole economy.
Further that, technology and industrial policies for innovation need to be complemented by macroeconomic, business-enabling, trade and investment, as well as infrastructure policies. Public investment in research and development (R&D), research infrastructure and human capital, and incentives for private R&D (direct subsidy payments to innovating firms or to tax relief on R&D expenditure) greatly promote Manufacturing.
UNIDO (ibid) further points out that technology and innovation have a central role in the Sustainable Development Goals (both were underplayed in MDGs). The relevant SDGs are:
Goal 2: Technology development in order to enhance agricultural productive capacity; Goal 4: Increasing support for scholarships available to developing countries for
enrolment in higher education, including technology; Goal 5: Enhancing the use of enabling technology to promote the empowerment of
women Goal 7: Enhancing international cooperation and expanding infrastructure to facilitate
clean energy research and technology; Goal 9: Increasing access to information and communications technology; Goal 14: Increasing scientific knowledge and research capacity and transfer of marine
technology; Goal 17: Enhancing north-south, south-south, triangular regional and international
cooperation on and access to science, technology and innovation (STI) as well as the promotion of environmentally sound technologies to developing countries and a fully operationalizing technology bank and STI capacity-building mechanism. See also Annex 1.
Total amount of R&D subsidies and tax incentives
16
Table 3.1 Technology-Related Policy DimensionsInput indicators MeasurementForeign technology transfer imports of capital goods; Number of licensing
agreements, imports of capital goods and number of joint ventures with foreign firms
Government support R&D expenditureGovernment support to private sector R&D Total amount of R&D subsidies and tax incentivesQuality and quantity of technical, tertiaryEducation
Share of public expenditure on tertiary education, share of engineers in total tertiary government disbursements for training programmes and public support to universities and research centres
Number of domestic research institutes Number of domestic research institutesInnovation human capital Employed personnel with science and technology
qualificationsInnovation infrastructure Support activities for R&D, capital and investment
in technology-based equipmentLabour market Employment in creative sectors as a share of
employmentDiffusion of new technologies Business use of mobile internet, 3G (and higher)
coverage, e-Intensity IndexInternational cooperation Number of international co-authorship of scientific
publications; Number of researchers, workshops and conferences, share of researcher recruitment from abroad, mobility of PhDs; Number of scientific and technical cooperation agreements; Number of international joint programmes, open programmes; Number of provision of incoming fellowships and outgoing fellowships; Number of measures aimed to raise the attraction of domestic universities and research institutes;
Output indicatorsShare of high-tech export of the country+ PercentNumber of new products Number countNumber of new processes introduced Number countNumber of patents Number countShare of innovative firms in the economy PercentNumber of firms entering new and high-tech sectors Number countKey: + = See Annex 12. Source: modified from UNIDO (2016) Tables 6.3, 6.4 and 6.5
Policy on industry
The debate on industrial policy has evolved considerably over the past decades with competition, openness, inclusive growth and policy experimentation being the building blocks of sustainable industrial policies.
Broadberry and Leunig (2013) identify three levels of policy for promoting Manufacturing. These are:
17
1. Macro economic policy: monetary and fiscal policy, Government purchasing regional policy; competition policy; demand management; international trade, and exchange rate regimes.
2. Sector-specific policies: encouragement of mergers to create national champions; nationalisation and privatisation; investment subsidies; selective employment tax; public sector purchasing; and the encouragement of foreign direct investment (FDI).
3. Manufacturing-relevant non-sector-specific microeconomic policies: education and training; science and technology policy; regional policy and agglomeration economies; competition policy, etc.
Page and Tarp (2016) assert that a key role for industrial policy in developing economies (trapped in low productivity, low wage employment) is to speed up the process of structural transformation, the movement of labour from lower to higher productivity sectors. A more balanced strategy to accelerate structural transformation and growth, is one that includes active co-ordination with the private sector. The relationship between the state and business has been a critical element of success or failure in accelerating structural transformation.
ODI (2016) points out that industrial policy can be important in theory. Industrial policy can help to address market and co-ordination failures prevalent in areas such as skills development, technological development and knowledge externalities. Some policies, for example political stability, cutting red tape, or sound macroeconomic policy lend themselves to an economy-wide implementation. Others, such as human capital development, or granting tax exemptions, can be applied more narrowly to specific sectors, or even specific firms. ‘Closed’ deals can be a good means of stimulating investment and growth in the short term.
However, it is pointed out that such deals are harmful in the long run as privileged firms often attempt to pull the ladder up behind them, preventing other firms from acquiring the same advantages. This shields such privileged firms from competition, and actually reduces their incentive to innovate and invest. The economy becomes overly dependent on a few firms or sectors, and thus vulnerable to economic shocks. There is some evidence that countries which base their industrial policy on granting favours to a few well-connected firms tend to experience an erratic, boom and bust pattern of growth. Most of the gains from periods of expansion are subsequently wiped out in periods of contraction, meaning that per capita incomes remain low. A call is made for a shift from closed to open deals, or from relationship-based to rules-based governance.
Rodrik (2004) as cited in ODI (2016) proposes design principles for effective industrial policy: Incentives should be provided only to ‘new’ activities; There should be clear benchmarks/criteria for success and failure; There must be a built-in sunset clause; Public support must target activities, not sectors; Activities that are subsidised must have the clear potential of providing spill-overs and
demonstration effects;
18
The authority for carrying out industrial policies must be vested in agencies with demonstrated competence;
Implementing agencies must be monitored closely by a principal with a clear stake in the outcomes and who has political authority at the highest level;
The agencies carrying out promotion must maintain channels of communication with the private sector;
Promotion activities need to have the capacity to renew themselves so that the cycle of discovery becomes an on-going one.
3.2 Literature review - empirical
Empirical work in this area is extensive and as such only a few are cited to assist in designing methodology for the theme of this paper.
Combined policiesBroadberry and Leunig (2013) analysed the effect of policies explicitly designed to support manufacturing in the UK from 1945. Government was more interventionist until the 1970s with nationalisation, industrial subsidies and regional policy common and often important.
Macroeconomic policies, privatisation, and joining the European Economic Community (EEC) all affected manufacturing. Output and productivity growth was reasonable between 1951-73, poor between 1973-79 and recovered 1979-99. Productivity performance improved further after 1999.
From 1979 there was a retreat from such sector-specific policies and a growing acceptance that manufacturing should “sink or swim” along with other sectors. Since the financial crisis of 2008, the economy needed to be rebalanced away from financial services towards manufacturing. New Industry, New Jobs was the agenda,
There was little evidence that privatisation had any direct effects on the success of manufacturing "an almost unmitigated failure". It was not successful in either supporting output or employment.
Further, British regional policy has had inconsistent effects on manufacturing. Competition policy has become much more effective since the mid-1990s, with correspondingly favourable effects on manufacturing productivity.
Foreign direct investment by overseas manufacturing companies directly raised the level of manufacturing in Britain. They generally have high rates of productivity, but spillover effects to indigenous British manufacturing appeared to be relatively low. Foreign direct investment should be welcomed, but should not be thought of as a panacea.
A successful education system at all levels is good for all firms in the economy. The emphasis on science and technology is, however, likely to favour manufacturing. The two most successful policy innovations in the post-war era have been Britain's greater willingness to engage in international trade, particularly in Europe, and greater use of competition policy. Both of these
19
policies increase the pressures on management to perform effectively, and thus better equip them to be successful in the medium term. The authors summarize their findings as follows:
Macroeconomic policies
no obvious connection between macroeconomic stability and manufacturing success; One important aspect of macroeconomic policy in an open economy is the choice of
exchange rate regime, which disproportionately affects manufacturing, given its emphasis on exports and imports.
Sector-specific policiesSuccess was recorded in:
Public sector purchasing; Encouragement of foreign direct investment attracting some manufacturing jobs, increase
in labour productivity.
Non-sector-specific microeconomic policiesSuccess was recorded in:
Science and technology policy - the support of a world-class scientific research community, which has been helpful in sustaining Britain’s revealed comparative advantage in pharmaceuticals and other science-based industries;
Formal schooling science -favour manufacturing (however, the authors caution that in education and training, there have been persistent worries about the poor treatment of vocational training. This can be seen as resulting in an under-investment in just the kind of intermediate level skills which are highly valued in manufacturing, and which are likely to be under-supplied by the market).
Product market competition strengthening through joining integration schemes and competition policy to support productivity growth in future.
Macroeconomic policy aloneEze and Festo (2013) examined the impact of fiscal policy on the manufacturing sector output in Nigeria using a long-run relationship between fiscal policy and manufacturing sector output.
Results of the study indicate that government expenditure significantly influences manufacturing sector output. The error correction model (ECM) was re-specified as:
MOP = F(GEXP, GTR). Where MOP = manufacturing sector output, GEXP = government expenditureGTR = government tax revenue
20
The authors found that government tax revenue (GTR) had significant negative impact on manufacturing sector output. Government expenditure had significant and positive impact on manufacturing sector output. One (1) period lag of MOP had significant positive impact on manufacturing sector.
There was no structural change analysis given the length of the time period covered. This is a major limitation of the study.
Imoughele and Ismaila, (2014) investigated the effectiveness of monetary policy on Nigeria’s manufacturing sector output using time series. Ordinary Least Square (OLS) regression technique was used with the model specified as: LMGDP = β0 + β1LEXRE + β2LINT + β3LMS2 + β4LEXR + β5LINF + Ut
Where: MGDP= manufacturing gross domestic product, EXRE= external reserves, INT = interest rate, MS2= Broad money supply, EXR= exchange rate, INF = inflation rate and Ut= error term.
Hypothesized relationship:β1, β3>0; β2, β4,β5<0
The main findings were that, external reserve, exchange rate and inflation rate were statistically significant to manufacturing sector output while broad money supply and interest rate were not statistically significant to manufacturing sector output in the previous and current year.
Interest rate, exchange rate and external reserve impacted negatively on the sector output but broad money supply and inflation rate affect the sector positively. This corroborates findings by, among others, Mbelle (2001), Broadberry and Leunig (2013) that macroeconomic policy has ambiguous influence on Manufacturing.
In view of the findings, the study recommended among others that monetary authority should create and implement monetary policies that favoured efficient provider of favourable investment climate by facilitating market-based interest rate and exchange rate regimes that attract both domestic and foreign investment to Manufacturing. The Central Bank of Nigeria should introduce more monetary instruments that are flexible enough to meet the supply and demand needs of the manufacturing sector.
Perhaps a criticism that can be made is that of missing structural breaks in a study which uses long run data.
21
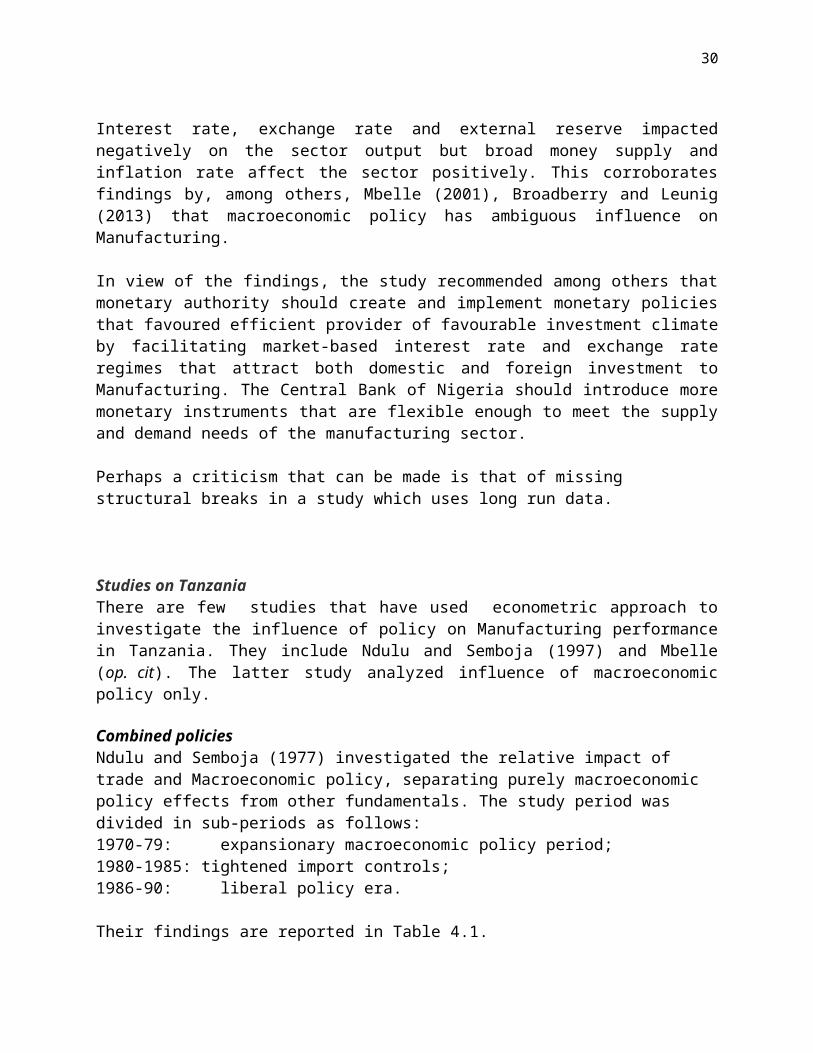
Studies on TanzaniaThere are few studies that have used econometric approach to investigate the influence of policy on Manufacturing performance in Tanzania. They include Ndulu and Semboja (1997) and Mbelle (op. cit). The latter study analyzed influence of macroeconomic policy only. Combined policiesNdulu and Semboja (1977) investigated the relative impact of trade and Macroeconomic policy, separating purely macroeconomic policy effects from other fundamentals. The study period was divided in sub-periods as follows:1970-79: expansionary macroeconomic policy period;1980-1985: tightened import controls;1986-90: liberal policy era.
Their findings are reported in Table 4.1.
Table 4.1: Relative Impact of Trade and Macroeconomic policy in Tanzania: 1970-1990Pure macro policy effect Pure trade policy effects Mixed trade and
macroeconomic effectsImpact coefficient -0.132* -0.09 -0.102*Policy shift1970-79 0.24 -0.04 0.201980-85 0.08 -0.01 0.521986-90 -0.36 -0.08 -0.25Impact on exports1970-79 -032 0.004 -0.0201980-85 -0.010 0.001 -0.0531986-90 0.05 0.007 0.026
*Statistically significant impact coefficient. Source: Ndulu and Semboja 1994, Table 6.9 p.196
The authors concluded that incentives were the single most important determinant of supply response for non-traditional exports (including Manufacturing); with supply response in range of 0.62 and 1.2. However, complimentarity of non-macroeconomic policy instruments brought better results.
Macroeconomic policy aloneMbelle (2001) used time series data for the period 1964 - 1996 to investigate the impact of macroeconomic policies on Manufacturing performance. Two equations were estimated on manufacturing exports (as function of manufacturing output, Real Exchange Rate Misalignment and Terms of Trade) and manufacturing investments (as function of real lending rate, change in money supply and effectiveness of banking facilities).
With respect to exports, output, foreign exchange and policy dummy were statistically significant and correctly signed.In the investment equation none of the variables showed statistical significance, though correctly signed.
22
In light of the findings (impact of liberalization being ambiguous), the author recommended for implementation of complementary sector-specific policy measures).
In the next section we suggest methodology for the investigation.
IV. METHODOLOGY FOR ASSESSING IMPACT OF POLICY ON MANUFACTURING PERFORMANCE
Overview
The methodology that is employed here builds on Broadberry and Leunig (2013) of distinguishing the three policy types, namely Macroeconomic policies, Sector-specific policies and Non-sector-specific microeconomic policies. This also considers methodology applied by Ndulu and Semboja (1977).
Data and data sources
The analysis used time series data for the period 1961 to 2015. The data were sourced from various official publications as well as other sources such as Rweyemamu (1973).
Variables (see also Annexes 10 and 11)
Manufacturing output – a measure of absolute performance and export base expressed in Tanzanian Shillings (nominal and real);
Manufacturing growth – a measure of relative performance over the years, expressed in percent (nominal and real);
Manufacturing share in Gross Domestic Product – a measure of relative importance in the economy expressed in percent;
Manufacturing Value Added – a measure of “profitability”, expressed in Tanzanian shillings (nominal and real);
Manufacturing exports – a measure of competitiveness, expressed in value terms both in Tanzanian Shillings and USD;
Manufacturing investment – proportion in total investments;
FDI inflows – a measure of business environment, expressed in value terms, both Tanzanian shillings and USD;
Exchange rate nominal – a measure of competitiveness expressed as units of Tanzanian shillings per one unit USD. This is a supply response variable;
23
Exchange rate, real - a measure of competitiveness expressed as units of Tanzanian shillings per one unit USD in real terms;
Parallel/nominal exchange rate ratio – a measure of misalignment of exchange rate;
Enrollment – expressed in numbers. Secondary education enrolment was chosen for lack of time series data on STEM enrolment at tertiary level. This choice is justified by Bradberry and Leunig (2013) that a successful education system at all levels is good for all firms in the economy. This treatment is widely applied mainly defended on grounds that it is the pool from which higher specializations source;
Dummy 1 – captures episode of macroeconomic policy with values zero before 1986 and one, after. Exchange rate was chosen;
Dummy 2 - Sector-specific policies – FDI was chosen with policy cut off point of establishment of Tanzania Investment Center in 1997 with period after that assigned value of one (1) and zero (0) otherwise;
Dummy 3 - Non-sector-specific microeconomic policies: education and training was chosen. The determining policy is the Education and Training Policy of 1995. The period after 1995 was assigned value of one (1) and zero (0)otherwise.
Specification of equations
Three equations were specified as follows:
1. Manufacturing output = f( FDI, enrollment, D2, D3)…………………………..(1)2. Manufacturing Value Added = f(FDI, Enrollment, D2, D3)……………………(2)3. Manufacturing exports = f(FDI, Exchange Rate, Enrollment, D1, D2, D3)…….(3)
These were respectively specified as:
LMO = β0 + β1LFDI + β2LENROL+ D2, + D3 + et ……………………………………………………(4)
LMVA = β0 + β1LFDI + β2LENROL + D2, + D3 + et……………………………………………..….(5)
LMEX = β0 + β1LFDI + β2LEXCHANGE + β3LENROL + D1, D2, D3 + et…………..….(6)
Data characteristics
Annex 5 presents normality test and Annex 6 presents Unit Root test since our analysis uses (long) time series data.
Results of estimations for equations 4 to 6 are presented in next Chapter.
24
V. Empirical results and discussion
Long run relationships
Equation 4. Table 5.1: Empirical Results: Determinants of Manufacturing output in Tanzania, 1961-2015
D.log(mfg_output)Variable Coef. Std. Err. t ProbD.log(FDI) 0.872 0.166 5.254 0.000D.log(enrolment) 0.578 0.467 1.240 0.223d2 1.222 0.523 2.335 0.042d3 0.579 1.186 0.488 0.628_cons 1.581 43.842 0.036 0.971
R-SQUARED = 0.54
Interpretation of results
1. FDI has positive and significant impact on manufacturing output at 1% level. Meaning that as FDI increases, the value of manufacturing output increases;
2. Dummy 2 has positive and significant impact on the value of manufacturing output at 5% level;
3. R-squared indicates that 54 percent of the variations in the value of manufacturing output are explained by changes in FDI, enrolment and dummies.
Equation 5. Table 5.2: Empirical Results: Determinants of Manufacturing Value Added in Tanzania, 1961-2015
D. log(Manufacturing VA)Variable Coef. Std. Err. t ProbD.log(FDI) 0.624 0.194 3.211 0.004D. log(enrolment) 0.446 0.228 1.951 0.045d2 2.388 18.369 0.130 0.897d3 1.234 0.286 4.311 0.000_cons -3.448 68.960 -0.050 0.964
R-SQUARED = 0.65
Interpretation of results1. FDI has positive and significant impact on the value addition in manufacturing at 1%
level meaning that as FDI increases, value addition in manufacturing increases too;
2. Dummy 3 has positive and significant impact on the value added in manufacturing at 1% level;
25
3. R-squared indicates that 65 percent variations in the value addition in manufacturing are explained by changes in FDI, enrolment and dummies.
Equation 6. Table 5.3: Empirical Results – Determinants of Manufacturing Exports in Tanzania, 1961-2015
D. log(Manufacturing exports)Variable Coef. Std. Err. t probD.log(FDI) 0.294 1.860 6.329 0.000D.log(Exchange Rate) 0.397 0.174 2.280 0.033D.log(enrolment) 0.020 0.044 0.440 0.662d1 0.525 0.988 0.530 0.601d2 -0.500 0.133 -3.750 0.001d3 0.614 0.193 3.190 0.004_cons 14.029 331.045 0.040 0.967
R-SQUARED = 0.87
Interpretation of results1. FDI has positive and significant impact on the value of manufacturing exports at 1%
level. Meaning that as FDI increases, the value of manufacturing exports increases;
2. Exchange rate has positive and significant impact on the value of manufacturing exports at 5% level;
3. Dummy 2 has negative and significant impact on manufacturing output at 1% level;
4. Dummy 3 has positive and significant impact on manufacturing output at 1% level;
5. R-squared indicates that 87 percent of the variations in the value of manufacturing exports are explained by changes in FDI, exchange rates, enrolment and dummies.
Discussion of results
Results of the estimations largely met the expectations.
Our findings confirm earlier findings such as Ndulu and Semboja (1977); Mbelle 92001); Broadberry and Leunig (2013), Eze and Ogiji (2013) Imoughele and Ismaila (2014).
However, the timing of the policy interventions was far apart (1986, 1995 and 1997), thus denying the country of the benefits of combined interventions. That notwithstanding, the important thing is to sustain implementation of the policies. The impact of policy would have
26
been more profound with better timing and sequencing (training, then export promotion then liberalization of foreign exchange).
VI. Concluding remarks
Tanzania is determined to achieve transformation through industrialization with Manufacturing playing key role (see for example URT 2016a and b). As technological developments proceed at hyper speed, the country needs to critically consider “diffusion oriented” R&D. This implies investing in R&D institutions and supporting private sector R&D.
A sound policy mix of innovation and competitiveness policies is crucial. Technology and innovation that drive productivity and economic growth are thus critical. Extending the quality and scope of education to raise the supply of skills is a recommended policy response. As the fourth industrial revolution is imminent, more education, more flexibility and more technological savvies are required. Emphasis on STEM orientation is thus an imperative.
Attention is also drawn on the need to maximizing on synergy of the three sets of policies (macro economic policy – exchange rate, sector specific policies – business environment for attracting FDIs, and manufacturing relevant non sector specific microeconomic policy (education and training, skills development). Timing and proper sequencing are needed as well as sustaining policy implementation.
27
Selected references
African Union Commission (AUC), (2014). The Africa We Want, Addis Ababa
Broadberry, S and T. Leunig, (2013). “The impact of Government policies on UK manufacturing since 1945”, Evidence Paper 2, Foresight, Government Office for Science
Dinh H. T. and C. Monga, (2013). Light Manufacturing in Tanzania: A Reform Agenda for Job Creation and Prosperity. World Bank Publications.
Economic and Social Research Foundation (ESRF), (2013). “Evaluation of the Institutional Framework to Facilitate Tanzania’s industrialization Process” Report to President’s Office, Planning Commission
East African Community (2012). Industrialization Strategy 2012-2032 – Structural Transformation of the Manufacturing Sector through High Value Addition and Product Diversification based on Comparative and Competitive Advantages of the Region, Arusha
Eze, O R and F.O Ogiji, (2013). “Impact of Fiscal Policy on the Manufacturing Sector Output in Nigeria: an Error Correction Analysis International Journal of Business and Management Review (IJBMR) Vol.1, No.3, pp. 35-55, September 2013
Foresight Africa, (2016). “Top Priorities for the Continent in 2016”, Africa Growth Initiative
Fox, L, (2016). “Gender, Economic Transformation and Women’s Empowerment in Tanzania” Draft Paper, March
Government of Cote d’Ivorie(GCI) and UNDP, (2015). “Proceedings of International Conference on the Emergence of Africa”, Abidjan, 18-20 March
Imoughele, L. E and M. Ismaila, (2014). “Empirical Investigation of the Impact of Monetary Policy on Manufacturing Sector Performance in Nigeria (1986 – 2012) International Journal of Education and Research Vol. 2 No. 1 January 2014
Krugman, P.R, (1991). Trade Policy and Market Structure, The MIT Press, Cambridge, Massachuttes London, England
Lall, S. (2001). Competitiveness, Technology and Skills. Cheltenham: Edward Elgar Publishing Ltd
Leistritz, F.L, (1996). Economic Impact of Manufacturing Impact Assessment, Volume 14, September 1996
Mbelle, A.V.Y, (2001). “Macroeconomic Policy and Performance of the Manufacturing Sector in Tanzania: Has Liberalization Helped? An Econometric Approach” in Szirmai and Lappere, (2001) The Industrial Experience of Tanzania, Palgrave
McKinnon, R.I, (1992). The Order of Economic Liberalization, Financial Control in the Transition to a Market Economy, The Johns Hopkins Studies in Development, United States of America
Mizuno, Y and E. P. Mhede, (2012). “Industrialization for Socio-economic Transformation in Tanzania” Paper presented at 17th Annual Research Workshop, Dar es Salaam, March 28-29
28
Ndulu, B,J and J.J Semboja (1997). “The Development of Manufacturing for Export in Tanzania: Experience, Policy and Prospects” ” in Helleiner, G.K (ed) Manufacturing for Export in the Developing World: Problems and Possibilities Routledge
Ndulu. B., Semboja, J and Mbelle A,V.Y. (2002). Promoting Non-Traditional exports in Tanzania, in Helleiner, G.K (ed) Non-Traditional Export Promotion in Africa, Palgrave
Overseas Development Institute (ODI), (2016). Supporting Economic Transformation: “Supporting Preparation of Tanzania’s Second Five Year Development Plan (FYDP II), 2016/17-2020/21” Final Draft; February
Page, J (2015). “Industry in Tanzania Performance, Prospects and Public Policy” The Brookings Institution, June 2015
Page, J and F. Tarp (2016). The practice of industrial policy: Government–business co-ordination in Africa and East Asia (forthcoming)
Rweyemamu, J.F, (1973). Underdevelopment and Industrialization in Tanzania Oxford University Press
Rwegasira, D; A.V.Y. Mbelle and J. Aikaeli (eds.) (2016). The Economy of Mainland Tanzania Into the 2000s: Productivity, Human Capital, and Other Leading Issues, Dar es Salaam University Press
Schwab, K, (2016). “Notes for World Economic Forum”, Foreign Affairs
Skarstein, R and S.M. Wangwe, (1986). Industrial Development in Tanzania: Some Critical Issues” Scandinavian Institute of African Studies, Uppsala
Szirmai, A and P. Lappere, (2001). The Industrial Experience of Tanzania, Palgrave
Szirmai, A., W. Naudé, and L. Alcorta (2013). Pathways to Industrialization in the 21stCentury. Oxford: Oxford University Press
United Nations (UN), (2015). “Transforming our World: The 2030 Agenda for Sustainable Development Final Text for adoption” (dated 1 August 2015)
United Nations Economic Commission for Africa (UNECA) (2015). Economic Report on Africa: Industrializing Through Trade, Addis Ababa
United Nations Economic Commission for Africa and African Union, (2013). Making the Most of Africa’s Commodities: Industrializing for Growth, Jobs and Economic Transformation, Addis Ababa
United Nations Department of Economic and Social Affairs (UNDESA) and United Nations Development Programme, UNDP (2012). Synthesis of National Reports for Rio+20, New York
United Nations Development Programme (UNDP).2015. Human Development Report 2015: Work for Human Development, New York
29
United Nations Economic and Social Council (2016). “Report of the Inter-Agency and Expert Group on Sustainable Development Goal Indicators”, February, 19.
United Nations Conference on Trade and Development (UNCTAD) (2012). Technology and Innovation Report 2012, Technology, Innovation and South-South Cooperation
UNCTAD (2015a). Technology and Innovation Report 2015 Fostering Innovation Policies for Industrialization, United Nations, New York
UNCTAD (2015b). The Least Developed Countries Report 2015 Transforming Rural Economies United Nations, New YorkUnited Nations Development Programme (UNDP) (2015). Human Development Report 2015: Work for Human Development, New York
United Nations Industrial Development Organization, UNIDO, (2013). Industrial Development Report 2013 Sustaining Employment Growth: The Role of Manufacturing and Structural Change, Geneva
UNIDO (2014). Inclusive and Sustainable Industrial Development (ISID): Creating shared prosperity/safeguarding the environment, Vienna
United Nations Industrial Development Organization, UNIDO (2015). Industrial Development Report 2016. The Role of Technology and Innovation in Inclusive and Sustainable Industrial Development. Vienna.
UNIDO/UNCTAD (2011), Economic Development in Africa Report 2011 Fostering Industrial Development in Africa in the New Global environment, Special Issue, United Nations, Geneva and New York
United Nations Conference on Trade and Development , UNCTAD, (2015). The Least Developed Countries Report 2015 – Transforming Rural Economies, Geneva
United Republic of Tanzania, URT, (1996). Sustainable Industrial Development Policy (SIDP) 1996-2020), Ministry of Industry and Trade, Dar es Salaam
URT, (1999a). The Tanzania Development Vision 2025 President’s Office, Planning Commission
URT, (1999b). Composite Development Goal for the Tanzania Development Vision 2025, President’s Office, Planning Commission
URT, (2010). Integrated Industrial Development Strategy (IIDS), Ministry of Industry and Trade ,
30
URT (2014). ‘Formal Sector Employment and Earnings Analytical Report 2014’ National Bureau of Statistics, 2014.
URT (2015). Labour Force Survey 2014, National Bureau of Statistics
URT, (2016a). Comprehensive Review Report for Tanzania Five Year development Plan 2011/2012 – 2015/2016, Ministry of Finance and Planning, January; Dar es Salaam
URT, (2016b). “End of MKUKUTA II Assessment Report – Taking Stock and Forging the National Future”, Ministry of Finance and Planning, January; Dar es Salaam
URT, (2016c). “Framework for Five Year Development Plan 2016/17 – 2020/21)”, Ministry of Finance and Planning, January; Dar es Salaam
URT. (2016)d. “Muhtasari wa matokeo ya awali ya takwimu za pato la taifa kwa mwaka 2015” (Summary of provisional statistics of Gross Domestic Product for 2015), National Bureau of Statistics, Ministry of Finance and Planning, March
URT/UNIDO (2012). ‘Tanzania Industrial Competitiveness Report 2012’ Dar es Salaam
URT, UNDP, UNIDO (2001). Tanzania Sustainable Industrial Development and Competitiveness– Analysing Competitiveness; Strategies, Policies and Action Plan to Accelerate IndustrialDevelopment. Dar es Salaam: Government Printer
Xiaoyun. L (2014). “China’s Industrialization: Overview – implications for Africa’s industrialization” Africa-China Poverty Reduction and Development Conference, Addis Ababa, 18-20 November
31
Annexes
Annex 1: Industrialization-related SDGsGoal 9. Build resilient infrastructure, promote inclusive and sustainable industrialization and foster innovation
Targets9.2 Promote inclusive and sustainable industrialization and, by 2030, significantly raise industry’s share of employment and gross domestic product, in line with national circumstances, and double its share in least developed countries
Indicators9.2.1 Manufacturing value added as a percentage of GDP and per capita 9.2.2 Manufacturing employment as a percentage of total employment Target9.3 Increase the access of small-scale industrial and other enterprises, in particular in developing countries, to financial services, including affordable credit, and their integration into value chains and markets
Indicators9.3.1 Percentage share of small-scale industries in total industry value added 9.3.2 Percentage of small-scale industries with a loan or line of credit
Target9.5 Enhance scientific research, upgrade the technological capabilities of industrial sectors in all countries, in particular developing countries, including, by 2030, encouraging innovation and substantially increasing the number of research and development workers per 1 million people and public and private research and development spending
Indicators 9.5.1 Research and development expenditure as a percentage of GDP 9.5.2 Researchers (in full-time equivalent) per million inhabitants
Target9.b Support domestic technology development, research and innovation in developing countries, including by ensuring a conducive policy environment for, inter alia, industrial diversification and value addition to commodities
Indicator9.b.1 Percentage of medium and high-tech industry value added in total value added
32
Annex 2 Elements of Inclusive and Sustainable Industrial Development (ISID)
Key ISID messages (adopted at Lima Declaration of 2013) – building productive capacity in LDCs as priority
- ISID to harness the full potential of industry’s contribution to the achievement of sustainable development, and lasting prosperity for all
- Industrialization is an effective poverty reduction strategy : VA, decent employment opportunities, promotion of innovation through industrial value chains, higher income industrial jobs, promoting cleaner and resource efficient pathways to production, decoupling of economic growth from environmental degradation, energy efficiency,
- Institutions capable of designing, implementing and monitoring industrial development policies that promote and encourage private sector development,
- Partnering for prosperity (multi-stakeholder partneships
Annex 3: Phases in industrial revolution
33
Annex 4 International Standard Industrial Classification - CodesISIC Code rev 3 ISIC Description15 Food and beverages16 Tobacco products17 Textiles18 and 19 Wearing apparel, fur and leather, leather products and footwear20 Wood products (excluding furniture)21 Paper and paper products22 Printing and publishing23 Coke, refined petroleum products, nuclear fuel24 Chemicals and chemical products25 Rubber and plastic products26 Non-metallic mineral products27 Basic metals28 Fabricated metal products29 and 30 Machinery and equipment n.e.c. and office,
accounting, computing machinery31 and 32 Electrical machinery and apparatus and radio,
television and communication equipment33 Medical, precision and optical instruments34 and 35 Motor vehicles, trailers, semi-trailers and other
transport equipment36 Furniture; manufacturing n.e.c.
Annex 5: International Standard Industrial Classification - SectorsInternational Standard Industrial Classification rev. 3 code
Sector name
C Mining and quarryingD ManufacturingE Electricity, gas and waterF ConstructionI Transport, storage and communicationJtK-70 Finance, insurance, and business servicesCtF+I+JtK-70 Modern market activitiesAtB Agriculture, hunting, forestry and fishingGtH Wholesale and retail trade and restaurants and hotels70 Real estateLtQ Community, social and personal servicesAtB, GtH, 70, LtQ Non-modern activities
Annex 6: Technological classification of exports, Standard International Trade ClassificationTechnological classification of exports, Standard International Trade Classification rev 3Type of export SITC SectionsResource-based exports 016, 017, 023, 024, 035, 037, 046, 047, 048, 056, 058, 059, 061, 062, 073, 098, 111,
112, 122, 232, 247, 248, 251, 264, 265, 281, 282, 283, 284, 285, 286, 287, 288, 289, 322, 334, 335, 342, 344, 345, 411, 421, 422, 431, 511, 514, 515, 516, 522, 523, 524, 531, 532, 551, 592, 621, 625, 629, 633, 634, 635, 641, 661, 662, 663, 664, 667,689
Low-tech exports 611, 612, 613, 642, 651, 652, 654, 655, 656, 657, 658, 659, 665, 666, 673, 674, 675, 676, 677, 679, 691, 692, 693, 694, 695, 696, 697, 699, 821, 831, 841, 842, 843, 844, 845, 846, 848, 851, 893, 894, 895, 897, 898, 899
Medium-tech exports 266, 267, 512, 513, 533, 553, 554, 562, 571, 572, 573, 574, 575, 579, 581, 582, 583, 591, 593, 597, 598, 653, 671, 672, 678, 711, 712,713 ,714, 721, 722, 723, 724, 725, 726, 727, 728, 731, 733, 735, 737, 741, 742, 743, 744, 745, 746, 747, 748, 749, 761, 762, 763, 772, 773, 775, 778, 781, 782, 783, 784, 785, 786, 791, 793, 811, 812, 813, 872, 873, 882, 884, 885
High-tech exports 525, 541, 542, 716, 718, 751, 752, 759, 764, 771, 774, 776, 792, 871, 874, 881, 891
34
Annex 7: Competitive Industrial Performance (CIP) index
CIP index consists of eight sub-indicators along three dimensions of industrial competitiveness: 1. Capacity to produce and export manufactures; 2.Technological deepening and upgrading; 3. World impact – impact on world manufacturing
The CIP index is a performance (or “outcome”) indicator rather than a potential (or “process”) indicator. It consists of output sub-indicators only
The first dimension describes a country’s capacity to produce and export manufactures and iscaptured by its MVA per capita (MVApc) and its manufactured exports per capita (MXpc).
The second dimension covers a country’s levels of technological deepening and upgrading. The degree of industrialization intensity is computed as a linear aggregation of medium- and high-tech MVA share in total MVA (MHVAsh) and MVA share in total gross domestic product (GDP) (MVAsh). Country export quality is obtained as a linear aggregation of medium- and high-tech manufactured export share in total manufactured exports (MHXsh) and manufactured export share in total exports (MXsh).
The third dimension of competitiveness is the country impact on world manufacturing, bothin terms of value-added share in world MVA (ImWMVA) and in world manufacturing trade(ImWMT).
35
Annex 8: Data characteristics: Normality Test
The results of the preliminary tests of descriptive characteristics of data are summarised in Table 1. All
the series follow a normal distribution, with the exception of manufacturing employment.
Summary Descriptive Statistics of the Data
Log(Enrolment)Log(Exchange
Rate)Log(FDI)
Log(Mfg Employment)
Log(Mfg Exports)
Log(Mfg Output)
Log(Mfg VA)
Mean 5.220 2.078 2.202 5.028 1.876 4.847 4.599
Median 5.222 2.369 2.503 5.076 1.753 5.095 4.682
Maximum 6.275 3.220 3.559 5.235 3.093 6.481 6.382
Minimum 4.448 0.839 -0.222 4.731 0.549 3.103 2.718
Std. Dev. 0.560 0.968 0.949 0.116 0.556 1.041 1.162
Skewness 0.434 -0.227 -0.927 -0.897 0.667 0.044 0.041
Kurtosis 2.123 1.279 3.085 3.337 3.280 1.882 1.741
Jarque-Bera 2.983 6.207 6.752 6.520 3.635 2.462 3.119
Probability 0.225 0.145 0.134 0.038* 0.162 0.292 0.210
Observations 55 55 55 55 55 55 55
Note: * means null hypothesis of normality of the variables is rejected at 5 percent level
of significance.
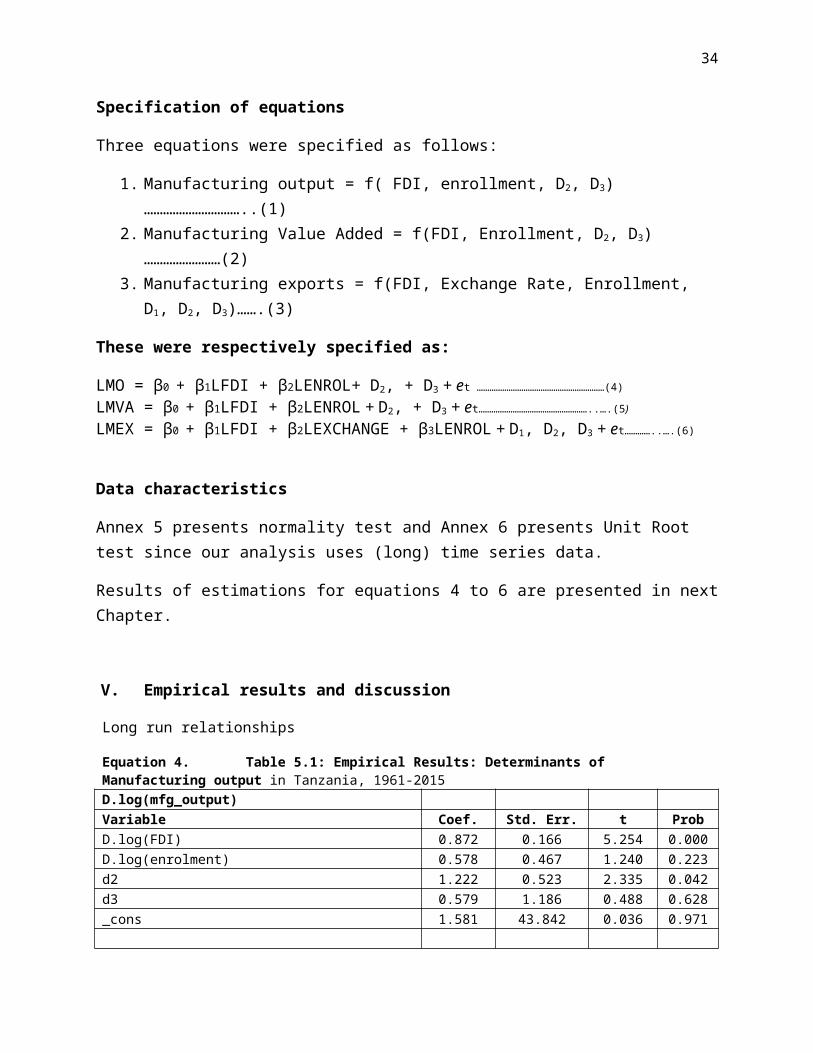
36
Annex 9: Data Characteristics: Unit Root Test
Unit root test was conducted and the results for the Augmented Dickey Fuller (ADF) test for variables in
both levels and after first difference are summarized in Table 1.The results suggest that none of the
variables in the model is stationary and that the variables in the model are integrated of order one ﴾i.e.
I(1)﴿. However, after taking first difference all variables are stationary and that the variables are
integrated of order zero ﴾i.e. I(0)﴿.
Unit root tests
At levels At first difference
VARIABLE Nature of selected ADF Equations
ADF test statistic
Order of integration
ADF test statistic
Order of integration
Log(Mfg Output) 1lag -2.56* I(1) -5.48* I(0)
Log(Mfg VA) 1lag -3.18* I(1) -3.91** I(0)
Log(Mfg Exports) 1lag -2.11* I(1) -4.84* I(0)
Log(Enrolment) 1 lag -1.23* I(1) -5.58* I(0)
Log(FDI) 1lag -3.32** I(1) -4.26* I(0)
Log(Exchange Rate) 1lag -2.90* I(1) -4.73* I(0)
*Significant at 1 percent ** significant at 5 percent level of significance.
Annex 10: Trends of Exchange Rate and Manufacturing Exports in Tanzania, 1961-2015
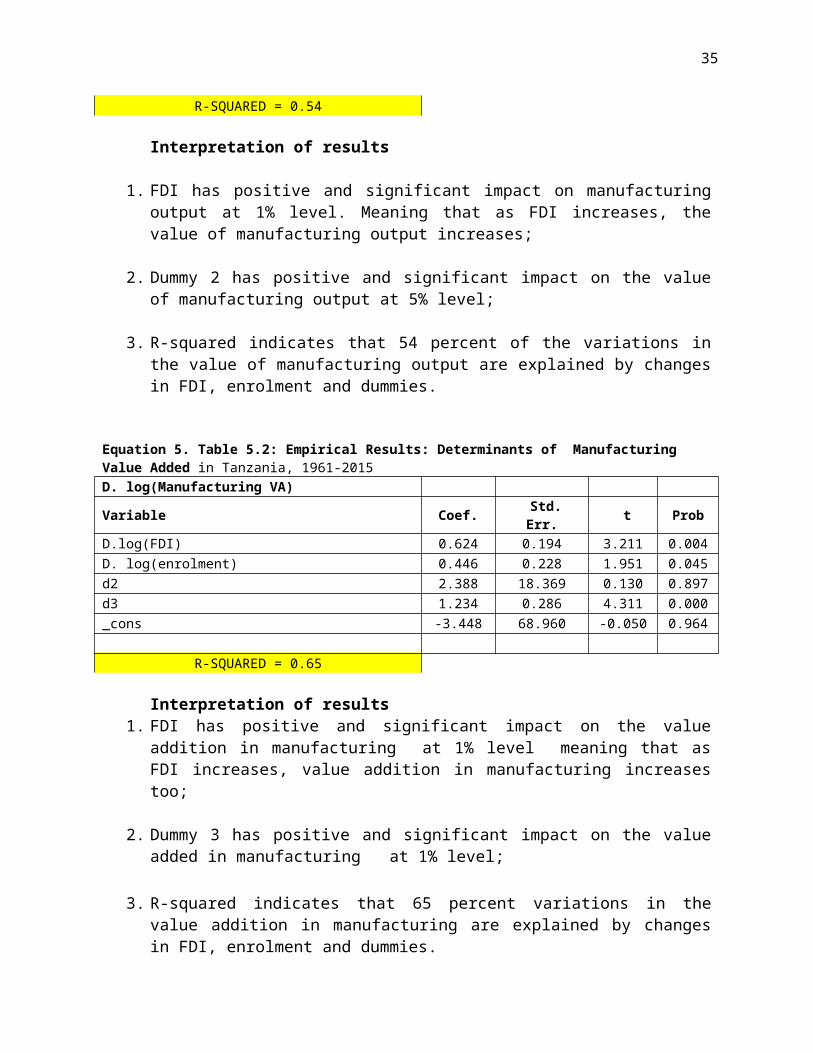
37
19691971
19731975
19771979
19811983
19851987
19891991
19931995
19971999
20012003
20052007
20092011
2013-50%
0%
50%
100%
150%
200%
250%
-200%0%200%400%600%800%1000%1200%1400%1600%1800%
Exchange rate %change Mfg exports %changeEx
chan
ge ra
te %
cha
nge
Mfg
exp
orts
% c
hang
e
Annex 11: FDI inflows in Tanzania, %change, 1961-2014
-1000%
0%
1000%
2000%
3000%
4000%
5000%
6000%
7000%
Annex 12: High-tech manufactures exports: Codes and description
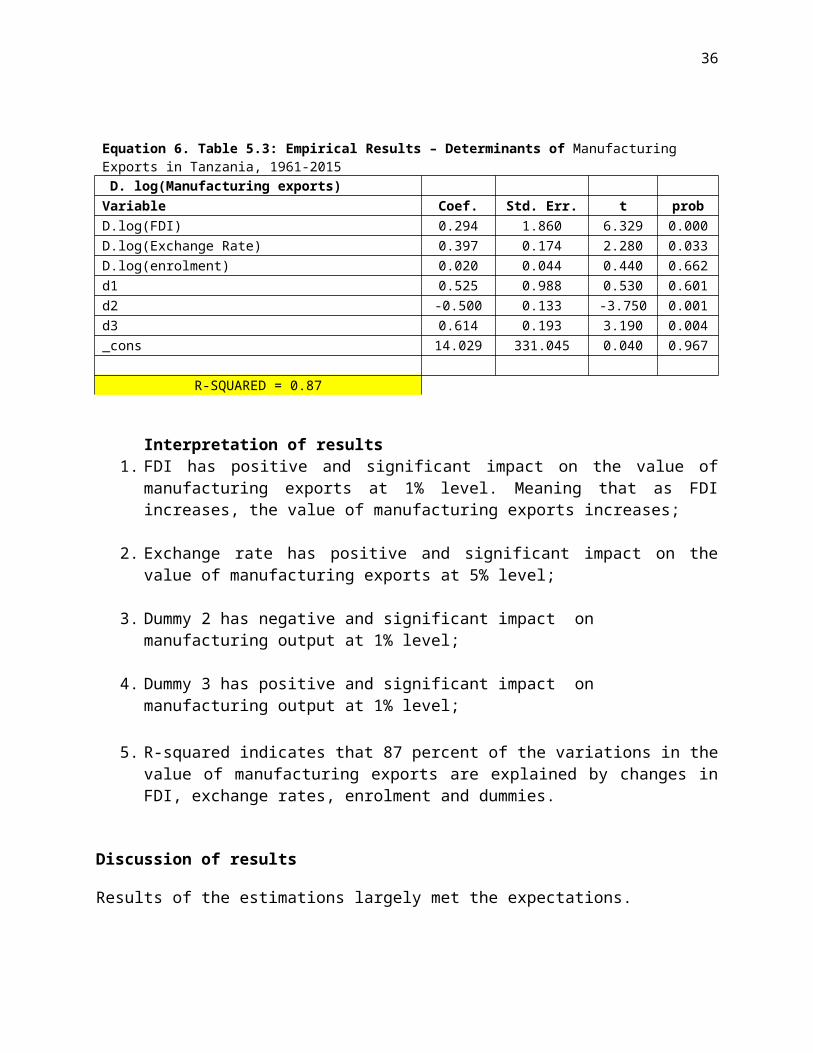
38
52: Inorganic chemicals
525 - Radioactive and associated materials
54: Medicinal and pharmaceutical products
541 - Medicinal and pharmaceutical products, other than medicaments of group 542
542 - Medicaments (including veterinary medicaments)
71: Power-generating machinery and equipment 716 -Rotating electric plant, and parts thereof, n.e.s.
718 - Power-generating machinery, and parts thereof, n.e.s.
75: Office machines and automatic data-processing machines
751-Office machines
752- Automatic data-processing machines and units thereof; magnetic or optical readers, machines for transcribing data onto data media in coded form and
machines for processing such data, n.e.s.
759 -Parts and accessories (other than covers, carrying cases and the like) suitable for use solely or principally with machines falling within groups 751 and 752
76: Telecommunications and sound-recording and reproducing apparatus and equipment
764 - Telecommunications equipment, n.e.s., and parts, n.e.s., and accessories of apparatus falling within division 76
77: Electrical machinery, apparatus and appliances, n.e.s., and electrical parts thereof (including non-electrical counterparts, n.e.s., of electrical household-type equipment)
771 - Electric power machinery (other than rotating electric plant of group 716), and parts thereof
774 - Electrodiagnostic apparatus for medical, surgical, dental or veterinary purposes, and radiological apparatus
776 - Thermionic, cold cathode or photo-cathode valves and tubes (e.g., vacuum or vapour or gas-filled valves and tubes, mercury arc rectifying valves and tubes, cathode-ray tubes, television camera tubes); diodes, transistors and similar semiconductor devices;
79: Other transport equipment
792- Aircraft and associated equipment; spacecraft (including satellites) and spacecraft launch vehicles; parts thereof
39
87: Professional, scientific and controlling instruments and apparatus, n.e.s.
871 - Optical instruments and apparatus, n.e.s.
874 - Measuring, checking, analysing and controlling instruments and apparatus, n.e.s.
88: Photographic apparatus, equipment and supplies and optical goods, n.e.s.; watches and clocks
881- Photographic apparatus and equipment, n.e.s.
89: Miscellaneous manufactured articles, n.e.s.
891 - Arms and ammunition