Embed Size (px)
Citation preview

Page 1
Manufacturing and International Trade Report
Values in the Manufacturing and International Trade Report (MITR) are based on manufacturing data from the 2014 Annual Survey of Manufactures and administrative records from official U.S. import and export merchandise trade statistics. Manufacturing data for 2013 supersede the data that were previously published in the 2013 Manufacturing and International Trade Report. Data users who create their own estimates using data from this report should cite the Census Bureau as the source of the original data only.
Data Comparability
Import and export data are classified using 10-digit commodity codes based on the Harmonized System. For this release, a concordance is used to map these import and export commodity codes to 7-digit NAICS-based Product Class Codes that are used in the Economic Census and the Annual Survey of Manufactures. Where a commodity code could be mapped to more than one 7-digit NAICS-based Product Class Code, a forced concordance is used to map the commodity code to a higher-level aggregate NAICS-based Product Code, based primarily on product value and agreed upon by subject matter experts. The 2014 MITR Concordance file may be found at:http://www.census.gov/foreign-trade/Press-Release/MITR/2014/2014 MITR Concordance.xls
For a given NAICS-based Product Code, the Value of Product Shipments may be lower than the Domestic Export Value of Goods. This may occur for several possible reasons, including the following. First, the Domestic Export Value of Goods is not limited to manufacturers and may include exports from individuals and other business establishments, such as retailers and wholesalers. Second, there may be a lag between when a given product was manufactured and when it was exported, which may occur when a finished good is exported from an establishment's inventories. Third, the Domestic Export Value of Goods is actually the value at the U.S. seaport, airport or border port of export, based on the transaction price, which includes inland freight, insurance, and other charges incurred in placing the merchandise alongside the carrier at the U.S. port of exportation. Fourth, if a foreign good was imported and improved in value, the finished good would be considered domestic when exported, and its value would represent the transaction value (not just the value of the domestic value added).
Confidentiality
The Census Bureau has suppressed some data in this release to protect confidentiality. Title 13 United States Code, Section 9, prohibits the Census Bureau from publishing results in which an individual's or business' data can be identified. For more information on how the Census Bureau protects the confidentiality of data, see the disclosure limitation topics listed below as appropriate.
Disclosure Limitation
Disclosure limitation is the process for protecting the confidentiality of data. A disclosure of data occurs when published statistical information identifies either an individual or business that has provided information under a pledge of confidentiality. The techniques used by the Census Bureau to protect confidentiality in tabulations vary, depending on the type of data. Data in this release that are withheld to avoid disclosing data for individual companies are denoted with a 'D'. When appropriate, these data may be included in higher level totals unless disclosure also exists at the 6-digit NAICS-based Product Code.
Reliability of the Data
The data presented in this report are subject to nonsampling error. Nonsampling error can be attributed to many sources that include inability to identify all cases in the population; definition and classification difficulties; differences in respondents' interpretation of questions; errors in recording or coding the data collected; and other errors of collection, response, coverage, processing, and estimation for missing or misreported data. These errors may occur for a sample survey or a census. Most of the important operational errors were detected and corrected during the course of reviewing data for reasonableness and consistency. Though nonsampling error is not measured directly, quality control procedures are employed throughout the survey process to minimize this type of error.

Page 2
Reliability of the Data continued
The sample estimates presented in this report that are produced from the Annual Survey of Manufactures are subject to sampling error. Sampling error is the difference between estimates obtained from a sample and results theoretically obtainable from a comparable complete enumeration of the sampling frame. This error results because only a subset of the sampling frame is measured in a sample survey. For an estimate produced from the Annual Survey of Manufactures and displayed in this report, its relative standard error is displayed with the estimate and is defined as the standard error of the estimate divided by the estimate. The standard error is a measure of sampling variability that may be used to define a confidence interval about its corresponding estimate with a desired level of confidence. Only one of many possible samples was selected. If confidence intervals were constructed for each of these possible samples, then it would be expected that the percentage of confidence intervals containing the result of a complete enumeration would equal the percent of the level of confidence. For example, the interval defined by a margin of error of one standard error, in which the interval is constructed one standard error below the estimate to one standard error above the estimate, approximately yields a 68-percent confidence interval; the interval defined by a margin of error of two standard errors approximately yields a 95-percent confidence interval; and the interval defined by a margin of error of two and a half standard errors approximately yields a 99-percent confidence interval.

Page 3
Definitions of Terms
NAICS
The North American Industry Classification System (NAICS) provides a consistent industry classification system for economic analysis across the three North American Free Trade Agreement partners - Canada, Mexico and the United States. The structure of NAICS is hierarchical. The first two digits of the code designate the sector that represents one of 20 general categories of economic activities. The third digit designates the sub-sector, the fourth digit designates the industry group, the fifth digit designates the NAICS industry, and the sixth digit designates the national industry.NAICS-based Product Class Codes
A detailed 7-digit NAICS-based Product Class Code combines a 6-digit NAICS-based product code with an additional seventh digit or letter that designates the product class used by the Census Bureau to identify manufactured products in the United States. An aggregate 6-digit NAICS-based Product Code consists of one or more 7-digit NAICS-based Product Class Codes.
Special NAICS-based Product Class Codes Ending in 'X' or 'XX'
The 7-digit NAICS-based Product Class Codes ending in 'X' or 'XX' represent the "undistributed" Schedule B exports and Harmonized Tariff System imports that cannot be mapped to any specific 7-digit codes, but are included in a higher level of aggregation at the 6-digit or 5-digit level. For example, commodity codes for sugar products do not differentiate between beet sugar and cane sugar. Therefore, these codes can only be mapped to the 5-digit NAICS-based product for sugar, represented by code 31131X.
Value of Product Shipments
Value of Product Shipments includes the total value of all products produced and shipped by all producers. For selected products, this can represent value of receipts, value of production, or value of work done. Industries that are published on these unique bases are separately identified in the product line description.
The manufacturing product data from the 2014 Annual Survey of Manufactures and revised 2013 data that are included in the MITR can be found in Table AM1431VS101 at: http://factfinder.census.gov/bkmk/table/1.0/en/ASM/2014/31VS101
Export Values
Export values of goods are provided for both Domestic Exports and Total Exports. Total Exports is defined as the sum of Domestic and Foreign Exports. Definitions of these export values are available in the Guide to Foreign Trade Statistics, which can be found at:http://www.census.gov/foreign-trade/guide/sec2.html#coverage
Import Values
Import values of goods are provided for both General Imports and Consumption Imports. Definitions of these import values are available in the Guide to Foreign Trade Statistics, which can be found at:http://www.census.gov/foreign-trade/guide/sec2.html#coverage
Note: If the hyperlinks do not direct you to the source tables, copy and paste addresses directly into your web b
SymbolsD: Withheld to avoid disclosing data for individual companies; data are included in higher level totals where appropriate.N: Trade and/or manufacturing data are not available or the codes are not linked in the concordance.S: Withheld because estimate did not meet publication standards.A: Relative standard error is 100 percent or more.X: Not Applicables: Relative standard error is more than 40 percent and less than 100 percent (displayed as a superscript).

Table
Page 4
NAICS-based Product Code Description Year
Value of Product
Shipments
Relative Standard Error
(%)
Total Export Value of Goods
Domestic Export Value
of Goods
General Import Value
of Goods
Consumption Import Value
of Goods
311111 Dog and cat food 2014 21,982,980 1.5 1,318,868 1,300,761 665,840 665,840311111 Dog and cat food 2013 20,426,045 0.5 1,364,636 1,351,347 639,763 639,763 3111111 Dog food 2014 15,539,420 2.1 N N N N 3111111 Dog food 2013 14,442,973 0.8 N N N N 3111114 Cat food 2014 5,856,558 0.8 N N N N 3111114 Cat food 2013 5,423,702 0.4 N N N N 311111W Dog and cat food, nsk, total 2014 587,002 0.5 N N N N 311111W Dog and cat food, nsk, total 2013 559,370 0.1 N N N N 311111X Undistributed dog and cat food 2014 N X 1,318,868 1,300,761 665,840 665,840 311111X Undistributed dog and cat food 2013 N X 1,364,636 1,351,347 639,763 639,763311119 Other animal food 2014 32,704,444 0.6 1,648,789 1,634,812 593,938 597,187311119 Other animal food 2013 35,233,922 0.3 1,677,254 1,666,648 597,562 603,325 3111191 Chicken and turkey feed, supplements, concentrates, and premixes 2014 11,599,820 0.6 N N N N 3111191 Chicken and turkey feed, supplements, concentrates, and premixes 2013 13,227,647 0.4 N N N N 3111195 Complete dairy cattle feed, supplements, concentrates, and premixes 2014 6,453,984 1.4 32,604 32,604 17,499 17,499 3111195 Complete dairy cattle feed, supplements, concentrates, and premixes 2013 6,503,140 0.8 27,774 27,756 19,009 19,009 311119B Complete swine feed, supplements, concentrates, and premixes 2014 3,612,257 2.4 N N 13,459 13,459 311119B Complete swine feed, supplements, concentrates, and premixes 2013 4,059,995 1.4 N N 38,386 38,386 311119H Complete beef cattle feed, supplements, concentrates, and premixes 2014 2,927,162 1.5 N N 94,893 94,893 311119H Complete beef cattle feed, supplements, concentrates, and premixes 2013 3,089,979 0.6 N N 91,029 91,029 311119M Other poultry and livestock feed 2014 2,237,413 1.9 N N N N 311119M Other poultry and livestock feed 2013 2,356,286 0.9 N N N N 311119P Other prepared animal feeds, including feeding materials and adjuncts 2014 2,453,134 4.3 66,802 66,802 14,459 14,459 311119P Other prepared animal feeds, including feeding materials and adjuncts 2013 2,378,079 1.5 60,116 60,113 13,064 13,064 311119R Specialty feeds 2014 2,141,011 2.5 107,704 106,045 4,509 4,509 311119R Specialty feeds 2013 2,380,017 0.5 112,232 109,983 5,380 5,380 311119W Other animal food, nsk, total 2014 1,279,663 0.5 N N N N 311119W Other animal food, nsk, total 2013 1,238,778 0.2 N N N N 311119X Undistributed other animal food 2014 N X 1,441,679 1,429,361 449,118 452,367 311119X Undistributed other animal food 2013 N X 1,477,131 1,468,796 430,694 436,457
Manufacturing and International Trade Report: 2014 and 2013(1)In thousands of dollars. Values are based on manufacturing data from the 2014 Annual Survey of
Manufactures and administrative records from official U.S. import and export merchandise trade statistics. (1) Data for 2013 supersede the data that were previously published in the 2013 Manufacturing and International Trade Report.

Table
Page 5
NAICS-based Product Code Description Year
Value of Product
Shipments
Relative Standard Error
(%)
Total Export Value of Goods
Domestic Export Value
of Goods
General Import Value
of Goods
Consumption Import Value
of Goods
Manufacturing and International Trade Report: 2014 and 2013(1)In thousands of dollars. Values are based on manufacturing data from the 2014 Annual Survey of
Manufactures and administrative records from official U.S. import and export merchandise trade statistics. (1) Data for 2013 supersede the data that were previously published in the 2013 Manufacturing and International Trade Report.
311211 Flour milling products 2014 15,326,990 0.7 867,262 858,824 1,061,217 1,061,011311211 Flour milling products 2013 16,095,554 0.6 791,172 783,718 962,715 962,507 3112111 Wheat flour (excluding flour mixes), made in flour mills 2014 10,063,726 0.4 N N 100,862 100,862 3112111 Wheat flour (excluding flour mixes), made in flour mills 2013 10,377,943 0.9 N N 84,278 84,278 3112114 Wheat mill products, excluding flour 2014 929,288 1.9 55,563 54,047 404,723 404,723 3112114 Wheat mill products, excluding flour 2013 1,037,902 1.3 68,270 66,099 381,956 381,956 3112117 Corn mill products 2014 2,299,182 0.4 450,754 450,115 86,761 86,761 3112117 Corn mill products 2013 2,429,848 0.8 372,024 371,499 80,871 80,871 311211A Prepared flour mixes, including refrigerated and frozen doughs and batters,
made in flour mills2014 910,469 1.4 N N N N
311211A Prepared flour mixes, including refrigerated and frozen doughs and batters, made in flour mills
2013 1,001,277 0.2 N N N N
311211B Other grain mill products 2014 973,517 5.1 182,848 177,805 387,450 387,280 311211B Other grain mill products 2013 996,010 1.1 189,489 185,404 338,353 338,147 311211W Flour milling products, nsk, total 2014 150,808 s 46.8 s N N N N 311211W Flour milling products, nsk, total 2013 252,574 0.2 N N N N 311211X Undistributed flour milling products 2014 N X 178,096 176,857 81,420 81,385 311211X Undistributed flour milling products 2013 N X 161,389 160,715 77,257 77,255311212 Rice milling products 2014 4,004,662 2.4 1,493,385 1,479,391 798,667 798,642311212 Rice milling products 2013 3,820,502 0.8 1,587,462 1,576,147 757,475 757,450 3112120 Rice milling products 2014 4,004,662 2.4 1,493,385 1,479,391 798,667 798,642 3112120 Rice milling products 2013 3,820,502 0.8 1,587,462 1,576,147 757,475 757,450311213 Malt 2014 1,301,837 0.1 236,246 233,671 281,019 281,019311213 Malt 2013 1,343,283 0.1 215,832 213,718 230,296 230,296 3112130 Malt 2014 1,301,837 0.1 236,246 233,671 281,019 281,019 3112130 Malt 2013 1,343,283 0.1 215,832 213,718 230,296 230,296

Table
Page 6
NAICS-based Product Code Description Year
Value of Product
Shipments
Relative Standard Error
(%)
Total Export Value of Goods
Domestic Export Value
of Goods
General Import Value
of Goods
Consumption Import Value
of Goods
Manufacturing and International Trade Report: 2014 and 2013(1)In thousands of dollars. Values are based on manufacturing data from the 2014 Annual Survey of
Manufactures and administrative records from official U.S. import and export merchandise trade statistics. (1) Data for 2013 supersede the data that were previously published in the 2013 Manufacturing and International Trade Report.
311221 Wet corn milling products 2014 12,929,441 0.1 2,771,576 2,747,358 699,387 699,341311221 Wet corn milling products 2013 16,421,695 0.2 3,037,407 2,997,858 676,820 676,733 3112211 Corn sweeteners, made by wet milling 2014 5,793,028 0.0 878,890 867,816 259,290 259,290 3112211 Corn sweeteners, made by wet milling 2013 7,077,643 0.0 1,032,822 1,004,130 218,942 218,942 3112214 Manufactured starch, made by wet milling 2014 2,497,327 0.7 549,467 537,009 399,750 399,750 3112214 Manufactured starch, made by wet milling 2013 2,688,738 1.0 557,309 546,540 404,582 404,578 3112218 Corn oil, made by wet milling 2014 1,273,491 0.3 401,030 400,992 18,406 18,360 3112218 Corn oil, made by wet milling 2013 1,411,957 0.0 503,204 503,119 30,125 30,043 311221A Wet process corn by-products, made by wet milling 2014 3,343,698 0.1 942,188 941,541 21,941 21,941 311221A Wet process corn by-products, made by wet milling 2013 5,048,889 0.2 944,072 944,069 23,170 23,170 311221W Wet corn milling products, nsk, total 2014 21,898 0.0 N N N N 311221W Wet corn milling products, nsk, total 2013 194,468 0.0 N N N N311224 Soybean and other oilseed products 2014 31,021,138 0.5 7,969,434 7,807,428 6,848,586 6,841,050311224 Soybean and other oilseed products 2013 33,241,945 0.6 7,923,886 7,782,408 6,488,380 6,479,011 3112241 Soybean oil 2014 9,430,434 0.7 636,139 635,910 3,972 3,972 3112241 Soybean oil 2013 10,735,620 0.4 677,443 677,438 10,260 10,257 3112242 Crude cottonseed oil 2014 89,462 12.1 9,848 9,844 1,524 1,524 3112242 Crude cottonseed oil 2013 115,156 7.8 3,384 3,384 0 0 3112244 Soybean cake, meal, and other by-products 2014 18,060,465 0.7 6,640,157 6,624,773 324,925 324,856 3112244 Soybean cake, meal, and other by-products 2013 19,558,225 1.0 6,434,841 6,424,739 232,388 232,152 3112245 Cottonseed oil, once-refined (after alkali or caustic wash but before
deodorizing or use in end products)2014 82,152 0.0 12,758 12,758 3,642 3,642
3112245 Cottonseed oil, once-refined (after alkali or caustic wash but before deodorizing or use in end products)
2013 115,679 0.0 23,184 23,184 11,519 11,519
3112247 Cotton linters 2014 61,607 4.5 14,586 14,586 772 772 3112247 Cotton linters 2013 66,842 5.8 36,921 36,911 0 0 311224B Cottonseed cake, meal, hulls, and other by-products 2014 404,619 3.2 27,925 27,925 0 0 311224B Cottonseed cake, meal, hulls, and other by-products 2013 486,461 0.5 37,193 37,193 0 0 311224H Other crude and refined vegetable oils and other vegetable mill products 2014 2,885,341 1.3 604,180 458,093 6,506,832 6,499,364 311224H Other crude and refined vegetable oils and other vegetable mill products 2013 2,149,472 2.0 684,909 553,762 6,225,397 6,216,267 311224W Soybean and other oilseed products, nsk, total 2014 7,057 9.4 N N N N 311224W Soybean and other oilseed products, nsk, total 2013 14,490 0.0 N N N N 311224X Undistributed soybean and other oilseed products 2014 N X 23,841 23,538 6,919 6,919 311224X Undistributed soybean and other oilseed products 2013 N X 26,011 25,797 8,816 8,816

Table
Page 7
NAICS-based Product Code Description Year
Value of Product
Shipments
Relative Standard Error
(%)
Total Export Value of Goods
Domestic Export Value
of Goods
General Import Value
of Goods
Consumption Import Value
of Goods
Manufacturing and International Trade Report: 2014 and 2013(1)In thousands of dollars. Values are based on manufacturing data from the 2014 Annual Survey of
Manufactures and administrative records from official U.S. import and export merchandise trade statistics. (1) Data for 2013 supersede the data that were previously published in the 2013 Manufacturing and International Trade Report.
311225 Fats and oils refining and blending products 2014 17,708,244 0.2 797,276 761,817 305,812 305,539311225 Fats and oils refining and blending products 2013 18,604,172 0.3 872,564 829,960 369,403 369,280 3112252 Shortening and cooking oils 2014 15,837,043 0.2 759,277 723,952 291,787 291,582 3112252 Shortening and cooking oils 2013 16,691,278 0.3 835,865 793,447 354,352 354,266 3112254 Margarine, butter blends, and butter substitutes 2014 1,800,442 0.5 37,999 37,866 14,024 13,958 3112254 Margarine, butter blends, and butter substitutes 2013 1,850,128 0.3 36,699 36,512 15,051 15,015 311225W Fats and oils refining and blending products, nsk, total 2014 70,759 0.2 N N N N 311225W Fats and oils refining and blending products, nsk, total 2013 62,766 0.0 N N N N311230 Breakfast cereal 2014 9,094,325 0.9 733,537 727,107 585,107 585,135311230 Breakfast cereal 2013 9,793,849 0.5 718,159 710,027 583,451 583,423 3112300 Breakfast cereal 2014 9,094,325 0.9 733,537 727,107 585,107 585,135 3112300 Breakfast cereal 2013 9,793,849 0.5 718,159 710,027 583,451 583,42331131X Sugar 2014 8,993,250 0.1 404,558 380,812 1,826,026 1,812,77331131X Sugar 2013 9,923,045 0.2 434,346 416,569 1,826,433 1,836,055
311313 Beet sugar 2014 3,738,284 0.1 N N N N311313 Beet sugar 2013 4,496,217 0.5 N N N N 3113130 Beet sugar 2014 3,738,284 0.1 N N N N 3113130 Beet sugar 2013 4,496,217 0.5 N N N N311314 Cane sugar 2014 5,254,966 0.0 N N N N311314 Cane sugar 2013 5,426,828 0.1 N N N N 3113141 Raw cane sugar and sugarcane mill products and by-products 2014 2,499,795 0.0 N N N N 3113141 Raw cane sugar and sugarcane mill products and by-products 2013 2,729,901 0.2 N N N N 3113143 Refined granulated cane sugar and by-products 2014 2,742,597 0.0 N N N N 3113143 Refined granulated cane sugar and by-products 2013 2,683,390 0.1 N N N N 311314W Cane sugar, nsk, total 2014 12,574 0.0 N N N N 311314W Cane sugar, nsk, total 2013 13,537 0.0 N N N N
31131XX Undistributed sugar 2014 N X 404,558 380,812 1,826,026 1,812,773 31131XX Undistributed sugar 2013 N X 434,346 416,569 1,826,433 1,836,055

Table
Page 8
NAICS-based Product Code Description Year
Value of Product
Shipments
Relative Standard Error
(%)
Total Export Value of Goods
Domestic Export Value
of Goods
General Import Value
of Goods
Consumption Import Value
of Goods
Manufacturing and International Trade Report: 2014 and 2013(1)In thousands of dollars. Values are based on manufacturing data from the 2014 Annual Survey of
Manufactures and administrative records from official U.S. import and export merchandise trade statistics. (1) Data for 2013 supersede the data that were previously published in the 2013 Manufacturing and International Trade Report.
311340 Nonchocolate confectionery 2014 9,260,555 0.7 713,052 669,152 1,978,222 1,976,304311340 Nonchocolate confectionery 2013 8,953,780 0.4 646,172 606,325 1,877,674 1,876,291 3113401 Nonchocolate-type confectionery products, made and packaged for shipment
not retailed at manufacturing establishment2014 6,680,758 0.9 N N N N
3113401 Nonchocolate-type confectionery products, made and packaged for shipment not retailed at manufacturing establishment
2013 6,543,707 0.6 N N N N
3113402 Nonchocolate-type confectionery products made from purchased chocolate retailed at manufacturing establishment
2014 103,481 6.7 N N N N
3113402 Nonchocolate-type confectionery products made from purchased chocolate retailed at manufacturing establishment
2013 103,751 0.4 N N N N
3113404 Chewing gum, bubble gum, and chewing gum base 2014 1,862,446 0.3 38,421 35,945 118,782 118,691 3113404 Chewing gum, bubble gum, and chewing gum base 2013 1,780,834 0.0 32,886 30,856 116,592 116,588 3113407 Other confectionery-type products 2014 412,662 8.2 15,024 13,828 158,659 158,356 3113407 Other confectionery-type products 2013 323,636 0.5 14,227 13,104 164,581 164,413 311340W Nonchocolate confectionery, nsk, total 2014 201,208 2.4 N N N N 311340W Nonchocolate confectionery, nsk, total 2013 201,852 1.2 N N N N 311340X Undistributed nonchocolate confectionery 2014 N X 659,607 619,378 1,700,781 1,699,257 311340X Undistributed nonchocolate confectionery 2013 N X 599,059 562,364 1,596,501 1,595,29131135X Chocolate and confectionery 2014 14,919,789 1.0 1,973,059 1,784,265 3,417,029 3,410,50931135X Chocolate and confectionery 2013 14,174,625 0.2 1,830,636 1,689,881 3,053,010 3,047,578
311351 Chocolate and confectionery from cacao beans 2014 4,472,261 0.6 N N N N311351 Chocolate and confectionery from cacao beans 2013 4,161,922 0.5 N N N N 3113511 Chocolate coatings, made from cacao beans 2014 1,230,235 0.2 N N N N 3113511 Chocolate coatings, made from cacao beans 2013 1,006,930 0.1 N N N N 3113514 Chocolate and chocolate-type confectionery products, made from cacao 2014 1,491,567 1.0 N N N N 3113514 Chocolate and chocolate-type confectionery products, made from cacao 2013 1,450,202 0.6 N N N N 3113517 Other chocolate and cocoa products, made from cacao beans 2014 1,645,936 1.3 N N N N 3113517 Other chocolate and cocoa products, made from cacao beans 2013 1,599,444 1.3 N N N N 311351W Chocolate and confectionery from cacao beans, nsk, total 2014 104,523 9.7 N N N N 311351W Chocolate and confectionery from cacao beans, nsk, total 2013 105,346 0.0 N N N N

Table
Page 9
NAICS-based Product Code Description Year
Value of Product
Shipments
Relative Standard Error
(%)
Total Export Value of Goods
Domestic Export Value
of Goods
General Import Value
of Goods
Consumption Import Value
of Goods
Manufacturing and International Trade Report: 2014 and 2013(1)In thousands of dollars. Values are based on manufacturing data from the 2014 Annual Survey of
Manufactures and administrative records from official U.S. import and export merchandise trade statistics. (1) Data for 2013 supersede the data that were previously published in the 2013 Manufacturing and International Trade Report.
311352 Confectionery from purchased chocolate 2014 10,447,528 1.5 N N N N311352 Confectionery from purchased chocolate 2013 10,012,703 0.1 N N N N 3113521 Chocolate and chocolate-type confectionery products, made from purchased
chocolate not retailed at manufacturing establishment2014 9,281,991 1.1 N N N N
3113521 Chocolate and chocolate-type confectionery products, made from purchased chocolate not retailed at manufacturing establishment
2013 9,102,059 0.1 N N N N
3113522 Chocolate and chocolate-type confectionery products, made from purchased chocolate retailed at manufacturing establishment
2014 768,741 13.9 N N N N
3113522 Chocolate and chocolate-type confectionery products, made from purchased chocolate retailed at manufacturing establishment
2013 540,348 0.4 N N N N
311352W Confectionery from purchased chocolate, nsk, total 2014 396,796 10.1 N N N N 311352W Confectionery from purchased chocolate, nsk, total 2013 370,296 0.1 N N N N
31135XX Undistributed chocolate and confectionery 2014 N X 1,973,059 1,784,265 3,417,029 3,410,509 31135XX Undistributed chocolate and confectionery 2013 N X 1,830,636 1,689,881 3,053,010 3,047,578311411 Frozen fruits, juices, and vegetables 2014 12,175,811 0.6 1,995,260 1,871,130 3,020,562 3,062,315311411 Frozen fruits, juices, and vegetables 2013 12,297,691 0.5 1,981,408 1,840,557 2,808,166 2,860,620 3114111 Frozen fruits, juices, ades, drinks, and cocktails 2014 2,707,530 1.2 556,109 467,696 1,332,140 1,376,643 3114111 Frozen fruits, juices, ades, drinks, and cocktails 2013 2,765,668 1.2 582,066 480,815 1,131,899 1,186,498 3114114 Frozen vegetables 2014 9,265,869 0.7 1,439,152 1,403,434 1,688,422 1,685,672 3114114 Frozen vegetables 2013 9,340,622 0.6 1,399,342 1,359,742 1,676,267 1,674,122 311411W Frozen fruits, juices, and vegetables, nsk, total 2014 202,412 0.5 N N N N 311411W Frozen fruits, juices, and vegetables, nsk, total 2013 191,402 0.0 N N N N311412 Frozen specialty food 2014 19,470,319 1.3 173,026 172,457 150,209 150,209311412 Frozen specialty food 2013 18,443,139 0.4 144,258 143,822 141,463 141,463 3114121 Frozen dinners (beef, pork, and poultry pies) and nationality foods 2014 15,950,696 1.6 173,026 172,457 150,209 150,209 3114121 Frozen dinners (beef, pork, and poultry pies) and nationality foods 2013 15,138,839 0.5 144,258 143,822 141,463 141,463 3114124 Other frozen specialties, such as dairy and nondairy whipped topping,
waffles, soups, etc., excluding seafood2014 3,079,215 2.5 N N N N
3114124 Other frozen specialties, such as dairy and nondairy whipped topping, waffles, soups, etc., excluding seafood
2013 2,885,879 0.6 N N N N
311412W Frozen specialty food, nsk, total 2014 440,408 0.1 N N N N 311412W Frozen specialty food, nsk, total 2013 418,420 0.0 N N N N

Table
Page 10
NAICS-based Product Code Description Year
Value of Product
Shipments
Relative Standard Error
(%)
Total Export Value of Goods
Domestic Export Value
of Goods
General Import Value
of Goods
Consumption Import Value
of Goods
Manufacturing and International Trade Report: 2014 and 2013(1)In thousands of dollars. Values are based on manufacturing data from the 2014 Annual Survey of
Manufactures and administrative records from official U.S. import and export merchandise trade statistics. (1) Data for 2013 supersede the data that were previously published in the 2013 Manufacturing and International Trade Report.
311421 Fruit and vegetable canning products 2014 25,066,936 1.3 3,160,535 3,043,206 5,170,740 5,164,072311421 Fruit and vegetable canning products 2013 24,934,186 0.3 3,013,675 2,893,021 5,129,974 5,119,200 3114211 Canned fruits, excluding baby foods 2014 3,258,368 2.4 733,307 695,398 1,757,755 1,754,993 3114211 Canned fruits, excluding baby foods 2013 3,092,888 0.4 684,690 647,396 1,790,575 1,789,754 3114215 Canned vegetables 2014 3,767,503 2.2 354,385 335,067 1,552,314 1,552,188 3114215 Canned vegetables 2013 3,651,499 0.7 337,471 323,657 1,439,807 1,439,517 311421A Canned vegetable juices 2014 784,721 4.4 76,042 74,480 33,567 33,565 311421A Canned vegetable juices 2013 785,227 0.1 72,699 72,146 30,078 30,061 311421D Canned catsup and other tomato-based sauces 2014 6,621,377 1.5 764,912 763,128 150,205 150,101 311421D Canned catsup and other tomato-based sauces 2013 7,232,870 0.4 661,845 659,539 150,581 150,354 311421G Canned jams, jellies, and preserves 2014 949,415 5.1 60,702 60,084 116,644 116,390 311421G Canned jams, jellies, and preserves 2013 889,531 2.9 34,031 33,563 103,768 103,695 311421K Canned and fresh fruit juices, nectars, and concentrates 2014 7,302,825 3.9 761,913 721,676 1,223,817 1,220,400 311421K Canned and fresh fruit juices, nectars, and concentrates 2013 6,968,153 0.6 825,839 777,402 1,278,595 1,269,279 311421P Pickles and other pickled products 2014 1,704,431 0.4 141,547 135,363 334,961 334,959 311421P Pickles and other pickled products 2013 1,566,679 2.3 133,954 126,505 336,373 336,342 311421W Fruit and vegetable canning products, nsk, total 2014 678,296 0.4 N N N N 311421W Fruit and vegetable canning products, nsk, total 2013 747,339 0.1 N N N N 311421X Undistributed fruit and vegetable canning products 2014 N X 267,727 258,011 1,475 1,475 311421X Undistributed fruit and vegetable canning products 2013 N X 263,147 252,813 198 198

Table
Page 11
NAICS-based Product Code Description Year
Value of Product
Shipments
Relative Standard Error
(%)
Total Export Value of Goods
Domestic Export Value
of Goods
General Import Value
of Goods
Consumption Import Value
of Goods
Manufacturing and International Trade Report: 2014 and 2013(1)In thousands of dollars. Values are based on manufacturing data from the 2014 Annual Survey of
Manufactures and administrative records from official U.S. import and export merchandise trade statistics. (1) Data for 2013 supersede the data that were previously published in the 2013 Manufacturing and International Trade Report.
311422 Specialty canning products 2014 7,456,178 0.7 320,551 318,338 177,073 176,837311422 Specialty canning products 2013 7,948,832 0.2 307,628 305,511 181,182 180,987 3114222 Canned baby foods (excluding cereal and biscuits), and other canned
specialty and nationality foods2014 1,103,930 0.1 157,229 156,779 13,300 13,300
3114222 Canned baby foods (excluding cereal and biscuits), and other canned specialty and nationality foods
2013 1,172,732 0.1 148,299 147,926 17,765 17,765
3114224 Canned soups and stews, excluding frozen and seafood 2014 4,500,513 0.1 142,978 142,290 161,759 161,523 3114224 Canned soups and stews, excluding frozen and seafood 2013 4,975,326 0.2 140,685 139,804 161,503 161,308 3114227 Canned dry beans 2014 1,784,579 2.9 20,344 19,269 2,014 2,014 3114227 Canned dry beans 2013 1,720,062 0.7 18,644 17,781 1,914 1,914 311422W Specialty canning products, nsk, total 2014 67,157 0.1 N N N N 311422W Specialty canning products, nsk, total 2013 80,711 0.0 N N N N311423 Dried and dehydrated food 2014 5,998,636 0.6 961,787 931,766 546,789 545,130311423 Dried and dehydrated food 2013 5,811,725 0.8 954,902 918,004 534,018 532,621 3114231 Soup mixes (including oriental, dried and dehydrated, and freeze-dried) and 2014 538,965 0.3 N N N N 3114231 Soup mixes (including oriental, dried and dehydrated, and freeze-dried) and 2013 510,901 0.9 N N N N 3114235 Dried and dehydrated fruits and vegetables, including freeze-dried 2014 3,953,977 0.7 950,017 920,386 544,317 542,658 3114235 Dried and dehydrated fruits and vegetables, including freeze-dried 2013 3,814,531 1.2 944,045 907,166 531,299 529,902 3114237 Macaroni and noodle products, purchased, packaged with other ingredients
excluding canned or frozen2014 885,864 0.6 N N N N
3114237 Macaroni and noodle products, purchased, packaged with other ingredients excluding canned or frozen
2013 867,910 0.2 N N N N
3114238 Other purchased products packaged with dried and dehydrated ingredients 2014 500,195 5.3 N N N N 3114238 Other purchased products packaged with dried and dehydrated ingredients 2013 508,275 0.2 N N N N 311423W Dried and dehydrated food, nsk, total 2014 119,635 0.1 N N N N 311423W Dried and dehydrated food, nsk, total 2013 110,107 0.0 N N N N 311423X Undistributed dried and dehydrated food 2014 N X 11,770 11,381 2,472 2,472 311423X Undistributed dried and dehydrated food 2013 N X 10,857 10,838 2,720 2,720

Table
Page 12
NAICS-based Product Code Description Year
Value of Product
Shipments
Relative Standard Error
(%)
Total Export Value of Goods
Domestic Export Value
of Goods
General Import Value
of Goods
Consumption Import Value
of Goods
Manufacturing and International Trade Report: 2014 and 2013(1)In thousands of dollars. Values are based on manufacturing data from the 2014 Annual Survey of
Manufactures and administrative records from official U.S. import and export merchandise trade statistics. (1) Data for 2013 supersede the data that were previously published in the 2013 Manufacturing and International Trade Report.
311511 Fluid milk products 2014 36,922,471 0.7 238,981 237,528 49,221 43,977311511 Fluid milk products 2013 35,423,482 0.2 210,547 206,889 82,063 76,599 3115111 Fluid milk and cream, bulk sales 2014 6,710,418 1.8 N N N N 3115111 Fluid milk and cream, bulk sales 2013 5,832,086 0.2 N N N N 3115115 Fluid milk and related products, packaged (including cartons, bottles, cans,
and dispenser cans), excluding Ultra High Temperature (U.H.T.) and 2014 18,088,246 1.0 N N 4,150 4,150
3115115 Fluid milk and related products, packaged (including cartons, bottles, cans, and dispenser cans), excluding Ultra High Temperature (U.H.T.) and
2013 18,017,572 0.4 N N 4,088 4,088
3115117 Cottage cheese (including bakers', pot, and farmers' cheese) 2014 1,010,562 1.1 N N N N 3115117 Cottage cheese (including bakers', pot, and farmers' cheese) 2013 987,826 0.8 N N N N 311511A Yogurt, excluding frozen 2014 6,199,987 0.9 40,372 40,170 24,605 22,944 311511A Yogurt, excluding frozen 2013 6,057,024 0.2 38,545 35,760 60,590 58,891 311511D Perishable dairy product substitutes 2014 2,191,810 1.9 N N N N 311511D Perishable dairy product substitutes 2013 2,108,171 0.1 N N N N 311511G Other packaged milk products 2014 2,280,006 5.7 113,797 112,638 4,253 4,253 311511G Other packaged milk products 2013 1,947,438 0.6 99,130 98,426 2,482 2,482 311511W Fluid milk products, nsk, total 2014 441,441 0.4 N N N N 311511W Fluid milk products, nsk, total 2013 473,366 2.0 N N N N 311511X Undistributed fluid milk products 2014 N X 84,812 84,720 16,214 12,630 311511X Undistributed fluid milk products 2013 N X 72,872 72,703 14,903 11,137311512 Creamery butter 2014 4,944,388 1.2 285,855 280,431 104,225 90,913311512 Creamery butter 2013 3,573,381 0.2 362,089 353,230 63,649 49,418 3115120 Creamery butter 2014 4,944,388 1.2 285,855 280,431 104,225 90,913 3115120 Creamery butter 2013 3,573,381 0.2 362,089 353,230 63,649 49,418

Table
Page 13
NAICS-based Product Code Description Year
Value of Product
Shipments
Relative Standard Error
(%)
Total Export Value of Goods
Domestic Export Value
of Goods
General Import Value
of Goods
Consumption Import Value
of Goods
Manufacturing and International Trade Report: 2014 and 2013(1)In thousands of dollars. Values are based on manufacturing data from the 2014 Annual Survey of
Manufactures and administrative records from official U.S. import and export merchandise trade statistics. (1) Data for 2013 supersede the data that were previously published in the 2013 Manufacturing and International Trade Report.
311513 Cheese products 2014 44,700,974 0.4 1,729,448 1,720,810 1,282,833 1,275,390311513 Cheese products 2013 39,735,080 0.2 1,377,081 1,367,431 1,154,789 1,151,965 3115131 Natural cheese (cheddar, Swiss, Italian, brick, cream, grated, dried, etc.),
excluding cottage cheese2014 35,614,547 0.4 909,251 908,722 751,249 745,669
3115131 Natural cheese (cheddar, Swiss, Italian, brick, cream, grated, dried, etc.), excluding cottage cheese
2013 31,246,690 0.3 712,601 712,034 663,199 660,988
3115134 Process cheese and related products 2014 7,546,442 0.9 90,597 88,576 36,211 36,211 3115134 Process cheese and related products 2013 6,986,338 0.5 84,103 81,941 31,360 31,376 3115137 Cheese substitutes and imitations 2014 412,430 1.4 N N 188 188 3115137 Cheese substitutes and imitations 2013 414,834 0.1 N N 221 221 311513A Raw liquid whey 2014 239,456 4.4 17,917 17,917 474 474 311513A Raw liquid whey 2013 270,391 3.0 14,289 14,289 6,744 6,744 311513W Cheese products, nsk, total 2014 888,099 0.2 N N N N 311513W Cheese products, nsk, total 2013 816,826 0.5 N N N N 311513X Undistributed cheese products 2014 N X 711,684 705,595 494,711 492,848 311513X Undistributed cheese products 2013 N X 566,088 559,167 453,265 452,636311514 Dry, condensed, and evaporated dairy products 2014 22,504,208 1.1 4,876,369 4,829,221 1,463,281 1,455,892311514 Dry, condensed, and evaporated dairy products 2013 20,573,949 0.2 4,821,646 4,804,406 1,244,404 1,239,901 3115141 Dry milk products and mixtures 2014 11,630,259 0.5 1,238 1,070 35,131 35,029 3115141 Dry milk products and mixtures 2013 11,015,737 0.3 4,543 4,524 29,687 29,705 3115145 Milk products, shipped in consumer-type cans, excluding substitutes 2014 5,207,738 0.6 N N 1,874 1,874 3115145 Milk products, shipped in consumer-type cans, excluding substitutes 2013 4,462,695 0.1 N N 1,451 1,451 3115147 Concentrated milk products, shipped in bulk (barrels, drums, and tanks) 2014 1,624,704 1.9 N N N N 3115147 Concentrated milk products, shipped in bulk (barrels, drums, and tanks) 2013 1,259,770 0.4 N N N N 311514A Ice cream mixes and related products 2014 1,208,857 3.2 N N N N 311514A Ice cream mixes and related products 2013 1,143,813 0.6 N N N N 311514D Dairy product substitutes 2014 2,474,814 9.2 271,871 271,241 33,606 33,606 311514D Dairy product substitutes 2013 2,323,453 0.3 312,041 311,190 25,285 25,273 311514W Dry, condensed, and evaporated dairy products, nsk, total 2014 357,837 0.0 N N N N 311514W Dry, condensed, and evaporated dairy products, nsk, total 2013 368,480 0.0 N N N N 311514X Undistributed dry, condensed, and evaporated dairy products 2014 N X 4,603,260 4,556,911 1,392,670 1,385,383 311514X Undistributed dry, condensed, and evaporated dairy products 2013 N X 4,505,063 4,488,692 1,187,980 1,183,472

Table
Page 14
NAICS-based Product Code Description Year
Value of Product
Shipments
Relative Standard Error
(%)
Total Export Value of Goods
Domestic Export Value
of Goods
General Import Value
of Goods
Consumption Import Value
of Goods
Manufacturing and International Trade Report: 2014 and 2013(1)In thousands of dollars. Values are based on manufacturing data from the 2014 Annual Survey of
Manufactures and administrative records from official U.S. import and export merchandise trade statistics. (1) Data for 2013 supersede the data that were previously published in the 2013 Manufacturing and International Trade Report.
311520 Ice cream and frozen desserts 2014 7,920,725 0.9 195,570 194,262 52,731 52,731311520 Ice cream and frozen desserts 2013 7,488,036 0.4 183,905 182,616 51,903 51,903 3115200 Ice cream and frozen desserts 2014 7,920,725 0.9 195,570 194,262 52,731 52,731 3115200 Ice cream and frozen desserts 2013 7,488,036 0.4 183,905 182,616 51,903 51,903311611 Animal (except poultry) slaughtering products 2014 100,891,151 0.7 17,046,051 16,936,898 9,122,776 9,122,458311611 Animal (except poultry) slaughtering products 2013 91,491,471 0.5 15,566,326 15,501,179 6,676,582 6,676,260 3116111 Beef, not canned or made into sausage, made in slaughtering plants 2014 59,074,806 0.8 6,930,323 6,893,501 5,832,271 5,832,094 3116111 Beef, not canned or made into sausage, made in slaughtering plants 2013 53,178,121 0.9 6,026,099 5,994,735 3,918,776 3,918,660 3116114 Veal, not canned or made into sausage, made in slaughtering plants 2014 457,988 5.4 950 921 13,667 13,667 3116114 Veal, not canned or made into sausage, made in slaughtering plants 2013 490,286 1.3 1,124 1,096 11,006 11,006 3116117 Lamb and mutton, not canned or made into sausage, made in slaughtering 2014 468,295 16.0 24,505 18,907 682,120 682,120 3116117 Lamb and mutton, not canned or made into sausage, made in slaughtering 2013 405,183 0.7 24,201 19,260 572,187 572,187 311611A Pork, not canned or made into sausage, made in slaughtering plants 2014 24,552,925 0.4 6,505,073 6,487,997 1,766,995 1,766,937 311611A Pork, not canned or made into sausage, made in slaughtering plants 2013 21,991,433 0.2 5,856,004 5,847,552 1,430,123 1,430,110 311611D Lard, made in slaughtering plants 2014 657,064 0.0 63,881 63,004 12,284 12,284 311611D Lard, made in slaughtering plants 2013 628,757 0.1 47,830 47,433 11,261 11,261 311611G Pork, processed or cured, not canned or made into sausage, made in
slaughtering plants2014 3,380,927 3.6 183,284 178,323 149,865 149,865
311611G Pork, processed or cured, not canned or made into sausage, made in slaughtering plants
2013 3,106,756 0.6 203,727 198,979 151,302 151,302
311611J Sausage and similar products, excluding canned, made in slaughtering 2014 3,467,520 3.1 2,551 2,551 40,964 40,881 311611J Sausage and similar products, excluding canned, made in slaughtering 2013 2,972,058 0.3 3,190 3,190 44,344 44,155 311611M Canned meats (excluding dog, cat, and baby food), made in slaughtering 2014 D S N N 3,536 3,536 311611M Canned meats (excluding dog, cat, and baby food), made in slaughtering 2013 D S N N 2,787 2,787 311611P Hides, skins, and pelts, made in slaughtering plants 2014 2,686,935 1.0 2,374,753 2,371,006 53,867 53,867 311611P Hides, skins, and pelts, made in slaughtering plants 2013 2,826,080 2.1 2,503,849 2,501,046 51,476 51,476 311611R Miscellaneous by-products of slaughtering plants 2014 3,929,131 1.0 59,959 58,169 444,614 444,614 311611R Miscellaneous by-products of slaughtering plants 2013 3,630,987 2.3 90,181 88,745 404,344 404,340 311611W Animal (except poultry) slaughtering products, nsk, total 2014 D S N N N N 311611W Animal (except poultry) slaughtering products, nsk, total 2013 D S N N N N 311611X Undistributed animal (except poultry) slaughtering products 2014 N X 900,773 862,517 122,594 122,594 311611X Undistributed animal (except poultry) slaughtering products 2013 N X 810,122 799,144 78,977 78,977

Table
Page 15
NAICS-based Product Code Description Year
Value of Product
Shipments
Relative Standard Error
(%)
Total Export Value of Goods
Domestic Export Value
of Goods
General Import Value
of Goods
Consumption Import Value
of Goods
Manufacturing and International Trade Report: 2014 and 2013(1)In thousands of dollars. Values are based on manufacturing data from the 2014 Annual Survey of
Manufactures and administrative records from official U.S. import and export merchandise trade statistics. (1) Data for 2013 supersede the data that were previously published in the 2013 Manufacturing and International Trade Report.
311612 Meat processed from carcasses 2014 48,708,475 1.4 N N 70,830 70,830311612 Meat processed from carcasses 2013 43,500,808 0.3 N N 63,421 63,421 3116121 Pork, processed or cured, not canned or made into sausage, made from
purchased carcasses2014 12,294,122 4.4 N N N N
3116121 Pork, processed or cured, not canned or made into sausage, made from purchased carcasses
2013 10,790,993 0.4 N N N N
3116124 Sausage and similar products, excluding canned, made from purchased 2014 8,831,636 1.2 N N N N 3116124 Sausage and similar products, excluding canned, made from purchased 2013 8,229,478 0.7 N N N N 3116127 Canned meats (excluding dog, cat, and baby food), made from purchased
carcasses2014 2,389,261 0.3 N N 0 0
3116127 Canned meats (excluding dog, cat, and baby food), made from purchased carcasses
2013 2,182,816 0.4 N N 0 0
311612A Other processed, frozen, or cooked meats, made from purchased carcasses 2014 24,115,389 1.8 N N 70,830 70,830 311612A Other processed, frozen, or cooked meats, made from purchased carcasses 2013 21,271,311 0.4 N N 63,421 63,421 311612W Meat processed from carcasses, nsk, total 2014 1,078,066 0.3 N N N N 311612W Meat processed from carcasses, nsk, total 2013 1,026,210 0.1 N N N N311613 Rendering and meat by-product processing products 2014 6,247,583 2.1 1,113,610 1,108,373 437,952 437,943311613 Rendering and meat by-product processing products 2013 6,333,495 1.2 1,201,294 1,195,450 412,760 412,760 3116132 Lard, inedible tallow, and other greases, excluding wool grease 2014 2,172,708 2.8 449,746 449,682 40,143 40,143 3116132 Lard, inedible tallow, and other greases, excluding wool grease 2013 2,288,910 0.9 480,357 480,341 41,455 41,455 3116135 Animal and marine feed and fertilizer by-products (including foots) 2014 3,976,865 2.9 447,621 445,234 359,128 359,119 3116135 Animal and marine feed and fertilizer by-products (including foots) 2013 3,954,547 1.9 517,261 515,294 334,992 334,992 311613W Rendering and meat by-product processing products, nsk, total 2014 98,009 0.8 N N N N 311613W Rendering and meat by-product processing products, nsk, total 2013 90,039 0.1 N N N N 311613X Undistributed rendering and meat by-product processing products 2014 N X 216,244 213,458 38,680 38,680 311613X Undistributed rendering and meat by-product processing products 2013 N X 203,676 199,815 36,314 36,314

Table
Page 16
NAICS-based Product Code Description Year
Value of Product
Shipments
Relative Standard Error
(%)
Total Export Value of Goods
Domestic Export Value
of Goods
General Import Value
of Goods
Consumption Import Value
of Goods
Manufacturing and International Trade Report: 2014 and 2013(1)In thousands of dollars. Values are based on manufacturing data from the 2014 Annual Survey of
Manufactures and administrative records from official U.S. import and export merchandise trade statistics. (1) Data for 2013 supersede the data that were previously published in the 2013 Manufacturing and International Trade Report.
311615 Poultry processing products 2014 63,289,777 0.8 5,514,283 5,503,630 390,978 390,978311615 Poultry processing products 2013 62,081,386 0.4 5,533,704 5,525,592 364,544 364,544 3116151 Young chickens (usually under 20 weeks of age), including bulk, chilled,
frozen, whole, and parts2014 33,392,317 1.1 4,207,828 4,201,976 169,225 169,225
3116151 Young chickens (usually under 20 weeks of age), including bulk, chilled, frozen, whole, and parts
2013 32,512,694 0.7 4,327,370 4,323,130 180,730 180,730
3116154 Hens and fowl, including frozen, whole, and parts 2014 1,271,586 15.8 63,160 62,809 4,314 4,314 3116154 Hens and fowl, including frozen, whole, and parts 2013 1,314,960 0.3 58,866 57,823 4,128 4,128 3116157 Turkeys, including frozen, whole, and parts 2014 5,768,829 1.6 649,166 647,848 47,362 47,362 3116157 Turkeys, including frozen, whole, and parts 2013 6,013,074 0.6 582,991 581,934 27,655 27,655 311615A Other poultry and small game, including frozen, whole, and parts 2014 717,088 0.6 16,322 15,789 15,891 15,891 311615A Other poultry and small game, including frozen, whole, and parts 2013 685,042 0.1 16,228 15,398 13,828 13,828 311615D Processed poultry and small game (excluding soups), containing 20 percent
or more poultry or meat2014 21,178,051 1.1 N N 153,002 153,002
311615D Processed poultry and small game (excluding soups), containing 20 percent or more poultry or meat
2013 20,531,446 0.3 N N 137,018 137,018
311615W Poultry processing products, nsk, total 2014 961,906 0.1 N N N N 311615W Poultry processing products, nsk, total 2013 1,024,171 0.1 N N N N 311615X Undistributed poultry processing products 2014 N X 577,807 575,208 1,185 1,185 311615X Undistributed poultry processing products 2013 N X 548,248 547,308 1,185 1,185
Table
Page 17
NAICS-based Product Code Description Year
Value of Product
Shipments
Relative Standard Error
(%)
Total Export Value of Goods
Domestic Export Value
of Goods
General Import Value
of Goods
Consumption Import Value
of Goods
Manufacturing and International Trade Report: 2014 and 2013(1)In thousands of dollars. Values are based on manufacturing data from the 2014 Annual Survey of
Manufactures and administrative records from official U.S. import and export merchandise trade statistics. (1) Data for 2013 supersede the data that were previously published in the 2013 Manufacturing and International Trade Report.
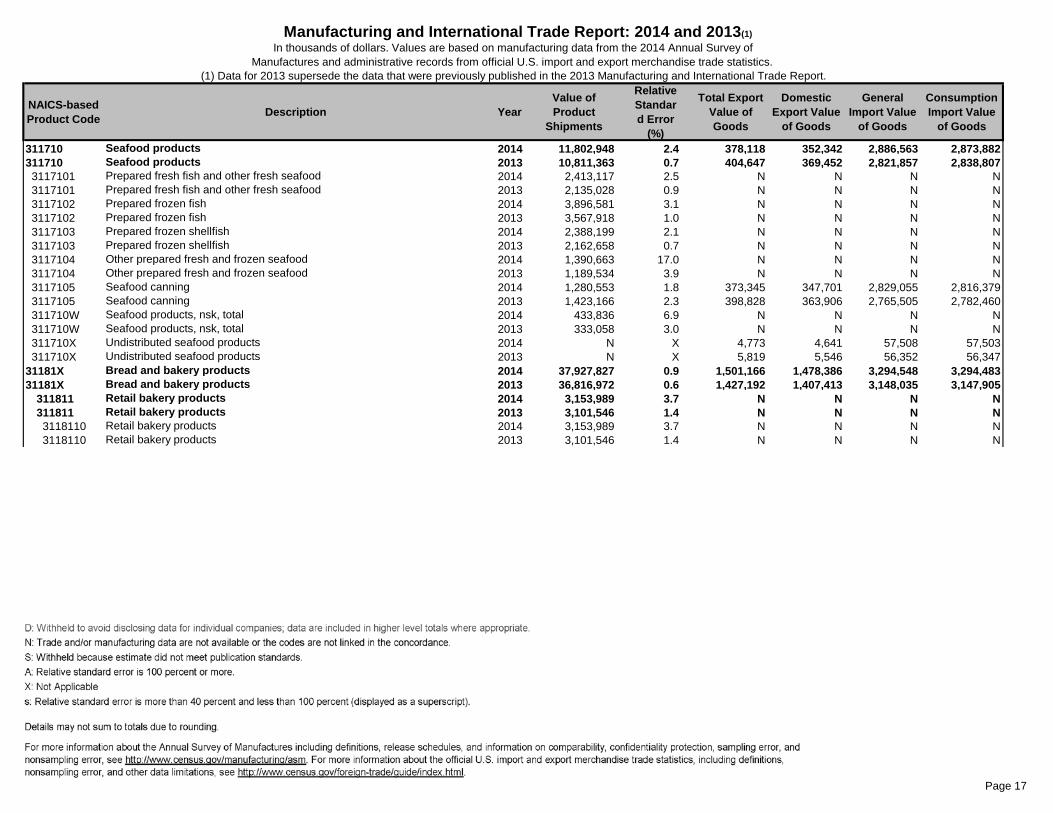
311710 Seafood products 2014 11,802,948 2.4 378,118 352,342 2,886,563 2,873,882311710 Seafood products 2013 10,811,363 0.7 404,647 369,452 2,821,857 2,838,807 3117101 Prepared fresh fish and other fresh seafood 2014 2,413,117 2.5 N N N N 3117101 Prepared fresh fish and other fresh seafood 2013 2,135,028 0.9 N N N N 3117102 Prepared frozen fish 2014 3,896,581 3.1 N N N N 3117102 Prepared frozen fish 2013 3,567,918 1.0 N N N N 3117103 Prepared frozen shellfish 2014 2,388,199 2.1 N N N N 3117103 Prepared frozen shellfish 2013 2,162,658 0.7 N N N N 3117104 Other prepared fresh and frozen seafood 2014 1,390,663 17.0 N N N N 3117104 Other prepared fresh and frozen seafood 2013 1,189,534 3.9 N N N N 3117105 Seafood canning 2014 1,280,553 1.8 373,345 347,701 2,829,055 2,816,379 3117105 Seafood canning 2013 1,423,166 2.3 398,828 363,906 2,765,505 2,782,460 311710W Seafood products, nsk, total 2014 433,836 6.9 N N N N 311710W Seafood products, nsk, total 2013 333,058 3.0 N N N N 311710X Undistributed seafood products 2014 N X 4,773 4,641 57,508 57,503 311710X Undistributed seafood products 2013 N X 5,819 5,546 56,352 56,34731181X Bread and bakery products 2014 37,927,827 0.9 1,501,166 1,478,386 3,294,548 3,294,48331181X Bread and bakery products 2013 36,816,972 0.6 1,427,192 1,407,413 3,148,035 3,147,905
311811 Retail bakery products 2014 3,153,989 3.7 N N N N311811 Retail bakery products 2013 3,101,546 1.4 N N N N 3118110 Retail bakery products 2014 3,153,989 3.7 N N N N 3118110 Retail bakery products 2013 3,101,546 1.4 N N N N

Table
Page 18
NAICS-based Product Code Description Year
Value of Product
Shipments
Relative Standard Error
(%)
Total Export Value of Goods
Domestic Export Value
of Goods
General Import Value
of Goods
Consumption Import Value
of Goods
Manufacturing and International Trade Report: 2014 and 2013(1)In thousands of dollars. Values are based on manufacturing data from the 2014 Annual Survey of
Manufactures and administrative records from official U.S. import and export merchandise trade statistics. (1) Data for 2013 supersede the data that were previously published in the 2013 Manufacturing and International Trade Report.
311812 Commercial bakery products 2014 29,235,886 1.1 N N N N311812 Commercial bakery products 2013 28,223,915 0.7 N N N N 3118121 Bread (white, wheat, rye, etc.), including frozen 2014 12,347,049 1.7 N N N N 3118121 Bread (white, wheat, rye, etc.), including frozen 2013 11,792,691 1.4 N N N N 3118125 Rolls, bread-type (including muffins, bagels, and croissants), including frozen 2014 8,610,414 1.8 N N N N 3118125 Rolls, bread-type (including muffins, bagels, and croissants), including frozen 2013 8,438,081 0.8 N N N N 3118127 Soft cakes, excluding frozen 2014 2,726,023 2.0 N N N N 3118127 Soft cakes, excluding frozen 2013 2,610,103 0.6 N N N N 311812A Pies (fruit, cream, and custard), excluding frozen 2014 286,137 6.5 N N N N 311812A Pies (fruit, cream, and custard), excluding frozen 2013 275,865 0.8 N N N N 311812D Other sweet goods, excluding frozen 2014 3,171,683 5.3 N N N N 311812D Other sweet goods, excluding frozen 2013 3,170,040 1.6 N N N N 311812W Commercial bakery products, nsk, total 2014 2,094,579 4.1 N N N N 311812W Commercial bakery products, nsk, total 2013 1,937,134 3.6 N N N N311813 Frozen cakes, pies, and other pastries 2014 5,537,952 1.5 N N N N311813 Frozen cakes, pies, and other pastries 2013 5,491,511 1.4 N N N N 3118130 Frozen cakes, pies, and other pastries 2014 5,537,952 1.5 N N N N 3118130 Frozen cakes, pies, and other pastries 2013 5,491,511 1.4 N N N N
31181XX Undistributed bread and bakery products 2014 N X 1,501,166 1,478,386 3,294,548 3,294,483 31181XX Undistributed bread and bakery products 2013 N X 1,427,192 1,407,413 3,148,035 3,147,905311821 Cookies and crackers 2014 11,502,647 1.7 N N N N311821 Cookies and crackers 2013 10,632,027 0.8 N N N N 3118212 Crackers, biscuits, and related products 2014 5,215,387 2.5 N N N N 3118212 Crackers, biscuits, and related products 2013 4,556,387 1.5 N N N N 3118214 Cookies, wafers, and ice cream cones and cups (excluding frozen) 2014 6,102,927 2.5 N N N N 3118214 Cookies, wafers, and ice cream cones and cups (excluding frozen) 2013 5,897,316 0.7 N N N N 311821W Cookies and crackers, nsk, total 2014 184,333 0.4 N N N N 311821W Cookies and crackers, nsk, total 2013 178,324 0.0 N N N N

Table
Page 19
NAICS-based Product Code Description Year
Value of Product
Shipments
Relative Standard Error
(%)
Total Export Value of Goods
Domestic Export Value
of Goods
General Import Value
of Goods
Consumption Import Value
of Goods
Manufacturing and International Trade Report: 2014 and 2013(1)In thousands of dollars. Values are based on manufacturing data from the 2014 Annual Survey of
Manufactures and administrative records from official U.S. import and export merchandise trade statistics. (1) Data for 2013 supersede the data that were previously published in the 2013 Manufacturing and International Trade Report.
311824 Dry pasta, dough, and flour mixes from purchased flour 2014 11,663,732 1.3 685,947 678,503 962,585 962,427311824 Dry pasta, dough, and flour mixes from purchased flour 2013 11,976,342 0.9 703,862 694,196 906,608 906,360 3118241 Prepared flour mixes, including refrigerated and frozen doughs and batters,
made from purchased flour2014 8,103,127 1.1 510,054 508,240 335,797 335,743
3118241 Prepared flour mixes, including refrigerated and frozen doughs and batters, made from purchased flour
2013 8,393,699 1.1 539,198 537,629 317,316 317,072
3118243 Dry macaroni, spaghetti and egg noodle products (excluding canned or 2014 3,427,961 3.6 175,893 170,263 626,787 626,685 3118243 Dry macaroni, spaghetti and egg noodle products (excluding canned or 2013 3,460,014 1.6 164,664 156,566 589,292 589,288 311824W Dry pasta, dough, and flour mixes from purchased flour, nsk, total 2014 132,644 0.2 N N N N 311824W Dry pasta, dough, and flour mixes from purchased flour, nsk, total 2013 122,630 0.0 N N N N311830 Tortillas 2014 3,554,236 2.9 N N N N311830 Tortillas 2013 3,301,097 1.7 N N N N 3118300 Tortillas, sold in bulk or packages, excluding frozen or canned 2014 3,554,236 2.9 N N N N 3118300 Tortillas, sold in bulk or packages, excluding frozen or canned 2013 3,301,097 1.7 N N N N311911 Roasted nuts and peanut butter 2014 12,853,663 0.6 760,007 747,016 384,078 383,994311911 Roasted nuts and peanut butter 2013 11,459,556 0.6 748,990 737,238 345,065 345,230 3119111 Nuts and seeds (salted, roasted, cooked, or blanched) 2014 10,714,532 0.7 614,418 602,404 332,074 331,990 3119111 Nuts and seeds (salted, roasted, cooked, or blanched) 2013 9,254,950 0.7 594,451 583,914 280,960 281,126 3119114 Peanut butter 2014 1,850,131 1.4 145,588 144,612 52,005 52,005 3119114 Peanut butter 2013 1,943,715 0.5 154,539 153,324 64,104 64,104 311911W Roasted nuts and peanut butter, nsk, total 2014 289,000 0.1 N N N N 311911W Roasted nuts and peanut butter, nsk, total 2013 260,891 0.0 N N N N311919 Other snack food 2014 21,969,911 1.4 602,418 598,304 248,121 248,129311919 Other snack food 2013 20,523,523 0.5 614,186 609,018 235,657 235,662 3119191 Potato chips and sticks, plain and flavored 2014 9,025,635 3.0 196,912 194,718 53,671 53,671 3119191 Potato chips and sticks, plain and flavored 2013 8,076,167 1.1 187,909 186,152 47,558 47,558 3119194 Corn chips and related products 2014 6,664,839 1.2 405,505 403,586 194,450 194,457 3119194 Corn chips and related products 2013 6,547,622 0.3 426,277 422,866 188,098 188,103 3119197 Other chips, sticks (hard pretzels, bacon rinds, popcorn (excluding candied),
etc.), excluding crackers, soft pretzels, and nuts2014 6,032,244 2.1 N N N N
3119197 Other chips, sticks (hard pretzels, bacon rinds, popcorn (excluding candied), etc.), excluding crackers, soft pretzels, and nuts
2013 5,724,080 0.8 N N N N
311919W Other snack food, nsk, total 2014 247,193 10.1 N N N N 311919W Other snack food, nsk, total 2013 175,654 0.3 N N N N

Table
Page 20
NAICS-based Product Code Description Year
Value of Product
Shipments
Relative Standard Error
(%)
Total Export Value of Goods
Domestic Export Value
of Goods
General Import Value
of Goods
Consumption Import Value
of Goods
Manufacturing and International Trade Report: 2014 and 2013(1)In thousands of dollars. Values are based on manufacturing data from the 2014 Annual Survey of
Manufactures and administrative records from official U.S. import and export merchandise trade statistics. (1) Data for 2013 supersede the data that were previously published in the 2013 Manufacturing and International Trade Report.
311920 Coffee and tea 2014 11,543,085 2.3 1,413,574 1,345,200 2,266,861 2,265,974311920 Coffee and tea 2013 11,535,870 1.1 1,478,391 1,407,139 2,273,976 2,273,375 3119201 Roasted coffee 2014 9,189,273 2.8 781,048 758,740 642,571 641,926 3119201 Roasted coffee 2013 9,413,980 1.2 816,380 788,163 644,465 643,943 3119205 Coffee, concentrated (freeze-dried, spray-dried, frozen or liquid
concentrated, mixtures, etc.), including coffee extracts and substitutes2014 700,581 8.3 184,461 174,885 448,674 448,689
3119205 Coffee, concentrated (freeze-dried, spray-dried, frozen or liquid concentrated, mixtures, etc.), including coffee extracts and substitutes
2013 655,542 8.8 205,631 194,567 489,834 489,782
3119207 Tea in consumer packages 2014 1,256,856 1.6 440,605 408,322 714,482 714,310 3119207 Tea in consumer packages 2013 1,261,193 0.4 450,794 422,538 713,605 713,612 311920W Coffee and tea, nsk, total 2014 396,374 0.3 N N N N 311920W Coffee and tea, nsk, total 2013 205,155 0.0 N N N N 311920X Undistributed coffee and tea 2014 N X 7,460 3,252 461,134 461,049 311920X Undistributed coffee and tea 2013 N X 5,586 1,870 426,071 426,038311930 Flavoring syrup and concentrates 2014 8,906,387 0.9 471,063 469,656 131,525 131,436311930 Flavoring syrup and concentrates 2013 9,431,376 0.2 461,500 446,166 164,515 164,389 3119301 Liquid beverage bases, excluding use by soft drink bottlers 2014 865,661 4.0 N N N N 3119301 Liquid beverage bases, excluding use by soft drink bottlers 2013 813,599 1.2 N N N N 3119304 Liquid beverage bases, concentrates and syrups, for sale by soft drink
bottlers to trade or nonbottler distributors2014 2,504,768 0.7 N N N N
3119304 Liquid beverage bases, concentrates and syrups, for sale by soft drink bottlers to trade or nonbottler distributors
2013 2,825,537 0.4 N N N N
3119305 Soft drink flavoring syrup, sold in bulk 2014 977,702 2.8 N N N N 3119305 Soft drink flavoring syrup, sold in bulk 2013 1,111,218 0.4 N N N N 3119308 Other flavoring agents, excluding chocolate syrups 2014 4,467,231 1.5 N N N N 3119308 Other flavoring agents, excluding chocolate syrups 2013 4,601,539 0.2 N N N N 311930W Flavoring syrup and concentrates, nsk, total 2014 91,025 0.1 N N N N 311930W Flavoring syrup and concentrates, nsk, total 2013 79,483 0.0 N N N N 311930X Undistributed flavoring syrup and concentrates 2014 N X 471,063 469,656 131,525 131,436 311930X Undistributed flavoring syrup and concentrates 2013 N X 461,500 446,166 164,515 164,389

Table
Page 21
NAICS-based Product Code Description Year
Value of Product
Shipments
Relative Standard Error
(%)
Total Export Value of Goods
Domestic Export Value
of Goods
General Import Value
of Goods
Consumption Import Value
of Goods
Manufacturing and International Trade Report: 2014 and 2013(1)In thousands of dollars. Values are based on manufacturing data from the 2014 Annual Survey of
Manufactures and administrative records from official U.S. import and export merchandise trade statistics. (1) Data for 2013 supersede the data that were previously published in the 2013 Manufacturing and International Trade Report.
311941 Mayonnaise, dressings, and other prepared sauces 2014 9,801,722 0.7 922,520 911,294 723,054 722,844311941 Mayonnaise, dressings, and other prepared sauces 2013 9,691,396 0.4 815,358 801,666 673,195 673,034 3119411 Vinegar and cider 2014 511,444 0.9 31,787 30,307 126,048 126,048 3119411 Vinegar and cider 2013 489,369 2.3 27,860 26,570 119,585 119,590 3119414 Prepared sauces (mustard, worcestershire, soy, horseradish, and sauces
used as a condiment to meat, vegetable, and seafood), excluding tomato-based sauces and sauces comprised of 20% or more meat
2014 3,146,697 1.2 536,598 528,434 537,798 537,591
3119414 Prepared sauces (mustard, worcestershire, soy, horseradish, and sauces used as a condiment to meat, vegetable, and seafood), excluding tomato-based sauces and sauces comprised of 20% or more meat
2013 3,116,740 1.0 482,946 474,385 482,253 482,087
3119417 Mayonnaise, salad dressings, and sandwich spreads 2014 5,944,309 0.9 354,135 352,554 59,208 59,205 3119417 Mayonnaise, salad dressings, and sandwich spreads 2013 5,882,523 0.4 304,551 300,711 71,357 71,357 311941W Mayonnaise, dressings, and other prepared sauces, nsk, total 2014 199,272 8.4 N N N N 311941W Mayonnaise, dressings, and other prepared sauces, nsk, total 2013 202,764 1.0 N N N N311942 Spices and extracts 2014 10,366,904 1.2 559,254 513,111 1,402,030 1,402,039311942 Spices and extracts 2013 10,015,094 1.0 540,222 492,645 1,292,186 1,292,173 3119421 Table salt (evaporated), pepper (white and black), and other spices 2014 3,153,910 3.0 420,531 374,432 1,388,724 1,388,733 3119421 Table salt (evaporated), pepper (white and black), and other spices 2013 2,900,510 0.7 406,303 358,813 1,275,474 1,275,461 3119426 Flavoring extracts, emulsions, and other liquid flavors and food colorings
(excluding synthetic)2014 3,455,419 1.5 138,723 138,679 13,306 13,306
3119426 Flavoring extracts, emulsions, and other liquid flavors and food colorings (excluding synthetic)
2013 3,450,072 0.8 133,919 133,832 16,712 16,712
3119427 Dry mix food preparations 2014 3,605,495 2.0 N N N N 3119427 Dry mix food preparations 2013 3,501,137 2.6 N N N N 311942W Spices and extracts, nsk, total 2014 152,080 2.6 N N N N 311942W Spices and extracts, nsk, total 2013 163,375 0.4 N N N N311991 Perishable prepared food 2014 11,602,328 1.5 54,302 53,426 86,111 86,111311991 Perishable prepared food 2013 10,730,013 0.3 59,741 58,968 85,664 85,658 3119910 Perishable prepared foods 2014 11,602,328 1.5 54,302 53,426 86,111 86,111 3119910 Perishable prepared foods 2013 10,730,013 0.3 59,741 58,968 85,664 85,658

Table
Page 22
NAICS-based Product Code Description Year
Value of Product
Shipments
Relative Standard Error
(%)
Total Export Value of Goods
Domestic Export Value
of Goods
General Import Value
of Goods
Consumption Import Value
of Goods
Manufacturing and International Trade Report: 2014 and 2013(1)In thousands of dollars. Values are based on manufacturing data from the 2014 Annual Survey of
Manufactures and administrative records from official U.S. import and export merchandise trade statistics. (1) Data for 2013 supersede the data that were previously published in the 2013 Manufacturing and International Trade Report.
311999 All other miscellaneous food 2014 12,515,323 1.7 4,820,900 4,727,056 3,643,448 3,649,144311999 All other miscellaneous food 2013 12,184,423 0.4 4,764,705 4,676,452 3,905,365 3,914,811 3119991 Desserts, ready-to-mix 2014 551,314 7.6 N N N N 3119991 Desserts, ready-to-mix 2013 579,144 0.1 N N N N 3119994 Sweetening syrups and molasses 2014 726,528 5.9 N N 232 232 3119994 Sweetening syrups and molasses 2013 648,169 3.0 N N 85 85 3119997 Baking powder and yeast 2014 584,695 2.7 114,366 103,396 287,879 287,671 3119997 Baking powder and yeast 2013 596,014 1.3 102,115 93,953 286,044 285,918 311999B Purchased macaroni and noodle products, packaged with other purchased
ingredients2014 120,524 7.6 659 601 36,250 36,250
311999B Purchased macaroni and noodle products, packaged with other purchased ingredients
2013 169,775 0.2 734 621 44,538 44,538
311999G Processed eggs (dried, frozen, liquid, whole, etc.) 2014 3,804,518 1.6 138,895 138,185 29,913 29,913 311999G Processed eggs (dried, frozen, liquid, whole, etc.) 2013 3,504,610 1.0 159,478 151,251 25,274 25,274 311999J Flavoring powders, tablets, and paste (including dry mix cocktails) 2014 2,085,872 2.2 N N N N 311999J Flavoring powders, tablets, and paste (including dry mix cocktails) 2013 2,249,895 0.9 N N N N 311999P Other food preparations (such as canned pudding, frosting, coconut, honey,
Chinese noodles, pectin, unpopped popcorn, and cracker sandwiches)2014 4,135,936 4.6 4,566,980 4,484,874 3,289,173 3,295,077
311999P Other food preparations (such as canned pudding, frosting, coconut, honey, Chinese noodles, pectin, unpopped popcorn, and cracker sandwiches)
2013 3,938,071 0.6 4,502,379 4,430,627 3,549,423 3,558,995
311999W All other miscellaneous food, nsk, total 2014 505,937 1.6 N N N N 311999W All other miscellaneous food, nsk, total 2013 498,747 0.1 N N N N312111 Soft drinks 2014 34,129,127 0.8 1,029,392 1,023,619 2,333,807 2,333,782312111 Soft drinks 2013 36,683,528 0.4 980,477 975,939 2,189,843 2,189,774 3121112 Soft drinks, bottled, canned, glass, plastic, carbonated 2014 21,400,805 1.1 150,499 149,031 1,686,751 1,686,731 3121112 Soft drinks, bottled, canned, glass, plastic, carbonated 2013 23,233,525 0.3 223,993 222,483 1,577,846 1,577,779 312111A Soft drinks, non-carbonated 2014 11,894,303 1.3 878,893 874,588 647,056 647,051 312111A Soft drinks, non-carbonated 2013 12,591,659 0.9 756,484 753,456 611,997 611,995 312111W Soft drinks, nsk, total 2014 834,019 4.2 N N N N 312111W Soft drinks, nsk, total 2013 858,344 0.0 N N N N

Table
Page 23
NAICS-based Product Code Description Year
Value of Product
Shipments
Relative Standard Error
(%)
Total Export Value of Goods
Domestic Export Value
of Goods
General Import Value
of Goods
Consumption Import Value
of Goods
Manufacturing and International Trade Report: 2014 and 2013(1)In thousands of dollars. Values are based on manufacturing data from the 2014 Annual Survey of
Manufactures and administrative records from official U.S. import and export merchandise trade statistics. (1) Data for 2013 supersede the data that were previously published in the 2013 Manufacturing and International Trade Report.
312112 Bottled water 2014 6,608,450 1.2 68,127 61,518 308,820 308,705312112 Bottled water 2013 7,322,378 1.0 85,697 80,720 275,920 275,885 3121120 Bottled water 2014 6,608,450 1.2 68,127 61,518 308,820 308,705 3121120 Bottled water 2013 7,322,378 1.0 85,697 80,720 275,920 275,885312113 Ice 2014 696,918 5.0 66,244 65,544 118,277 118,252312113 Ice 2013 694,613 3.6 38,798 38,087 105,555 105,552 3121130 Ice, manufactured (cubed, crushed, etc.), including can or block 2014 696,918 5.0 66,244 65,544 118,277 118,252 3121130 Ice, manufactured (cubed, crushed, etc.), including can or block 2013 694,613 3.6 38,798 38,087 105,555 105,552312120 Brewery products 2014 34,184,520 0.6 3,512,535 3,508,572 4,257,359 4,231,351312120 Brewery products 2013 31,327,056 0.1 3,476,582 3,473,477 3,831,888 3,805,962 3121201 Beer and ale, canned, case goods 2014 15,462,276 0.1 N N N N 3121201 Beer and ale, canned, case goods 2013 15,244,593 0.1 N N N N 3121204 Beer and ale, bottled, case goods, all sizes 2014 12,173,439 1.5 N N 3,074,381 3,061,672 3121204 Beer and ale, bottled, case goods, all sizes 2013 11,624,810 0.3 N N 2,806,568 2,795,161 3121207 Beer and ale, barrels and kegs 2014 3,498,133 2.2 N N N N 3121207 Beer and ale, barrels and kegs 2013 3,035,627 0.5 N N N N 3121209 All other malt beverages and brewing products 2014 587,842 3.1 2,970,642 2,970,490 113,201 113,134 3121209 All other malt beverages and brewing products 2013 573,414 3.6 2,956,108 2,955,925 122,416 122,360 312120W Brewery products, nsk, total 2014 2,462,831 0.2 N N N N 312120W Brewery products, nsk, total 2013 848,611 0.2 N N N N 312120X Undistributed brewery products 2014 N X 541,893 538,082 1,069,776 1,056,545 312120X Undistributed brewery products 2013 N X 520,474 517,551 902,903 888,441312130 Winery products 2014 16,420,852 0.9 1,787,657 1,586,661 6,631,760 6,410,964312130 Winery products 2013 14,985,882 0.7 1,756,175 1,609,306 6,385,383 6,198,846 3121300 Wines, brandy, and brandy spirits 2014 16,420,852 0.9 1,787,657 1,586,661 6,631,760 6,410,964 3121300 Wines, brandy, and brandy spirits 2013 14,985,882 0.7 1,756,175 1,609,306 6,385,383 6,198,846

Table
Page 24
NAICS-based Product Code Description Year
Value of Product
Shipments
Relative Standard Error
(%)
Total Export Value of Goods
Domestic Export Value
of Goods
General Import Value
of Goods
Consumption Import Value
of Goods
Manufacturing and International Trade Report: 2014 and 2013(1)In thousands of dollars. Values are based on manufacturing data from the 2014 Annual Survey of
Manufactures and administrative records from official U.S. import and export merchandise trade statistics. (1) Data for 2013 supersede the data that were previously published in the 2013 Manufacturing and International Trade Report.
312140 Distillery products 2014 14,894,321 1.2 1,828,912 1,512,308 6,023,618 5,676,663312140 Distillery products 2013 14,977,098 0.6 1,810,115 1,480,924 5,999,473 5,597,509 3121402 Distilled liquor, excluding brandy, including distiller's dried grains 2014 7,136,853 0.7 N N N N 3121402 Distilled liquor, excluding brandy, including distiller's dried grains 2013 7,522,126 0.2 N N N N 3121404 Bottled liquor, excluding brandy 2014 7,493,042 2.2 32,457 31,659 N N 3121404 Bottled liquor, excluding brandy 2013 7,211,007 1.2 28,371 25,950 N N 312140W Distillery products, nsk, total 2014 264,426 0.1 N N N N 312140W Distillery products, nsk, total 2013 243,965 7.3 N N N N 312140X Undistributed distillery products 2014 N X 1,796,454 1,480,649 6,023,618 5,676,663 312140X Undistributed distillery products 2013 N X 1,781,743 1,454,974 5,999,473 5,597,509312230 Tobacco products 2014 35,857,308 0.3 667,587 426,879 1,226,644 972,499312230 Tobacco products 2013 38,909,978 0.1 696,495 485,412 1,188,408 914,200 3122301 Tobacco, unstemmed leaf, redried before packing 2014 703,902 0.0 N N N N 3122301 Tobacco, unstemmed leaf, redried before packing 2013 711,459 0.0 N N N N 3122303 Tobacco, stemmed 2014 718,910 1.3 N N N N 3122303 Tobacco, stemmed 2013 641,856 0.0 N N N N 3122305 Cigarettes, including nontobacco 2014 29,207,716 0.4 505,610 273,914 403,656 157,645 3122305 Cigarettes, including nontobacco 2013 31,332,594 0.0 493,639 288,418 411,096 147,095 3122306 Cigars 2014 925,128 5.6 39,210 36,306 740,434 737,500 3122306 Cigars 2013 944,512 0.0 44,382 43,107 703,184 699,521 3122307 Smoking and chewing tobacco 2014 3,982,070 0.2 51,570 45,626 45,946 43,862 3122307 Smoking and chewing tobacco 2013 4,942,061 0.0 83,920 79,503 39,634 37,048 3122309 Reconstituted tobacco, processed sheet and homogenized 2014 241,613 0.0 55,753 55,732 29,966 29,487 3122309 Reconstituted tobacco, processed sheet and homogenized 2013 258,925 0.0 61,724 61,645 25,258 25,404 312230W Tobacco products, nsk, total 2014 77,969 0.0 N N N N 312230W Tobacco products, nsk, total 2013 78,571 3.6 N N N N 312230X Undistributed tobacco products 2014 N X 15,444 15,301 6,643 4,004 312230X Undistributed tobacco products 2013 N X 12,830 12,739 9,237 5,131

Table
Page 25
NAICS-based Product Code Description Year
Value of Product
Shipments
Relative Standard Error
(%)
Total Export Value of Goods
Domestic Export Value
of Goods
General Import Value
of Goods
Consumption Import Value
of Goods
Manufacturing and International Trade Report: 2014 and 2013(1)In thousands of dollars. Values are based on manufacturing data from the 2014 Annual Survey of
Manufactures and administrative records from official U.S. import and export merchandise trade statistics. (1) Data for 2013 supersede the data that were previously published in the 2013 Manufacturing and International Trade Report.
313110 Fiber, yarn, and thread mill products 2014 8,072,519 0.7 2,260,991 2,220,717 781,510 780,837313110 Fiber, yarn, and thread mill products 2013 7,961,876 0.6 2,141,246 2,112,756 789,270 789,106 3131101 Yarns, spun, carded, cotton 2014 2,137,787 1.4 1,044,220 1,037,260 87,957 87,497 3131101 Yarns, spun, carded, cotton 2013 2,027,868 0.9 1,042,295 1,039,675 84,205 84,151 3131103 Yarns, spun, combed, cotton 2014 224,772 6.3 336,412 335,381 80,653 80,521 3131103 Yarns, spun, combed, cotton 2013 240,775 5.0 312,794 312,470 78,061 78,061 3131105 Yarns, spun, rayon, acetate, and lyocell 2014 52,662 5.1 N N N N 3131105 Yarns, spun, rayon, acetate, and lyocell 2013 54,418 4.9 N N N N 3131107 Yarns, spun, noncellulosic fiber and other natural fibers 2014 1,746,608 2.8 521,159 514,644 382,924 382,855 3131107 Yarns, spun, noncellulosic fiber and other natural fibers 2013 1,768,045 1.9 458,219 452,270 399,368 399,314 3131109 Yarns, wool, including new, reused, and reprocessed 2014 155,674 0.1 8,097 7,583 75,592 75,592 3131109 Yarns, wool, including new, reused, and reprocessed 2013 156,865 0.4 7,720 7,416 68,734 68,734 313110B Scouring and combing mill products 2014 D S 19,789 11,637 43,134 43,134 313110B Scouring and combing mill products 2013 7,446 0.0 23,184 18,932 47,902 47,902 313110D Yarns, novelty and plied, excluding wool, not spun or thrown at the same
establishment2014 142,721 3.4 N N N N
313110D Yarns, novelty and plied, excluding wool, not spun or thrown at the same establishment
2013 164,661 0.0 N N N N
313110F Yarns, thrown, filament, excluding textured (report yarns that are both thrown and textured as texture yarns)
2014 436,131 0.3 N N N N
313110F Yarns, thrown, filament, excluding textured (report yarns that are both thrown and textured as texture yarns)
2013 400,531 0.4 N N N N
313110H Yarns, textured, crimped, and bulked, filament, including stretch, made from purchased filament yarn
2014 2,688,309 0.3 N N N N
313110H Yarns, textured, crimped, and bulked, filament, including stretch, made from purchased filament yarn
2013 2,720,855 1.1 N N N N
313110J Yarns, filament, commission receipts for throwing, texturing, or winding 2014 61,931 0.0 N N N N 313110J Yarns, filament, commission receipts for throwing, texturing, or winding 2013 60,525 0.0 N N N N 313110L Thread mills 2014 272,371 0.8 159,891 148,658 55,626 55,624 313110L Thread mills 2013 255,197 0.1 138,399 129,510 57,273 57,219 313110W Fiber, yarn, and thread mill products, nsk, total 2014 D S N N N N 313110W Fiber, yarn, and thread mill products, nsk, total 2013 104,691 0.0 N N N N 313110X Undistributed fiber, yarn, and thread mill products 2014 N X 171,423 165,553 55,623 55,614 313110X Undistributed fiber, yarn, and thread mill products 2013 N X 158,635 152,484 53,729 53,726
Table
Page 26
NAICS-based Product Code Description Year
Value of Product
Shipments
Relative Standard Error
(%)
Total Export Value of Goods
Domestic Export Value
of Goods
General Import Value
of Goods
Consumption Import Value
of Goods
Manufacturing and International Trade Report: 2014 and 2013(1)In thousands of dollars. Values are based on manufacturing data from the 2014 Annual Survey of
Manufactures and administrative records from official U.S. import and export merchandise trade statistics. (1) Data for 2013 supersede the data that were previously published in the 2013 Manufacturing and International Trade Report.
313210 Broadwoven fabric mill products 2014 4,118,603 1.7 2,139,505 1,946,696 3,192,690 3,171,345313210 Broadwoven fabric mill products 2013 3,936,303 0.7 2,059,346 1,868,949 3,109,860 3,095,168 3132101 Broadwoven fabrics, cotton, plain weave (excluding pile), gray goods 2014 241,467 19.1 12,144 10,336 52,451 52,400 3132101 Broadwoven fabrics, cotton, plain weave (excluding pile), gray goods 2013 181,374 0.1 14,473 12,868 53,175 53,175 3132103 Broadwoven fabrics, cotton, twill weave (excluding pile), gray goods 2014 287,007 0.6 7,959 7,878 14,434 14,434 3132103 Broadwoven fabrics, cotton, twill weave (excluding pile), gray goods 2013 268,575 0.0 8,099 8,028 15,003 15,003 3132105 Broadwoven fabrics, cotton, all other weaves (excluding plain, twill, or pile),
gray goods2014 74,688 0.0 N N 21,516 21,516
3132105 Broadwoven fabrics, cotton, all other weaves (excluding plain, twill, or pile), gray goods
2013 72,682 0.0 N N 25,832 25,832
3132107 Broadwoven fabrics, cotton, pile, gray goods 2014 D S N N N N 3132107 Broadwoven fabrics, cotton, pile, gray goods 2013 1,990 0.0 N N N N 3132109 Broadwoven fabrics, cotton, finished in weaving mills 2014 132,502 10.3 561,422 515,543 587,994 585,138 3132109 Broadwoven fabrics, cotton, finished in weaving mills 2013 182,810 0.4 500,235 455,747 589,045 588,735 313210D Fabricated textile products, made in weaving mills 2014 97,377 37.2 N N 49,258 49,234 313210D Fabricated textile products, made in weaving mills 2013 108,246 6.6 N N 32,772 32,771 313210E Broadwoven fabrics, manmade fiber, 85 percent or more filament yarns
(chiefly rayon, acetate, and/or lyocell), gray goods2014 122,478 0.0 N N 3,570 3,570
313210E Broadwoven fabrics, manmade fiber, 85 percent or more filament yarns (chiefly rayon, acetate, and/or lyocell), gray goods
2013 95,128 2.5 N N 2,354 2,354
313210G Broadwoven fabrics, manmade fiber, 85 percent or more filament yarns (excluding rayon, acetate, and lyocell), gray goods
2014 1,028,827 1.1 N N N N
313210G Broadwoven fabrics, manmade fiber, 85 percent or more filament yarns (excluding rayon, acetate, and lyocell), gray goods
2013 945,984 0.9 N N N N
313210H Broadwoven fabrics, manmade fiber, plain weave (excluding pile), 85 percent or more spun yarns (excluding wool blends), gray goods
2014 331,941 1.0 N N 3,423 3,423
313210H Broadwoven fabrics, manmade fiber, plain weave (excluding pile), 85 percent or more spun yarns (excluding wool blends), gray goods
2013 312,102 0.6 N N 1,731 1,731

Table
Page 27
NAICS-based Product Code Description Year
Value of Product
Shipments
Relative Standard Error
(%)
Total Export Value of Goods
Domestic Export Value
of Goods
General Import Value
of Goods
Consumption Import Value
of Goods
Manufacturing and International Trade Report: 2014 and 2013(1)In thousands of dollars. Values are based on manufacturing data from the 2014 Annual Survey of
Manufactures and administrative records from official U.S. import and export merchandise trade statistics. (1) Data for 2013 supersede the data that were previously published in the 2013 Manufacturing and International Trade Report.
313210J Broadwoven fabrics, manmade fiber, twill weave (excluding pile), 85 percent or more spun yarns (excluding wool blends), gray goods
2014 221,034 6.5 N N 3,088 3,088
313210J Broadwoven fabrics, manmade fiber, twill weave (excluding pile), 85 percent or more spun yarns (excluding wool blends), gray goods
2013 183,119 0.0 N N 3,636 3,636
313210L Broadwoven fabrics, manmade fiber, all other weaves (excluding plain, twill, and pile), 85 percent or more spun yarn (excluding wool blends), gray goods
2014 109,187 20.2 N N N N
313210L Broadwoven fabrics, manmade fiber, all other weaves (excluding plain, twill, and pile), 85 percent or more spun yarn (excluding wool blends), gray goods
2013 121,786 0.3 N N N N
313210M Broadwoven fabrics, manmade and natural fibers, combinations of spun and filament yarns, each less than 85 percent of total fiber content (excluding wool blends), gray goods
2014 154,434 0.3 1,289 1,216 49,079 49,082
313210M Broadwoven fabrics, manmade and natural fibers, combinations of spun and filament yarns, each less than 85 percent of total fiber content (excluding wool blends), gray goods
2013 148,119 0.9 2,047 1,948 50,382 50,382
313210N Broadwoven fabrics, manmade and natural fibers, including silk (excluding cotton), all other weaves (including pile), gray goods
2014 8,516 2.7 2,604 2,190 582 582
313210N Broadwoven fabrics, manmade and natural fibers, including silk (excluding cotton), all other weaves (including pile), gray goods
2013 37,683 0.0 3,268 2,724 517 517
313210P Broadwoven fabrics, manmade and natural fibers, including silk (excluding cotton and wool), finished in weaving mills
2014 1,056,441 2.1 150,624 123,302 134,245 131,741
313210P Broadwoven fabrics, manmade and natural fibers, including silk (excluding cotton and wool), finished in weaving mills
2013 1,003,376 2.1 165,019 141,957 121,865 118,587
313210T Broadwoven fabrics, wool, gray goods 2014 57,429 0.0 N N N N 313210T Broadwoven fabrics, wool, gray goods 2013 63,357 0.0 N N N N 313210U Broadwoven fabrics, including felts, wool, finished in weaving mills 2014 35,044 0.0 N N N N 313210U Broadwoven fabrics, including felts, wool, finished in weaving mills 2013 35,439 0.0 N N N N 313210W Broadwoven fabric mill products, nsk, total 2014 D S N N N N 313210W Broadwoven fabric mill products, nsk, total 2013 174,533 5.7 N N N N 313210X Undistributed broadwoven fabric mill products 2014 N X 1,403,463 1,286,231 2,273,051 2,257,138 313210X Undistributed broadwoven fabric mill products 2013 N X 1,366,205 1,245,677 2,213,548 2,202,444

Table
Page 28
NAICS-based Product Code Description Year
Value of Product
Shipments
Relative Standard Error
(%)
Total Export Value of Goods
Domestic Export Value
of Goods
General Import Value
of Goods
Consumption Import Value
of Goods
Manufacturing and International Trade Report: 2014 and 2013(1)In thousands of dollars. Values are based on manufacturing data from the 2014 Annual Survey of
Manufactures and administrative records from official U.S. import and export merchandise trade statistics. (1) Data for 2013 supersede the data that were previously published in the 2013 Manufacturing and International Trade Report.
313220 Narrow fabric mill and Schiffli machine embroidery products 2014 994,550 1.5 967,048 868,391 890,822 887,987313220 Narrow fabric mill and Schiffli machine embroidery products 2013 1,007,444 1.1 908,817 822,337 834,624 829,599 3132201 Narrow fabrics (12 inches or less in width), woven 2014 558,175 2.7 552,344 508,002 454,775 454,925 3132201 Narrow fabrics (12 inches or less in width), woven 2013 586,601 1.6 512,443 477,207 431,070 427,457 3132203 Narrow fabrics (12 inches or less in width), braided 2014 285,283 0.9 55,632 51,146 21,573 21,674 3132203 Narrow fabrics (12 inches or less in width), braided 2013 271,442 1.9 58,215 55,081 22,777 22,469 3132205 Covered rubber thread, made in narrow fabric mills 2014 D S 12,760 10,833 11,039 11,022 3132205 Covered rubber thread, made in narrow fabric mills 2013 D S 17,558 16,616 10,265 10,254 3132207 Schiffli machine embroideries 2014 43,690 4.5 N N N N 3132207 Schiffli machine embroideries 2013 48,515 1.4 N N N N 313220W Narrow fabric mill and Schiffli machine embroidery products, nsk, total 2014 D S N N N N 313220W Narrow fabric mill and Schiffli machine embroidery products, nsk, total 2013 D S N N N N 313220X Undistributed narrow fabric mill and Schiffli machine embroidery products 2014 N X 346,311 298,410 403,435 400,366 313220X Undistributed narrow fabric mill and Schiffli machine embroidery products 2013 N X 320,601 273,434 370,512 369,419313230 Nonwoven fabric mill products 2014 8,309,460 1.3 2,230,203 2,092,862 1,223,765 1,220,112313230 Nonwoven fabric mill products 2013 8,537,007 0.3 2,197,878 2,072,199 1,125,926 1,124,803 3132301 Nonwoven fabrics 2014 6,448,605 1.1 1,960,407 1,885,856 1,133,473 1,130,308 3132301 Nonwoven fabrics 2013 6,737,740 0.1 1,925,517 1,861,017 1,043,001 1,042,134 3132303 Fabricated nonwoven products 2014 1,310,794 5.5 149,378 89,622 9,840 9,840 3132303 Fabricated nonwoven products 2013 1,260,762 1.0 159,660 100,859 7,006 7,006 3132305 Pressed, punched, or needled felts (excluding hats) 2014 446,948 9.8 120,418 117,384 80,452 79,964 3132305 Pressed, punched, or needled felts (excluding hats) 2013 428,376 5.6 112,701 110,322 75,919 75,663 313230W Nonwoven fabric mill products, nsk, total 2014 103,112 0.7 N N N N 313230W Nonwoven fabric mill products, nsk, total 2013 110,129 5.5 N N N N

Table
Page 29
NAICS-based Product Code Description Year
Value of Product
Shipments
Relative Standard Error
(%)
Total Export Value of Goods
Domestic Export Value
of Goods
General Import Value
of Goods
Consumption Import Value
of Goods
Manufacturing and International Trade Report: 2014 and 2013(1)In thousands of dollars. Values are based on manufacturing data from the 2014 Annual Survey of
Manufactures and administrative records from official U.S. import and export merchandise trade statistics. (1) Data for 2013 supersede the data that were previously published in the 2013 Manufacturing and International Trade Report.
313240 Knit fabric mill products 2014 1,499,155 1.2 1,088,725 1,030,942 1,099,465 1,085,490313240 Knit fabric mill products 2013 1,421,409 2.8 1,109,896 1,055,096 1,007,057 992,170 3132401 Weft (circular) knit fabrics, greige goods (excluding hosiery) 2014 252,194 4.6 N N N N 3132401 Weft (circular) knit fabrics, greige goods (excluding hosiery) 2013 349,964 8.8 N N N N 3132403 Weft (circular) knit fabrics, knit and finished in the same establishment
(excluding hosiery)2014 435,266 2.5 N N N N
3132403 Weft (circular) knit fabrics, knit and finished in the same establishment (excluding hosiery)
2013 379,026 0.6 N N N N
3132405 Weft (circular) knit fabrics, nonapparel-type, knitting only or knitting and finishing (excluding hosiery) on contract or commission
2014 33,324 0.0 N N N N
3132405 Weft (circular) knit fabrics, nonapparel-type, knitting only or knitting and finishing (excluding hosiery) on contract or commission
2013 31,697 1.9 N N N N
3132407 Warp knit fabrics, greige goods 2014 167,437 0.9 N N N N 3132407 Warp knit fabrics, greige goods 2013 109,461 23.4 N N N N 3132409 Warp knit fabrics, knit and finished in same establishment 2014 425,755 1.5 N N N N 3132409 Warp knit fabrics, knit and finished in same establishment 2013 387,710 0.4 N N N N 313240B Lace and net goods, all leavers and Nottingham lace machine products,
including bobbinets and barmen laces (excluding raschel lace machine products and burned-out laces)
2014 22,572 5.2 29,972 27,375 36,956 36,956
313240B Lace and net goods, all leavers and Nottingham lace machine products, including bobbinets and barmen laces (excluding raschel lace machine products and burned-out laces)
2013 30,041 0.0 34,385 32,084 43,043 43,043
313240D Warp knit fabrics, lace and net goods, contract and commission receipts for knitting only or knitting and finishing
2014 58,100 1.7 N N N N
313240D Warp knit fabrics, lace and net goods, contract and commission receipts for knitting only or knitting and finishing
2013 49,204 7.8 N N N N
313240F Other nonapparel warp knit end products (including knitted towels and washcloths), excluding fabrics, lace, and net goods
2014 12,672 0.0 N N N N
313240F Other nonapparel warp knit end products (including knitted towels and washcloths), excluding fabrics, lace, and net goods
2013 9,911 0.0 N N N N
313240W Knit fabric mill products, nsk, total 2014 91,835 2.6 N N N N 313240W Knit fabric mill products, nsk, total 2013 74,396 0.0 N N N N 313240X Undistributed knit fabric mill products 2014 N X 1,058,753 1,003,567 1,062,509 1,048,534 313240X Undistributed knit fabric mill products 2013 N X 1,075,511 1,023,012 964,014 949,127

Table
Page 30
NAICS-based Product Code Description Year
Value of Product
Shipments
Relative Standard Error
(%)
Total Export Value of Goods
Domestic Export Value
of Goods
General Import Value
of Goods
Consumption Import Value
of Goods
Manufacturing and International Trade Report: 2014 and 2013(1)In thousands of dollars. Values are based on manufacturing data from the 2014 Annual Survey of
Manufactures and administrative records from official U.S. import and export merchandise trade statistics. (1) Data for 2013 supersede the data that were previously published in the 2013 Manufacturing and International Trade Report.
313310 Textile and fabric finishing mill products 2014 5,772,181 4.0 N N N N313310 Textile and fabric finishing mill products 2013 5,597,878 1.9 N N N N 3133101 Broadwoven fabrics, cotton, finished in finishing mills 2014 708,907 4.5 N N N N 3133101 Broadwoven fabrics, cotton, finished in finishing mills 2013 704,003 2.1 N N N N 3133103 Broadwoven fabrics, cotton, print cloth, job or commission finishing 2014 500,324 6.2 N N N N 3133103 Broadwoven fabrics, cotton, print cloth, job or commission finishing 2013 470,056 1.4 N N N N 3133105 Broadwoven fabrics, manmade and natural fibers, including silk (excluding
cotton and wool), finished in finishing mills2014 1,077,961 3.8 N N N N
3133105 Broadwoven fabrics, manmade and natural fibers, including silk (excluding cotton and wool), finished in finishing mills
2013 1,117,296 1.7 N N N N
3133107 Broadwoven fabrics, job or commission finishing, all other fabrics (excluding cotton), including combinations of spun yarn and filament, and blends
2014 881,737 6.7 N N N N
3133107 Broadwoven fabrics, job or commission finishing, all other fabrics (excluding cotton), including combinations of spun yarn and filament, and blends
2013 678,750 4.2 N N N N
3133109 Broadwoven fabrics, finished, wool (including felts), not finished in weaving 2014 7,424 6.2 N N N N 3133109 Broadwoven fabrics, finished, wool (including felts), not finished in weaving 2013 12,037 3.2 N N N N 313310B Finished fabrics (excluding broadwoven) and other finished textiles 2014 2,009,858 10.6 N N N N 313310B Finished fabrics (excluding broadwoven) and other finished textiles 2013 2,037,081 4.9 N N N N 313310W Textile and fabric finishing mill products, nsk, total 2014 585,969 6.7 N N N N 313310W Textile and fabric finishing mill products, nsk, total 2013 578,655 2.3 N N N N313320 Fabric coating mill products 2014 2,660,840 1.5 1,337,721 1,226,045 1,270,353 1,264,824313320 Fabric coating mill products 2013 2,579,345 0.5 1,231,005 1,124,015 1,174,409 1,169,123 3133201 Vinyl coated fabrics, including expanded vinyl coated 2014 596,631 1.4 149,151 121,857 435,867 434,558 3133201 Vinyl coated fabrics, including expanded vinyl coated 2013 574,078 0.1 171,853 135,489 418,373 416,734 3133204 Rubber coated fabrics, garment and footwear 2014 195,328 11.8 266,005 243,811 209,818 209,952 3133204 Rubber coated fabrics, garment and footwear 2013 213,670 0.6 253,758 236,118 195,782 195,901 3133205 Coated or laminated fabrics and coated yarns, including impregnated fabrics 2014 1,800,586 1.7 499,247 452,035 416,430 413,681 3133205 Coated or laminated fabrics and coated yarns, including impregnated fabrics 2013 1,702,142 0.8 436,568 397,757 366,198 362,775 313320W Fabric coating mill products, nsk, total 2014 68,295 4.6 N N N N 313320W Fabric coating mill products, nsk, total 2013 89,455 0.0 N N N N 313320X Undistributed fabric coating mill products 2014 N X 423,317 408,341 208,237 206,632 313320X Undistributed fabric coating mill products 2013 N X 368,826 354,651 194,055 193,713

Table
Page 31
NAICS-based Product Code Description Year
Value of Product
Shipments
Relative Standard Error
(%)
Total Export Value of Goods
Domestic Export Value
of Goods
General Import Value
of Goods
Consumption Import Value
of Goods
Manufacturing and International Trade Report: 2014 and 2013(1)In thousands of dollars. Values are based on manufacturing data from the 2014 Annual Survey of
Manufactures and administrative records from official U.S. import and export merchandise trade statistics. (1) Data for 2013 supersede the data that were previously published in the 2013 Manufacturing and International Trade Report.
314110 Carpet and rug mill products 2014 9,264,733 1.0 1,118,767 1,059,708 2,453,621 2,438,702314110 Carpet and rug mill products 2013 9,306,567 0.2 1,125,050 1,071,410 2,171,580 2,154,268 3141101 Carpet and rugs, woven, made or finished at this plant 2014 432,535 6.1 84,103 64,212 632,670 628,040 3141101 Carpet and rugs, woven, made or finished at this plant 2013 417,764 1.0 84,436 66,682 567,616 561,715 3141103 Carpet and rugs, tufted 2014 8,256,505 1.1 923,952 900,496 1,168,250 1,158,809 3141103 Carpet and rugs, tufted 2013 8,356,150 0.2 905,699 884,829 1,032,866 1,022,849 3141105 Other carpet, rugs, and mats 2014 348,604 3.1 110,712 95,000 632,448 631,613 3141105 Other carpet, rugs, and mats 2013 338,927 2.1 134,915 119,899 548,343 547,014 314110W Carpet and rug mill products, nsk, total 2014 227,088 0.1 N N N N 314110W Carpet and rug mill products, nsk, total 2013 193,727 0.0 N N N N 314110X Undistributed carpet and rug mill products 2014 N X N N 20,253 20,241 314110X Undistributed carpet and rug mill products 2013 N X N N 22,755 22,689314120 Curtain and linen mill products 2014 3,864,169 2.9 775,660 610,090 11,086,762 11,041,174314120 Curtain and linen mill products 2013 3,521,698 1.8 751,174 593,005 10,840,160 10,781,538 3141201 Curtains and draperies 2014 806,770 4.8 135,317 120,713 714,142 712,980 3141201 Curtains and draperies 2013 782,826 1.6 125,379 113,864 750,821 748,449 3141203 Bedspreads, made from purchased materials 2014 152,751 11.0 4,377 2,963 79,090 79,012 3141203 Bedspreads, made from purchased materials 2013 134,994 3.6 4,280 2,907 83,243 82,736 3141205 Sheets and pillowcases, made from purchased materials 2014 202,787 7.5 49,124 28,736 2,611,999 2,602,840 3141205 Sheets and pillowcases, made from purchased materials 2013 178,714 0.8 47,276 26,688 2,575,542 2,565,745 3141207 Towels and washcloths, made from purchased materials 2014 60,699 0.5 51,172 35,837 2,108,839 2,091,946 3141207 Towels and washcloths, made from purchased materials 2013 41,994 9.2 48,611 33,509 2,041,302 2,024,601 3141209 Other household furnishings, made from purchased materials 2014 2,407,053 3.8 306,032 251,620 3,852,850 3,842,122 3141209 Other household furnishings, made from purchased materials 2013 2,189,537 2.8 292,649 243,326 3,659,805 3,637,707 314120W Curtain and linen mill products, nsk, total 2014 234,109 17.1 N N N N 314120W Curtain and linen mill products, nsk, total 2013 193,635 1.6 N N N N 314120X Undistributed curtain and linen mill products 2014 N X 229,637 170,220 1,719,843 1,712,273 314120X Undistributed curtain and linen mill products 2013 N X 232,978 172,710 1,729,448 1,722,301

Table
Page 32
NAICS-based Product Code Description Year
Value of Product
Shipments
Relative Standard Error
(%)
Total Export Value of Goods
Domestic Export Value
of Goods
General Import Value
of Goods
Consumption Import Value
of Goods
Manufacturing and International Trade Report: 2014 and 2013(1)In thousands of dollars. Values are based on manufacturing data from the 2014 Annual Survey of
Manufactures and administrative records from official U.S. import and export merchandise trade statistics. (1) Data for 2013 supersede the data that were previously published in the 2013 Manufacturing and International Trade Report.
314910 Textile bag and canvas mill products 2014 3,243,818 5.3 223,237 193,974 1,804,077 1,803,891314910 Textile bag and canvas mill products 2013 2,736,452 1.4 216,281 190,684 1,762,989 1,753,518 3149101 Textile bags 2014 600,192 7.8 98,883 81,486 1,254,789 1,254,858 3149101 Textile bags 2013 500,572 5.6 100,757 86,990 1,238,801 1,235,607 3149105 Canvas and related products 2014 2,506,833 6.7 118,102 106,521 519,854 519,601 3149105 Canvas and related products 2013 2,144,487 1.2 111,777 100,291 501,056 494,791 314910W Textile bag and canvas mill products, nsk, total 2014 136,794 5.2 N N N N 314910W Textile bag and canvas mill products, nsk, total 2013 91,393 0.2 N N N N 314910X Undistributed textile bag and canvas mill products 2014 N X 6,252 5,967 29,434 29,432 314910X Undistributed textile bag and canvas mill products 2013 N X 3,747 3,404 23,132 23,120314994 Rope, cordage, twine, tire cord, and tire fabric mill products 2014 1,892,427 2.3 340,628 317,990 1,166,455 1,170,018314994 Rope, cordage, twine, tire cord, and tire fabric mill products 2013 1,944,048 1.4 335,509 290,232 1,143,022 1,112,699 3149941 Cordage and twine, hard fiber 2014 159,382 15.7 6,607 5,850 69,990 69,982 3149941 Cordage and twine, hard fiber 2013 134,662 6.2 11,717 10,259 59,679 59,653 3149943 Cordage and twine, soft fiber, excluding cotton 2014 493,129 7.3 197,577 180,054 454,474 450,592 3149943 Cordage and twine, soft fiber, excluding cotton 2013 592,610 4.4 183,707 164,048 458,510 455,805 3149945 Cordage and twine, cotton 2014 25,207 4.5 N N 23,874 23,859 3149945 Cordage and twine, cotton 2013 18,573 4.7 N N 19,111 19,094 3149947 Tire cord and tire fabrics 2014 1,190,018 0.2 119,812 117,412 595,879 603,345 3149947 Tire cord and tire fabrics 2013 1,166,754 0.2 128,897 105,527 586,812 559,252 314994W Rope, cordage, twine, tire cord, and tire fabric mill products, nsk, total 2014 24,692 18.7 N N N N 314994W Rope, cordage, twine, tire cord, and tire fabric mill products, nsk, total 2013 31,448 3.0 N N N N 314994X Undistributed rope, cordage, twine, tire cord, and tire fabric mill products 2014 N X 16,632 14,675 22,238 22,239 314994X Undistributed rope, cordage, twine, tire cord, and tire fabric mill products 2013 N X 11,188 10,397 18,909 18,894

Table
Page 33
NAICS-based Product Code Description Year
Value of Product
Shipments
Relative Standard Error
(%)
Total Export Value of Goods
Domestic Export Value
of Goods
General Import Value
of Goods
Consumption Import Value
of Goods
Manufacturing and International Trade Report: 2014 and 2013(1)In thousands of dollars. Values are based on manufacturing data from the 2014 Annual Survey of
Manufactures and administrative records from official U.S. import and export merchandise trade statistics. (1) Data for 2013 supersede the data that were previously published in the 2013 Manufacturing and International Trade Report.
314999 All other miscellaneous textile product mill products 2014 5,075,011 2.4 836,201 681,258 3,165,125 3,150,236314999 All other miscellaneous textile product mill products 2013 4,850,812 1.5 824,215 684,332 2,948,250 2,931,053 3149991 Recovered fibers, processed mill waste and related products 2014 118,311 9.9 24,308 23,630 57,625 57,623 3149991 Recovered fibers, processed mill waste and related products 2013 129,581 2.1 26,856 26,365 47,104 47,104 3149993 Paddings and upholstery filling, batting, and wadding (excluding foam rubber
and plastics)2014 278,904 8.3 133,237 122,616 177,104 177,029
3149993 Paddings and upholstery filling, batting, and wadding (excluding foam rubber and plastics)
2013 330,423 2.0 126,167 116,516 158,233 158,236
3149996 Embroideries (excluding Schiffli machine products) and embroidery 2014 1,008,608 4.5 10,681 6,271 122,801 122,784 3149996 Embroideries (excluding Schiffli machine products) and embroidery 2013 1,026,060 3.8 9,944 6,757 122,439 122,429 3149997 Trimmings and findings, excluding automobile and apparel 2014 30,374 15.4 19,192 18,087 27,518 27,517 3149997 Trimmings and findings, excluding automobile and apparel 2013 26,748 2.7 19,944 18,758 31,242 31,182 3149998 All other miscellaneous fabricated textile products 2014 2,832,286 2.9 648,783 510,653 2,780,078 2,765,283 3149998 All other miscellaneous fabricated textile products 2013 2,743,421 2.0 641,303 515,936 2,589,231 2,572,103 314999W All other miscellaneous textile product mill products, nsk, total 2014 806,529 8.5 N N N N 314999W All other miscellaneous textile product mill products, nsk, total 2013 594,581 5.1 N N N N

Table
Page 34
NAICS-based Product Code Description Year
Value of Product
Shipments
Relative Standard Error
(%)
Total Export Value of Goods
Domestic Export Value
of Goods
General Import Value
of Goods
Consumption Import Value
of Goods
Manufacturing and International Trade Report: 2014 and 2013(1)In thousands of dollars. Values are based on manufacturing data from the 2014 Annual Survey of
Manufactures and administrative records from official U.S. import and export merchandise trade statistics. (1) Data for 2013 supersede the data that were previously published in the 2013 Manufacturing and International Trade Report.
315110 Hosiery and sock mill products 2014 968,388 1.8 242,530 197,064 2,291,977 2,280,939315110 Hosiery and sock mill products 2013 959,830 0.3 235,706 192,480 2,202,566 2,199,571 3151101 Sheer hosiery, women's, misses', and girls', finished, full-length, knee-length,
and below the knee (excluding socks)2014 53,509 15.5 N N N N
3151101 Sheer hosiery, women's, misses', and girls', finished, full-length, knee-length, and below the knee (excluding socks)
2013 67,393 1.4 N N N N
3151103 Sheer pantyhose, including tights, women's, misses', and girls', finished, all needles
2014 126,165 10.9 52,659 49,226 291,616 291,534
3151103 Sheer pantyhose, including tights, women's, misses', and girls', finished, all needles
2013 138,793 1.1 51,209 47,441 295,820 295,729
3151105 Sheer hosiery, excluding socks, women's, misses', and girls', shipped in the 2014 16,370 2.4 N N N N 3151105 Sheer hosiery, excluding socks, women's, misses', and girls', shipped in the 2013 16,326 0.2 N N N N 3151107 Hosiery and socks, men's, finished, sizes 10 and up (excluding sheer) 2014 374,901 1.6 N N N N 3151107 Hosiery and socks, men's, finished, sizes 10 and up (excluding sheer) 2013 344,485 0.5 N N N N 3151109 Hosiery and socks, all other types, finished (excluding sheer) 2014 239,390 1.4 N N 72,123 71,912 3151109 Hosiery and socks, all other types, finished (excluding sheer) 2013 247,376 0.7 N N 77,106 77,114 315110B Socks and hosiery, excluding sheer, shipped in the greige 2014 90,145 0.3 N N N N 315110B Socks and hosiery, excluding sheer, shipped in the greige 2013 95,386 0.0 N N N N 315110W Hosiery and sock mill products, nsk, total 2014 67,908 0.5 N N N N 315110W Hosiery and sock mill products, nsk, total 2013 50,071 0.1 N N N N 315110X Undistributed hosiery and sock mill products 2014 N X 189,871 147,837 1,928,238 1,917,493 315110X Undistributed hosiery and sock mill products 2013 N X 184,497 145,040 1,829,640 1,826,729

Table
Page 35
NAICS-based Product Code Description Year
Value of Product
Shipments
Relative Standard Error
(%)
Total Export Value of Goods
Domestic Export Value
of Goods
General Import Value
of Goods
Consumption Import Value
of Goods
Manufacturing and International Trade Report: 2014 and 2013(1)In thousands of dollars. Values are based on manufacturing data from the 2014 Annual Survey of
Manufactures and administrative records from official U.S. import and export merchandise trade statistics. (1) Data for 2013 supersede the data that were previously published in the 2013 Manufacturing and International Trade Report.
315190 Other apparel knitting mill products 2014 417,903 2.3 166,152 118,904 800,124 797,851315190 Other apparel knitting mill products 2013 369,797 0.7 177,897 133,645 677,901 677,483 3151901 Sweaters, men's and boys', made in knitting mills 2014 9,791 0.0 N N N N 3151901 Sweaters, men's and boys', made in knitting mills 2013 10,672 0.0 N N N N 3151903 Sweaters, women's, girls', and infants', made in knitting mills 2014 62,955 4.2 N N N N 3151903 Sweaters, women's, girls', and infants', made in knitting mills 2013 69,615 0.0 N N N N 3151905 Shirts, dress and sport (including polo shirts, tank tops, sweatshirts, t-shirts,
and unisex sweatshirts and t-shirts), knit, men's and boys', made in knitting 2014 123,334 0.8 N N N N
3151905 Shirts, dress and sport (including polo shirts, tank tops, sweatshirts, t-shirts, and unisex sweatshirts and t-shirts), knit, men's and boys', made in knitting
2013 120,766 0.0 N N N N
3151907 Shirts and blouses (including polo shirts, tank tops, sweatshirts, and t-shirts), knit, women's, girls', and infants', made in knitting mills
2014 39,403 23.6 N N N N
3151907 Shirts and blouses (including polo shirts, tank tops, sweatshirts, and t-shirts), knit, women's, girls', and infants', made in knitting mills
2013 27,052 0.0 N N N N
3151909 Outerwear (excluding sweaters, shirts, and blouses), knit, made in knitting 2014 14,844 0.0 N N N N 3151909 Outerwear (excluding sweaters, shirts, and blouses), knit, made in knitting 2013 15,078 0.0 N N N N 315190B Contract receipts for knitting only or knitting and finishing knitting mill apparel
products, excluding underwear and nightwear2014 20,841 0.0 N N N N
315190B Contract receipts for knitting only or knitting and finishing knitting mill apparel products, excluding underwear and nightwear
2013 13,358 6.7 N N N N
315190D Gloves and mittens, made in knitting mills 2014 30,336 0.4 N N N N 315190D Gloves and mittens, made in knitting mills 2013 27,860 4.4 N N N N 315190F Apparel products (excluding outerwear, gloves and mittens, underwear, and
nightwear), other types (hats, mufflers, scarves, etc.), made in knitting mills2014 64,636 0.2 166,152 118,904 800,124 797,851
315190F Apparel products (excluding outerwear, gloves and mittens, underwear, and nightwear), other types (hats, mufflers, scarves, etc.), made in knitting mills
2013 46,272 0.0 177,897 133,645 677,901 677,483
315190H Underwear, nightwear, and robes, men's and boys', knit, made in knitting 2014 D S N N N N 315190H Underwear, nightwear, and robes, men's and boys', knit, made in knitting 2013 142 0.0 N N N N 315190J Underwear and nightwear and robes, women's, girls', and infants', knit, made
in knitting mills2014 1,658 11.1 N N N N
315190J Underwear and nightwear and robes, women's, girls', and infants', knit, made in knitting mills
2013 2,158 0.0 N N N N
315190W Other apparel knitting mill products, nsk, total 2014 D S N N N N 315190W Other apparel knitting mill products, nsk, total 2013 36,823 5.3 N N N N
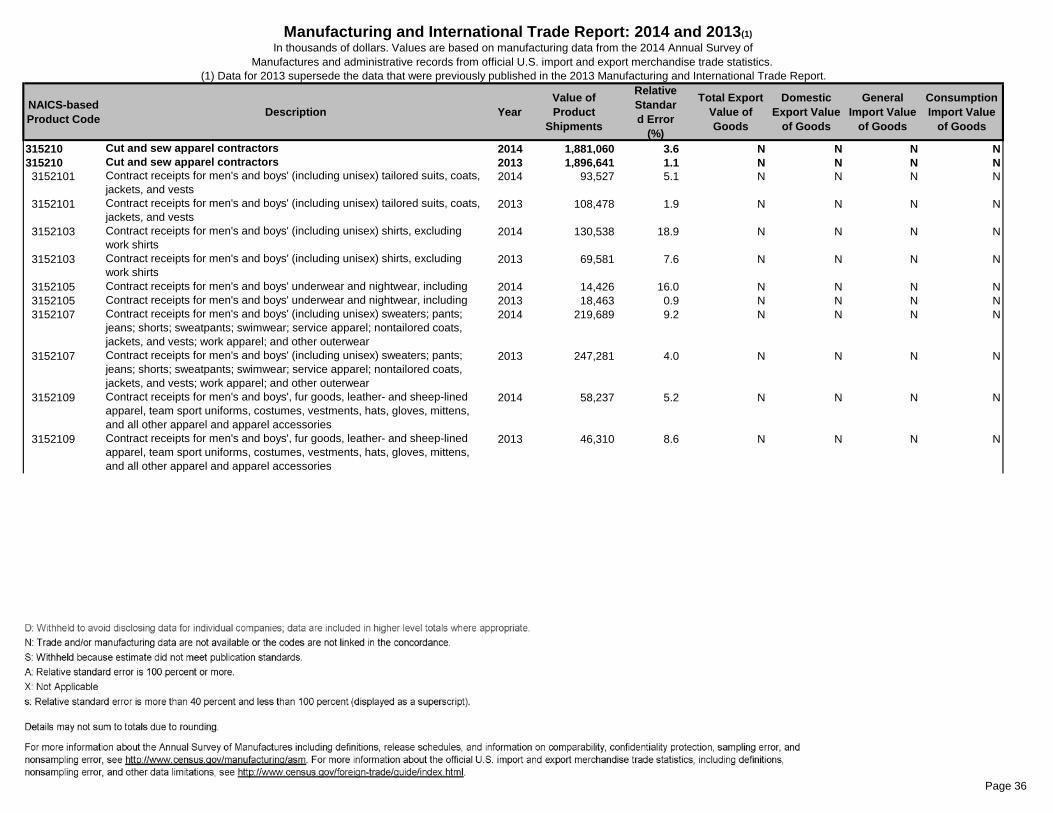
Table
Page 36
NAICS-based Product Code Description Year
Value of Product
Shipments
Relative Standard Error
(%)
Total Export Value of Goods
Domestic Export Value
of Goods
General Import Value
of Goods
Consumption Import Value
of Goods
Manufacturing and International Trade Report: 2014 and 2013(1)In thousands of dollars. Values are based on manufacturing data from the 2014 Annual Survey of
Manufactures and administrative records from official U.S. import and export merchandise trade statistics. (1) Data for 2013 supersede the data that were previously published in the 2013 Manufacturing and International Trade Report.
315210 Cut and sew apparel contractors 2014 1,881,060 3.6 N N N N315210 Cut and sew apparel contractors 2013 1,896,641 1.1 N N N N 3152101 Contract receipts for men's and boys' (including unisex) tailored suits, coats,
jackets, and vests2014 93,527 5.1 N N N N
3152101 Contract receipts for men's and boys' (including unisex) tailored suits, coats, jackets, and vests
2013 108,478 1.9 N N N N
3152103 Contract receipts for men's and boys' (including unisex) shirts, excluding work shirts
2014 130,538 18.9 N N N N
3152103 Contract receipts for men's and boys' (including unisex) shirts, excluding work shirts
2013 69,581 7.6 N N N N
3152105 Contract receipts for men's and boys' underwear and nightwear, including 2014 14,426 16.0 N N N N 3152105 Contract receipts for men's and boys' underwear and nightwear, including 2013 18,463 0.9 N N N N 3152107 Contract receipts for men's and boys' (including unisex) sweaters; pants;
jeans; shorts; sweatpants; swimwear; service apparel; nontailored coats, jackets, and vests; work apparel; and other outerwear
2014 219,689 9.2 N N N N
3152107 Contract receipts for men's and boys' (including unisex) sweaters; pants; jeans; shorts; sweatpants; swimwear; service apparel; nontailored coats, jackets, and vests; work apparel; and other outerwear
2013 247,281 4.0 N N N N
3152109 Contract receipts for men's and boys', fur goods, leather- and sheep-lined apparel, team sport uniforms, costumes, vestments, hats, gloves, mittens, and all other apparel and apparel accessories
2014 58,237 5.2 N N N N
3152109 Contract receipts for men's and boys', fur goods, leather- and sheep-lined apparel, team sport uniforms, costumes, vestments, hats, gloves, mittens, and all other apparel and apparel accessories
2013 46,310 8.6 N N N N
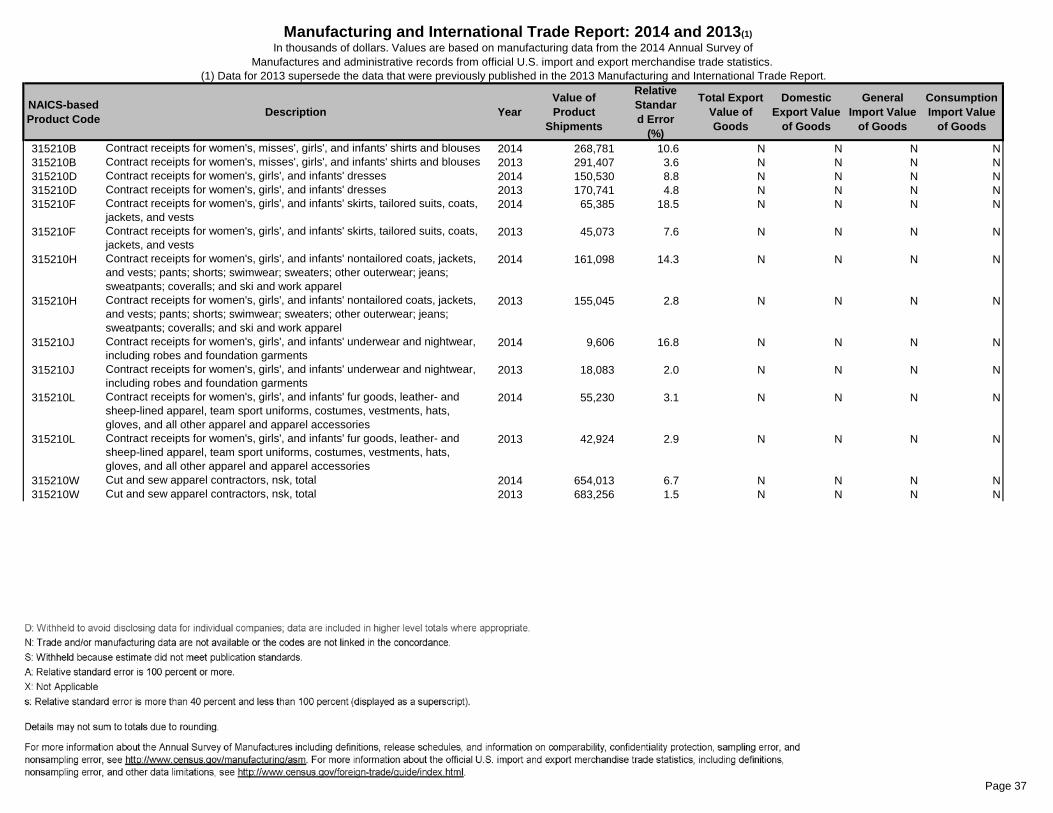
Table
Page 37
NAICS-based Product Code Description Year
Value of Product
Shipments
Relative Standard Error
(%)
Total Export Value of Goods
Domestic Export Value
of Goods
General Import Value
of Goods
Consumption Import Value
of Goods
Manufacturing and International Trade Report: 2014 and 2013(1)In thousands of dollars. Values are based on manufacturing data from the 2014 Annual Survey of
Manufactures and administrative records from official U.S. import and export merchandise trade statistics. (1) Data for 2013 supersede the data that were previously published in the 2013 Manufacturing and International Trade Report.
315210B Contract receipts for women's, misses', girls', and infants' shirts and blouses 2014 268,781 10.6 N N N N 315210B Contract receipts for women's, misses', girls', and infants' shirts and blouses 2013 291,407 3.6 N N N N 315210D Contract receipts for women's, girls', and infants' dresses 2014 150,530 8.8 N N N N 315210D Contract receipts for women's, girls', and infants' dresses 2013 170,741 4.8 N N N N 315210F Contract receipts for women's, girls', and infants' skirts, tailored suits, coats,
jackets, and vests2014 65,385 18.5 N N N N
315210F Contract receipts for women's, girls', and infants' skirts, tailored suits, coats, jackets, and vests
2013 45,073 7.6 N N N N
315210H Contract receipts for women's, girls', and infants' nontailored coats, jackets, and vests; pants; shorts; swimwear; sweaters; other outerwear; jeans; sweatpants; coveralls; and ski and work apparel
2014 161,098 14.3 N N N N
315210H Contract receipts for women's, girls', and infants' nontailored coats, jackets, and vests; pants; shorts; swimwear; sweaters; other outerwear; jeans; sweatpants; coveralls; and ski and work apparel
2013 155,045 2.8 N N N N
315210J Contract receipts for women's, girls', and infants' underwear and nightwear, including robes and foundation garments
2014 9,606 16.8 N N N N
315210J Contract receipts for women's, girls', and infants' underwear and nightwear, including robes and foundation garments
2013 18,083 2.0 N N N N
315210L Contract receipts for women's, girls', and infants' fur goods, leather- and sheep-lined apparel, team sport uniforms, costumes, vestments, hats, gloves, and all other apparel and apparel accessories
2014 55,230 3.1 N N N N
315210L Contract receipts for women's, girls', and infants' fur goods, leather- and sheep-lined apparel, team sport uniforms, costumes, vestments, hats, gloves, and all other apparel and apparel accessories
2013 42,924 2.9 N N N N
315210W Cut and sew apparel contractors, nsk, total 2014 654,013 6.7 N N N N 315210W Cut and sew apparel contractors, nsk, total 2013 683,256 1.5 N N N N

Table
Page 38
NAICS-based Product Code Description Year
Value of Product
Shipments
Relative Standard Error
(%)
Total Export Value of Goods
Domestic Export Value
of Goods
General Import Value
of Goods
Consumption Import Value
of Goods
Manufacturing and International Trade Report: 2014 and 2013(1)In thousands of dollars. Values are based on manufacturing data from the 2014 Annual Survey of
Manufactures and administrative records from official U.S. import and export merchandise trade statistics. (1) Data for 2013 supersede the data that were previously published in the 2013 Manufacturing and International Trade Report.
315220 Men's and boys' cut and sew apparel 2014 1,487,322 2.3 1,788,310 878,110 30,235,396 30,051,175315220 Men's and boys' cut and sew apparel 2013 1,528,940 0.8 1,746,202 895,945 29,164,106 28,872,292 3152201 Men's and boys' nightwear, robes, and knit underwear, made from purchased
fabrics2014 99,940 0.8 112,056 56,200 2,538,954 2,536,048
3152201 Men's and boys' nightwear, robes, and knit underwear, made from purchased fabrics
2013 105,097 0.0 112,588 54,954 2,459,503 2,441,221
3152203 Men's and boys' tailored suits, including dress uniforms (firefighter, military, police, etc.), made from purchased fabrics
2014 186,004 4.8 96,551 85,786 615,554 610,462
3152203 Men's and boys' tailored suits, including dress uniforms (firefighter, military, police, etc.), made from purchased fabrics
2013 187,475 4.3 88,517 77,183 590,140 588,379
3152205 Men's and boys' tailored overcoats, topcoats, car and suburban coats (including water-repellent), made from purchased fabrics
2014 15,823 6.1 N N N N
3152205 Men's and boys' tailored overcoats, topcoats, car and suburban coats (including water-repellent), made from purchased fabrics
2013 15,495 1.7 N N N N
3152207 Men's and boys' tailored dress and sport coats and vests, made from purchased fabrics
2014 53,523 7.4 22,580 12,961 805,143 805,238
3152207 Men's and boys' tailored dress and sport coats and vests, made from purchased fabrics
2013 49,175 1.8 20,313 9,375 775,141 773,511
3152209 Men's and boys' (including unisex) knit dress and sport shirts (including polo shirts, tank tops, sweatshirts, and t-shirts), made from purchased fabrics
2014 277,807 9.5 197,354 87,195 9,033,027 8,907,556
3152209 Men's and boys' (including unisex) knit dress and sport shirts (including polo shirts, tank tops, sweatshirts, and t-shirts), made from purchased fabrics
2013 245,240 0.1 194,738 92,337 8,653,300 8,511,514
315220B Men's and boys' woven dress and sport shirts, made from purchased fabrics 2014 128,072 2.4 46,709 22,050 3,792,837 3,783,248 315220B Men's and boys' woven dress and sport shirts, made from purchased fabrics 2013 132,326 0.7 45,648 20,762 3,688,611 3,670,011 315220D Men's and boys' separate dress and sport trousers, pants, and slacks
(excluding jeans, jean-cut casual slacks, workpants, and sweatpants), made from purchased fabrics
2014 90,488 6.5 N N 3,459,217 3,468,969
315220D Men's and boys' separate dress and sport trousers, pants, and slacks (excluding jeans, jean-cut casual slacks, workpants, and sweatpants), made from purchased fabrics
2013 89,090 7.3 N N 3,573,857 3,532,290

Table
Page 39
NAICS-based Product Code Description Year
Value of Product
Shipments
Relative Standard Error
(%)
Total Export Value of Goods
Domestic Export Value
of Goods
General Import Value
of Goods
Consumption Import Value
of Goods
Manufacturing and International Trade Report: 2014 and 2013(1)In thousands of dollars. Values are based on manufacturing data from the 2014 Annual Survey of
Manufactures and administrative records from official U.S. import and export merchandise trade statistics. (1) Data for 2013 supersede the data that were previously published in the 2013 Manufacturing and International Trade Report.
315220F Men's and boys' jeans and jean-cut casual slacks, made from purchased 2014 43,103 11.4 N N 2,046,148 2,045,751 315220F Men's and boys' jeans and jean-cut casual slacks, made from purchased 2013 48,103 0.0 N N 2,159,896 2,151,681 315220H Men's and boys' work shirts, made from purchased fabrics 2014 42,300 9.1 N N N N 315220H Men's and boys' work shirts, made from purchased fabrics 2013 57,607 1.2 N N N N 315220J Men's and boys' workpants (excluding jeans), work jackets, coveralls,
overalls, jumpsuits, and washable service apparel, including nondisposable hospital patient wear, made from purchased fabrics
2014 219,850 3.0 13,498 7,244 335,475 332,622
315220J Men's and boys' workpants (excluding jeans), work jackets, coveralls, overalls, jumpsuits, and washable service apparel, including nondisposable hospital patient wear, made from purchased fabrics
2013 267,118 2.3 12,229 8,231 285,362 284,149
315220L Men's and boys' nontailored coats, jackets, and vests, including down- and feather-filled (excluding ski apparel and work jackets), made from purchased
2014 250,955 6.7 N N 224,830 223,591
315220L Men's and boys' nontailored coats, jackets, and vests, including down- and feather-filled (excluding ski apparel and work jackets), made from purchased
2013 245,104 0.4 N N 212,852 211,540
315220N Men's and boys' shorts (including dress and athletic) and swimwear, made from purchased fabrics
2014 10,537 15.0 60,870 31,166 2,316,729 2,311,727
315220N Men's and boys' shorts (including dress and athletic) and swimwear, made from purchased fabrics
2013 12,671 3.3 64,318 35,156 2,291,332 2,278,963
315220P Men's and boys' sweaters, sweater vests, sweatpants, jogging and warm-up suits, playsuits, beachwear (excluding swimsuits), and ski apparel, made from purchased fabrics
2014 8,442 13.2 303,475 138,033 535,816 533,454
315220P Men's and boys' sweaters, sweater vests, sweatpants, jogging and warm-up suits, playsuits, beachwear (excluding swimsuits), and ski apparel, made from purchased fabrics
2013 9,095 0.8 288,203 135,604 488,277 485,571
315220W Men's and boys' cut and sew apparel, nsk, total 2014 60,477 2.7 N N N N 315220W Men's and boys' cut and sew apparel, nsk, total 2013 65,345 2.9 N N N N 315220X Undistributed men's and boys' cut and sew apparel 2014 N X 935,217 437,475 4,531,667 4,492,510 315220X Undistributed men's and boys' cut and sew apparel 2013 N X 919,650 462,344 3,985,834 3,943,461

Table
Page 40
NAICS-based Product Code Description Year
Value of Product
Shipments
Relative Standard Error
(%)
Total Export Value of Goods
Domestic Export Value
of Goods
General Import Value
of Goods
Consumption Import Value
of Goods
Manufacturing and International Trade Report: 2014 and 2013(1)In thousands of dollars. Values are based on manufacturing data from the 2014 Annual Survey of
Manufactures and administrative records from official U.S. import and export merchandise trade statistics. (1) Data for 2013 supersede the data that were previously published in the 2013 Manufacturing and International Trade Report.
315240 Women's, girls', and infants' cut and sew apparel 2014 3,549,862 2.3 2,717,607 1,422,654 45,607,350 45,529,018315240 Women's, girls', and infants' cut and sew apparel 2013 3,725,940 0.2 2,486,335 1,383,275 45,242,979 45,007,595 3152401 Women's and girls' underwear, excluding foundation garments, made from
purchased fabrics2014 38,934 5.4 148,205 43,052 1,662,523 1,667,963
3152401 Women's and girls' underwear, excluding foundation garments, made from purchased fabrics
2013 41,456 0.9 133,410 47,083 1,661,969 1,632,494
3152403 Women's and girls' nightwear, excluding robes or dressing gowns intended to sell separately, made from purchased fabrics
2014 10,690 0.3 43,032 13,880 1,154,114 1,150,553
3152403 Women's and girls' nightwear, excluding robes or dressing gowns intended to sell separately, made from purchased fabrics
2013 12,633 0.1 37,765 11,893 1,099,951 1,093,498
3152405 Women's and girls' brassieres, bralettes, and bandeaux, made from purchased fabrics
2014 7,091 0.1 213,923 40,557 2,228,400 2,235,495
3152405 Women's and girls' brassieres, bralettes, and bandeaux, made from purchased fabrics
2013 8,122 1.2 156,873 38,592 2,305,491 2,242,305
3152407 Women's and girls' corsets (excluding surgical), girdles, and combinations, made from purchased fabrics
2014 5,251 0.0 16,447 6,557 122,028 121,844
3152407 Women's and girls' corsets (excluding surgical), girdles, and combinations, made from purchased fabrics
2013 5,137 0.0 19,198 8,659 113,565 113,496
3152409 Women's and girls' robes and dressing gowns, made from purchased fabrics 2014 1,694 0.0 4,357 2,735 98,426 96,796 3152409 Women's and girls' robes and dressing gowns, made from purchased fabrics 2013 1,704 0.0 4,284 2,824 91,697 89,716 315240B Women's and girls' knit shirts and blouses (including polo shirts, cowl neck
shirts, tank tops, sweatshirts, and t-shirts), made from purchased fabrics (excluding screen printing)
2014 800,961 3.9 282,080 138,835 11,441,664 11,415,549
315240B Women's and girls' knit shirts and blouses (including polo shirts, cowl neck shirts, tank tops, sweatshirts, and t-shirts), made from purchased fabrics (excluding screen printing)
2013 793,809 0.7 289,149 143,959 11,484,917 11,436,356
315240D Women's and girls' woven shirts and blouses, made from purchased fabrics (excluding screen printing)
2014 230,807 5.1 208,402 125,035 3,227,734 3,223,427
315240D Women's and girls' woven shirts and blouses, made from purchased fabrics (excluding screen printing)
2013 245,163 0.2 146,964 93,896 3,386,903 3,382,207

Table
Page 41
NAICS-based Product Code Description Year
Value of Product
Shipments
Relative Standard Error
(%)
Total Export Value of Goods
Domestic Export Value
of Goods
General Import Value
of Goods
Consumption Import Value
of Goods
Manufacturing and International Trade Report: 2014 and 2013(1)In thousands of dollars. Values are based on manufacturing data from the 2014 Annual Survey of
Manufactures and administrative records from official U.S. import and export merchandise trade statistics. (1) Data for 2013 supersede the data that were previously published in the 2013 Manufacturing and International Trade Report.
315240F Women's and girls' dresses, made from purchased fabrics 2014 982,270 3.2 417,116 253,158 4,791,408 4,774,452 315240F Women's and girls' dresses, made from purchased fabrics 2013 912,155 0.6 380,656 260,370 4,571,474 4,553,640 315240G Women's and girls' tailored coats and capes, including water-repellent
(excluding fur, leather, down- and feather-filled), made from purchased 2014 25,760 8.2 N N N N
315240G Women's and girls' tailored coats and capes, including water-repellent (excluding fur, leather, down- and feather-filled), made from purchased
2013 11,418 0.2 N N N N
315240H Women's and girls' tailored suits and pantsuits, including dress uniforms (firefighter, military, police, etc), made from purchased fabrics
2014 31,688 8.1 12,266 9,645 52,432 52,245
315240H Women's and girls' tailored suits and pantsuits, including dress uniforms (firefighter, military, police, etc), made from purchased fabrics
2013 49,216 0.1 13,136 9,478 54,757 54,803
315240J Women's and girls' skirts, made from purchased fabrics 2014 70,640 5.5 52,686 34,520 1,099,803 1,097,871 315240J Women's and girls' skirts, made from purchased fabrics 2013 64,715 0.5 44,529 29,465 1,070,104 1,069,610 315240K Women's and girls' tailored jackets and vests, excluding fur and leather,
made from purchased fabrics2014 13,319 10.9 47,240 33,455 652,800 650,564
315240K Women's and girls' tailored jackets and vests, excluding fur and leather, made from purchased fabrics
2013 10,965 2.4 50,358 35,218 794,775 793,260
315240L Women's and girls' sweaters, including sweater vests, made from purchased fabrics
2014 26,905 2.8 41,624 23,652 1,677,439 1,675,193
315240L Women's and girls' sweaters, including sweater vests, made from purchased fabrics
2013 37,399 1.9 33,906 19,802 1,449,804 1,448,833
315240M Women's and girls' shorts, including tennis skirts, made from purchased 2014 24,672 10.2 20,389 10,429 1,446,482 1,445,210 315240M Women's and girls' shorts, including tennis skirts, made from purchased 2013 28,183 14.4 20,605 11,569 1,536,885 1,533,320 315240N Women's and girls' slacks, jeans, and jean-cut casual slacks (excluding
sweatpants), made from purchased fabrics2014 428,527 2.3 220,249 153,920 3,559,699 3,552,761
315240N Women's and girls' slacks, jeans, and jean-cut casual slacks (excluding sweatpants), made from purchased fabrics
2013 600,111 0.1 236,762 170,186 3,255,331 3,243,738

Table
Page 42
NAICS-based Product Code Description Year
Value of Product
Shipments
Relative Standard Error
(%)
Total Export Value of Goods
Domestic Export Value
of Goods
General Import Value
of Goods
Consumption Import Value
of Goods
Manufacturing and International Trade Report: 2014 and 2013(1)In thousands of dollars. Values are based on manufacturing data from the 2014 Annual Survey of
Manufactures and administrative records from official U.S. import and export merchandise trade statistics. (1) Data for 2013 supersede the data that were previously published in the 2013 Manufacturing and International Trade Report.
315240P Women's and girls' sweatpants, bodysuits and bodyshirts, jogging and warm-up suits, playsuits, rompers, and beachwear (excluding swimwear), made from purchased fabrics
2014 61,135 6.7 23,334 2,273 155,976 155,401
315240P Women's and girls' sweatpants, bodysuits and bodyshirts, jogging and warm-up suits, playsuits, rompers, and beachwear (excluding swimwear), made from purchased fabrics
2013 68,999 0.4 28,907 1,539 140,863 140,516
315240R Women's and girls' swimwear, made from purchased fabrics 2014 239,573 5.5 61,529 30,208 845,462 840,750 315240R Women's and girls' swimwear, made from purchased fabrics 2013 242,660 0.4 51,610 24,288 811,057 798,812 315240T Women's and girls' nontailored coats, jackets, and vests (including water-
repellent, down- and feather-filled, and ski apparel), made from purchased 2014 10,299 25.8 4,698 3,194 1,543,535 1,525,240
315240T Women's and girls' nontailored coats, jackets, and vests (including water-repellent, down- and feather-filled, and ski apparel), made from purchased
2013 26,309 8.5 3,665 3,181 1,321,526 1,315,608
315240U Women's and girls' washable service apparel (including nondisposable hospital patient wear, coveralls, overalls, and jumpsuits), made from
2014 9,912 26.7 2,451 1,854 227,508 226,544
315240U Women's and girls' washable service apparel (including nondisposable hospital patient wear, coveralls, overalls, and jumpsuits), made from
2013 20,180 0.4 2,526 2,291 113,137 112,540
315240V Infants' apparel, made from purchased fabrics 2014 61,497 11.3 62,513 38,484 2,348,584 2,344,729 315240V Infants' apparel, made from purchased fabrics 2013 74,942 1.7 62,047 36,000 2,324,343 2,325,125 315240W Women's, girls', and infants' cut and sew apparel, nsk, total 2014 468,237 13.3 N N N N 315240W Women's, girls', and infants' cut and sew apparel, nsk, total 2013 470,663 0.0 N N N N 315240X Undistributed women's, girls', and infants' cut and sew apparel 2014 N X 835,066 457,210 7,271,333 7,276,430 315240X Undistributed women's, girls', and infants' cut and sew apparel 2013 N X 769,986 432,980 7,654,431 7,627,716

Table
Page 43
NAICS-based Product Code Description Year
Value of Product
Shipments
Relative Standard Error
(%)
Total Export Value of Goods
Domestic Export Value
of Goods
General Import Value
of Goods
Consumption Import Value
of Goods
Manufacturing and International Trade Report: 2014 and 2013(1)In thousands of dollars. Values are based on manufacturing data from the 2014 Annual Survey of
Manufactures and administrative records from official U.S. import and export merchandise trade statistics. (1) Data for 2013 supersede the data that were previously published in the 2013 Manufacturing and International Trade Report.
315280 Other cut and sew apparel 2014 899,041 1.8 328,660 262,397 2,375,671 2,345,136315280 Other cut and sew apparel 2013 857,794 4.1 333,379 260,337 2,152,930 2,141,217 3152801 Fur apparel, accessories, and trimmings (coats, capes, jackets, neck pieces,
fur linings, etc.), made from purchased materials2014 30,441 7.5 31,618 23,604 217,645 217,639
3152801 Fur apparel, accessories, and trimmings (coats, capes, jackets, neck pieces, fur linings, etc.), made from purchased materials
2013 30,125 2.6 27,027 19,408 162,930 162,578
3152803 Leather and sheep-lined apparel 2014 58,094 0.7 151,358 114,433 546,543 541,322 3152803 Leather and sheep-lined apparel 2013 57,992 1.3 150,794 117,492 562,335 560,354 3152805 Team sport uniforms, men's and boys', made from purchased fabrics 2014 117,962 1.7 N N 12,052 12,041 3152805 Team sport uniforms, men's and boys', made from purchased fabrics 2013 115,386 2.4 N N 9,736 9,736 3152807 Team sport uniforms, women's and girls', made from purchased fabrics 2014 68,091 3.4 N N 8,004 8,004 3152807 Team sport uniforms, women's and girls', made from purchased fabrics 2013 61,924 1.4 N N 10,521 10,521 3152809 Vestments and costumes, made from purchased materials 2014 533,421 3.0 N N N N 3152809 Vestments and costumes, made from purchased materials 2013 501,032 6.9 N N N N 315280A Apparel, plastic or rubber (50% or greater), including raincoats and rubber
pants (excluding wet suits), made from purchased materials2014 32,038 3.0 145,684 124,359 1,591,428 1,566,130
315280A Apparel, plastic or rubber (50% or greater), including raincoats and rubber pants (excluding wet suits), made from purchased materials
2013 35,282 0.1 155,558 123,436 1,407,408 1,398,028
315280W Other cut and sew apparel, nsk, total 2014 58,992 0.1 N N N N 315280W Other cut and sew apparel, nsk, total 2013 56,053 0.1 N N N N
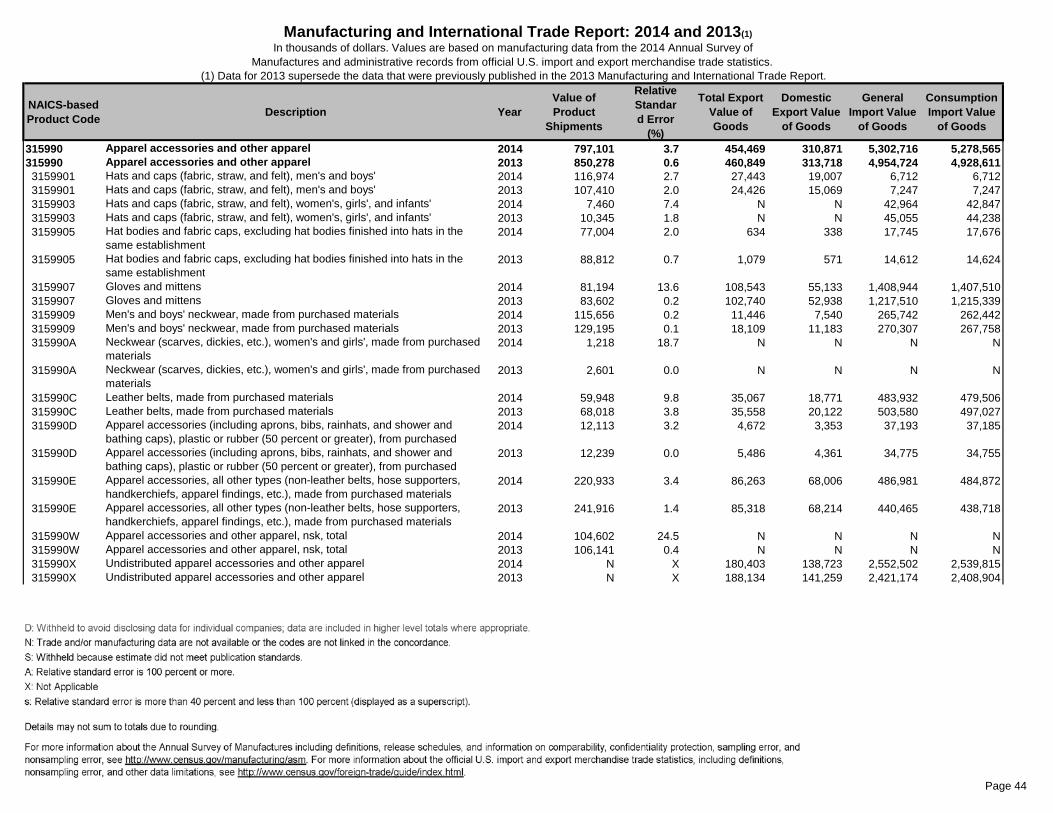
Table
Page 44
NAICS-based Product Code Description Year
Value of Product
Shipments
Relative Standard Error
(%)
Total Export Value of Goods
Domestic Export Value
of Goods
General Import Value
of Goods
Consumption Import Value
of Goods
Manufacturing and International Trade Report: 2014 and 2013(1)In thousands of dollars. Values are based on manufacturing data from the 2014 Annual Survey of
Manufactures and administrative records from official U.S. import and export merchandise trade statistics. (1) Data for 2013 supersede the data that were previously published in the 2013 Manufacturing and International Trade Report.
315990 Apparel accessories and other apparel 2014 797,101 3.7 454,469 310,871 5,302,716 5,278,565315990 Apparel accessories and other apparel 2013 850,278 0.6 460,849 313,718 4,954,724 4,928,611 3159901 Hats and caps (fabric, straw, and felt), men's and boys' 2014 116,974 2.7 27,443 19,007 6,712 6,712 3159901 Hats and caps (fabric, straw, and felt), men's and boys' 2013 107,410 2.0 24,426 15,069 7,247 7,247 3159903 Hats and caps (fabric, straw, and felt), women's, girls', and infants' 2014 7,460 7.4 N N 42,964 42,847 3159903 Hats and caps (fabric, straw, and felt), women's, girls', and infants' 2013 10,345 1.8 N N 45,055 44,238 3159905 Hat bodies and fabric caps, excluding hat bodies finished into hats in the
same establishment2014 77,004 2.0 634 338 17,745 17,676
3159905 Hat bodies and fabric caps, excluding hat bodies finished into hats in the same establishment
2013 88,812 0.7 1,079 571 14,612 14,624
3159907 Gloves and mittens 2014 81,194 13.6 108,543 55,133 1,408,944 1,407,510 3159907 Gloves and mittens 2013 83,602 0.2 102,740 52,938 1,217,510 1,215,339 3159909 Men's and boys' neckwear, made from purchased materials 2014 115,656 0.2 11,446 7,540 265,742 262,442 3159909 Men's and boys' neckwear, made from purchased materials 2013 129,195 0.1 18,109 11,183 270,307 267,758 315990A Neckwear (scarves, dickies, etc.), women's and girls', made from purchased
materials2014 1,218 18.7 N N N N
315990A Neckwear (scarves, dickies, etc.), women's and girls', made from purchased materials
2013 2,601 0.0 N N N N
315990C Leather belts, made from purchased materials 2014 59,948 9.8 35,067 18,771 483,932 479,506 315990C Leather belts, made from purchased materials 2013 68,018 3.8 35,558 20,122 503,580 497,027 315990D Apparel accessories (including aprons, bibs, rainhats, and shower and
bathing caps), plastic or rubber (50 percent or greater), from purchased 2014 12,113 3.2 4,672 3,353 37,193 37,185
315990D Apparel accessories (including aprons, bibs, rainhats, and shower and bathing caps), plastic or rubber (50 percent or greater), from purchased
2013 12,239 0.0 5,486 4,361 34,775 34,755
315990E Apparel accessories, all other types (non-leather belts, hose supporters, handkerchiefs, apparel findings, etc.), made from purchased materials
2014 220,933 3.4 86,263 68,006 486,981 484,872
315990E Apparel accessories, all other types (non-leather belts, hose supporters, handkerchiefs, apparel findings, etc.), made from purchased materials
2013 241,916 1.4 85,318 68,214 440,465 438,718
315990W Apparel accessories and other apparel, nsk, total 2014 104,602 24.5 N N N N 315990W Apparel accessories and other apparel, nsk, total 2013 106,141 0.4 N N N N 315990X Undistributed apparel accessories and other apparel 2014 N X 180,403 138,723 2,552,502 2,539,815 315990X Undistributed apparel accessories and other apparel 2013 N X 188,134 141,259 2,421,174 2,408,904

Table
Page 45
NAICS-based Product Code Description Year
Value of Product
Shipments
Relative Standard Error
(%)
Total Export Value of Goods
Domestic Export Value
of Goods
General Import Value
of Goods
Consumption Import Value
of Goods
Manufacturing and International Trade Report: 2014 and 2013(1)In thousands of dollars. Values are based on manufacturing data from the 2014 Annual Survey of
Manufactures and administrative records from official U.S. import and export merchandise trade statistics. (1) Data for 2013 supersede the data that were previously published in the 2013 Manufacturing and International Trade Report.
316110 Leather and hide tanning and finishing products 2014 1,739,899 0.1 1,500,258 1,379,381 779,354 745,625316110 Leather and hide tanning and finishing products 2013 1,700,765 0.1 1,307,484 1,210,684 700,364 678,674 3161101 Leather, finished and unfinished 2014 1,505,294 0.1 1,457,513 1,340,539 743,169 709,485 3161101 Leather, finished and unfinished 2013 1,421,764 0.1 1,249,188 1,156,174 666,893 645,205 3161102 Tanning or finishing leather owned by others, and furs, dressed and dyed or
bleached2014 164,025 0.0 42,744 38,843 36,185 36,140
3161102 Tanning or finishing leather owned by others, and furs, dressed and dyed or bleached
2013 173,607 0.2 58,296 54,510 33,471 33,469
316110W Leather and hide tanning and finishing products, nsk, total 2014 70,580 0.0 N N N N 316110W Leather and hide tanning and finishing products, nsk, total 2013 105,394 0.0 N N N N316210 Footwear 2014 1,676,722 0.5 1,217,158 599,244 25,578,401 25,313,221316210 Footwear 2013 1,804,189 0.3 1,171,704 581,109 24,357,458 24,172,633 3162101 Rubber and plastics footwear 2014 448,049 0.0 373,536 170,059 10,447,539 10,348,451 3162101 Rubber and plastics footwear 2013 472,964 0.1 364,527 175,222 9,821,753 9,730,450 3162102 Men's footwear (size 6 and larger), excluding athletic 2014 773,670 0.0 N N N N 3162102 Men's footwear (size 6 and larger), excluding athletic 2013 820,989 0.6 N N N N 3162103 Women's footwear (size 4 and larger), excluding athletic 2014 357,144 0.0 N N N N 3162103 Women's footwear (size 4 and larger), excluding athletic 2013 412,138 0.1 N N N N 3162104 Other footwear, excluding rubber and plastic-soled footwear 2014 48,264 18.3 96,625 75,953 3,694,953 3,664,953 3162104 Other footwear, excluding rubber and plastic-soled footwear 2013 56,041 0.0 83,714 66,414 3,665,952 3,668,413 316210W Footwear, nsk, total 2014 49,595 4.1 N N N N 316210W Footwear, nsk, total 2013 42,058 4.1 N N N N 316210X Undistributed footwear 2014 N X 746,997 353,232 11,435,908 11,299,817 316210X Undistributed footwear 2013 N X 723,464 339,472 10,869,753 10,773,769316992 Women's handbags and purses 2014 313,110 1.6 335,494 153,292 3,091,590 3,059,931316992 Women's handbags and purses 2013 298,551 0.3 304,220 130,024 2,979,977 2,944,578 3169920 Women's and children's handbags and purses 2014 313,110 1.6 335,494 153,292 3,091,590 3,059,931 3169920 Women's and children's handbags and purses 2013 298,551 0.3 304,220 130,024 2,979,977 2,944,578

Table
Page 46
NAICS-based Product Code Description Year
Value of Product
Shipments
Relative Standard Error
(%)
Total Export Value of Goods
Domestic Export Value
of Goods
General Import Value
of Goods
Consumption Import Value
of Goods
Manufacturing and International Trade Report: 2014 and 2013(1)In thousands of dollars. Values are based on manufacturing data from the 2014 Annual Survey of
Manufactures and administrative records from official U.S. import and export merchandise trade statistics. (1) Data for 2013 supersede the data that were previously published in the 2013 Manufacturing and International Trade Report.
316998 All other leather goods and allied products 2014 948,439 2.9 1,974,630 1,229,206 9,498,927 9,378,211316998 All other leather goods and allied products 2013 964,024 1.5 1,977,689 1,307,130 9,065,499 8,939,564 3169981 Luggage (including suitcases, travel bags, backpacks, and other types) 2014 280,800 6.4 690,255 338,229 6,135,337 6,107,854 3169981 Luggage (including suitcases, travel bags, backpacks, and other types) 2013 286,807 1.4 734,693 385,985 5,819,205 5,738,624 3169982 Personal leather goods (excluding women's handbags and purses) 2014 148,559 2.2 146,487 75,990 1,097,495 1,072,777 3169982 Personal leather goods (excluding women's handbags and purses) 2013 175,188 7.4 134,134 66,881 1,081,643 1,053,806 3169983 Boot and shoe cut stock and findings 2014 96,167 0.0 220,508 210,121 115,532 115,532 3169983 Boot and shoe cut stock and findings 2013 94,615 0.0 200,096 189,642 121,435 121,020 3169985 All other miscellaneous leather goods 2014 374,675 5.4 917,379 604,866 2,150,563 2,082,048 3169985 All other miscellaneous leather goods 2013 359,217 1.1 908,766 664,623 2,043,216 2,026,114 316998W All other leather goods and allied products, nsk, total 2014 48,239 6.5 N N N N 316998W All other leather goods and allied products, nsk, total 2013 48,198 0.0 N N N N321113 Sawmill products 2014 21,857,609 0.9 3,760,924 3,683,755 5,924,196 5,924,164321113 Sawmill products 2013 20,907,749 0.8 3,316,661 3,243,729 5,233,351 5,233,424 3211131 Hardwood lumber, made in sawmills 2014 4,465,509 3.1 2,363,148 2,336,143 513,107 513,077 3211131 Hardwood lumber, made in sawmills 2013 3,629,233 3.5 1,881,950 1,858,677 447,483 447,556 3211133 Softwood lumber, made in sawmills 2014 11,842,175 1.0 1,074,271 1,026,151 5,164,256 5,164,254 3211133 Softwood lumber, made in sawmills 2013 11,832,985 0.7 1,119,874 1,073,660 4,549,306 4,549,306 3211135 Wood chips, excluding field chips 2014 2,522,743 2.0 255,383 255,296 5,272 5,272 3211135 Wood chips, excluding field chips 2013 2,493,408 0.7 219,862 219,846 5,056 5,056 3211137 Wood ties, siding, shingles, and shakes, and contract sawing of logs owned
by others2014 390,706 5.6 68,121 66,166 241,371 241,371
3211137 Wood ties, siding, shingles, and shakes, and contract sawing of logs owned by others
2013 304,381 2.2 94,975 91,547 231,456 231,456
321113W Sawmill products, nsk, total 2014 2,636,476 2.5 N N N N 321113W Sawmill products, nsk, total 2013 2,647,743 1.6 N N N N 321113X Undistributed sawmill products 2014 N X N N 190 190 321113X Undistributed sawmill products 2013 N X N N 51 51
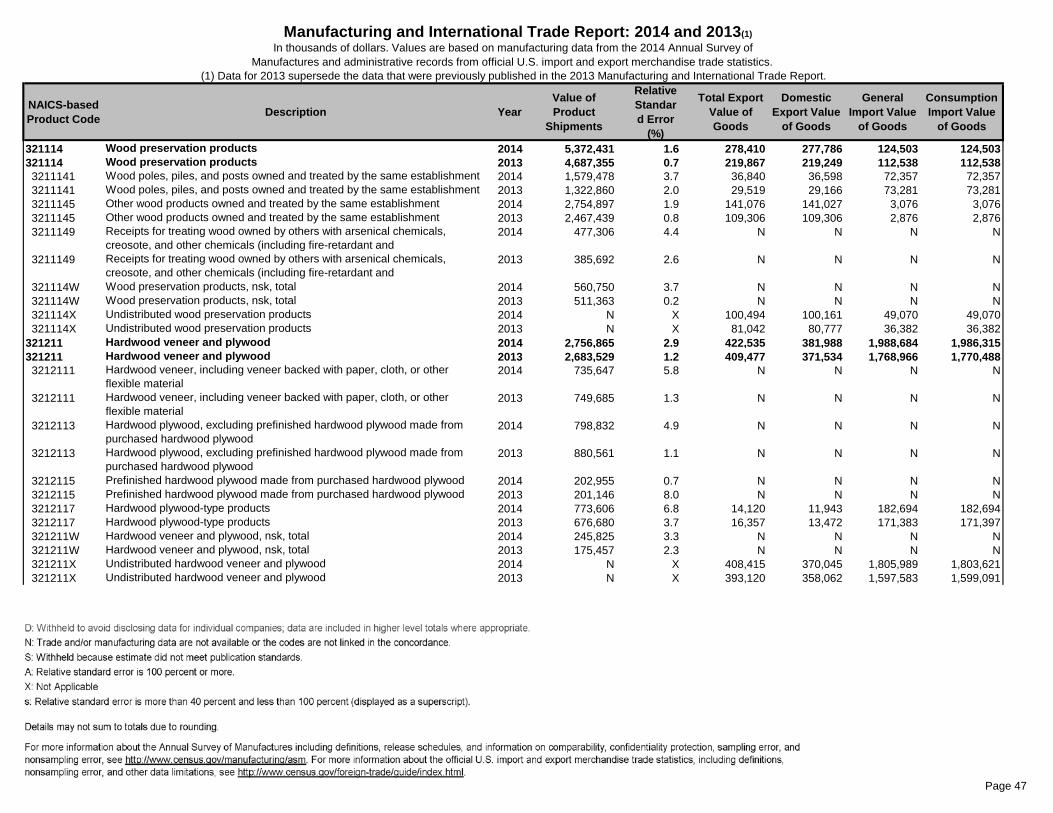
Table
Page 47
NAICS-based Product Code Description Year
Value of Product
Shipments
Relative Standard Error
(%)
Total Export Value of Goods
Domestic Export Value
of Goods
General Import Value
of Goods
Consumption Import Value
of Goods
Manufacturing and International Trade Report: 2014 and 2013(1)In thousands of dollars. Values are based on manufacturing data from the 2014 Annual Survey of
Manufactures and administrative records from official U.S. import and export merchandise trade statistics. (1) Data for 2013 supersede the data that were previously published in the 2013 Manufacturing and International Trade Report.
321114 Wood preservation products 2014 5,372,431 1.6 278,410 277,786 124,503 124,503321114 Wood preservation products 2013 4,687,355 0.7 219,867 219,249 112,538 112,538 3211141 Wood poles, piles, and posts owned and treated by the same establishment 2014 1,579,478 3.7 36,840 36,598 72,357 72,357 3211141 Wood poles, piles, and posts owned and treated by the same establishment 2013 1,322,860 2.0 29,519 29,166 73,281 73,281 3211145 Other wood products owned and treated by the same establishment 2014 2,754,897 1.9 141,076 141,027 3,076 3,076 3211145 Other wood products owned and treated by the same establishment 2013 2,467,439 0.8 109,306 109,306 2,876 2,876 3211149 Receipts for treating wood owned by others with arsenical chemicals,
creosote, and other chemicals (including fire-retardant and 2014 477,306 4.4 N N N N
3211149 Receipts for treating wood owned by others with arsenical chemicals, creosote, and other chemicals (including fire-retardant and
2013 385,692 2.6 N N N N
321114W Wood preservation products, nsk, total 2014 560,750 3.7 N N N N 321114W Wood preservation products, nsk, total 2013 511,363 0.2 N N N N 321114X Undistributed wood preservation products 2014 N X 100,494 100,161 49,070 49,070 321114X Undistributed wood preservation products 2013 N X 81,042 80,777 36,382 36,382321211 Hardwood veneer and plywood 2014 2,756,865 2.9 422,535 381,988 1,988,684 1,986,315321211 Hardwood veneer and plywood 2013 2,683,529 1.2 409,477 371,534 1,768,966 1,770,488 3212111 Hardwood veneer, including veneer backed with paper, cloth, or other
flexible material2014 735,647 5.8 N N N N
3212111 Hardwood veneer, including veneer backed with paper, cloth, or other flexible material
2013 749,685 1.3 N N N N
3212113 Hardwood plywood, excluding prefinished hardwood plywood made from purchased hardwood plywood
2014 798,832 4.9 N N N N
3212113 Hardwood plywood, excluding prefinished hardwood plywood made from purchased hardwood plywood
2013 880,561 1.1 N N N N
3212115 Prefinished hardwood plywood made from purchased hardwood plywood 2014 202,955 0.7 N N N N 3212115 Prefinished hardwood plywood made from purchased hardwood plywood 2013 201,146 8.0 N N N N 3212117 Hardwood plywood-type products 2014 773,606 6.8 14,120 11,943 182,694 182,694 3212117 Hardwood plywood-type products 2013 676,680 3.7 16,357 13,472 171,383 171,397 321211W Hardwood veneer and plywood, nsk, total 2014 245,825 3.3 N N N N 321211W Hardwood veneer and plywood, nsk, total 2013 175,457 2.3 N N N N 321211X Undistributed hardwood veneer and plywood 2014 N X 408,415 370,045 1,805,989 1,803,621 321211X Undistributed hardwood veneer and plywood 2013 N X 393,120 358,062 1,597,583 1,599,091

Table
Page 48
NAICS-based Product Code Description Year
Value of Product
Shipments
Relative Standard Error
(%)
Total Export Value of Goods
Domestic Export Value
of Goods
General Import Value
of Goods
Consumption Import Value
of Goods
Manufacturing and International Trade Report: 2014 and 2013(1)In thousands of dollars. Values are based on manufacturing data from the 2014 Annual Survey of
Manufactures and administrative records from official U.S. import and export merchandise trade statistics. (1) Data for 2013 supersede the data that were previously published in the 2013 Manufacturing and International Trade Report.
321212 Softwood veneer and plywood 2014 4,558,371 0.8 329,051 310,943 504,289 501,489321212 Softwood veneer and plywood 2013 4,452,107 0.6 357,524 337,141 452,457 451,268 3212121 Softwood veneer, including veneer backed with paper, cloth, or other flexible
material2014 1,290,343 2.5 N N N N
3212121 Softwood veneer, including veneer backed with paper, cloth, or other flexible material
2013 1,218,072 1.9 N N N N
3212124 Softwood plywood products (rough, sanded, and specialties) 2014 3,141,639 0.4 80,043 78,234 47,579 47,579 3212124 Softwood plywood products (rough, sanded, and specialties) 2013 3,110,575 0.3 70,105 68,311 45,592 45,581 321212W Softwood veneer and plywood, nsk, total 2014 126,388 1.6 N N N N 321212W Softwood veneer and plywood, nsk, total 2013 123,459 2.0 N N N N 321212X Undistributed softwood veneer and plywood 2014 N X 249,008 232,709 456,710 453,910 321212X Undistributed softwood veneer and plywood 2013 N X 287,419 268,830 406,866 405,688321213 Engineered wood members (excluding trusses) 2014 1,949,710 14.8 241,097 235,207 633,447 633,306321213 Engineered wood members (excluding trusses) 2013 1,602,754 0.9 230,545 225,440 580,866 580,845 3212130 Engineered wood members (excluding trusses) 2014 1,949,710 14.8 241,097 235,207 633,447 633,306 3212130 Engineered wood members (excluding trusses) 2013 1,602,754 0.9 230,545 225,440 580,866 580,845321214 Trusses 2014 4,148,948 3.0 N N 11,283 11,283321214 Trusses 2013 3,421,473 2.4 N N 10,825 10,825 3212140 Wood trusses 2014 4,148,948 3.0 N N 11,283 11,283 3212140 Wood trusses 2013 3,421,473 2.4 N N 10,825 10,825

Table
Page 49
NAICS-based Product Code Description Year
Value of Product
Shipments
Relative Standard Error
(%)
Total Export Value of Goods
Domestic Export Value
of Goods
General Import Value
of Goods
Consumption Import Value
of Goods
Manufacturing and International Trade Report: 2014 and 2013(1)In thousands of dollars. Values are based on manufacturing data from the 2014 Annual Survey of
Manufactures and administrative records from official U.S. import and export merchandise trade statistics. (1) Data for 2013 supersede the data that were previously published in the 2013 Manufacturing and International Trade Report.
321219 Reconstituted wood products 2014 6,610,000 1.9 443,886 419,839 2,177,225 2,178,286321219 Reconstituted wood products 2013 7,477,151 0.8 458,697 433,393 2,244,513 2,246,739 3212191 Particleboard made from particleboard produced at the same location 2014 1,281,805 3.3 N N N N 3212191 Particleboard made from particleboard produced at the same location 2013 1,055,113 4.0 N N N N 3212192 Waferboard and oriented strandboard 2014 2,689,453 0.2 81,479 78,887 908,389 908,389 3212192 Waferboard and oriented strandboard 2013 3,352,152 0.5 89,931 87,755 1,101,782 1,101,782 3212193 Medium density fiberboard (MDF) made from MDF produced at the same 2014 1,204,001 3.8 N N N N 3212193 Medium density fiberboard (MDF) made from MDF produced at the same 2013 1,295,949 0.9 N N N N 3212195 Cellulosic fiberboard (insulating board) 2014 38,753 14.3 N N N N 3212195 Cellulosic fiberboard (insulating board) 2013 59,238 0.0 N N N N 3212196 Hardboard products 2014 559,106 10.4 N N N N 3212196 Hardboard products 2013 639,485 4.6 N N N N 3212198 Prefinished particleboard and medium density fiberboard (MDF) made from
purchased particleboard and MDF2014 591,410 14.8 N N N N
3212198 Prefinished particleboard and medium density fiberboard (MDF) made from purchased particleboard and MDF
2013 751,458 3.2 N N N N
321219W Reconstituted wood products, nsk, total 2014 245,470 4.1 N N N N 321219W Reconstituted wood products, nsk, total 2013 323,757 0.6 N N N N 321219X Undistributed reconstituted wood products 2014 N X 362,407 340,952 1,268,836 1,269,897 321219X Undistributed reconstituted wood products 2013 N X 368,766 345,638 1,142,731 1,144,957

Table
Page 50
NAICS-based Product Code Description Year
Value of Product
Shipments
Relative Standard Error
(%)
Total Export Value of Goods
Domestic Export Value
of Goods
General Import Value
of Goods
Consumption Import Value
of Goods
Manufacturing and International Trade Report: 2014 and 2013(1)In thousands of dollars. Values are based on manufacturing data from the 2014 Annual Survey of
Manufactures and administrative records from official U.S. import and export merchandise trade statistics. (1) Data for 2013 supersede the data that were previously published in the 2013 Manufacturing and International Trade Report.
321911 Wood windows and doors 2014 10,045,873 1.4 206,497 203,562 594,235 593,848321911 Wood windows and doors 2013 9,574,562 0.6 200,189 197,818 538,583 538,377 3219111 Wood window units 2014 3,092,389 1.4 74,443 74,247 113,144 113,144 3219111 Wood window units 2013 2,856,855 0.9 73,042 72,983 101,949 101,949 3219113 Wood sash, excluding sash shipped in window units 2014 95,541 26.7 N N N N 3219113 Wood sash, excluding sash shipped in window units 2013 87,349 3.0 N N N N 3219115 Wood window and door frames, including door frames shipped in door units,
excluding window frames shipped in window units2014 1,042,302 4.9 N N 39,442 39,442
3219115 Wood window and door frames, including door frames shipped in door units, excluding window frames shipped in window units
2013 1,282,266 0.9 N N 38,989 38,989
3219117 Wood panel, flush, and molded face doors, interior and exterior, including doors with glazed sections
2014 2,678,768 3.0 132,054 129,315 441,649 441,262
3219117 Wood panel, flush, and molded face doors, interior and exterior, including doors with glazed sections
2013 2,218,933 1.7 127,147 124,835 397,645 397,439
3219119 Other wood doors, including garage, patio, bifold, cabinet, screen, storm, and louver
2014 1,953,705 2.6 N N N N
3219119 Other wood doors, including garage, patio, bifold, cabinet, screen, storm, and louver
2013 2,214,776 1.0 N N N N
321911W Wood windows and doors, nsk, total 2014 1,183,168 6.1 N N N N 321911W Wood windows and doors, nsk, total 2013 914,383 1.9 N N N N321912 Cut stock, resawing lumber, and planing 2014 6,851,549 1.8 N N N N321912 Cut stock, resawing lumber, and planing 2013 6,112,048 1.1 N N N N 3219121 Hardwood lumber, made from purchased lumber 2014 1,070,881 3.7 N N N N 3219121 Hardwood lumber, made from purchased lumber 2013 1,095,622 1.5 N N N N 3219123 Softwood lumber, made from purchased lumber 2014 2,786,201 3.0 N N N N 3219123 Softwood lumber, made from purchased lumber 2013 1,941,618 2.2 N N N N 3219126 Hardwood cut stock and dimension 2014 1,304,337 4.5 N N N N 3219126 Hardwood cut stock and dimension 2013 1,280,767 1.9 N N N N 3219128 Softwood cut stock and dimension 2014 694,337 4.9 N N N N 3219128 Softwood cut stock and dimension 2013 768,453 4.8 N N N N 3219129 Sawn wood fence stock, wood lath, and contract resawing and planing 2014 345,824 3.8 N N N N 3219129 Sawn wood fence stock, wood lath, and contract resawing and planing 2013 371,769 4.6 N N N N 321912W Cut stock, resawing lumber, and planing, nsk, total 2014 649,969 7.4 N N N N 321912W Cut stock, resawing lumber, and planing, nsk, total 2013 653,818 3.5 N N N N

Table
Page 51
NAICS-based Product Code Description Year
Value of Product
Shipments
Relative Standard Error
(%)
Total Export Value of Goods
Domestic Export Value
of Goods
General Import Value
of Goods
Consumption Import Value
of Goods
Manufacturing and International Trade Report: 2014 and 2013(1)In thousands of dollars. Values are based on manufacturing data from the 2014 Annual Survey of
Manufactures and administrative records from official U.S. import and export merchandise trade statistics. (1) Data for 2013 supersede the data that were previously published in the 2013 Manufacturing and International Trade Report.
321918 Other millwork products (including flooring) 2014 6,542,341 3.2 251,740 229,431 1,462,170 1,461,665321918 Other millwork products (including flooring) 2013 5,740,035 0.8 224,373 202,034 1,368,053 1,368,086 3219182 Wood moldings 2014 1,873,367 7.7 66,970 58,368 766,063 765,876 3219182 Wood moldings 2013 1,622,499 1.2 73,486 62,970 745,288 745,324 3219185 Other wood millwork products, including stairwork, exterior millwork, and
softwood flooring2014 1,289,531 5.5 N N N N
3219185 Other wood millwork products, including stairwork, exterior millwork, and softwood flooring
2013 1,118,746 1.4 N N N N
3219187 Hardwood flooring 2014 2,543,559 4.0 N N 4,615 4,615 3219187 Hardwood flooring 2013 2,055,471 1.1 N N 4,157 4,157 321918W Other millwork products (including flooring), nsk, total 2014 835,885 11.2 N N N N 321918W Other millwork products (including flooring), nsk, total 2013 943,319 3.4 N N N N 321918X Undistributed other millwork products (including flooring) 2014 N X 184,770 171,063 691,492 691,174 321918X Undistributed other millwork products (including flooring) 2013 N X 150,888 139,064 618,608 618,605321920 Wood containers and pallets 2014 7,819,555 3.8 339,766 321,557 491,739 491,345321920 Wood containers and pallets 2013 6,770,149 0.8 302,341 282,662 481,798 481,483 3219201 Nailed and lock-corner wood boxes 2014 482,857 6.9 N N N N 3219201 Nailed and lock-corner wood boxes 2013 254,821 1.1 N N N N 3219203 Wood box and crate shook 2014 391,779 15.6 N N 55,752 55,697 3219203 Wood box and crate shook 2013 404,695 3.3 N N 52,782 52,782 3219205 Wood pallets and pallet containers, wood and metal combination 2014 4,885,465 4.6 82,335 74,326 63,359 63,359 3219205 Wood pallets and pallet containers, wood and metal combination 2013 4,038,665 1.0 84,735 74,115 62,298 62,298 3219207 Other wood container parts and wood containers 2014 851,855 10.4 257,431 247,230 372,629 372,289 3219207 Other wood container parts and wood containers 2013 707,385 1.2 217,606 208,547 366,719 366,404 321920W Wood containers and pallets, nsk, total 2014 1,207,598 13.1 N N N N 321920W Wood containers and pallets, nsk, total 2013 1,364,583 2.4 N N N N321991 Manufactured homes (mobile homes) 2014 4,026,397 2.4 32,713 32,676 1,727 1,727321991 Manufactured homes (mobile homes) 2013 3,824,469 0.9 37,310 36,964 1,227 1,227 3219911 Manufactured homes (mobile homes) 2014 3,454,667 2.8 32,713 32,676 1,727 1,727 3219911 Manufactured homes (mobile homes) 2013 3,138,753 0.8 37,310 36,964 1,227 1,227 3219915 Nonresidential mobile buildings 2014 359,886 3.9 N N N N 3219915 Nonresidential mobile buildings 2013 421,567 5.6 N N N N 321991W Manufactured homes (mobile homes), nsk, total 2014 211,844 3.6 N N N N 321991W Manufactured homes (mobile homes), nsk, total 2013 264,148 0.1 N N N N

Table
Page 52
NAICS-based Product Code Description Year
Value of Product
Shipments
Relative Standard Error
(%)
Total Export Value of Goods
Domestic Export Value
of Goods
General Import Value
of Goods
Consumption Import Value
of Goods
Manufacturing and International Trade Report: 2014 and 2013(1)In thousands of dollars. Values are based on manufacturing data from the 2014 Annual Survey of
Manufactures and administrative records from official U.S. import and export merchandise trade statistics. (1) Data for 2013 supersede the data that were previously published in the 2013 Manufacturing and International Trade Report.
321992 Prefabricated wood buildings 2014 2,608,236 4.9 204,079 202,671 93,192 93,043321992 Prefabricated wood buildings 2013 2,258,360 1.7 185,969 185,013 94,717 94,717 3219921 Components for prefabricated stationary wood buildings (not sold as
complete units)2014 741,259 3.6 N N N N
3219921 Components for prefabricated stationary wood buildings (not sold as complete units)
2013 621,593 4.3 N N N N
3219923 Precut packages for prefabricated stationary wood buildings (complete units) 2014 304,188 6.7 N N N N 3219923 Precut packages for prefabricated stationary wood buildings (complete units) 2013 280,538 6.4 N N N N 3219925 Prefabricated stationary wood buildings shipped in panel form (complete 2014 285,929 11.6 N N N N 3219925 Prefabricated stationary wood buildings shipped in panel form (complete 2013 230,606 3.8 N N N N 3219927 Prefabricated stationary wood buildings shipped in three-dimensional 2014 718,541 7.1 N N N N 3219927 Prefabricated stationary wood buildings shipped in three-dimensional 2013 593,211 2.8 N N N N 321992W Prefabricated wood buildings, nsk, total 2014 558,319 19.0 N N N N 321992W Prefabricated wood buildings, nsk, total 2013 532,412 2.2 N N N N 321992X Undistributed prefabricated wood buildings 2014 N X 204,079 202,671 93,192 93,043 321992X Undistributed prefabricated wood buildings 2013 N X 185,969 185,013 94,717 94,717321999 All other miscellaneous wood products 2014 5,832,331 1.4 993,104 930,478 2,632,140 2,625,084321999 All other miscellaneous wood products 2013 5,489,831 2.2 828,757 762,964 2,438,271 2,430,783 3219990 All other miscellaneous wood products 2014 5,832,331 1.4 993,104 930,478 2,632,140 2,625,084 3219990 All other miscellaneous wood products 2013 5,489,831 2.2 828,757 762,964 2,438,271 2,430,783322110 Pulp mill products 2014 7,684,117 0.1 5,871,430 5,594,123 3,506,845 3,506,845322110 Pulp mill products 2013 7,696,181 0.3 5,860,946 5,556,464 3,521,096 3,521,096 3221104 Special alpha and dissolving woodpulp (sulfite and sulfate for chemical
conversion, papermaking, and other uses), sulfate woodpulp (including soda), sulfite woodpulp, and other woodpulp
2014 6,541,905 0.0 5,575,327 5,302,085 3,448,350 3,448,350
3221104 Special alpha and dissolving woodpulp (sulfite and sulfate for chemical conversion, papermaking, and other uses), sulfate woodpulp (including soda), sulfite woodpulp, and other woodpulp
2013 6,546,296 0.1 5,578,850 5,276,330 3,469,969 3,469,969
3221107 All other miscellaneous pulp, other than wood, and pulp mill by-products 2014 1,119,101 0.1 254,130 250,604 18,581 18,581 3221107 All other miscellaneous pulp, other than wood, and pulp mill by-products 2013 1,130,650 1.8 236,903 235,703 19,056 19,056 322110W Pulp mill products, nsk, total 2014 23,111 0.0 N N N N 322110W Pulp mill products, nsk, total 2013 19,235 0.0 N N N N 322110X Undistributed pulp mill products 2014 N X 41,973 41,434 39,914 39,914 322110X Undistributed pulp mill products 2013 N X 45,192 44,430 32,071 32,071
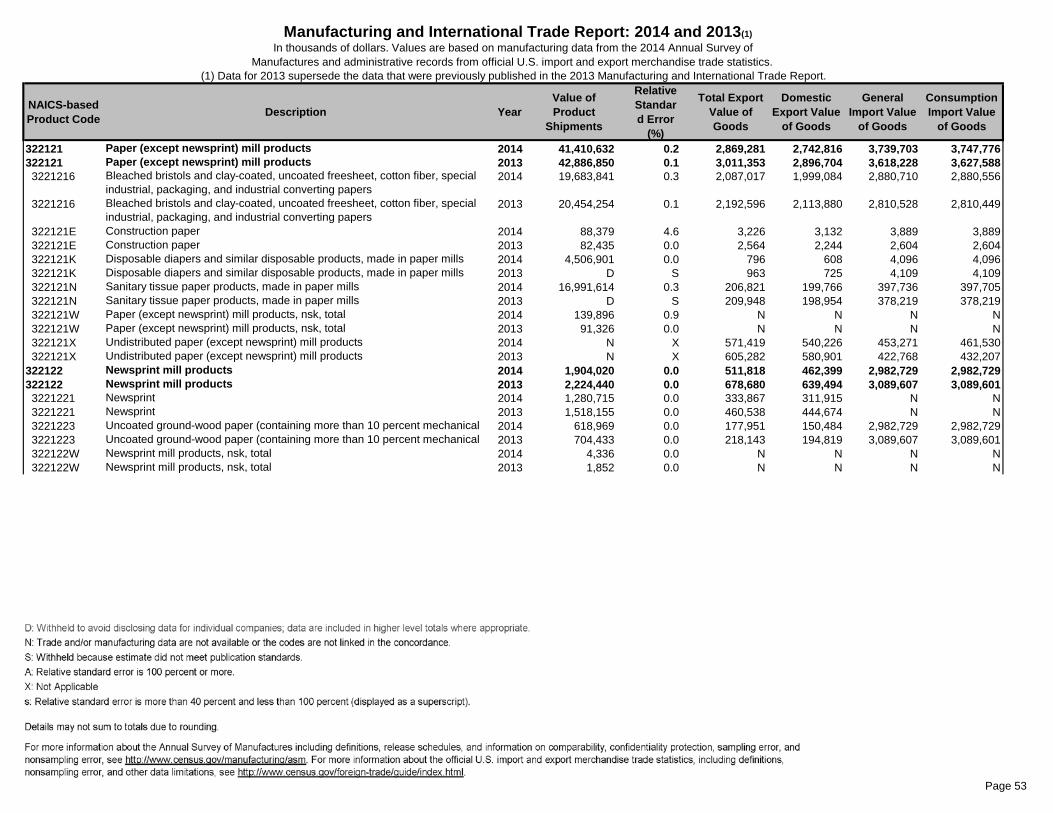
Table
Page 53
NAICS-based Product Code Description Year
Value of Product
Shipments
Relative Standard Error
(%)
Total Export Value of Goods
Domestic Export Value
of Goods
General Import Value
of Goods
Consumption Import Value
of Goods
Manufacturing and International Trade Report: 2014 and 2013(1)In thousands of dollars. Values are based on manufacturing data from the 2014 Annual Survey of
Manufactures and administrative records from official U.S. import and export merchandise trade statistics. (1) Data for 2013 supersede the data that were previously published in the 2013 Manufacturing and International Trade Report.
322121 Paper (except newsprint) mill products 2014 41,410,632 0.2 2,869,281 2,742,816 3,739,703 3,747,776322121 Paper (except newsprint) mill products 2013 42,886,850 0.1 3,011,353 2,896,704 3,618,228 3,627,588 3221216 Bleached bristols and clay-coated, uncoated freesheet, cotton fiber, special
industrial, packaging, and industrial converting papers2014 19,683,841 0.3 2,087,017 1,999,084 2,880,710 2,880,556
3221216 Bleached bristols and clay-coated, uncoated freesheet, cotton fiber, special industrial, packaging, and industrial converting papers
2013 20,454,254 0.1 2,192,596 2,113,880 2,810,528 2,810,449
322121E Construction paper 2014 88,379 4.6 3,226 3,132 3,889 3,889 322121E Construction paper 2013 82,435 0.0 2,564 2,244 2,604 2,604 322121K Disposable diapers and similar disposable products, made in paper mills 2014 4,506,901 0.0 796 608 4,096 4,096 322121K Disposable diapers and similar disposable products, made in paper mills 2013 D S 963 725 4,109 4,109 322121N Sanitary tissue paper products, made in paper mills 2014 16,991,614 0.3 206,821 199,766 397,736 397,705 322121N Sanitary tissue paper products, made in paper mills 2013 D S 209,948 198,954 378,219 378,219 322121W Paper (except newsprint) mill products, nsk, total 2014 139,896 0.9 N N N N 322121W Paper (except newsprint) mill products, nsk, total 2013 91,326 0.0 N N N N 322121X Undistributed paper (except newsprint) mill products 2014 N X 571,419 540,226 453,271 461,530 322121X Undistributed paper (except newsprint) mill products 2013 N X 605,282 580,901 422,768 432,207322122 Newsprint mill products 2014 1,904,020 0.0 511,818 462,399 2,982,729 2,982,729322122 Newsprint mill products 2013 2,224,440 0.0 678,680 639,494 3,089,607 3,089,601 3221221 Newsprint 2014 1,280,715 0.0 333,867 311,915 N N 3221221 Newsprint 2013 1,518,155 0.0 460,538 444,674 N N 3221223 Uncoated ground-wood paper (containing more than 10 percent mechanical 2014 618,969 0.0 177,951 150,484 2,982,729 2,982,729 3221223 Uncoated ground-wood paper (containing more than 10 percent mechanical 2013 704,433 0.0 218,143 194,819 3,089,607 3,089,601 322122W Newsprint mill products, nsk, total 2014 4,336 0.0 N N N N 322122W Newsprint mill products, nsk, total 2013 1,852 0.0 N N N N
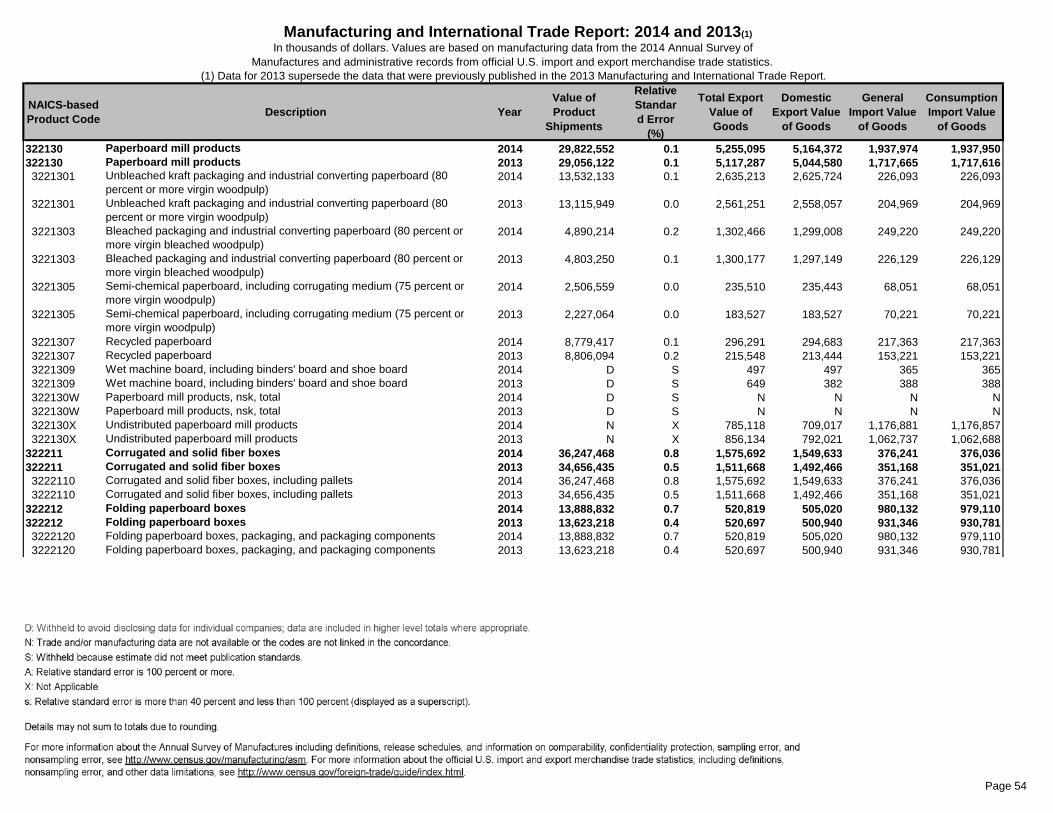
Table
Page 54
NAICS-based Product Code Description Year
Value of Product
Shipments
Relative Standard Error
(%)
Total Export Value of Goods
Domestic Export Value
of Goods
General Import Value
of Goods
Consumption Import Value
of Goods
Manufacturing and International Trade Report: 2014 and 2013(1)In thousands of dollars. Values are based on manufacturing data from the 2014 Annual Survey of
Manufactures and administrative records from official U.S. import and export merchandise trade statistics. (1) Data for 2013 supersede the data that were previously published in the 2013 Manufacturing and International Trade Report.
322130 Paperboard mill products 2014 29,822,552 0.1 5,255,095 5,164,372 1,937,974 1,937,950322130 Paperboard mill products 2013 29,056,122 0.1 5,117,287 5,044,580 1,717,665 1,717,616 3221301 Unbleached kraft packaging and industrial converting paperboard (80
percent or more virgin woodpulp)2014 13,532,133 0.1 2,635,213 2,625,724 226,093 226,093
3221301 Unbleached kraft packaging and industrial converting paperboard (80 percent or more virgin woodpulp)
2013 13,115,949 0.0 2,561,251 2,558,057 204,969 204,969
3221303 Bleached packaging and industrial converting paperboard (80 percent or more virgin bleached woodpulp)
2014 4,890,214 0.2 1,302,466 1,299,008 249,220 249,220
3221303 Bleached packaging and industrial converting paperboard (80 percent or more virgin bleached woodpulp)
2013 4,803,250 0.1 1,300,177 1,297,149 226,129 226,129
3221305 Semi-chemical paperboard, including corrugating medium (75 percent or more virgin woodpulp)
2014 2,506,559 0.0 235,510 235,443 68,051 68,051
3221305 Semi-chemical paperboard, including corrugating medium (75 percent or more virgin woodpulp)
2013 2,227,064 0.0 183,527 183,527 70,221 70,221
3221307 Recycled paperboard 2014 8,779,417 0.1 296,291 294,683 217,363 217,363 3221307 Recycled paperboard 2013 8,806,094 0.2 215,548 213,444 153,221 153,221 3221309 Wet machine board, including binders' board and shoe board 2014 D S 497 497 365 365 3221309 Wet machine board, including binders' board and shoe board 2013 D S 649 382 388 388 322130W Paperboard mill products, nsk, total 2014 D S N N N N 322130W Paperboard mill products, nsk, total 2013 D S N N N N 322130X Undistributed paperboard mill products 2014 N X 785,118 709,017 1,176,881 1,176,857 322130X Undistributed paperboard mill products 2013 N X 856,134 792,021 1,062,737 1,062,688322211 Corrugated and solid fiber boxes 2014 36,247,468 0.8 1,575,692 1,549,633 376,241 376,036322211 Corrugated and solid fiber boxes 2013 34,656,435 0.5 1,511,668 1,492,466 351,168 351,021 3222110 Corrugated and solid fiber boxes, including pallets 2014 36,247,468 0.8 1,575,692 1,549,633 376,241 376,036 3222110 Corrugated and solid fiber boxes, including pallets 2013 34,656,435 0.5 1,511,668 1,492,466 351,168 351,021322212 Folding paperboard boxes 2014 13,888,832 0.7 520,819 505,020 980,132 979,110322212 Folding paperboard boxes 2013 13,623,218 0.4 520,697 500,940 931,346 930,781 3222120 Folding paperboard boxes, packaging, and packaging components 2014 13,888,832 0.7 520,819 505,020 980,132 979,110 3222120 Folding paperboard boxes, packaging, and packaging components 2013 13,623,218 0.4 520,697 500,940 931,346 930,781

Table
Page 55
NAICS-based Product Code Description Year
Value of Product
Shipments
Relative Standard Error
(%)
Total Export Value of Goods
Domestic Export Value
of Goods
General Import Value
of Goods
Consumption Import Value
of Goods
Manufacturing and International Trade Report: 2014 and 2013(1)In thousands of dollars. Values are based on manufacturing data from the 2014 Annual Survey of
Manufactures and administrative records from official U.S. import and export merchandise trade statistics. (1) Data for 2013 supersede the data that were previously published in the 2013 Manufacturing and International Trade Report.
322219 Other paperboard containers 2014 7,304,949 1.5 337,540 331,868 290,976 290,429322219 Other paperboard containers 2013 7,161,783 0.6 325,840 317,037 262,026 261,916 3222191 Setup (rigid) paperboard boxes 2014 829,456 11.0 N N N N 3222191 Setup (rigid) paperboard boxes 2013 732,461 2.7 N N N N 3222192 Paperboard fiber drums with ends of any material 2014 273,827 10.0 N N N N 3222192 Paperboard fiber drums with ends of any material 2013 293,085 0.5 N N N N 3222193 Fiber cans, tubes, and similar fiber products 2014 1,618,148 2.5 22,533 22,278 9,054 9,054 3222193 Fiber cans, tubes, and similar fiber products 2013 1,668,855 1.4 20,401 20,161 6,852 6,852 3222194 Milk and milk-type paperboard cartons, including juice, beverage, and other
products2014 D S N N N N
3222194 Milk and milk-type paperboard cartons, including juice, beverage, and other products
2013 787,083 0.6 N N N N
3222195 Cups and liquid-tight paper and paperboard containers 2014 1,701,925 0.6 N N 146,746 146,741 3222195 Cups and liquid-tight paper and paperboard containers 2013 1,667,417 0.6 N N 130,001 129,982 3222196 Other sanitary paper and paperboard food containers, boards, and trays,
excluding folding2014 1,965,001 1.8 290,767 285,413 128,639 128,506
3222196 Other sanitary paper and paperboard food containers, boards, and trays, excluding folding
2013 1,833,310 1.7 278,433 270,263 117,162 117,072
322219W Other paperboard containers, nsk, total 2014 D S N N N N 322219W Other paperboard containers, nsk, total 2013 179,572 0.7 N N N N 322219X Undistributed other paperboard containers 2014 N X 24,239 24,177 6,537 6,127 322219X Undistributed other paperboard containers 2013 N X 27,007 26,614 8,010 8,010

Table
Page 56
NAICS-based Product Code Description Year
Value of Product
Shipments
Relative Standard Error
(%)
Total Export Value of Goods
Domestic Export Value
of Goods
General Import Value
of Goods
Consumption Import Value
of Goods
Manufacturing and International Trade Report: 2014 and 2013(1)In thousands of dollars. Values are based on manufacturing data from the 2014 Annual Survey of
Manufactures and administrative records from official U.S. import and export merchandise trade statistics. (1) Data for 2013 supersede the data that were previously published in the 2013 Manufacturing and International Trade Report.
322220 Paper bags and coated and treated paper 2014 20,836,543 1.9 5,009,057 4,805,356 3,367,073 3,349,639322220 Paper bags and coated and treated paper 2013 20,879,573 0.3 4,786,589 4,595,801 3,166,526 3,140,536 3222201 Single-web paper, rolls and sheets, including waxed, for flexible packaging 2014 1,453,298 3.4 N N 13,763 13,763 3222201 Single-web paper, rolls and sheets, including waxed, for flexible packaging 2013 1,267,372 0.7 N N 11,556 11,556 3222203 Multiweb laminated rolls and sheets, excluding foil, for flexible packaging 2014 872,409 1.8 N N N N 3222203 Multiweb laminated rolls and sheets, excluding foil, for flexible packaging 2013 1,054,847 0.7 N N N N 3222204 Printing paper, coated at establishments other than where paper was 2014 1,605,446 6.7 N N N N 3222204 Printing paper, coated at establishments other than where paper was 2013 1,575,502 1.4 N N N N 3222205 Gummed products 2014 207,716 11.0 288,206 270,112 197,943 191,810 3222205 Gummed products 2013 248,417 1.4 290,759 278,583 187,259 183,307 3222206 Pressure-sensitive products 2014 6,330,525 2.6 2,926,188 2,786,563 1,252,337 1,242,229 3222206 Pressure-sensitive products 2013 6,145,159 0.7 2,725,568 2,601,629 1,153,745 1,134,110 3222207 Wallcoverings 2014 297,701 9.9 115,335 107,645 86,238 86,217 3222207 Wallcoverings 2013 395,707 4.1 99,625 93,872 88,011 88,007 3222208 Converted foil for nonpackaging applications 2014 325,183 1.6 N N N N 3222208 Converted foil for nonpackaging applications 2013 349,674 0.6 N N N N 3222209 Other coated and processed papers, excluding for packaging uses 2014 2,798,885 6.9 54,300 53,382 42,482 42,482 3222209 Other coated and processed papers, excluding for packaging uses 2013 2,684,227 0.8 58,784 57,036 31,950 31,950 322220A Gift wrap paper 2014 148,514 9.4 18,084 18,063 107,259 107,255 322220A Gift wrap paper 2013 166,973 0.4 22,963 22,844 97,960 97,960

Table
Page 57
NAICS-based Product Code Description Year
Value of Product
Shipments
Relative Standard Error
(%)
Total Export Value of Goods
Domestic Export Value
of Goods
General Import Value
of Goods
Consumption Import Value
of Goods
Manufacturing and International Trade Report: 2014 and 2013(1)In thousands of dollars. Values are based on manufacturing data from the 2014 Annual Survey of
Manufactures and administrative records from official U.S. import and export merchandise trade statistics. (1) Data for 2013 supersede the data that were previously published in the 2013 Manufacturing and International Trade Report.
322220B Specialty bags, pouches, and liners, coated and single-web paper 2014 323,023 2.3 N N N N 322220B Specialty bags, pouches, and liners, coated and single-web paper 2013 277,717 9.7 N N N N 322220C Specialty bags, pouches, and liners, multiweb laminations and foil, excluding
film-film2014 769,070 26.6 N N N N
322220C Specialty bags, pouches, and liners, multiweb laminations and foil, excluding film-film
2013 504,883 3.5 N N N N
322220D Uncoated single-web paper grocers' bags and sacks and variety and 2014 1,216,936 1.7 N N N N 322220D Uncoated single-web paper grocers' bags and sacks and variety and 2013 1,276,556 0.6 N N N N 322220E Shipping sacks and multiwall bags, all materials, excluding textiles 2014 1,071,197 2.6 82,442 73,235 165,988 165,901 322220E Shipping sacks and multiwall bags, all materials, excluding textiles 2013 1,344,310 0.8 89,434 79,977 159,297 159,256 322220F Laminated aluminum foil rolls and sheets for flexible packaging uses
(converting and printing or converting only)2014 1,458,412 3.6 N N N N
322220F Laminated aluminum foil rolls and sheets for flexible packaging uses (converting and printing or converting only)
2013 1,545,577 1.1 N N N N
322220G Pasted, lined, laminated, or surface-coated paperboard 2014 1,109,206 1.4 631,266 630,951 147,759 147,759 322220G Pasted, lined, laminated, or surface-coated paperboard 2013 1,168,323 1.3 661,103 659,935 130,760 130,760 322220W Paper bags and coated and treated paper, nsk, total 2014 849,021 17.9 N N N N 322220W Paper bags and coated and treated paper, nsk, total 2013 874,330 0.2 N N N N 322220X Undistributed paper bags and coated and treated paper 2014 N X 893,237 865,407 1,353,304 1,352,223 322220X Undistributed paper bags and coated and treated paper 2013 N X 838,351 801,925 1,305,988 1,303,630

Table
Page 58
NAICS-based Product Code Description Year
Value of Product
Shipments
Relative Standard Error
(%)
Total Export Value of Goods
Domestic Export Value
of Goods
General Import Value
of Goods
Consumption Import Value
of Goods
Manufacturing and International Trade Report: 2014 and 2013(1)In thousands of dollars. Values are based on manufacturing data from the 2014 Annual Survey of
Manufactures and administrative records from official U.S. import and export merchandise trade statistics. (1) Data for 2013 supersede the data that were previously published in the 2013 Manufacturing and International Trade Report.
322230 Stationery products 2014 5,927,409 2.0 86,909 76,953 403,880 410,716322230 Stationery products 2013 6,439,578 1.9 111,839 104,435 372,227 370,554 3222301 Die-cut paper and paperboard office supplies 2014 874,573 4.9 N N N N 3222301 Die-cut paper and paperboard office supplies 2013 970,613 2.0 N N N N 3222303 Paper supplies for business machines and other miscellaneous unprinted
paper office supplies2014 1,722,957 3.1 N N N N
3222303 Paper supplies for business machines and other miscellaneous unprinted paper office supplies
2013 1,796,423 6.4 N N N N
3222305 Envelopes, commercial, all types and materials 2014 2,387,152 1.3 58,593 53,075 141,377 141,392 3222305 Envelopes, commercial, all types and materials 2013 2,567,051 1.1 85,901 82,420 119,678 119,696 3222307 Stationery 2014 283,695 6.0 8,080 6,750 13,885 13,790 3222307 Stationery 2013 341,956 0.2 9,117 7,670 12,779 12,744 3222309 Tablets, pads, and related products 2014 406,856 6.3 5,446 4,055 215,404 222,374 3222309 Tablets, pads, and related products 2013 518,365 2.4 5,658 4,728 214,570 212,913 322230W Stationery products, nsk, total 2014 252,178 32.9 N N N N 322230W Stationery products, nsk, total 2013 245,171 3.1 N N N N 322230X Undistributed stationery products 2014 N X 14,789 13,072 33,213 33,160 322230X Undistributed stationery products 2013 N X 11,162 9,617 25,200 25,201322291 Sanitary paper products 2014 11,533,130 1.2 1,841,412 1,791,024 2,145,042 2,144,685322291 Sanitary paper products 2013 11,466,591 1.6 1,864,943 1,811,261 1,911,884 1,911,616 3222912 Disposable diapers and similar disposable products, made from purchased
sanitary paper stock or wadding2014 6,941,404 0.4 613,122 585,599 1,030,556 1,030,491
3222912 Disposable diapers and similar disposable products, made from purchased sanitary paper stock or wadding
2013 6,251,527 2.6 670,711 642,874 872,491 872,441
3222915 Sanitary tissue paper products, made from purchased sanitary paper stock or wadding
2014 4,192,081 2.9 808,138 792,470 467,664 467,497
3222915 Sanitary tissue paper products, made from purchased sanitary paper stock or wadding
2013 4,844,722 1.5 729,884 717,901 441,809 441,682
322291W Sanitary paper products, nsk, total 2014 399,646 11.2 N N N N 322291W Sanitary paper products, nsk, total 2013 370,343 0.0 N N N N 322291X Undistributed sanitary paper products 2014 N X 420,152 412,956 646,823 646,697 322291X Undistributed sanitary paper products 2013 N X 464,348 450,485 597,584 597,494

Table
Page 59
NAICS-based Product Code Description Year
Value of Product
Shipments
Relative Standard Error
(%)
Total Export Value of Goods
Domestic Export Value
of Goods
General Import Value
of Goods
Consumption Import Value
of Goods
Manufacturing and International Trade Report: 2014 and 2013(1)In thousands of dollars. Values are based on manufacturing data from the 2014 Annual Survey of
Manufactures and administrative records from official U.S. import and export merchandise trade statistics. (1) Data for 2013 supersede the data that were previously published in the 2013 Manufacturing and International Trade Report.
322299 All other converted paper products 2014 5,437,094 3.3 1,018,640 926,087 1,132,613 1,130,904322299 All other converted paper products 2013 5,246,790 0.8 983,579 889,610 1,065,172 1,062,420 3222991 Molded pulp goods, including egg cartons, florist pots, food trays, etc. 2014 623,963 6.7 58,022 54,953 137,572 137,627 3222991 Molded pulp goods, including egg cartons, florist pots, food trays, etc. 2013 666,834 0.4 49,066 45,651 134,125 134,078 3222993 Miscellaneous converted paper and paperboard products 2014 4,164,986 3.1 325,267 272,209 883,871 883,678 3222993 Miscellaneous converted paper and paperboard products 2013 3,667,682 1.0 339,552 287,940 820,043 819,123 322299W All other converted paper products, nsk, total 2014 648,145 18.7 N N N N 322299W All other converted paper products, nsk, total 2013 912,274 2.4 N N N N 322299X Undistributed all other converted paper products 2014 N X 635,352 598,924 111,170 109,598 322299X Undistributed all other converted paper products 2013 N X 594,962 556,019 111,004 109,219323111 Commercial printing products (except screen and books) 2014 63,420,727 0.9 3,422,468 3,093,291 3,360,358 3,354,981323111 Commercial printing products (except screen and books) 2013 62,922,619 0.3 3,699,909 3,387,588 3,386,001 3,378,720 3231111 Magazine and periodical printing (gravure), including magazine and comic
supplements for Sunday newspapers (excluding printing of newspaper advertising inserts)
2014 379,274 1.1 N N 44 44
3231111 Magazine and periodical printing (gravure), including magazine and comic supplements for Sunday newspapers (excluding printing of newspaper advertising inserts)
2013 380,282 0.2 N N 105 105
3231112 Catalog and directory printing (gravure) 2014 747,259 1.8 N N N N 3231112 Catalog and directory printing (gravure) 2013 730,143 0.4 N N N N 3231113 Label and wrapper printing (gravure) 2014 850,175 3.4 N N N N 3231113 Label and wrapper printing (gravure) 2013 854,809 0.7 N N N N 3231114 Advertising printing (gravure) 2014 730,550 1.7 N N N N 3231114 Advertising printing (gravure) 2013 688,950 1.6 N N N N 3231116 Other commercial and general job printing (gravure), including customized
stationery2014 394,295 5.9 N N N N
3231116 Other commercial and general job printing (gravure), including customized stationery
2013 410,320 1.9 N N N N
3231118 Magazine and periodical printing (lithographic) 2014 4,570,341 2.1 809,175 800,244 43,686 43,646 3231118 Magazine and periodical printing (lithographic) 2013 4,386,777 1.9 940,436 931,390 45,298 45,298 323111A Label and wrapper printing (lithographic) 2014 2,770,588 3.3 N N 95,886 95,858 323111A Label and wrapper printing (lithographic) 2013 2,721,873 1.0 N N 102,814 102,794 323111B Catalog and directory printing (lithographic) 2014 3,262,632 1.3 100,410 94,642 33,366 33,049 323111B Catalog and directory printing (lithographic) 2013 3,259,474 0.7 98,501 95,546 32,989 32,931 323111C Financial and legal printing (lithographic) 2014 2,014,793 3.3 168,378 119,750 78,972 78,972 323111C Financial and legal printing (lithographic) 2013 1,849,288 0.8 233,759 198,331 99,204 99,204

Table
Page 60
NAICS-based Product Code Description Year
Value of Product
Shipments
Relative Standard Error
(%)
Total Export Value of Goods
Domestic Export Value
of Goods
General Import Value
of Goods
Consumption Import Value
of Goods
Manufacturing and International Trade Report: 2014 and 2013(1)In thousands of dollars. Values are based on manufacturing data from the 2014 Annual Survey of
Manufactures and administrative records from official U.S. import and export merchandise trade statistics. (1) Data for 2013 supersede the data that were previously published in the 2013 Manufacturing and International Trade Report.
323111D Advertising printing (lithographic) 2014 11,297,508 1.4 287,264 262,124 307,859 307,529 323111D Advertising printing (lithographic) 2013 12,072,582 0.5 281,421 256,959 309,179 308,917 323111E Other commercial and general job printing (lithographic) 2014 7,162,120 2.1 181,711 117,149 579,900 579,636 323111E Other commercial and general job printing (lithographic) 2013 6,696,764 1.2 193,606 128,927 632,159 631,744 323111F Label and wrapper printing (flexographic) 2014 6,390,620 3.4 N N N N 323111F Label and wrapper printing (flexographic) 2013 6,072,016 0.5 N N N N 323111G Commercial and general job printing other than label and wrapper printing
(flexographic)2014 1,506,288 3.3 N N N N
323111G Commercial and general job printing other than label and wrapper printing (flexographic)
2013 1,498,932 1.0 N N N N
323111H Quick printing 2014 1,039,790 9.9 N N N N 323111H Quick printing 2013 1,323,062 3.7 N N N N 323111J Digital printing 2014 8,676,671 2.7 N N N N 323111J Digital printing 2013 8,763,741 0.7 N N N N 323111K Unit set business forms, loose or bound, manifold books, and pegboard
accounting systems2014 676,498 7.7 N N N N
323111K Unit set business forms, loose or bound, manifold books, and pegboard accounting systems
2013 643,323 4.7 N N N N
323111L Continuous business forms, custom and stock 2014 1,055,096 7.5 N N N N 323111L Continuous business forms, custom and stock 2013 1,031,718 2.1 N N N N

Table
Page 61
NAICS-based Product Code Description Year
Value of Product
Shipments
Relative Standard Error
(%)
Total Export Value of Goods
Domestic Export Value
of Goods
General Import Value
of Goods
Consumption Import Value
of Goods
Manufacturing and International Trade Report: 2014 and 2013(1)In thousands of dollars. Values are based on manufacturing data from the 2014 Annual Survey of
Manufactures and administrative records from official U.S. import and export merchandise trade statistics. (1) Data for 2013 supersede the data that were previously published in the 2013 Manufacturing and International Trade Report.
323111M Checkbooks (including inserts and refills, but excluding those in continuous form and die-cut)
2014 1,563,920 4.6 N N N N
323111M Checkbooks (including inserts and refills, but excluding those in continuous form and die-cut)
2013 1,664,424 0.4 N N N N
323111N Blankbooks, excluding checkbooks and looseleaf types 2014 317,954 4.0 149,277 115,438 220,281 219,673 323111N Blankbooks, excluding checkbooks and looseleaf types 2013 342,744 0.6 157,778 125,029 206,238 205,709 323111P Looseleaf binders, devices, inserts, and forms, excluding school and
commercial looseleaf filler paper2014 337,410 6.9 33,390 30,594 384,332 383,384
323111P Looseleaf binders, devices, inserts, and forms, excluding school and commercial looseleaf filler paper
2013 534,817 1.5 29,933 25,727 385,774 383,723
323111R Label, wrapper, and advertising printing (letterpress) 2014 204,202 4.4 N N N N 323111R Label, wrapper, and advertising printing (letterpress) 2013 233,494 2.3 N N N N 323111T Other commercial and general job printing (letterpress) 2014 594,290 3.7 N N N N 323111T Other commercial and general job printing (letterpress) 2013 517,612 2.5 N N N N 323111U Engraving (printing) 2014 145,753 5.3 N N N N 323111U Engraving (printing) 2013 148,390 3.2 N N N N 323111V All other commercial and general job printing (excluding lithographic (offset),
gravure, flexographic, screen, quick, digital, letterpress, and engraving 2014 280,692 6.1 N N N N
323111V All other commercial and general job printing (excluding lithographic (offset), gravure, flexographic, screen, quick, digital, letterpress, and engraving
2013 232,257 1.8 N N N N
323111W Commercial printing products (except screen and books), nsk, total 2014 6,452,008 4.9 N N N N 323111W Commercial printing products (except screen and books), nsk, total 2013 5,864,827 0.7 N N N N 323111X Undistributed commercial printing products (except screen and books) 2014 N X 1,692,862 1,553,351 1,616,032 1,613,190 323111X Undistributed commercial printing products (except screen and books) 2013 N X 1,764,474 1,625,679 1,572,241 1,568,295

Table
Page 62
NAICS-based Product Code Description Year
Value of Product
Shipments
Relative Standard Error
(%)
Total Export Value of Goods
Domestic Export Value
of Goods
General Import Value
of Goods
Consumption Import Value
of Goods
Manufacturing and International Trade Report: 2014 and 2013(1)In thousands of dollars. Values are based on manufacturing data from the 2014 Annual Survey of
Manufactures and administrative records from official U.S. import and export merchandise trade statistics. (1) Data for 2013 supersede the data that were previously published in the 2013 Manufacturing and International Trade Report.
323113 Commercial screen printing products 2014 7,223,409 2.2 N N N N323113 Commercial screen printing products 2013 6,975,133 1.6 N N N N 3231132 Label printing (screen) 2014 533,999 6.1 N N N N 3231132 Label printing (screen) 2013 498,857 3.0 N N N N 3231134 Screen printing on garments, apparel accessories, and other fabric articles,
excluding labels2014 3,629,399 2.9 N N N N
3231134 Screen printing on garments, apparel accessories, and other fabric articles, excluding labels
2013 3,351,200 3.0 N N N N
3231136 Screen printing (excluding on textiles, apparel, apparel accessories, and 2014 1,931,288 4.3 N N N N 3231136 Screen printing (excluding on textiles, apparel, apparel accessories, and 2013 2,029,842 1.9 N N N N 323113W Commercial screen printing products, nsk, total 2014 1,128,723 7.6 N N N N 323113W Commercial screen printing products, nsk, total 2013 1,095,233 2.4 N N N N323117 Book printing products 2014 4,503,162 1.2 2,503,506 2,266,004 1,876,184 1,864,193323117 Book printing products 2013 4,346,083 0.8 2,586,799 2,346,456 1,818,067 1,805,231 3231171 Textbook printing and binding 2014 746,391 4.5 490,354 468,298 198,828 198,822 3231171 Textbook printing and binding 2013 770,721 3.2 497,672 478,579 172,591 172,587 3231173 Technical, scientific, and professional book printing and binding 2014 412,251 4.1 282,992 248,476 155,253 151,643 3231173 Technical, scientific, and professional book printing and binding 2013 429,097 1.9 311,331 275,752 164,392 162,378 3231175 Religious book printing and binding 2014 303,251 3.5 104,158 87,998 123,874 123,874 3231175 Religious book printing and binding 2013 294,555 3.6 104,579 89,416 125,871 125,871 3231177 General book (trade, etc.) printing and binding 2014 1,429,995 2.1 46,506 32,232 266,018 266,062 3231177 General book (trade, etc.) printing and binding 2013 1,285,084 1.5 49,956 36,937 261,119 260,700 3231179 Other book printing and binding 2014 931,812 2.6 16,824 15,992 8,752 8,752 3231179 Other book printing and binding 2013 847,709 0.7 18,210 17,094 9,961 9,967 323117A Books, printing only, not bound 2014 229,296 1.4 N N N N 323117A Books, printing only, not bound 2013 231,027 1.2 N N N N 323117C Pamphlets, printing only or printing and binding (excluding advertising 2014 167,925 4.7 13,727 10,926 9,427 9,422 323117C Pamphlets, printing only or printing and binding (excluding advertising 2013 194,053 2.2 14,707 13,597 8,055 8,050 323117W Book printing products, nsk, total 2014 282,240 1.9 N N N N 323117W Book printing products, nsk, total 2013 293,838 0.5 N N N N 323117X Undistributed book printing products 2014 N X 1,548,944 1,402,082 1,114,032 1,105,618 323117X Undistributed book printing products 2013 N X 1,590,344 1,435,082 1,076,078 1,065,679

Table
Page 63
NAICS-based Product Code Description Year
Value of Product
Shipments
Relative Standard Error
(%)
Total Export Value of Goods
Domestic Export Value
of Goods
General Import Value
of Goods
Consumption Import Value
of Goods
Manufacturing and International Trade Report: 2014 and 2013(1)In thousands of dollars. Values are based on manufacturing data from the 2014 Annual Survey of
Manufactures and administrative records from official U.S. import and export merchandise trade statistics. (1) Data for 2013 supersede the data that were previously published in the 2013 Manufacturing and International Trade Report.
323120 Printing support activity products 2014 4,027,496 2.7 115,707 112,435 50,999 50,992323120 Printing support activity products 2013 4,234,507 1.4 117,898 113,251 49,474 49,493 3231201 Edition, library, and other hardcover binding of books printed elsewhere 2014 195,430 5.5 68,661 68,357 21,622 21,622 3231201 Edition, library, and other hardcover binding of books printed elsewhere 2013 200,106 15.3 66,322 65,449 12,081 12,081 3231203 Softcover, pamphlet, sample book, and other binding of books and materials
printed elsewhere2014 475,892 11.5 N N N N
3231203 Softcover, pamphlet, sample book, and other binding of books and materials printed elsewhere
2013 492,117 1.6 N N N N
3231205 Miscellaneous binding and postpress work, including collating, perforating, folding, gluing, die-cutting, gold or foil stamping, etc.
2014 670,784 6.0 N N N N
3231205 Miscellaneous binding and postpress work, including collating, perforating, folding, gluing, die-cutting, gold or foil stamping, etc.
2013 658,585 4.3 N N N N
3231207 Prepress services, excluding platemaking (including film, assembled flats, color separations, typesetting, imagesetting, etc.)
2014 1,345,986 2.7 N N 2,562 2,562
3231207 Prepress services, excluding platemaking (including film, assembled flats, color separations, typesetting, imagesetting, etc.)
2013 1,447,044 2.3 N N 6,065 6,065
3231209 Printing plates and cylinders, prepared for printing (excluding blank plates and blank cylinders)
2014 945,038 4.7 N N 26,815 26,809
3231209 Printing plates and cylinders, prepared for printing (excluding blank plates and blank cylinders)
2013 953,493 2.7 N N 31,328 31,347
323120W Printing support activity products, nsk, total 2014 394,366 15.8 N N N N 323120W Printing support activity products, nsk, total 2013 483,161 0.7 N N N N 323120X Undistributed printing support activity products 2014 N X 47,046 44,077 N N 323120X Undistributed printing support activity products 2013 N X 51,576 47,802 N N

Table
Page 64
NAICS-based Product Code Description Year
Value of Product
Shipments
Relative Standard Error
(%)
Total Export Value of Goods
Domestic Export Value
of Goods
General Import Value
of Goods
Consumption Import Value
of Goods
Manufacturing and International Trade Report: 2014 and 2013(1)In thousands of dollars. Values are based on manufacturing data from the 2014 Annual Survey of
Manufactures and administrative records from official U.S. import and export merchandise trade statistics. (1) Data for 2013 supersede the data that were previously published in the 2013 Manufacturing and International Trade Report.
324110 Petroleum refinery products 2014 696,397,390 0.1 116,355,637 115,212,715 81,598,033 112,166,475324110 Petroleum refinery products 2013 757,527,251 0.1 118,866,479 117,773,143 90,716,970 123,273,099 3241101 Gasoline, including finished base stocks and blending agents 2014 338,676,202 0.0 22,438,037 22,414,745 18,325,451 18,025,306 3241101 Gasoline, including finished base stocks and blending agents 2013 380,188,297 0.0 22,368,909 22,320,283 22,941,226 22,741,829 3241104 Jet fuel, all types 2014 57,850,973 0.0 6,979,243 6,840,442 6,436,569 3,381,131 3241104 Jet fuel, all types 2013 60,243,185 0.0 6,696,145 6,577,343 5,430,913 3,354,301 3241107 Kerosene, excluding jet fuel 2014 4,165,078 0.1 643,054 642,999 81,780 81,780 3241107 Kerosene, excluding jet fuel 2013 3,735,640 0.0 710,779 710,746 94,948 94,948 324110A Light fuel oils 2014 201,627,769 0.1 54,386,061 54,003,284 16,049,382 20,041,045 324110A Light fuel oils 2013 212,226,823 0.0 58,999,642 58,356,635 15,318,646 19,844,635 324110D Heavy fuel oils, including grades No. 5, 6, heavy diesel-type, heavy gas-
enrichment oils, etc.2014 17,330,932 0.1 11,773,384 11,338,007 28,760,982 35,232,935
324110D Heavy fuel oils, including grades No. 5, 6, heavy diesel-type, heavy gas-enrichment oils, etc.
2013 20,811,880 0.0 12,712,691 12,589,166 32,878,175 39,313,477
324110G Petroleum lubricating oils and greases, made in a refinery 2014 6,198,241 0.2 5,961,275 5,855,647 3,060,512 6,387,021 324110G Petroleum lubricating oils and greases, made in a refinery 2013 6,364,068 0.0 5,824,963 5,719,299 2,802,397 6,546,576 324110J Unfinished oils and lubricating oil base stock 2014 24,481,647 0.1 60,760 60,679 22,801 22,801 324110J Unfinished oils and lubricating oil base stock 2013 25,652,210 0.1 55,072 54,855 17,583 17,583 324110M Asphalt 2014 8,714,565 0.4 N N N N 324110M Asphalt 2013 8,845,476 0.1 N N N N 324110P Liquefied refinery gases (aliphatics), made in a refinery 2014 21,027,178 0.0 630,690 630,276 2,684,229 4,591,211 324110P Liquefied refinery gases (aliphatics), made in a refinery 2013 22,706,024 0.0 752,129 739,158 2,238,402 4,710,844 324110T Other finished petroleum products, including waxes, made in a refinery 2014 15,301,666 0.2 10,428,498 10,388,390 3,048,098 20,257,550 324110T Other finished petroleum products, including waxes, made in a refinery 2013 15,733,002 0.1 8,673,586 8,641,049 4,213,879 21,340,932 324110W Petroleum refinery products, nsk, total 2014 1,023,137 2.0 N N N N 324110W Petroleum refinery products, nsk, total 2013 1,020,646 0.0 N N N N 324110X Undistributed petroleum refinery products 2014 N X 3,054,634 3,038,247 3,128,229 4,145,694 324110X Undistributed petroleum refinery products 2013 N X 2,072,563 2,064,609 4,780,801 5,307,974

Table
Page 65
NAICS-based Product Code Description Year
Value of Product
Shipments
Relative Standard Error
(%)
Total Export Value of Goods
Domestic Export Value
of Goods
General Import Value
of Goods
Consumption Import Value
of Goods
Manufacturing and International Trade Report: 2014 and 2013(1)In thousands of dollars. Values are based on manufacturing data from the 2014 Annual Survey of
Manufactures and administrative records from official U.S. import and export merchandise trade statistics. (1) Data for 2013 supersede the data that were previously published in the 2013 Manufacturing and International Trade Report.
324121 Asphalt paving mixtures and blocks 2014 12,633,310 1.8 184,850 183,854 183,235 183,235324121 Asphalt paving mixtures and blocks 2013 12,285,608 0.9 181,342 179,762 171,028 172,694 3241210 Asphalt paving mixtures and blocks 2014 12,633,310 1.8 184,850 183,854 183,235 183,235 3241210 Asphalt paving mixtures and blocks 2013 12,285,608 0.9 181,342 179,762 171,028 172,694324122 Asphalt shingle and coating materials manufacturing 2014 9,120,418 1.4 340,433 339,724 137,452 137,437324122 Asphalt shingle and coating materials manufacturing 2013 10,112,451 0.2 389,760 389,250 157,074 157,074 3241221 Roofing asphalts and pitches, coatings, and cements 2014 2,766,887 3.6 N N N N 3241221 Roofing asphalts and pitches, coatings, and cements 2013 1,724,484 1.1 N N N N 3241222 Prepared asphalt and tar roofing and siding products, including saturated
felts and boards for nonbuilding use2014 6,085,351 1.4 N N N N
3241222 Prepared asphalt and tar roofing and siding products, including saturated felts and boards for nonbuilding use
2013 8,148,119 0.2 N N N N
324122W Asphalt shingles and coating materials, nsk, total 2014 268,181 0.3 N N N N 324122W Asphalt shingles and coating materials, nsk, total 2013 239,848 2.6 N N N N 324122X Undistributed asphalt shingle and coating materials manufacturing 2014 N X 340,433 339,724 137,452 137,437 324122X Undistributed asphalt shingle and coating materials manufacturing 2013 N X 389,760 389,250 157,074 157,074324191 Petroleum lubricating oils and greases 2014 17,488,330 0.7 N N 37,003 37,005324191 Petroleum lubricating oils and greases 2013 18,155,996 0.9 N N 30,889 30,877 3241910 Petroleum lubricating oils and greases, made from refined petroleum 2014 17,488,330 0.7 N N 37,003 37,005 3241910 Petroleum lubricating oils and greases, made from refined petroleum 2013 18,155,996 0.9 N N 30,889 30,877324199 All other petroleum and coal products 2014 4,382,223 0.9 54,125 53,862 19,913 561,464324199 All other petroleum and coal products 2013 4,655,216 0.6 59,456 59,366 5,451 736,200 3241991 Coke oven and blast furnace products, made in coke oven establishments 2014 2,439,600 1.5 N N N N 3241991 Coke oven and blast furnace products, made in coke oven establishments 2013 2,667,332 0.0 N N N N 3241992 All other petroleum and coal products (excluding coke oven products), made
in coke oven establishments2014 1,675,520 0.5 54,125 53,862 19,913 561,464
3241992 All other petroleum and coal products (excluding coke oven products), made in coke oven establishments
2013 1,815,865 1.5 59,456 59,366 5,451 736,200
324199W All other petroleum and coal products, nsk, total 2014 267,103 1.1 N N N N 324199W All other petroleum and coal products, nsk, total 2013 172,019 0.0 N N N N

Table
Page 66
NAICS-based Product Code Description Year
Value of Product
Shipments
Relative Standard Error
(%)
Total Export Value of Goods
Domestic Export Value
of Goods
General Import Value
of Goods
Consumption Import Value
of Goods
Manufacturing and International Trade Report: 2014 and 2013(1)In thousands of dollars. Values are based on manufacturing data from the 2014 Annual Survey of
Manufactures and administrative records from official U.S. import and export merchandise trade statistics. (1) Data for 2013 supersede the data that were previously published in the 2013 Manufacturing and International Trade Report.
325110 Petrochemicals 2014 71,535,296 0.1 4,211,449 4,177,708 3,172,394 12,131,783325110 Petrochemicals 2013 81,449,597 0.1 5,407,589 5,371,057 3,452,620 14,038,530 3251101 Aromatics (benzene, toluene, xylene, etc.), made in petrochemical plants 2014 28,519,399 0.0 2,625,988 2,624,398 984,681 2,484,386 3251101 Aromatics (benzene, toluene, xylene, etc.), made in petrochemical plants 2013 32,277,659 0.1 3,660,836 3,660,726 1,083,389 3,111,312 3251104 Liquefied refinery gases (aliphatics), made in petrochemical plants 2014 42,781,725 0.0 391,741 391,516 1,595,763 8,373,808 3251104 Liquefied refinery gases (aliphatics), made in petrochemical plants 2013 48,924,710 0.0 636,307 636,246 1,789,364 9,418,173 325110W Petrochemicals, nsk, total 2014 234,172 5.8 N N N N 325110W Petrochemicals, nsk, total 2013 247,228 4.5 N N N N 325110X Undistributed petrochemicals 2014 N X 1,193,721 1,161,794 591,950 1,273,589 325110X Undistributed petrochemicals 2013 N X 1,110,446 1,074,085 579,867 1,509,045325120 Industrial gases 2014 6,926,406 1.8 540,344 524,483 210,742 211,068325120 Industrial gases 2013 6,971,366 0.7 567,448 557,885 175,081 175,235 3251201 Acetylene 2014 D S N N N N 3251201 Acetylene 2013 233,867 4.7 N N N N 3251204 Carbon dioxide 2014 701,568 1.7 32,219 24,166 16,936 17,261 3251204 Carbon dioxide 2013 607,481 2.7 28,558 23,151 18,887 19,134 3251207 Nitrogen 2014 1,054,878 3.4 29,568 28,541 1,077 1,077 3251207 Nitrogen 2013 1,031,834 0.5 18,411 18,307 1,397 1,397 325120A Oxygen 2014 601,035 3.9 10,674 10,611 1,174 1,174 325120A Oxygen 2013 580,090 0.3 12,238 11,645 1,749 1,749 325120C Argon and hydrogen 2014 1,795,572 1.7 22,926 22,883 68,255 68,255 325120C Argon and hydrogen 2013 1,819,825 0.2 20,099 20,056 63,916 63,919 325120G Fluorocarbon gases 2014 1,120,043 1.0 29,442 28,312 50,597 50,597 325120G Fluorocarbon gases 2013 1,103,101 0.4 30,815 29,915 50,961 50,863 325120U Other industrial gases 2014 956,328 5.5 415,516 409,969 72,703 72,703 325120U Other industrial gases 2013 1,037,599 3.9 457,326 454,811 38,172 38,172 325120W Industrial gases, nsk, total 2014 D S N N N N 325120W Industrial gases, nsk, total 2013 557,569 3.4 N N N N
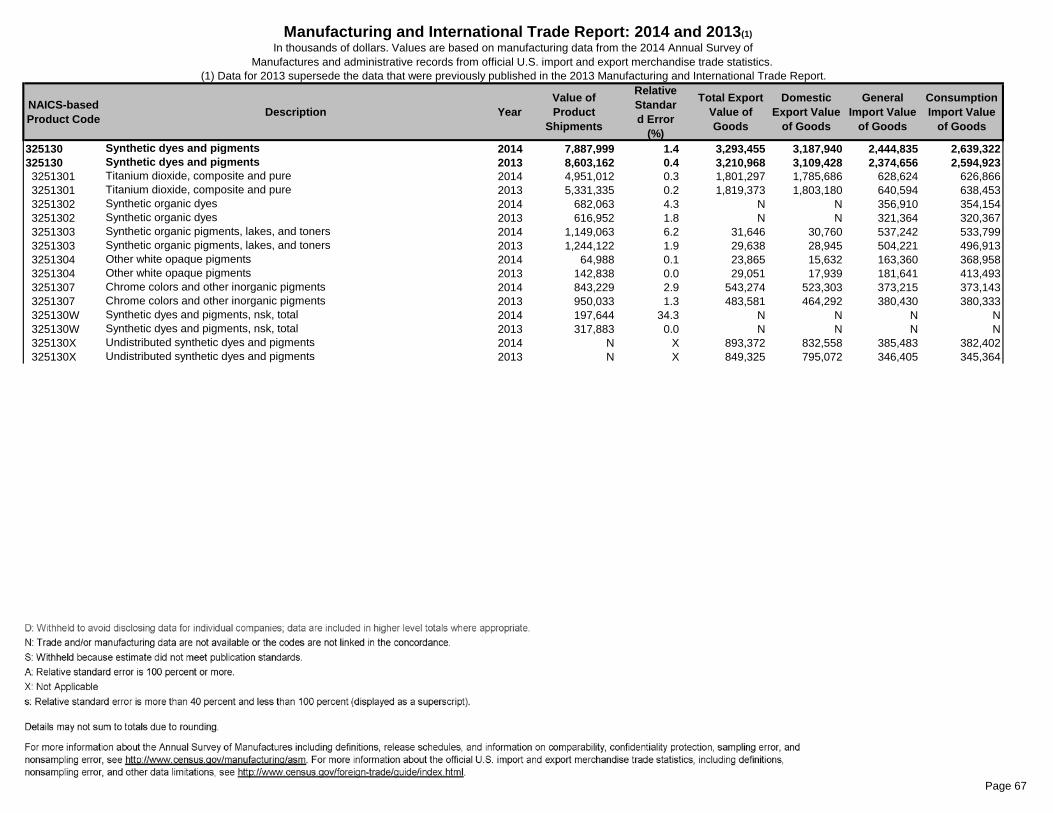
Table
Page 67
NAICS-based Product Code Description Year
Value of Product
Shipments
Relative Standard Error
(%)
Total Export Value of Goods
Domestic Export Value
of Goods
General Import Value
of Goods
Consumption Import Value
of Goods
Manufacturing and International Trade Report: 2014 and 2013(1)In thousands of dollars. Values are based on manufacturing data from the 2014 Annual Survey of
Manufactures and administrative records from official U.S. import and export merchandise trade statistics. (1) Data for 2013 supersede the data that were previously published in the 2013 Manufacturing and International Trade Report.
325130 Synthetic dyes and pigments 2014 7,887,999 1.4 3,293,455 3,187,940 2,444,835 2,639,322325130 Synthetic dyes and pigments 2013 8,603,162 0.4 3,210,968 3,109,428 2,374,656 2,594,923 3251301 Titanium dioxide, composite and pure 2014 4,951,012 0.3 1,801,297 1,785,686 628,624 626,866 3251301 Titanium dioxide, composite and pure 2013 5,331,335 0.2 1,819,373 1,803,180 640,594 638,453 3251302 Synthetic organic dyes 2014 682,063 4.3 N N 356,910 354,154 3251302 Synthetic organic dyes 2013 616,952 1.8 N N 321,364 320,367 3251303 Synthetic organic pigments, lakes, and toners 2014 1,149,063 6.2 31,646 30,760 537,242 533,799 3251303 Synthetic organic pigments, lakes, and toners 2013 1,244,122 1.9 29,638 28,945 504,221 496,913 3251304 Other white opaque pigments 2014 64,988 0.1 23,865 15,632 163,360 368,958 3251304 Other white opaque pigments 2013 142,838 0.0 29,051 17,939 181,641 413,493 3251307 Chrome colors and other inorganic pigments 2014 843,229 2.9 543,274 523,303 373,215 373,143 3251307 Chrome colors and other inorganic pigments 2013 950,033 1.3 483,581 464,292 380,430 380,333 325130W Synthetic dyes and pigments, nsk, total 2014 197,644 34.3 N N N N 325130W Synthetic dyes and pigments, nsk, total 2013 317,883 0.0 N N N N 325130X Undistributed synthetic dyes and pigments 2014 N X 893,372 832,558 385,483 382,402 325130X Undistributed synthetic dyes and pigments 2013 N X 849,325 795,072 346,405 345,364

Table
Page 68
NAICS-based Product Code Description Year
Value of Product
Shipments
Relative Standard Error
(%)
Total Export Value of Goods
Domestic Export Value
of Goods
General Import Value
of Goods
Consumption Import Value
of Goods
Manufacturing and International Trade Report: 2014 and 2013(1)In thousands of dollars. Values are based on manufacturing data from the 2014 Annual Survey of
Manufactures and administrative records from official U.S. import and export merchandise trade statistics. (1) Data for 2013 supersede the data that were previously published in the 2013 Manufacturing and International Trade Report.
325180 Other basic inorganic chemicals 2014 29,300,340 1.1 13,092,585 12,730,446 9,968,399 10,507,367325180 Other basic inorganic chemicals 2013 29,678,816 0.7 12,881,075 12,503,131 10,465,999 11,118,704 3251801 Chlorine, compressed or liquefied 2014 1,101,591 6.5 7,259 7,207 33,245 33,245 3251801 Chlorine, compressed or liquefied 2013 1,041,570 0.0 6,969 6,963 57,789 57,789 3251802 Sulfuric acid 2014 1,699,353 2.3 21,831 21,780 188,069 200,469 3251802 Sulfuric acid 2013 1,835,247 0.4 30,242 30,065 197,400 211,001 3251803 Inorganic acids, excluding nitric, sulfuric, and phosphoric 2014 1,408,504 5.7 86,018 82,151 324,144 324,144 3251803 Inorganic acids, excluding nitric, sulfuric, and phosphoric 2013 1,584,259 7.2 81,374 77,858 290,500 290,500 3251804 Sodium hydroxide (caustic soda) 2014 3,155,768 0.1 820,918 812,508 281,747 281,747 3251804 Sodium hydroxide (caustic soda) 2013 3,615,201 0.1 960,277 951,686 308,314 308,314 3251805 Other inorganic aluminum compounds 2014 1,524,461 5.0 118,489 99,079 205,811 205,811 3251805 Other inorganic aluminum compounds 2013 1,500,119 0.6 106,105 102,249 212,308 212,308 3251806 Carbon black, all processes 2014 2,004,250 0.7 341,415 336,983 381,888 382,008 3251806 Carbon black, all processes 2013 2,354,502 1.4 322,447 319,104 336,880 336,852 3251807 Other alkalies 2014 2,166,024 0.1 153,084 151,035 57,381 57,381 3251807 Other alkalies 2013 2,169,246 0.4 171,840 170,494 53,800 53,800 325180A Potassium and sodium compounds, excluding bleaches, alkalies, and alum 2014 1,942,416 4.8 1,967,204 1,947,459 740,471 740,364 325180A Potassium and sodium compounds, excluding bleaches, alkalies, and alum 2013 2,008,179 1.6 1,855,389 1,835,479 712,923 712,871 325180D Chemical catalytic preparations, excluding silica gel catalyst 2014 4,171,753 3.8 4,074,932 4,009,265 1,232,975 1,228,727 325180D Chemical catalytic preparations, excluding silica gel catalyst 2013 3,752,742 1.2 3,926,018 3,842,429 1,217,258 1,213,418 325180H All other inorganic chemicals 2014 8,865,785 1.7 748,851 734,792 560,236 549,468 325180H All other inorganic chemicals 2013 8,466,570 2.1 641,935 622,102 679,099 665,085 325180W Other basic inorganic chemicals, nsk, total 2014 1,260,436 14.3 N N N N 325180W Other basic inorganic chemicals, nsk, total 2013 1,351,182 0.6 N N N N 325180X Undistributed other basic inorganic chemicals 2014 N X 4,752,582 4,528,187 5,962,431 6,504,003 325180X Undistributed other basic inorganic chemicals 2013 N X 4,778,478 4,544,700 6,399,728 7,056,766325193 Ethyl alcohol 2014 32,896,482 0.8 2,064,721 2,064,116 620,053 620,053325193 Ethyl alcohol 2013 32,866,259 0.1 1,555,074 1,554,929 1,414,603 1,414,603 3251930 Ethyl alcohol 2014 32,896,482 0.8 2,064,721 2,064,116 620,053 620,053 3251930 Ethyl alcohol 2013 32,866,259 0.1 1,555,074 1,554,929 1,414,603 1,414,603

Table
Page 69
NAICS-based Product Code Description Year
Value of Product
Shipments
Relative Standard Error
(%)
Total Export Value of Goods
Domestic Export Value
of Goods
General Import Value
of Goods
Consumption Import Value
of Goods
Manufacturing and International Trade Report: 2014 and 2013(1)In thousands of dollars. Values are based on manufacturing data from the 2014 Annual Survey of
Manufactures and administrative records from official U.S. import and export merchandise trade statistics. (1) Data for 2013 supersede the data that were previously published in the 2013 Manufacturing and International Trade Report.
325194 Cyclic crudes, intermediates, and gum and wood chemicals 2014 9,234,952 0.9 5,034,061 4,998,408 2,866,466 3,596,038325194 Cyclic crudes, intermediates, and gum and wood chemicals 2013 8,765,512 0.4 5,188,102 5,145,724 2,687,475 3,454,502 3251941 Cyclic (coal tar) intermediates 2014 6,566,377 0.0 4,546,888 4,526,541 2,560,651 3,291,584 3251941 Cyclic (coal tar) intermediates 2013 6,000,846 0.0 4,735,685 4,704,697 2,374,505 3,143,029 3251942 Gum and wood chemicals, including wood distillation products 2014 1,934,873 4.4 434,529 419,663 292,667 292,563 3251942 Gum and wood chemicals, including wood distillation products 2013 2,016,750 2.0 396,947 386,068 298,807 298,644 3251944 Tar, tar crudes, and tar pitches 2014 547,580 0.0 N N N N 3251944 Tar, tar crudes, and tar pitches 2013 593,182 0.0 N N N N 325194W Cyclic crudes, intermediates, and gum and wood chemicals, nsk, total 2014 186,123 0.6 N N N N 325194W Cyclic crudes, intermediates, and gum and wood chemicals, nsk, total 2013 154,734 0.0 N N N N 325194X Undistributed cyclic crudes, intermediates, and gum and wood chemicals 2014 N X 52,644 52,204 13,148 11,891 325194X Undistributed cyclic crudes, intermediates, and gum and wood chemicals 2013 N X 55,471 54,959 14,163 12,829
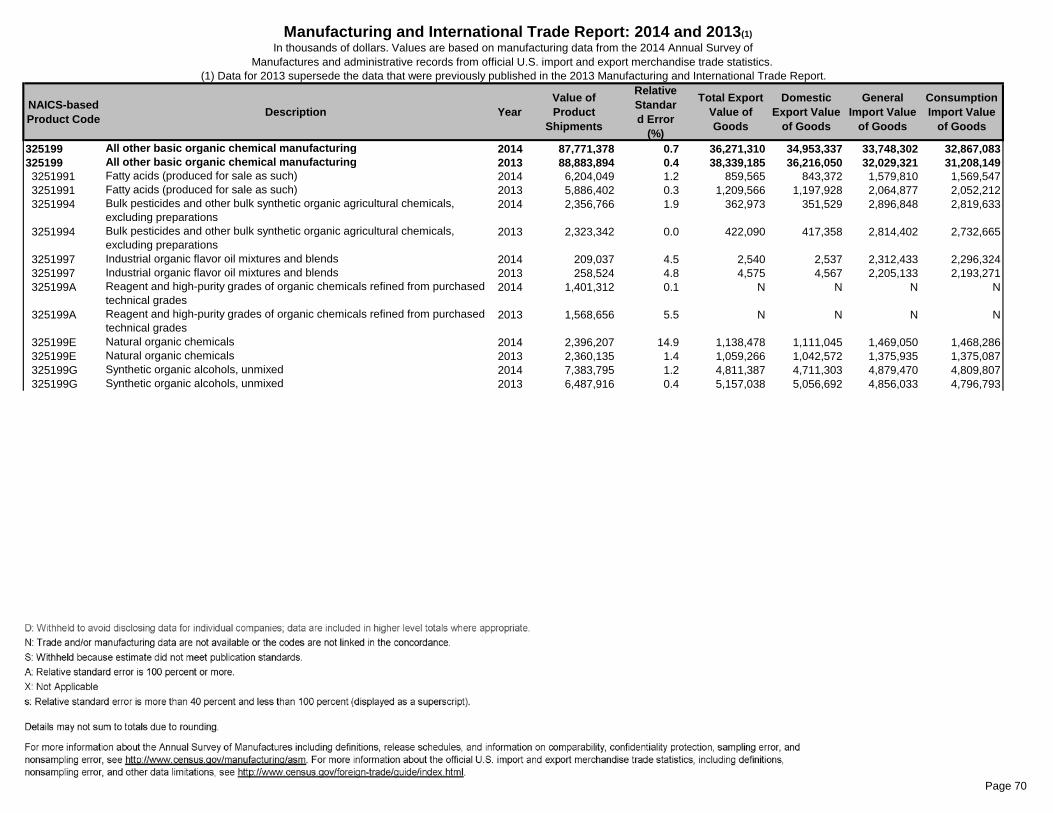
Table
Page 70
NAICS-based Product Code Description Year
Value of Product
Shipments
Relative Standard Error
(%)
Total Export Value of Goods
Domestic Export Value
of Goods
General Import Value
of Goods
Consumption Import Value
of Goods
Manufacturing and International Trade Report: 2014 and 2013(1)In thousands of dollars. Values are based on manufacturing data from the 2014 Annual Survey of
Manufactures and administrative records from official U.S. import and export merchandise trade statistics. (1) Data for 2013 supersede the data that were previously published in the 2013 Manufacturing and International Trade Report.
325199 All other basic organic chemical manufacturing 2014 87,771,378 0.7 36,271,310 34,953,337 33,748,302 32,867,083325199 All other basic organic chemical manufacturing 2013 88,883,894 0.4 38,339,185 36,216,050 32,029,321 31,208,149 3251991 Fatty acids (produced for sale as such) 2014 6,204,049 1.2 859,565 843,372 1,579,810 1,569,547 3251991 Fatty acids (produced for sale as such) 2013 5,886,402 0.3 1,209,566 1,197,928 2,064,877 2,052,212 3251994 Bulk pesticides and other bulk synthetic organic agricultural chemicals,
excluding preparations2014 2,356,766 1.9 362,973 351,529 2,896,848 2,819,633
3251994 Bulk pesticides and other bulk synthetic organic agricultural chemicals, excluding preparations
2013 2,323,342 0.0 422,090 417,358 2,814,402 2,732,665
3251997 Industrial organic flavor oil mixtures and blends 2014 209,037 4.5 2,540 2,537 2,312,433 2,296,324 3251997 Industrial organic flavor oil mixtures and blends 2013 258,524 4.8 4,575 4,567 2,205,133 2,193,271 325199A Reagent and high-purity grades of organic chemicals refined from purchased
technical grades2014 1,401,312 0.1 N N N N
325199A Reagent and high-purity grades of organic chemicals refined from purchased technical grades
2013 1,568,656 5.5 N N N N
325199E Natural organic chemicals 2014 2,396,207 14.9 1,138,478 1,111,045 1,469,050 1,468,286 325199E Natural organic chemicals 2013 2,360,135 1.4 1,059,266 1,042,572 1,375,935 1,375,087 325199G Synthetic organic alcohols, unmixed 2014 7,383,795 1.2 4,811,387 4,711,303 4,879,470 4,809,807 325199G Synthetic organic alcohols, unmixed 2013 6,487,916 0.4 5,157,038 5,056,692 4,856,033 4,796,793
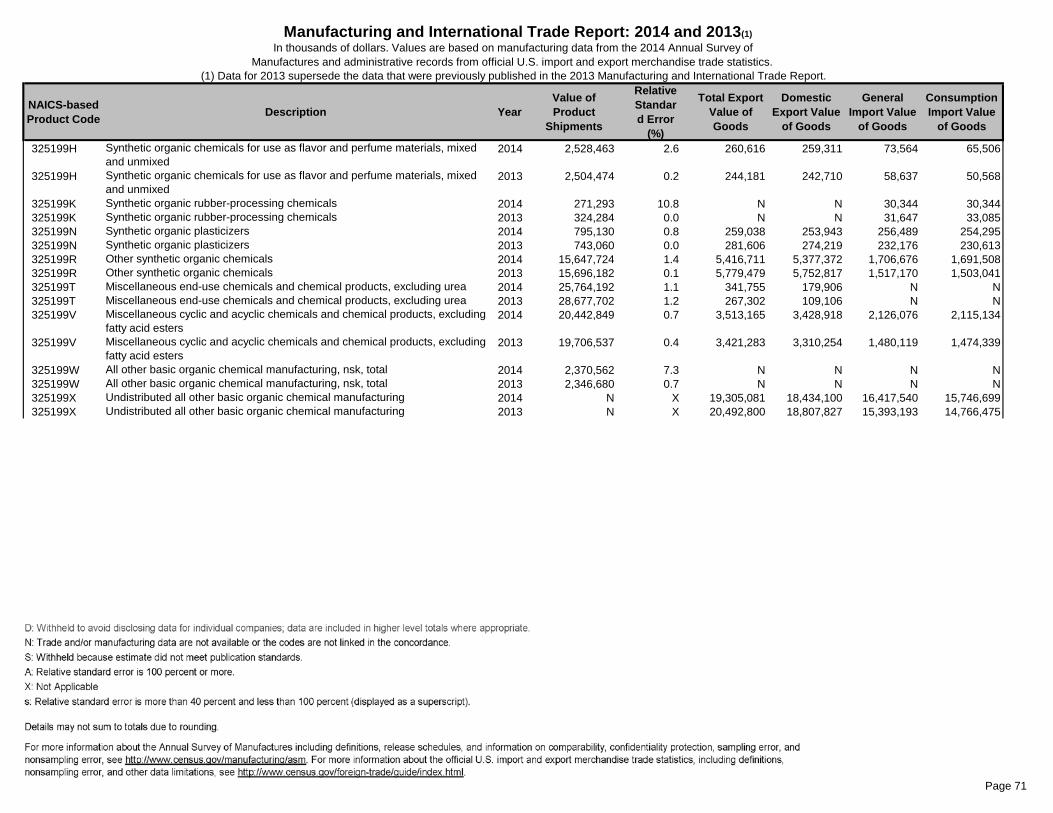
Table
Page 71
NAICS-based Product Code Description Year
Value of Product
Shipments
Relative Standard Error
(%)
Total Export Value of Goods
Domestic Export Value
of Goods
General Import Value
of Goods
Consumption Import Value
of Goods
Manufacturing and International Trade Report: 2014 and 2013(1)In thousands of dollars. Values are based on manufacturing data from the 2014 Annual Survey of
Manufactures and administrative records from official U.S. import and export merchandise trade statistics. (1) Data for 2013 supersede the data that were previously published in the 2013 Manufacturing and International Trade Report.
325199H Synthetic organic chemicals for use as flavor and perfume materials, mixed and unmixed
2014 2,528,463 2.6 260,616 259,311 73,564 65,506
325199H Synthetic organic chemicals for use as flavor and perfume materials, mixed and unmixed
2013 2,504,474 0.2 244,181 242,710 58,637 50,568
325199K Synthetic organic rubber-processing chemicals 2014 271,293 10.8 N N 30,344 30,344 325199K Synthetic organic rubber-processing chemicals 2013 324,284 0.0 N N 31,647 33,085 325199N Synthetic organic plasticizers 2014 795,130 0.8 259,038 253,943 256,489 254,295 325199N Synthetic organic plasticizers 2013 743,060 0.0 281,606 274,219 232,176 230,613 325199R Other synthetic organic chemicals 2014 15,647,724 1.4 5,416,711 5,377,372 1,706,676 1,691,508 325199R Other synthetic organic chemicals 2013 15,696,182 0.1 5,779,479 5,752,817 1,517,170 1,503,041 325199T Miscellaneous end-use chemicals and chemical products, excluding urea 2014 25,764,192 1.1 341,755 179,906 N N 325199T Miscellaneous end-use chemicals and chemical products, excluding urea 2013 28,677,702 1.2 267,302 109,106 N N 325199V Miscellaneous cyclic and acyclic chemicals and chemical products, excluding
fatty acid esters2014 20,442,849 0.7 3,513,165 3,428,918 2,126,076 2,115,134
325199V Miscellaneous cyclic and acyclic chemicals and chemical products, excluding fatty acid esters
2013 19,706,537 0.4 3,421,283 3,310,254 1,480,119 1,474,339
325199W All other basic organic chemical manufacturing, nsk, total 2014 2,370,562 7.3 N N N N 325199W All other basic organic chemical manufacturing, nsk, total 2013 2,346,680 0.7 N N N N 325199X Undistributed all other basic organic chemical manufacturing 2014 N X 19,305,081 18,434,100 16,417,540 15,746,699 325199X Undistributed all other basic organic chemical manufacturing 2013 N X 20,492,800 18,807,827 15,393,193 14,766,475
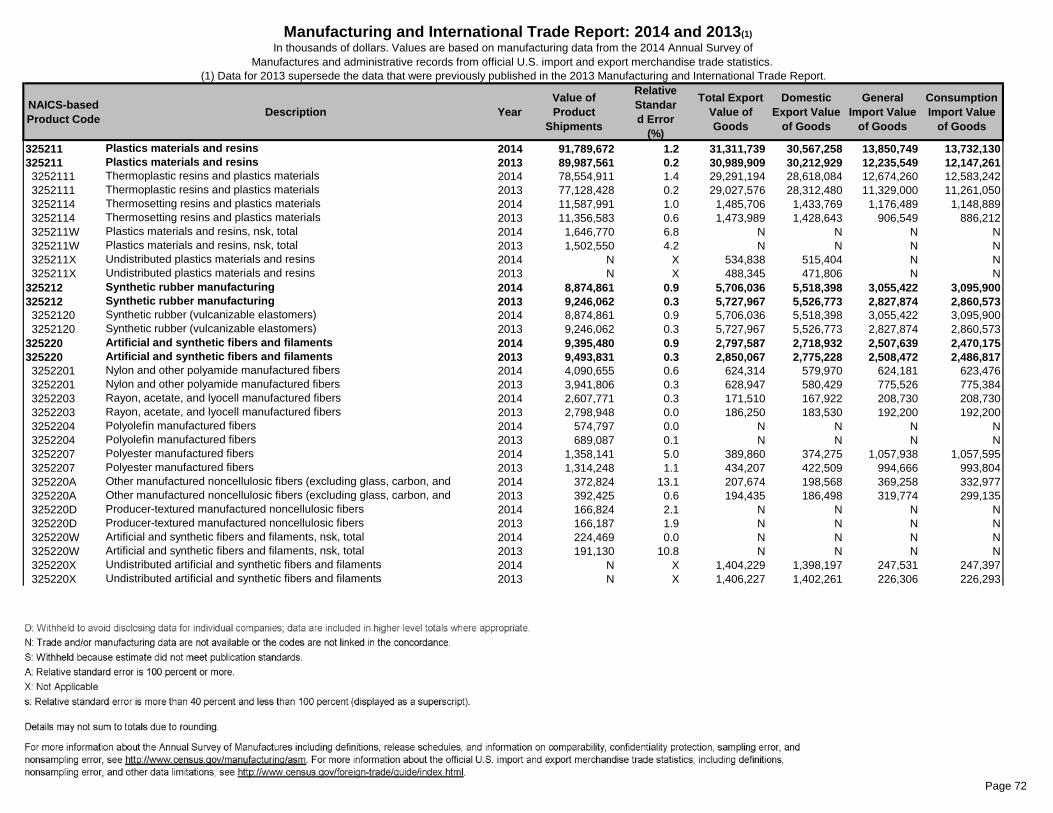
Table
Page 72
NAICS-based Product Code Description Year
Value of Product
Shipments
Relative Standard Error
(%)
Total Export Value of Goods
Domestic Export Value
of Goods
General Import Value
of Goods
Consumption Import Value
of Goods
Manufacturing and International Trade Report: 2014 and 2013(1)In thousands of dollars. Values are based on manufacturing data from the 2014 Annual Survey of
Manufactures and administrative records from official U.S. import and export merchandise trade statistics. (1) Data for 2013 supersede the data that were previously published in the 2013 Manufacturing and International Trade Report.
325211 Plastics materials and resins 2014 91,789,672 1.2 31,311,739 30,567,258 13,850,749 13,732,130325211 Plastics materials and resins 2013 89,987,561 0.2 30,989,909 30,212,929 12,235,549 12,147,261 3252111 Thermoplastic resins and plastics materials 2014 78,554,911 1.4 29,291,194 28,618,084 12,674,260 12,583,242 3252111 Thermoplastic resins and plastics materials 2013 77,128,428 0.2 29,027,576 28,312,480 11,329,000 11,261,050 3252114 Thermosetting resins and plastics materials 2014 11,587,991 1.0 1,485,706 1,433,769 1,176,489 1,148,889 3252114 Thermosetting resins and plastics materials 2013 11,356,583 0.6 1,473,989 1,428,643 906,549 886,212 325211W Plastics materials and resins, nsk, total 2014 1,646,770 6.8 N N N N 325211W Plastics materials and resins, nsk, total 2013 1,502,550 4.2 N N N N 325211X Undistributed plastics materials and resins 2014 N X 534,838 515,404 N N 325211X Undistributed plastics materials and resins 2013 N X 488,345 471,806 N N325212 Synthetic rubber manufacturing 2014 8,874,861 0.9 5,706,036 5,518,398 3,055,422 3,095,900325212 Synthetic rubber manufacturing 2013 9,246,062 0.3 5,727,967 5,526,773 2,827,874 2,860,573 3252120 Synthetic rubber (vulcanizable elastomers) 2014 8,874,861 0.9 5,706,036 5,518,398 3,055,422 3,095,900 3252120 Synthetic rubber (vulcanizable elastomers) 2013 9,246,062 0.3 5,727,967 5,526,773 2,827,874 2,860,573325220 Artificial and synthetic fibers and filaments 2014 9,395,480 0.9 2,797,587 2,718,932 2,507,639 2,470,175325220 Artificial and synthetic fibers and filaments 2013 9,493,831 0.3 2,850,067 2,775,228 2,508,472 2,486,817 3252201 Nylon and other polyamide manufactured fibers 2014 4,090,655 0.6 624,314 579,970 624,181 623,476 3252201 Nylon and other polyamide manufactured fibers 2013 3,941,806 0.3 628,947 580,429 775,526 775,384 3252203 Rayon, acetate, and lyocell manufactured fibers 2014 2,607,771 0.3 171,510 167,922 208,730 208,730 3252203 Rayon, acetate, and lyocell manufactured fibers 2013 2,798,948 0.0 186,250 183,530 192,200 192,200 3252204 Polyolefin manufactured fibers 2014 574,797 0.0 N N N N 3252204 Polyolefin manufactured fibers 2013 689,087 0.1 N N N N 3252207 Polyester manufactured fibers 2014 1,358,141 5.0 389,860 374,275 1,057,938 1,057,595 3252207 Polyester manufactured fibers 2013 1,314,248 1.1 434,207 422,509 994,666 993,804 325220A Other manufactured noncellulosic fibers (excluding glass, carbon, and 2014 372,824 13.1 207,674 198,568 369,258 332,977 325220A Other manufactured noncellulosic fibers (excluding glass, carbon, and 2013 392,425 0.6 194,435 186,498 319,774 299,135 325220D Producer-textured manufactured noncellulosic fibers 2014 166,824 2.1 N N N N 325220D Producer-textured manufactured noncellulosic fibers 2013 166,187 1.9 N N N N 325220W Artificial and synthetic fibers and filaments, nsk, total 2014 224,469 0.0 N N N N 325220W Artificial and synthetic fibers and filaments, nsk, total 2013 191,130 10.8 N N N N 325220X Undistributed artificial and synthetic fibers and filaments 2014 N X 1,404,229 1,398,197 247,531 247,397 325220X Undistributed artificial and synthetic fibers and filaments 2013 N X 1,406,227 1,402,261 226,306 226,293

Table
Page 73
NAICS-based Product Code Description Year
Value of Product
Shipments
Relative Standard Error
(%)
Total Export Value of Goods
Domestic Export Value
of Goods
General Import Value
of Goods
Consumption Import Value
of Goods
Manufacturing and International Trade Report: 2014 and 2013(1)In thousands of dollars. Values are based on manufacturing data from the 2014 Annual Survey of
Manufactures and administrative records from official U.S. import and export merchandise trade statistics. (1) Data for 2013 supersede the data that were previously published in the 2013 Manufacturing and International Trade Report.
325311 Nitrogenous fertilizer 2014 8,542,981 0.4 885,508 817,019 6,781,904 6,790,324325311 Nitrogenous fertilizer 2013 8,917,733 0.6 903,639 843,806 7,303,706 7,318,948 3253111 Synthetic ammonia, nitric acid, and ammonium compounds 2014 6,473,812 0.3 579,313 568,259 3,862,002 3,870,539 3253111 Synthetic ammonia, nitric acid, and ammonium compounds 2013 6,952,462 0.6 629,443 608,832 4,711,031 4,726,314 3253114 Urea 2014 1,215,120 0.5 230,915 175,468 2,800,806 2,800,797 3253114 Urea 2013 1,149,474 0.1 204,188 167,924 2,475,105 2,475,103 3253117 Fertilizer materials of organic origin, including activated sewage sludge,
processed tankage, and other natural fertilizer materials2014 671,425 4.7 31,552 30,399 49,837 49,728
3253117 Fertilizer materials of organic origin, including activated sewage sludge, processed tankage, and other natural fertilizer materials
2013 631,392 5.8 31,020 28,609 47,289 47,250
325311W Nitrogenous fertilizer, nsk, total 2014 182,623 1.3 N N N N 325311W Nitrogenous fertilizer, nsk, total 2013 184,405 3.2 N N N N 325311X Undistributed nitrogenous fertilizer 2014 N X 43,728 42,893 69,259 69,259 325311X Undistributed nitrogenous fertilizer 2013 N X 38,989 38,440 70,281 70,281325312 Phosphatic fertilizer 2014 12,596,038 1.1 4,261,016 3,449,108 4,250,082 4,250,085325312 Phosphatic fertilizer 2013 13,893,998 0.3 4,745,155 3,910,327 4,277,235 4,272,181 3253121 Phosphoric acid 2014 2,153,323 1.6 451,457 446,559 135,413 135,413 3253121 Phosphoric acid 2013 2,215,820 0.1 541,127 540,147 108,076 108,076 3253124 Superphosphates and other phosphatic fertilizer materials 2014 7,790,456 1.3 1,111,096 1,109,885 844,954 844,954 3253124 Superphosphates and other phosphatic fertilizer materials 2013 8,787,431 0.1 1,410,712 1,409,938 503,607 503,607 3253127 Mixed fertilizers, made in plants which manufacture fertilizer materials 2014 2,636,262 3.0 1,579,405 1,570,093 117,836 117,839 3253127 Mixed fertilizers, made in plants which manufacture fertilizer materials 2013 2,870,886 1.3 1,516,414 1,509,547 94,509 94,491 325312W Phosphatic fertilizer, nsk, total 2014 15,996 2.1 N N N N 325312W Phosphatic fertilizer, nsk, total 2013 19,861 0.0 N N N N 325312X Undistributed phosphatic fertilizer 2014 N X 1,119,058 322,571 3,151,878 3,151,878 325312X Undistributed phosphatic fertilizer 2013 N X 1,276,902 450,694 3,571,043 3,566,007325314 Fertilizer (mixing only) 2014 4,902,103 3.8 N N N N325314 Fertilizer (mixing only) 2013 4,800,709 0.8 N N N N 3253140 Mixed fertilizers, mixing only 2014 4,902,103 3.8 N N N N 3253140 Mixed fertilizers, mixing only 2013 4,800,709 0.8 N N N N

Table
Page 74
NAICS-based Product Code Description Year
Value of Product
Shipments
Relative Standard Error
(%)
Total Export Value of Goods
Domestic Export Value
of Goods
General Import Value
of Goods
Consumption Import Value
of Goods
Manufacturing and International Trade Report: 2014 and 2013(1)In thousands of dollars. Values are based on manufacturing data from the 2014 Annual Survey of
Manufactures and administrative records from official U.S. import and export merchandise trade statistics. (1) Data for 2013 supersede the data that were previously published in the 2013 Manufacturing and International Trade Report.
325320 Pesticides and other agricultural chemicals 2014 15,781,037 0.7 4,048,267 3,721,837 957,711 1,222,135325320 Pesticides and other agricultural chemicals 2013 17,689,291 1.4 3,775,962 3,371,991 888,866 1,157,549 3253201 Agricultural and commercial pesticides and chemicals 2014 12,997,574 0.7 N N N N 3253201 Agricultural and commercial pesticides and chemicals 2013 14,360,538 1.7 N N N N 3253204 Lawn and garden pesticides and chemicals 2014 643,401 1.5 N N N N 3253204 Lawn and garden pesticides and chemicals 2013 845,150 3.5 N N N N 3253207 Household and institutional pesticides and chemicals 2014 1,273,047 5.0 N N N N 3253207 Household and institutional pesticides and chemicals 2013 1,563,576 1.1 N N N N 325320W Pesticides and other agricultural chemicals, nsk, total 2014 867,015 0.3 N N N N 325320W Pesticides and other agricultural chemicals, nsk, total 2013 920,026 0.1 N N N N 325320X Undistributed pesticides and other agricultural chemicals 2014 N X 4,048,267 3,721,837 957,711 1,222,135 325320X Undistributed pesticides and other agricultural chemicals 2013 N X 3,775,962 3,371,991 888,866 1,157,549325411 Medicinals and botanicals 2014 12,631,167 0.9 3,179,891 3,047,140 12,166,182 11,646,496325411 Medicinals and botanicals 2013 12,462,819 0.6 4,647,849 4,510,265 12,611,452 12,489,320 3254110 Synthetic organic medicinal chemicals (all uses), medicinal and botanical
drugs, chemicals, and products, in bulk, alkaloid drugs, naturally occurring 2014 12,631,167 0.9 3,113,032 2,982,465 11,604,979 11,085,293
3254110 Synthetic organic medicinal chemicals (all uses), medicinal and botanical drugs, chemicals, and products, in bulk, alkaloid drugs, naturally occurring
2013 12,462,819 0.6 4,614,778 4,479,272 11,979,799 11,857,674
325411X Undistributed medicinals and botanicals 2014 N X 66,859 64,675 561,203 561,203 325411X Undistributed medicinals and botanicals 2013 N X 33,070 30,993 631,654 631,646

Table
Page 75
NAICS-based Product Code Description Year
Value of Product
Shipments
Relative Standard Error
(%)
Total Export Value of Goods
Domestic Export Value
of Goods
General Import Value
of Goods
Consumption Import Value
of Goods
Manufacturing and International Trade Report: 2014 and 2013(1)In thousands of dollars. Values are based on manufacturing data from the 2014 Annual Survey of
Manufactures and administrative records from official U.S. import and export merchandise trade statistics. (1) Data for 2013 supersede the data that were previously published in the 2013 Manufacturing and International Trade Report.
325412 Pharmaceutical preparations 2014 136,267,851 0.7 30,209,236 28,660,482 64,650,112 64,354,284325412 Pharmaceutical preparations 2013 120,032,143 0.2 29,218,043 26,997,288 58,878,160 59,104,784 3254121 Pharmaceutical preparations, affecting neoplasms, the endocrine system,
and metabolic diseases, for human use2014 25,687,607 3.0 7,340,763 7,215,503 18,796,042 19,562,801
3254121 Pharmaceutical preparations, affecting neoplasms, the endocrine system, and metabolic diseases, for human use
2013 27,019,027 0.1 7,199,603 6,857,623 16,362,840 16,427,738
3254124 Pharmaceutical preparations, acting on the central nervous system and the sense organs, for human use
2014 27,240,851 0.2 4,776,435 4,681,969 8,008,989 8,059,406
3254124 Pharmaceutical preparations, acting on the central nervous system and the sense organs, for human use
2013 25,333,670 0.5 4,196,578 4,087,998 6,235,306 6,247,148
3254127 Pharmaceutical preparations, acting on the cardiovascular system, for 2014 13,510,484 0.1 3,140,593 3,022,926 8,034,951 7,949,636 3254127 Pharmaceutical preparations, acting on the cardiovascular system, for 2013 12,317,231 0.1 2,875,538 2,787,800 9,198,213 9,106,844 325412A Pharmaceutical preparations, acting on the respiratory system, for human 2014 13,671,597 0.1 1,216,227 1,175,729 4,072,395 4,105,092 325412A Pharmaceutical preparations, acting on the respiratory system, for human 2013 13,108,147 0.9 926,608 892,488 3,432,862 3,383,909 325412D Pharmaceutical preparations, acting on the digestive or the genito-urinary
systems, for human use2014 5,021,893 0.4 253,389 161,766 5,512,995 4,212,594
325412D Pharmaceutical preparations, acting on the digestive or the genito-urinary systems, for human use
2013 4,580,507 0.4 279,921 201,203 4,587,666 4,572,665
325412G Pharmaceutical preparations, acting on skin, for human use 2014 2,571,129 2.6 72,499 71,490 458,291 457,834 325412G Pharmaceutical preparations, acting on skin, for human use 2013 2,623,805 0.2 84,883 83,011 696,946 696,242

Table
Page 76
NAICS-based Product Code Description Year
Value of Product
Shipments
Relative Standard Error
(%)
Total Export Value of Goods
Domestic Export Value
of Goods
General Import Value
of Goods
Consumption Import Value
of Goods
Manufacturing and International Trade Report: 2014 and 2013(1)In thousands of dollars. Values are based on manufacturing data from the 2014 Annual Survey of
Manufactures and administrative records from official U.S. import and export merchandise trade statistics. (1) Data for 2013 supersede the data that were previously published in the 2013 Manufacturing and International Trade Report.
325412L Pharmaceutical preparations, vitamin, nutrient, and hematinic preparations, for human use
2014 10,577,886 0.7 454,095 447,598 265,015 265,160
325412L Pharmaceutical preparations, vitamin, nutrient, and hematinic preparations, for human use
2013 8,102,964 0.6 514,150 509,568 177,440 178,185
325412P Pharmaceutical preparations, affecting parasitic and infective diseases, for human use (excluding diagnostics)
2014 27,633,937 1.5 5,150,848 4,457,436 11,137,110 11,131,590
325412P Pharmaceutical preparations, affecting parasitic and infective diseases, for human use (excluding diagnostics)
2013 15,634,150 0.1 5,285,538 4,158,972 10,092,180 10,143,151
325412T Pharmaceutical preparations for veterinary use (including medicinal premixes and medicated pet care products; excluding pet flea and tick products), excluding diagnostics
2014 2,395,090 8.2 370,293 365,207 808,737 821,833
325412T Pharmaceutical preparations for veterinary use (including medicinal premixes and medicated pet care products; excluding pet flea and tick products), excluding diagnostics
2013 2,411,116 0.2 452,113 442,715 818,567 800,706
325412V In vivo diagnostic substances 2014 1,931,167 10.3 N N N N 325412V In vivo diagnostic substances 2013 2,504,365 0.1 N N N N 325412W Pharmaceutical preparations, nsk, total 2014 6,026,209 4.2 N N N N 325412W Pharmaceutical preparations, nsk, total 2013 6,397,161 0.0 N N N N 325412X Undistributed pharmaceutical preparations 2014 N X 7,434,092 7,060,857 7,555,589 7,788,339 325412X Undistributed pharmaceutical preparations 2013 N X 7,403,110 6,975,909 7,276,142 7,548,196
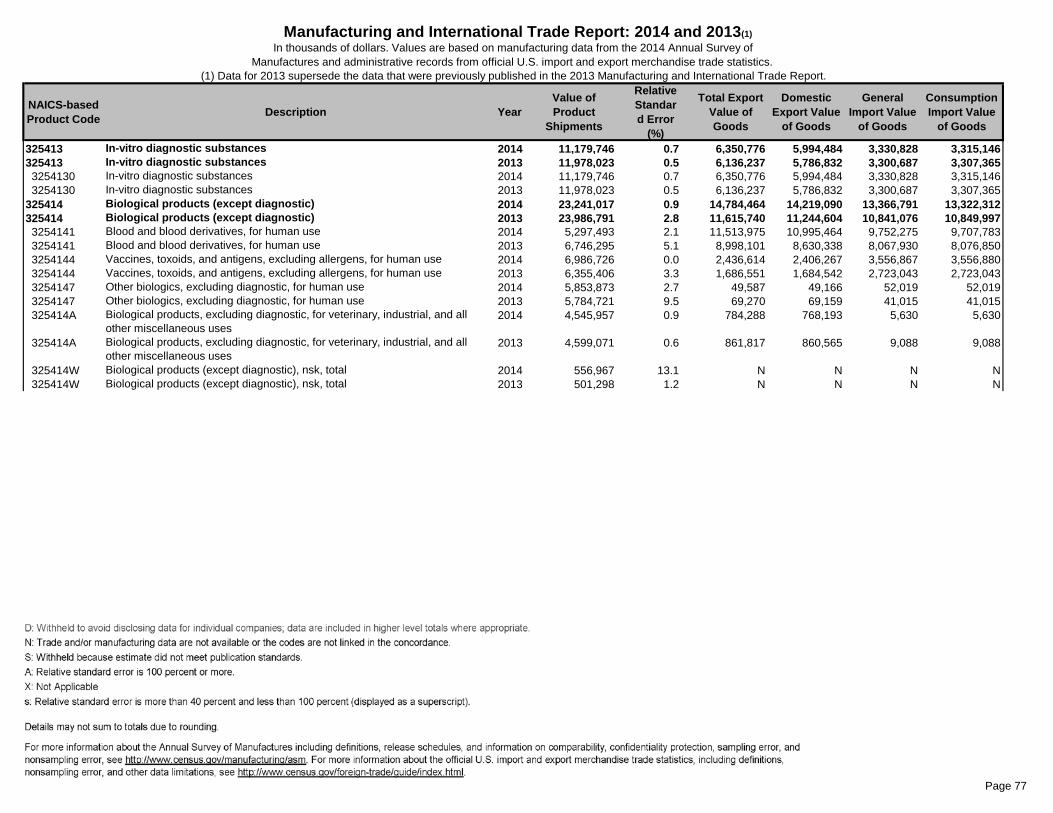
Table
Page 77
NAICS-based Product Code Description Year
Value of Product
Shipments
Relative Standard Error
(%)
Total Export Value of Goods
Domestic Export Value
of Goods
General Import Value
of Goods
Consumption Import Value
of Goods
Manufacturing and International Trade Report: 2014 and 2013(1)In thousands of dollars. Values are based on manufacturing data from the 2014 Annual Survey of
Manufactures and administrative records from official U.S. import and export merchandise trade statistics. (1) Data for 2013 supersede the data that were previously published in the 2013 Manufacturing and International Trade Report.
325413 In-vitro diagnostic substances 2014 11,179,746 0.7 6,350,776 5,994,484 3,330,828 3,315,146325413 In-vitro diagnostic substances 2013 11,978,023 0.5 6,136,237 5,786,832 3,300,687 3,307,365 3254130 In-vitro diagnostic substances 2014 11,179,746 0.7 6,350,776 5,994,484 3,330,828 3,315,146 3254130 In-vitro diagnostic substances 2013 11,978,023 0.5 6,136,237 5,786,832 3,300,687 3,307,365325414 Biological products (except diagnostic) 2014 23,241,017 0.9 14,784,464 14,219,090 13,366,791 13,322,312325414 Biological products (except diagnostic) 2013 23,986,791 2.8 11,615,740 11,244,604 10,841,076 10,849,997 3254141 Blood and blood derivatives, for human use 2014 5,297,493 2.1 11,513,975 10,995,464 9,752,275 9,707,783 3254141 Blood and blood derivatives, for human use 2013 6,746,295 5.1 8,998,101 8,630,338 8,067,930 8,076,850 3254144 Vaccines, toxoids, and antigens, excluding allergens, for human use 2014 6,986,726 0.0 2,436,614 2,406,267 3,556,867 3,556,880 3254144 Vaccines, toxoids, and antigens, excluding allergens, for human use 2013 6,355,406 3.3 1,686,551 1,684,542 2,723,043 2,723,043 3254147 Other biologics, excluding diagnostic, for human use 2014 5,853,873 2.7 49,587 49,166 52,019 52,019 3254147 Other biologics, excluding diagnostic, for human use 2013 5,784,721 9.5 69,270 69,159 41,015 41,015 325414A Biological products, excluding diagnostic, for veterinary, industrial, and all
other miscellaneous uses2014 4,545,957 0.9 784,288 768,193 5,630 5,630
325414A Biological products, excluding diagnostic, for veterinary, industrial, and all other miscellaneous uses
2013 4,599,071 0.6 861,817 860,565 9,088 9,088
325414W Biological products (except diagnostic), nsk, total 2014 556,967 13.1 N N N N 325414W Biological products (except diagnostic), nsk, total 2013 501,298 1.2 N N N N

Table
Page 78
NAICS-based Product Code Description Year
Value of Product
Shipments
Relative Standard Error
(%)
Total Export Value of Goods
Domestic Export Value
of Goods
General Import Value
of Goods
Consumption Import Value
of Goods
Manufacturing and International Trade Report: 2014 and 2013(1)In thousands of dollars. Values are based on manufacturing data from the 2014 Annual Survey of
Manufactures and administrative records from official U.S. import and export merchandise trade statistics. (1) Data for 2013 supersede the data that were previously published in the 2013 Manufacturing and International Trade Report.
325510 Paints and coatings 2014 26,292,980 0.7 2,705,774 2,625,587 999,158 985,645325510 Paints and coatings 2013 25,828,006 0.6 2,593,208 2,518,753 928,143 915,738 3255101 Architectural coatings 2014 10,218,784 1.2 2,502,943 2,426,509 960,400 955,767 3255101 Architectural coatings 2013 9,992,256 0.8 2,420,567 2,349,895 888,681 884,986 3255104 Product finishes for original equipment manufacturers (OEM), excluding
marine coatings2014 6,996,325 1.3 N N N N
3255104 Product finishes for original equipment manufacturers (OEM), excluding marine coatings
2013 7,294,822 0.6 N N N N
3255107 Special-purpose coatings including all marine coatings, industrial, construction and maintenance coatings, traffic marking paints, etc.
2014 5,731,990 1.2 N N N N
3255107 Special-purpose coatings including all marine coatings, industrial, construction and maintenance coatings, traffic marking paints, etc.
2013 5,330,522 2.3 N N N N
325510B Miscellaneous allied paint products, including paint and varnish removers, thinners, pigment dispersions, glazing compounds, etc.
2014 1,534,254 3.0 202,831 199,078 38,758 29,878
325510B Miscellaneous allied paint products, including paint and varnish removers, thinners, pigment dispersions, glazing compounds, etc.
2013 1,604,339 3.9 172,641 168,857 39,462 30,752
325510W Paints and coatings, nsk, total 2014 1,811,627 0.7 N N N N 325510W Paints and coatings, nsk, total 2013 1,606,068 0.3 N N N N325520 Adhesives 2014 12,296,168 2.1 2,338,253 2,267,289 662,070 657,885325520 Adhesives 2013 11,808,738 1.2 2,276,790 2,203,140 614,178 611,769 3255201 Natural base glues and adhesives 2014 1,025,736 7.8 238,767 224,737 9,066 9,006 3255201 Natural base glues and adhesives 2013 976,854 0.7 212,362 198,778 9,610 9,622 3255204 Synthetic resin and rubber adhesives, including all types of bonding and
laminating adhesives2014 7,533,185 2.6 1,209,070 1,173,624 282,540 281,825
3255204 Synthetic resin and rubber adhesives, including all types of bonding and laminating adhesives
2013 7,298,041 1.6 1,205,857 1,164,403 273,230 273,089
3255207 Structural sealants (load-bearing) 2014 363,094 6.6 N N N N 3255207 Structural sealants (load-bearing) 2013 441,517 0.5 N N N N 325520A Nonstructural caulking compounds and sealants 2014 2,483,249 2.2 563,394 549,817 117,795 117,915 325520A Nonstructural caulking compounds and sealants 2013 2,242,034 4.0 557,344 546,388 116,190 116,435 325520W Adhesives, nsk, total 2014 890,905 14.8 N N N N 325520W Adhesives, nsk, total 2013 850,291 1.1 N N N N 325520X Undistributed adhesives 2014 N X 327,023 319,111 252,668 249,139 325520X Undistributed adhesives 2013 N X 301,228 293,571 215,147 212,623
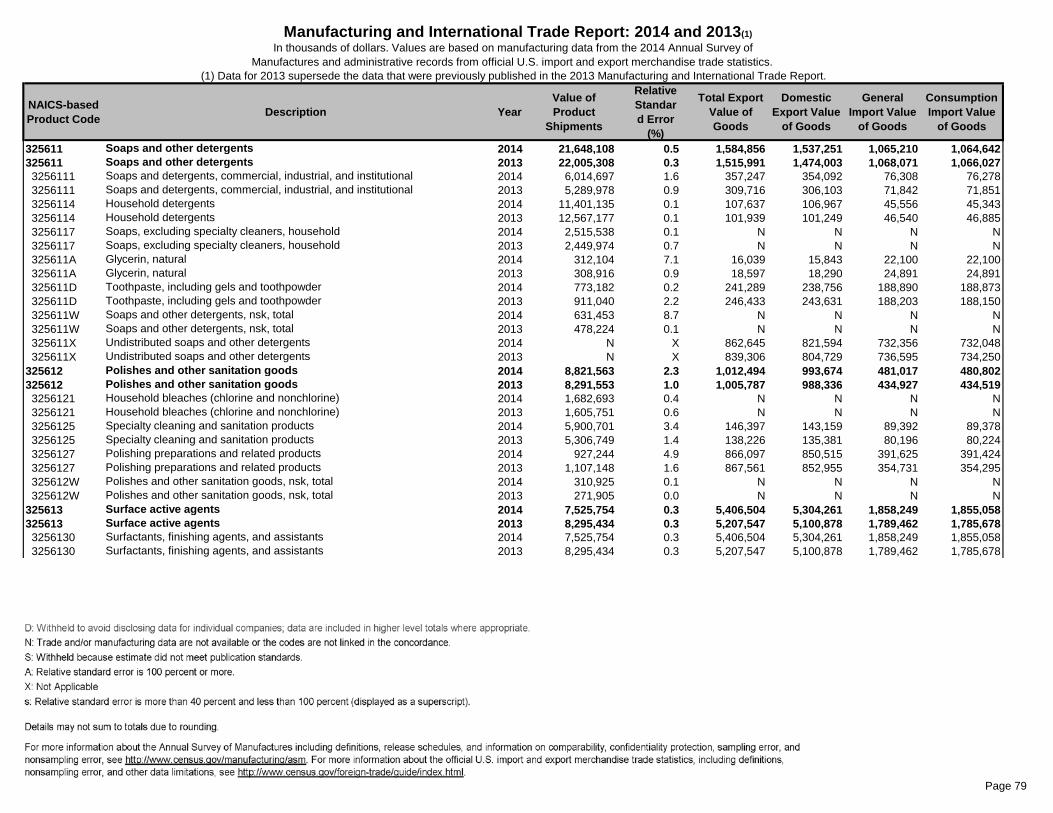
Table
Page 79
NAICS-based Product Code Description Year
Value of Product
Shipments
Relative Standard Error
(%)
Total Export Value of Goods
Domestic Export Value
of Goods
General Import Value
of Goods
Consumption Import Value
of Goods
Manufacturing and International Trade Report: 2014 and 2013(1)In thousands of dollars. Values are based on manufacturing data from the 2014 Annual Survey of
Manufactures and administrative records from official U.S. import and export merchandise trade statistics. (1) Data for 2013 supersede the data that were previously published in the 2013 Manufacturing and International Trade Report.
325611 Soaps and other detergents 2014 21,648,108 0.5 1,584,856 1,537,251 1,065,210 1,064,642325611 Soaps and other detergents 2013 22,005,308 0.3 1,515,991 1,474,003 1,068,071 1,066,027 3256111 Soaps and detergents, commercial, industrial, and institutional 2014 6,014,697 1.6 357,247 354,092 76,308 76,278 3256111 Soaps and detergents, commercial, industrial, and institutional 2013 5,289,978 0.9 309,716 306,103 71,842 71,851 3256114 Household detergents 2014 11,401,135 0.1 107,637 106,967 45,556 45,343 3256114 Household detergents 2013 12,567,177 0.1 101,939 101,249 46,540 46,885 3256117 Soaps, excluding specialty cleaners, household 2014 2,515,538 0.1 N N N N 3256117 Soaps, excluding specialty cleaners, household 2013 2,449,974 0.7 N N N N 325611A Glycerin, natural 2014 312,104 7.1 16,039 15,843 22,100 22,100 325611A Glycerin, natural 2013 308,916 0.9 18,597 18,290 24,891 24,891 325611D Toothpaste, including gels and toothpowder 2014 773,182 0.2 241,289 238,756 188,890 188,873 325611D Toothpaste, including gels and toothpowder 2013 911,040 2.2 246,433 243,631 188,203 188,150 325611W Soaps and other detergents, nsk, total 2014 631,453 8.7 N N N N 325611W Soaps and other detergents, nsk, total 2013 478,224 0.1 N N N N 325611X Undistributed soaps and other detergents 2014 N X 862,645 821,594 732,356 732,048 325611X Undistributed soaps and other detergents 2013 N X 839,306 804,729 736,595 734,250325612 Polishes and other sanitation goods 2014 8,821,563 2.3 1,012,494 993,674 481,017 480,802325612 Polishes and other sanitation goods 2013 8,291,553 1.0 1,005,787 988,336 434,927 434,519 3256121 Household bleaches (chlorine and nonchlorine) 2014 1,682,693 0.4 N N N N 3256121 Household bleaches (chlorine and nonchlorine) 2013 1,605,751 0.6 N N N N 3256125 Specialty cleaning and sanitation products 2014 5,900,701 3.4 146,397 143,159 89,392 89,378 3256125 Specialty cleaning and sanitation products 2013 5,306,749 1.4 138,226 135,381 80,196 80,224 3256127 Polishing preparations and related products 2014 927,244 4.9 866,097 850,515 391,625 391,424 3256127 Polishing preparations and related products 2013 1,107,148 1.6 867,561 852,955 354,731 354,295 325612W Polishes and other sanitation goods, nsk, total 2014 310,925 0.1 N N N N 325612W Polishes and other sanitation goods, nsk, total 2013 271,905 0.0 N N N N325613 Surface active agents 2014 7,525,754 0.3 5,406,504 5,304,261 1,858,249 1,855,058325613 Surface active agents 2013 8,295,434 0.3 5,207,547 5,100,878 1,789,462 1,785,678 3256130 Surfactants, finishing agents, and assistants 2014 7,525,754 0.3 5,406,504 5,304,261 1,858,249 1,855,058 3256130 Surfactants, finishing agents, and assistants 2013 8,295,434 0.3 5,207,547 5,100,878 1,789,462 1,785,678

Table
Page 80
NAICS-based Product Code Description Year
Value of Product
Shipments
Relative Standard Error
(%)
Total Export Value of Goods
Domestic Export Value
of Goods
General Import Value
of Goods
Consumption Import Value
of Goods
Manufacturing and International Trade Report: 2014 and 2013(1)In thousands of dollars. Values are based on manufacturing data from the 2014 Annual Survey of
Manufactures and administrative records from official U.S. import and export merchandise trade statistics. (1) Data for 2013 supersede the data that were previously published in the 2013 Manufacturing and International Trade Report.
325620 Toilet preparations 2014 34,796,936 3.2 8,880,533 7,950,899 7,689,514 7,865,837325620 Toilet preparations 2013 33,740,755 0.2 8,484,637 7,639,796 7,129,292 7,332,010 3256201 All shaving preparations 2014 279,843 0.7 76,397 73,624 59,755 59,659 3256201 All shaving preparations 2013 249,537 0.7 72,311 68,361 61,638 61,414 3256204 Perfumes, toilet waters, and colognes 2014 2,767,961 1.5 2,068,027 1,703,317 2,199,863 2,355,397 3256204 Perfumes, toilet waters, and colognes 2013 2,829,620 0.6 2,042,226 1,688,444 2,089,035 2,267,909 3256207 Hair preparations (including shampoos) 2014 6,839,991 12.8 1,318,562 1,229,825 1,112,776 1,114,796 3256207 Hair preparations (including shampoos) 2013 5,649,013 0.8 1,246,852 1,174,097 1,076,878 1,086,045 325620A Dentifrices, mouthwashes, gargles, and rinses 2014 3,490,673 1.5 293,491 279,981 191,084 191,063 325620A Dentifrices, mouthwashes, gargles, and rinses 2013 3,346,865 0.4 270,294 256,044 199,013 199,009 325620D Creams, lotions and oils, excluding shaving, hair, and deodorant 2014 7,446,784 1.9 242,536 237,966 164,760 163,606 325620D Creams, lotions and oils, excluding shaving, hair, and deodorant 2013 7,227,099 0.6 227,042 222,513 151,098 149,903 325620G Other cosmetics and toilet preparations 2014 12,460,412 1.6 4,358,652 3,912,734 3,824,011 3,844,411 325620G Other cosmetics and toilet preparations 2013 11,969,730 0.3 4,144,101 3,756,365 3,386,203 3,402,318 325620W Toilet preparations, nsk, total 2014 1,511,273 s 42.7 s N N N N 325620W Toilet preparations, nsk, total 2013 2,468,892 0.6 N N N N 325620X Undistributed toilet preparations 2014 N X 522,868 513,452 137,265 136,905 325620X Undistributed toilet preparations 2013 N X 481,811 473,970 165,428 165,412

Table
Page 81
NAICS-based Product Code Description Year
Value of Product
Shipments
Relative Standard Error
(%)
Total Export Value of Goods
Domestic Export Value
of Goods
General Import Value
of Goods
Consumption Import Value
of Goods
Manufacturing and International Trade Report: 2014 and 2013(1)In thousands of dollars. Values are based on manufacturing data from the 2014 Annual Survey of
Manufactures and administrative records from official U.S. import and export merchandise trade statistics. (1) Data for 2013 supersede the data that were previously published in the 2013 Manufacturing and International Trade Report.
325910 Printing inks 2014 5,127,446 1.8 1,342,350 992,784 9,630,705 9,880,910325910 Printing inks 2013 5,375,670 2.2 1,397,636 1,030,381 10,121,065 10,271,845 3259101 Letterpress printing inks 2014 244,807 6.9 92,217 79,399 13,015 12,976 3259101 Letterpress printing inks 2013 318,320 15.4 103,744 95,137 7,957 7,957 3259104 Lithographic and offset inks 2014 1,111,757 6.5 102,979 99,649 74,167 74,167 3259104 Lithographic and offset inks 2013 1,308,632 3.2 99,703 96,510 73,018 73,018 3259107 Gravure printing inks 2014 457,268 5.6 10,425 8,630 10,240 10,240 3259107 Gravure printing inks 2013 514,765 3.4 9,536 8,417 9,647 9,647 325910A Flexographic printing inks 2014 801,853 4.7 63,477 61,352 28,814 28,814 325910A Flexographic printing inks 2013 663,515 5.5 60,092 58,665 28,530 28,530 325910E Nonimpact/digital inks 2014 1,387,163 0.3 484,696 238,813 N N 325910E Nonimpact/digital inks 2013 1,534,541 5.8 542,101 261,587 N N 325910H All other printing inks 2014 542,947 4.3 N N N N 325910H All other printing inks 2013 495,545 0.5 N N N N 325910W Printing inks, nsk, total 2014 581,651 3.1 N N N N 325910W Printing inks, nsk, total 2013 540,351 0.4 N N N N 325910X Undistributed printing inks 2014 N X 588,555 504,941 9,504,470 9,754,713 325910X Undistributed printing inks 2013 N X 582,461 510,065 10,001,914 10,152,694325920 Explosives 2014 2,056,970 2.6 768,038 705,562 433,373 454,485325920 Explosives 2013 1,903,051 1.0 733,993 665,399 384,698 397,837 3259200 Explosives and blasting accessories 2014 2,056,970 2.6 768,038 705,562 433,373 454,485 3259200 Explosives and blasting accessories 2013 1,903,051 1.0 733,993 665,399 384,698 397,837325991 Custom compounding of purchased resins 2014 10,429,246 0.4 N N N N325991 Custom compounding of purchased resins 2013 10,621,612 0.8 N N N N 3259910 Custom compounding of purchased resins and color concentrates 2014 10,429,246 0.4 N N N N 3259910 Custom compounding of purchased resins and color concentrates 2013 10,621,612 0.8 N N N N

Table
Page 82
NAICS-based Product Code Description Year
Value of Product
Shipments
Relative Standard Error
(%)
Total Export Value of Goods
Domestic Export Value
of Goods
General Import Value
of Goods
Consumption Import Value
of Goods
Manufacturing and International Trade Report: 2014 and 2013(1)In thousands of dollars. Values are based on manufacturing data from the 2014 Annual Survey of
Manufactures and administrative records from official U.S. import and export merchandise trade statistics. (1) Data for 2013 supersede the data that were previously published in the 2013 Manufacturing and International Trade Report.
325992 Photographic film, paper, plates, and chemicals 2014 5,837,180 1.4 2,201,279 2,034,018 1,451,817 908,849325992 Photographic film, paper, plates, and chemicals 2013 6,048,196 1.1 2,381,706 2,216,354 1,456,078 952,165 3259921 Photographic sensitized film, plates, paper, and cloth, silver-halide-type
(excluding X-ray)2014 2,339,933 0.3 195,515 186,503 64,234 71,005
3259921 Photographic sensitized film, plates, paper, and cloth, silver-halide-type (excluding X-ray)
2013 2,332,736 0.1 223,515 212,173 71,551 79,186
3259923 Sensitized photographic film, plates, paper, and cloth, other than silver-halide-type (including X-ray)
2014 1,287,524 2.3 530,560 505,128 141,038 135,256
3259923 Sensitized photographic film, plates, paper, and cloth, other than silver-halide-type (including X-ray)
2013 1,391,942 0.1 567,550 537,531 181,144 164,702
3259925 Prepared photographic chemicals 2014 1,935,027 3.7 603,682 529,999 669,847 287,837 3259925 Prepared photographic chemicals 2013 2,057,505 3.3 662,039 594,016 705,555 319,125 325992W Photographic film, paper, plates, and chemicals, nsk, total 2014 274,695 12.6 N N N N 325992W Photographic film, paper, plates, and chemicals, nsk, total 2013 266,011 0.7 N N N N 325992X Undistributed photographic film, paper, plates, and chemicals 2014 N X 871,521 812,388 576,699 414,751 325992X Undistributed photographic film, paper, plates, and chemicals 2013 N X 928,603 872,633 497,829 389,151325998 All other miscellaneous chemical products and preparations 2014 20,635,704 2.0 5,939,720 5,805,960 3,447,980 3,412,214325998 All other miscellaneous chemical products and preparations 2013 20,085,105 0.8 6,010,723 5,887,168 3,240,718 3,191,083 3259981 Evaporated salt (bulk, pressed blocks, and packaged), excluding table salt 2014 999,706 6.0 N N N N 3259981 Evaporated salt (bulk, pressed blocks, and packaged), excluding table salt 2013 943,799 0.7 N N N N 3259984 Matches 2014 30,118 1.3 1,827 1,754 3,555 3,478 3259984 Matches 2013 28,593 1.6 1,406 1,260 4,129 4,074 3259987 Gelatin, excluding ready-to-eat desserts 2014 781,688 0.2 231,425 220,284 375,800 355,195 3259987 Gelatin, excluding ready-to-eat desserts 2013 772,130 1.3 248,096 234,101 417,065 390,407 325998A Water treating compounds 2014 3,283,690 1.1 N N N N 325998A Water treating compounds 2013 3,325,011 0.9 N N N N 325998E Automotive chemicals 2014 1,979,257 2.9 N N N N 325998E Automotive chemicals 2013 1,860,367 1.0 N N N N 325998J All other chemical preparations, including essential oils 2014 10,920,694 3.2 5,706,468 5,583,922 3,068,625 3,053,541 325998J All other chemical preparations, including essential oils 2013 10,644,602 1.4 5,761,222 5,651,807 2,819,524 2,796,602 325998W All other miscellaneous chemical products and preparations, nsk, total 2014 2,640,552 7.3 N N N N 325998W All other miscellaneous chemical products and preparations, nsk, total 2013 2,510,602 0.5 N N N N

Table
Page 83
NAICS-based Product Code Description Year
Value of Product
Shipments
Relative Standard Error
(%)
Total Export Value of Goods
Domestic Export Value
of Goods
General Import Value
of Goods
Consumption Import Value
of Goods
Manufacturing and International Trade Report: 2014 and 2013(1)In thousands of dollars. Values are based on manufacturing data from the 2014 Annual Survey of
Manufactures and administrative records from official U.S. import and export merchandise trade statistics. (1) Data for 2013 supersede the data that were previously published in the 2013 Manufacturing and International Trade Report.
326111 Plastics bags 2014 9,617,129 0.9 987,716 931,051 2,453,140 2,449,784326111 Plastics bags 2013 9,261,326 0.3 925,092 869,381 2,258,302 2,252,799 3261111 Single-web film specialty bags, pouches, and liners 2014 8,205,494 0.9 N N N N 3261111 Single-web film specialty bags, pouches, and liners 2013 8,002,619 0.3 N N N N 3261113 Multiweb film/film combination specialty bags, pouches, and liners 2014 1,114,350 1.9 N N N N 3261113 Multiweb film/film combination specialty bags, pouches, and liners 2013 975,846 1.1 N N N N 326111W Plastics bags, nsk, total 2014 297,285 8.3 N N N N 326111W Plastics bags, nsk, total 2013 282,860 0.7 N N N N 326111X Undistributed plastics bags 2014 N X 987,716 931,051 2,453,140 2,449,784 326111X Undistributed plastics bags 2013 N X 925,092 869,381 2,258,302 2,252,799326112 Plastics packaging film and sheet (including laminated) 2014 12,685,925 1.0 N N N N326112 Plastics packaging film and sheet (including laminated) 2013 12,362,836 0.3 N N N N 3261121 Single-web film, rolls, and sheets, including coextruded, for flexible 2014 8,782,051 1.1 N N N N 3261121 Single-web film, rolls, and sheets, including coextruded, for flexible 2013 8,542,343 0.3 N N N N 3261123 Film/film multiweb laminated rolls and sheets, excluding foil, for flexible
packaging uses2014 3,590,115 2.1 N N N N
3261123 Film/film multiweb laminated rolls and sheets, excluding foil, for flexible packaging uses
2013 3,522,950 0.7 N N N N
326112W Plastics packaging film and sheet (including laminated), nsk, total 2014 313,758 3.2 N N N N 326112W Plastics packaging film and sheet (including laminated), nsk, total 2013 297,543 3.6 N N N N326113 Unlaminated plastics film and sheet (except packaging) 2014 20,297,991 0.8 7,913,416 7,483,883 6,315,911 6,173,650326113 Unlaminated plastics film and sheet (except packaging) 2013 19,926,171 0.4 7,358,644 7,005,696 5,847,609 5,685,210 3261130 Unlaminated plastics film and sheet, excluding packaging 2014 20,297,991 0.8 7,913,416 7,483,883 6,315,911 6,173,650 3261130 Unlaminated plastics film and sheet, excluding packaging 2013 19,926,171 0.4 7,358,644 7,005,696 5,847,609 5,685,210326121 Unlaminated plastics profile shapes 2014 6,424,037 1.2 551,489 534,568 340,217 340,211326121 Unlaminated plastics profile shapes 2013 6,265,316 0.6 522,823 512,495 313,024 312,890 3261210 Unlaminated plastics profile shapes 2014 6,424,037 1.2 551,489 534,568 340,217 340,211 3261210 Unlaminated plastics profile shapes 2013 6,265,316 0.6 522,823 512,495 313,024 312,890 3261211 Unlaminated plastics profile shapes 2014 N X N N 0 0 3261211 Unlaminated plastics profile shapes 2013 N X N N 0 0

Table
Page 84
NAICS-based Product Code Description Year
Value of Product
Shipments
Relative Standard Error
(%)
Total Export Value of Goods
Domestic Export Value
of Goods
General Import Value
of Goods
Consumption Import Value
of Goods
Manufacturing and International Trade Report: 2014 and 2013(1)In thousands of dollars. Values are based on manufacturing data from the 2014 Annual Survey of
Manufactures and administrative records from official U.S. import and export merchandise trade statistics. (1) Data for 2013 supersede the data that were previously published in the 2013 Manufacturing and International Trade Report.
326122 Plastics pipe and pipe fittings 2014 10,765,514 3.6 1,518,733 1,443,146 617,086 613,095326122 Plastics pipe and pipe fittings 2013 9,647,732 0.7 1,526,275 1,467,207 561,154 558,527 3261221 Plastics pipe 2014 8,563,285 4.3 595,927 582,727 258,781 256,674 3261221 Plastics pipe 2013 7,633,492 0.3 628,548 618,334 232,301 231,575 3261223 Plastics pipe fittings and unions 2014 1,747,069 6.6 573,119 535,715 358,305 356,421 3261223 Plastics pipe fittings and unions 2013 1,589,639 4.0 528,124 498,388 328,853 326,952 326122W Plastics pipe and pipe fittings, nsk, total 2014 455,160 6.6 N N N N 326122W Plastics pipe and pipe fittings, nsk, total 2013 424,601 0.6 N N N N 326122X Undistributed plastics pipe and pipe fittings 2014 N X 349,686 324,704 N N 326122X Undistributed plastics pipe and pipe fittings 2013 N X 369,603 350,485 N N326130 Laminated plastics plates, sheet (except packaging), and shapes 2014 3,692,213 1.6 N N N N326130 Laminated plastics plates, sheet (except packaging), and shapes 2013 3,512,132 0.4 N N N N 3261300 Laminated plastics plates, sheet (excluding packaging), and shapes 2014 3,692,213 1.6 N N N N 3261300 Laminated plastics plates, sheet (excluding packaging), and shapes 2013 3,512,132 0.4 N N N N326140 Polystyrene foam products 2014 7,640,847 1.5 N N N N326140 Polystyrene foam products 2013 8,109,813 0.5 N N N N 3261401 Transportation polystyrene foam products (including seating, dash, and other
interior-exterior components)2014 661,298 4.2 N N N N
3261401 Transportation polystyrene foam products (including seating, dash, and other interior-exterior components)
2013 673,803 2.4 N N N N
3261402 Packaging, polystyrene foam products 2014 2,262,604 2.6 N N N N 3261402 Packaging, polystyrene foam products 2013 2,413,039 0.7 N N N N 3261403 Building and construction polystyrene foam products 2014 1,418,924 2.9 N N N N 3261403 Building and construction polystyrene foam products 2013 1,451,146 1.3 N N N N 3261405 Consumer and institutional polystyrene foam products 2014 2,621,089 3.0 N N N N 3261405 Consumer and institutional polystyrene foam products 2013 2,890,419 0.9 N N N N 3261407 Furniture, Furnishings, and Miscellaneous polystyrene foam products 2014 329,062 2.5 N N N N 3261407 Furniture, Furnishings, and Miscellaneous polystyrene foam products 2013 315,554 1.2 N N N N 326140W Polystyrene foam products, nsk, total 2014 347,870 12.0 N N N N 326140W Polystyrene foam products, nsk, total 2013 365,851 0.2 N N N N

Table
Page 85
NAICS-based Product Code Description Year
Value of Product
Shipments
Relative Standard Error
(%)
Total Export Value of Goods
Domestic Export Value
of Goods
General Import Value
of Goods
Consumption Import Value
of Goods
Manufacturing and International Trade Report: 2014 and 2013(1)In thousands of dollars. Values are based on manufacturing data from the 2014 Annual Survey of
Manufactures and administrative records from official U.S. import and export merchandise trade statistics. (1) Data for 2013 supersede the data that were previously published in the 2013 Manufacturing and International Trade Report.
326150 Urethane and other foam products (except polystyrene) 2014 10,218,778 1.6 N N N N326150 Urethane and other foam products (except polystyrene) 2013 9,510,655 0.9 N N N N 3261501 Transportation polyurethane foam products 2014 1,317,342 4.6 N N N N 3261501 Transportation polyurethane foam products 2013 1,223,176 2.0 N N N N 3261502 Packaging polyurethane foam products 2014 462,583 4.4 N N N N 3261502 Packaging polyurethane foam products 2013 414,000 4.2 N N N N 3261503 Building and construction polyurethane foam products 2014 1,322,360 3.1 N N N N 3261503 Building and construction polyurethane foam products 2013 1,282,211 0.6 N N N N 3261504 Furniture and furnishings polyurethane foam products 2014 3,579,482 1.9 N N N N 3261504 Furniture and furnishings polyurethane foam products 2013 3,245,069 1.2 N N N N 3261505 Consumer and institutional polyurethane foam products 2014 1,010,171 5.3 N N N N 3261505 Consumer and institutional polyurethane foam products 2013 960,684 0.7 N N N N 3261506 All other miscellaneous polyurethane foam products 2014 802,843 11.8 N N N N 3261506 All other miscellaneous polyurethane foam products 2013 721,385 2.6 N N N N 3261509 Products made of foam other than polystyrene or polyurethane, including
phenolics, vinyl and cellulose acetate, etc.2014 1,141,263 4.6 N N N N
3261509 Products made of foam other than polystyrene or polyurethane, including phenolics, vinyl and cellulose acetate, etc.
2013 1,110,038 5.9 N N N N
326150W Urethane and other foam products (except polystyrene), nsk, total 2014 582,735 4.6 N N N N 326150W Urethane and other foam products (except polystyrene), nsk, total 2013 554,093 4.2 N N N N326160 Plastics bottles 2014 12,430,909 0.8 728,960 690,285 915,328 903,564326160 Plastics bottles 2013 11,977,234 1.0 740,582 709,221 915,184 896,874 3261600 Plastics bottles 2014 12,430,909 0.8 728,960 690,285 915,328 903,564 3261600 Plastics bottles 2013 11,977,234 1.0 740,582 709,221 915,184 896,874326191 Plastics plumbing fixtures 2014 3,575,552 1.7 93,886 87,712 174,124 174,035326191 Plastics plumbing fixtures 2013 3,249,514 1.2 96,150 90,623 147,093 146,987 3261910 Plastics plumbing fixtures, lavatories, bathtubs (including wall surrounds
when sold as units), shower stalls, hot tubs, spas, sinks, bidets, etc., fiberglass (FRP), PVC, ABS, and cultured marble
2014 3,575,552 1.7 93,886 87,712 174,124 174,035
3261910 Plastics plumbing fixtures, lavatories, bathtubs (including wall surrounds when sold as units), shower stalls, hot tubs, spas, sinks, bidets, etc., fiberglass (FRP), PVC, ABS, and cultured marble
2013 3,249,514 1.2 96,150 90,623 147,093 146,987

Table
Page 86
NAICS-based Product Code Description Year
Value of Product
Shipments
Relative Standard Error
(%)
Total Export Value of Goods
Domestic Export Value
of Goods
General Import Value
of Goods
Consumption Import Value
of Goods
Manufacturing and International Trade Report: 2014 and 2013(1)In thousands of dollars. Values are based on manufacturing data from the 2014 Annual Survey of
Manufactures and administrative records from official U.S. import and export merchandise trade statistics. (1) Data for 2013 supersede the data that were previously published in the 2013 Manufacturing and International Trade Report.
326199 All other plastics products 2014 87,595,957 1.6 11,118,793 9,923,369 17,365,117 17,167,160326199 All other plastics products 2013 81,762,707 0.4 10,586,461 9,534,625 16,403,034 16,190,895 3261991 Transportation fabricated plastics products (excluding foam and reinforced 2014 19,001,716 1.2 102,052 97,627 41,766 37,101 3261991 Transportation fabricated plastics products (excluding foam and reinforced 2013 16,663,549 0.9 88,674 84,936 34,226 31,409 3261992 Electrical and electronic fabricated plastics (excluding foam and reinforced
plastics)2014 2,756,318 3.0 166,221 127,596 89,577 88,786
3261992 Electrical and electronic fabricated plastics (excluding foam and reinforced plastics)
2013 2,818,093 2.3 135,619 115,044 73,911 73,593
3261993 Industrial machinery plastics products, excluding foam (including gears, bearings, bushings, cams, and other components)
2014 3,277,748 7.7 N N N N
3261993 Industrial machinery plastics products, excluding foam (including gears, bearings, bushings, cams, and other components)
2013 2,791,715 4.9 N N N N
3261994 Plastics packaging (excluding film and sheet, foam, and bottles) 2014 16,082,689 7.3 3,503,084 3,256,557 3,293,260 3,222,197 3261994 Plastics packaging (excluding film and sheet, foam, and bottles) 2013 14,494,360 0.8 3,355,853 3,136,752 3,183,966 3,096,484 3261995 Plastics dinnerware, tableware, kitchenware, and oven-microwave ware
(excluding foam and cups)2014 2,070,674 3.3 501,103 439,036 2,465,150 2,466,669
3261995 Plastics dinnerware, tableware, kitchenware, and oven-microwave ware (excluding foam and cups)
2013 2,202,905 1.1 459,094 402,231 2,264,716 2,246,814
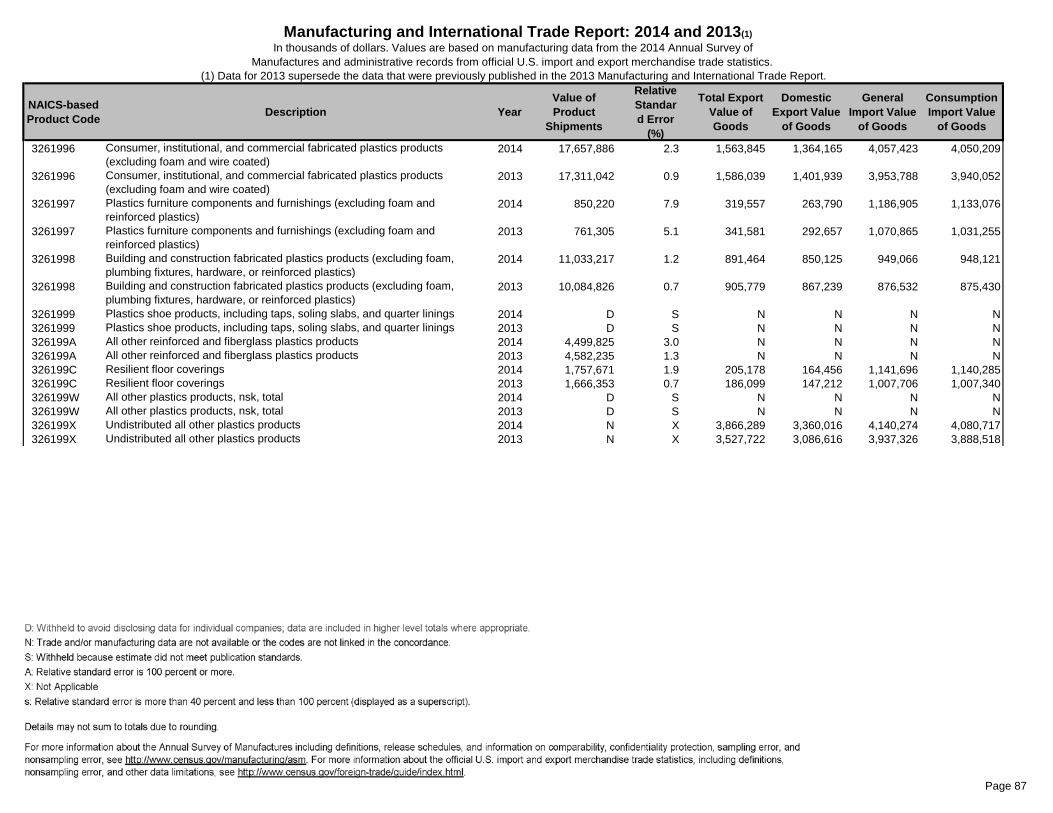
Table
Page 87
NAICS-based Product Code Description Year
Value of Product
Shipments
Relative Standard Error
(%)
Total Export Value of Goods
Domestic Export Value
of Goods
General Import Value
of Goods
Consumption Import Value
of Goods
Manufacturing and International Trade Report: 2014 and 2013(1)In thousands of dollars. Values are based on manufacturing data from the 2014 Annual Survey of
Manufactures and administrative records from official U.S. import and export merchandise trade statistics. (1) Data for 2013 supersede the data that were previously published in the 2013 Manufacturing and International Trade Report.
3261996 Consumer, institutional, and commercial fabricated plastics products (excluding foam and wire coated)
2014 17,657,886 2.3 1,563,845 1,364,165 4,057,423 4,050,209
3261996 Consumer, institutional, and commercial fabricated plastics products (excluding foam and wire coated)
2013 17,311,042 0.9 1,586,039 1,401,939 3,953,788 3,940,052
3261997 Plastics furniture components and furnishings (excluding foam and reinforced plastics)
2014 850,220 7.9 319,557 263,790 1,186,905 1,133,076
3261997 Plastics furniture components and furnishings (excluding foam and reinforced plastics)
2013 761,305 5.1 341,581 292,657 1,070,865 1,031,255
3261998 Building and construction fabricated plastics products (excluding foam, plumbing fixtures, hardware, or reinforced plastics)
2014 11,033,217 1.2 891,464 850,125 949,066 948,121
3261998 Building and construction fabricated plastics products (excluding foam, plumbing fixtures, hardware, or reinforced plastics)
2013 10,084,826 0.7 905,779 867,239 876,532 875,430
3261999 Plastics shoe products, including taps, soling slabs, and quarter linings 2014 D S N N N N 3261999 Plastics shoe products, including taps, soling slabs, and quarter linings 2013 D S N N N N 326199A All other reinforced and fiberglass plastics products 2014 4,499,825 3.0 N N N N 326199A All other reinforced and fiberglass plastics products 2013 4,582,235 1.3 N N N N 326199C Resilient floor coverings 2014 1,757,671 1.9 205,178 164,456 1,141,696 1,140,285 326199C Resilient floor coverings 2013 1,666,353 0.7 186,099 147,212 1,007,706 1,007,340 326199W All other plastics products, nsk, total 2014 D S N N N N 326199W All other plastics products, nsk, total 2013 D S N N N N 326199X Undistributed all other plastics products 2014 N X 3,866,289 3,360,016 4,140,274 4,080,717 326199X Undistributed all other plastics products 2013 N X 3,527,722 3,086,616 3,937,326 3,888,518

Table
Page 88
NAICS-based Product Code Description Year
Value of Product
Shipments
Relative Standard Error
(%)
Total Export Value of Goods
Domestic Export Value
of Goods
General Import Value
of Goods
Consumption Import Value
of Goods
Manufacturing and International Trade Report: 2014 and 2013(1)In thousands of dollars. Values are based on manufacturing data from the 2014 Annual Survey of
Manufactures and administrative records from official U.S. import and export merchandise trade statistics. (1) Data for 2013 supersede the data that were previously published in the 2013 Manufacturing and International Trade Report.
326211 Tires (except retreading) 2014 16,606,735 0.5 5,904,081 5,209,698 14,735,216 14,695,181326211 Tires (except retreading) 2013 16,889,112 0.1 5,989,854 5,259,237 14,495,732 14,428,840 3262111 Passenger car pneumatic tires (casings) 2014 8,883,646 0.0 2,251,267 1,811,406 7,681,320 7,649,099 3262111 Passenger car pneumatic tires (casings) 2013 8,974,297 0.1 2,388,502 1,913,449 7,840,188 7,745,215 3262113 Truck and bus (including off-the-highway) pneumatic tires 2014 4,368,897 0.0 2,500,742 2,388,384 4,333,010 4,328,113 3262113 Truck and bus (including off-the-highway) pneumatic tires 2013 4,385,532 0.1 2,240,607 2,144,282 3,988,610 3,997,556 3262117 Tractor and implement (farm and industrial) pneumatic tires 2014 755,830 0.0 206,940 195,666 364,734 360,564 3262117 Tractor and implement (farm and industrial) pneumatic tires 2013 930,294 0.3 274,203 264,641 358,321 363,667 3262119 Industrial and utility pneumatic tires (including garden) 2014 80,711 0.0 385,994 315,127 779,971 779,387 3262119 Industrial and utility pneumatic tires (including garden) 2013 68,035 1.0 563,367 479,886 773,496 788,835 326211B Other pneumatic tires and casing including motor bike, motorcycle, moped,
bicycle, aircraft, and mobile home2014 521,667 2.5 167,559 137,982 318,235 317,143
326211B Other pneumatic tires and casing including motor bike, motorcycle, moped, bicycle, aircraft, and mobile home
2013 488,247 0.1 169,592 144,298 311,544 312,578
326211D Solid and semipneumatic tires 2014 113,885 s 66.4 s 30,342 25,006 224,870 224,733 326211D Solid and semipneumatic tires 2013 197,270 0.4 26,602 20,165 214,027 214,027 326211F Inner tubes 2014 42,488 4.2 14,995 12,729 123,059 122,637 326211F Inner tubes 2013 44,467 0.0 16,821 12,695 116,964 116,290 326211H Tread rubber, tire sundries, and repair materials 2014 1,462,749 0.2 110,628 104,045 102,473 102,484 326211H Tread rubber, tire sundries, and repair materials 2013 1,434,579 0.6 113,805 104,895 94,649 94,690 326211W Tires (except retreading), nsk, total 2014 376,862 0.1 N N N N 326211W Tires (except retreading), nsk, total 2013 366,393 0.0 N N N N 326211X Undistributed tires (except retreading) 2014 N X 235,613 219,352 807,545 811,020 326211X Undistributed tires (except retreading) 2013 N X 196,357 174,926 797,934 795,981326212 Tire retreading 2014 1,665,379 3.2 35,873 31,645 17,298 17,261326212 Tire retreading 2013 1,558,600 1.1 36,304 24,847 12,090 12,090 3262120 Tire rebuilding and retreading (excluding tire repairing, such as pluggings) 2014 1,665,379 3.2 35,873 31,645 17,298 17,261 3262120 Tire rebuilding and retreading (excluding tire repairing, such as pluggings) 2013 1,558,600 1.1 36,304 24,847 12,090 12,090

Table
Page 89
NAICS-based Product Code Description Year
Value of Product
Shipments
Relative Standard Error
(%)
Total Export Value of Goods
Domestic Export Value
of Goods
General Import Value
of Goods
Consumption Import Value
of Goods
Manufacturing and International Trade Report: 2014 and 2013(1)In thousands of dollars. Values are based on manufacturing data from the 2014 Annual Survey of
Manufactures and administrative records from official U.S. import and export merchandise trade statistics. (1) Data for 2013 supersede the data that were previously published in the 2013 Manufacturing and International Trade Report.
326220 Rubber and plastics hoses and belting 2014 5,108,202 1.5 2,594,857 2,362,229 3,387,081 3,318,938326220 Rubber and plastics hoses and belting 2013 5,226,349 0.9 2,393,974 2,194,394 3,121,458 3,066,310 3262201 Flat rubber and plastics belts and belting 2014 1,216,882 3.5 182,904 168,369 288,573 288,329 3262201 Flat rubber and plastics belts and belting 2013 1,235,171 1.8 192,508 177,495 292,960 292,788 3262202 Rubber and plastics transmission belts and belting (excluding flat) 2014 761,693 7.3 241,624 203,545 351,772 346,983 3262202 Rubber and plastics transmission belts and belting (excluding flat) 2013 835,700 2.5 226,866 199,997 311,623 308,003 3262203 Rubber and plastics hose for on-and off-highway motor vehicles 2014 1,133,013 2.0 N N N N 3262203 Rubber and plastics hose for on-and off-highway motor vehicles 2013 1,187,469 0.2 N N N N 3262204 Industrial rubber and plastics hose without fittings (acid and chemical
handling, food and beverage, petroleum curb pump, dock, transfer, and other 2014 771,362 2.1 N N N N
3262204 Industrial rubber and plastics hose without fittings (acid and chemical handling, food and beverage, petroleum curb pump, dock, transfer, and other
2013 694,155 1.4 N N N N
3262205 Rubber and plastics water hose (including fire, irrigation, water suction-discharge, and other water hose)
2014 284,708 3.0 N N N N
3262205 Rubber and plastics water hose (including fire, irrigation, water suction-discharge, and other water hose)
2013 264,263 12.8 N N N N
3262206 Rubber and plastics garden hose (with or without fittings) 2014 175,911 1.6 N N N N 3262206 Rubber and plastics garden hose (with or without fittings) 2013 202,949 6.5 N N N N 3262207 Rubber and plastics inner-tube-type air hose (excluding pneumatic power 2014 29,182 4.2 N N N N 3262207 Rubber and plastics inner-tube-type air hose (excluding pneumatic power 2013 35,786 0.0 N N N N 3262208 All other pneumatic and hydraulic hose, without fittings, made of rubber and
plastics2014 567,268 2.4 N N N N
3262208 All other pneumatic and hydraulic hose, without fittings, made of rubber and plastics
2013 576,099 0.1 N N N N
326220W Rubber and plastics hoses and belting, nsk, total 2014 168,182 3.9 N N N N 326220W Rubber and plastics hoses and belting, nsk, total 2013 194,756 2.0 N N N N 326220X Undistributed rubber and plastics hoses and belting 2014 N X 2,170,329 1,990,316 2,746,736 2,683,626 326220X Undistributed rubber and plastics hoses and belting 2013 N X 1,974,601 1,816,902 2,516,875 2,465,519

Table
Page 90
NAICS-based Product Code Description Year
Value of Product
Shipments
Relative Standard Error
(%)
Total Export Value of Goods
Domestic Export Value
of Goods
General Import Value
of Goods
Consumption Import Value
of Goods
Manufacturing and International Trade Report: 2014 and 2013(1)In thousands of dollars. Values are based on manufacturing data from the 2014 Annual Survey of
Manufactures and administrative records from official U.S. import and export merchandise trade statistics. (1) Data for 2013 supersede the data that were previously published in the 2013 Manufacturing and International Trade Report.
326291 Rubber products for mechanical use 2014 6,327,014 1.0 94,127 82,603 29,872 29,400326291 Rubber products for mechanical use 2013 6,259,783 0.8 75,132 66,515 28,080 27,676 3262911 Molded rubber mechanical goods, automotive 2014 3,243,531 0.9 94,127 82,603 29,872 29,400 3262911 Molded rubber mechanical goods, automotive 2013 3,127,928 0.8 75,132 66,515 28,080 27,676 3262912 Molded rubber mechanical goods, transportation (excluding automotive) and
off-highway machinery and equipment2014 884,899 2.6 N N N N
3262912 Molded rubber mechanical goods, transportation (excluding automotive) and off-highway machinery and equipment
2013 834,748 0.4 N N N N
3262914 Extruded rubber mechanical goods, automotive, excluding tubing 2014 669,289 3.8 N N N N 3262914 Extruded rubber mechanical goods, automotive, excluding tubing 2013 609,482 2.6 N N N N 3262918 Lathe-cut rubber mechanical goods 2014 268,177 8.6 N N N N 3262918 Lathe-cut rubber mechanical goods 2013 315,004 7.5 N N N N 3262919 Other molded rubber mechanical goods (excluding tubing) 2014 649,550 3.9 N N N N 3262919 Other molded rubber mechanical goods (excluding tubing) 2013 790,743 3.1 N N N N 326291C Other extruded rubber mechanical goods (excluding automotive) (excluding 2014 272,632 6.6 N N N N 326291C Other extruded rubber mechanical goods (excluding automotive) (excluding 2013 281,319 5.0 N N N N 326291W Rubber products for mechanical use, nsk, total 2014 338,936 4.5 N N N N 326291W Rubber products for mechanical use, nsk, total 2013 300,559 1.1 N N N N

Table
Page 91
NAICS-based Product Code Description Year
Value of Product
Shipments
Relative Standard Error
(%)
Total Export Value of Goods
Domestic Export Value
of Goods
General Import Value
of Goods
Consumption Import Value
of Goods
Manufacturing and International Trade Report: 2014 and 2013(1)In thousands of dollars. Values are based on manufacturing data from the 2014 Annual Survey of
Manufactures and administrative records from official U.S. import and export merchandise trade statistics. (1) Data for 2013 supersede the data that were previously published in the 2013 Manufacturing and International Trade Report.
326299 All other rubber products 2014 10,972,112 0.7 2,479,182 2,306,388 3,294,693 3,255,842326299 All other rubber products 2013 10,861,145 1.2 2,375,664 2,197,224 3,196,322 3,165,456 3262991 Rubber sponge, expanded and foam rubber products 2014 1,731,505 2.9 N N N N 3262991 Rubber sponge, expanded and foam rubber products 2013 1,516,058 2.6 N N N N 3262993 Rubber floor and wall coverings 2014 618,450 3.1 108,939 101,684 179,268 178,894 3262993 Rubber floor and wall coverings 2013 616,055 0.4 113,573 104,594 147,182 146,635 3262994 Shoe products, rubber, elastomer resin 2014 165,779 2.0 15,170 14,326 229,682 229,638 3262994 Shoe products, rubber, elastomer resin 2013 152,506 0.9 17,041 15,933 263,729 263,724 3262996 Rubber compounds or mixtures for sale or interplant transfer 2014 3,069,836 0.4 785,545 774,436 603,683 603,516 3262996 Rubber compounds or mixtures for sale or interplant transfer 2013 3,275,414 0.6 751,167 741,694 571,253 571,086 3262997 All other industrial rubber products 2014 2,784,173 0.8 N N N N 3262997 All other industrial rubber products 2013 2,662,527 1.1 N N N N 326299A Rubber druggist and medical sundries, excluding gloves 2014 532,751 0.1 69,236 62,686 44,639 42,910 326299A Rubber druggist and medical sundries, excluding gloves 2013 532,039 12.3 98,735 89,288 44,094 44,094 326299B All other miscellaneous rubber goods 2014 1,271,687 3.3 137,481 122,874 831,685 817,734 326299B All other miscellaneous rubber goods 2013 1,334,501 7.5 147,623 131,390 781,905 771,190 326299W All other rubber products, nsk, total 2014 797,931 4.6 N N N N 326299W All other rubber products, nsk, total 2013 772,045 0.8 N N N N 326299X Undistributed all other rubber products 2014 N X 1,362,810 1,230,382 1,405,736 1,383,149 326299X Undistributed all other rubber products 2013 N X 1,247,526 1,114,324 1,388,160 1,368,727

Table
Page 92
NAICS-based Product Code Description Year
Value of Product
Shipments
Relative Standard Error
(%)
Total Export Value of Goods
Domestic Export Value
of Goods
General Import Value
of Goods
Consumption Import Value
of Goods
Manufacturing and International Trade Report: 2014 and 2013(1)In thousands of dollars. Values are based on manufacturing data from the 2014 Annual Survey of
Manufactures and administrative records from official U.S. import and export merchandise trade statistics. (1) Data for 2013 supersede the data that were previously published in the 2013 Manufacturing and International Trade Report.
327110 Pottery, ceramics, and plumbing fixtures 2014 1,995,220 3.3 1,481,277 1,273,070 4,031,821 3,990,473327110 Pottery, ceramics, and plumbing fixtures 2013 1,920,260 0.9 1,371,223 1,164,051 3,728,257 3,690,887 3271101 Vitreous plumbing fixtures 2014 560,551 1.1 145,139 96,883 1,012,811 1,010,443 3271101 Vitreous plumbing fixtures 2013 569,261 0.0 144,978 96,711 981,393 981,033 3271102 Vitreous china, porcelain, and earthenware (semivitreous) table and
kitchenware (including household, hotel, or commercial uses) (including 2014 237,127 6.8 36,281 28,978 368,604 353,918
3271102 Vitreous china, porcelain, and earthenware (semivitreous) table and kitchenware (including household, hotel, or commercial uses) (including
2013 212,262 2.5 31,499 25,381 379,683 359,199
3271103 All other pottery products (including china decorated for the trade) 2014 258,960 9.0 911,504 803,350 2,064,107 2,055,304 3271103 All other pottery products (including china decorated for the trade) 2013 269,764 4.0 833,840 723,263 1,867,469 1,857,425 3271104 Porcelain, steatite, and other ceramic electrical products 2014 832,459 7.2 227,413 195,811 478,779 462,465 3271104 Porcelain, steatite, and other ceramic electrical products 2013 762,348 1.6 198,498 171,014 405,217 399,403 327110W Pottery, ceramics, and plumbing fixtures, nsk, total 2014 106,123 0.7 N N N N 327110W Pottery, ceramics, and plumbing fixtures, nsk, total 2013 106,626 0.3 N N N N 327110X Undistributed pottery, ceramics, and plumbing fixtures 2014 N X 160,939 148,047 107,521 108,344 327110X Undistributed pottery, ceramics, and plumbing fixtures 2013 N X 162,408 147,681 94,496 93,828

Table
Page 93
NAICS-based Product Code Description Year
Value of Product
Shipments
Relative Standard Error
(%)
Total Export Value of Goods
Domestic Export Value
of Goods
General Import Value
of Goods
Consumption Import Value
of Goods
Manufacturing and International Trade Report: 2014 and 2013(1)In thousands of dollars. Values are based on manufacturing data from the 2014 Annual Survey of
Manufactures and administrative records from official U.S. import and export merchandise trade statistics. (1) Data for 2013 supersede the data that were previously published in the 2013 Manufacturing and International Trade Report.
327120 Clay building materials and refractories 2014 5,406,543 2.3 865,618 825,009 2,289,802 2,287,658327120 Clay building materials and refractories 2013 5,131,629 1.0 780,664 740,498 2,101,589 2,100,463 3271201 Brick and structural clay tile 2014 1,170,631 6.9 53,035 52,626 38,091 38,091 3271201 Brick and structural clay tile 2013 1,161,604 3.9 44,958 44,608 38,393 38,393 3271202 Clay floor and wall tile, glazed and unglazed (including quarry tile and
ceramic mosaic tile)2014 1,114,284 1.6 69,012 55,233 1,572,473 1,570,365
3271202 Clay floor and wall tile, glazed and unglazed (including quarry tile and ceramic mosaic tile)
2013 970,719 1.6 67,466 54,642 1,480,831 1,479,813
3271203 Vitrified clay sewer pipe and fittings 2014 25,388 3.8 N N N N 3271203 Vitrified clay sewer pipe and fittings 2013 26,974 1.1 N N N N 3271204 All other structural clay products (architectural terra cotta, drain tile, flue tile,
roofing tile, conduit, etc.), excluding clay refractories2014 91,398 0.5 3,244 3,168 1,494 1,494
3271204 All other structural clay products (architectural terra cotta, drain tile, flue tile, roofing tile, conduit, etc.), excluding clay refractories
2013 92,000 0.4 2,006 1,949 1,825 1,825
3271205 Clay refractories 2014 1,294,506 4.6 245,901 231,050 258,995 258,989 3271205 Clay refractories 2013 1,246,007 1.2 232,093 218,517 241,206 241,207 3271206 Nonclay refractories (excluding dead-burned magnesia) 2014 1,601,790 4.7 260,284 255,859 226,615 226,600 3271206 Nonclay refractories (excluding dead-burned magnesia) 2013 1,524,668 0.9 227,768 223,496 172,637 172,637 327120W Clay building materials and refractories, nsk, total 2014 108,546 4.7 N N N N 327120W Clay building materials and refractories, nsk, total 2013 109,657 3.1 N N N N 327120X Undistributed clay building materials and refractories 2014 N X 234,141 227,074 192,134 192,118 327120X Undistributed clay building materials and refractories 2013 N X 206,373 197,287 166,697 166,588327211 Flat glass 2014 3,266,055 1.9 1,215,178 1,160,099 758,251 747,485327211 Flat glass 2013 3,265,377 0.1 1,262,396 1,214,300 565,081 542,863 3272111 Flat glass (float, sheet, and plate process), made by flat glass producers 2014 2,267,139 2.7 478,885 477,597 80,601 80,601 3272111 Flat glass (float, sheet, and plate process), made by flat glass producers 2013 2,258,079 0.0 469,781 468,345 72,134 72,134 3272114 Other glass products, made by flat glass producers 2014 994,211 0.1 361,789 309,422 576,577 565,812 3272114 Other glass products, made by flat glass producers 2013 999,734 0.1 334,377 289,289 407,864 385,645 327211W Flat glass, nsk, total 2014 4,705 0.0 N N N N 327211W Flat glass, nsk, total 2013 7,563 0.0 N N N N 327211X Undistributed flat glass 2014 N X 374,504 373,079 101,072 101,072 327211X Undistributed flat glass 2013 N X 458,238 456,667 85,083 85,083

Table
Page 94
NAICS-based Product Code Description Year
Value of Product
Shipments
Relative Standard Error
(%)
Total Export Value of Goods
Domestic Export Value
of Goods
General Import Value
of Goods
Consumption Import Value
of Goods
Manufacturing and International Trade Report: 2014 and 2013(1)In thousands of dollars. Values are based on manufacturing data from the 2014 Annual Survey of
Manufactures and administrative records from official U.S. import and export merchandise trade statistics. (1) Data for 2013 supersede the data that were previously published in the 2013 Manufacturing and International Trade Report.
327212 Other pressed and blown glass and glassware 2014 3,570,168 3.4 1,642,080 1,506,865 2,610,400 2,580,899327212 Other pressed and blown glass and glassware 2013 3,722,778 2.7 1,636,735 1,502,968 2,379,617 2,348,773 3272121 Glass fiber mat, textile-type, made by establishments producing glass 2014 1,571,077 4.0 398,796 385,857 638,036 637,793 3272121 Glass fiber mat, textile-type, made by establishments producing glass 2013 1,537,103 1.5 389,140 367,006 539,362 539,149 3272123 Machine-made pressed and blown table, kitchen, art, and novelty glassware,
made by glass producers2014 888,624 11.4 326,674 277,227 1,174,270 1,163,571
3272123 Machine-made pressed and blown table, kitchen, art, and novelty glassware, made by glass producers
2013 1,010,761 6.4 308,033 269,782 1,119,171 1,100,976
3272125 Machine-made pressed and blown lighting, automotive, and electronic glassware, made by glass producers
2014 162,061 9.3 5,898 5,556 42,312 35,766
3272125 Machine-made pressed and blown lighting, automotive, and electronic glassware, made by glass producers
2013 206,577 0.0 5,007 4,783 40,707 38,508
3272127 All other machine-made pressed and blown glassware (including technical and scientific glassware, glass blocks, and lens blanks), made by glass
2014 634,951 1.3 717,074 663,080 487,586 476,835
3272127 All other machine-made pressed and blown glassware (including technical and scientific glassware, glass blocks, and lens blanks), made by glass
2013 663,654 11.0 752,143 693,776 497,667 488,569
3272129 Handmade pressed and blown glassware, made by glass producers 2014 65,229 0.0 N N N N 3272129 Handmade pressed and blown glassware, made by glass producers 2013 59,982 1.4 N N N N 327212W Other pressed and blown glass and glassware, nsk, total 2014 248,226 0.4 N N N N 327212W Other pressed and blown glass and glassware, nsk, total 2013 244,700 0.1 N N N N 327212X Undistributed other pressed and blown glass and glassware 2014 N X 193,637 175,145 268,196 266,934 327212X Undistributed other pressed and blown glass and glassware 2013 N X 182,413 167,622 182,709 181,571327213 Glass containers 2014 5,124,763 1.1 299,621 275,648 1,330,077 1,323,623327213 Glass containers 2013 5,132,281 0.1 289,151 268,403 1,259,527 1,251,161 3272130 Glass containers 2014 5,124,763 1.1 299,621 275,648 1,330,077 1,323,623 3272130 Glass containers 2013 5,132,281 0.1 289,151 268,403 1,259,527 1,251,161
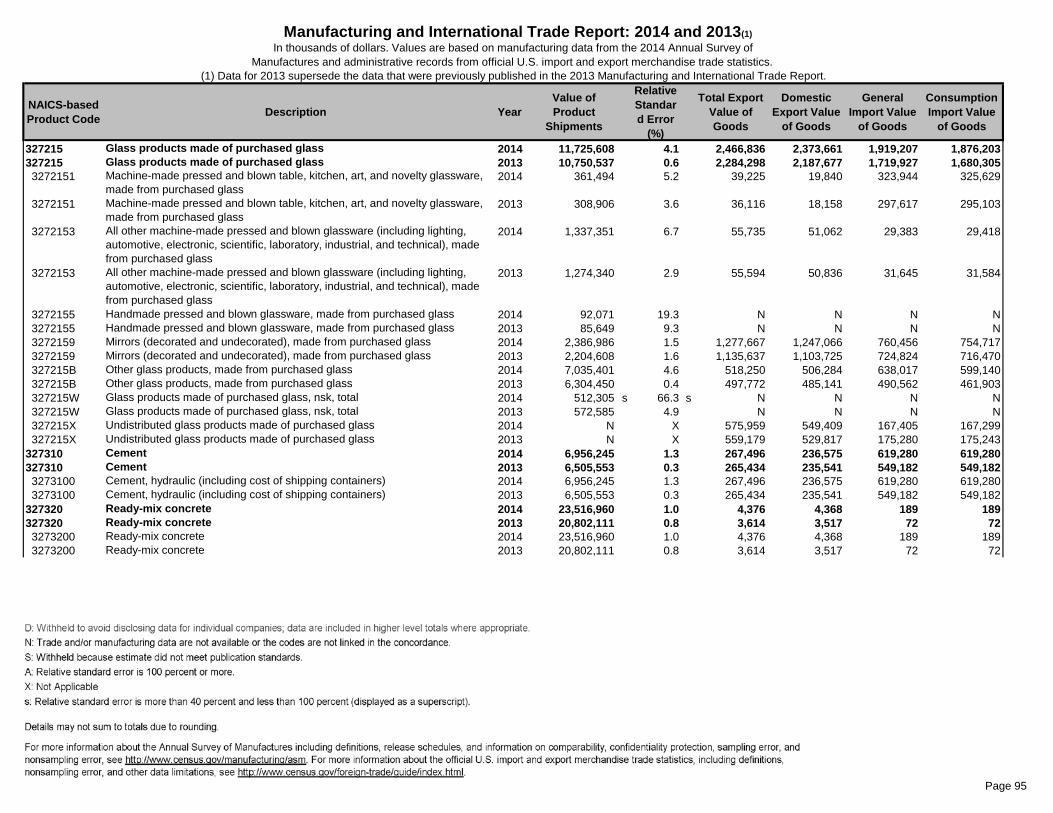
Table
Page 95
NAICS-based Product Code Description Year
Value of Product
Shipments
Relative Standard Error
(%)
Total Export Value of Goods
Domestic Export Value
of Goods
General Import Value
of Goods
Consumption Import Value
of Goods
Manufacturing and International Trade Report: 2014 and 2013(1)In thousands of dollars. Values are based on manufacturing data from the 2014 Annual Survey of
Manufactures and administrative records from official U.S. import and export merchandise trade statistics. (1) Data for 2013 supersede the data that were previously published in the 2013 Manufacturing and International Trade Report.
327215 Glass products made of purchased glass 2014 11,725,608 4.1 2,466,836 2,373,661 1,919,207 1,876,203327215 Glass products made of purchased glass 2013 10,750,537 0.6 2,284,298 2,187,677 1,719,927 1,680,305 3272151 Machine-made pressed and blown table, kitchen, art, and novelty glassware,
made from purchased glass2014 361,494 5.2 39,225 19,840 323,944 325,629
3272151 Machine-made pressed and blown table, kitchen, art, and novelty glassware, made from purchased glass
2013 308,906 3.6 36,116 18,158 297,617 295,103
3272153 All other machine-made pressed and blown glassware (including lighting, automotive, electronic, scientific, laboratory, industrial, and technical), made from purchased glass
2014 1,337,351 6.7 55,735 51,062 29,383 29,418
3272153 All other machine-made pressed and blown glassware (including lighting, automotive, electronic, scientific, laboratory, industrial, and technical), made from purchased glass
2013 1,274,340 2.9 55,594 50,836 31,645 31,584
3272155 Handmade pressed and blown glassware, made from purchased glass 2014 92,071 19.3 N N N N 3272155 Handmade pressed and blown glassware, made from purchased glass 2013 85,649 9.3 N N N N 3272159 Mirrors (decorated and undecorated), made from purchased glass 2014 2,386,986 1.5 1,277,667 1,247,066 760,456 754,717 3272159 Mirrors (decorated and undecorated), made from purchased glass 2013 2,204,608 1.6 1,135,637 1,103,725 724,824 716,470 327215B Other glass products, made from purchased glass 2014 7,035,401 4.6 518,250 506,284 638,017 599,140 327215B Other glass products, made from purchased glass 2013 6,304,450 0.4 497,772 485,141 490,562 461,903 327215W Glass products made of purchased glass, nsk, total 2014 512,305 s 66.3 s N N N N 327215W Glass products made of purchased glass, nsk, total 2013 572,585 4.9 N N N N 327215X Undistributed glass products made of purchased glass 2014 N X 575,959 549,409 167,405 167,299 327215X Undistributed glass products made of purchased glass 2013 N X 559,179 529,817 175,280 175,243327310 Cement 2014 6,956,245 1.3 267,496 236,575 619,280 619,280327310 Cement 2013 6,505,553 0.3 265,434 235,541 549,182 549,182 3273100 Cement, hydraulic (including cost of shipping containers) 2014 6,956,245 1.3 267,496 236,575 619,280 619,280 3273100 Cement, hydraulic (including cost of shipping containers) 2013 6,505,553 0.3 265,434 235,541 549,182 549,182327320 Ready-mix concrete 2014 23,516,960 1.0 4,376 4,368 189 189327320 Ready-mix concrete 2013 20,802,111 0.8 3,614 3,517 72 72 3273200 Ready-mix concrete 2014 23,516,960 1.0 4,376 4,368 189 189 3273200 Ready-mix concrete 2013 20,802,111 0.8 3,614 3,517 72 72

Table
Page 96
NAICS-based Product Code Description Year
Value of Product
Shipments
Relative Standard Error
(%)
Total Export Value of Goods
Domestic Export Value
of Goods
General Import Value
of Goods
Consumption Import Value
of Goods
Manufacturing and International Trade Report: 2014 and 2013(1)In thousands of dollars. Values are based on manufacturing data from the 2014 Annual Survey of
Manufactures and administrative records from official U.S. import and export merchandise trade statistics. (1) Data for 2013 supersede the data that were previously published in the 2013 Manufacturing and International Trade Report.
327331 Concrete block and brick 2014 3,381,390 2.3 50,881 48,915 21,963 21,963327331 Concrete block and brick 2013 3,488,033 2.3 53,249 52,836 27,429 27,429 3273310 Concrete block and brick 2014 3,381,390 2.3 50,881 48,915 21,963 21,963 3273310 Concrete block and brick 2013 3,488,033 2.3 53,249 52,836 27,429 27,429327332 Concrete pipe 2014 2,301,598 5.5 N N N N327332 Concrete pipe 2013 1,928,431 1.6 N N N N 3273320 Concrete pipe 2014 2,301,598 5.5 N N N N 3273320 Concrete pipe 2013 1,928,431 1.6 N N N N327390 Other concrete products 2014 10,021,144 1.4 225,740 213,405 808,790 808,586327390 Other concrete products 2013 9,229,967 1.2 205,984 194,132 775,216 774,605 3273901 Precast concrete products 2014 6,994,998 1.7 6,228 6,030 N N 3273901 Precast concrete products 2013 6,542,696 1.2 5,208 5,079 N N 3273904 Prestressed concrete products 2014 2,275,414 3.0 N N N N 3273904 Prestressed concrete products 2013 2,134,602 3.3 N N N N 327390W Other concrete products, nsk, total 2014 750,732 5.8 N N N N 327390W Other concrete products, nsk, total 2013 552,668 2.0 N N N N 327390X Undistributed other concrete products 2014 N X 219,512 207,374 808,790 808,586 327390X Undistributed other concrete products 2013 N X 200,776 189,054 775,216 774,605327410 Lime 2014 2,510,081 1.0 57,646 57,585 65,243 65,243327410 Lime 2013 2,388,373 0.5 48,381 48,312 61,829 61,829 3274100 Lime 2014 2,510,081 1.0 57,646 57,585 65,243 65,243 3274100 Lime 2013 2,388,373 0.5 48,381 48,312 61,829 61,829327420 Gypsum products 2014 4,992,354 0.7 260,298 257,475 97,571 97,565327420 Gypsum products 2013 4,312,881 0.1 247,825 246,167 77,301 77,301 3274201 Gypsum building materials 2014 4,116,868 0.6 148,697 148,512 83,960 83,954 3274201 Gypsum building materials 2013 3,510,575 0.1 150,463 150,313 66,829 66,829 3274205 Other gypsum products 2014 692,559 3.7 65,641 63,140 5,994 5,994 3274205 Other gypsum products 2013 650,038 0.0 52,894 51,731 4,587 4,587 327420W Gypsum products, nsk, total 2014 182,928 0.0 N N N N 327420W Gypsum products, nsk, total 2013 152,268 0.0 N N N N 327420X Undistributed gypsum products 2014 N X 45,960 45,823 7,617 7,617 327420X Undistributed gypsum products 2013 N X 44,468 44,122 5,885 5,885

Table
Page 97
NAICS-based Product Code Description Year
Value of Product
Shipments
Relative Standard Error
(%)
Total Export Value of Goods
Domestic Export Value
of Goods
General Import Value
of Goods
Consumption Import Value
of Goods
Manufacturing and International Trade Report: 2014 and 2013(1)In thousands of dollars. Values are based on manufacturing data from the 2014 Annual Survey of
Manufactures and administrative records from official U.S. import and export merchandise trade statistics. (1) Data for 2013 supersede the data that were previously published in the 2013 Manufacturing and International Trade Report.
327910 Abrasive products 2014 5,222,413 3.5 1,119,484 1,006,959 1,550,123 1,545,448327910 Abrasive products 2013 4,812,792 0.8 1,043,146 929,251 1,443,234 1,436,598 3279101 Nonmetallic sized grains, powders, and flour abrasives (including graded
products only)2014 856,084 6.1 111,816 105,611 243,449 243,449
3279101 Nonmetallic sized grains, powders, and flour abrasives (including graded products only)
2013 1,001,339 2.7 118,746 110,459 240,567 240,535
3279104 Nonmetallic abrasive products (including diamond abrasives) 2014 1,521,937 9.9 198,163 183,791 263,014 261,319 3279104 Nonmetallic abrasive products (including diamond abrasives) 2013 1,196,563 1.1 172,461 158,543 245,210 245,283 3279107 Nonmetallic coated abrasive products and buffing wheels, polishing wheels,
and laps2014 2,237,387 4.1 469,886 403,065 632,587 629,705
3279107 Nonmetallic coated abrasive products and buffing wheels, polishing wheels, and laps
2013 2,100,940 0.9 424,488 360,150 591,573 585,071
327910A Metal abrasives including steel and iron grid, shot, and sand, and other metal abrasives
2014 372,303 4.6 339,619 314,492 154,881 154,992
327910A Metal abrasives including steel and iron grid, shot, and sand, and other metal abrasives
2013 333,784 4.1 327,451 300,098 131,991 132,065
327910W Abrasive products, nsk, total 2014 234,703 0.1 N N N N 327910W Abrasive products, nsk, total 2013 180,165 0.0 N N N N 327910X Undistributed abrasive products 2014 N X N N 256,193 255,983 327910X Undistributed abrasive products 2013 N X N N 233,892 233,643327991 Cut stone and stone products 2014 4,063,534 2.6 91,071 76,404 3,168,171 3,216,382327991 Cut stone and stone products 2013 3,892,291 1.6 80,978 64,685 2,927,152 2,938,547 3279911 Dressed dimension granite (including gneiss, syenite, diorite, and cut 2014 2,089,279 3.3 53,921 44,781 1,342,022 1,353,437 3279911 Dressed dimension granite (including gneiss, syenite, diorite, and cut 2013 2,193,531 2.4 54,609 43,735 1,307,711 1,311,165 3279914 Dressed dimension limestone (including dolomite, travertine, calcareous,
tufa, and cut limestone)2014 409,796 5.6 7,487 6,268 408,205 407,772
3279914 Dressed dimension limestone (including dolomite, travertine, calcareous, tufa, and cut limestone)
2013 365,222 1.2 4,992 4,203 397,170 395,540
3279917 Dressed dimension marble and other stone 2014 866,321 7.2 25,434 21,135 1,391,383 1,428,612 3279917 Dressed dimension marble and other stone 2013 704,725 4.4 19,755 15,171 1,202,522 1,212,093 327991W Cut stone and stone products, nsk, total 2014 698,139 6.1 N N N N 327991W Cut stone and stone products, nsk, total 2013 628,812 2.2 N N N N 327991X Undistributed cut stone and stone products 2014 N X 4,229 4,220 26,560 26,560 327991X Undistributed cut stone and stone products 2013 N X 1,622 1,576 19,749 19,749

Table
Page 98
NAICS-based Product Code Description Year
Value of Product
Shipments
Relative Standard Error
(%)
Total Export Value of Goods
Domestic Export Value
of Goods
General Import Value
of Goods
Consumption Import Value
of Goods
Manufacturing and International Trade Report: 2014 and 2013(1)In thousands of dollars. Values are based on manufacturing data from the 2014 Annual Survey of
Manufactures and administrative records from official U.S. import and export merchandise trade statistics. (1) Data for 2013 supersede the data that were previously published in the 2013 Manufacturing and International Trade Report.
327992 Ground or treated minerals and earths 2014 4,168,731 2.1 294,884 274,076 398,949 398,895327992 Ground or treated minerals and earths 2013 3,881,557 1.6 270,009 253,279 379,676 379,602 3279920 Treated minerals and earths 2014 4,168,731 2.1 294,884 274,076 398,949 398,895 3279920 Treated minerals and earths 2013 3,881,557 1.6 270,009 253,279 379,676 379,602327993 Mineral wool 2014 5,557,550 1.2 1,093,015 1,054,743 739,262 738,109327993 Mineral wool 2013 5,494,197 2.3 995,889 961,421 600,044 596,441 3279931 Mineral wool for thermal and acoustical envelope insulation (for homes, and
commercial and industrial buildings)2014 4,082,032 1.4 175,430 170,206 5,689 5,689
3279931 Mineral wool for thermal and acoustical envelope insulation (for homes, and commercial and industrial buildings)
2013 3,912,231 1.5 156,327 154,964 3,628 3,628
3279934 Mineral wool for industrial, equipment, and appliance insulation 2014 1,275,837 1.7 738,194 710,376 568,386 567,218 3279934 Mineral wool for industrial, equipment, and appliance insulation 2013 1,449,334 7.6 691,658 663,753 454,638 451,188 327993W Mineral wool, nsk, total 2014 199,681 13.1 N N N N 327993W Mineral wool, nsk, total 2013 132,633 0.0 N N N N 327993X Undistributed mineral wool 2014 N X 179,391 174,160 165,187 165,202 327993X Undistributed mineral wool 2013 N X 147,904 142,705 141,777 141,624327999 All other nonmetallic mineral products 2014 4,373,423 1.6 652,962 637,372 481,091 480,585327999 All other nonmetallic mineral products 2013 4,219,315 2.0 617,721 601,573 435,388 435,080 3279990 All other nonmetallic mineral products 2014 4,373,423 1.6 652,962 637,372 351,188 351,049 3279990 All other nonmetallic mineral products 2013 4,219,315 2.0 617,721 601,573 281,846 281,798 327999X Undistributed all other nonmetallic mineral products 2014 N X N N 129,903 129,536 327999X Undistributed all other nonmetallic mineral products 2013 N X N N 153,542 153,282

Table
Page 99
NAICS-based Product Code Description Year
Value of Product
Shipments
Relative Standard Error
(%)
Total Export Value of Goods
Domestic Export Value
of Goods
General Import Value
of Goods
Consumption Import Value
of Goods
Manufacturing and International Trade Report: 2014 and 2013(1)In thousands of dollars. Values are based on manufacturing data from the 2014 Annual Survey of
Manufactures and administrative records from official U.S. import and export merchandise trade statistics. (1) Data for 2013 supersede the data that were previously published in the 2013 Manufacturing and International Trade Report.
331110 Iron and steel mill products and ferroalloys 2014 103,830,728 0.4 17,163,820 15,921,619 42,930,019 42,686,395331110 Iron and steel mill products and ferroalloys 2013 104,050,322 0.3 17,214,625 16,039,331 33,017,950 32,904,737 3311101 Coke oven and blast furnace products, made in steel mills 2014 2,467,296 0.1 310,118 287,990 1,909,312 1,909,312 3311101 Coke oven and blast furnace products, made in steel mills 2013 2,418,655 0.0 254,847 247,665 1,723,691 1,723,691 3311103 Steel ingots and semifinished shapes and forms, made in steel mills 2014 12,559,910 2.6 458,246 444,813 5,569,047 5,629,020 3311103 Steel ingots and semifinished shapes and forms, made in steel mills 2013 11,935,490 0.1 540,333 523,689 3,724,087 3,754,899 3311105 Hot rolled steel sheet and strip (including tin mill products, tinplate,
blackplate, terneplate, and tin-free steel), made in steel mills2014 27,441,334 0.8 4,908,068 4,729,528 8,422,987 8,422,824
3311105 Hot rolled steel sheet and strip (including tin mill products, tinplate, blackplate, terneplate, and tin-free steel), made in steel mills
2013 30,392,383 0.1 4,907,879 4,722,647 5,693,664 5,683,915
3311107 Hot rolled steel bars and bar shapes, plates, structural shapes, and piling (including concrete reinforcing and tool steel bars), made in steel mills
2014 25,466,427 0.5 2,865,429 2,721,342 6,162,468 6,167,144
3311107 Hot rolled steel bars and bar shapes, plates, structural shapes, and piling (including concrete reinforcing and tool steel bars), made in steel mills
2013 25,465,294 0.1 2,753,897 2,596,131 4,660,604 4,659,220
3311109 Steel wire, including galvanized and other coated wire, made in steel mills producing wire rods or hot rolled bars
2014 1,221,752 0.2 N N N N
3311109 Steel wire, including galvanized and other coated wire, made in steel mills producing wire rods or hot rolled bars
2013 928,636 28.1 N N N N
331110B Steel pipes and tubes, made in steel mills producing semifinished shapes or 2014 4,364,447 2.4 3,853,581 3,403,127 5,880,694 5,756,533 331110B Steel pipes and tubes, made in steel mills producing semifinished shapes or 2013 4,070,823 0.3 4,022,904 3,721,041 5,368,582 5,323,112

Table
Page 100
NAICS-based Product Code Description Year
Value of Product
Shipments
Relative Standard Error
(%)
Total Export Value of Goods
Domestic Export Value
of Goods
General Import Value
of Goods
Consumption Import Value
of Goods
Manufacturing and International Trade Report: 2014 and 2013(1)In thousands of dollars. Values are based on manufacturing data from the 2014 Annual Survey of
Manufactures and administrative records from official U.S. import and export merchandise trade statistics. (1) Data for 2013 supersede the data that were previously published in the 2013 Manufacturing and International Trade Report.
331110D Cold rolled steel sheet and strip, made in steel mills producing hot rolled sheet or strip
2014 20,133,241 0.0 1,387,657 1,315,468 2,925,261 2,924,769
331110D Cold rolled steel sheet and strip, made in steel mills producing hot rolled sheet or strip
2013 19,712,987 0.0 1,383,120 1,262,805 1,707,773 1,707,213
331110F Cold finished steel bars and bar shapes, made in steel mills producing hot rolled bars and bar shapes
2014 1,584,433 1.1 473,882 444,727 1,024,436 1,024,436
331110F Cold finished steel bars and bar shapes, made in steel mills producing hot rolled bars and bar shapes
2013 1,161,177 0.1 439,294 411,306 896,571 896,575
331110H Seamless rolled ring forgings, ferrous, made in steel mills 2014 D S N N N N 331110H Seamless rolled ring forgings, ferrous, made in steel mills 2013 D S N N N N 331110J Open die and smith forgings (hammer and press), ferrous, made in steel 2014 671,123 1.3 N N N N 331110J Open die and smith forgings (hammer and press), ferrous, made in steel 2013 673,443 0.0 N N N N 331110L Other steel mill products, including steel rails, excluding wire products 2014 4,300,628 0.0 1,183,628 1,131,990 3,290,940 3,292,104 331110L Other steel mill products, including steel rails, excluding wire products 2013 4,459,121 0.3 1,192,873 1,094,386 2,831,941 2,833,887 331110M Ferrosilicon, including briquettes, and other silicon alloys 2014 975,886 1.4 60,183 45,186 430,786 426,579 331110M Ferrosilicon, including briquettes, and other silicon alloys 2013 960,308 0.0 75,893 54,741 368,074 362,864 331110N All other ferroalloys, superalloys and ferrous materials, excluding pig iron 2014 1,286,937 3.4 201,641 90,777 3,664,644 3,493,939 331110N All other ferroalloys, superalloys and ferrous materials, excluding pig iron 2013 839,857 0.2 152,732 73,683 2,937,270 2,874,855 331110W Iron and steel mill products and ferroalloys, nsk, total 2014 D S N N N N 331110W Iron and steel mill products and ferroalloys, nsk, total 2013 D S N N N N 331110X Undistributed iron and steel mill products and ferroalloys 2014 N X 1,461,388 1,306,672 3,649,444 3,639,736 331110X Undistributed iron and steel mill products and ferroalloys 2013 N X 1,490,852 1,331,236 3,105,691 3,084,506

Table
Page 101
NAICS-based Product Code Description Year
Value of Product
Shipments
Relative Standard Error
(%)
Total Export Value of Goods
Domestic Export Value
of Goods
General Import Value
of Goods
Consumption Import Value
of Goods
Manufacturing and International Trade Report: 2014 and 2013(1)In thousands of dollars. Values are based on manufacturing data from the 2014 Annual Survey of
Manufactures and administrative records from official U.S. import and export merchandise trade statistics. (1) Data for 2013 supersede the data that were previously published in the 2013 Manufacturing and International Trade Report.
331210 Iron and steel pipes and tubes, made from purchased iron and steel 2014 13,252,041 0.9 2,665 2,259 58,300 58,300331210 Iron and steel pipes and tubes, made from purchased iron and steel 2013 13,199,419 0.4 3,187 2,966 76,013 76,013 3312100 Iron and steel pipes and tubes, made from purchased iron and steel 2014 13,252,041 0.9 2,665 2,259 58,300 58,300 3312100 Iron and steel pipes and tubes, made from purchased iron and steel 2013 13,199,419 0.4 3,187 2,966 76,013 76,013331221 Rolled steel shapes 2014 8,200,823 1.2 188,988 183,258 189,055 189,056331221 Rolled steel shapes 2013 6,587,719 0.5 172,873 167,323 180,051 180,105 3312211 Cold rolled steel sheet and strip, made from purchased steel 2014 5,269,400 1.0 N N N N 3312211 Cold rolled steel sheet and strip, made from purchased steel 2013 3,682,712 0.5 N N N N 3312213 Cold finished steel bars and bar shapes, made from purchased steel 2014 1,672,027 4.9 N N N N 3312213 Cold finished steel bars and bar shapes, made from purchased steel 2013 1,744,304 1.5 N N N N 3312215 Iron and steel powders, paste, and flakes, made from purchased steel 2014 661,485 0.1 188,988 183,258 189,055 189,056 3312215 Iron and steel powders, paste, and flakes, made from purchased steel 2013 559,427 0.3 172,873 167,323 180,051 180,105 331221W Rolled steel shapes, nsk, total 2014 597,911 5.1 N N N N 331221W Rolled steel shapes, nsk, total 2013 601,276 0.6 N N N N

Table
Page 102
NAICS-based Product Code Description Year
Value of Product
Shipments
Relative Standard Error
(%)
Total Export Value of Goods
Domestic Export Value
of Goods
General Import Value
of Goods
Consumption Import Value
of Goods
Manufacturing and International Trade Report: 2014 and 2013(1)In thousands of dollars. Values are based on manufacturing data from the 2014 Annual Survey of
Manufactures and administrative records from official U.S. import and export merchandise trade statistics. (1) Data for 2013 supersede the data that were previously published in the 2013 Manufacturing and International Trade Report.
331222 Steel wire drawing products 2014 5,490,502 2.3 518,792 461,422 1,954,870 1,953,033331222 Steel wire drawing products 2013 5,492,637 0.7 476,150 419,465 1,846,041 1,844,455 3312221 Noninsulated ferrous wire rope, cable, and fabricated wire rope assemblies
(including lifting slings), made in plants that draw wire2014 624,441 1.1 N N N N
3312221 Noninsulated ferrous wire rope, cable, and fabricated wire rope assemblies (including lifting slings), made in plants that draw wire
2013 638,015 0.3 N N N N
3312223 Steel nails, staples, tacks, spikes, and brads, made in plants that draw wire 2014 169,479 14.1 83,319 68,197 810,756 809,862 3312223 Steel nails, staples, tacks, spikes, and brads, made in plants that draw wire 2013 246,942 7.3 82,391 65,638 791,107 789,521 3312225 Steel wire, including galvanized and other coated wire, made in plants that
draw wire2014 2,890,802 3.3 435,473 393,224 1,098,526 1,098,516
3312225 Steel wire, including galvanized and other coated wire, made in plants that draw wire
2013 2,965,884 0.2 393,759 353,826 1,001,973 1,001,973
3312227 Steel fencing and fence gates, made in plants that draw wire 2014 496,002 6.4 N N 44,457 44,457 3312227 Steel fencing and fence gates, made in plants that draw wire 2013 539,046 5.7 N N 52,108 52,108 3312229 Ferrous wire cloth and other ferrous woven wire products, made in plants
that draw wire2014 123,826 4.1 N N N N
3312229 Ferrous wire cloth and other ferrous woven wire products, made in plants that draw wire
2013 126,471 0.5 N N N N
331222B Other ferrous wire products (excluding springs), made in plants that draw 2014 772,003 9.7 N N 1,130 198 331222B Other ferrous wire products (excluding springs), made in plants that draw 2013 672,396 1.7 N N 854 854 331222W Steel wire drawing products, nsk, total 2014 413,949 2.3 N N N N 331222W Steel wire drawing products, nsk, total 2013 303,883 0.0 N N N N331313 Refined alumina and primary aluminum 2014 5,376,041 0.2 2,052,517 1,787,515 7,717,485 8,201,762331313 Refined alumina and primary aluminum 2013 5,838,332 0.0 2,013,099 1,761,782 7,008,392 7,536,661 3313131 Aluminum oxide, excluding natural alumina 2014 802,314 1.6 883,857 874,649 587,441 587,441 3313131 Aluminum oxide, excluding natural alumina 2013 898,028 0.0 889,509 869,593 680,819 680,819 3313133 Aluminum ingot, including billet, made in primary aluminum reduction plants 2014 4,550,156 0.0 1,168,660 912,866 7,130,044 7,614,321 3313133 Aluminum ingot, including billet, made in primary aluminum reduction plants 2013 4,926,600 0.0 1,123,590 892,189 6,327,573 6,855,843 331313W Refined alumina and primary aluminum, nsk, total 2014 23,571 0.0 N N N N 331313W Refined alumina and primary aluminum, nsk, total 2013 13,704 0.0 N N N N

Table
Page 103
NAICS-based Product Code Description Year
Value of Product
Shipments
Relative Standard Error
(%)
Total Export Value of Goods
Domestic Export Value
of Goods
General Import Value
of Goods
Consumption Import Value
of Goods
Manufacturing and International Trade Report: 2014 and 2013(1)In thousands of dollars. Values are based on manufacturing data from the 2014 Annual Survey of
Manufactures and administrative records from official U.S. import and export merchandise trade statistics. (1) Data for 2013 supersede the data that were previously published in the 2013 Manufacturing and International Trade Report.
331314 Secondary smelted aluminum and alloys 2014 5,810,006 3.1 144,478 131,712 103,721 104,158331314 Secondary smelted aluminum and alloys 2013 5,566,145 0.2 153,846 144,182 93,021 93,021 3313142 Aluminum ingot, including billet, made by secondary smelters 2014 4,868,947 3.7 127,277 115,016 41,854 42,290 3313142 Aluminum ingot, including billet, made by secondary smelters 2013 4,656,394 0.3 134,370 125,405 47,320 47,320 3313145 Aluminum and aluminum-base alloy powders, paste, and flakes from
purchased aluminum2014 844,258 2.5 17,201 16,696 61,868 61,868
3313145 Aluminum and aluminum-base alloy powders, paste, and flakes from purchased aluminum
2013 719,352 0.0 19,475 18,778 45,701 45,701
331314W Secondary smelted aluminum and alloys, nsk, total 2014 96,801 11.3 N N N N 331314W Secondary smelted aluminum and alloys, nsk, total 2013 190,399 0.0 N N N N331315 Aluminum sheet, plate, and foil 2014 16,268,371 0.2 4,124,798 3,969,063 2,914,645 2,871,438331315 Aluminum sheet, plate, and foil 2013 15,830,788 0.1 4,214,915 4,046,125 2,550,906 2,510,943 3313151 Aluminum plate (thickness of 0.25 in. or more), including continuous cast 2014 2,107,388 0.1 N N N N 3313151 Aluminum plate (thickness of 0.25 in. or more), including continuous cast 2013 2,555,368 0.0 N N N N 3313153 Aluminum sheet and strip, including continuous cast 2014 12,175,308 0.2 N N N N 3313153 Aluminum sheet and strip, including continuous cast 2013 11,489,186 0.2 N N N N 3313155 Plain aluminum foil (less than .006 in. thick) 2014 1,740,830 0.0 251,617 203,606 540,045 505,408 3313155 Plain aluminum foil (less than .006 in. thick) 2013 1,553,111 0.1 270,296 222,300 459,116 427,596 3313157 Aluminum welded tube 2014 114,101 16.2 N N N N 3313157 Aluminum welded tube 2013 D S N N N N 331315W Aluminum sheet, plate, and foil, nsk, total 2014 130,745 1.1 N N N N 331315W Aluminum sheet, plate, and foil, nsk, total 2013 D S N N N N 331315X Undistributed aluminum sheet, plate, and foil 2014 N X 3,873,181 3,765,456 2,374,600 2,366,030 331315X Undistributed aluminum sheet, plate, and foil 2013 N X 3,944,620 3,823,826 2,091,791 2,083,347

Table
Page 104
NAICS-based Product Code Description Year
Value of Product
Shipments
Relative Standard Error
(%)
Total Export Value of Goods
Domestic Export Value
of Goods
General Import Value
of Goods
Consumption Import Value
of Goods
Manufacturing and International Trade Report: 2014 and 2013(1)In thousands of dollars. Values are based on manufacturing data from the 2014 Annual Survey of
Manufactures and administrative records from official U.S. import and export merchandise trade statistics. (1) Data for 2013 supersede the data that were previously published in the 2013 Manufacturing and International Trade Report.
331318 Other aluminum rolled, drawn, and extruded products 2014 10,234,940 0.9 1,585,691 1,471,844 1,584,583 1,569,241331318 Other aluminum rolled, drawn, and extruded products 2013 10,167,925 0.2 1,615,858 1,488,294 1,511,174 1,492,233 3313181 Extruded aluminum rod, bar, and other extruded shapes 2014 7,623,808 1.1 937,693 854,699 736,907 729,953 3313181 Extruded aluminum rod, bar, and other extruded shapes 2013 7,424,917 0.3 985,254 877,277 658,313 643,560 3313183 Extruded and drawn aluminum tube 2014 858,051 5.3 297,933 285,156 152,693 145,031 3313183 Extruded and drawn aluminum tube 2013 887,083 0.8 264,038 256,238 145,462 141,497 3313185 Aluminum and aluminum-base alloy wire and cable (excluding covered or
insulated), including ACSR, made in aluminum rolling mills and plants that draw wire from purchased or recovered aluminum
2014 525,635 0.4 N N 5,048 5,048
3313185 Aluminum and aluminum-base alloy wire and cable (excluding covered or insulated), including ACSR, made in aluminum rolling mills and plants that draw wire from purchased or recovered aluminum
2013 523,161 0.5 N N 2,703 2,703
3313187 Rolled aluminum rod and bar (including continuous cast), made in aluminum rolling mills and plants that draw wire from purchased or recovered aluminum
2014 107,400 1.3 N N N N
3313187 Rolled aluminum rod and bar (including continuous cast), made in aluminum rolling mills and plants that draw wire from purchased or recovered aluminum
2013 112,680 0.0 N N N N
331318D Aluminum ingot, including billet, made in aluminum rolling mills and plants that draw wire from purchased or recovered aluminum
2014 149,644 15.5 N N N N
331318D Aluminum ingot, including billet, made in aluminum rolling mills and plants that draw wire from purchased or recovered aluminum
2013 223,828 0.0 N N N N
331318E Aluminum insulated wire and cable 2014 664,768 0.0 220,798 205,456 450,771 450,046 331318E Aluminum insulated wire and cable 2013 727,485 0.1 190,425 181,788 447,965 447,746 331318W Other aluminum rolled, drawn, and extruded products, nsk, total 2014 305,635 0.7 N N N N 331318W Other aluminum rolled, drawn, and extruded products, nsk, total 2013 268,771 4.6 N N N N 331318X Undistributed other aluminum rolled, drawn, and extruded products 2014 N X 129,267 126,533 239,164 239,164 331318X Undistributed other aluminum rolled, drawn, and extruded products 2013 N X 176,142 172,990 256,732 256,727

Table
Page 105
NAICS-based Product Code Description Year
Value of Product
Shipments
Relative Standard Error
(%)
Total Export Value of Goods
Domestic Export Value
of Goods
General Import Value
of Goods
Consumption Import Value
of Goods
Manufacturing and International Trade Report: 2014 and 2013(1)In thousands of dollars. Values are based on manufacturing data from the 2014 Annual Survey of
Manufactures and administrative records from official U.S. import and export merchandise trade statistics. (1) Data for 2013 supersede the data that were previously published in the 2013 Manufacturing and International Trade Report.
331410 Nonferrous metal (except aluminum) smelted and refined products 2014 13,582,942 0.9 27,795,592 24,949,590 33,455,466 33,657,593331410 Nonferrous metal (except aluminum) smelted and refined products 2013 13,945,672 0.4 37,302,204 35,827,716 35,342,532 35,348,504 3314101 Primary smelting and refining of copper 2014 6,051,272 0.6 1,469,251 1,203,548 4,419,224 4,454,546 3314101 Primary smelting and refining of copper 2013 6,419,475 0.0 1,203,399 1,179,662 5,612,033 5,643,115 3314103 Primary smelting and refining of zinc 2014 510,519 14.3 235,977 148,698 939,806 1,246,364 3314103 Primary smelting and refining of zinc 2013 476,557 0.1 113,753 104,564 916,334 1,026,112 3314107 Primary precious metals and precious metal alloys 2014 2,921,228 1.0 23,537,090 21,165,775 20,585,859 20,585,859 3314107 Primary precious metals and precious metal alloys 2013 3,351,060 1.4 33,886,396 32,551,179 22,299,534 22,299,534 331410A All other miscellaneous primary nonferrous metals 2014 3,931,670 2.0 2,553,275 2,431,569 7,510,576 7,370,824 331410A All other miscellaneous primary nonferrous metals 2013 3,554,707 0.6 2,098,655 1,992,310 6,514,632 6,379,743 331410W Nonferrous metal (except aluminum) smelted and refined products, nsk, total 2014 168,252 0.0 N N N N 331410W Nonferrous metal (except aluminum) smelted and refined products, nsk, total 2013 143,873 0.0 N N N N

Table
Page 106
NAICS-based Product Code Description Year
Value of Product
Shipments
Relative Standard Error
(%)
Total Export Value of Goods
Domestic Export Value
of Goods
General Import Value
of Goods
Consumption Import Value
of Goods
Manufacturing and International Trade Report: 2014 and 2013(1)In thousands of dollars. Values are based on manufacturing data from the 2014 Annual Survey of
Manufactures and administrative records from official U.S. import and export merchandise trade statistics. (1) Data for 2013 supersede the data that were previously published in the 2013 Manufacturing and International Trade Report.
331420 Copper rolled, drawn, extruded, and alloy products 2014 22,730,580 0.7 3,242,917 3,084,222 3,643,252 3,636,152331420 Copper rolled, drawn, extruded, and alloy products 2013 22,951,130 0.4 3,398,253 3,251,890 3,615,742 3,615,252 3314201 Copper wire, bare and tinned (nonelectrical), made in rolling mills 2014 1,775,520 2.7 N N N N 3314201 Copper wire, bare and tinned (nonelectrical), made in rolling mills 2013 1,700,523 0.0 N N N N 3314202 Copper and copper-base alloy wire, strand, and cable, made in plants that
draw wire2014 2,863,761 3.9 N N N N
3314202 Copper and copper-base alloy wire, strand, and cable, made in plants that draw wire
2013 2,739,757 1.3 N N N N
3314203 Copper and copper-base alloy rod, bar, and shapes 2014 6,192,911 0.9 360,425 324,361 509,446 508,495 3314203 Copper and copper-base alloy rod, bar, and shapes 2013 6,695,936 0.1 404,917 357,840 521,488 524,716 3314204 Copper wire and cable, including apparatus wire, cord, and flexible cord sets,
made in copper wire drawing plants2014 4,601,957 0.1 N N N N
3314204 Copper wire and cable, including apparatus wire, cord, and flexible cord sets, made in copper wire drawing plants
2013 3,972,387 2.0 N N N N
3314205 Copper and copper-base alloy sheet, strip, and plate 2014 2,701,746 0.1 463,495 448,977 556,040 555,932 3314205 Copper and copper-base alloy sheet, strip, and plate 2013 2,685,762 0.0 457,589 442,489 523,194 523,194 3314206 Copper magnet wire made in plants that draw wire 2014 651,226 0.0 N N N N 3314206 Copper magnet wire made in plants that draw wire 2013 860,892 0.8 N N N N 3314207 Copper and copper-base alloy pipe and tube 2014 2,354,547 2.9 224,373 207,038 748,432 747,850 3314207 Copper and copper-base alloy pipe and tube 2013 2,618,723 0.7 276,827 260,258 718,333 718,341 3314208 Secondary smelting, refining, and alloying of copper 2014 1,294,712 0.0 N N N N 3314208 Secondary smelting, refining, and alloying of copper 2013 1,360,916 1.3 N N N N 331420W Copper rolled, drawn, extruded, and alloy products, nsk, total 2014 294,201 12.2 N N N N 331420W Copper rolled, drawn, extruded, and alloy products, nsk, total 2013 316,233 3.7 N N N N 331420X Undistributed copper rolled, drawn, extruded, and alloy products 2014 N X 2,194,624 2,103,846 1,829,334 1,823,874 331420X Undistributed copper rolled, drawn, extruded, and alloy products 2013 N X 2,258,919 2,191,303 1,852,728 1,849,000

Table
Page 107
NAICS-based Product Code Description Year
Value of Product
Shipments
Relative Standard Error
(%)
Total Export Value of Goods
Domestic Export Value
of Goods
General Import Value
of Goods
Consumption Import Value
of Goods
Manufacturing and International Trade Report: 2014 and 2013(1)In thousands of dollars. Values are based on manufacturing data from the 2014 Annual Survey of
Manufactures and administrative records from official U.S. import and export merchandise trade statistics. (1) Data for 2013 supersede the data that were previously published in the 2013 Manufacturing and International Trade Report.
331491 Nonferrous metal (except copper and aluminum) rolled, drawn, and extruded products
2014 7,909,508 1.3 5,144,714 4,807,116 4,349,363 4,350,587
331491 Nonferrous metal (except copper and aluminum) rolled, drawn, and extruded products
2013 7,985,564 0.3 4,887,657 4,555,677 4,822,724 4,807,620
3314912 Nickel and nickel-base alloy mill shapes 2014 2,656,476 2.8 1,220,204 1,166,711 531,577 531,237 3314912 Nickel and nickel-base alloy mill shapes 2013 2,858,829 0.1 1,243,507 1,185,429 539,458 536,665 3314913 Titanium and titanium-base alloy mill shapes 2014 2,623,018 0.9 1,393,229 1,357,794 311,596 324,054 3314913 Titanium and titanium-base alloy mill shapes 2013 2,487,613 0.7 1,332,606 1,301,337 310,388 304,457 331491A Precious metal mill shapes 2014 741,100 4.0 1,656,419 1,468,381 3,005,776 3,005,284 331491A Precious metal mill shapes 2013 861,358 0.0 1,426,823 1,238,617 3,534,379 3,533,986 331491D All other nonferrous metal mill shapes 2014 1,403,847 4.0 874,863 814,231 500,415 490,012 331491D All other nonferrous metal mill shapes 2013 1,281,239 0.9 884,722 830,293 438,499 432,511 331491F Apparatus wire and cord and flexible cord sets (excluding aluminum, copper,
wiring harnesses and fiber optic), made in plants that draw wire2014 206,682 1.6 N N N N
331491F Apparatus wire and cord and flexible cord sets (excluding aluminum, copper, wiring harnesses and fiber optic), made in plants that draw wire
2013 253,928 0.0 N N N N
331491H Magnet wire (excluding aluminum and copper), made in plants that draw wire 2014 12,559 s 42.9 s N N N N 331491H Magnet wire (excluding aluminum and copper), made in plants that draw wire 2013 18,284 0.0 N N N N 331491W Nonferrous metal (except copper and aluminum) rolled, drawn, and extruded
products, nsk, total2014 265,827 0.0 N N N N
331491W Nonferrous metal (except copper and aluminum) rolled, drawn, and extruded products, nsk, total
2013 224,313 0.1 N N N N

Table
Page 108
NAICS-based Product Code Description Year
Value of Product
Shipments
Relative Standard Error
(%)
Total Export Value of Goods
Domestic Export Value
of Goods
General Import Value
of Goods
Consumption Import Value
of Goods
Manufacturing and International Trade Report: 2014 and 2013(1)In thousands of dollars. Values are based on manufacturing data from the 2014 Annual Survey of
Manufactures and administrative records from official U.S. import and export merchandise trade statistics. (1) Data for 2013 supersede the data that were previously published in the 2013 Manufacturing and International Trade Report.
331492 Secondary smelted, refined, and alloy nonferrous metal (except copper and aluminum) products
2014 11,646,481 1.3 852,916 776,699 722,624 692,922
331492 Secondary smelted, refined, and alloy nonferrous metal (except copper and aluminum) products
2013 12,945,651 0.5 820,055 753,622 733,037 715,330
3314921 Other nonferrous metal powders, paste, and flakes 2014 3,503,531 2.9 852,916 776,699 722,624 692,922 3314921 Other nonferrous metal powders, paste, and flakes 2013 3,621,359 0.3 820,055 753,622 733,037 715,330 3314927 Secondary smelting, refining, and alloying of zinc 2014 556,186 5.6 N N N N 3314927 Secondary smelting, refining, and alloying of zinc 2013 443,927 3.8 N N N N 3314929 Secondary precious metals and precious metal alloys 2014 5,292,410 0.3 N N N N 3314929 Secondary precious metals and precious metal alloys 2013 6,685,108 0.4 N N N N 331492B All other miscellaneous secondary nonferrous metals 2014 1,954,817 5.6 N N N N 331492B All other miscellaneous secondary nonferrous metals 2013 1,874,693 0.9 N N N N 331492W Secondary smelted, refined, and alloy nonferrous metal (except copper and
aluminum) products, nsk, total2014 339,536 0.9 N N N N
331492W Secondary smelted, refined, and alloy nonferrous metal (except copper and aluminum) products, nsk, total
2013 320,564 17.4 N N N N

Table
Page 109
NAICS-based Product Code Description Year
Value of Product
Shipments
Relative Standard Error
(%)
Total Export Value of Goods
Domestic Export Value
of Goods
General Import Value
of Goods
Consumption Import Value
of Goods
Manufacturing and International Trade Report: 2014 and 2013(1)In thousands of dollars. Values are based on manufacturing data from the 2014 Annual Survey of
Manufactures and administrative records from official U.S. import and export merchandise trade statistics. (1) Data for 2013 supersede the data that were previously published in the 2013 Manufacturing and International Trade Report.
331511 Iron foundry products 2014 10,552,445 0.5 1,049,172 985,035 1,106,401 1,104,030331511 Iron foundry products 2013 9,919,441 0.8 960,845 896,163 1,091,608 1,089,912 3315111 Ductile iron pressure pipe and fittings 2014 1,992,179 2.3 48,587 40,539 74,902 74,903 3315111 Ductile iron pressure pipe and fittings 2013 1,767,774 1.3 48,575 43,400 60,822 60,822 3315113 Other ductile iron castings 2014 3,513,141 0.6 N N N N 3315113 Other ductile iron castings 2013 3,248,291 2.2 N N N N 3315115 Cast iron pressure pipe and fittings 2014 32,560 18.0 N N N N 3315115 Cast iron pressure pipe and fittings 2013 59,124 0.0 N N N N 3315117 Cast iron soil pipe and fittings, all sizes 2014 D S 17,080 16,482 26,928 26,928 3315117 Cast iron soil pipe and fittings, all sizes 2013 D S 12,081 11,977 20,528 20,528 3315119 Other gray iron castings 2014 4,212,266 0.4 21,926 21,827 47,533 47,533 3315119 Other gray iron castings 2013 4,029,720 0.9 17,870 17,341 48,419 48,419 331511A Standard malleable iron castings 2014 94,108 12.5 N N N N 331511A Standard malleable iron castings 2013 91,365 4.1 N N N N 331511C Pearlitic malleable iron castings 2014 D S N N N N 331511C Pearlitic malleable iron castings 2013 23,237 9.9 N N N N 331511E Molds and stools for heavy steel ingots 2014 153,999 8.1 4,630 3,848 3,329 3,289 331511E Molds and stools for heavy steel ingots 2013 173,521 1.4 3,800 3,364 4,028 4,006 331511W Iron foundry products, nsk, total 2014 D S N N N N 331511W Iron foundry products, nsk, total 2013 D S N N N N 331511X Undistributed iron foundry products 2014 N X 956,950 902,339 953,708 951,376 331511X Undistributed iron foundry products 2013 N X 878,519 820,081 957,811 956,136331512 Steel investment castings 2014 3,656,535 1.2 N N N N331512 Steel investment castings 2013 3,697,364 0.7 N N N N 3315120 Steel investment castings 2014 3,656,535 1.2 N N N N 3315120 Steel investment castings 2013 3,697,364 0.7 N N N N

Table
Page 110
NAICS-based Product Code Description Year
Value of Product
Shipments
Relative Standard Error
(%)
Total Export Value of Goods
Domestic Export Value
of Goods
General Import Value
of Goods
Consumption Import Value
of Goods
Manufacturing and International Trade Report: 2014 and 2013(1)In thousands of dollars. Values are based on manufacturing data from the 2014 Annual Survey of
Manufactures and administrative records from official U.S. import and export merchandise trade statistics. (1) Data for 2013 supersede the data that were previously published in the 2013 Manufacturing and International Trade Report.
331513 Steel foundry products (except investment) 2014 4,562,071 2.6 8,682 5,651 222,085 221,814331513 Steel foundry products (except investment) 2013 4,038,657 1.1 8,136 7,426 215,718 215,715 3315131 Carbon steel castings, excluding investment 2014 2,199,777 4.5 N N N N 3315131 Carbon steel castings, excluding investment 2013 1,676,252 2.2 N N N N 3315134 Alloy steel castings, excluding investment 2014 2,254,326 2.8 8,682 5,651 63,932 63,892 3315134 Alloy steel castings, excluding investment 2013 2,266,819 1.2 8,136 7,426 63,365 63,365 331513W Steel foundry products (except investment), nsk, total 2014 107,968 4.4 N N N N 331513W Steel foundry products (except investment), nsk, total 2013 95,587 0.0 N N N N 331513X Undistributed steel foundry products (except investment) 2014 N X N N 158,153 157,922 331513X Undistributed steel foundry products (except investment) 2013 N X N N 152,353 152,350331523 Nonferrous metal die-casting foundry products 2014 8,087,168 2.1 164,206 151,927 202,317 201,959331523 Nonferrous metal die-casting foundry products 2013 7,800,357 0.4 168,311 156,970 167,178 166,502 3315231 Aluminum die-castings 2014 5,845,961 2.5 164,206 151,927 202,317 201,959 3315231 Aluminum die-castings 2013 5,649,972 0.6 168,311 156,970 167,178 166,502 3315233 Nonferrous (excluding aluminum) die-castings 2014 2,079,815 4.0 N N N N 3315233 Nonferrous (excluding aluminum) die-castings 2013 1,972,846 0.3 N N N N 331523W Nonferrous metal die-casting foundry products, nsk, total 2014 161,392 0.6 N N N N 331523W Nonferrous metal die-casting foundry products, nsk, total 2013 177,539 0.0 N N N N331524 Aluminum foundry products (except die-casting) 2014 2,874,331 2.1 N N N N331524 Aluminum foundry products (except die-casting) 2013 2,759,494 0.8 N N N N 3315240 Aluminum foundry products (except die-casting) 2014 2,874,331 2.1 N N N N 3315240 Aluminum foundry products (except die-casting) 2013 2,759,494 0.8 N N N N331529 Other nonferrous metal foundry products (except die-casting) 2014 2,249,118 1.6 N N 10,412 8,940331529 Other nonferrous metal foundry products (except die-casting) 2013 2,238,073 0.5 N N 11,769 11,769 3315291 Copper foundries (excluding die-casting) 2014 1,353,576 1.3 N N 10,412 8,940 3315291 Copper foundries (excluding die-casting) 2013 1,364,071 0.7 N N 11,769 11,769 3315293 Other nonferrous foundries (excluding die-casting) 2014 847,375 3.7 N N N N 3315293 Other nonferrous foundries (excluding die-casting) 2013 832,457 0.7 N N N N 331529W Other nonferrous metal foundry products (except die-casting), nsk, total 2014 48,167 0.8 N N N N 331529W Other nonferrous metal foundry products (except die-casting), nsk, total 2013 41,544 0.0 N N N N

Table
Page 111
NAICS-based Product Code Description Year
Value of Product
Shipments
Relative Standard Error
(%)
Total Export Value of Goods
Domestic Export Value
of Goods
General Import Value
of Goods
Consumption Import Value
of Goods
Manufacturing and International Trade Report: 2014 and 2013(1)In thousands of dollars. Values are based on manufacturing data from the 2014 Annual Survey of
Manufactures and administrative records from official U.S. import and export merchandise trade statistics. (1) Data for 2013 supersede the data that were previously published in the 2013 Manufacturing and International Trade Report.
332111 Iron and steel forgings 2014 9,128,784 1.0 3,165 2,225 90,582 83,565332111 Iron and steel forgings 2013 9,179,836 0.8 5,509 3,308 58,480 57,360 3321111 Hot impression die impact, press, and upset steel forgings 2014 6,520,629 1.0 N N N N 3321111 Hot impression die impact, press, and upset steel forgings 2013 6,703,355 1.0 N N N N 3321113 Cold impression die impact, press, and upset steel forgings 2014 613,043 2.5 N N N N 3321113 Cold impression die impact, press, and upset steel forgings 2013 552,929 2.4 N N N N 3321115 Seamless rolled ring forgings, ferrous, made from purchased iron and steel 2014 1,171,151 1.1 N N N N 3321115 Seamless rolled ring forgings, ferrous, made from purchased iron and steel 2013 1,169,600 1.7 N N N N 3321117 Open die and smith forgings (hammer and press), ferrous, made from
purchased iron and steel2014 501,371 10.5 N N N N
3321117 Open die and smith forgings (hammer and press), ferrous, made from purchased iron and steel
2013 401,966 4.8 N N N N
332111W Iron and steel forgings, nsk, total 2014 322,590 0.2 N N N N 332111W Iron and steel forgings, nsk, total 2013 351,986 0.1 N N N N 332111X Undistributed iron and steel forgings 2014 N X 3,165 2,225 90,582 83,565 332111X Undistributed iron and steel forgings 2013 N X 5,509 3,308 58,480 57,360332112 Nonferrous forgings 2014 3,035,137 1.9 183,779 182,388 30,765 30,765332112 Nonferrous forgings 2013 2,932,073 0.4 188,555 187,359 35,723 35,723 3321121 Hot impression die impact, press, and upset nonferrous forgings 2014 2,742,157 1.9 N N N N 3321121 Hot impression die impact, press, and upset nonferrous forgings 2013 2,648,649 0.5 N N N N 3321123 All other nonferrous forgings 2014 262,514 9.8 N N N N 3321123 All other nonferrous forgings 2013 253,064 1.1 N N N N 332112W Nonferrous forgings, nsk, total 2014 30,466 0.0 N N N N 332112W Nonferrous forgings, nsk, total 2013 30,360 0.0 N N N N 332112X Undistributed nonferrous forgings 2014 N X 183,779 182,388 30,765 30,765 332112X Undistributed nonferrous forgings 2013 N X 188,555 187,359 35,723 35,723332114 Custom roll form products 2014 8,287,892 0.9 N N N N332114 Custom roll form products 2013 7,893,131 0.9 N N N N 3321140 Custom roll form products 2014 8,287,892 0.9 N N N N 3321140 Custom roll form products 2013 7,893,131 0.9 N N N N
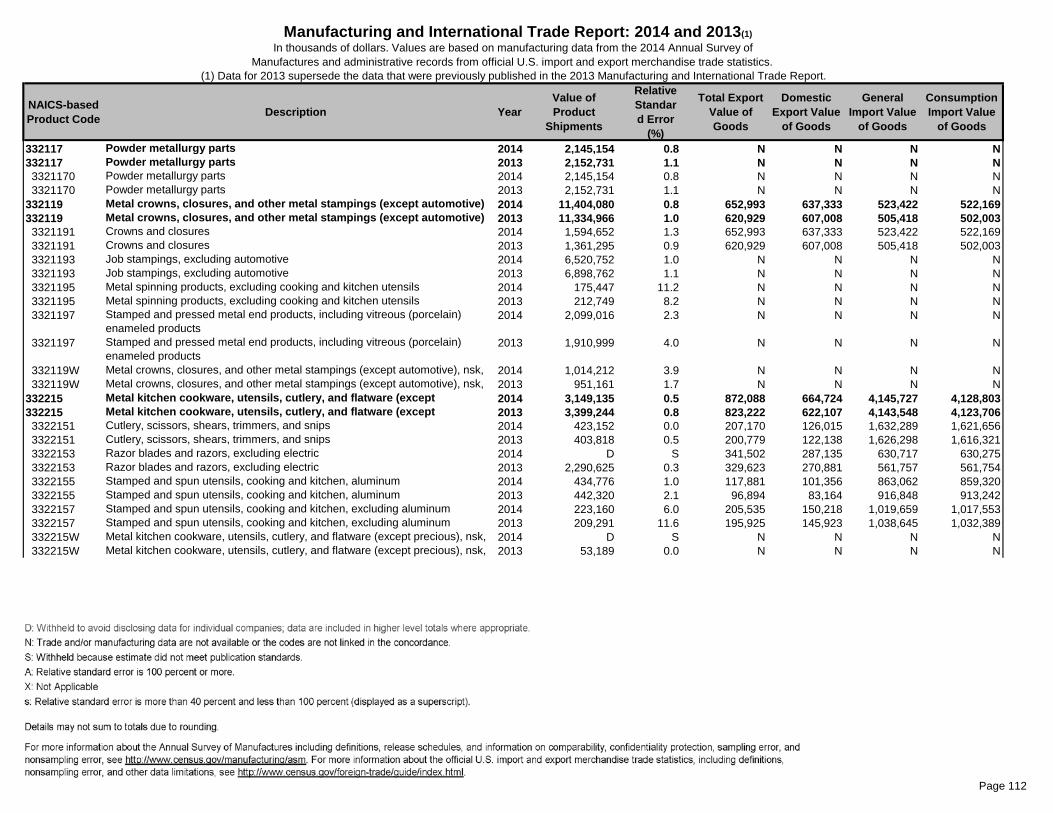
Table
Page 112
NAICS-based Product Code Description Year
Value of Product
Shipments
Relative Standard Error
(%)
Total Export Value of Goods
Domestic Export Value
of Goods
General Import Value
of Goods
Consumption Import Value
of Goods
Manufacturing and International Trade Report: 2014 and 2013(1)In thousands of dollars. Values are based on manufacturing data from the 2014 Annual Survey of
Manufactures and administrative records from official U.S. import and export merchandise trade statistics. (1) Data for 2013 supersede the data that were previously published in the 2013 Manufacturing and International Trade Report.
332117 Powder metallurgy parts 2014 2,145,154 0.8 N N N N332117 Powder metallurgy parts 2013 2,152,731 1.1 N N N N 3321170 Powder metallurgy parts 2014 2,145,154 0.8 N N N N 3321170 Powder metallurgy parts 2013 2,152,731 1.1 N N N N332119 Metal crowns, closures, and other metal stampings (except automotive) 2014 11,404,080 0.8 652,993 637,333 523,422 522,169332119 Metal crowns, closures, and other metal stampings (except automotive) 2013 11,334,966 1.0 620,929 607,008 505,418 502,003 3321191 Crowns and closures 2014 1,594,652 1.3 652,993 637,333 523,422 522,169 3321191 Crowns and closures 2013 1,361,295 0.9 620,929 607,008 505,418 502,003 3321193 Job stampings, excluding automotive 2014 6,520,752 1.0 N N N N 3321193 Job stampings, excluding automotive 2013 6,898,762 1.1 N N N N 3321195 Metal spinning products, excluding cooking and kitchen utensils 2014 175,447 11.2 N N N N 3321195 Metal spinning products, excluding cooking and kitchen utensils 2013 212,749 8.2 N N N N 3321197 Stamped and pressed metal end products, including vitreous (porcelain)
enameled products2014 2,099,016 2.3 N N N N
3321197 Stamped and pressed metal end products, including vitreous (porcelain) enameled products
2013 1,910,999 4.0 N N N N
332119W Metal crowns, closures, and other metal stampings (except automotive), nsk, 2014 1,014,212 3.9 N N N N 332119W Metal crowns, closures, and other metal stampings (except automotive), nsk, 2013 951,161 1.7 N N N N332215 Metal kitchen cookware, utensils, cutlery, and flatware (except 2014 3,149,135 0.5 872,088 664,724 4,145,727 4,128,803332215 Metal kitchen cookware, utensils, cutlery, and flatware (except 2013 3,399,244 0.8 823,222 622,107 4,143,548 4,123,706 3322151 Cutlery, scissors, shears, trimmers, and snips 2014 423,152 0.0 207,170 126,015 1,632,289 1,621,656 3322151 Cutlery, scissors, shears, trimmers, and snips 2013 403,818 0.5 200,779 122,138 1,626,298 1,616,321 3322153 Razor blades and razors, excluding electric 2014 D S 341,502 287,135 630,717 630,275 3322153 Razor blades and razors, excluding electric 2013 2,290,625 0.3 329,623 270,881 561,757 561,754 3322155 Stamped and spun utensils, cooking and kitchen, aluminum 2014 434,776 1.0 117,881 101,356 863,062 859,320 3322155 Stamped and spun utensils, cooking and kitchen, aluminum 2013 442,320 2.1 96,894 83,164 916,848 913,242 3322157 Stamped and spun utensils, cooking and kitchen, excluding aluminum 2014 223,160 6.0 205,535 150,218 1,019,659 1,017,553 3322157 Stamped and spun utensils, cooking and kitchen, excluding aluminum 2013 209,291 11.6 195,925 145,923 1,038,645 1,032,389 332215W Metal kitchen cookware, utensils, cutlery, and flatware (except precious), nsk, 2014 D S N N N N 332215W Metal kitchen cookware, utensils, cutlery, and flatware (except precious), nsk, 2013 53,189 0.0 N N N N
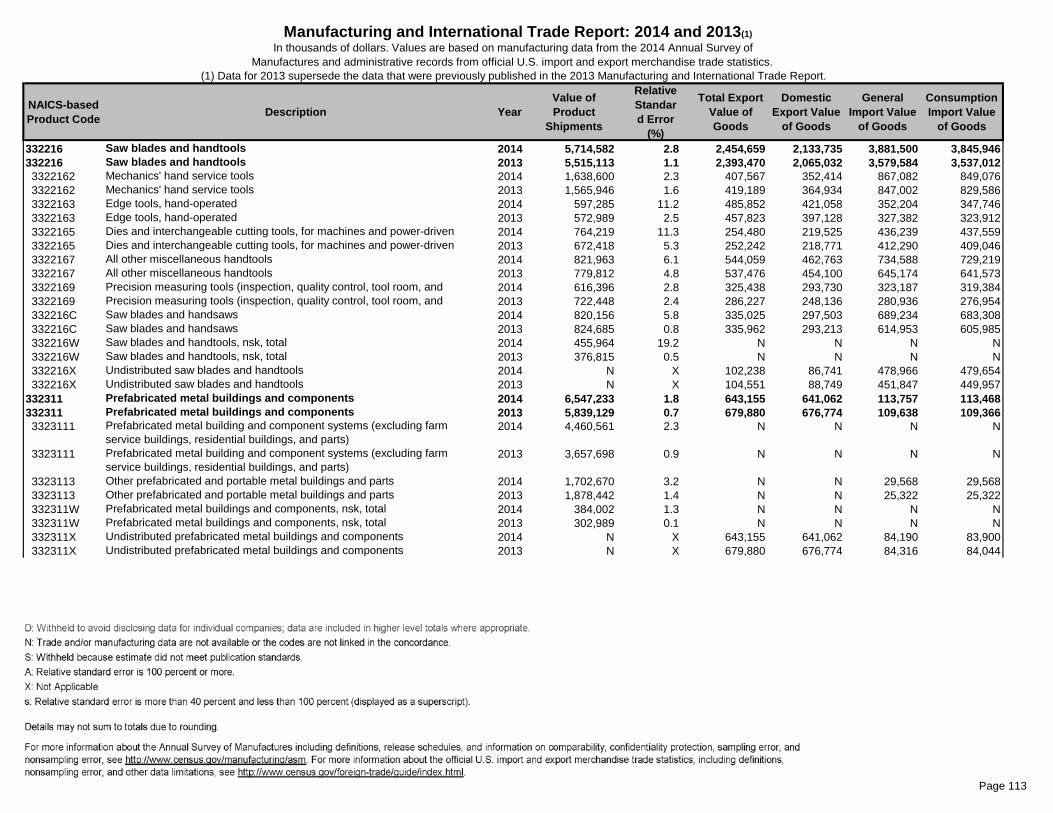
Table
Page 113
NAICS-based Product Code Description Year
Value of Product
Shipments
Relative Standard Error
(%)
Total Export Value of Goods
Domestic Export Value
of Goods
General Import Value
of Goods
Consumption Import Value
of Goods
Manufacturing and International Trade Report: 2014 and 2013(1)In thousands of dollars. Values are based on manufacturing data from the 2014 Annual Survey of
Manufactures and administrative records from official U.S. import and export merchandise trade statistics. (1) Data for 2013 supersede the data that were previously published in the 2013 Manufacturing and International Trade Report.
332216 Saw blades and handtools 2014 5,714,582 2.8 2,454,659 2,133,735 3,881,500 3,845,946332216 Saw blades and handtools 2013 5,515,113 1.1 2,393,470 2,065,032 3,579,584 3,537,012 3322162 Mechanics' hand service tools 2014 1,638,600 2.3 407,567 352,414 867,082 849,076 3322162 Mechanics' hand service tools 2013 1,565,946 1.6 419,189 364,934 847,002 829,586 3322163 Edge tools, hand-operated 2014 597,285 11.2 485,852 421,058 352,204 347,746 3322163 Edge tools, hand-operated 2013 572,989 2.5 457,823 397,128 327,382 323,912 3322165 Dies and interchangeable cutting tools, for machines and power-driven 2014 764,219 11.3 254,480 219,525 436,239 437,559 3322165 Dies and interchangeable cutting tools, for machines and power-driven 2013 672,418 5.3 252,242 218,771 412,290 409,046 3322167 All other miscellaneous handtools 2014 821,963 6.1 544,059 462,763 734,588 729,219 3322167 All other miscellaneous handtools 2013 779,812 4.8 537,476 454,100 645,174 641,573 3322169 Precision measuring tools (inspection, quality control, tool room, and 2014 616,396 2.8 325,438 293,730 323,187 319,384 3322169 Precision measuring tools (inspection, quality control, tool room, and 2013 722,448 2.4 286,227 248,136 280,936 276,954 332216C Saw blades and handsaws 2014 820,156 5.8 335,025 297,503 689,234 683,308 332216C Saw blades and handsaws 2013 824,685 0.8 335,962 293,213 614,953 605,985 332216W Saw blades and handtools, nsk, total 2014 455,964 19.2 N N N N 332216W Saw blades and handtools, nsk, total 2013 376,815 0.5 N N N N 332216X Undistributed saw blades and handtools 2014 N X 102,238 86,741 478,966 479,654 332216X Undistributed saw blades and handtools 2013 N X 104,551 88,749 451,847 449,957332311 Prefabricated metal buildings and components 2014 6,547,233 1.8 643,155 641,062 113,757 113,468332311 Prefabricated metal buildings and components 2013 5,839,129 0.7 679,880 676,774 109,638 109,366 3323111 Prefabricated metal building and component systems (excluding farm
service buildings, residential buildings, and parts)2014 4,460,561 2.3 N N N N
3323111 Prefabricated metal building and component systems (excluding farm service buildings, residential buildings, and parts)
2013 3,657,698 0.9 N N N N
3323113 Other prefabricated and portable metal buildings and parts 2014 1,702,670 3.2 N N 29,568 29,568 3323113 Other prefabricated and portable metal buildings and parts 2013 1,878,442 1.4 N N 25,322 25,322 332311W Prefabricated metal buildings and components, nsk, total 2014 384,002 1.3 N N N N 332311W Prefabricated metal buildings and components, nsk, total 2013 302,989 0.1 N N N N 332311X Undistributed prefabricated metal buildings and components 2014 N X 643,155 641,062 84,190 83,900 332311X Undistributed prefabricated metal buildings and components 2013 N X 679,880 676,774 84,316 84,044

Table
Page 114
NAICS-based Product Code Description Year
Value of Product
Shipments
Relative Standard Error
(%)
Total Export Value of Goods
Domestic Export Value
of Goods
General Import Value
of Goods
Consumption Import Value
of Goods
Manufacturing and International Trade Report: 2014 and 2013(1)In thousands of dollars. Values are based on manufacturing data from the 2014 Annual Survey of
Manufactures and administrative records from official U.S. import and export merchandise trade statistics. (1) Data for 2013 supersede the data that were previously published in the 2013 Manufacturing and International Trade Report.
332312 Fabricated structural metal products 2014 28,221,975 0.9 1,478,390 1,407,740 2,504,020 2,492,600332312 Fabricated structural metal products 2013 25,341,482 0.6 1,676,633 1,588,447 2,320,782 2,286,402 3323121 Fabricated structural metal bar joists and concrete reinforcing bars 2014 12,946,292 1.3 396,328 379,207 576,091 575,089 3323121 Fabricated structural metal bar joists and concrete reinforcing bars 2013 12,930,407 0.8 460,257 412,937 537,699 537,572 3323123 Fabricated structural metal for bridges 2014 1,606,664 2.8 86,546 84,207 12,429 12,385 3323123 Fabricated structural metal for bridges 2013 1,524,864 2.1 85,972 80,115 22,515 22,405 3323125 Other fabricated structural metal 2014 11,729,184 1.6 120,103 111,773 314,172 311,735 3323125 Other fabricated structural metal 2013 9,376,117 1.0 136,564 135,095 186,500 176,676 332312W Fabricated structural metal products, nsk, total 2014 1,939,835 2.0 N N N N 332312W Fabricated structural metal products, nsk, total 2013 1,510,094 0.6 N N N N 332312X Undistributed fabricated structural metal products 2014 N X 875,413 832,554 1,601,328 1,593,391 332312X Undistributed fabricated structural metal products 2013 N X 993,839 960,299 1,574,069 1,549,748332313 Plate work 2014 6,865,237 1.3 129,970 129,066 15,063 15,050332313 Plate work 2013 6,989,290 2.0 110,694 106,355 27,739 27,720 3323130 Fabricated plate work (stacks and weldments) 2014 6,865,237 1.3 129,970 129,066 15,063 15,050 3323130 Fabricated plate work (stacks and weldments) 2013 6,989,290 2.0 110,694 106,355 27,739 27,720332321 Metal windows and doors 2014 9,853,318 1.5 401,753 392,550 702,495 700,917332321 Metal windows and doors 2013 9,585,170 0.6 377,347 371,313 593,376 592,879 3323211 Metal doors (excluding storm doors) 2014 5,629,434 2.3 N N 414,849 413,410 3323211 Metal doors (excluding storm doors) 2013 5,506,023 0.5 N N 382,364 381,867 3323213 Metal windows (excluding storm sash) 2014 1,711,766 3.3 N N 240,407 240,323 3323213 Metal windows (excluding storm sash) 2013 1,795,907 2.7 N N 170,603 170,603 3323215 Metal molding and trim and store fronts 2014 774,240 4.0 N N N N 3323215 Metal molding and trim and store fronts 2013 698,337 0.8 N N N N 3323217 Metal combination screen, storm sash, and storm doors 2014 314,964 7.7 N N N N 3323217 Metal combination screen, storm sash, and storm doors 2013 253,011 0.5 N N N N 3323219 Metal window and door screens (excluding combination) and metal weather 2014 854,738 4.4 N N N N 3323219 Metal window and door screens (excluding combination) and metal weather 2013 778,829 3.1 N N N N 332321W Metal windows and doors, nsk, total 2014 568,176 4.2 N N N N 332321W Metal windows and doors, nsk, total 2013 553,063 0.4 N N N N 332321X Undistributed metal windows and doors 2014 N X 401,753 392,550 47,239 47,185 332321X Undistributed metal windows and doors 2013 N X 377,347 371,313 40,409 40,409

Table
Page 115
NAICS-based Product Code Description Year
Value of Product
Shipments
Relative Standard Error
(%)
Total Export Value of Goods
Domestic Export Value
of Goods
General Import Value
of Goods
Consumption Import Value
of Goods
Manufacturing and International Trade Report: 2014 and 2013(1)In thousands of dollars. Values are based on manufacturing data from the 2014 Annual Survey of
Manufactures and administrative records from official U.S. import and export merchandise trade statistics. (1) Data for 2013 supersede the data that were previously published in the 2013 Manufacturing and International Trade Report.
332322 Sheet metal work products 2014 20,270,254 2.4 270,849 255,497 62,557 62,276332322 Sheet metal work products 2013 19,294,717 0.6 261,044 249,967 62,413 64,466 3323221 Sheet metal air-conditioning ducts and stove pipe 2014 1,922,238 4.7 N N N N 3323221 Sheet metal air-conditioning ducts and stove pipe 2013 1,643,838 1.1 N N N N 3323223 Sheet metal culverts, flumes, irrigation pipes, etc. 2014 1,379,523 3.3 N N N N 3323223 Sheet metal culverts, flumes, irrigation pipes, etc. 2013 1,199,680 3.1 N N N N 3323227 Sheet metal roofing and roof drainage equipment 2014 2,051,321 5.7 N N N N 3323227 Sheet metal roofing and roof drainage equipment 2013 2,111,551 1.5 N N N N 3323229 Sheet metal flooring and siding 2014 1,005,488 5.6 N N N N 3323229 Sheet metal flooring and siding 2013 890,666 1.4 N N N N 332322A Sheet metal awnings, canopies, cornices, and soffits 2014 940,531 4.5 N N N N 332322A Sheet metal awnings, canopies, cornices, and soffits 2013 944,801 0.7 N N N N 332322C Sheet metal electronic enclosures 2014 2,762,655 12.1 102,166 87,967 N N 332322C Sheet metal electronic enclosures 2013 2,566,544 1.8 93,115 83,795 N N 332322F Metal studs, nonload and load-bearing (iron, steel, and aluminum) 2014 740,157 2.5 N N N N 332322F Metal studs, nonload and load-bearing (iron, steel, and aluminum) 2013 788,846 4.0 N N N N 332322G Other sheet metal work 2014 7,554,110 3.0 N N N N 332322G Other sheet metal work 2013 7,221,235 1.1 N N N N 332322W Sheet metal work products, nsk, total 2014 1,914,229 9.9 N N N N 332322W Sheet metal work products, nsk, total 2013 1,927,555 2.4 N N N N 332322X Undistributed sheet metal work products 2014 N X 168,683 167,530 62,557 62,276 332322X Undistributed sheet metal work products 2013 N X 167,929 166,172 62,413 64,466

Table
Page 116
NAICS-based Product Code Description Year
Value of Product
Shipments
Relative Standard Error
(%)
Total Export Value of Goods
Domestic Export Value
of Goods
General Import Value
of Goods
Consumption Import Value
of Goods
Manufacturing and International Trade Report: 2014 and 2013(1)In thousands of dollars. Values are based on manufacturing data from the 2014 Annual Survey of
Manufactures and administrative records from official U.S. import and export merchandise trade statistics. (1) Data for 2013 supersede the data that were previously published in the 2013 Manufacturing and International Trade Report.
332323 Ornamental and architectural metal work products 2014 6,363,876 2.2 183,702 154,523 577,167 577,178332323 Ornamental and architectural metal work products 2013 6,154,114 1.2 171,541 146,884 425,692 425,551 3323231 Metal grilles, registers, and air diffusers 2014 1,009,510 5.3 N N N N 3323231 Metal grilles, registers, and air diffusers 2013 882,786 2.9 N N N N 3323233 Ornamental and architectural metal work 2014 2,329,616 3.2 N N 46,166 46,166 3323233 Ornamental and architectural metal work 2013 2,220,384 2.3 N N 42,983 42,983 3323236 Open metal flooring, grating, and studs 2014 539,997 6.7 N N 34,643 34,607 3323236 Open metal flooring, grating, and studs 2013 564,699 2.3 N N 30,217 30,214 3323237 Metal scaffolding and shoring and forming for concrete work 2014 180,035 15.7 98,534 74,159 375,780 375,780 3323237 Metal scaffolding and shoring and forming for concrete work 2013 134,231 1.3 87,900 67,454 244,013 243,880 3323239 Other architectural and ornamental work 2014 1,477,486 4.6 N N N N 3323239 Other architectural and ornamental work 2013 1,534,465 2.8 N N N N 332323W Ornamental and architectural metal work products, nsk, total 2014 827,231 8.6 N N N N 332323W Ornamental and architectural metal work products, nsk, total 2013 817,550 2.1 N N N N 332323X Undistributed ornamental and architectural metal work products 2014 N X 85,168 80,364 120,578 120,625 332323X Undistributed ornamental and architectural metal work products 2013 N X 83,641 79,429 108,479 108,474332410 Power boilers and heat exchangers 2014 6,867,921 1.2 2,109,814 1,983,164 1,858,041 1,843,539332410 Power boilers and heat exchangers 2013 6,561,679 1.0 2,270,511 2,200,899 1,820,129 1,810,985 3324101 Fabricated heat exchangers and steam condensers (excluding nuclear
applications)2014 5,003,349 1.5 1,349,145 1,260,194 1,163,850 1,156,983
3324101 Fabricated heat exchangers and steam condensers (excluding nuclear applications)
2013 4,690,527 1.3 1,277,111 1,216,266 1,018,802 1,012,364
3324105 Steel power boilers (stationary and marine), parts and attachments (excluding nuclear applications)
2014 1,125,354 3.5 359,917 350,734 351,242 350,613
3324105 Steel power boilers (stationary and marine), parts and attachments (excluding nuclear applications)
2013 1,101,757 2.1 449,491 443,256 474,232 473,982
3324107 Nuclear reactor steam supply systems, heat exchangers and condensers, pressurizers, components, and auxiliary equipment
2014 568,796 0.1 266,062 265,079 133,549 127,982
3324107 Nuclear reactor steam supply systems, heat exchangers and condensers, pressurizers, components, and auxiliary equipment
2013 615,049 0.4 469,913 468,599 123,842 123,842
332410W Power boilers and heat exchangers, nsk, total 2014 170,423 1.4 N N N N 332410W Power boilers and heat exchangers, nsk, total 2013 154,347 1.4 N N N N 332410X Undistributed power boilers and heat exchangers 2014 N X 134,690 107,158 209,401 207,960 332410X Undistributed power boilers and heat exchangers 2013 N X 73,996 72,778 203,253 200,797
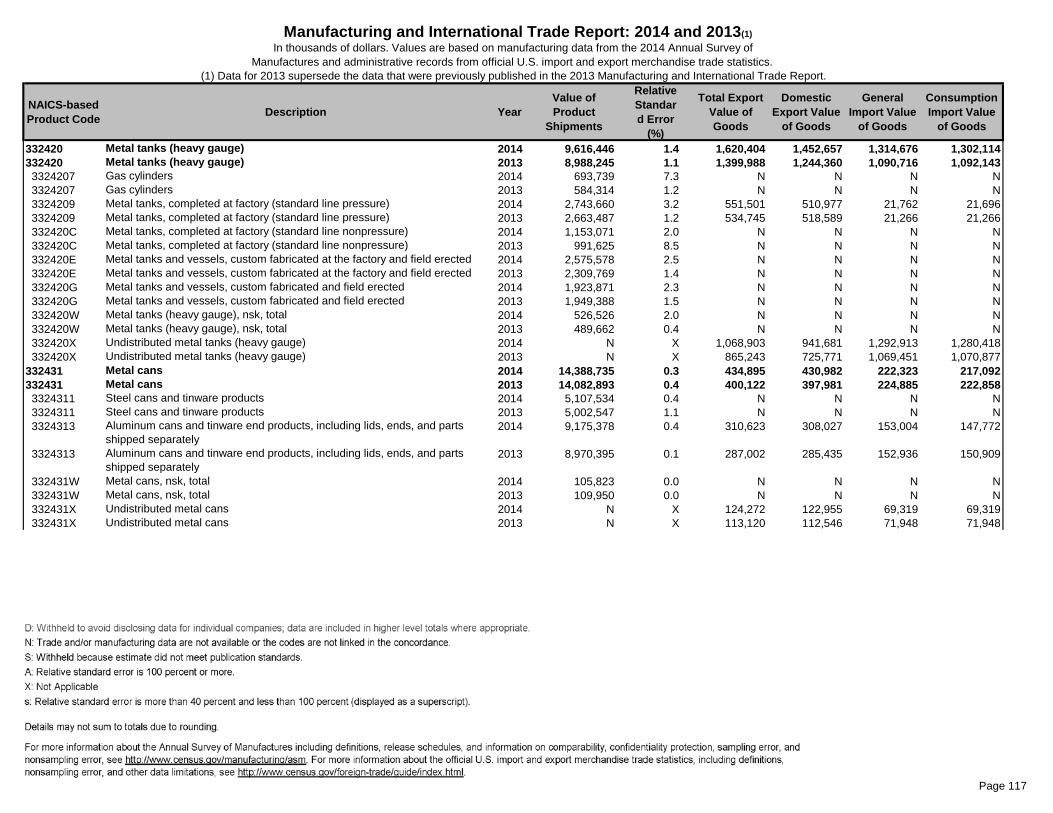
Table
Page 117
NAICS-based Product Code Description Year
Value of Product
Shipments
Relative Standard Error
(%)
Total Export Value of Goods
Domestic Export Value
of Goods
General Import Value
of Goods
Consumption Import Value
of Goods
Manufacturing and International Trade Report: 2014 and 2013(1)In thousands of dollars. Values are based on manufacturing data from the 2014 Annual Survey of
Manufactures and administrative records from official U.S. import and export merchandise trade statistics. (1) Data for 2013 supersede the data that were previously published in the 2013 Manufacturing and International Trade Report.
332420 Metal tanks (heavy gauge) 2014 9,616,446 1.4 1,620,404 1,452,657 1,314,676 1,302,114332420 Metal tanks (heavy gauge) 2013 8,988,245 1.1 1,399,988 1,244,360 1,090,716 1,092,143 3324207 Gas cylinders 2014 693,739 7.3 N N N N 3324207 Gas cylinders 2013 584,314 1.2 N N N N 3324209 Metal tanks, completed at factory (standard line pressure) 2014 2,743,660 3.2 551,501 510,977 21,762 21,696 3324209 Metal tanks, completed at factory (standard line pressure) 2013 2,663,487 1.2 534,745 518,589 21,266 21,266 332420C Metal tanks, completed at factory (standard line nonpressure) 2014 1,153,071 2.0 N N N N 332420C Metal tanks, completed at factory (standard line nonpressure) 2013 991,625 8.5 N N N N 332420E Metal tanks and vessels, custom fabricated at the factory and field erected 2014 2,575,578 2.5 N N N N 332420E Metal tanks and vessels, custom fabricated at the factory and field erected 2013 2,309,769 1.4 N N N N 332420G Metal tanks and vessels, custom fabricated and field erected 2014 1,923,871 2.3 N N N N 332420G Metal tanks and vessels, custom fabricated and field erected 2013 1,949,388 1.5 N N N N 332420W Metal tanks (heavy gauge), nsk, total 2014 526,526 2.0 N N N N 332420W Metal tanks (heavy gauge), nsk, total 2013 489,662 0.4 N N N N 332420X Undistributed metal tanks (heavy gauge) 2014 N X 1,068,903 941,681 1,292,913 1,280,418 332420X Undistributed metal tanks (heavy gauge) 2013 N X 865,243 725,771 1,069,451 1,070,877332431 Metal cans 2014 14,388,735 0.3 434,895 430,982 222,323 217,092332431 Metal cans 2013 14,082,893 0.4 400,122 397,981 224,885 222,858 3324311 Steel cans and tinware products 2014 5,107,534 0.4 N N N N 3324311 Steel cans and tinware products 2013 5,002,547 1.1 N N N N 3324313 Aluminum cans and tinware end products, including lids, ends, and parts
shipped separately2014 9,175,378 0.4 310,623 308,027 153,004 147,772
3324313 Aluminum cans and tinware end products, including lids, ends, and parts shipped separately
2013 8,970,395 0.1 287,002 285,435 152,936 150,909
332431W Metal cans, nsk, total 2014 105,823 0.0 N N N N 332431W Metal cans, nsk, total 2013 109,950 0.0 N N N N 332431X Undistributed metal cans 2014 N X 124,272 122,955 69,319 69,319 332431X Undistributed metal cans 2013 N X 113,120 112,546 71,948 71,948

Table
Page 118
NAICS-based Product Code Description Year
Value of Product
Shipments
Relative Standard Error
(%)
Total Export Value of Goods
Domestic Export Value
of Goods
General Import Value
of Goods
Consumption Import Value
of Goods
Manufacturing and International Trade Report: 2014 and 2013(1)In thousands of dollars. Values are based on manufacturing data from the 2014 Annual Survey of
Manufactures and administrative records from official U.S. import and export merchandise trade statistics. (1) Data for 2013 supersede the data that were previously published in the 2013 Manufacturing and International Trade Report.
332439 Other metal containers 2014 3,540,616 2.4 517,405 473,197 704,135 702,051332439 Other metal containers 2013 3,384,159 2.9 474,724 436,061 611,307 606,316 3324391 Steel pails (1- to 12-gallon capacity) and fabricated steel boxes 2014 293,245 4.1 N N N N 3324391 Steel pails (1- to 12-gallon capacity) and fabricated steel boxes 2013 286,501 2.7 N N N N 3324393 Steel shipping barrels and drums, more than 12-gallon capacity (excluding
beer barrels)2014 1,124,301 6.8 N N N N
3324393 Steel shipping barrels and drums, more than 12-gallon capacity (excluding beer barrels)
2013 985,151 4.4 N N N N
3324396 All other metal containers 2014 1,865,795 1.7 87,521 75,071 187,492 185,593 3324396 All other metal containers 2013 1,868,629 4.6 60,284 50,819 145,570 140,859 332439W Other metal containers, nsk, total 2014 257,274 2.9 N N N N 332439W Other metal containers, nsk, total 2013 243,879 0.1 N N N N 332439X Undistributed other metal containers 2014 N X 429,884 398,126 516,643 516,458 332439X Undistributed other metal containers 2013 N X 414,440 385,243 465,738 465,458332510 Hardware 2014 7,789,412 0.9 2,963,211 2,529,295 6,822,379 6,639,778332510 Hardware 2013 7,144,576 0.4 2,738,513 2,312,946 6,423,775 6,296,607 3325102 Furniture hardware (excluding cabinet hardware) 2014 529,133 2.3 181,614 136,185 734,653 733,862 3325102 Furniture hardware (excluding cabinet hardware) 2013 539,396 0.3 176,638 133,090 703,540 701,216 3325104 Builders' hardware 2014 3,620,375 1.5 487,796 374,172 1,935,160 1,924,626 3325104 Builders' hardware 2013 3,375,421 0.8 476,633 347,886 1,859,365 1,854,736 3325106 Motor vehicle hardware (lock units, door and window handles, window
regulators, hinges, license plate brackets, etc.)2014 1,916,634 1.5 1,161,424 1,007,811 2,762,054 2,627,327
3325106 Motor vehicle hardware (lock units, door and window handles, window regulators, hinges, license plate brackets, etc.)
2013 1,711,950 0.8 993,776 858,872 2,582,051 2,479,251
3325107 Other transportation equipment hardware (excluding motor vehicle hardware) 2014 669,494 3.4 329,649 312,017 262,071 250,279 3325107 Other transportation equipment hardware (excluding motor vehicle hardware) 2013 548,178 0.9 283,364 268,566 226,497 222,096 332510A All other miscellaneous hardware 2014 683,764 4.6 296,319 270,944 537,639 521,407 332510A All other miscellaneous hardware 2013 603,520 1.0 332,594 303,130 509,901 502,188 332510W Hardware, nsk, total 2014 370,012 1.6 N N N N 332510W Hardware, nsk, total 2013 366,112 0.0 N N N N 332510X Undistributed hardware 2014 N X 506,409 428,164 590,801 582,278 332510X Undistributed hardware 2013 N X 475,508 401,402 542,421 537,121

Table
Page 119
NAICS-based Product Code Description Year
Value of Product
Shipments
Relative Standard Error
(%)
Total Export Value of Goods
Domestic Export Value
of Goods
General Import Value
of Goods
Consumption Import Value
of Goods
Manufacturing and International Trade Report: 2014 and 2013(1)In thousands of dollars. Values are based on manufacturing data from the 2014 Annual Survey of
Manufactures and administrative records from official U.S. import and export merchandise trade statistics. (1) Data for 2013 supersede the data that were previously published in the 2013 Manufacturing and International Trade Report.
332613 Springs 2014 3,648,597 1.8 699,012 648,279 1,048,551 1,037,557332613 Springs 2013 3,414,478 0.8 654,077 612,697 934,569 925,050 3326131 Hot formed steel springs, excluding wire 2014 719,244 2.5 48,911 40,046 581,340 580,873 3326131 Hot formed steel springs, excluding wire 2013 597,970 0.6 43,406 36,819 512,553 511,998 3326133 Cold formed steel springs, excluding wire 2014 596,181 5.8 N N N N 3326133 Cold formed steel springs, excluding wire 2013 466,198 1.4 N N N N 3326135 Precision mechanical wire springs 2014 956,295 4.1 8,815 8,511 5,514 5,514 3326135 Precision mechanical wire springs 2013 1,022,871 2.0 8,023 7,791 4,094 4,094 3326137 Other wire springs 2014 1,179,688 2.7 N N 10,151 10,151 3326137 Other wire springs 2013 1,143,633 1.4 N N 12,070 12,070 332613W Springs, nsk, total 2014 197,190 2.2 N N N N 332613W Springs, nsk, total 2013 183,806 0.8 N N N N 332613X Undistributed springs 2014 N X 641,287 599,722 451,545 441,019 332613X Undistributed springs 2013 N X 602,648 568,087 405,851 396,888

Table
Page 120
NAICS-based Product Code Description Year
Value of Product
Shipments
Relative Standard Error
(%)
Total Export Value of Goods
Domestic Export Value
of Goods
General Import Value
of Goods
Consumption Import Value
of Goods
Manufacturing and International Trade Report: 2014 and 2013(1)In thousands of dollars. Values are based on manufacturing data from the 2014 Annual Survey of
Manufactures and administrative records from official U.S. import and export merchandise trade statistics. (1) Data for 2013 supersede the data that were previously published in the 2013 Manufacturing and International Trade Report.
332618 Other fabricated wire products 2014 4,566,639 3.1 1,169,567 1,054,488 2,165,089 2,161,645332618 Other fabricated wire products 2013 4,680,141 1.5 1,107,556 987,922 2,073,429 2,076,416 3326181 Noninsulated ferrous wire rope, cable, forms, and strand, made from
purchased wire2014 1,005,756 3.4 368,898 336,747 640,670 640,268
3326181 Noninsulated ferrous wire rope, cable, forms, and strand, made from purchased wire
2013 1,006,385 3.8 336,807 306,735 619,543 627,568
3326182 Other nonferrous fabricated wire products, made from purchased wire 2014 966,865 6.4 34,360 33,212 11,380 11,365 3326182 Other nonferrous fabricated wire products, made from purchased wire 2013 970,152 5.6 36,991 34,433 10,900 10,867 3326183 Ferrous wire cloth and other ferrous woven wire products, made from
purchased wire2014 452,961 7.1 54,651 49,378 116,717 116,715
3326183 Ferrous wire cloth and other ferrous woven wire products, made from purchased wire
2013 450,601 0.4 57,424 52,060 109,756 109,754
3326185 Nonferrous wire cloth and other nonferrous woven wire products, made from purchased wire
2014 110,622 18.2 18,434 15,792 2,602 2,602
3326185 Nonferrous wire cloth and other nonferrous woven wire products, made from purchased wire
2013 106,485 2.8 24,201 23,027 3,949 3,949
3326187 Steel fencing and fence gates, made from purchased wire 2014 211,502 4.7 N N N N 3326187 Steel fencing and fence gates, made from purchased wire 2013 254,134 2.4 N N N N 3326189 Steel nails, staples, tacks, spikes, and brads, made from purchased wire 2014 194,945 6.7 N N N N 3326189 Steel nails, staples, tacks, spikes, and brads, made from purchased wire 2013 176,734 2.5 N N N N 332618B Other ferrous fabricated wire products (excluding springs), made from
purchased wire2014 1,195,857 7.2 278,629 242,964 644,870 644,710
332618B Other ferrous fabricated wire products (excluding springs), made from purchased wire
2013 1,267,478 1.1 276,485 237,440 599,082 596,741
332618W Other fabricated wire products, nsk, total 2014 428,131 17.7 N N N N 332618W Other fabricated wire products, nsk, total 2013 448,173 1.5 N N N N 332618X Undistributed other fabricated wire products 2014 N X 414,596 376,394 748,851 745,986 332618X Undistributed other fabricated wire products 2013 N X 375,648 334,228 730,199 727,538332710 Machine shops 2014 39,872,986 0.8 N N N N332710 Machine shops 2013 38,351,537 1.4 N N N N 3327100 Receipts for machine shop job work and job order repairs 2014 39,872,986 0.8 N N N N 3327100 Receipts for machine shop job work and job order repairs 2013 38,351,537 1.4 N N N N

Table
Page 121
NAICS-based Product Code Description Year
Value of Product
Shipments
Relative Standard Error
(%)
Total Export Value of Goods
Domestic Export Value
of Goods
General Import Value
of Goods
Consumption Import Value
of Goods
Manufacturing and International Trade Report: 2014 and 2013(1)In thousands of dollars. Values are based on manufacturing data from the 2014 Annual Survey of
Manufactures and administrative records from official U.S. import and export merchandise trade statistics. (1) Data for 2013 supersede the data that were previously published in the 2013 Manufacturing and International Trade Report.
332721 Precision turned products 2014 17,990,744 0.7 N N N N332721 Precision turned products 2013 18,190,886 1.0 N N N N 3327211 Precision turned products, automotive 2014 4,460,847 1.0 N N N N 3327211 Precision turned products, automotive 2013 4,631,067 3.6 N N N N 3327213 Precision turned products (made on CNC equipment or screw machines),
excluding automotive2014 12,463,291 0.9 N N N N
3327213 Precision turned products (made on CNC equipment or screw machines), excluding automotive
2013 12,549,768 0.7 N N N N
332721W Precision turned products, nsk, total 2014 1,066,606 3.8 N N N N 332721W Precision turned products, nsk, total 2013 1,010,051 1.0 N N N N332722 Bolts, nuts, screws, rivets, and washers 2014 9,827,611 0.7 4,198,478 3,675,136 5,167,937 5,054,047332722 Bolts, nuts, screws, rivets, and washers 2013 9,492,368 0.6 3,940,087 3,480,650 4,789,031 4,714,158 3327221 Aircraft fasteners (including aerospace), excluding plastics (meets
specifications for flying vehicles)2014 2,350,105 1.0 N N N N
3327221 Aircraft fasteners (including aerospace), excluding plastics (meets specifications for flying vehicles)
2013 2,258,274 0.6 N N N N
3327223 Externally threaded metal fasteners (excluding aircraft types) 2014 3,856,439 0.9 N N 11,714 11,714 3327223 Externally threaded metal fasteners (excluding aircraft types) 2013 3,673,175 0.9 N N 14,359 14,359 3327225 Internally threaded metal fasteners (excluding aircraft types) 2014 1,188,043 1.7 N N N N 3327225 Internally threaded metal fasteners (excluding aircraft types) 2013 1,109,421 1.1 N N N N 3327227 Rivets, washers, and other nonthreaded metal fasteners (excluding aircraft 2014 622,655 3.8 N N N N 3327227 Rivets, washers, and other nonthreaded metal fasteners (excluding aircraft 2013 678,272 1.6 N N N N 332722A Products, made by cold-, warm-, or hot-heading processes (excluding 2014 1,272,565 2.8 N N N N 332722A Products, made by cold-, warm-, or hot-heading processes (excluding 2013 1,256,735 0.8 N N N N 332722W Bolts, nuts, screws, rivets, and washers, nsk, total 2014 537,803 2.8 N N N N 332722W Bolts, nuts, screws, rivets, and washers, nsk, total 2013 516,491 7.9 N N N N 332722X Undistributed bolts, nuts, screws, rivets, and washers 2014 N X 4,198,478 3,675,136 5,156,223 5,042,333 332722X Undistributed bolts, nuts, screws, rivets, and washers 2013 N X 3,940,087 3,480,650 4,774,672 4,699,799

Table
Page 122
NAICS-based Product Code Description Year
Value of Product
Shipments
Relative Standard Error
(%)
Total Export Value of Goods
Domestic Export Value
of Goods
General Import Value
of Goods
Consumption Import Value
of Goods
Manufacturing and International Trade Report: 2014 and 2013(1)In thousands of dollars. Values are based on manufacturing data from the 2014 Annual Survey of
Manufactures and administrative records from official U.S. import and export merchandise trade statistics. (1) Data for 2013 supersede the data that were previously published in the 2013 Manufacturing and International Trade Report.
332811 Metal heat treating 2014 6,997,471 1.7 N N N N332811 Metal heat treating 2013 6,763,387 0.5 N N N N 3328110 Heat treating of metal for the trade (heat treating, pickling, annealing,
brazing, shot peening, tempering, etc.)2014 6,997,471 1.7 N N N N
3328110 Heat treating of metal for the trade (heat treating, pickling, annealing, brazing, shot peening, tempering, etc.)
2013 6,763,387 0.5 N N N N
332812 Metal coating, engraving (except jewelry and silverware), and allied services to manufacturers
2014 13,674,068 0.8 N N N N
332812 Metal coating, engraving (except jewelry and silverware), and allied services to manufacturers
2013 12,903,332 0.6 N N N N
3328120 Metal coating, engraving (excluding jewelry and silverware), and allied services to manufacturers
2014 13,674,068 0.8 N N N N
3328120 Metal coating, engraving (excluding jewelry and silverware), and allied services to manufacturers
2013 12,903,332 0.6 N N N N
332813 Electroplating, plating, polishing, anodizing, and coloring 2014 7,464,205 0.8 N N N N332813 Electroplating, plating, polishing, anodizing, and coloring 2013 7,510,104 0.8 N N N N 3328130 Electroplating, plating, polishing, anodizing, and coloring 2014 7,464,205 0.8 N N N N 3328130 Electroplating, plating, polishing, anodizing, and coloring 2013 7,510,104 0.8 N N N N

Table
Page 123
NAICS-based Product Code Description Year
Value of Product
Shipments
Relative Standard Error
(%)
Total Export Value of Goods
Domestic Export Value
of Goods
General Import Value
of Goods
Consumption Import Value
of Goods
Manufacturing and International Trade Report: 2014 and 2013(1)In thousands of dollars. Values are based on manufacturing data from the 2014 Annual Survey of
Manufactures and administrative records from official U.S. import and export merchandise trade statistics. (1) Data for 2013 supersede the data that were previously published in the 2013 Manufacturing and International Trade Report.
332911 Industrial valves 2014 12,919,228 1.1 10,396,503 9,076,436 11,617,964 11,424,586332911 Industrial valves 2013 12,594,682 0.8 9,408,230 8,276,900 10,462,460 10,350,878 3329111 Gates, globes, angles, straightway (Y-type) check, stop and check, cross, 3-
and 4-way, etc.2014 2,885,725 2.6 N N N N
3329111 Gates, globes, angles, straightway (Y-type) check, stop and check, cross, 3- and 4-way, etc.
2013 3,343,803 1.6 N N N N
3329113 Industrial valves for water works and municipal equipment (IBBM, AWWA, 2014 1,665,728 1.9 1,834,817 1,601,973 2,105,494 2,094,249 3329113 Industrial valves for water works and municipal equipment (IBBM, AWWA, 2013 1,428,738 0.1 1,810,292 1,608,777 1,858,353 1,856,765 3329115 Industrial ball valves (all metals, pressures, and types), including manual and
power-operated, on-off valves2014 2,140,298 2.1 N N N N
3329115 Industrial ball valves (all metals, pressures, and types), including manual and power-operated, on-off valves
2013 2,250,710 2.8 N N N N
3329117 Industrial butterfly valves (all metals, pressures, and types), including manual and power-operated, on-off valves
2014 579,849 3.1 N N N N
3329117 Industrial butterfly valves (all metals, pressures, and types), including manual and power-operated, on-off valves
2013 462,212 2.8 N N N N
3329119 Industrial plug valves (all metals, pressures, and types), including lubricated, cylindrical eccentric, and sleeve-lined
2014 638,873 1.4 N N N N
3329119 Industrial plug valves (all metals, pressures, and types), including lubricated, cylindrical eccentric, and sleeve-lined
2013 452,158 0.9 N N N N
332911B All other miscellaneous industrial valves 2014 2,377,195 3.3 1,329,709 1,255,794 563,164 558,810 332911B All other miscellaneous industrial valves 2013 2,036,504 2.0 1,111,813 1,057,000 466,396 465,645 332911D Nuclear valves (N-stamp only) 2014 310,955 0.1 N N N N 332911D Nuclear valves (N-stamp only) 2013 299,093 4.4 N N N N 332911F Automatic regulating and control valves and parts (excluding nuclear), power-
operated, designed for modulating (throttling) service2014 1,510,348 3.2 709,625 598,762 861,191 847,220
332911F Automatic regulating and control valves and parts (excluding nuclear), power-operated, designed for modulating (throttling) service
2013 1,489,725 0.4 667,323 568,073 868,673 861,702
332911H Solenoid-operated valves and parts, excluding nuclear and fluid power 2014 483,217 6.0 961,100 755,240 1,530,663 1,508,179 332911H Solenoid-operated valves and parts, excluding nuclear and fluid power 2013 468,793 1.2 816,665 628,721 1,348,953 1,370,784 332911W Industrial valves, nsk, total 2014 327,039 5.8 N N N N 332911W Industrial valves, nsk, total 2013 362,946 6.1 N N N N 332911X Undistributed industrial valves 2014 N X 5,561,251 4,864,667 6,557,452 6,416,128 332911X Undistributed industrial valves 2013 N X 5,002,137 4,414,328 5,920,085 5,795,981

Table
Page 124
NAICS-based Product Code Description Year
Value of Product
Shipments
Relative Standard Error
(%)
Total Export Value of Goods
Domestic Export Value
of Goods
General Import Value
of Goods
Consumption Import Value
of Goods
Manufacturing and International Trade Report: 2014 and 2013(1)In thousands of dollars. Values are based on manufacturing data from the 2014 Annual Survey of
Manufactures and administrative records from official U.S. import and export merchandise trade statistics. (1) Data for 2013 supersede the data that were previously published in the 2013 Manufacturing and International Trade Report.
332912 Fluid power valves and hose fittings 2014 9,422,129 0.6 1,836,374 1,584,568 2,078,850 1,974,801332912 Fluid power valves and hose fittings 2013 8,900,413 0.2 1,607,198 1,368,716 1,832,682 1,807,017 3329121 Aerospace-type hydraulic fluid power valves 2014 845,729 2.5 N N N N 3329121 Aerospace-type hydraulic fluid power valves 2013 894,145 1.1 N N N N 3329123 Aerospace-type pneumatic fluid power valves 2014 885,015 1.4 N N N N 3329123 Aerospace-type pneumatic fluid power valves 2013 1,060,611 0.1 N N N N 3329125 Nonaerospace-type hydraulic directional control valves 2014 925,441 0.3 N N N N 3329125 Nonaerospace-type hydraulic directional control valves 2013 924,339 0.4 N N N N 3329127 Nonaerospace-type hydraulic valves, excluding directional control 2014 684,704 0.5 N N N N 3329127 Nonaerospace-type hydraulic valves, excluding directional control 2013 699,793 0.5 N N N N 3329129 Nonaerospace-type pneumatic directional control valves 2014 544,303 2.0 N N N N 3329129 Nonaerospace-type pneumatic directional control valves 2013 465,873 0.2 N N N N 332912B Nonaerospace-type pneumatic valves, excluding directional control 2014 211,205 4.8 N N N N 332912B Nonaerospace-type pneumatic valves, excluding directional control 2013 206,674 0.4 N N N N 332912D Parts for fluid power valves 2014 395,922 6.0 362,030 252,429 632,318 621,666 332912D Parts for fluid power valves 2013 297,960 0.5 277,631 212,027 601,709 597,551 332912F Aerospace-type hydraulic and pneumatic fluid power hose or tube end
fittings and assemblies2014 1,263,695 1.6 N N N N
332912F Aerospace-type hydraulic and pneumatic fluid power hose or tube end fittings and assemblies
2013 1,106,971 0.4 N N N N

Table
Page 125
NAICS-based Product Code Description Year
Value of Product
Shipments
Relative Standard Error
(%)
Total Export Value of Goods
Domestic Export Value
of Goods
General Import Value
of Goods
Consumption Import Value
of Goods
Manufacturing and International Trade Report: 2014 and 2013(1)In thousands of dollars. Values are based on manufacturing data from the 2014 Annual Survey of
Manufactures and administrative records from official U.S. import and export merchandise trade statistics. (1) Data for 2013 supersede the data that were previously published in the 2013 Manufacturing and International Trade Report.
332912H Nonaerospace-type flared (metal) fittings, couplings, and assemblies of tubing used in fluid power transfer systems
2014 492,465 5.1 N N N N
332912H Nonaerospace-type flared (metal) fittings, couplings, and assemblies of tubing used in fluid power transfer systems
2013 514,728 1.6 N N N N
332912J Nonaerospace-type flareless fittings and couplings, including nonmetal fittings, used in fluid power transfer systems
2014 1,105,526 0.3 N N N N
332912J Nonaerospace-type flareless fittings and couplings, including nonmetal fittings, used in fluid power transfer systems
2013 828,837 1.1 N N N N
332912L Nonaerospace-type hydraulic and pneumatic fittings and couplings for hose 2014 1,296,918 2.0 N N N N 332912L Nonaerospace-type hydraulic and pneumatic fittings and couplings for hose 2013 1,238,686 0.4 N N N N 332912N Nonaerospace-type hydraulic and pneumatic assemblies of hose 2014 365,853 4.2 N N N N 332912N Nonaerospace-type hydraulic and pneumatic assemblies of hose 2013 249,735 2.6 N N N N 332912W Fluid power valves and hose fittings, nsk, total 2014 405,354 4.0 N N N N 332912W Fluid power valves and hose fittings, nsk, total 2013 412,062 1.1 N N N N 332912X Undistributed fluid power valves and hose fittings 2014 N X 1,474,344 1,332,139 1,446,532 1,353,135 332912X Undistributed fluid power valves and hose fittings 2013 N X 1,329,567 1,156,689 1,230,973 1,209,466332913 Plumbing fixture fittings and trim 2014 3,393,052 1.4 347,497 293,847 1,345,000 1,337,671332913 Plumbing fixture fittings and trim 2013 3,430,320 1.6 340,491 291,819 1,230,714 1,215,563 3329132 Metallic and nonmetallic single lever plumbing fixture controls, two- and three-
handle bath and shower fittings, and antiscald bath or shower valves2014 1,153,661 0.2 N N 152,916 150,503
3329132 Metallic and nonmetallic single lever plumbing fixture controls, two- and three-handle bath and shower fittings, and antiscald bath or shower valves
2013 1,125,666 3.7 N N 127,919 124,635
3329134 Metallic and nonmetallic lavatory and sink fittings (excluding single control), including drains and overflows
2014 890,328 1.3 16,353 15,332 83,236 83,042
3329134 Metallic and nonmetallic lavatory and sink fittings (excluding single control), including drains and overflows
2013 1,047,384 1.8 14,345 13,591 68,767 68,206
3329136 Miscellaneous metallic and nonmetallic plumbing fixtures, fittings, and trim 2014 1,238,804 3.6 300,151 250,537 973,354 969,122 3329136 Miscellaneous metallic and nonmetallic plumbing fixtures, fittings, and trim 2013 1,131,701 2.6 298,501 252,732 913,326 902,602 332913W Plumbing fixture fittings and trim, nsk, total 2014 110,259 0.0 N N N N 332913W Plumbing fixture fittings and trim, nsk, total 2013 125,569 0.0 N N N N 332913X Undistributed plumbing fixture fittings and trim 2014 N X 30,993 27,978 135,494 135,004 332913X Undistributed plumbing fixture fittings and trim 2013 N X 27,645 25,496 120,703 120,121

Table
Page 126
NAICS-based Product Code Description Year
Value of Product
Shipments
Relative Standard Error
(%)
Total Export Value of Goods
Domestic Export Value
of Goods
General Import Value
of Goods
Consumption Import Value
of Goods
Manufacturing and International Trade Report: 2014 and 2013(1)In thousands of dollars. Values are based on manufacturing data from the 2014 Annual Survey of
Manufactures and administrative records from official U.S. import and export merchandise trade statistics. (1) Data for 2013 supersede the data that were previously published in the 2013 Manufacturing and International Trade Report.
332919 Other metal valves and pipe fittings 2014 4,771,513 2.0 2,629,182 2,325,487 3,009,146 2,998,403332919 Other metal valves and pipe fittings 2013 4,827,389 0.7 2,606,324 2,322,353 2,771,045 2,751,296 3329191 Plumbing and heating valves and specialties, excluding plumbers' brass 2014 948,511 5.3 N N 360,458 360,268 3329191 Plumbing and heating valves and specialties, excluding plumbers' brass 2013 964,514 0.1 N N 306,181 306,080 3329194 Metal fittings, flanges, and unions for piping systems 2014 3,541,125 2.2 2,629,182 2,325,487 2,648,688 2,638,136 3329194 Metal fittings, flanges, and unions for piping systems 2013 3,627,462 0.9 2,606,324 2,322,353 2,464,863 2,445,216 332919W Other metal valves and pipe fittings, nsk, total 2014 281,876 1.0 N N N N 332919W Other metal valves and pipe fittings, nsk, total 2013 235,414 0.0 N N N N332991 Ball and roller bearings 2014 6,898,453 2.9 3,151,158 2,612,825 4,133,896 3,912,251332991 Ball and roller bearings 2013 6,345,690 1.0 2,992,567 2,502,776 3,799,251 3,591,582 3329911 Ball bearings, complete, unmounted 2014 2,405,358 1.6 556,397 432,085 1,222,589 1,119,856 3329911 Ball bearings, complete, unmounted 2013 2,355,641 2.0 516,916 409,532 1,146,922 1,040,767 3329913 Tapered roller bearings (including cups and cones), unmounted 2014 1,475,934 0.3 650,507 544,622 644,818 609,345 3329913 Tapered roller bearings (including cups and cones), unmounted 2013 1,465,001 2.8 619,386 519,736 585,649 558,090 3329915 Other roller bearings, unmounted 2014 1,274,200 1.5 424,444 348,823 745,445 703,771 3329915 Other roller bearings, unmounted 2013 1,133,706 1.1 431,197 348,427 712,376 663,544 3329917 Mounted bearings (excluding plain) 2014 722,576 0.0 145,099 132,629 40,360 39,731 3329917 Mounted bearings (excluding plain) 2013 604,298 0.1 122,053 110,060 33,472 32,755 3329919 Parts and components for ball and roller bearings (including balls and
rollers), sold separately (excluding cups and cones)2014 931,706 21.3 340,229 299,360 817,006 799,083
3329919 Parts and components for ball and roller bearings (including balls and rollers), sold separately (excluding cups and cones)
2013 702,180 2.2 330,988 288,638 714,360 706,520
332991W Ball and roller bearings, nsk, total 2014 88,679 3.3 N N N N 332991W Ball and roller bearings, nsk, total 2013 84,864 0.1 N N N N 332991X Undistributed ball and roller bearings 2014 N X 1,034,481 855,305 663,677 640,465 332991X Undistributed ball and roller bearings 2013 N X 972,028 826,384 606,472 589,906332992 Small arms ammunition 2014 3,176,002 0.4 380,875 373,306 853,141 853,148332992 Small arms ammunition 2013 3,276,719 0.6 367,245 362,370 789,130 788,137 3329920 Small arms ammunition 2014 3,176,002 0.4 380,875 373,306 853,141 853,148 3329920 Small arms ammunition 2013 3,276,719 0.6 367,245 362,370 789,130 788,137

Table
Page 127
NAICS-based Product Code Description Year
Value of Product
Shipments
Relative Standard Error
(%)
Total Export Value of Goods
Domestic Export Value
of Goods
General Import Value
of Goods
Consumption Import Value
of Goods
Manufacturing and International Trade Report: 2014 and 2013(1)In thousands of dollars. Values are based on manufacturing data from the 2014 Annual Survey of
Manufactures and administrative records from official U.S. import and export merchandise trade statistics. (1) Data for 2013 supersede the data that were previously published in the 2013 Manufacturing and International Trade Report.
332993 Ammunition (except small arms) 2014 1,567,193 1.0 672,406 669,362 135,017 102,400332993 Ammunition (except small arms) 2013 1,700,435 1.9 538,856 538,120 140,501 140,501 3329930 Ammunition (excluding small arms), more than 30 mm, more than 1.18 in. 2014 1,567,193 1.0 672,406 669,362 135,017 102,400 3329930 Ammunition (excluding small arms), more than 30 mm, more than 1.18 in. 2013 1,700,435 1.9 538,856 538,120 140,501 140,501332994 Small arms, ordnance, and ordnance accessories 2014 5,921,023 2.1 1,216,966 1,109,972 1,868,925 1,871,502332994 Small arms, ordnance, and ordnance accessories 2013 6,587,430 1.2 1,141,714 1,055,383 2,398,832 2,396,483 3329941 Machine guns (30 mm or less, 1.18 in. or less) 2014 366,784 11.8 182,366 180,842 2,839 1,799 3329941 Machine guns (30 mm or less, 1.18 in. or less) 2013 290,073 0.9 69,417 68,420 5,237 2,245 3329944 Small arms (30 mm or less, 1.18 in. or less) 2014 4,408,678 2.6 505,586 457,654 1,173,554 1,175,660 3329944 Small arms (30 mm or less, 1.18 in. or less) 2013 5,134,105 1.3 532,505 493,457 1,491,019 1,488,847 3329945 Guns, howitzers, mortars, turrets, parts, and all other miscellaneous
ordnance, accessories and related equipment (more than 30 mm (1.18 in.)) 2014 980,917 4.1 350,467 318,906 145,311 148,299
3329945 Guns, howitzers, mortars, turrets, parts, and all other miscellaneous ordnance, accessories and related equipment (more than 30 mm (1.18 in.))
2013 988,236 4.3 359,374 344,645 174,770 177,884
332994W Small arms, ordnance, and ordnance accessories, nsk, total 2014 164,644 0.1 N N N N 332994W Small arms, ordnance, and ordnance accessories, nsk, total 2013 175,016 0.1 N N N N 332994X Undistributed small arms, ordnance, and ordnance accessories 2014 N X 178,547 152,569 547,221 545,743 332994X Undistributed small arms, ordnance, and ordnance accessories 2013 N X 180,419 148,861 727,806 727,508332996 Fabricated pipe and pipe fittings 2014 7,728,275 1.0 N N N N332996 Fabricated pipe and pipe fittings 2013 7,579,669 0.5 N N N N 3329960 Fabricated pipe and pipe fittings made from purchased pipe 2014 7,728,275 1.0 N N N N 3329960 Fabricated pipe and pipe fittings made from purchased pipe 2013 7,579,669 0.5 N N N N
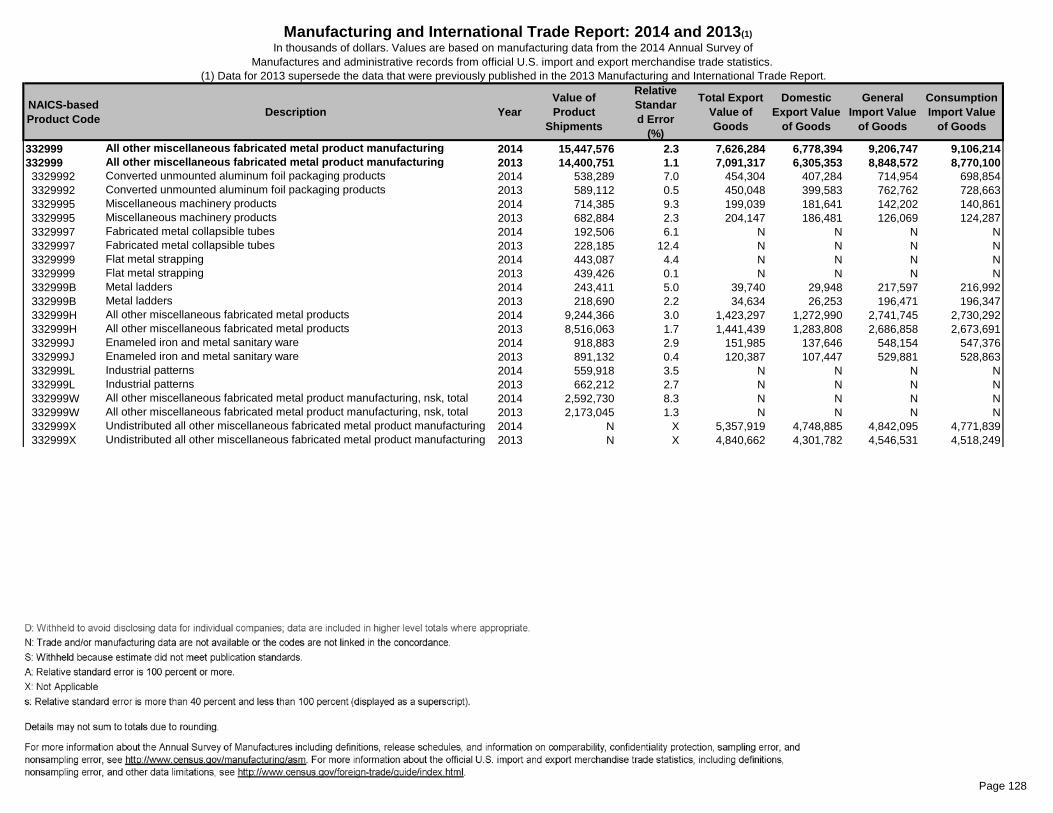
Table
Page 128
NAICS-based Product Code Description Year
Value of Product
Shipments
Relative Standard Error
(%)
Total Export Value of Goods
Domestic Export Value
of Goods
General Import Value
of Goods
Consumption Import Value
of Goods
Manufacturing and International Trade Report: 2014 and 2013(1)In thousands of dollars. Values are based on manufacturing data from the 2014 Annual Survey of
Manufactures and administrative records from official U.S. import and export merchandise trade statistics. (1) Data for 2013 supersede the data that were previously published in the 2013 Manufacturing and International Trade Report.
332999 All other miscellaneous fabricated metal product manufacturing 2014 15,447,576 2.3 7,626,284 6,778,394 9,206,747 9,106,214332999 All other miscellaneous fabricated metal product manufacturing 2013 14,400,751 1.1 7,091,317 6,305,353 8,848,572 8,770,100 3329992 Converted unmounted aluminum foil packaging products 2014 538,289 7.0 454,304 407,284 714,954 698,854 3329992 Converted unmounted aluminum foil packaging products 2013 589,112 0.5 450,048 399,583 762,762 728,663 3329995 Miscellaneous machinery products 2014 714,385 9.3 199,039 181,641 142,202 140,861 3329995 Miscellaneous machinery products 2013 682,884 2.3 204,147 186,481 126,069 124,287 3329997 Fabricated metal collapsible tubes 2014 192,506 6.1 N N N N 3329997 Fabricated metal collapsible tubes 2013 228,185 12.4 N N N N 3329999 Flat metal strapping 2014 443,087 4.4 N N N N 3329999 Flat metal strapping 2013 439,426 0.1 N N N N 332999B Metal ladders 2014 243,411 5.0 39,740 29,948 217,597 216,992 332999B Metal ladders 2013 218,690 2.2 34,634 26,253 196,471 196,347 332999H All other miscellaneous fabricated metal products 2014 9,244,366 3.0 1,423,297 1,272,990 2,741,745 2,730,292 332999H All other miscellaneous fabricated metal products 2013 8,516,063 1.7 1,441,439 1,283,808 2,686,858 2,673,691 332999J Enameled iron and metal sanitary ware 2014 918,883 2.9 151,985 137,646 548,154 547,376 332999J Enameled iron and metal sanitary ware 2013 891,132 0.4 120,387 107,447 529,881 528,863 332999L Industrial patterns 2014 559,918 3.5 N N N N 332999L Industrial patterns 2013 662,212 2.7 N N N N 332999W All other miscellaneous fabricated metal product manufacturing, nsk, total 2014 2,592,730 8.3 N N N N 332999W All other miscellaneous fabricated metal product manufacturing, nsk, total 2013 2,173,045 1.3 N N N N 332999X Undistributed all other miscellaneous fabricated metal product manufacturing 2014 N X 5,357,919 4,748,885 4,842,095 4,771,839 332999X Undistributed all other miscellaneous fabricated metal product manufacturing 2013 N X 4,840,662 4,301,782 4,546,531 4,518,249

Table
Page 129
NAICS-based Product Code Description Year
Value of Product
Shipments
Relative Standard Error
(%)
Total Export Value of Goods
Domestic Export Value
of Goods
General Import Value
of Goods
Consumption Import Value
of Goods
Manufacturing and International Trade Report: 2014 and 2013(1)In thousands of dollars. Values are based on manufacturing data from the 2014 Annual Survey of
Manufactures and administrative records from official U.S. import and export merchandise trade statistics. (1) Data for 2013 supersede the data that were previously published in the 2013 Manufacturing and International Trade Report.
333111 Farm machinery and equipment 2014 37,696,293 1.6 8,517,386 7,778,499 8,683,799 8,831,886333111 Farm machinery and equipment 2013 37,781,639 0.5 9,169,860 8,463,901 8,548,772 8,670,215 3331111 Farm-type, power take-off hp, wheel tractors (2- and 4-wheel drive), sold with
or without attachments (excluding parts)2014 12,162,688 4.1 2,148,196 1,918,044 2,999,177 3,296,885
3331111 Farm-type, power take-off hp, wheel tractors (2- and 4-wheel drive), sold with or without attachments (excluding parts)
2013 12,312,496 1.1 2,155,759 1,927,869 2,902,791 3,082,921
3331114 Farm dairy equipment, sprayers and dusters (excluding aerial types), farm blowers, and attachments
2014 3,144,470 1.8 868,527 756,173 155,370 156,297
3331114 Farm dairy equipment, sprayers and dusters (excluding aerial types), farm blowers, and attachments
2013 2,901,021 0.8 1,001,883 887,621 146,641 146,905
3331117 Planting, seeding, and fertilizing machinery and attachments, excluding turf machinery
2014 2,307,932 1.8 289,414 286,238 261,360 261,360
3331117 Planting, seeding, and fertilizing machinery and attachments, excluding turf machinery
2013 2,519,482 0.7 381,714 377,560 269,243 269,243
3331119 Harvesting machinery (excluding hay and straw) and attachments 2014 6,043,245 1.5 1,367,319 1,276,726 404,084 457,301 3331119 Harvesting machinery (excluding hay and straw) and attachments 2013 5,923,542 1.3 1,716,979 1,634,562 431,253 510,075 333111A Haying machinery and attachments 2014 1,749,115 1.7 202,390 183,643 179,694 182,904 333111A Haying machinery and attachments 2013 2,131,885 0.2 213,950 196,332 164,077 167,038 333111C Parts for farm machinery, for sale separately 2014 2,888,693 3.5 2,647,413 2,397,547 3,815,814 3,603,230 333111C Parts for farm machinery, for sale separately 2013 2,681,003 2.6 2,721,585 2,506,137 3,831,464 3,687,830 333111E Farm plows (including plowshares, primary tillage), harrows, rollers,
pulverizers, cultivators and weeders, and attachments2014 1,503,015 0.7 286,310 276,210 209,526 212,551
333111E Farm plows (including plowshares, primary tillage), harrows, rollers, pulverizers, cultivators and weeders, and attachments
2013 1,647,374 1.4 348,809 336,930 216,444 218,947
333111G All other farm machinery and equipment (excluding parts), including 2014 3,859,943 1.9 504,759 488,915 421,459 421,095 333111G All other farm machinery and equipment (excluding parts), including 2013 3,635,761 1.9 435,140 411,649 367,255 367,053 333111J Commercial turf and grounds care equipment, including parts and 2014 3,072,022 5.7 184,518 177,253 201,001 201,001 333111J Commercial turf and grounds care equipment, including parts and 2013 2,870,158 1.1 181,419 173,997 184,152 184,152 333111W Farm machinery and equipment, nsk, total 2014 965,169 26.4 N N N N 333111W Farm machinery and equipment, nsk, total 2013 1,158,918 0.4 N N N N 333111X Undistributed farm machinery and equipment 2014 N X 18,540 17,750 36,313 39,264 333111X Undistributed farm machinery and equipment 2013 N X 12,622 11,243 35,453 36,052

Table
Page 130
NAICS-based Product Code Description Year
Value of Product
Shipments
Relative Standard Error
(%)
Total Export Value of Goods
Domestic Export Value
of Goods
General Import Value
of Goods
Consumption Import Value
of Goods
Manufacturing and International Trade Report: 2014 and 2013(1)In thousands of dollars. Values are based on manufacturing data from the 2014 Annual Survey of
Manufactures and administrative records from official U.S. import and export merchandise trade statistics. (1) Data for 2013 supersede the data that were previously published in the 2013 Manufacturing and International Trade Report.
333112 Lawn and garden tractors and home lawn and garden equipment 2014 7,724,623 0.9 1,593,930 1,466,376 1,067,117 1,150,753333112 Lawn and garden tractors and home lawn and garden equipment 2013 7,779,384 0.4 1,520,663 1,406,158 1,089,805 1,175,779 3331121 Consumer nonriding lawn, garden, and snow equipment 2014 3,529,877 2.0 564,322 478,344 699,537 796,437 3331121 Consumer nonriding lawn, garden, and snow equipment 2013 3,856,013 0.7 521,364 454,728 732,650 828,669 3331123 Consumer riding lawn, garden, and snow equipment 2014 2,551,826 0.3 709,553 694,672 6,751 6,751 3331123 Consumer riding lawn, garden, and snow equipment 2013 2,332,009 0.4 650,429 632,611 18,643 18,643 3331127 Parts and attachments for consumer lawn, garden, and snow equipment 2014 1,472,953 0.9 253,538 237,520 275,524 262,629 3331127 Parts and attachments for consumer lawn, garden, and snow equipment 2013 1,431,298 0.1 274,262 258,788 268,248 257,753 333112W Lawn and garden tractors and home lawn and garden equipment, nsk, total 2014 169,966 0.0 N N N N 333112W Lawn and garden tractors and home lawn and garden equipment, nsk, total 2013 160,063 0.0 N N N N 333112X Undistributed lawn and garden tractors and home lawn and garden 2014 N X 66,517 55,840 85,305 84,937 333112X Undistributed lawn and garden tractors and home lawn and garden 2013 N X 74,609 60,031 70,264 70,714333120 Construction machinery 2014 33,241,755 1.1 17,292,024 14,954,714 17,851,312 17,913,961333120 Construction machinery 2013 31,238,520 0.6 19,761,167 17,479,233 15,347,417 15,470,319 3331201 Power cranes, excavation loaders, dozers, construction tractors, off-highway
trucks and trailers, mixers, pavers, backhoes, and related equipment2014 25,575,336 1.1 12,112,256 10,548,228 11,774,363 11,905,656
3331201 Power cranes, excavation loaders, dozers, construction tractors, off-highway trucks and trailers, mixers, pavers, backhoes, and related equipment
2013 23,553,922 0.6 13,623,046 12,122,782 9,834,424 9,973,359
3331208 Other construction machinery and equipment (excluding parts) 2014 4,218,979 4.7 504,852 464,144 569,685 569,820 3331208 Other construction machinery and equipment (excluding parts) 2013 4,149,836 2.9 488,822 447,038 497,503 494,140 3331209 Parts for construction machinery and equipment, sold separately 2014 2,827,440 2.2 4,503,196 3,781,130 5,347,772 5,278,992 3331209 Parts for construction machinery and equipment, sold separately 2013 2,891,001 1.0 5,447,671 4,714,381 4,903,880 4,893,297 333120W Construction machinery, nsk, total 2014 620,001 15.9 N N N N 333120W Construction machinery, nsk, total 2013 643,760 0.1 N N N N 333120X Undistributed construction machinery 2014 N X 171,720 161,212 159,493 159,493 333120X Undistributed construction machinery 2013 N X 201,627 195,032 111,611 109,522

Table
Page 131
NAICS-based Product Code Description Year
Value of Product
Shipments
Relative Standard Error
(%)
Total Export Value of Goods
Domestic Export Value
of Goods
General Import Value
of Goods
Consumption Import Value
of Goods
Manufacturing and International Trade Report: 2014 and 2013(1)In thousands of dollars. Values are based on manufacturing data from the 2014 Annual Survey of
Manufactures and administrative records from official U.S. import and export merchandise trade statistics. (1) Data for 2013 supersede the data that were previously published in the 2013 Manufacturing and International Trade Report.
333131 Mining machinery and equipment 2014 5,058,026 1.8 3,532,308 3,292,765 1,289,888 1,293,485333131 Mining machinery and equipment 2013 6,053,250 0.5 3,852,077 3,593,926 1,348,767 1,347,270 3331311 Underground mining machinery (excluding parts sold separately) 2014 2,212,025 3.1 N N N N 3331311 Underground mining machinery (excluding parts sold separately) 2013 2,667,124 0.3 N N N N 3331313 Mineral processing and beneficiation machinery (excluding parts sold 2014 152,271 6.3 N N N N 3331313 Mineral processing and beneficiation machinery (excluding parts sold 2013 211,739 6.1 N N N N 3331315 Crushing, pulverizing, and screening machinery (excluding parts sold
separately and portable crushing, screening, washing, and combination 2014 735,918 4.8 418,929 392,333 147,667 147,448
3331315 Crushing, pulverizing, and screening machinery (excluding parts sold separately and portable crushing, screening, washing, and combination
2013 839,505 3.2 340,983 319,149 144,809 143,279
3331317 Drills and other mining machinery (excluding parts sold separately) 2014 289,807 5.4 869,557 827,635 358,479 362,508 3331317 Drills and other mining machinery (excluding parts sold separately) 2013 307,574 0.4 1,112,990 1,066,558 349,630 349,577 3331319 Parts and attachments for mining machinery and equipment (sold 2014 1,487,160 3.3 1,694,194 1,565,797 678,688 678,679 3331319 Parts and attachments for mining machinery and equipment (sold 2013 1,833,739 0.4 1,835,136 1,682,145 773,891 773,952 333131W Mining machinery and equipment, nsk, total 2014 180,844 0.8 N N N N 333131W Mining machinery and equipment, nsk, total 2013 193,569 0.1 N N N N 333131X Undistributed mining machinery and equipment 2014 N X 549,628 507,001 105,054 104,850 333131X Undistributed mining machinery and equipment 2013 N X 562,968 526,074 80,436 80,462333132 Oil and gas field machinery and equipment 2014 25,008,141 1.7 8,187,668 7,821,786 1,730,183 1,716,741333132 Oil and gas field machinery and equipment 2013 24,380,052 0.3 7,882,525 7,583,146 1,539,039 1,521,647 3331321 Rotary oil and gas field drilling machinery and equipment 2014 11,456,246 1.1 363,660 359,072 56,992 56,983 3331321 Rotary oil and gas field drilling machinery and equipment 2013 11,699,733 0.5 494,271 472,688 64,978 64,969 3331323 Other oil and gas field drilling machinery and equipment 2014 2,627,450 5.9 N N N N 3331323 Other oil and gas field drilling machinery and equipment 2013 2,523,562 1.4 N N N N 3331325 Oil and gas field production machinery and equipment (excluding pumps) 2014 7,503,039 4.7 N N N N 3331325 Oil and gas field production machinery and equipment (excluding pumps) 2013 6,598,976 0.6 N N N N 3331327 Portable drilling rigs and parts (above ground) 2014 1,773,166 2.0 N N N N 3331327 Portable drilling rigs and parts (above ground) 2013 1,915,660 0.2 N N N N 3331329 Oil and gas field derricks and well surveying machinery 2014 622,597 3.6 N N N N 3331329 Oil and gas field derricks and well surveying machinery 2013 673,610 0.7 N N N N 333132W Oil and gas field machinery and equipment, nsk, total 2014 1,025,642 8.5 N N N N 333132W Oil and gas field machinery and equipment, nsk, total 2013 968,512 0.4 N N N N 333132X Undistributed oil and gas field machinery and equipment 2014 N X 7,824,008 7,462,714 1,673,192 1,659,758 333132X Undistributed oil and gas field machinery and equipment 2013 N X 7,388,254 7,110,458 1,474,061 1,456,679

Table
Page 132
NAICS-based Product Code Description Year
Value of Product
Shipments
Relative Standard Error
(%)
Total Export Value of Goods
Domestic Export Value
of Goods
General Import Value
of Goods
Consumption Import Value
of Goods
Manufacturing and International Trade Report: 2014 and 2013(1)In thousands of dollars. Values are based on manufacturing data from the 2014 Annual Survey of
Manufactures and administrative records from official U.S. import and export merchandise trade statistics. (1) Data for 2013 supersede the data that were previously published in the 2013 Manufacturing and International Trade Report.
333241 Food product machinery 2014 4,784,496 3.2 1,250,534 1,173,395 1,373,668 1,373,086333241 Food product machinery 2013 4,285,590 2.2 1,215,529 1,134,993 1,322,232 1,320,959 3332411 Dairy and milk products plant machinery and equipment (excluding bottling
and packaging)2014 849,074 8.3 36,482 35,297 15,906 15,906
3332411 Dairy and milk products plant machinery and equipment (excluding bottling and packaging)
2013 720,512 4.2 29,067 28,075 34,706 34,706
3332413 Commercial food products machinery (excluding packaging machinery and food cooking and warming equipment)
2014 1,482,528 4.5 379,326 359,700 459,361 459,044
3332413 Commercial food products machinery (excluding packaging machinery and food cooking and warming equipment)
2013 1,442,010 3.7 342,429 316,646 417,996 417,475
3332415 Industrial machinery and equipment for manufacturing or processing foods, beverages, and animal and fowl feed, including parts and attachments for industrial food and feed products machinery
2014 2,197,708 4.5 414,909 385,157 627,422 627,378
3332415 Industrial machinery and equipment for manufacturing or processing foods, beverages, and animal and fowl feed, including parts and attachments for industrial food and feed products machinery
2013 1,855,920 3.8 392,549 368,139 663,390 663,290
333241W Food product machiney, nsk, total 2014 255,187 26.0 N N N N 333241W Food product machiney, nsk, total 2013 267,148 0.5 N N N N 333241X Undistributed food product machinery 2014 N X 419,817 393,242 270,979 270,758 333241X Undistributed food product machinery 2013 N X 451,485 422,133 206,139 205,488333242 Semiconductor machinery 2014 6,969,793 0.8 11,062,589 10,081,587 13,312,752 13,111,666333242 Semiconductor machinery 2013 8,794,944 0.5 9,828,522 8,967,745 11,396,871 11,284,891 3332420 Semiconductor machinery (excluding furnaces and ovens, instruments, and
photographics)2014 6,969,793 0.8 11,062,589 10,081,587 13,312,752 13,111,666
3332420 Semiconductor machinery (excluding furnaces and ovens, instruments, and photographics)
2013 8,794,944 0.5 9,828,522 8,967,745 11,396,871 11,284,891

Table
Page 133
NAICS-based Product Code Description Year
Value of Product
Shipments
Relative Standard Error
(%)
Total Export Value of Goods
Domestic Export Value
of Goods
General Import Value
of Goods
Consumption Import Value
of Goods
Manufacturing and International Trade Report: 2014 and 2013(1)In thousands of dollars. Values are based on manufacturing data from the 2014 Annual Survey of
Manufactures and administrative records from official U.S. import and export merchandise trade statistics. (1) Data for 2013 supersede the data that were previously published in the 2013 Manufacturing and International Trade Report.
333243 Sawmill, woodworking, and paper machinery 2014 3,113,913 3.1 1,043,771 897,993 2,164,901 2,161,750333243 Sawmill, woodworking, and paper machinery 2013 2,995,616 1.2 997,220 871,400 1,825,926 1,816,315 3332431 Woodworking machinery, including parts, attachments, and accessories,
excluding for home workshops, garages, and service shops (excluding chainsaws and other power-driven handtools)
2014 701,286 9.9 168,324 134,661 716,311 714,703
3332431 Woodworking machinery, including parts, attachments, and accessories, excluding for home workshops, garages, and service shops (excluding chainsaws and other power-driven handtools)
2013 572,630 1.1 176,269 142,155 604,168 597,541
3332434 Woodworking machinery for home workshops, garages, and service shops (excluding chainsaws and other power-driven handtools)
2014 30,833 1.9 32,799 8,762 259,963 259,724
3332434 Woodworking machinery for home workshops, garages, and service shops (excluding chainsaws and other power-driven handtools)
2013 31,266 7.0 29,573 8,117 252,762 249,738
3332435 Paper industry machinery 2014 1,291,933 4.1 354,882 312,929 720,867 720,899 3332435 Paper industry machinery 2013 1,250,591 2.5 320,966 298,083 575,640 577,358 3332436 Parts and attachments for paper industry machinery (sold separately) 2014 840,703 4.4 487,766 441,641 467,761 466,424 3332436 Parts and attachments for paper industry machinery (sold separately) 2013 892,736 1.1 470,412 423,045 393,356 391,678 333243W Sawmill, woodworking, and paper machinery, nsk, total 2014 249,157 10.4 N N N N 333243W Sawmill, woodworking, and paper machinery, nsk, total 2013 248,393 3.3 N N N N333244 Printing machinery and equipment 2014 1,697,032 4.9 918,949 765,756 1,702,982 1,770,981333244 Printing machinery and equipment 2013 1,785,661 2.1 859,893 721,204 1,608,962 1,664,435 3332442 Printing presses, all types 2014 535,173 3.6 548,306 466,260 658,255 658,146 3332442 Printing presses, all types 2013 502,511 4.4 445,500 377,981 596,657 595,318 3332447 Binding machinery and equipment (including paper cutting, collating, and
gathering machines)2014 140,747 33.5 25,381 19,400 89,846 89,846
3332447 Binding machinery and equipment (including paper cutting, collating, and gathering machines)
2013 149,317 15.2 26,122 22,839 112,049 112,049
333244A All other miscellaneous printing trades machinery, including typesetting machinery (excluding justifying typewriters)
2014 834,162 3.9 345,261 280,096 954,882 1,022,989
333244A All other miscellaneous printing trades machinery, including typesetting machinery (excluding justifying typewriters)
2013 860,020 2.2 388,272 320,384 900,256 957,068
333244W Printing machinery and equipment, nsk, total 2014 186,949 31.0 N N N N 333244W Printing machinery and equipment, nsk, total 2013 273,813 1.2 N N N N

Table
Page 134
NAICS-based Product Code Description Year
Value of Product
Shipments
Relative Standard Error
(%)
Total Export Value of Goods
Domestic Export Value
of Goods
General Import Value
of Goods
Consumption Import Value
of Goods
Manufacturing and International Trade Report: 2014 and 2013(1)In thousands of dollars. Values are based on manufacturing data from the 2014 Annual Survey of
Manufactures and administrative records from official U.S. import and export merchandise trade statistics. (1) Data for 2013 supersede the data that were previously published in the 2013 Manufacturing and International Trade Report.
333249 Other industrial machinery 2014 13,030,575 2.3 4,485,962 3,997,748 6,055,943 6,046,658333249 Other industrial machinery 2013 12,113,828 0.9 4,189,334 3,766,825 5,824,489 5,818,145 3332491 Plastics-working machinery and equipment and parts, excluding patterns and
molds2014 2,428,674 5.5 1,540,670 1,329,707 2,330,750 2,325,917
3332491 Plastics-working machinery and equipment and parts, excluding patterns and molds
2013 2,367,679 1.8 1,372,043 1,202,993 2,325,875 2,321,456
3332493 Rubber-working machinery and equipment and parts, excluding tire molds 2014 399,657 3.6 251,917 221,950 446,530 446,246 3332493 Rubber-working machinery and equipment and parts, excluding tire molds 2013 391,628 5.1 249,346 225,984 391,319 391,058 3332495 Textile machinery, excluding parts, attachments, and accessories 2014 406,470 4.9 510,272 441,893 1,221,341 1,221,309 3332495 Textile machinery, excluding parts, attachments, and accessories 2013 380,690 2.1 488,770 441,890 1,096,165 1,096,165 3332497 Parts, attachments, and accessories for textile machinery 2014 162,346 2.5 186,410 156,882 240,969 240,908 3332497 Parts, attachments, and accessories for textile machinery 2013 155,792 8.4 192,513 164,028 302,778 302,778 3332499 Chemical manufacturing machinery, equipment, and parts 2014 1,352,035 6.6 N N N N 3332499 Chemical manufacturing machinery, equipment, and parts 2013 1,262,387 2.3 N N N N 333249A Foundry machinery and equipment, excluding patterns and molds 2014 561,923 5.0 146,657 142,322 135,596 135,590 333249A Foundry machinery and equipment, excluding patterns and molds 2013 550,371 4.0 189,644 184,355 187,522 187,570 333249C Printed circuit board manufacturing machinery and parts, accessories, and
attachments excluding testing2014 502,722 1.5 N N N N
333249C Printed circuit board manufacturing machinery and parts, accessories, and attachments excluding testing
2013 509,003 1.5 N N N N
333249F All other miscellaneous special industry machinery and equipment and parts 2014 5,765,276 3.7 1,803,739 1,663,065 1,272,923 1,269,457 333249F All other miscellaneous special industry machinery and equipment and parts 2013 5,104,538 1.9 1,655,658 1,511,004 1,205,377 1,203,535 333249W Other industrial machinery, nsk, total 2014 1,451,472 9.0 N N N N 333249W Other industrial machinery, nsk, total 2013 1,391,740 0.1 N N N N 333249X Undistributed other industrial machinery 2014 N X 46,297 41,930 407,834 407,230 333249X Undistributed other industrial machinery 2013 N X 41,360 36,570 315,454 315,584

Table
Page 135
NAICS-based Product Code Description Year
Value of Product
Shipments
Relative Standard Error
(%)
Total Export Value of Goods
Domestic Export Value
of Goods
General Import Value
of Goods
Consumption Import Value
of Goods
Manufacturing and International Trade Report: 2014 and 2013(1)In thousands of dollars. Values are based on manufacturing data from the 2014 Annual Survey of
Manufactures and administrative records from official U.S. import and export merchandise trade statistics. (1) Data for 2013 supersede the data that were previously published in the 2013 Manufacturing and International Trade Report.
333314 Optical instruments and lens 2014 4,054,467 2.9 4,448,604 3,594,433 5,045,721 4,991,380333314 Optical instruments and lens 2013 4,649,036 1.1 4,415,894 3,586,966 5,017,859 4,996,070 3333141 Sighting, tracking, and fire-control equipment, optical-type 2014 1,903,047 3.4 N N 187,137 186,167 3333141 Sighting, tracking, and fire-control equipment, optical-type 2013 2,584,933 1.9 N N 229,658 229,778 3333143 All other miscellaneous optical instruments and lenses (including binoculars
and astronomical instruments)2014 2,042,163 4.9 4,448,604 3,594,433 4,858,585 4,805,213
3333143 All other miscellaneous optical instruments and lenses (including binoculars and astronomical instruments)
2013 1,972,886 0.7 4,415,894 3,586,966 4,788,201 4,766,292
333314W Optical instruments and lens, nsk, total 2014 109,257 3.0 N N N N 333314W Optical instruments and lens, nsk, total 2013 91,217 3.7 N N N N333316 Photographic and photocopying equipment 2014 1,596,105 5.1 2,455,824 1,970,292 1,311,822 1,329,253333316 Photographic and photocopying equipment 2013 2,054,657 3.1 2,426,036 1,931,390 1,297,372 1,286,395 3333161 Still picture photographic equipment, excluding digital 2014 417,157 14.3 1,810,410 1,483,850 796,481 781,402 3333161 Still picture photographic equipment, excluding digital 2013 326,788 19.6 1,758,375 1,425,475 766,051 752,980 3333162 Digital cameras 2014 170,763 2.9 N N N N 3333162 Digital cameras 2013 115,375 0.3 N N N N 3333163 Photocopying equipment, including diffusion transfer, dye transfer,
electrostatic, light and heat sensitive types, etc.2014 399,871 0.0 364,107 248,588 212,913 246,348
3333163 Photocopying equipment, including diffusion transfer, dye transfer, electrostatic, light and heat sensitive types, etc.
2013 D S 379,079 263,792 207,756 210,198
3333164 Motion picture and all other photographic and photocopying equipment 2014 462,660 12.1 281,307 237,855 302,428 301,504 3333164 Motion picture and all other photographic and photocopying equipment 2013 567,723 1.5 288,582 242,122 323,565 323,217 333316W Photographic and photocopying equipment, nsk, total 2014 145,654 2.3 N N N N 333316W Photographic and photocopying equipment, nsk, total 2013 D S N N N N
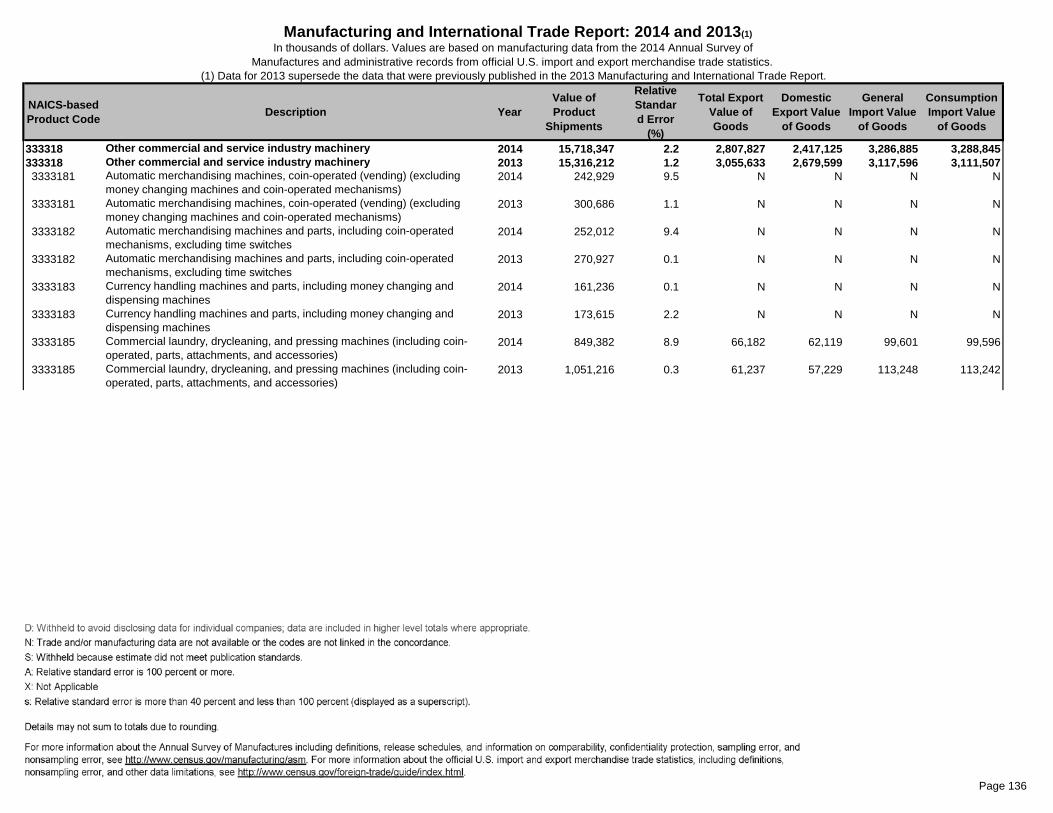
Table
Page 136
NAICS-based Product Code Description Year
Value of Product
Shipments
Relative Standard Error
(%)
Total Export Value of Goods
Domestic Export Value
of Goods
General Import Value
of Goods
Consumption Import Value
of Goods
Manufacturing and International Trade Report: 2014 and 2013(1)In thousands of dollars. Values are based on manufacturing data from the 2014 Annual Survey of
Manufactures and administrative records from official U.S. import and export merchandise trade statistics. (1) Data for 2013 supersede the data that were previously published in the 2013 Manufacturing and International Trade Report.
333318 Other commercial and service industry machinery 2014 15,718,347 2.2 2,807,827 2,417,125 3,286,885 3,288,845333318 Other commercial and service industry machinery 2013 15,316,212 1.2 3,055,633 2,679,599 3,117,596 3,111,507 3333181 Automatic merchandising machines, coin-operated (vending) (excluding
money changing machines and coin-operated mechanisms)2014 242,929 9.5 N N N N
3333181 Automatic merchandising machines, coin-operated (vending) (excluding money changing machines and coin-operated mechanisms)
2013 300,686 1.1 N N N N
3333182 Automatic merchandising machines and parts, including coin-operated mechanisms, excluding time switches
2014 252,012 9.4 N N N N
3333182 Automatic merchandising machines and parts, including coin-operated mechanisms, excluding time switches
2013 270,927 0.1 N N N N
3333183 Currency handling machines and parts, including money changing and dispensing machines
2014 161,236 0.1 N N N N
3333183 Currency handling machines and parts, including money changing and dispensing machines
2013 173,615 2.2 N N N N
3333185 Commercial laundry, drycleaning, and pressing machines (including coin-operated, parts, attachments, and accessories)
2014 849,382 8.9 66,182 62,119 99,601 99,596
3333185 Commercial laundry, drycleaning, and pressing machines (including coin-operated, parts, attachments, and accessories)
2013 1,051,216 0.3 61,237 57,229 113,248 113,242

Table
Page 137
NAICS-based Product Code Description Year
Value of Product
Shipments
Relative Standard Error
(%)
Total Export Value of Goods
Domestic Export Value
of Goods
General Import Value
of Goods
Consumption Import Value
of Goods
Manufacturing and International Trade Report: 2014 and 2013(1)In thousands of dollars. Values are based on manufacturing data from the 2014 Annual Survey of
Manufactures and administrative records from official U.S. import and export merchandise trade statistics. (1) Data for 2013 supersede the data that were previously published in the 2013 Manufacturing and International Trade Report.
3333187 Mailing, letter handling, and addressing machines, excluding parts and attachments
2014 922,081 12.0 69,919 64,182 64,281 64,281
3333187 Mailing, letter handling, and addressing machines, excluding parts and attachments
2013 696,159 0.1 69,461 63,492 64,419 64,419
3333188 Other office machinery, excluding parts and attachments 2014 298,742 5.9 221,526 134,711 792,559 796,310 3333188 Other office machinery, excluding parts and attachments 2013 305,074 2.9 234,578 158,921 768,118 769,610 3333189 Parts and attachments for office machines 2014 36,820 11.6 447,132 320,896 475,193 474,276 3333189 Parts and attachments for office machines 2013 37,427 0.0 494,232 370,481 497,527 493,666 333318A Commercial cooking and food-warming equipment and parts and 2014 3,333,166 2.9 899,100 838,621 675,558 675,770 333318A Commercial cooking and food-warming equipment and parts and 2013 3,457,471 1.3 962,569 898,620 564,009 563,103 333318C Commercial and industrial vacuum cleaners (including parts and 2014 476,005 11.5 N N N N 333318C Commercial and industrial vacuum cleaners (including parts and 2013 457,630 2.1 N N N N 333318F Automotive maintenance equipment (excluding handtools) (sold separately) 2014 817,585 16.0 109,127 88,546 61,270 61,270 333318F Automotive maintenance equipment (excluding handtools) (sold separately) 2013 637,965 0.3 128,916 111,336 51,018 51,018 333318H Electronic teaching machines, teaching aids, trainers, and simulators
(including kits)2014 1,827,036 7.4 269,174 251,134 223,920 223,920
333318H Electronic teaching machines, teaching aids, trainers, and simulators (including kits)
2013 1,483,195 8.4 250,494 234,587 179,945 179,945
333318J Miscellaneous machinery products (including flexible metal hose and tubing, metal bellows, etc.) (excluding electrical)
2014 4,812,740 2.8 587,456 526,225 763,586 762,578
333318J Miscellaneous machinery products (including flexible metal hose and tubing, metal bellows, etc.) (excluding electrical)
2013 4,835,058 0.8 703,301 645,609 716,003 713,196
333318W Other commercial and service industry machinery, nsk, total 2014 1,688,611 11.7 N N N N 333318W Other commercial and service industry machinery, nsk, total 2013 1,609,790 7.0 N N N N 333318X Undistributed other commercial and service industry machinery 2014 N X 138,210 130,691 130,917 130,844 333318X Undistributed other commercial and service industry machinery 2013 N X 150,845 139,323 163,309 163,309

Table
Page 138
NAICS-based Product Code Description Year
Value of Product
Shipments
Relative Standard Error
(%)
Total Export Value of Goods
Domestic Export Value
of Goods
General Import Value
of Goods
Consumption Import Value
of Goods
Manufacturing and International Trade Report: 2014 and 2013(1)In thousands of dollars. Values are based on manufacturing data from the 2014 Annual Survey of
Manufactures and administrative records from official U.S. import and export merchandise trade statistics. (1) Data for 2013 supersede the data that were previously published in the 2013 Manufacturing and International Trade Report.
333413 Industrial and commercial fans and blowers and air purification 2014 6,078,410 3.2 1,622,523 1,345,960 2,148,889 2,204,025333413 Industrial and commercial fans and blowers and air purification 2013 5,917,896 1.3 1,659,428 1,383,765 1,913,233 1,972,236 3334131 Industrial and commercial fans and blowers 2014 2,443,190 4.6 1,047,318 824,132 1,412,490 1,471,950 3334131 Industrial and commercial fans and blowers 2013 2,141,269 1.7 1,020,553 785,746 1,280,147 1,335,633 3334132 Dust collection and other air purification equipment for industrial gas
cleaning systems2014 1,596,652 5.3 168,584 162,778 66,722 66,703
3334132 Dust collection and other air purification equipment for industrial gas cleaning systems
2013 1,655,180 3.8 187,175 183,617 40,592 40,590
3334133 Dust collection and other air purification equipment for cleaning incoming air 2014 1,567,502 5.2 406,621 359,050 669,677 665,372 3334133 Dust collection and other air purification equipment for cleaning incoming air 2013 1,606,601 1.1 451,700 414,402 592,493 596,014 333413W Industrial and commercial fans and blowers and air purification equipment,
nsk, total2014 471,067 22.8 N N N N
333413W Industrial and commercial fans and blowers and air purification equipment, nsk, total
2013 514,847 4.4 N N N N

Table
Page 139
NAICS-based Product Code Description Year
Value of Product
Shipments
Relative Standard Error
(%)
Total Export Value of Goods
Domestic Export Value
of Goods
General Import Value
of Goods
Consumption Import Value
of Goods
Manufacturing and International Trade Report: 2014 and 2013(1)In thousands of dollars. Values are based on manufacturing data from the 2014 Annual Survey of
Manufactures and administrative records from official U.S. import and export merchandise trade statistics. (1) Data for 2013 supersede the data that were previously published in the 2013 Manufacturing and International Trade Report.
333414 Heating equipment (except warm air furnaces) 2014 4,609,635 4.2 900,975 839,908 1,300,085 1,298,461333414 Heating equipment (except warm air furnaces) 2013 4,528,723 3.1 882,264 832,332 1,118,972 1,117,650 3334141 Cast iron heating boilers, radiators, and convectors (excluding electric,
automotive, and parts)2014 659,247 4.6 1,705 1,664 6,417 6,417
3334141 Cast iron heating boilers, radiators, and convectors (excluding electric, automotive, and parts)
2013 593,698 23.7 1,042 924 6,606 6,606
3334143 Domestic heating stoves (excluding electric and parts) 2014 835,483 11.1 12,933 12,592 776,987 775,874 3334143 Domestic heating stoves (excluding electric and parts) 2013 676,597 0.0 11,339 11,036 656,262 655,282 3334145 Steel heating boilers (15 psi or less), and all other hot water heating boilers
(excluding parts)2014 293,429 1.0 127,137 115,161 335,806 335,417
3334145 Steel heating boilers (15 psi or less), and all other hot water heating boilers (excluding parts)
2013 252,160 1.1 131,409 119,236 287,819 287,667
3334147 Floor and wall furnaces, unit heaters, gas-fired infrared heaters, and mechanical stokers (including parts)
2014 528,326 8.1 542,888 501,507 52,964 52,958
3334147 Floor and wall furnaces, unit heaters, gas-fired infrared heaters, and mechanical stokers (including parts)
2013 470,078 1.3 520,377 494,039 42,059 41,984
333414A Other heating equipment, excluding industrial types (including parts for nonelectric heating equipment and oil burners)
2014 1,752,320 6.7 216,310 208,985 127,911 127,795
333414A Other heating equipment, excluding industrial types (including parts for nonelectric heating equipment and oil burners)
2013 1,875,421 1.0 218,097 207,098 126,227 126,112
333414W Heating equipment (except warm air furnaces), nsk, total 2014 540,829 20.1 N N N N 333414W Heating equipment (except warm air furnaces), nsk, total 2013 660,769 0.8 N N N N

Table
Page 140
NAICS-based Product Code Description Year
Value of Product
Shipments
Relative Standard Error
(%)
Total Export Value of Goods
Domestic Export Value
of Goods
General Import Value
of Goods
Consumption Import Value
of Goods
Manufacturing and International Trade Report: 2014 and 2013(1)In thousands of dollars. Values are based on manufacturing data from the 2014 Annual Survey of
Manufactures and administrative records from official U.S. import and export merchandise trade statistics. (1) Data for 2013 supersede the data that were previously published in the 2013 Manufacturing and International Trade Report.
333415 Air-conditioning and warm air heating equipment and commercial and industrial refrigeration equipment
2014 29,795,543 1.2 5,564,321 5,019,130 9,664,421 9,603,026
333415 Air-conditioning and warm air heating equipment and commercial and industrial refrigeration equipment
2013 30,406,766 0.5 5,605,127 5,094,008 8,196,211 8,137,080
3334152 Heat transfer equipment (excluding electrically operated dehumidifiers), mechanically refrigerated, self-contained, excluding motor vehicle mechanical air-conditioning systems
2014 6,937,241 2.1 732,138 671,682 969,026 969,086
3334152 Heat transfer equipment (excluding electrically operated dehumidifiers), mechanically refrigerated, self-contained, excluding motor vehicle mechanical air-conditioning systems
2013 7,695,070 0.5 873,150 817,305 731,379 730,753
3334153 Commercial refrigerators and related equipment 2014 3,691,056 1.4 385,285 367,133 676,756 676,169 3334153 Commercial refrigerators and related equipment 2013 3,693,774 0.5 369,596 352,801 545,516 545,472 3334155 Refrigeration condensing units, all refrigerants, excluding ammonia 2014 778,476 8.7 41,394 39,068 47,951 47,951 3334155 Refrigeration condensing units, all refrigerants, excluding ammonia 2013 650,280 0.1 43,898 41,602 42,180 42,180 3334156 Room air conditioners and dehumidifiers, excluding portable dehumidifiers 2014 663,940 21.6 74,716 69,735 106,600 106,366 3334156 Room air conditioners and dehumidifiers, excluding portable dehumidifiers 2013 578,713 0.5 67,537 61,949 98,658 98,648 3334159 All other miscellaneous refrigeration and air-conditioning equipment 2014 1,037,152 2.4 482,823 466,989 83,048 82,708 3334159 All other miscellaneous refrigeration and air-conditioning equipment 2013 1,068,183 3.6 452,283 438,142 77,340 77,263 333415A Compressors and compressor units, all refrigerants, excluding automotive 2014 2,664,343 2.3 804,009 706,146 1,830,890 1,797,106 333415A Compressors and compressor units, all refrigerants, excluding automotive 2013 2,598,288 2.2 801,899 721,936 1,752,296 1,711,996

Table
Page 141
NAICS-based Product Code Description Year
Value of Product
Shipments
Relative Standard Error
(%)
Total Export Value of Goods
Domestic Export Value
of Goods
General Import Value
of Goods
Consumption Import Value
of Goods
Manufacturing and International Trade Report: 2014 and 2013(1)In thousands of dollars. Values are based on manufacturing data from the 2014 Annual Survey of
Manufactures and administrative records from official U.S. import and export merchandise trade statistics. (1) Data for 2013 supersede the data that were previously published in the 2013 Manufacturing and International Trade Report.
333415C Warm air furnaces, including duct furnaces and humidifiers, and electric comfort heating
2014 2,207,439 8.3 N N N N
333415C Warm air furnaces, including duct furnaces and humidifiers, and electric comfort heating
2013 2,067,342 0.1 N N N N
333415D Parts and accessories for air-conditioning and heat transfer equipment 2014 1,687,099 4.7 1,342,502 1,178,857 2,686,458 2,672,234 333415D Parts and accessories for air-conditioning and heat transfer equipment 2013 1,669,816 6.4 1,275,645 1,104,160 1,939,706 1,925,032 333415E Unitary air conditioners, excluding air source heat pumps 2014 6,546,306 1.5 922,230 780,038 2,551,313 2,539,875 333415E Unitary air conditioners, excluding air source heat pumps 2013 6,647,889 0.6 902,654 786,062 2,458,284 2,455,350 333415F Air-source heat pumps, excluding room air conditioners 2014 1,286,383 3.9 N N N N 333415F Air-source heat pumps, excluding room air conditioners 2013 1,655,519 0.1 N N N N 333415G Ground and ground water source heat pumps (single and split systems) 2014 220,982 5.7 N N N N 333415G Ground and ground water source heat pumps (single and split systems) 2013 238,447 0.5 N N N N 333415W Air-conditioning and warm air heating equipment and commercial and
industrial refrigeration equipment, nsk, total2014 2,075,127 8.7 N N N N
333415W Air-conditioning and warm air heating equipment and commercial and industrial refrigeration equipment, nsk, total
2013 1,843,444 0.1 N N N N
333415X Undistributed air-conditioning and warm air heating equipment and commercial and industrial refrigeration equipment
2014 N X 779,224 739,482 712,378 711,532
333415X Undistributed air-conditioning and warm air heating equipment and commercial and industrial refrigeration equipment
2013 N X 818,464 770,052 550,852 550,385
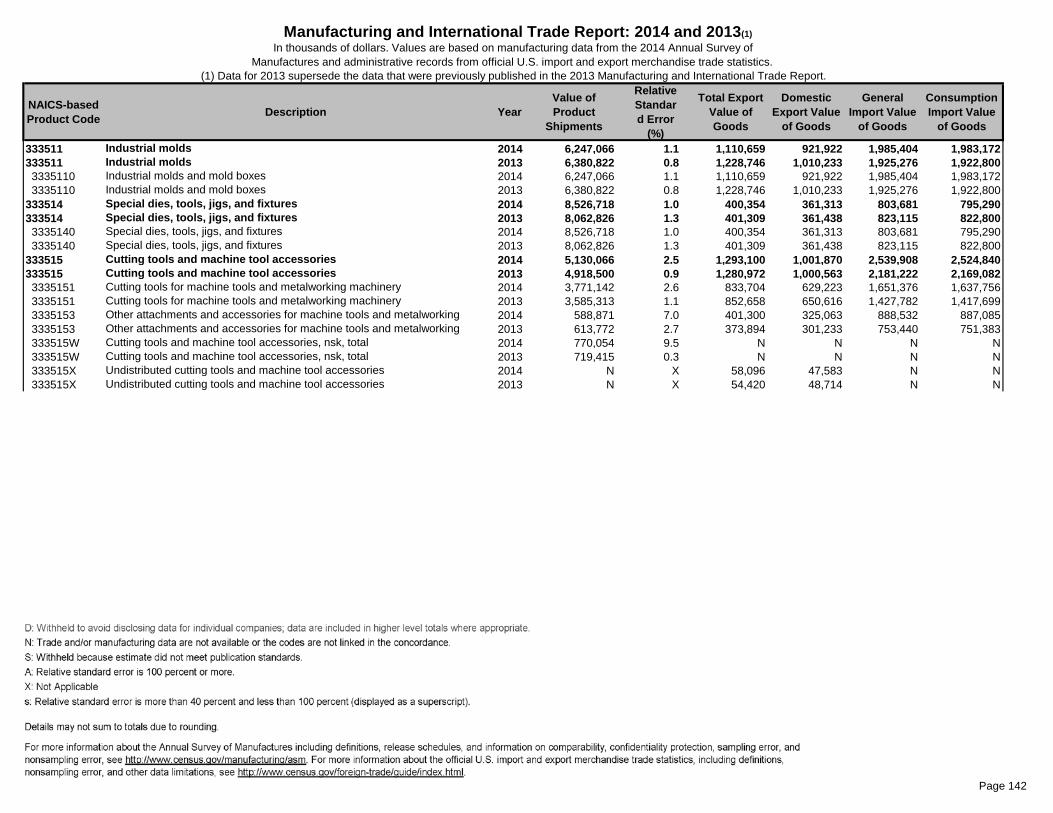
Table
Page 142
NAICS-based Product Code Description Year
Value of Product
Shipments
Relative Standard Error
(%)
Total Export Value of Goods
Domestic Export Value
of Goods
General Import Value
of Goods
Consumption Import Value
of Goods
Manufacturing and International Trade Report: 2014 and 2013(1)In thousands of dollars. Values are based on manufacturing data from the 2014 Annual Survey of
Manufactures and administrative records from official U.S. import and export merchandise trade statistics. (1) Data for 2013 supersede the data that were previously published in the 2013 Manufacturing and International Trade Report.
333511 Industrial molds 2014 6,247,066 1.1 1,110,659 921,922 1,985,404 1,983,172333511 Industrial molds 2013 6,380,822 0.8 1,228,746 1,010,233 1,925,276 1,922,800 3335110 Industrial molds and mold boxes 2014 6,247,066 1.1 1,110,659 921,922 1,985,404 1,983,172 3335110 Industrial molds and mold boxes 2013 6,380,822 0.8 1,228,746 1,010,233 1,925,276 1,922,800333514 Special dies, tools, jigs, and fixtures 2014 8,526,718 1.0 400,354 361,313 803,681 795,290333514 Special dies, tools, jigs, and fixtures 2013 8,062,826 1.3 401,309 361,438 823,115 822,800 3335140 Special dies, tools, jigs, and fixtures 2014 8,526,718 1.0 400,354 361,313 803,681 795,290 3335140 Special dies, tools, jigs, and fixtures 2013 8,062,826 1.3 401,309 361,438 823,115 822,800333515 Cutting tools and machine tool accessories 2014 5,130,066 2.5 1,293,100 1,001,870 2,539,908 2,524,840333515 Cutting tools and machine tool accessories 2013 4,918,500 0.9 1,280,972 1,000,563 2,181,222 2,169,082 3335151 Cutting tools for machine tools and metalworking machinery 2014 3,771,142 2.6 833,704 629,223 1,651,376 1,637,756 3335151 Cutting tools for machine tools and metalworking machinery 2013 3,585,313 1.1 852,658 650,616 1,427,782 1,417,699 3335153 Other attachments and accessories for machine tools and metalworking 2014 588,871 7.0 401,300 325,063 888,532 887,085 3335153 Other attachments and accessories for machine tools and metalworking 2013 613,772 2.7 373,894 301,233 753,440 751,383 333515W Cutting tools and machine tool accessories, nsk, total 2014 770,054 9.5 N N N N 333515W Cutting tools and machine tool accessories, nsk, total 2013 719,415 0.3 N N N N 333515X Undistributed cutting tools and machine tool accessories 2014 N X 58,096 47,583 N N 333515X Undistributed cutting tools and machine tool accessories 2013 N X 54,420 48,714 N N

Table
Page 143
NAICS-based Product Code Description Year
Value of Product
Shipments
Relative Standard Error
(%)
Total Export Value of Goods
Domestic Export Value
of Goods
General Import Value
of Goods
Consumption Import Value
of Goods
Manufacturing and International Trade Report: 2014 and 2013(1)In thousands of dollars. Values are based on manufacturing data from the 2014 Annual Survey of
Manufactures and administrative records from official U.S. import and export merchandise trade statistics. (1) Data for 2013 supersede the data that were previously published in the 2013 Manufacturing and International Trade Report.
333517 Machine tools 2014 7,229,322 1.2 4,376,841 3,613,339 7,356,782 7,342,337333517 Machine tools 2013 6,840,275 1.1 4,425,116 3,777,569 7,388,617 7,424,275 3335171 Metal gear cutting machines 2014 576,068 4.8 55,662 43,396 116,217 116,322 3335171 Metal gear cutting machines 2013 252,197 2.8 72,477 68,723 155,474 155,372 3335172 Metal grinding, polishing, buffing, honing, and lapping machines, excluding
gear-tooth grinding, lapping, polishing, and buffing machines2014 535,063 4.5 253,336 209,754 427,289 427,167
3335172 Metal grinding, polishing, buffing, honing, and lapping machines, excluding gear-tooth grinding, lapping, polishing, and buffing machines
2013 599,953 4.5 231,017 203,736 432,022 430,324
3335173 Metal lathes (turning machines) numerically and nonnumerically controlled 2014 537,051 2.9 270,706 148,353 1,162,234 1,168,482 3335173 Metal lathes (turning machines) numerically and nonnumerically controlled 2013 479,632 3.0 297,939 184,449 1,189,835 1,233,770 3335174 Metal milling machines (excluding machining centers) 2014 96,117 4.9 70,326 51,772 154,891 154,891 3335174 Metal milling machines (excluding machining centers) 2013 207,101 0.8 46,463 40,115 205,740 206,798 3335175 Machine tools for home workshops, laboratories, garages, etc. (metalworking
and primarily metalworking only)2014 120,547 7.7 487,573 417,728 586,831 579,984
3335175 Machine tools for home workshops, laboratories, garages, etc. (metalworking and primarily metalworking only)
2013 81,046 0.0 501,984 442,988 564,576 556,668
3335176 Rebuilt metal-cutting machine tools, remanufactured metal-cutting machine tools, and parts for metal-cutting-type machine tools (sold separately)
2014 584,896 3.1 714,048 598,052 728,190 727,615
3335176 Rebuilt metal-cutting machine tools, remanufactured metal-cutting machine tools, and parts for metal-cutting-type machine tools (sold separately)
2013 609,555 2.7 730,265 618,179 700,921 700,481
3335177 Metal machining centers (multifunction numerically controlled machines) 2014 1,376,847 2.6 743,567 548,940 1,322,111 1,314,789 3335177 Metal machining centers (multifunction numerically controlled machines) 2013 1,202,927 4.2 691,205 516,229 1,293,440 1,301,567

Table
Page 144
NAICS-based Product Code Description Year
Value of Product
Shipments
Relative Standard Error
(%)
Total Export Value of Goods
Domestic Export Value
of Goods
General Import Value
of Goods
Consumption Import Value
of Goods
Manufacturing and International Trade Report: 2014 and 2013(1)In thousands of dollars. Values are based on manufacturing data from the 2014 Annual Survey of
Manufactures and administrative records from official U.S. import and export merchandise trade statistics. (1) Data for 2013 supersede the data that were previously published in the 2013 Manufacturing and International Trade Report.
3335178 Metal-station-type machines 2014 108,708 3.3 20,264 19,057 8,113 8,113 3335178 Metal-station-type machines 2013 89,370 0.1 18,215 17,519 14,556 14,556 3335179 Other metal cutting machine tools (excluding those designed primarily for
home workshops, laboratories, garages, etc.)2014 873,748 3.3 29,466 27,678 585,044 584,452
3335179 Other metal cutting machine tools (excluding those designed primarily for home workshops, laboratories, garages, etc.)
2013 926,303 1.4 25,575 24,253 521,548 521,539
333517A Metal boring machines and drilling machines (excluding machining centers) 2014 184,673 1.9 202,032 177,968 276,262 276,283 333517A Metal boring machines and drilling machines (excluding machining centers) 2013 236,002 0.9 249,978 220,641 242,929 242,882 333517B Metal punching and shearing machines (including power and manual) and
bending and forming machines (power only)2014 589,629 4.8 413,615 347,442 591,081 591,070
333517B Metal punching and shearing machines (including power and manual) and bending and forming machines (power only)
2013 516,155 1.2 398,875 349,261 507,228 505,749
333517C Metalworking presses (excluding forging and die-stamping presses) 2014 254,858 11.2 44,770 35,602 247,263 246,760 333517C Metalworking presses (excluding forging and die-stamping presses) 2013 271,545 14.6 61,480 53,472 183,895 183,895 333517D Other metal forming machine tools, including forging and die-stamping
machines (excluding metalworking presses)2014 546,831 6.7 310,560 293,312 314,111 310,841
333517D Other metal forming machine tools, including forging and die-stamping machines (excluding metalworking presses)
2013 635,605 2.0 346,370 332,030 385,491 389,893
333517E Parts for metal forming machine tools (sold separately) and rebuilt and remanufactured metal forming machine tools
2014 352,745 3.8 608,908 556,425 654,886 653,309
333517E Parts for metal forming machine tools (sold separately) and rebuilt and remanufactured metal forming machine tools
2013 338,010 3.6 595,941 559,041 705,832 693,485
333517W Machine tools, nsk, total 2014 491,541 4.3 N N N N 333517W Machine tools, nsk, total 2013 394,874 0.1 N N N N 333517X Undistributed machine tools 2014 N X 152,007 137,862 182,258 182,257 333517X Undistributed machine tools 2013 N X 157,332 146,933 285,131 287,296
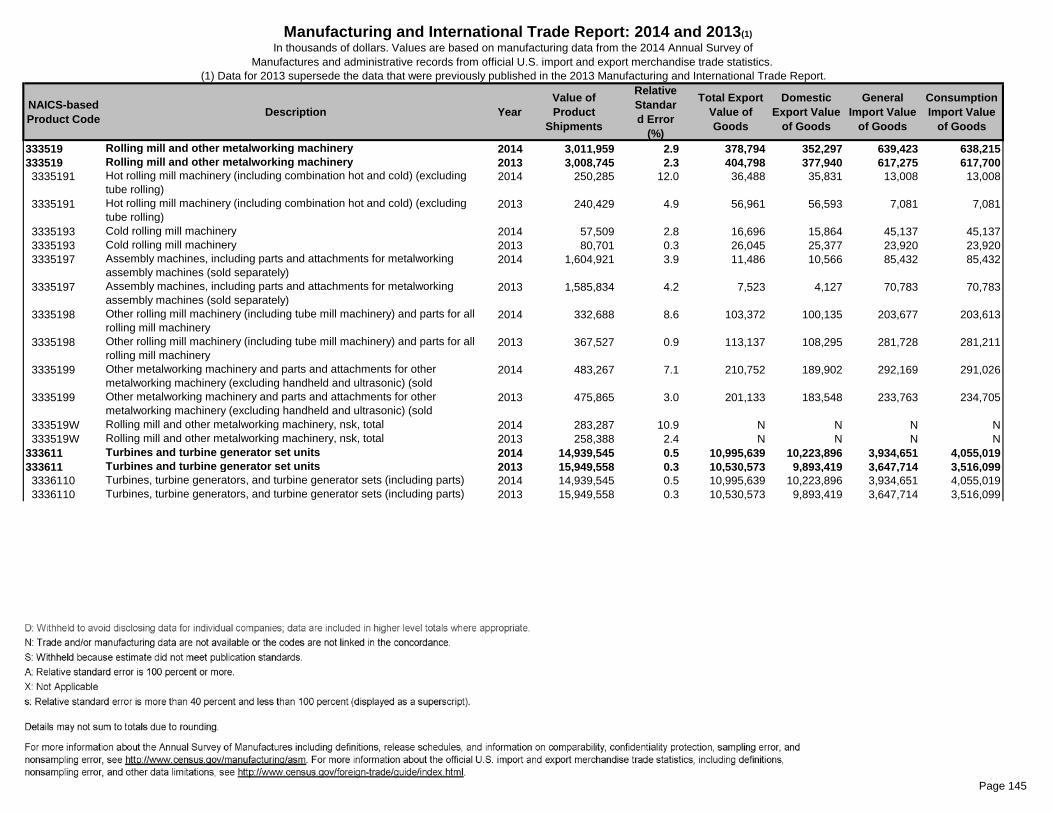
Table
Page 145
NAICS-based Product Code Description Year
Value of Product
Shipments
Relative Standard Error
(%)
Total Export Value of Goods
Domestic Export Value
of Goods
General Import Value
of Goods
Consumption Import Value
of Goods
Manufacturing and International Trade Report: 2014 and 2013(1)In thousands of dollars. Values are based on manufacturing data from the 2014 Annual Survey of
Manufactures and administrative records from official U.S. import and export merchandise trade statistics. (1) Data for 2013 supersede the data that were previously published in the 2013 Manufacturing and International Trade Report.
333519 Rolling mill and other metalworking machinery 2014 3,011,959 2.9 378,794 352,297 639,423 638,215333519 Rolling mill and other metalworking machinery 2013 3,008,745 2.3 404,798 377,940 617,275 617,700 3335191 Hot rolling mill machinery (including combination hot and cold) (excluding
tube rolling)2014 250,285 12.0 36,488 35,831 13,008 13,008
3335191 Hot rolling mill machinery (including combination hot and cold) (excluding tube rolling)
2013 240,429 4.9 56,961 56,593 7,081 7,081
3335193 Cold rolling mill machinery 2014 57,509 2.8 16,696 15,864 45,137 45,137 3335193 Cold rolling mill machinery 2013 80,701 0.3 26,045 25,377 23,920 23,920 3335197 Assembly machines, including parts and attachments for metalworking
assembly machines (sold separately)2014 1,604,921 3.9 11,486 10,566 85,432 85,432
3335197 Assembly machines, including parts and attachments for metalworking assembly machines (sold separately)
2013 1,585,834 4.2 7,523 4,127 70,783 70,783
3335198 Other rolling mill machinery (including tube mill machinery) and parts for all rolling mill machinery
2014 332,688 8.6 103,372 100,135 203,677 203,613
3335198 Other rolling mill machinery (including tube mill machinery) and parts for all rolling mill machinery
2013 367,527 0.9 113,137 108,295 281,728 281,211
3335199 Other metalworking machinery and parts and attachments for other metalworking machinery (excluding handheld and ultrasonic) (sold
2014 483,267 7.1 210,752 189,902 292,169 291,026
3335199 Other metalworking machinery and parts and attachments for other metalworking machinery (excluding handheld and ultrasonic) (sold
2013 475,865 3.0 201,133 183,548 233,763 234,705
333519W Rolling mill and other metalworking machinery, nsk, total 2014 283,287 10.9 N N N N 333519W Rolling mill and other metalworking machinery, nsk, total 2013 258,388 2.4 N N N N333611 Turbines and turbine generator set units 2014 14,939,545 0.5 10,995,639 10,223,896 3,934,651 4,055,019333611 Turbines and turbine generator set units 2013 15,949,558 0.3 10,530,573 9,893,419 3,647,714 3,516,099 3336110 Turbines, turbine generators, and turbine generator sets (including parts) 2014 14,939,545 0.5 10,995,639 10,223,896 3,934,651 4,055,019 3336110 Turbines, turbine generators, and turbine generator sets (including parts) 2013 15,949,558 0.3 10,530,573 9,893,419 3,647,714 3,516,099

Table
Page 146
NAICS-based Product Code Description Year
Value of Product
Shipments
Relative Standard Error
(%)
Total Export Value of Goods
Domestic Export Value
of Goods
General Import Value
of Goods
Consumption Import Value
of Goods
Manufacturing and International Trade Report: 2014 and 2013(1)In thousands of dollars. Values are based on manufacturing data from the 2014 Annual Survey of
Manufactures and administrative records from official U.S. import and export merchandise trade statistics. (1) Data for 2013 supersede the data that were previously published in the 2013 Manufacturing and International Trade Report.
333612 Speed changers, industrial high-speed drives, and gears 2014 3,621,813 3.3 2,379,991 2,109,632 3,923,425 3,695,977333612 Speed changers, industrial high-speed drives, and gears 2013 3,594,752 0.5 1,749,673 1,489,033 3,541,024 3,384,672 3336123 Gears 2014 1,515,366 2.8 954,873 827,656 1,890,627 1,810,018 3336123 Gears 2013 1,301,847 1.4 902,324 783,842 1,756,949 1,691,597 3336127 Speed changers and industrial high-speed drives 2014 1,861,676 6.1 1,425,118 1,281,976 2,032,798 1,885,959 3336127 Speed changers and industrial high-speed drives 2013 2,052,691 0.3 847,349 705,191 1,784,074 1,693,075 333612W Speed changers, industrial high-speed drives, and gears, nsk, total 2014 244,771 0.3 N N N N 333612W Speed changers, industrial high-speed drives, and gears, nsk, total 2013 240,215 0.0 N N N N333613 Mechanical power transmission equipment 2014 4,035,161 1.7 2,593,835 2,304,303 2,265,555 2,082,641333613 Mechanical power transmission equipment 2013 4,066,326 0.7 1,761,338 1,506,591 2,090,508 1,931,932 3336131 Plain bearings and bushings (excluding engines) 2014 1,256,058 4.5 N N N N 3336131 Plain bearings and bushings (excluding engines) 2013 1,177,758 1.2 N N N N 3336133 Mechanical power transmission equipment and parts, excluding speed
changers, drives, gears, and bearings2014 2,736,836 1.5 1,438,541 1,226,907 1,751,745 1,596,441
3336133 Mechanical power transmission equipment and parts, excluding speed changers, drives, gears, and bearings
2013 2,849,591 0.9 1,351,750 1,164,565 1,601,727 1,468,633
333613W Mechanical power transmission equipment, nsk, total 2014 42,267 1.8 N N N N 333613W Mechanical power transmission equipment, nsk, total 2013 38,978 0.0 N N N N 333613X Undistributed mechanical power transmission equipment 2014 N X 1,155,294 1,077,395 513,811 486,199 333613X Undistributed mechanical power transmission equipment 2013 N X 409,588 342,026 488,781 463,300
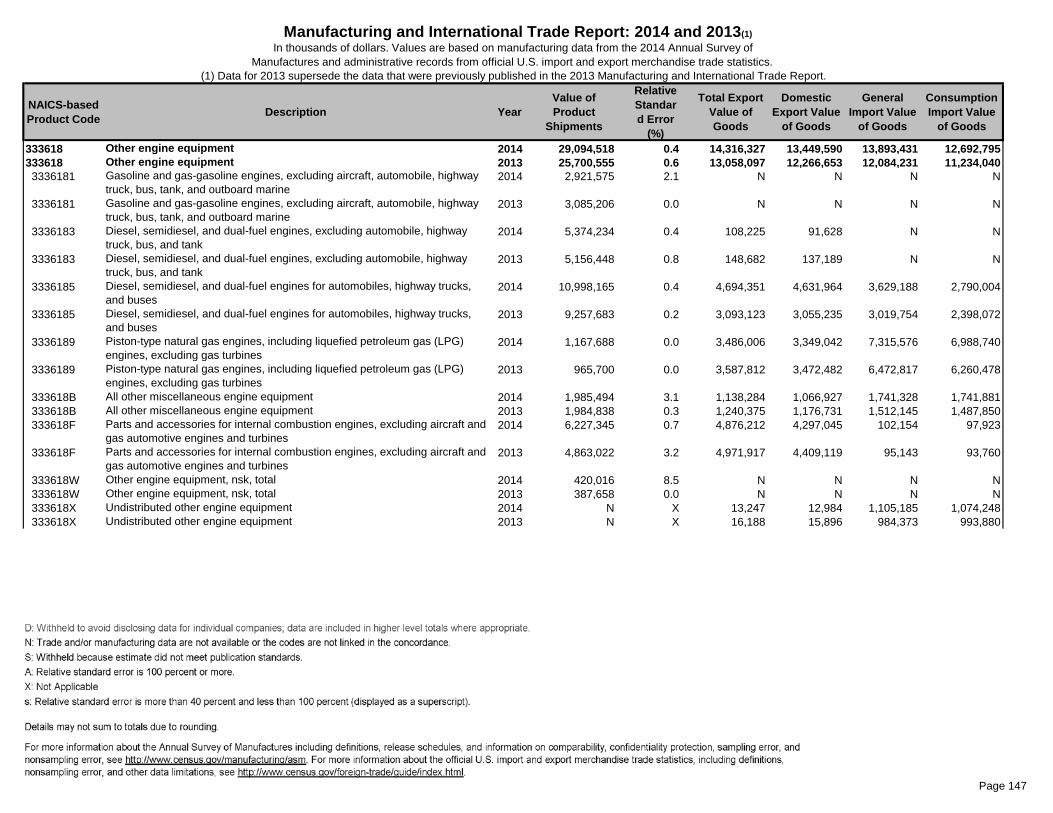
Table
Page 147
NAICS-based Product Code Description Year
Value of Product
Shipments
Relative Standard Error
(%)
Total Export Value of Goods
Domestic Export Value
of Goods
General Import Value
of Goods
Consumption Import Value
of Goods
Manufacturing and International Trade Report: 2014 and 2013(1)In thousands of dollars. Values are based on manufacturing data from the 2014 Annual Survey of
Manufactures and administrative records from official U.S. import and export merchandise trade statistics. (1) Data for 2013 supersede the data that were previously published in the 2013 Manufacturing and International Trade Report.
333618 Other engine equipment 2014 29,094,518 0.4 14,316,327 13,449,590 13,893,431 12,692,795333618 Other engine equipment 2013 25,700,555 0.6 13,058,097 12,266,653 12,084,231 11,234,040 3336181 Gasoline and gas-gasoline engines, excluding aircraft, automobile, highway
truck, bus, tank, and outboard marine2014 2,921,575 2.1 N N N N
3336181 Gasoline and gas-gasoline engines, excluding aircraft, automobile, highway truck, bus, tank, and outboard marine
2013 3,085,206 0.0 N N N N
3336183 Diesel, semidiesel, and dual-fuel engines, excluding automobile, highway truck, bus, and tank
2014 5,374,234 0.4 108,225 91,628 N N
3336183 Diesel, semidiesel, and dual-fuel engines, excluding automobile, highway truck, bus, and tank
2013 5,156,448 0.8 148,682 137,189 N N
3336185 Diesel, semidiesel, and dual-fuel engines for automobiles, highway trucks, and buses
2014 10,998,165 0.4 4,694,351 4,631,964 3,629,188 2,790,004
3336185 Diesel, semidiesel, and dual-fuel engines for automobiles, highway trucks, and buses
2013 9,257,683 0.2 3,093,123 3,055,235 3,019,754 2,398,072
3336189 Piston-type natural gas engines, including liquefied petroleum gas (LPG) engines, excluding gas turbines
2014 1,167,688 0.0 3,486,006 3,349,042 7,315,576 6,988,740
3336189 Piston-type natural gas engines, including liquefied petroleum gas (LPG) engines, excluding gas turbines
2013 965,700 0.0 3,587,812 3,472,482 6,472,817 6,260,478
333618B All other miscellaneous engine equipment 2014 1,985,494 3.1 1,138,284 1,066,927 1,741,328 1,741,881 333618B All other miscellaneous engine equipment 2013 1,984,838 0.3 1,240,375 1,176,731 1,512,145 1,487,850 333618F Parts and accessories for internal combustion engines, excluding aircraft and
gas automotive engines and turbines2014 6,227,345 0.7 4,876,212 4,297,045 102,154 97,923
333618F Parts and accessories for internal combustion engines, excluding aircraft and gas automotive engines and turbines
2013 4,863,022 3.2 4,971,917 4,409,119 95,143 93,760
333618W Other engine equipment, nsk, total 2014 420,016 8.5 N N N N 333618W Other engine equipment, nsk, total 2013 387,658 0.0 N N N N 333618X Undistributed other engine equipment 2014 N X 13,247 12,984 1,105,185 1,074,248 333618X Undistributed other engine equipment 2013 N X 16,188 15,896 984,373 993,880

Table
Page 148
NAICS-based Product Code Description Year
Value of Product
Shipments
Relative Standard Error
(%)
Total Export Value of Goods
Domestic Export Value
of Goods
General Import Value
of Goods
Consumption Import Value
of Goods
Manufacturing and International Trade Report: 2014 and 2013(1)In thousands of dollars. Values are based on manufacturing data from the 2014 Annual Survey of
Manufactures and administrative records from official U.S. import and export merchandise trade statistics. (1) Data for 2013 supersede the data that were previously published in the 2013 Manufacturing and International Trade Report.
333911 Pump and pumping equipment 2014 15,657,980 1.8 5,936,134 5,351,262 5,300,214 5,205,760333911 Pump and pumping equipment 2013 14,648,986 1.1 5,776,249 5,298,468 4,476,759 4,406,806 3339112 Domestic water systems (pumps for farm and home use), excluding irrigation
pumps2014 1,725,566 6.0 8,659 8,438 8,066 8,066
3339112 Domestic water systems (pumps for farm and home use), excluding irrigation pumps
2013 1,524,586 0.7 7,472 7,232 6,868 6,894
3339113 Domestic sump pumps (1 hp or less), including value of drivers 2014 182,790 0.1 N N N N 3339113 Domestic sump pumps (1 hp or less), including value of drivers 2013 195,159 1.8 N N N N 3339114 Oil-well and oil-field pumps, including value of drivers (excluding boiler feed) 2014 2,867,819 1.8 983,923 935,638 698,312 698,307 3339114 Oil-well and oil-field pumps, including value of drivers (excluding boiler feed) 2013 2,177,951 3.1 998,395 977,610 516,177 516,177 3339116 Industrial pumps, including value of drivers (excluding hydraulic fluid power
pumps, automotive circulating pumps, and measuring and dispensing 2014 5,767,615 2.6 2,803,834 2,493,701 2,179,682 2,165,634
3339116 Industrial pumps, including value of drivers (excluding hydraulic fluid power pumps, automotive circulating pumps, and measuring and dispensing
2013 5,275,342 1.0 2,682,403 2,428,119 1,829,987 1,792,965
3339117 Other pumps 2014 1,747,403 7.3 N N N N 3339117 Other pumps 2013 1,753,615 1.6 N N N N 3339118 Parts and attachments for pumps and pumping equipment, excluding
hydraulic fluid power, and air and gas compressors (including locomotive and packaged pumps)
2014 2,286,312 2.5 1,632,311 1,461,888 2,000,996 1,943,539
3339118 Parts and attachments for pumps and pumping equipment, excluding hydraulic fluid power, and air and gas compressors (including locomotive and packaged pumps)
2013 2,465,328 5.2 1,629,204 1,473,862 1,722,173 1,693,324
333911W Pump and pumping equipment, nsk, total 2014 1,080,475 14.6 N N N N 333911W Pump and pumping equipment, nsk, total 2013 1,257,004 1.3 N N N N 333911X Undistributed pump and pumping equipment 2014 N X 507,407 451,597 413,157 390,214 333911X Undistributed pump and pumping equipment 2013 N X 458,774 411,644 401,554 397,445

Table
Page 149
NAICS-based Product Code Description Year
Value of Product
Shipments
Relative Standard Error
(%)
Total Export Value of Goods
Domestic Export Value
of Goods
General Import Value
of Goods
Consumption Import Value
of Goods
Manufacturing and International Trade Report: 2014 and 2013(1)In thousands of dollars. Values are based on manufacturing data from the 2014 Annual Survey of
Manufactures and administrative records from official U.S. import and export merchandise trade statistics. (1) Data for 2013 supersede the data that were previously published in the 2013 Manufacturing and International Trade Report.
333912 Air and gas compressors 2014 10,766,875 2.1 6,835,488 6,211,516 5,678,967 5,569,197333912 Air and gas compressors 2013 10,095,079 1.2 6,736,905 6,157,814 5,136,150 5,032,217 3339121 Air and gas compressors and vacuum pumps, including value of drivers 2014 7,396,310 2.5 3,833,551 3,471,780 2,831,580 2,759,184 3339121 Air and gas compressors and vacuum pumps, including value of drivers 2013 6,731,651 1.8 3,757,260 3,422,142 2,562,731 2,491,741 3339125 Parts and attachments for air and gas compressors and vacuum pumps
(excluding refrigeration, ice making, and air-conditioning equipment)2014 1,439,697 7.9 1,215,544 1,096,643 1,008,535 1,001,738
3339125 Parts and attachments for air and gas compressors and vacuum pumps (excluding refrigeration, ice making, and air-conditioning equipment)
2013 1,334,760 2.7 1,232,237 1,132,085 842,932 839,330
3339127 Industrial spraying equipment and parts and attachments for industrial spraying equipment, sold separately
2014 1,427,119 2.0 1,786,393 1,643,093 1,838,852 1,808,274
3339127 Industrial spraying equipment and parts and attachments for industrial spraying equipment, sold separately
2013 1,553,413 0.7 1,747,409 1,603,587 1,730,488 1,701,146
333912W Air and gas compressors, nsk, total 2014 503,749 12.8 N N N N 333912W Air and gas compressors, nsk, total 2013 475,254 0.0 N N N N333913 Measuring and dispensing pumps 2014 1,350,879 2.0 435,156 414,408 132,527 132,128333913 Measuring and dispensing pumps 2013 1,485,452 0.7 422,622 393,921 133,190 132,295 3339130 Measuring and dispensing pumps and parts and attachments 2014 1,350,879 2.0 435,156 414,408 132,527 132,128 3339130 Measuring and dispensing pumps and parts and attachments 2013 1,485,452 0.7 422,622 393,921 133,190 132,295333921 Elevators and moving stairways 2014 2,113,923 3.9 439,342 415,270 493,724 492,527333921 Elevators and moving stairways 2013 1,705,450 1.5 424,547 396,623 484,312 484,032 3339211 Elevators and moving stairways 2014 1,676,873 4.2 312,283 302,271 221,689 221,232 3339211 Elevators and moving stairways 2013 1,245,752 1.4 302,217 289,567 187,287 187,010 3339213 Parts and attachments for elevators and moving stairways (sold separately) 2014 379,029 11.2 127,059 112,999 272,035 271,295 3339213 Parts and attachments for elevators and moving stairways (sold separately) 2013 416,097 4.5 122,331 107,056 297,026 297,022 333921W Elevators and moving stairways, nsk, total 2014 58,021 2.2 N N N N 333921W Elevators and moving stairways, nsk, total 2013 43,600 0.0 N N N N

Table
Page 150
NAICS-based Product Code Description Year
Value of Product
Shipments
Relative Standard Error
(%)
Total Export Value of Goods
Domestic Export Value
of Goods
General Import Value
of Goods
Consumption Import Value
of Goods
Manufacturing and International Trade Report: 2014 and 2013(1)In thousands of dollars. Values are based on manufacturing data from the 2014 Annual Survey of
Manufactures and administrative records from official U.S. import and export merchandise trade statistics. (1) Data for 2013 supersede the data that were previously published in the 2013 Manufacturing and International Trade Report.
333922 Conveyors and conveying equipment 2014 8,185,435 1.9 1,265,765 1,186,966 1,577,845 1,577,461333922 Conveyors and conveying equipment 2013 7,854,742 0.8 1,222,081 1,172,117 1,502,393 1,507,434 3339221 Unit handling conveyors and conveying systems (excluding hoists and farm
elevators)2014 3,785,941 3.2 684,297 642,091 725,592 725,328
3339221 Unit handling conveyors and conveying systems (excluding hoists and farm elevators)
2013 3,614,705 1.2 599,780 581,076 660,551 659,840
3339223 Parts, attachments, and accessories for unit handling conveyors and conveying systems (sold separately)
2014 936,283 5.1 N N N N
3339223 Parts, attachments, and accessories for unit handling conveyors and conveying systems (sold separately)
2013 780,067 1.0 N N N N
3339228 Bulk material handling conveyors and conveying systems 2014 2,130,324 3.5 220,062 206,827 291,769 291,726 3339228 Bulk material handling conveyors and conveying systems 2013 2,199,403 2.2 241,479 227,931 234,903 240,385 3339229 Parts, attachments, and accessories for bulk material handling conveyors
and conveying systems (sold separately)2014 821,558 5.0 361,407 338,047 560,484 560,407
3339229 Parts, attachments, and accessories for bulk material handling conveyors and conveying systems (sold separately)
2013 976,908 0.4 380,823 363,110 606,939 607,210
333922W Conveyors and conveying equipment, nsk, total 2014 511,329 3.7 N N N N 333922W Conveyors and conveying equipment, nsk, total 2013 283,658 0.1 N N N N333923 Overhead traveling cranes, hoists, and monorail systems 2014 7,344,828 1.6 1,365,188 1,246,427 852,273 850,074333923 Overhead traveling cranes, hoists, and monorail systems 2013 7,331,606 1.0 1,356,325 1,246,816 771,545 771,189 3339231 Hoists and parts and attachments for hoists (sold separately) 2014 775,162 4.5 242,602 173,529 335,795 335,070 3339231 Hoists and parts and attachments for hoists (sold separately) 2013 965,148 1.2 244,789 177,564 296,372 296,111 3339233 Overhead traveling cranes and monorail systems (excluding construction
power cranes), and parts and attachments for monorail systems (sold 2014 1,214,778 8.4 103,936 96,769 194,656 194,453
3339233 Overhead traveling cranes and monorail systems (excluding construction power cranes), and parts and attachments for monorail systems (sold
2013 1,220,159 4.3 146,366 132,015 176,321 176,226
3339237 Winches, aerial work platforms, automotive wrecker hoists, and parts 2014 5,186,025 0.8 1,018,651 976,129 321,821 320,550 3339237 Winches, aerial work platforms, automotive wrecker hoists, and parts 2013 5,011,381 0.9 965,171 937,237 298,852 298,852 333923W Overhead traveling cranes, hoists, and monorail systems, nsk, total 2014 168,863 0.6 N N N N 333923W Overhead traveling cranes, hoists, and monorail systems, nsk, total 2013 134,917 0.0 N N N N

Table
Page 151
NAICS-based Product Code Description Year
Value of Product
Shipments
Relative Standard Error
(%)
Total Export Value of Goods
Domestic Export Value
of Goods
General Import Value
of Goods
Consumption Import Value
of Goods
Manufacturing and International Trade Report: 2014 and 2013(1)In thousands of dollars. Values are based on manufacturing data from the 2014 Annual Survey of
Manufactures and administrative records from official U.S. import and export merchandise trade statistics. (1) Data for 2013 supersede the data that were previously published in the 2013 Manufacturing and International Trade Report.
333924 Industrial trucks, tractors, trailers, and stacker machinery 2014 9,087,975 0.5 3,133,115 2,886,475 3,970,693 4,136,460333924 Industrial trucks, tractors, trailers, and stacker machinery 2013 9,084,453 0.3 3,325,089 3,047,070 3,832,440 3,946,673 3339242 Industrial trucks, tractors, mobile straddle carriers and cranes, and automatic
stacking machines (excluding parts and attachments) (sold separately)2014 7,078,028 0.6 2,513,734 2,317,395 2,599,720 2,887,173
3339242 Industrial trucks, tractors, mobile straddle carriers and cranes, and automatic stacking machines (excluding parts and attachments) (sold separately)
2013 7,095,814 0.3 2,761,006 2,527,913 2,555,408 2,764,077
3339243 Parts and attachments for industrial trucks and tractors (sold separately) 2014 1,907,363 1.2 619,381 569,080 1,370,972 1,249,287 3339243 Parts and attachments for industrial trucks and tractors (sold separately) 2013 1,859,366 0.9 564,083 519,157 1,277,032 1,182,596 333924W Industrial trucks, tractors, trailers, and stacker machinery, nsk, total 2014 102,584 7.8 N N N N 333924W Industrial trucks, tractors, trailers, and stacker machinery, nsk, total 2013 129,273 0.0 N N N N333991 Power-driven handtools 2014 3,120,025 1.7 1,398,348 1,005,407 4,053,069 4,256,090333991 Power-driven handtools 2013 3,464,260 2.3 1,396,519 1,009,172 4,040,898 4,206,934 3339911 Power-driven handtools, pneumatic, hydraulic, and power-actuated 2014 831,934 2.5 622,309 467,507 1,470,195 1,437,811 3339911 Power-driven handtools, pneumatic, hydraulic, and power-actuated 2013 778,324 10.1 635,902 476,361 1,478,169 1,438,617 3339913 Power-driven handtools, internal combustion engine driven (including parts) 2014 1,207,855 1.3 N N N N 3339913 Power-driven handtools, internal combustion engine driven (including parts) 2013 1,175,098 0.0 N N N N 3339917 Power-driven handtools, battery-powered (cordless), including parts 2014 441,056 5.9 286,293 264,672 287,409 493,128 3339917 Power-driven handtools, battery-powered (cordless), including parts 2013 550,126 2.6 277,058 256,962 265,675 460,943 3339919 Power-driven handtools, electric (excluding battery-powered), including parts 2014 520,446 7.3 232,435 101,603 2,146,388 2,176,116 3339919 Power-driven handtools, electric (excluding battery-powered), including parts 2013 859,131 0.4 215,256 96,363 2,154,380 2,165,030 333991W Power-driven handtools, nsk, total 2014 118,734 8.6 N N N N 333991W Power-driven handtools, nsk, total 2013 101,581 0.0 N N N N 333991X Undistributed power-driven handtools 2014 N X 257,312 171,625 149,077 149,035 333991X Undistributed power-driven handtools 2013 N X 268,304 179,486 142,674 142,344

Table
Page 152
NAICS-based Product Code Description Year
Value of Product
Shipments
Relative Standard Error
(%)
Total Export Value of Goods
Domestic Export Value
of Goods
General Import Value
of Goods
Consumption Import Value
of Goods
Manufacturing and International Trade Report: 2014 and 2013(1)In thousands of dollars. Values are based on manufacturing data from the 2014 Annual Survey of
Manufactures and administrative records from official U.S. import and export merchandise trade statistics. (1) Data for 2013 supersede the data that were previously published in the 2013 Manufacturing and International Trade Report.
333992 Welding and soldering equipment 2014 5,251,378 2.5 1,609,068 1,367,426 1,296,703 1,267,389333992 Welding and soldering equipment 2013 5,296,077 0.6 1,535,629 1,399,811 1,422,914 1,421,422 3339921 Arc welding machines, components, and accessories, excluding electrodes
and stud welding equipment2014 1,910,879 2.9 237,397 225,408 130,713 130,184
3339921 Arc welding machines, components, and accessories, excluding electrodes and stud welding equipment
2013 1,849,305 1.2 244,845 231,110 129,428 128,980
3339923 Arc welding metal electrodes 2014 1,315,374 4.7 288,249 272,376 117,201 117,232 3339923 Arc welding metal electrodes 2013 1,432,482 0.4 293,044 284,240 113,473 113,445 3339927 Resistance welders, components, accessories, and electrodes 2014 792,112 1.2 66,456 60,302 49,014 48,800 3339927 Resistance welders, components, accessories, and electrodes 2013 717,199 1.6 66,826 63,225 46,742 44,717 3339929 Gas welding and cutting equipment, parts, attachments, and accessories 2014 405,742 15.2 146,856 128,276 74,385 74,385 3339929 Gas welding and cutting equipment, parts, attachments, and accessories 2013 516,724 4.1 188,180 169,394 73,096 73,096 333992A Other welding equipment, components, and accessories (excluding arc,
resistance, and gas welding equipment)2014 504,043 6.9 437,394 310,588 485,432 478,177
333992A Other welding equipment, components, and accessories (excluding arc, resistance, and gas welding equipment)
2013 491,664 0.7 279,856 237,552 551,520 584,752
333992W Welding and soldering equipment, nsk, total 2014 323,228 21.0 N N N N 333992W Welding and soldering equipment, nsk, total 2013 288,703 0.6 N N N N 333992X Undistributed welding and soldering equipment 2014 N X 432,716 370,476 439,958 418,610 333992X Undistributed welding and soldering equipment 2013 N X 462,878 414,291 508,655 476,431333993 Packaging machinery 2014 5,196,021 1.6 1,082,397 933,379 2,624,703 2,621,382333993 Packaging machinery 2013 5,176,268 0.7 1,044,330 913,342 2,471,425 2,469,234 3339931 Packing, packaging, and bottling machinery, excluding parts 2014 3,292,568 2.2 802,458 699,052 1,972,870 1,969,549 3339931 Packing, packaging, and bottling machinery, excluding parts 2013 3,357,227 1.0 776,130 690,463 1,890,502 1,888,391 3339935 Parts for packing, packaging, and bottling machinery 2014 1,560,933 2.8 279,939 234,327 651,834 651,833 3339935 Parts for packing, packaging, and bottling machinery 2013 1,557,286 0.6 268,200 222,880 580,923 580,843 333993W Packaging machinery, nsk, total 2014 342,520 4.0 N N N N 333993W Packaging machinery, nsk, total 2013 261,755 0.3 N N N N

Table
Page 153
NAICS-based Product Code Description Year
Value of Product
Shipments
Relative Standard Error
(%)
Total Export Value of Goods
Domestic Export Value
of Goods
General Import Value
of Goods
Consumption Import Value
of Goods
Manufacturing and International Trade Report: 2014 and 2013(1)In thousands of dollars. Values are based on manufacturing data from the 2014 Annual Survey of
Manufactures and administrative records from official U.S. import and export merchandise trade statistics. (1) Data for 2013 supersede the data that were previously published in the 2013 Manufacturing and International Trade Report.
333994 Industrial process furnaces and ovens 2014 2,633,798 2.0 946,628 906,849 709,385 708,383333994 Industrial process furnaces and ovens 2013 2,515,390 1.8 936,818 895,012 691,819 712,116 3339940 Industrial furnaces and ovens (excluding cremating ovens), and electric
industrial heating equipment2014 2,633,798 2.0 946,628 906,849 709,385 708,383
3339940 Industrial furnaces and ovens (excluding cremating ovens), and electric industrial heating equipment
2013 2,515,390 1.8 936,818 895,012 691,819 712,116
333995 Fluid power cylinders and actuators 2014 6,684,091 1.1 1,080,176 919,701 1,805,424 1,757,228333995 Fluid power cylinders and actuators 2013 6,744,974 0.8 1,042,538 888,386 1,645,096 1,598,583 3339951 Nonaerospace-type hydraulic fluid power cylinders and actuators, linear and 2014 2,334,647 2.0 690,389 603,191 1,136,327 1,106,284 3339951 Nonaerospace-type hydraulic fluid power cylinders and actuators, linear and 2013 2,328,464 1.6 654,922 567,792 1,054,520 1,029,338 3339953 Nonaerospace-type pneumatic fluid power cylinders and actuators, linear
and rotary2014 793,510 3.7 N N 117,979 116,816
3339953 Nonaerospace-type pneumatic fluid power cylinders and actuators, linear and rotary
2013 908,576 0.5 N N 110,994 106,626
3339955 Parts for aerospace- and nonaerospace-type hydraulic and pneumatic fluid power cylinders and actuators, including accumulators, cushions, etc.
2014 857,056 4.3 246,661 207,563 274,068 258,872
3339955 Parts for aerospace- and nonaerospace-type hydraulic and pneumatic fluid power cylinders and actuators, including accumulators, cushions, etc.
2013 844,206 2.5 248,292 218,591 267,125 250,099
3339957 Aerospace-type fluid power cylinders and actuators, hydraulic and pneumatic 2014 2,526,371 0.8 143,126 108,947 277,050 275,256 3339957 Aerospace-type fluid power cylinders and actuators, hydraulic and pneumatic 2013 2,460,130 1.2 139,324 102,004 212,456 212,520 333995W Fluid power cylinders and actuators, nsk, total 2014 172,507 10.9 N N N N 333995W Fluid power cylinders and actuators, nsk, total 2013 203,597 0.0 N N N N

Table
Page 154
NAICS-based Product Code Description Year
Value of Product
Shipments
Relative Standard Error
(%)
Total Export Value of Goods
Domestic Export Value
of Goods
General Import Value
of Goods
Consumption Import Value
of Goods
Manufacturing and International Trade Report: 2014 and 2013(1)In thousands of dollars. Values are based on manufacturing data from the 2014 Annual Survey of
Manufactures and administrative records from official U.S. import and export merchandise trade statistics. (1) Data for 2013 supersede the data that were previously published in the 2013 Manufacturing and International Trade Report.
333996 Fluid power pumps and motors 2014 3,575,763 0.5 2,719,103 2,358,748 3,986,636 3,903,783333996 Fluid power pumps and motors 2013 3,644,075 0.3 2,562,279 2,224,135 3,662,843 3,603,581 3339961 Nonaerospace-type reciprocating fluid power pumps 2014 1,224,391 0.9 55,593 51,373 40,716 39,549 3339961 Nonaerospace-type reciprocating fluid power pumps 2013 1,255,482 0.7 55,054 49,837 46,718 43,578 3339963 Nonaerospace-type rotary and other fluid power pumps 2014 571,224 1.8 1,196,149 1,045,028 1,839,939 1,786,434 3339963 Nonaerospace-type rotary and other fluid power pumps 2013 657,341 0.1 1,148,894 999,515 1,799,692 1,762,658 3339965 Nonaerospace-type fluid power motors 2014 639,684 0.4 712,709 603,557 809,777 796,683 3339965 Nonaerospace-type fluid power motors 2013 682,652 0.3 660,948 570,696 776,674 762,464 3339967 Aerospace-type fluid power pumps and motors 2014 480,290 0.4 N N N N 3339967 Aerospace-type fluid power pumps and motors 2013 446,138 1.4 N N N N 3339969 Parts for fluid power pumps, motors, and hydrostatic transmissions 2014 525,018 0.1 754,653 658,790 1,296,204 1,281,117 3339969 Parts for fluid power pumps, motors, and hydrostatic transmissions 2013 494,474 0.1 697,382 604,087 1,039,759 1,034,881 333996W Fluid power pumps and motors, nsk, total 2014 135,156 5.4 N N N N 333996W Fluid power pumps and motors, nsk, total 2013 107,987 0.0 N N N N333997 Scales and balances 2014 743,563 3.4 379,432 239,433 747,365 739,515333997 Scales and balances 2013 694,315 4.3 327,267 221,879 774,136 762,710 3339972 Vehicle and industrial scales 2014 383,662 3.7 73,316 61,663 302,926 298,906 3339972 Vehicle and industrial scales 2013 339,335 6.9 74,232 61,958 328,224 328,090 3339974 Retail, commercial, household, mailing scales and balances 2014 117,519 7.9 193,665 87,054 288,319 286,795 3339974 Retail, commercial, household, mailing scales and balances 2013 158,061 0.4 156,953 87,297 287,191 285,342 3339976 Parts, attachments, and accessories for scales and balances 2014 226,959 8.0 112,451 90,717 156,120 153,814 3339976 Parts, attachments, and accessories for scales and balances 2013 178,943 10.1 96,082 72,625 158,721 149,278 333997W Scales and balances, nsk, total 2014 15,423 0.0 N N N N 333997W Scales and balances, nsk, total 2013 17,976 0.0 N N N N

Table
Page 155
NAICS-based Product Code Description Year
Value of Product
Shipments
Relative Standard Error
(%)
Total Export Value of Goods
Domestic Export Value
of Goods
General Import Value
of Goods
Consumption Import Value
of Goods
Manufacturing and International Trade Report: 2014 and 2013(1)In thousands of dollars. Values are based on manufacturing data from the 2014 Annual Survey of
Manufactures and administrative records from official U.S. import and export merchandise trade statistics. (1) Data for 2013 supersede the data that were previously published in the 2013 Manufacturing and International Trade Report.
333999 All other miscellaneous general purpose machinery 2014 13,845,432 1.3 10,594,187 9,672,016 12,284,536 12,124,975333999 All other miscellaneous general purpose machinery 2013 13,499,349 0.5 10,071,783 9,179,067 10,985,789 10,796,087 3339991 Filters, strainers, and parts and accessories, excluding fluid power systems
(sold separately)2014 3,077,730 1.4 2,948,266 2,746,070 1,962,916 2,055,575
3339991 Filters, strainers, and parts and accessories, excluding fluid power systems (sold separately)
2013 2,987,747 0.8 2,613,246 2,408,005 1,851,485 1,930,995
3339993 Filters for hydraulic fluid power systems, nonaerospace 2014 848,474 2.7 2,056,817 1,923,698 1,308,741 1,303,177 3339993 Filters for hydraulic fluid power systems, nonaerospace 2013 948,632 1.8 2,010,519 1,887,920 1,196,386 1,190,767 3339994 Filters for pneumatic fluid power systems, nonaerospace 2014 644,957 1.3 7,378 5,001 18,386 18,562 3339994 Filters for pneumatic fluid power systems, nonaerospace 2013 499,601 0.4 6,888 5,911 11,266 11,478 3339996 Filters for hydraulic and pneumatic fluid power systems, aerospace 2014 281,271 2.2 N N N N 3339996 Filters for hydraulic and pneumatic fluid power systems, aerospace 2013 290,369 1.8 N N N N 3339997 All other miscellaneous general industrial machinery 2014 6,634,525 2.3 5,581,726 4,997,247 4,804,420 4,615,278 3339997 All other miscellaneous general industrial machinery 2013 6,723,059 0.8 5,441,130 4,877,231 4,195,942 3,967,583 333999A All other miscellaneous machinery products, excluding electrical 2014 1,066,613 3.6 N N 4,190,073 4,132,382 333999A All other miscellaneous machinery products, excluding electrical 2013 922,612 1.2 N N 3,730,710 3,695,264 333999W All other miscellaneous general purpose machinery, nsk, total 2014 1,291,861 4.0 N N N N 333999W All other miscellaneous general purpose machinery, nsk, total 2013 1,127,330 0.6 N N N N334111 Electronic computers 2014 8,195,047 0.5 14,681,896 7,524,458 58,543,860 58,527,445334111 Electronic computers 2013 7,878,435 0.1 14,367,498 6,919,997 59,516,399 59,506,148 3341111 Host computers, multiusers (mainframes, super computers, midrange
servers, blade servers, UNIX servers, PC servers)2014 4,925,467 0.1 8,136,194 5,626,317 16,560,786 16,563,238
3341111 Host computers, multiusers (mainframes, super computers, midrange servers, blade servers, UNIX servers, PC servers)
2013 4,558,975 0.1 7,746,708 5,333,977 16,877,929 16,874,333
3341117 Single user computers, microprocessor-based, capable of supporting attached peripherals (personal computers, workstations, portable computers, smart handheld devices)
2014 2,375,275 0.0 6,545,701 1,898,141 41,983,074 41,964,206
3341117 Single user computers, microprocessor-based, capable of supporting attached peripherals (personal computers, workstations, portable computers, smart handheld devices)
2013 2,533,790 0.1 6,620,789 1,586,020 42,638,470 42,631,815
334111D Other computers (array, analog, hybrid, and special-use computers) 2014 470,793 7.8 N N N N 334111D Other computers (array, analog, hybrid, and special-use computers) 2013 445,612 0.0 N N N N 334111W Electronic computers, nsk, total 2014 423,511 0.0 N N N N 334111W Electronic computers, nsk, total 2013 340,058 0.0 N N N N

Table
Page 156
NAICS-based Product Code Description Year
Value of Product
Shipments
Relative Standard Error
(%)
Total Export Value of Goods
Domestic Export Value
of Goods
General Import Value
of Goods
Consumption Import Value
of Goods
Manufacturing and International Trade Report: 2014 and 2013(1)In thousands of dollars. Values are based on manufacturing data from the 2014 Annual Survey of
Manufactures and administrative records from official U.S. import and export merchandise trade statistics. (1) Data for 2013 supersede the data that were previously published in the 2013 Manufacturing and International Trade Report.
334112 Computer storage devices 2014 8,138,044 1.0 6,002,453 2,057,646 11,470,528 11,451,690334112 Computer storage devices 2013 9,072,163 0.1 6,090,264 2,119,313 11,997,947 11,970,747 3341121 Computer storage devices (excluding parts, attachments, and accessories) 2014 6,356,688 1.2 6,002,453 2,057,646 11,470,528 11,451,690 3341121 Computer storage devices (excluding parts, attachments, and accessories) 2013 7,092,120 0.2 6,090,264 2,119,313 11,997,947 11,970,747 3341124 Parts, attachments, and accessories for computer storage devices 2014 1,698,800 0.0 N N N N 3341124 Parts, attachments, and accessories for computer storage devices 2013 1,919,979 0.0 N N N N 334112W Computer storage devices, nsk, total 2014 82,556 0.0 N N N N 334112W Computer storage devices, nsk, total 2013 60,064 0.0 N N N N334118 Computer terminals and other computer peripheral equipment 2014 9,707,141 2.0 28,376,741 11,732,109 22,176,589 22,228,175334118 Computer terminals and other computer peripheral equipment 2013 10,690,659 1.1 27,806,482 11,888,605 21,813,762 21,939,256 3341181 Computer terminals (excluding point-of-sale and funds-transfer devices,
parts, attachments, and accessories)2014 571,023 15.1 N N N N
3341181 Computer terminals (excluding point-of-sale and funds-transfer devices, parts, attachments, and accessories)
2013 514,073 1.1 N N N N
3341182 Parts, attachments, and accessories for computer terminals (excluding point-of-sale and funds-transfer devices)
2014 29,370 0.0 N N N N
3341182 Parts, attachments, and accessories for computer terminals (excluding point-of-sale and funds-transfer devices)
2013 21,776 0.0 N N N N
3341183 All other miscellaneous computer peripheral (input/output) equipment (excluding parts, attachments, accessories, and digital cameras)
2014 5,432,064 2.8 25,337,232 10,411,674 21,680,193 21,731,718
3341183 All other miscellaneous computer peripheral (input/output) equipment (excluding parts, attachments, accessories, and digital cameras)
2013 6,232,428 1.0 24,749,622 10,467,650 21,385,354 21,511,261
3341184 Parts, subassemblies, and accessories for computer peripheral equipment (excluding digital camera parts and accessories)
2014 2,399,840 2.1 2,837,174 1,254,196 N N
3341184 Parts, subassemblies, and accessories for computer peripheral equipment (excluding digital camera parts and accessories)
2013 2,287,483 0.0 2,852,931 1,370,744 N N
3341185 Point-of-sale terminals and fund-transfer devices 2014 659,806 8.7 202,336 66,239 496,396 496,458 3341185 Point-of-sale terminals and fund-transfer devices 2013 854,924 11.0 203,929 50,211 428,408 427,996 3341186 Parts and attachments for point-of-sale terminals and fund-transfer devices 2014 96,761 7.3 N N N N 3341186 Parts and attachments for point-of-sale terminals and fund-transfer devices 2013 135,312 31.5 N N N N 334118W Computer terminals and other computer peripheral equipment, nsk, total 2014 518,277 1.5 N N N N 334118W Computer terminals and other computer peripheral equipment, nsk, total 2013 644,663 0.0 N N N N

Table
Page 157
NAICS-based Product Code Description Year
Value of Product
Shipments
Relative Standard Error
(%)
Total Export Value of Goods
Domestic Export Value
of Goods
General Import Value
of Goods
Consumption Import Value
of Goods
Manufacturing and International Trade Report: 2014 and 2013(1)In thousands of dollars. Values are based on manufacturing data from the 2014 Annual Survey of
Manufactures and administrative records from official U.S. import and export merchandise trade statistics. (1) Data for 2013 supersede the data that were previously published in the 2013 Manufacturing and International Trade Report.
334210 Telephone apparatus 2014 7,604,122 1.3 864,587 405,490 1,983,258 1,982,168334210 Telephone apparatus 2013 7,539,069 0.8 983,924 472,593 2,123,880 2,115,608 3342101 Telephone switching and switchboard equipment 2014 1,310,198 1.0 N N N N 3342101 Telephone switching and switchboard equipment 2013 1,368,226 0.6 N N N N 3342104 Carrier line equipment (including local loop and long haul transmission) and
non-consumer modems2014 1,882,085 1.6 N N N N
3342104 Carrier line equipment (including local loop and long haul transmission) and non-consumer modems
2013 1,727,510 0.3 N N N N
3342107 Wireline voice and data network equipment 2014 3,578,242 2.6 864,587 405,490 1,983,258 1,982,168 3342107 Wireline voice and data network equipment 2013 3,620,991 0.2 983,924 472,593 2,123,880 2,115,608 334210W Telephone apparatus, nsk, total 2014 833,597 2.3 N N N N 334210W Telephone apparatus, nsk, total 2013 822,342 7.0 N N N N334220 Radio and television broadcasting and wireless communications 2014 23,124,049 0.9 39,007,963 17,755,503 104,124,174 104,051,068334220 Radio and television broadcasting and wireless communications 2013 26,379,380 1.0 36,062,410 16,755,072 98,966,011 96,271,386 3342202 Broadcast, studio, and related electronic equipment 2014 1,926,791 4.2 26,043,859 12,566,221 50,655,860 51,254,967 3342202 Broadcast, studio, and related electronic equipment 2013 2,025,186 7.2 24,136,181 12,067,889 48,834,763 48,680,829 3342203 Wireless networking equipment 2014 1,526,037 2.7 10,464,377 3,292,084 53,002,290 52,378,500 3342203 Wireless networking equipment 2013 2,262,495 0.7 9,376,379 2,687,702 49,687,166 47,146,690 3342205 Radio station equipment 2014 9,139,637 0.3 1,028,281 1,002,942 89,179 41,092 3342205 Radio station equipment 2013 9,936,105 1.9 1,034,632 1,032,600 22,293 22,293 3342209 Other communications systems and equipment, including GPS 2014 9,011,409 1.5 N N N N 3342209 Other communications systems and equipment, including GPS 2013 10,582,019 0.6 N N N N 334220W Radio and television broadcasting and wireless communications equipment,
nsk, total2014 1,520,176 9.4 N N N N
334220W Radio and television broadcasting and wireless communications equipment, nsk, total
2013 1,573,575 3.0 N N N N
334220X Undistributed radio and television broadcasting and wireless communications equipment
2014 N X 1,471,446 894,256 376,844 376,510
334220X Undistributed radio and television broadcasting and wireless communications equipment
2013 N X 1,515,218 966,882 421,790 421,574

Table
Page 158
NAICS-based Product Code Description Year
Value of Product
Shipments
Relative Standard Error
(%)
Total Export Value of Goods
Domestic Export Value
of Goods
General Import Value
of Goods
Consumption Import Value
of Goods
Manufacturing and International Trade Report: 2014 and 2013(1)In thousands of dollars. Values are based on manufacturing data from the 2014 Annual Survey of
Manufactures and administrative records from official U.S. import and export merchandise trade statistics. (1) Data for 2013 supersede the data that were previously published in the 2013 Manufacturing and International Trade Report.
334290 Other communications equipment 2014 4,954,185 2.0 770,793 606,066 1,221,868 1,260,336334290 Other communications equipment 2013 4,908,995 1.1 759,533 594,999 1,194,532 1,214,780 3342901 Alarm systems, including electric sirens and horns 2014 1,982,866 2.2 444,736 320,493 842,948 881,792 3342901 Alarm systems, including electric sirens and horns 2013 2,177,396 2.2 440,181 323,448 836,316 856,342 3342902 Vehicular and pedestrian traffic control equipment, including electric railway
signals and attachments2014 1,994,635 2.8 326,057 285,573 355,228 355,228
3342902 Vehicular and pedestrian traffic control equipment, including electric railway signals and attachments
2013 1,738,702 0.5 319,353 271,551 333,214 333,190
3342903 Intercommunications systems, including inductive paging systems (selective paging), excluding telephone and telegraph
2014 449,531 6.5 N N 23,692 23,315
3342903 Intercommunications systems, including inductive paging systems (selective paging), excluding telephone and telegraph
2013 464,667 2.2 N N 25,002 25,249
334290W Other communications equipment, nsk, total 2014 527,153 12.1 N N N N 334290W Other communications equipment, nsk, total 2013 528,230 2.6 N N N N334310 Audio and video equipment 2014 2,988,152 1.9 9,771,205 4,229,828 36,143,736 35,854,555334310 Audio and video equipment 2013 2,770,049 1.0 9,703,092 4,378,013 35,207,439 35,017,639 3343101 Automotive audio equipment (excluding speakers) 2014 40,768 10.9 1,102,476 446,283 3,587,862 3,526,801 3343101 Automotive audio equipment (excluding speakers) 2013 S A 1,170,357 593,510 3,337,493 3,291,501 3343102 Television receivers, including CRT, LCD, projection, plasma, LED, etc. 2014 141,246 0.1 3,836,061 1,172,320 20,494,340 20,436,456 3343102 Television receivers, including CRT, LCD, projection, plasma, LED, etc. 2013 115,426 0.0 3,646,312 1,145,229 18,965,832 18,927,993 3343104 Speakers, including loudspeaker systems and loudspeakers sold separately,
and commercial sound equipment2014 1,090,214 1.4 2,176,134 1,174,844 3,932,836 3,852,190
3343104 Speakers, including loudspeaker systems and loudspeakers sold separately, and commercial sound equipment
2013 1,157,758 1.7 2,153,732 1,273,033 3,725,849 3,675,984
3343105 Other consumer audio and video equipment, including audio and video recorders and players (camcorders)
2014 1,194,490 3.0 2,656,534 1,436,381 8,128,698 8,039,107
3343105 Other consumer audio and video equipment, including audio and video recorders and players (camcorders)
2013 929,222 0.5 2,732,691 1,366,241 9,178,265 9,122,161
334310W Audio and video equipment, nsk, total 2014 521,434 7.9 N N N N 334310W Audio and video equipment, nsk, total 2013 556,062 0.1 N N N N334412 Bare printed circuit boards 2014 4,110,808 2.0 1,980,226 1,422,475 1,973,648 1,913,276334412 Bare printed circuit boards 2013 4,448,618 1.9 1,769,302 1,303,684 1,923,294 1,859,550 3344120 Bare printed circuit boards 2014 4,110,808 2.0 1,980,226 1,422,475 1,973,648 1,913,276 3344120 Bare printed circuit boards 2013 4,448,618 1.9 1,769,302 1,303,684 1,923,294 1,859,550

Table
Page 159
NAICS-based Product Code Description Year
Value of Product
Shipments
Relative Standard Error
(%)
Total Export Value of Goods
Domestic Export Value
of Goods
General Import Value
of Goods
Consumption Import Value
of Goods
Manufacturing and International Trade Report: 2014 and 2013(1)In thousands of dollars. Values are based on manufacturing data from the 2014 Annual Survey of
Manufactures and administrative records from official U.S. import and export merchandise trade statistics. (1) Data for 2013 supersede the data that were previously published in the 2013 Manufacturing and International Trade Report.
334413 Semiconductors and related devices 2014 44,479,769 1.0 42,697,341 28,052,798 40,332,775 40,370,209334413 Semiconductors and related devices 2013 43,410,661 0.3 41,968,539 26,675,381 39,282,776 39,330,499 3344131 Integrated circuit packages 2014 30,080,382 0.2 33,650,739 21,208,733 29,702,091 29,749,758 3344131 Integrated circuit packages 2013 29,360,198 0.4 33,730,755 20,440,543 29,335,411 29,400,026 3344134 Transistors 2014 284,707 4.2 951,808 334,824 1,147,836 1,159,516 3344134 Transistors 2013 538,967 0.2 877,618 306,040 1,124,245 1,132,592 3344137 Diodes and rectifiers 2014 242,726 3.3 2,050,777 1,423,944 2,029,284 2,035,317 3344137 Diodes and rectifiers 2013 214,516 0.2 1,804,933 1,270,275 1,892,560 1,901,399 334413A Other semiconductor devices, including semiconductor parts such as chips,
wafers, and heat sinks2014 12,511,484 1.9 4,136,015 3,425,960 6,472,471 6,453,278
334413A Other semiconductor devices, including semiconductor parts such as chips, wafers, and heat sinks
2013 11,316,207 0.5 3,758,035 3,132,522 6,012,869 5,985,631
334413W Semiconductors and related devices, nsk, total 2014 1,360,469 25.8 N N N N 334413W Semiconductors and related devices, nsk, total 2013 1,980,772 0.7 N N N N 334413X Undistributed semiconductors and related devices 2014 N X 1,908,002 1,659,336 981,092 972,340 334413X Undistributed semiconductors and related devices 2013 N X 1,797,198 1,526,001 917,690 910,852334416 Capacitors, resistors, coils, transformers, and other inductors 2014 3,367,440 1.6 3,654,212 2,180,107 4,975,506 4,970,779334416 Capacitors, resistors, coils, transformers, and other inductors 2013 3,323,411 1.8 3,531,987 2,136,414 4,049,397 4,043,812 3344161 Capacitors for electronic circuitry 2014 973,456 3.1 1,584,505 897,890 2,171,171 2,193,815 3344161 Capacitors for electronic circuitry 2013 916,219 5.8 1,603,231 864,118 1,361,478 1,384,868 3344162 Resistors for electronic circuitry 2014 402,441 5.9 1,193,138 785,489 1,547,302 1,543,123 3344162 Resistors for electronic circuitry 2013 381,599 1.0 1,087,226 742,438 1,492,017 1,487,410 3344163 Electronic coils, transformers, and other inductors 2014 1,885,704 2.0 876,569 496,727 1,257,033 1,233,841 3344163 Electronic coils, transformers, and other inductors 2013 1,935,968 1.2 841,530 529,858 1,195,902 1,171,535 334416W Capacitors, resistors, coils, transformers, and other inductors, nsk, total 2014 105,838 0.4 N N N N 334416W Capacitors, resistors, coils, transformers, and other inductors, nsk, total 2013 89,625 0.0 N N N N334417 Electronic connectors 2014 5,156,934 1.1 2,311,742 1,541,027 2,329,028 2,312,963334417 Electronic connectors 2013 5,488,321 1.1 1,905,099 1,310,891 2,246,505 2,236,704 3344170 Electronic connectors, including parts 2014 5,156,934 1.1 2,311,742 1,541,027 2,329,028 2,312,963 3344170 Electronic connectors, including parts 2013 5,488,321 1.1 1,905,099 1,310,891 2,246,505 2,236,704

Table
Page 160
NAICS-based Product Code Description Year
Value of Product
Shipments
Relative Standard Error
(%)
Total Export Value of Goods
Domestic Export Value
of Goods
General Import Value
of Goods
Consumption Import Value
of Goods
Manufacturing and International Trade Report: 2014 and 2013(1)In thousands of dollars. Values are based on manufacturing data from the 2014 Annual Survey of
Manufactures and administrative records from official U.S. import and export merchandise trade statistics. (1) Data for 2013 supersede the data that were previously published in the 2013 Manufacturing and International Trade Report.
334418 Printed circuit assemblies (electronic assemblies) 2014 15,895,419 1.6 935,488 328,273 15,652,586 15,649,677334418 Printed circuit assemblies (electronic assemblies) 2013 16,946,792 1.1 745,022 293,903 13,417,135 13,399,953 3344184 External modems, consumer 2014 216,094 1.2 902,322 305,223 990,131 990,168 3344184 External modems, consumer 2013 259,764 1.9 715,971 273,799 879,369 879,338 334418B Printed circuit assemblies, loaded boards and modules (printed circuit
boards with inserted electronic components)2014 14,795,016 1.6 33,166 23,049 14,662,455 14,659,508
334418B Printed circuit assemblies, loaded boards and modules (printed circuit boards with inserted electronic components)
2013 15,756,670 1.2 29,051 20,104 12,537,766 12,520,615
334418W Printed circuit assemblies (electronic assemblies), nsk, total 2014 884,309 8.9 N N N N 334418W Printed circuit assemblies (electronic assemblies), nsk, total 2013 930,357 0.1 N N N N334419 Other electronic components 2014 11,151,387 1.1 3,267,169 2,077,244 6,009,618 5,939,258334419 Other electronic components 2013 10,684,240 1.7 3,277,343 2,080,867 5,704,062 5,664,915 3344191 Crystals, filters, piezoelectric, and other related electronic devices (excluding
microwave filters)2014 861,737 2.9 309,311 135,132 478,735 479,201
3344191 Crystals, filters, piezoelectric, and other related electronic devices (excluding microwave filters)
2013 937,367 5.0 313,888 146,852 439,802 438,001
3344192 Electron tubes and parts, excluding glass blanks 2014 951,609 1.5 338,511 284,142 281,946 281,899 3344192 Electron tubes and parts, excluding glass blanks 2013 927,161 1.8 287,183 219,191 310,566 310,535 3344194 Transducers, including electrical-electronic input/output transducers 2014 857,863 5.6 N N N N 3344194 Transducers, including electrical-electronic input/output transducers 2013 789,377 3.0 N N N N 3344197 Switches, mechanical, for electronic circuitry 2014 987,698 7.1 N N N N 3344197 Switches, mechanical, for electronic circuitry 2013 972,591 0.6 N N N N 334419A Microwave components and devices, excluding antennae, tubes, and
semiconductors2014 1,700,855 1.5 N N N N
334419A Microwave components and devices, excluding antennae, tubes, and semiconductors
2013 1,684,326 1.0 N N N N
334419E All other miscellaneous electronic components 2014 4,676,697 1.6 2,619,348 1,657,970 5,248,937 5,178,158 334419E All other miscellaneous electronic components 2013 4,507,778 3.9 2,676,272 1,714,824 4,953,694 4,916,379 334419W Other electronic components, nsk, total 2014 1,114,929 3.6 N N N N 334419W Other electronic components, nsk, total 2013 865,641 1.5 N N N N

Table
Page 161
NAICS-based Product Code Description Year
Value of Product
Shipments
Relative Standard Error
(%)
Total Export Value of Goods
Domestic Export Value
of Goods
General Import Value
of Goods
Consumption Import Value
of Goods
Manufacturing and International Trade Report: 2014 and 2013(1)In thousands of dollars. Values are based on manufacturing data from the 2014 Annual Survey of
Manufactures and administrative records from official U.S. import and export merchandise trade statistics. (1) Data for 2013 supersede the data that were previously published in the 2013 Manufacturing and International Trade Report.
334510 Electromedical and electrotherapeutic apparatus 2014 27,580,496 1.4 10,587,094 8,302,796 10,387,695 10,370,618334510 Electromedical and electrotherapeutic apparatus 2013 27,415,327 0.5 10,416,062 8,386,550 9,528,251 9,513,513 3345101 Electromedical equipment (including diagnostic, therapeutic, and patient
monitoring equipment), excluding ionizing radiation equipment2014 24,375,608 1.5 10,295,852 8,206,150 8,940,221 8,922,902
3345101 Electromedical equipment (including diagnostic, therapeutic, and patient monitoring equipment), excluding ionizing radiation equipment
2013 24,205,774 0.5 10,117,775 8,283,674 8,060,227 8,045,669
3345103 Electronic hearing aids, complete units 2014 1,341,491 2.1 291,242 96,646 1,447,474 1,447,716 3345103 Electronic hearing aids, complete units 2013 1,483,764 3.6 298,287 102,876 1,468,025 1,467,845 334510W Electromedical and electrotherapeutic apparatus, nsk, total 2014 1,863,396 2.2 N N N N 334510W Electromedical and electrotherapeutic apparatus, nsk, total 2013 1,725,789 0.5 N N N N334511 Search, detection, navigation, guidance, aeronautical, and nautical
systems and instruments2014 41,257,880 1.1 6,293,859 4,475,898 7,336,934 7,143,116
334511 Search, detection, navigation, guidance, aeronautical, and nautical systems and instruments
2013 42,958,393 2.1 6,583,067 5,325,053 6,426,359 6,245,701
3345111 Aeronautical, nautical, and navigational instruments, not sending or receiving radio signals (excluding engine instruments)
2014 3,292,698 3.6 2,509,532 1,942,526 2,454,961 2,375,151
3345111 Aeronautical, nautical, and navigational instruments, not sending or receiving radio signals (excluding engine instruments)
2013 3,080,765 1.1 2,529,433 2,103,546 2,234,402 2,187,683
3345113 Search, detection, navigation, and guidance systems and equipment 2014 36,947,066 1.2 3,784,327 2,533,372 4,881,973 4,767,966 3345113 Search, detection, navigation, and guidance systems and equipment 2013 38,757,781 2.3 4,053,634 3,221,508 4,191,958 4,058,018 334511W Search, detection, navigation, guidance, aeronautical, and nautical systems
and instruments, nsk, total2014 1,018,116 6.7 N N N N
334511W Search, detection, navigation, guidance, aeronautical, and nautical systems and instruments, nsk, total
2013 1,119,846 0.6 N N N N
334512 Automatic environmental controls for residential, commercial, and appliance use
2014 2,672,584 1.4 435,885 282,888 1,408,331 1,399,452
334512 Automatic environmental controls for residential, commercial, and appliance use
2013 2,514,864 0.8 423,761 288,271 1,259,044 1,240,117
3345120 Automatic environmental controls for monitoring residential, commercial, and appliance use
2014 2,672,584 1.4 435,885 282,888 1,408,331 1,399,452
3345120 Automatic environmental controls for monitoring residential, commercial, and appliance use
2013 2,514,864 0.8 423,761 288,271 1,259,044 1,240,117

Table
Page 162
NAICS-based Product Code Description Year
Value of Product
Shipments
Relative Standard Error
(%)
Total Export Value of Goods
Domestic Export Value
of Goods
General Import Value
of Goods
Consumption Import Value
of Goods
Manufacturing and International Trade Report: 2014 and 2013(1)In thousands of dollars. Values are based on manufacturing data from the 2014 Annual Survey of
Manufactures and administrative records from official U.S. import and export merchandise trade statistics. (1) Data for 2013 supersede the data that were previously published in the 2013 Manufacturing and International Trade Report.
334513 Instruments and related products for measuring, displaying, and controlling industrial process variables
2014 10,899,820 1.2 8,320,980 6,722,907 8,021,604 7,844,933
334513 Instruments and related products for measuring, displaying, and controlling industrial process variables
2013 10,705,235 0.7 8,235,302 6,856,392 7,519,628 7,401,378
3345130 Process control instruments 2014 10,899,820 1.2 8,320,980 6,722,907 8,021,604 7,844,933 3345130 Process control instruments 2013 10,705,235 0.7 8,235,302 6,856,392 7,519,628 7,401,378334514 Totalizing fluid meters and counting devices 2014 5,008,716 0.8 841,676 601,172 2,500,350 2,422,175334514 Totalizing fluid meters and counting devices 2013 5,414,007 0.8 796,824 599,606 2,161,719 2,105,414 3345141 Integrating and totalizing meters for gas and liquids 2014 2,676,840 0.7 316,680 273,788 468,304 468,302 3345141 Integrating and totalizing meters for gas and liquids 2013 2,906,404 1.5 306,296 276,973 439,819 439,819 3345143 Counting devices (excluding motor vehicle instruments) 2014 1,274,968 2.6 203,324 104,853 424,874 384,197 3345143 Counting devices (excluding motor vehicle instruments) 2013 1,424,615 0.3 168,000 100,327 266,982 266,105 3345147 Motor vehicle instruments 2014 902,630 1.2 321,672 222,532 1,607,172 1,569,676 3345147 Motor vehicle instruments 2013 890,242 0.1 322,528 222,306 1,454,918 1,399,490 334514W Totalizing fluid meters and counting devices, nsk, total 2014 154,278 0.0 N N N N 334514W Totalizing fluid meters and counting devices, nsk, total 2013 192,746 1.8 N N N N334515 Instruments for measuring and testing electricity and electrical signals 2014 11,210,271 1.5 8,352,887 6,825,002 6,409,321 6,323,210334515 Instruments for measuring and testing electricity and electrical signals 2013 11,454,940 1.0 8,393,321 7,100,982 6,154,467 6,113,344 3345151 Electrical integrating instruments 2014 3,113,552 5.1 595,565 388,179 553,566 534,403 3345151 Electrical integrating instruments 2013 2,924,572 0.6 556,818 475,459 483,381 481,555 3345154 Test equipment for testing electrical, radio, and communication circuits, and
motors (excluding portable instrument transformers)2014 7,376,840 0.8 7,757,323 6,436,824 5,855,754 5,788,808
3345154 Test equipment for testing electrical, radio, and communication circuits, and motors (excluding portable instrument transformers)
2013 7,786,566 1.4 7,836,502 6,625,523 5,671,087 5,631,789
3345155 Other instruments to measure electricity 2014 315,163 7.6 N N N N 3345155 Other instruments to measure electricity 2013 335,189 9.8 N N N N 334515W Instruments for measuring and testing electricity and electrical signals, nsk, 2014 404,715 5.8 N N N N 334515W Instruments for measuring and testing electricity and electrical signals, nsk, 2013 408,613 5.3 N N N N

Table
Page 163
NAICS-based Product Code Description Year
Value of Product
Shipments
Relative Standard Error
(%)
Total Export Value of Goods
Domestic Export Value
of Goods
General Import Value
of Goods
Consumption Import Value
of Goods
Manufacturing and International Trade Report: 2014 and 2013(1)In thousands of dollars. Values are based on manufacturing data from the 2014 Annual Survey of
Manufactures and administrative records from official U.S. import and export merchandise trade statistics. (1) Data for 2013 supersede the data that were previously published in the 2013 Manufacturing and International Trade Report.
334516 Analytical laboratory instruments 2014 15,514,162 1.3 6,002,976 5,135,439 5,998,188 5,956,802334516 Analytical laboratory instruments 2013 13,346,901 0.5 5,911,113 5,086,890 5,602,834 5,579,663 3345160 Analytical and scientific instruments, excluding optical 2014 15,514,162 1.3 6,002,976 5,135,439 5,998,188 5,956,802 3345160 Analytical and scientific instruments, excluding optical 2013 13,346,901 0.5 5,911,113 5,086,890 5,602,834 5,579,663334517 Irradiation apparatus 2014 8,981,019 1.4 3,866,661 3,397,508 3,753,403 3,751,407334517 Irradiation apparatus 2013 8,944,636 0.5 4,188,949 3,762,614 3,634,641 3,622,082 3345170 Irradiation (ionizing radiation) equipment 2014 8,981,019 1.4 3,866,661 3,397,508 3,753,403 3,751,407 3345170 Irradiation (ionizing radiation) equipment 2013 8,944,636 0.5 4,188,949 3,762,614 3,634,641 3,622,082334519 Other measuring and controlling devices 2014 11,075,168 1.2 8,246,916 6,372,124 7,361,908 7,093,549334519 Other measuring and controlling devices 2013 11,259,694 0.5 8,571,305 6,789,299 6,977,013 6,690,732 3345191 Watches, clocks, and parts 2014 263,067 2.8 1,291,311 349,179 5,191,313 4,926,997 3345191 Watches, clocks, and parts 2013 260,855 2.1 1,192,922 334,596 4,903,869 4,622,538 3345192 Aircraft engine instruments (excluding flight) 2014 1,357,757 1.9 N N N N 3345192 Aircraft engine instruments (excluding flight) 2013 1,336,593 0.2 N N N N 3345194 Physical properties testing and inspection equipment and kinematic testing
and measuring equipment2014 3,209,708 2.2 3,449,188 3,077,300 193,844 193,609
3345194 Physical properties testing and inspection equipment and kinematic testing and measuring equipment
2013 3,061,452 1.6 3,479,364 3,100,468 182,619 182,242
3345195 Nuclear radiation detection and monitoring instruments 2014 1,011,153 2.1 575,988 533,956 241,792 241,792 3345195 Nuclear radiation detection and monitoring instruments 2013 1,045,120 1.8 695,492 649,153 237,229 237,229 3345197 Commercial, geophysical, meteorological, and general-purpose instruments
and equipment (excluding medical thermometers)2014 3,096,543 2.2 1,794,680 1,526,312 964,357 961,004
3345197 Commercial, geophysical, meteorological, and general-purpose instruments and equipment (excluding medical thermometers)
2013 3,315,036 0.5 1,919,676 1,647,628 896,495 892,843
3345199 Survey and drafting instruments and apparatus (including photogrammetric equipment)
2014 1,107,078 0.3 1,135,750 885,377 770,603 770,148
3345199 Survey and drafting instruments and apparatus (including photogrammetric equipment)
2013 1,143,634 0.0 1,283,851 1,057,454 756,801 755,880
334519W Other measuring and controlling devices, nsk, total 2014 1,029,861 8.9 N N N N 334519W Other measuring and controlling devices, nsk, total 2013 1,097,004 0.5 N N N N

Table
Page 164
NAICS-based Product Code Description Year
Value of Product
Shipments
Relative Standard Error
(%)
Total Export Value of Goods
Domestic Export Value
of Goods
General Import Value
of Goods
Consumption Import Value
of Goods
Manufacturing and International Trade Report: 2014 and 2013(1)In thousands of dollars. Values are based on manufacturing data from the 2014 Annual Survey of
Manufactures and administrative records from official U.S. import and export merchandise trade statistics. (1) Data for 2013 supersede the data that were previously published in the 2013 Manufacturing and International Trade Report.
334613 Magnetic and optical recording media 2014 451,971 1.7 1,410,394 685,018 4,892,603 4,895,821334613 Magnetic and optical recording media 2013 233,235 s 47.7 s 1,298,864 615,187 3,828,742 3,830,056 3346130 Magnetic and optical recording media 2014 451,971 1.7 1,410,394 685,018 4,892,603 4,895,821 3346130 Magnetic and optical recording media 2013 233,235 s 47.7 s 1,298,864 615,187 3,828,742 3,830,056334614 Software and other prerecorded compact disc, tape, and record
reproduction2014 2,434,544 2.1 2,679,899 2,263,910 757,240 755,765
334614 Software and other prerecorded compact disc, tape, and record reproduction
2013 2,525,434 1.4 3,090,456 2,598,954 833,188 826,037
3346141 Software reproducing 2014 560,982 8.2 1,580,438 1,315,306 395,987 395,986 3346141 Software reproducing 2013 649,494 0.7 1,911,693 1,594,821 434,500 432,641 3346142 Reproduction of recording media 2014 1,784,966 1.3 1,099,461 948,603 361,252 359,779 3346142 Reproduction of recording media 2013 1,748,552 1.9 1,178,763 1,004,134 398,688 393,396 334614W Software and other prerecorded compact disc, tape, and record
reproduction, nsk, total2014 88,596 0.0 N N N N
334614W Software and other prerecorded compact disc, tape, and record reproduction, nsk, total
2013 127,388 0.0 N N N N
335110 Electric lamp bulbs and parts 2014 1,471,199 2.1 719,456 516,545 2,343,692 2,344,819335110 Electric lamp bulbs and parts 2013 1,669,095 2.0 783,027 584,947 2,510,338 2,516,211 3351101 Electric lamp bulbs and tubes (including sealed beam lamp bulbs) 2014 790,553 2.7 631,056 436,575 2,250,488 2,251,950 3351101 Electric lamp bulbs and tubes (including sealed beam lamp bulbs) 2013 935,803 1.3 665,010 478,415 2,389,650 2,396,534 3351103 Electric lamp (bulbs and tubes) components (including bases, supports, lead-
ins, filaments, etc.), excluding lamp bulb blanks2014 674,372 3.3 88,401 79,970 93,204 92,869
3351103 Electric lamp (bulbs and tubes) components (including bases, supports, lead-ins, filaments, etc.), excluding lamp bulb blanks
2013 726,166 4.2 118,017 106,533 120,688 119,678
335110W Electric lamp bulbs and parts, nsk, total 2014 6,274 0.0 N N N N 335110W Electric lamp bulbs and parts, nsk, total 2013 7,126 0.0 N N N N

Table
Page 165
NAICS-based Product Code Description Year
Value of Product
Shipments
Relative Standard Error
(%)
Total Export Value of Goods
Domestic Export Value
of Goods
General Import Value
of Goods
Consumption Import Value
of Goods
Manufacturing and International Trade Report: 2014 and 2013(1)In thousands of dollars. Values are based on manufacturing data from the 2014 Annual Survey of
Manufactures and administrative records from official U.S. import and export merchandise trade statistics. (1) Data for 2013 supersede the data that were previously published in the 2013 Manufacturing and International Trade Report.
335121 Residential electric lighting fixtures 2014 1,435,505 2.6 247,725 174,112 2,281,408 2,281,806335121 Residential electric lighting fixtures 2013 1,342,551 1.2 240,695 168,158 2,061,598 2,058,957 3351211 Residential-type electric lighting fixtures (excluding portable), including parts
and accessories2014 752,380 4.1 194,186 139,009 1,618,227 1,619,600
3351211 Residential-type electric lighting fixtures (excluding portable), including parts and accessories
2013 703,901 2.2 184,158 132,684 1,412,468 1,411,743
3351214 Residential-type portable lighting fixtures, including parts and accessories 2014 533,209 4.1 53,538 35,103 663,181 662,206 3351214 Residential-type portable lighting fixtures, including parts and accessories 2013 526,536 0.4 56,538 35,474 649,129 647,214 335121W Residential electric lighting fixtures, nsk, total 2014 149,915 1.6 N N N N 335121W Residential electric lighting fixtures, nsk, total 2013 112,114 0.0 N N N N335122 Commercial, industrial, and institutional electric lighting fixtures 2014 5,071,902 1.9 349,005 237,051 1,789,100 1,787,945335122 Commercial, industrial, and institutional electric lighting fixtures 2013 4,800,176 0.8 331,995 230,943 1,497,553 1,497,357 3351221 Commercial- and institutional-type electric lighting fixtures, including parts
and accessories2014 3,936,556 2.2 N N N N
3351221 Commercial- and institutional-type electric lighting fixtures, including parts and accessories
2013 3,650,562 1.0 N N N N
3351222 Industrial-type electric lighting fixtures, including parts and accessories 2014 907,163 5.3 N N N N 3351222 Industrial-type electric lighting fixtures, including parts and accessories 2013 932,239 1.7 N N N N 335122W Commercial, industrial, and institutional electric lighting fixtures, nsk, total 2014 228,183 1.4 N N N N 335122W Commercial, industrial, and institutional electric lighting fixtures, nsk, total 2013 217,375 0.0 N N N N 335122X Undistributed commercial, industrial, and institutional electric lighting fixtures 2014 N X 349,005 237,051 1,789,100 1,787,945 335122X Undistributed commercial, industrial, and institutional electric lighting fixtures 2013 N X 331,995 230,943 1,497,553 1,497,357

Table
Page 166
NAICS-based Product Code Description Year
Value of Product
Shipments
Relative Standard Error
(%)
Total Export Value of Goods
Domestic Export Value
of Goods
General Import Value
of Goods
Consumption Import Value
of Goods
Manufacturing and International Trade Report: 2014 and 2013(1)In thousands of dollars. Values are based on manufacturing data from the 2014 Annual Survey of
Manufactures and administrative records from official U.S. import and export merchandise trade statistics. (1) Data for 2013 supersede the data that were previously published in the 2013 Manufacturing and International Trade Report.
335129 Other lighting equipment 2014 3,869,188 1.8 1,454,594 1,132,753 6,536,730 6,534,865335129 Other lighting equipment 2013 3,909,623 1.0 1,266,140 1,003,945 5,502,464 5,491,550 3351291 Outdoor lighting equipment (including parts and accessories) 2014 2,279,764 1.6 N N 64,277 64,181 3351291 Outdoor lighting equipment (including parts and accessories) 2013 2,096,859 1.5 N N 60,756 60,763 3351294 All other miscellaneous electric and nonelectric lighting equipment, including
hand portable, parts and accessories2014 1,380,320 4.3 540,164 439,324 2,372,823 2,376,014
3351294 All other miscellaneous electric and nonelectric lighting equipment, including hand portable, parts and accessories
2013 1,632,177 1.6 477,178 389,494 1,575,405 1,569,037
335129W Other lighting equipment, nsk, total 2014 209,103 2.2 N N N N 335129W Other lighting equipment, nsk, total 2013 180,587 0.2 N N N N 335129X Undistributed other lighting equipment 2014 N X 914,430 693,429 4,099,630 4,094,670 335129X Undistributed other lighting equipment 2013 N X 788,962 614,450 3,866,303 3,861,750335210 Small electrical appliances 2014 3,036,088 0.2 6,130,762 5,174,359 11,317,410 11,318,076335210 Small electrical appliances 2013 3,054,204 0.1 5,406,390 4,461,911 10,564,719 10,563,131 3352101 Electric fans, excluding industrial-type 2014 584,562 0.0 127,881 90,744 1,290,736 1,292,732 3352101 Electric fans, excluding industrial-type 2013 552,283 0.0 135,874 100,019 1,249,632 1,247,294 3352104 Small electric household appliances, excluding fans and wall and baseboard
heating units for permanent installation2014 1,552,213 0.5 3,297,496 2,693,032 7,304,045 7,301,936
3352104 Small electric household appliances, excluding fans and wall and baseboard heating units for permanent installation
2013 1,492,928 0.1 2,997,233 2,412,414 6,916,942 6,873,871
3352105 Parts and attachments for small household electric appliances, including 2014 138,245 0.4 2,313,635 2,113,288 532,027 525,628 3352105 Parts and attachments for small household electric appliances, including 2013 122,047 0.0 1,836,807 1,641,860 439,134 434,238 3352106 Household vacuum cleaners, floor waxing machines, floor polishing
machines, and parts2014 696,853 0.0 391,751 277,295 2,190,602 2,197,781
3352106 Household vacuum cleaners, floor waxing machines, floor polishing machines, and parts
2013 820,141 0.0 436,475 307,618 1,959,011 2,007,727
335210W Small electrical appliances, nsk, total 2014 64,215 0.0 N N N N 335210W Small electrical appliances, nsk, total 2013 66,805 0.0 N N N N

Table
Page 167
NAICS-based Product Code Description Year
Value of Product
Shipments
Relative Standard Error
(%)
Total Export Value of Goods
Domestic Export Value
of Goods
General Import Value
of Goods
Consumption Import Value
of Goods
Manufacturing and International Trade Report: 2014 and 2013(1)In thousands of dollars. Values are based on manufacturing data from the 2014 Annual Survey of
Manufactures and administrative records from official U.S. import and export merchandise trade statistics. (1) Data for 2013 supersede the data that were previously published in the 2013 Manufacturing and International Trade Report.
335221 Household cooking appliances 2014 5,006,042 0.8 820,355 692,514 4,204,927 4,242,428335221 Household cooking appliances 2013 4,418,688 0.9 770,961 700,388 4,088,678 4,117,393 3352211 Electric (including microwave) household ranges, ovens, surface cooking
units, and equipment, including parts and accessories (sold separately)2014 2,565,218 1.5 407,480 371,157 2,245,178 2,282,552
3352211 Electric (including microwave) household ranges, ovens, surface cooking units, and equipment, including parts and accessories (sold separately)
2013 2,376,123 0.4 400,513 356,813 2,183,699 2,213,565
3352213 Gas household ranges, ovens, surface cooking units, and equipment, including parts and accessories (sold separately)
2014 1,508,887 0.0 407,136 316,245 1,456,683 1,461,256
3352213 Gas household ranges, ovens, surface cooking units, and equipment, including parts and accessories (sold separately)
2013 1,223,232 1.7 364,647 338,351 1,423,713 1,431,207
3352215 Other household ranges and cooking equipment 2014 898,690 0.1 5,739 5,112 155,180 155,378 3352215 Other household ranges and cooking equipment 2013 800,569 3.9 5,802 5,224 154,951 150,851 335221W Household cooking appliances, nsk, total 2014 33,247 0.0 N N N N 335221W Household cooking appliances, nsk, total 2013 18,763 0.0 N N N N 335221X Undistributed household cooking appliances 2014 N X N N 347,886 343,242 335221X Undistributed household cooking appliances 2013 N X N N 326,314 321,771335222 Household refrigerators and home freezers 2014 3,615,301 0.3 1,209,993 1,064,752 5,426,210 5,428,929335222 Household refrigerators and home freezers 2013 3,363,921 0.0 1,163,928 1,033,963 5,163,454 5,170,032 3352221 Household refrigerators, including combination refrigerator-freezers 2014 3,101,111 0.0 547,313 455,262 4,398,463 4,403,995 3352221 Household refrigerators, including combination refrigerator-freezers 2013 2,930,646 0.0 508,741 428,839 4,226,590 4,235,739 3352222 Household food freezers, complete units 2014 D S 183,031 175,300 231,337 229,785 3352222 Household food freezers, complete units 2013 D S 191,270 182,042 211,892 212,275 3352223 Parts and attachments for household refrigerators and freezers 2014 D S 479,649 434,190 796,410 795,149 3352223 Parts and attachments for household refrigerators and freezers 2013 50,439 0.0 463,917 423,081 724,972 722,018 335222W Household refrigerators and home freezers, nsk, total 2014 D S N N N N 335222W Household refrigerators and home freezers, nsk, total 2013 D S N N N N335224 Household laundry equipment 2014 3,428,855 1.4 678,887 604,001 2,121,058 2,309,864335224 Household laundry equipment 2013 3,529,266 0.9 674,814 590,302 2,002,472 2,117,387 3352240 Household laundry equipment 2014 3,428,855 1.4 678,887 604,001 2,121,058 2,309,864 3352240 Household laundry equipment 2013 3,529,266 0.9 674,814 590,302 2,002,472 2,117,387

Table
Page 168
NAICS-based Product Code Description Year
Value of Product
Shipments
Relative Standard Error
(%)
Total Export Value of Goods
Domestic Export Value
of Goods
General Import Value
of Goods
Consumption Import Value
of Goods
Manufacturing and International Trade Report: 2014 and 2013(1)In thousands of dollars. Values are based on manufacturing data from the 2014 Annual Survey of
Manufactures and administrative records from official U.S. import and export merchandise trade statistics. (1) Data for 2013 supersede the data that were previously published in the 2013 Manufacturing and International Trade Report.
335228 Other major household appliances 2014 4,625,784 0.2 967,830 870,707 1,932,072 1,946,961335228 Other major household appliances 2013 4,318,482 0.4 937,148 847,590 1,680,998 1,686,311 3352281 Household water heaters, electric, for permanent installation 2014 891,532 0.0 424,785 368,637 1,203,519 1,203,534 3352281 Household water heaters, electric, for permanent installation 2013 815,289 0.0 380,228 341,139 1,007,507 1,006,663 3352283 Household water heaters, excluding electric 2014 1,252,732 0.0 6,470 4,472 8,348 8,348 3352283 Household water heaters, excluding electric 2013 1,143,996 0.0 3,272 3,025 6,350 6,350 3352285 All other miscellaneous household appliances 2014 2,455,936 0.4 536,575 497,598 720,206 735,079 3352285 All other miscellaneous household appliances 2013 2,317,240 0.7 553,648 503,427 667,142 673,298 335228W Other major household appliances, nsk, total 2014 25,584 0.0 N N N N 335228W Other major household appliances, nsk, total 2013 41,957 0.0 N N N N335311 Power, distribution, and specialty transformers 2014 5,526,642 1.4 912,837 681,648 2,971,798 2,903,754335311 Power, distribution, and specialty transformers 2013 5,508,823 0.6 935,443 653,820 3,050,135 2,997,533 3353111 Power and distribution transformers, excluding parts 2014 4,414,777 1.0 N N N N 3353111 Power and distribution transformers, excluding parts 2013 4,142,968 0.8 N N N N 3353113 Specialty transformers, excluding fluorescent lamp ballast 2014 242,413 2.8 N N N N 3353113 Specialty transformers, excluding fluorescent lamp ballast 2013 235,677 0.0 N N N N 3353115 Fluorescent lamp ballasts 2014 40,024 20.2 254,707 106,053 687,465 683,143 3353115 Fluorescent lamp ballasts 2013 42,008 0.0 259,870 93,196 789,836 793,701 3353117 Commercial, institutional, and industrial general-purpose transformers, all 2014 226,490 12.8 N N N N 3353117 Commercial, institutional, and industrial general-purpose transformers, all 2013 215,432 0.9 N N N N 3353119 Power regulators, boosters, and other transformers and parts for all 2014 321,045 10.2 91,555 81,144 377,081 319,334 3353119 Power regulators, boosters, and other transformers and parts for all 2013 572,078 0.1 95,495 79,799 358,575 303,116 335311W Power, distribution, and specialty transformers, nsk, total 2014 281,894 15.4 N N N N 335311W Power, distribution, and specialty transformers, nsk, total 2013 300,660 1.2 N N N N 335311X Undistributed power, distribution, and specialty transformers 2014 N X 566,576 494,451 1,907,252 1,901,277 335311X Undistributed power, distribution, and specialty transformers 2013 N X 580,078 480,825 1,901,724 1,900,716

Table
Page 169
NAICS-based Product Code Description Year
Value of Product
Shipments
Relative Standard Error
(%)
Total Export Value of Goods
Domestic Export Value
of Goods
General Import Value
of Goods
Consumption Import Value
of Goods
Manufacturing and International Trade Report: 2014 and 2013(1)In thousands of dollars. Values are based on manufacturing data from the 2014 Annual Survey of
Manufactures and administrative records from official U.S. import and export merchandise trade statistics. (1) Data for 2013 supersede the data that were previously published in the 2013 Manufacturing and International Trade Report.
335312 Motors and generators 2014 10,595,014 0.8 7,980,287 6,672,365 11,486,886 10,987,296335312 Motors and generators 2013 10,230,002 0.4 7,415,595 6,151,005 10,707,941 10,293,196 3353121 Fractional horsepower motors (rated at less than 746 watts) (excluding 2014 1,812,529 2.0 N N N N 3353121 Fractional horsepower motors (rated at less than 746 watts) (excluding 2013 1,664,952 0.7 N N N N 3353123 Integral horsepower motors and generators other than for land transportation
equipment (rated at 746 watts or more) (excluding hermetics)2014 2,445,849 1.4 N N N N
3353123 Integral horsepower motors and generators other than for land transportation equipment (rated at 746 watts or more) (excluding hermetics)
2013 2,335,169 0.4 N N N N
3353125 Land transportation motors, generators, and control equipment (excluding 2014 441,483 4.9 N N N N 3353125 Land transportation motors, generators, and control equipment (excluding 2013 456,788 0.0 N N N N 3353127 Prime mover generator sets, excluding steam and hydraulic turbine 2014 1,787,442 0.9 N N N N 3353127 Prime mover generator sets, excluding steam and hydraulic turbine 2013 1,789,238 1.8 N N N N 3353129 Fractional motor generator sets and other rotating equipment (including 2014 1,269,320 2.8 N N N N 3353129 Fractional motor generator sets and other rotating equipment (including 2013 1,177,263 0.4 N N N N 335312A Integral motor generator sets and other rotating equipment (including 2014 1,235,183 0.5 N N N N 335312A Integral motor generator sets and other rotating equipment (including 2013 1,333,780 0.2 N N N N 335312C Parts and supplies for motors, generators, generator sets, and other rotating
equipment, excluding motors for built-in jobs2014 1,059,751 1.0 1,754,983 1,524,309 1,800,012 1,703,922
335312C Parts and supplies for motors, generators, generator sets, and other rotating equipment, excluding motors for built-in jobs
2013 1,006,004 0.7 1,659,626 1,403,419 1,566,398 1,512,179
335312E Armature rewinding on a factory basis 2014 139,715 33.1 N N N N 335312E Armature rewinding on a factory basis 2013 94,228 0.8 N N N N 335312W Motors and generators, nsk, total 2014 403,741 0.4 N N N N 335312W Motors and generators, nsk, total 2013 372,580 0.0 N N N N 335312X Undistributed motors and generators 2014 N X 6,225,303 5,148,057 9,686,874 9,283,374 335312X Undistributed motors and generators 2013 N X 5,755,968 4,747,586 9,141,543 8,781,017

Table
Page 170
NAICS-based Product Code Description Year
Value of Product
Shipments
Relative Standard Error
(%)
Total Export Value of Goods
Domestic Export Value
of Goods
General Import Value
of Goods
Consumption Import Value
of Goods
Manufacturing and International Trade Report: 2014 and 2013(1)In thousands of dollars. Values are based on manufacturing data from the 2014 Annual Survey of
Manufactures and administrative records from official U.S. import and export merchandise trade statistics. (1) Data for 2013 supersede the data that were previously published in the 2013 Manufacturing and International Trade Report.
335313 Switchgear and switchboard apparatus 2014 11,194,729 2.1 6,271,240 4,507,437 10,717,975 10,367,269335313 Switchgear and switchboard apparatus 2013 11,023,555 0.6 6,093,464 4,468,447 10,249,999 9,944,554 3353131 Power circuit breakers, all voltages 2014 2,455,567 6.9 151,734 136,893 165,327 211,889 3353131 Power circuit breakers, all voltages 2013 2,235,711 1.2 171,278 156,257 149,068 191,901 3353133 Low voltage panelboards and distribution boards and other switching and
interrupting devices, 1000 volts or less2014 2,449,840 1.4 748,144 596,293 1,069,566 1,050,084
3353133 Low voltage panelboards and distribution boards and other switching and interrupting devices, 1000 volts or less
2013 2,409,977 1.5 707,003 548,327 1,095,807 1,086,714
3353135 Fuses and fuse equipment less than 2300 volts (excluding power distribution cut-outs)
2014 327,305 2.6 244,856 110,322 287,423 286,895
3353135 Fuses and fuse equipment less than 2300 volts (excluding power distribution cut-outs)
2013 301,463 3.7 217,220 92,209 283,063 282,357
3353137 Molded case circuit breakers, 1000 volts or less 2014 670,489 0.6 496,872 381,700 788,177 786,731 3353137 Molded case circuit breakers, 1000 volts or less 2013 708,836 2.7 469,397 369,137 769,215 768,583 3353139 Duct, including plug-in units and accessories, 1000 volts or less 2014 353,657 1.1 35,302 33,374 9,795 9,784 3353139 Duct, including plug-in units and accessories, 1000 volts or less 2013 289,258 1.4 39,125 37,324 10,620 10,578 335313A Switchgear, excluding ducts and relays 2014 4,572,928 2.0 4,359,739 3,097,851 8,268,182 7,900,181 335313A Switchgear, excluding ducts and relays 2013 4,643,965 1.0 4,230,213 3,080,529 7,818,443 7,487,236 335313W Switchgear and switchboard apparatus, nsk, total 2014 364,942 37.9 N N N N 335313W Switchgear and switchboard apparatus, nsk, total 2013 434,345 1.5 N N N N 335313X Undistributed switchgear and switchboard apparatus 2014 N X 234,594 151,005 129,505 121,705 335313X Undistributed switchgear and switchboard apparatus 2013 N X 259,229 184,662 123,782 117,185

Table
Page 171
NAICS-based Product Code Description Year
Value of Product
Shipments
Relative Standard Error
(%)
Total Export Value of Goods
Domestic Export Value
of Goods
General Import Value
of Goods
Consumption Import Value
of Goods
Manufacturing and International Trade Report: 2014 and 2013(1)In thousands of dollars. Values are based on manufacturing data from the 2014 Annual Survey of
Manufactures and administrative records from official U.S. import and export merchandise trade statistics. (1) Data for 2013 supersede the data that were previously published in the 2013 Manufacturing and International Trade Report.
335314 Relays and industrial controls 2014 9,507,415 2.4 5,718,546 4,202,688 5,226,195 4,916,041335314 Relays and industrial controls 2013 9,174,045 0.7 5,037,599 3,705,103 4,911,824 4,641,904 3353141 Relays for electronic circuitry, industrial control overload, and switchgear- 2014 1,230,912 5.3 715,100 454,222 777,075 741,311 3353141 Relays for electronic circuitry, industrial control overload, and switchgear- 2013 1,167,608 0.9 791,327 555,389 786,202 754,364 3353143 Specific-purpose industrial controls 2014 2,300,711 7.7 N N N N 3353143 Specific-purpose industrial controls 2013 2,195,051 2.1 N N N N 3353146 General-purpose industrial controls 2014 4,810,909 2.3 1,894,361 1,464,344 3,370,950 3,121,212 3353146 General-purpose industrial controls 2013 4,796,139 0.8 1,619,413 1,203,018 3,165,378 2,943,209 3353147 Parts for industrial controls and motor-control accessories 2014 589,378 11.8 N N N N 3353147 Parts for industrial controls and motor-control accessories 2013 541,418 2.1 N N N N 335314W Relays and industrial controls, nsk, total 2014 575,505 3.2 N N N N 335314W Relays and industrial controls, nsk, total 2013 473,829 0.3 N N N N 335314X Undistributed relays and industrial controls 2014 N X 3,109,085 2,284,122 1,078,170 1,053,518 335314X Undistributed relays and industrial controls 2013 N X 2,626,860 1,946,696 960,244 944,330335911 Storage batteries 2014 7,024,618 1.5 2,933,799 2,589,586 4,524,890 3,896,441335911 Storage batteries 2013 6,191,301 0.9 2,670,885 2,352,599 4,174,859 3,747,310 3359111 Storage batteries, lead-acid-type, BCI dimensional size group 8D (1.5 cu ft
(.042 cu m) and smaller)2014 4,604,025 1.1 N N N N
3359111 Storage batteries, lead-acid-type, BCI dimensional size group 8D (1.5 cu ft (.042 cu m) and smaller)
2013 4,255,915 1.2 N N N N
3359114 Storage batteries, lead-acid-type, larger than BCI dimensional size group 8D (1.5 cu ft (.042 cu m))
2014 1,335,465 5.6 N N N N
3359114 Storage batteries, lead-acid-type, larger than BCI dimensional size group 8D (1.5 cu ft (.042 cu m))
2013 1,023,840 0.4 N N N N
3359118 Storage batteries (excluding lead acid) 2014 823,639 2.1 875,428 710,149 2,247,150 1,903,200 3359118 Storage batteries (excluding lead acid) 2013 665,190 1.6 780,965 620,407 2,309,832 1,906,956 3359119 Parts for all storage batteries, excluding cases and containers 2014 235,143 7.5 112,960 110,682 40,348 40,348 3359119 Parts for all storage batteries, excluding cases and containers 2013 158,134 0.6 108,707 107,461 33,734 33,734 335911W Storage batteries, nsk, total 2014 S A N N N N 335911W Storage batteries, nsk, total 2013 88,223 0.0 N N N N 335911X Undistributed storage batteries 2014 N X 1,945,412 1,768,755 2,237,392 1,952,892 335911X Undistributed storage batteries 2013 N X 1,781,213 1,624,731 1,831,293 1,806,621

Table
Page 172
NAICS-based Product Code Description Year
Value of Product
Shipments
Relative Standard Error
(%)
Total Export Value of Goods
Domestic Export Value
of Goods
General Import Value
of Goods
Consumption Import Value
of Goods
Manufacturing and International Trade Report: 2014 and 2013(1)In thousands of dollars. Values are based on manufacturing data from the 2014 Annual Survey of
Manufactures and administrative records from official U.S. import and export merchandise trade statistics. (1) Data for 2013 supersede the data that were previously published in the 2013 Manufacturing and International Trade Report.
335912 Primary batteries 2014 3,574,651 2.2 880,572 755,744 746,135 743,484335912 Primary batteries 2013 3,863,817 0.1 890,282 770,753 693,094 686,449 3359120 Primary batteries 2014 3,574,651 2.2 880,572 755,744 746,135 743,484 3359120 Primary batteries 2013 3,863,817 0.1 890,282 770,753 693,094 686,449335921 Fiber optic cable 2014 2,131,130 1.0 1,016,897 673,579 731,700 730,439335921 Fiber optic cable 2013 1,873,298 1.5 954,434 684,926 746,074 693,154 3359210 Fiber optic cable 2014 2,131,130 1.0 1,016,897 673,579 731,700 730,439 3359210 Fiber optic cable 2013 1,873,298 1.5 954,434 684,926 746,074 693,154335929 Other communication and energy wire 2014 11,140,361 1.0 6,404,367 5,249,064 7,638,927 7,510,460335929 Other communication and energy wire 2013 11,510,372 0.2 6,438,052 5,414,995 6,886,780 6,811,355 3359291 Power wire and cable, made from nonferrous metals (purchased wire), for
electric transmission and distribution2014 2,992,635 2.3 N N N N
3359291 Power wire and cable, made from nonferrous metals (purchased wire), for electric transmission and distribution
2013 2,955,375 0.1 N N N N
335929A Electronic wire and cable, made from nonferrous metals (purchased wire) 2014 3,169,412 2.0 N N N N 335929A Electronic wire and cable, made from nonferrous metals (purchased wire) 2013 3,258,994 0.7 N N N N 335929B Telecom (low-voltage premise) wire and cable, made from nonferrous metals
(purchased wire)2014 754,357 1.4 N N 1,949,705 1,935,052
335929B Telecom (low-voltage premise) wire and cable, made from nonferrous metals (purchased wire)
2013 742,887 0.7 N N 1,588,110 1,580,471
335929D Building wire and cable, made of nonferrous metals (purchased wire), 601 volts or less, used within structures for light and power for permanent
2014 2,197,580 0.4 N N N N
335929D Building wire and cable, made of nonferrous metals (purchased wire), 601 volts or less, used within structures for light and power for permanent
2013 2,414,311 0.5 N N N N
335929F Other insulated wire and cable, including automotive, and control and signal wire and cable, made from nonferrous metals (purchased wire)
2014 1,574,103 4.1 N N N N
335929F Other insulated wire and cable, including automotive, and control and signal wire and cable, made from nonferrous metals (purchased wire)
2013 1,702,903 0.6 N N N N
335929W Other communication and energy wire, nsk, total 2014 452,275 0.3 N N N N 335929W Other communication and energy wire, nsk, total 2013 435,900 0.0 N N N N 335929X Undistributed other communication and energy wire 2014 N X 6,404,367 5,249,064 5,689,222 5,575,408 335929X Undistributed other communication and energy wire 2013 N X 6,438,052 5,414,995 5,298,670 5,230,884

Table
Page 173
NAICS-based Product Code Description Year
Value of Product
Shipments
Relative Standard Error
(%)
Total Export Value of Goods
Domestic Export Value
of Goods
General Import Value
of Goods
Consumption Import Value
of Goods
Manufacturing and International Trade Report: 2014 and 2013(1)In thousands of dollars. Values are based on manufacturing data from the 2014 Annual Survey of
Manufactures and administrative records from official U.S. import and export merchandise trade statistics. (1) Data for 2013 supersede the data that were previously published in the 2013 Manufacturing and International Trade Report.
335931 Current-carrying wiring devices 2014 7,464,359 1.4 6,630,573 5,051,577 5,459,642 5,343,045335931 Current-carrying wiring devices 2013 7,365,397 0.8 6,236,073 4,720,322 5,283,189 5,199,829 3359315 Current-carrying switches for electrical circuitry (including vehicular switches) 2014 2,984,661 1.6 2,673,807 1,959,226 2,924,309 2,848,463 3359315 Current-carrying switches for electrical circuitry (including vehicular switches) 2013 3,017,218 1.2 2,527,715 1,856,116 2,777,030 2,714,558 3359319 Current-carrying wire connectors for electrical circuitry 2014 2,246,733 3.2 3,027,716 2,381,566 1,621,598 1,586,860 3359319 Current-carrying wire connectors for electrical circuitry 2013 2,054,429 2.3 2,782,222 2,150,331 1,591,336 1,576,653 335931A Current-carrying wiring devices, lampholders, power outlets, precious metal,
attachments, plug caps, connector bodies, lightning arrestors, and other miscellaneous current-carrying wiring devices
2014 1,895,840 2.2 929,050 710,785 913,735 907,722
335931A Current-carrying wiring devices, lampholders, power outlets, precious metal, attachments, plug caps, connector bodies, lightning arrestors, and other miscellaneous current-carrying wiring devices
2013 1,997,540 0.9 926,135 713,875 914,822 908,618
335931W Current-carrying wiring devices, nsk, total 2014 337,125 9.3 N N N N 335931W Current-carrying wiring devices, nsk, total 2013 296,209 0.1 N N N N335932 Noncurrent-carrying wiring devices 2014 5,182,775 1.1 398,515 338,359 345,787 338,373335932 Noncurrent-carrying wiring devices 2013 5,506,459 0.6 372,144 324,942 348,613 326,305 3359321 Noncurrent-carrying pole and transmission line hardware 2014 1,425,440 2.4 N N N N 3359321 Noncurrent-carrying pole and transmission line hardware 2013 1,626,940 0.2 N N N N 3359323 Noncurrent-carrying electrical conduit and conduit fittings, including plastics
conduit and conduit fittings2014 2,046,061 1.9 88,510 81,075 36,996 36,559
3359323 Noncurrent-carrying electrical conduit and conduit fittings, including plastics conduit and conduit fittings
2013 1,966,415 1.3 83,868 79,559 42,378 42,373
3359326 Other noncurrent-carrying wiring devices and supplies (boxes, covers, bar hangers, etc.)
2014 1,637,289 1.1 310,005 257,285 308,791 301,814
3359326 Other noncurrent-carrying wiring devices and supplies (boxes, covers, bar hangers, etc.)
2013 1,833,447 1.0 288,276 245,383 306,234 283,932
335932W Noncurrent-carrying wiring devices, nsk, total 2014 73,986 14.3 N N N N 335932W Noncurrent-carrying wiring devices, nsk, total 2013 79,656 0.0 N N N N

Table
Page 174
NAICS-based Product Code Description Year
Value of Product
Shipments
Relative Standard Error
(%)
Total Export Value of Goods
Domestic Export Value
of Goods
General Import Value
of Goods
Consumption Import Value
of Goods
Manufacturing and International Trade Report: 2014 and 2013(1)In thousands of dollars. Values are based on manufacturing data from the 2014 Annual Survey of
Manufactures and administrative records from official U.S. import and export merchandise trade statistics. (1) Data for 2013 supersede the data that were previously published in the 2013 Manufacturing and International Trade Report.
335991 Carbon and graphite products 2014 3,126,363 2.0 1,630,745 1,577,785 1,009,266 1,014,785335991 Carbon and graphite products 2013 3,183,558 0.8 1,447,637 1,391,008 961,127 979,270 3359911 Carbon and graphite electrodes for electric furnaces and electrolytic cell use 2014 1,361,600 2.0 285,495 273,718 353,082 352,082 3359911 Carbon and graphite electrodes for electric furnaces and electrolytic cell use 2013 1,104,730 1.2 268,701 258,418 346,011 347,782 3359913 All other carbon and graphite products, including carbon and graphite fibers,
brushes, brush plates, contacts, excluding refractories2014 1,690,529 3.3 1,322,923 1,282,890 645,748 652,267
3359913 All other carbon and graphite products, including carbon and graphite fibers, brushes, brush plates, contacts, excluding refractories
2013 1,998,107 1.1 1,103,288 1,057,534 601,904 618,277
335991W Carbon and graphite products, nsk, total 2014 74,234 4.7 N N N N 335991W Carbon and graphite products, nsk, total 2013 80,720 0.0 N N N N 335991X Undistributed carbon and graphite products 2014 N X 22,327 21,177 10,436 10,436 335991X Undistributed carbon and graphite products 2013 N X 75,648 75,056 13,211 13,211
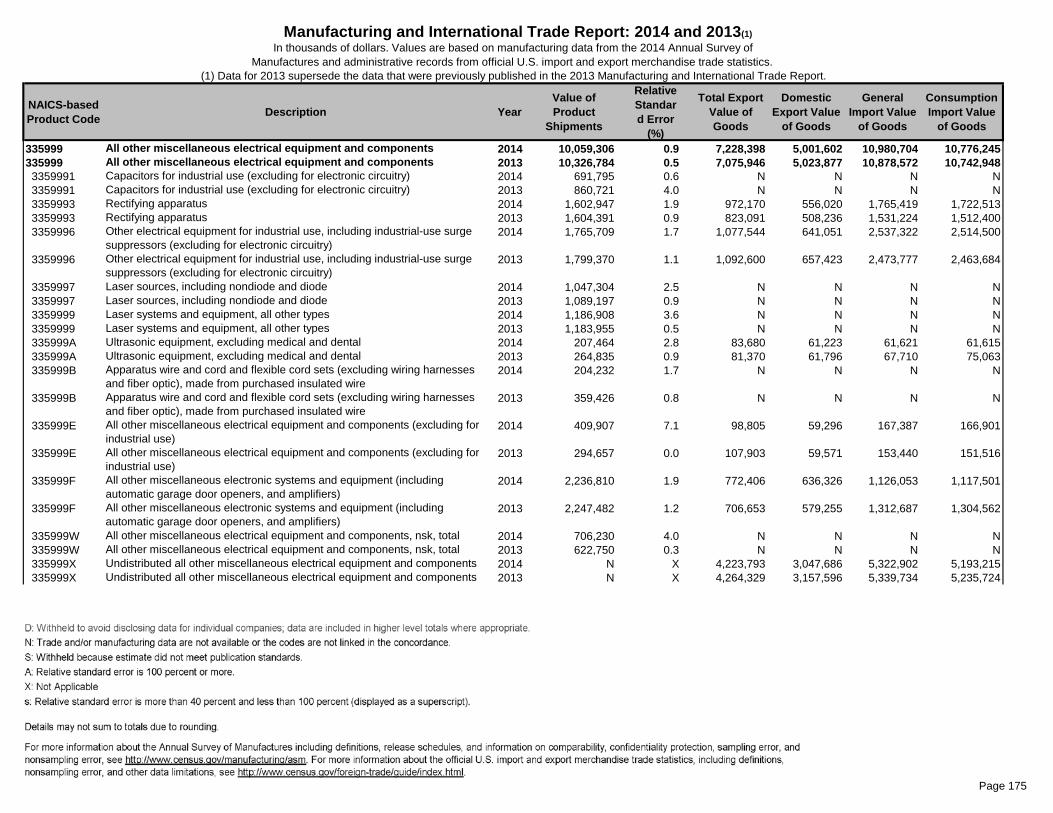
Table
Page 175
NAICS-based Product Code Description Year
Value of Product
Shipments
Relative Standard Error
(%)
Total Export Value of Goods
Domestic Export Value
of Goods
General Import Value
of Goods
Consumption Import Value
of Goods
Manufacturing and International Trade Report: 2014 and 2013(1)In thousands of dollars. Values are based on manufacturing data from the 2014 Annual Survey of
Manufactures and administrative records from official U.S. import and export merchandise trade statistics. (1) Data for 2013 supersede the data that were previously published in the 2013 Manufacturing and International Trade Report.
335999 All other miscellaneous electrical equipment and components 2014 10,059,306 0.9 7,228,398 5,001,602 10,980,704 10,776,245335999 All other miscellaneous electrical equipment and components 2013 10,326,784 0.5 7,075,946 5,023,877 10,878,572 10,742,948 3359991 Capacitors for industrial use (excluding for electronic circuitry) 2014 691,795 0.6 N N N N 3359991 Capacitors for industrial use (excluding for electronic circuitry) 2013 860,721 4.0 N N N N 3359993 Rectifying apparatus 2014 1,602,947 1.9 972,170 556,020 1,765,419 1,722,513 3359993 Rectifying apparatus 2013 1,604,391 0.9 823,091 508,236 1,531,224 1,512,400 3359996 Other electrical equipment for industrial use, including industrial-use surge
suppressors (excluding for electronic circuitry)2014 1,765,709 1.7 1,077,544 641,051 2,537,322 2,514,500
3359996 Other electrical equipment for industrial use, including industrial-use surge suppressors (excluding for electronic circuitry)
2013 1,799,370 1.1 1,092,600 657,423 2,473,777 2,463,684
3359997 Laser sources, including nondiode and diode 2014 1,047,304 2.5 N N N N 3359997 Laser sources, including nondiode and diode 2013 1,089,197 0.9 N N N N 3359999 Laser systems and equipment, all other types 2014 1,186,908 3.6 N N N N 3359999 Laser systems and equipment, all other types 2013 1,183,955 0.5 N N N N 335999A Ultrasonic equipment, excluding medical and dental 2014 207,464 2.8 83,680 61,223 61,621 61,615 335999A Ultrasonic equipment, excluding medical and dental 2013 264,835 0.9 81,370 61,796 67,710 75,063 335999B Apparatus wire and cord and flexible cord sets (excluding wiring harnesses
and fiber optic), made from purchased insulated wire2014 204,232 1.7 N N N N
335999B Apparatus wire and cord and flexible cord sets (excluding wiring harnesses and fiber optic), made from purchased insulated wire
2013 359,426 0.8 N N N N
335999E All other miscellaneous electrical equipment and components (excluding for industrial use)
2014 409,907 7.1 98,805 59,296 167,387 166,901
335999E All other miscellaneous electrical equipment and components (excluding for industrial use)
2013 294,657 0.0 107,903 59,571 153,440 151,516
335999F All other miscellaneous electronic systems and equipment (including automatic garage door openers, and amplifiers)
2014 2,236,810 1.9 772,406 636,326 1,126,053 1,117,501
335999F All other miscellaneous electronic systems and equipment (including automatic garage door openers, and amplifiers)
2013 2,247,482 1.2 706,653 579,255 1,312,687 1,304,562
335999W All other miscellaneous electrical equipment and components, nsk, total 2014 706,230 4.0 N N N N 335999W All other miscellaneous electrical equipment and components, nsk, total 2013 622,750 0.3 N N N N 335999X Undistributed all other miscellaneous electrical equipment and components 2014 N X 4,223,793 3,047,686 5,322,902 5,193,215 335999X Undistributed all other miscellaneous electrical equipment and components 2013 N X 4,264,329 3,157,596 5,339,734 5,235,724

Table
Page 176
NAICS-based Product Code Description Year
Value of Product
Shipments
Relative Standard Error
(%)
Total Export Value of Goods
Domestic Export Value
of Goods
General Import Value
of Goods
Consumption Import Value
of Goods
Manufacturing and International Trade Report: 2014 and 2013(1)In thousands of dollars. Values are based on manufacturing data from the 2014 Annual Survey of
Manufactures and administrative records from official U.S. import and export merchandise trade statistics. (1) Data for 2013 supersede the data that were previously published in the 2013 Manufacturing and International Trade Report.
336111 Automobiles 2014 111,376,155 0.1 52,143,965 49,638,136 152,614,607 156,686,199336111 Automobiles 2013 108,088,868 0.6 47,013,381 44,386,895 151,988,164 155,065,953 3361110 Automobiles 2014 111,376,155 0.1 52,143,965 49,638,136 152,614,607 156,686,199 3361110 Automobiles 2013 108,088,868 0.6 47,013,381 44,386,895 151,988,164 155,065,953336112 Light truck and utility vehicles 2014 162,180,177 0.1 9,412,063 9,044,388 14,835,300 14,835,421336112 Light truck and utility vehicles 2013 142,824,356 0.1 9,640,598 9,263,847 12,269,526 12,269,398 3361120 Light trucks and utility vehicles 2014 162,180,177 0.1 9,412,063 9,044,388 14,835,300 14,835,421 3361120 Light trucks and utility vehicles 2013 142,824,356 0.1 9,640,598 9,263,847 12,269,526 12,269,398336120 Heavy duty trucks 2014 29,369,102 0.2 6,531,536 6,342,026 13,445,356 13,412,622336120 Heavy duty trucks 2013 28,815,114 0.7 7,009,456 6,812,592 10,502,983 10,471,130 3361201 Trucks, truck tractors, and bus chassis (chassis of own manufacture) 14,001
to 33,000 lb2014 3,097,045 2.0 3,342,759 3,264,803 12,072,835 12,040,757
3361201 Trucks, truck tractors, and bus chassis (chassis of own manufacture) 14,001 to 33,000 lb
2013 3,657,055 1.0 3,482,984 3,399,339 9,393,445 9,361,719
3361202 Trucks, truck tractors, and bus chassis (chassis of own manufacture) 33,001 lb or more
2014 20,310,144 0.0 1,678,428 1,601,255 402,611 402,429
3361202 Trucks, truck tractors, and bus chassis (chassis of own manufacture) 33,001 lb or more
2013 19,728,694 0.6 1,928,690 1,854,530 389,150 389,039
3361203 Buses, including military and firefighting vehicles (chassis of own 2014 5,725,207 0.1 1,071,641 1,046,886 776,644 776,644 3361203 Buses, including military and firefighting vehicles (chassis of own 2013 5,197,799 3.5 986,318 962,464 659,726 659,726 336120W Heavy duty trucks, nsk, total 2014 236,706 0.0 N N N N 336120W Heavy duty trucks, nsk, total 2013 231,567 0.0 N N N N 336120X Undistributed heavy duty trucks 2014 N X 438,708 429,082 193,266 192,791 336120X Undistributed heavy duty trucks 2013 N X 611,464 596,259 60,663 60,646

Table
Page 177
NAICS-based Product Code Description Year
Value of Product
Shipments
Relative Standard Error
(%)
Total Export Value of Goods
Domestic Export Value
of Goods
General Import Value
of Goods
Consumption Import Value
of Goods
Manufacturing and International Trade Report: 2014 and 2013(1)In thousands of dollars. Values are based on manufacturing data from the 2014 Annual Survey of
Manufactures and administrative records from official U.S. import and export merchandise trade statistics. (1) Data for 2013 supersede the data that were previously published in the 2013 Manufacturing and International Trade Report.
336211 Motor vehicle bodies 2014 12,173,689 1.9 10,009,796 8,633,972 763,665 760,954336211 Motor vehicle bodies 2013 11,242,310 0.5 10,285,659 8,610,792 785,484 788,256 3362112 Bus bodies and truck cabs for sale separately 2014 2,374,268 3.0 82,443 38,610 490,484 486,574 3362112 Bus bodies and truck cabs for sale separately 2013 2,139,630 0.4 148,175 124,668 450,897 447,873 3362114 Van bodies for sale separately 2014 1,748,406 7.3 396,856 392,357 14,861 17,302 3362114 Van bodies for sale separately 2013 1,594,834 0.6 226,977 223,246 10,787 12,248 3362115 Other truck and vehicle bodies for sale separately (including dumptruck lifting
mechanisms and kit cars)2014 3,334,711 2.6 1,509,667 1,060,293 13,700 15,750
3362115 Other truck and vehicle bodies for sale separately (including dumptruck lifting mechanisms and kit cars)
2013 3,003,774 1.4 1,455,708 1,004,939 10,398 14,733
3362117 Buses and firefighting vehicles, complete, produced on purchased chassis 2014 1,461,443 6.9 N N 1,540 1,540 3362117 Buses and firefighting vehicles, complete, produced on purchased chassis 2013 1,372,469 0.3 N N 2,475 2,475 3362119 Other trucks, complete, produced on purchased chassis 2014 2,738,136 3.2 16,444 16,312 25,329 22,039 3362119 Other trucks, complete, produced on purchased chassis 2013 2,638,854 1.5 22,924 22,840 75,030 75,030 336211W Motor vehicle bodies, nsk, total 2014 516,725 14.2 N N N N 336211W Motor vehicle bodies, nsk, total 2013 492,750 1.5 N N N N 336211X Undistributed motor vehicle bodies 2014 N X 8,004,386 7,126,399 217,750 217,750 336211X Undistributed motor vehicle bodies 2013 N X 8,431,875 7,235,099 235,897 235,897336212 Truck trailers 2014 8,875,703 1.1 1,403,593 1,344,969 1,437,007 1,436,997336212 Truck trailers 2013 7,853,831 0.5 1,540,763 1,500,417 1,064,911 1,064,911 3362121 Truck trailers, with axle rating of 10,000 lb or more 2014 7,815,354 1.0 1,394,805 1,336,277 1,429,415 1,429,406 3362121 Truck trailers, with axle rating of 10,000 lb or more 2013 6,822,052 0.6 1,527,721 1,488,119 1,061,843 1,061,843 3362123 Truck trailers, with axle rating of less than 10,000 lb 2014 780,257 4.8 8,788 8,691 7,592 7,592 3362123 Truck trailers, with axle rating of less than 10,000 lb 2013 724,546 1.4 13,042 12,298 3,068 3,068 336212W Truck trailers, nsk, total 2014 280,091 16.6 N N N N 336212W Truck trailers, nsk, total 2013 307,233 0.3 N N N N336213 Motor homes 2014 4,197,584 1.6 429,438 420,809 210,225 307,802336213 Motor homes 2013 3,417,920 0.1 405,093 397,657 184,502 272,714 3362130 Motor homes, produced on purchased chassis 2014 4,197,584 1.6 429,438 420,809 210,225 307,802 3362130 Motor homes, produced on purchased chassis 2013 3,417,920 0.1 405,093 397,657 184,502 272,714
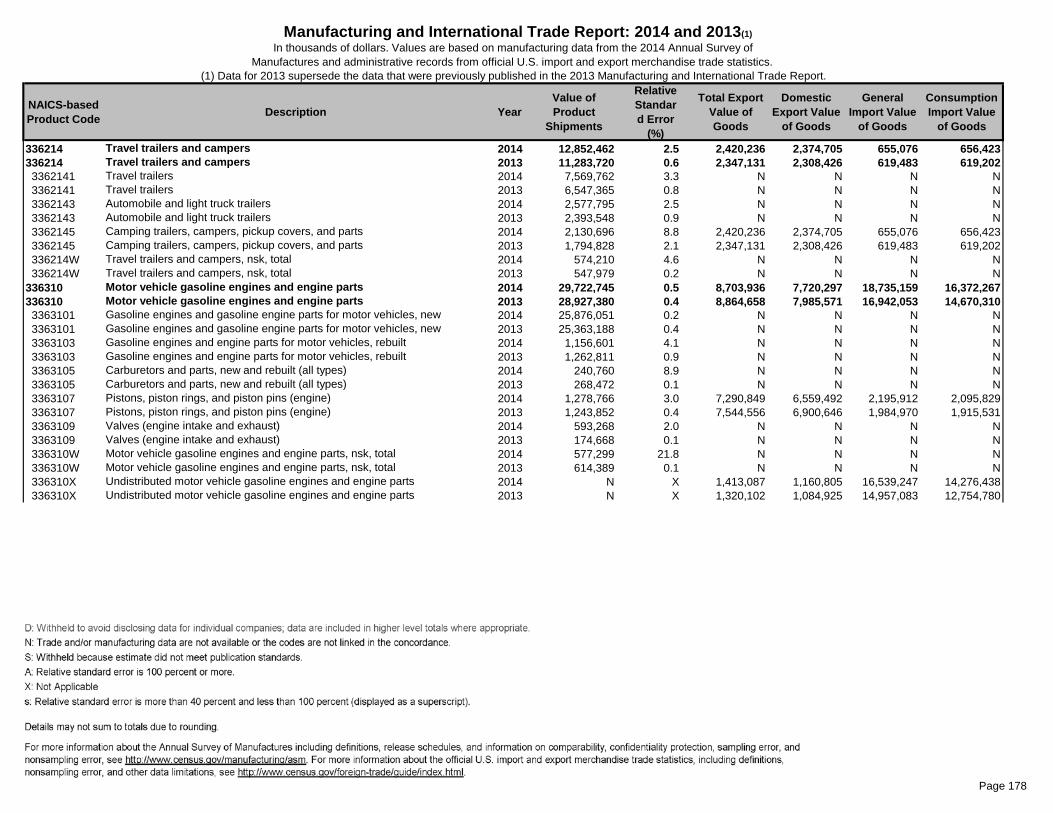
Table
Page 178
NAICS-based Product Code Description Year
Value of Product
Shipments
Relative Standard Error
(%)
Total Export Value of Goods
Domestic Export Value
of Goods
General Import Value
of Goods
Consumption Import Value
of Goods
Manufacturing and International Trade Report: 2014 and 2013(1)In thousands of dollars. Values are based on manufacturing data from the 2014 Annual Survey of
Manufactures and administrative records from official U.S. import and export merchandise trade statistics. (1) Data for 2013 supersede the data that were previously published in the 2013 Manufacturing and International Trade Report.
336214 Travel trailers and campers 2014 12,852,462 2.5 2,420,236 2,374,705 655,076 656,423336214 Travel trailers and campers 2013 11,283,720 0.6 2,347,131 2,308,426 619,483 619,202 3362141 Travel trailers 2014 7,569,762 3.3 N N N N 3362141 Travel trailers 2013 6,547,365 0.8 N N N N 3362143 Automobile and light truck trailers 2014 2,577,795 2.5 N N N N 3362143 Automobile and light truck trailers 2013 2,393,548 0.9 N N N N 3362145 Camping trailers, campers, pickup covers, and parts 2014 2,130,696 8.8 2,420,236 2,374,705 655,076 656,423 3362145 Camping trailers, campers, pickup covers, and parts 2013 1,794,828 2.1 2,347,131 2,308,426 619,483 619,202 336214W Travel trailers and campers, nsk, total 2014 574,210 4.6 N N N N 336214W Travel trailers and campers, nsk, total 2013 547,979 0.2 N N N N336310 Motor vehicle gasoline engines and engine parts 2014 29,722,745 0.5 8,703,936 7,720,297 18,735,159 16,372,267336310 Motor vehicle gasoline engines and engine parts 2013 28,927,380 0.4 8,864,658 7,985,571 16,942,053 14,670,310 3363101 Gasoline engines and gasoline engine parts for motor vehicles, new 2014 25,876,051 0.2 N N N N 3363101 Gasoline engines and gasoline engine parts for motor vehicles, new 2013 25,363,188 0.4 N N N N 3363103 Gasoline engines and engine parts for motor vehicles, rebuilt 2014 1,156,601 4.1 N N N N 3363103 Gasoline engines and engine parts for motor vehicles, rebuilt 2013 1,262,811 0.9 N N N N 3363105 Carburetors and parts, new and rebuilt (all types) 2014 240,760 8.9 N N N N 3363105 Carburetors and parts, new and rebuilt (all types) 2013 268,472 0.1 N N N N 3363107 Pistons, piston rings, and piston pins (engine) 2014 1,278,766 3.0 7,290,849 6,559,492 2,195,912 2,095,829 3363107 Pistons, piston rings, and piston pins (engine) 2013 1,243,852 0.4 7,544,556 6,900,646 1,984,970 1,915,531 3363109 Valves (engine intake and exhaust) 2014 593,268 2.0 N N N N 3363109 Valves (engine intake and exhaust) 2013 174,668 0.1 N N N N 336310W Motor vehicle gasoline engines and engine parts, nsk, total 2014 577,299 21.8 N N N N 336310W Motor vehicle gasoline engines and engine parts, nsk, total 2013 614,389 0.1 N N N N 336310X Undistributed motor vehicle gasoline engines and engine parts 2014 N X 1,413,087 1,160,805 16,539,247 14,276,438 336310X Undistributed motor vehicle gasoline engines and engine parts 2013 N X 1,320,102 1,084,925 14,957,083 12,754,780

Table
Page 179
NAICS-based Product Code Description Year
Value of Product
Shipments
Relative Standard Error
(%)
Total Export Value of Goods
Domestic Export Value
of Goods
General Import Value
of Goods
Consumption Import Value
of Goods
Manufacturing and International Trade Report: 2014 and 2013(1)In thousands of dollars. Values are based on manufacturing data from the 2014 Annual Survey of
Manufactures and administrative records from official U.S. import and export merchandise trade statistics. (1) Data for 2013 supersede the data that were previously published in the 2013 Manufacturing and International Trade Report.
336320 Motor vehicle electrical and electronic equipment 2014 21,383,544 0.5 6,489,709 4,337,727 18,729,484 18,349,352336320 Motor vehicle electrical and electronic equipment 2013 19,809,508 0.5 6,245,486 4,244,265 16,870,330 16,513,432 3363201 Vehicular lighting equipment, electric (including parts and accessories) 2014 4,393,782 0.3 1,596,576 1,233,750 3,787,947 3,690,891 3363201 Vehicular lighting equipment, electric (including parts and accessories) 2013 3,672,658 0.1 1,455,240 1,169,388 3,109,624 3,036,607 3363202 Ignition harness and cable sets 2014 1,061,948 4.8 114,155 101,848 552,200 544,489 3363202 Ignition harness and cable sets 2013 1,018,679 3.8 86,290 75,388 558,842 554,152 3363203 Battery charging alternators, generators, and regulators 2014 1,963,189 1.5 904,424 664,366 1,282,860 1,238,868 3363203 Battery charging alternators, generators, and regulators 2013 1,676,398 4.5 888,357 662,818 1,236,839 1,202,467 3363205 Cranking motors (starters) 2014 2,962,916 0.4 610,884 464,863 1,094,662 1,051,682 3363205 Cranking motors (starters) 2013 2,777,987 0.0 552,663 412,053 1,006,053 980,097 3363207 Spark plugs (all types) 2014 205,380 1.6 246,593 173,934 527,547 524,753 3363207 Spark plugs (all types) 2013 192,624 0.0 227,803 156,452 498,725 495,031 3363209 All other miscellaneous complete engine electrical equipment 2014 957,644 5.8 2,456,647 1,323,126 10,376,219 10,211,467 3363209 All other miscellaneous complete engine electrical equipment 2013 880,409 0.5 2,489,338 1,393,054 9,458,064 9,272,870 336320A Parts for engine electrical and electronic equipment 2014 943,460 0.9 20,334 17,449 1,159 1,159 336320A Parts for engine electrical and electronic equipment 2013 953,954 0.1 17,119 14,515 683 681 336320D Motor vehicle electrical and electronic equipment 2014 8,233,487 0.8 540,096 358,390 1,106,890 1,086,043 336320D Motor vehicle electrical and electronic equipment 2013 8,004,417 0.6 528,676 360,597 1,001,500 971,528 336320W Motor vehicle electrical and electronic equipment, nsk, total 2014 661,739 5.3 N N N N 336320W Motor vehicle electrical and electronic equipment, nsk, total 2013 632,382 0.0 N N N N336330 Motor vehicle steering and suspension components (except springs) 2014 14,055,973 1.2 11,383,586 9,906,940 16,945,292 14,822,622336330 Motor vehicle steering and suspension components (except springs) 2013 11,741,618 0.3 11,520,167 9,885,304 15,854,817 14,204,283 3363300 Motor vehicle steering and suspension components (excluding spring), new
and rebuilt2014 14,055,973 1.2 11,383,586 9,906,940 16,945,292 14,822,622
3363300 Motor vehicle steering and suspension components (excluding spring), new and rebuilt
2013 11,741,618 0.3 11,520,167 9,885,304 15,854,817 14,204,283

Table
Page 180
NAICS-based Product Code Description Year
Value of Product
Shipments
Relative Standard Error
(%)
Total Export Value of Goods
Domestic Export Value
of Goods
General Import Value
of Goods
Consumption Import Value
of Goods
Manufacturing and International Trade Report: 2014 and 2013(1)In thousands of dollars. Values are based on manufacturing data from the 2014 Annual Survey of
Manufactures and administrative records from official U.S. import and export merchandise trade statistics. (1) Data for 2013 supersede the data that were previously published in the 2013 Manufacturing and International Trade Report.
336340 Motor vehicle brake systems 2014 9,958,228 0.8 3,046,479 2,508,354 5,054,872 4,850,353336340 Motor vehicle brake systems 2013 9,701,878 0.5 2,873,931 2,328,025 4,521,635 4,369,150 3363401 Motor vehicle brake parts and assemblies, new 2014 9,214,953 0.9 644,757 539,133 1,485,903 1,400,483 3363401 Motor vehicle brake parts and assemblies, new 2013 8,842,407 0.6 620,928 520,778 1,242,809 1,199,474 3363403 Motor vehicle brake parts and assemblies, rebuilt 2014 645,943 0.1 2,401,722 1,969,221 3,373,701 3,254,742 3363403 Motor vehicle brake parts and assemblies, rebuilt 2013 769,344 0.4 2,253,003 1,807,247 3,097,237 2,988,083 336340W Motor vehicle brake systems, nsk, total 2014 97,332 0.3 N N N N 336340W Motor vehicle brake systems, nsk, total 2013 90,127 0.0 N N N N 336340X Undistributed motor vehicle brake systems 2014 N X N N 195,267 195,129 336340X Undistributed motor vehicle brake systems 2013 N X N N 181,589 181,593336350 Motor vehicle transmission and power train parts 2014 40,574,053 1.8 2,833,215 2,541,986 8,799,547 8,334,939336350 Motor vehicle transmission and power train parts 2013 37,342,176 1.0 2,499,907 2,235,591 8,159,584 7,782,377 3363501 Motor vehicle drive train components, excluding wheels and brakes, new 2014 38,983,037 1.9 2,139,342 1,960,402 8,799,547 8,334,939 3363501 Motor vehicle drive train components, excluding wheels and brakes, new 2013 36,438,757 1.0 1,817,333 1,687,279 8,159,584 7,782,377 3363503 Motor vehicle drive train components, rebuilt 2014 1,072,568 1.2 693,872 581,584 N N 3363503 Motor vehicle drive train components, rebuilt 2013 390,364 1.6 682,574 548,312 N N 336350W Motor vehicle transmission and power train parts, nsk, total 2014 518,447 16.2 N N N N 336350W Motor vehicle transmission and power train parts, nsk, total 2013 513,054 0.0 N N N N336360 Motor vehicle seating and interior trim 2014 27,723,446 0.5 2,539,532 1,981,960 7,162,521 7,111,974336360 Motor vehicle seating and interior trim 2013 24,583,631 0.8 2,292,372 1,769,022 6,234,803 6,196,613 3363601 Automobile trimmings 2014 8,519,996 1.2 N N N N 3363601 Automobile trimmings 2013 7,910,112 1.4 N N N N 3363602 Fabricated seat and safety belts, including shoulder harnesses (excluding 2014 4,257,370 1.5 N N N N 3363602 Fabricated seat and safety belts, including shoulder harnesses (excluding 2013 3,776,666 2.4 N N N N 3363603 Seats for public conveyance and aircraft 2014 10,729,600 0.7 547,844 534,206 742,658 742,622 3363603 Seats for public conveyance and aircraft 2013 9,089,616 1.4 553,193 546,423 539,962 539,973 3363605 Fabricated automobile seat covers and tire covers 2014 507,291 5.5 N N 110,383 108,271 3363605 Fabricated automobile seat covers and tire covers 2013 474,893 1.1 N N 66,784 65,440 3363607 Metal motor vehicle seat frames 2014 3,089,741 1.3 N N 26,410 26,408 3363607 Metal motor vehicle seat frames 2013 2,827,324 1.8 N N 22,067 22,067 336360W Motor vehicle seating and interior trim, nsk, total 2014 619,447 0.9 N N N N 336360W Motor vehicle seating and interior trim, nsk, total 2013 505,020 0.0 N N N N 336360X Undistributed motor vehicle seating and interior trim 2014 N X 1,991,688 1,447,754 6,283,069 6,234,673 336360X Undistributed motor vehicle seating and interior trim 2013 N X 1,739,179 1,222,599 5,605,991 5,569,134

Table
Page 181
NAICS-based Product Code Description Year
Value of Product
Shipments
Relative Standard Error
(%)
Total Export Value of Goods
Domestic Export Value
of Goods
General Import Value
of Goods
Consumption Import Value
of Goods
Manufacturing and International Trade Report: 2014 and 2013(1)In thousands of dollars. Values are based on manufacturing data from the 2014 Annual Survey of
Manufactures and administrative records from official U.S. import and export merchandise trade statistics. (1) Data for 2013 supersede the data that were previously published in the 2013 Manufacturing and International Trade Report.
336370 Motor vehicle metal stampings 2014 31,786,869 0.6 1,523,307 1,490,290 569,437 557,152336370 Motor vehicle metal stampings 2013 29,577,558 0.6 1,536,601 1,499,133 553,763 549,118 3363700 Automotive job stampings (truck, bus, and passenger car) 2014 31,786,869 0.6 1,523,307 1,490,290 569,437 557,152 3363700 Automotive job stampings (truck, bus, and passenger car) 2013 29,577,558 0.6 1,536,601 1,499,133 553,763 549,118336390 Other motor vehicle parts 2014 60,616,810 1.1 15,662,612 13,913,485 33,381,051 32,293,368336390 Other motor vehicle parts 2013 55,982,799 0.4 15,402,694 13,834,264 30,773,729 30,056,678 3363901 Filters for internal combustion engines and motor vehicles, new 2014 3,790,804 1.6 1,442,348 1,280,485 1,132,073 1,098,349 3363901 Filters for internal combustion engines and motor vehicles, new 2013 3,512,737 3.0 1,324,550 1,194,598 1,046,439 1,018,199 3363902 Motor vehicle air-conditioning systems 2014 5,179,832 1.8 103,955 82,848 1,281,112 1,282,144 3363902 Motor vehicle air-conditioning systems 2013 5,011,982 0.2 94,284 88,437 1,103,278 1,094,524 3363903 Automotive air-conditioning compressors (open-type, with or without motor) 2014 1,398,263 1.0 543,183 459,466 1,049,894 1,093,631 3363903 Automotive air-conditioning compressors (open-type, with or without motor) 2013 1,261,721 0.7 511,771 409,093 1,083,868 1,149,805 3363904 Exhaust system parts, new 2014 13,323,267 3.8 1,478,350 1,425,299 2,285,548 2,208,201 3363904 Exhaust system parts, new 2013 11,686,483 0.6 1,301,696 1,249,697 2,110,310 2,051,589 3363905 Motor vehicle wheels, new 2014 3,487,384 3.7 N N 3,531,555 3,467,814 3363905 Motor vehicle wheels, new 2013 3,317,741 1.3 N N 3,176,895 3,099,054 3363906 Trailer hitches (for travel trailers, automobile trailers, and light-duty truck 2014 207,511 2.0 N N N N 3363906 Trailer hitches (for travel trailers, automobile trailers, and light-duty truck 2013 268,639 3.6 N N N N 3363909 All other motor vehicle parts and accessories, new and rebuilt 2014 31,482,638 1.0 12,094,777 10,665,387 24,100,869 23,143,228 3363909 All other motor vehicle parts and accessories, new and rebuilt 2013 29,302,451 0.5 12,170,393 10,892,439 22,252,939 21,643,507 336390W Other motor vehicle parts, nsk, total 2014 1,747,111 7.2 N N N N 336390W Other motor vehicle parts, nsk, total 2013 1,621,045 0.9 N N N N

Table
Page 182
NAICS-based Product Code Description Year
Value of Product
Shipments
Relative Standard Error
(%)
Total Export Value of Goods
Domestic Export Value
of Goods
General Import Value
of Goods
Consumption Import Value
of Goods
Manufacturing and International Trade Report: 2014 and 2013(1)In thousands of dollars. Values are based on manufacturing data from the 2014 Annual Survey of
Manufactures and administrative records from official U.S. import and export merchandise trade statistics. (1) Data for 2013 supersede the data that were previously published in the 2013 Manufacturing and International Trade Report.
33641X Aerospace products and parts 2014 232,329,279 0.3 113,071,133 102,868,213 N N33641X Aerospace products and parts 2013 217,591,764 0.1 104,990,544 95,716,810 N N
336411 Aircraft 2014 123,029,602 0.1 D D 16,780,586 16,780,586336411 Aircraft 2013 114,711,250 0.1 D D 14,208,604 14,208,604 3364112 Military aircraft (including all aircraft for U.S. military and any other aircraft
built to military specifications)2014 35,641,765 0.1 D D 51,314 51,314
3364112 Military aircraft (including all aircraft for U.S. military and any other aircraft built to military specifications)
2013 35,625,314 0.1 D D 137,451 137,451
3364113 Civilian aircraft 2014 71,486,561 0.1 D D 16,708,710 16,708,710 3364113 Civilian aircraft 2013 63,554,413 0.1 D D 14,047,528 14,047,528 3364115 Modification, conversion, and overhaul of previously accepted aircraft 2014 6,093,797 1.6 D D N N 3364115 Modification, conversion, and overhaul of previously accepted aircraft 2013 6,089,817 1.3 D D N N 3364117 All other aeronautical services on complete aircraft 2014 9,433,066 0.1 D D N N 3364117 All other aeronautical services on complete aircraft 2013 9,099,669 0.2 D D N N 336411W Aircraft, nsk, total 2014 374,413 0.1 D D N N 336411W Aircraft, nsk, total 2013 342,037 1.8 D D N N 336411X Undistributed aircraft 2014 N X D D 20,562 20,562 336411X Undistributed aircraft 2013 N X D D 23,624 23,624336412 Aircraft engines and engine parts 2014 38,976,637 0.8 D D 18,974,496 19,063,031336412 Aircraft engines and engine parts 2013 36,816,742 0.4 D D 17,718,748 17,634,810 3364121 Military aircraft engines (including other aircraft engines built to military
specifications)2014 5,045,799 1.2 D D 129,843 127,306
3364121 Military aircraft engines (including other aircraft engines built to military specifications)
2013 5,183,551 0.8 D D 195,275 195,177
3364123 Civilian aircraft engines 2014 7,583,933 2.1 D D 108,108 107,953 3364123 Civilian aircraft engines 2013 7,071,031 1.5 D D 287,244 287,089 3364125 Aeronautical services on aircraft engines 2014 5,455,558 2.5 D D N N 3364125 Aeronautical services on aircraft engines 2013 6,209,097 0.4 D D N N 3364127 Aircraft engine parts and accessories 2014 20,162,180 1.1 D D N N 3364127 Aircraft engine parts and accessories 2013 17,715,282 0.4 D D N N 336412W Aircraft engines and engine parts, nsk, total 2014 729,167 2.4 D D N N 336412W Aircraft engines and engine parts, nsk, total 2013 637,780 0.7 D D N N 336412X Undistributed aircraft engines and engine parts 2014 N X D D 18,736,545 18,827,772 336412X Undistributed aircraft engines and engine parts 2013 N X D D 17,236,229 17,152,544

Table
Page 183
NAICS-based Product Code Description Year
Value of Product
Shipments
Relative Standard Error
(%)
Total Export Value of Goods
Domestic Export Value
of Goods
General Import Value
of Goods
Consumption Import Value
of Goods
Manufacturing and International Trade Report: 2014 and 2013(1)In thousands of dollars. Values are based on manufacturing data from the 2014 Annual Survey of
Manufactures and administrative records from official U.S. import and export merchandise trade statistics. (1) Data for 2013 supersede the data that were previously published in the 2013 Manufacturing and International Trade Report.
336413 Other aircraft parts and auxiliary equipment 2014 42,050,341 1.1 D D 17,103,411 17,144,257336413 Other aircraft parts and auxiliary equipment 2013 38,728,928 0.5 D D 14,861,995 14,856,117 3364131 Aircraft propellers and helicopter rotors 2014 2,389,154 5.7 D D 228,771 229,013 3364131 Aircraft propellers and helicopter rotors 2013 3,419,547 0.3 D D 229,543 229,658 3364133 Developing and making prototypes of aircraft parts (excluding engines) 2014 3,296,645 5.7 D D N N 3364133 Developing and making prototypes of aircraft parts (excluding engines) 2013 2,965,476 0.2 D D N N 3364136 Aircraft parts and auxiliary equipment, excluding hydraulic and pneumatic
subassemblies and engines2014 33,923,119 1.2 D D 16,874,640 16,915,243
3364136 Aircraft parts and auxiliary equipment, excluding hydraulic and pneumatic subassemblies and engines
2013 30,106,587 0.6 D D 14,632,452 14,626,459
336413W Other aircraft parts and auxiliary equipment, nsk, total 2014 2,441,424 2.9 D D N N 336413W Other aircraft parts and auxiliary equipment, nsk, total 2013 2,237,318 1.2 D D N N336414 Guided missiles and space vehicles 2014 21,944,820 0.6 D D 2,792 2,841336414 Guided missiles and space vehicles 2013 20,907,486 0.1 D D 821 821 3364141 Complete guided missiles 2014 8,528,417 0.0 D D 2,063 2,063 3364141 Complete guided missiles 2013 8,512,837 0.0 D D 0 0 3364143 Developing and making prototypes of complete guided missiles 2014 2,154,138 5.4 D D N N 3364143 Developing and making prototypes of complete guided missiles 2013 2,317,074 0.0 D D N N 3364145 Other services on complete guided missiles 2014 D S D D N N 3364145 Other services on complete guided missiles 2013 D S D D N N 3364147 Complete space vehicles (excluding propulsion systems) 2014 7,519,177 0.0 D D 729 777 3364147 Complete space vehicles (excluding propulsion systems) 2013 6,838,014 0.0 D D 821 821 3364149 Developing and making prototypes of complete space vehicles 2014 419,922 9.2 D D N N 3364149 Developing and making prototypes of complete space vehicles 2013 399,491 0.1 D D N N 336414A All other services on complete space vehicles 2014 1,966,326 0.0 D D N N 336414A All other services on complete space vehicles 2013 1,744,428 0.1 D D N N 336414W Guided missiles and space vehicles, nsk, total 2014 D S D D N N 336414W Guided missiles and space vehicles, nsk, total 2013 D S D D N N

Table
Page 184
NAICS-based Product Code Description Year
Value of Product
Shipments
Relative Standard Error
(%)
Total Export Value of Goods
Domestic Export Value
of Goods
General Import Value
of Goods
Consumption Import Value
of Goods
Manufacturing and International Trade Report: 2014 and 2013(1)In thousands of dollars. Values are based on manufacturing data from the 2014 Annual Survey of
Manufactures and administrative records from official U.S. import and export merchandise trade statistics. (1) Data for 2013 supersede the data that were previously published in the 2013 Manufacturing and International Trade Report.
336415 Guided missile and space vehicle propulsion units and propulsion unit 2014 3,470,881 0.6 D D 493,031 493,025336415 Guided missile and space vehicle propulsion units and propulsion unit 2013 3,669,297 0.3 D D 442,690 442,690 3364151 Complete missiles, space vehicle engines, and propulsion units 2014 1,990,350 0.2 D D 160,840 160,840 3364151 Complete missiles, space vehicle engines, and propulsion units 2013 2,068,527 0.5 D D 94,787 94,787 3364153 Developing and making prototypes of complete missiles, space vehicle
engines, and propulsion units2014 D S D D N N
3364153 Developing and making prototypes of complete missiles, space vehicle engines, and propulsion units
2013 704,445 0.0 D D N N
3364155 Other services on complete missiles, space vehicle engines, and propulsion 2014 D S D D N N 3364155 Other services on complete missiles, space vehicle engines, and propulsion 2013 420,151 0.0 D D N N 3364157 Missile and space vehicle engine and propulsion parts and accessories 2014 470,356 4.0 D D 332,191 332,186 3364157 Missile and space vehicle engine and propulsion parts and accessories 2013 469,030 0.9 D D 347,903 347,903 336415W Guided missile and space vehicle propulsion units and propulsion unit parts,
nsk, total2014 D S D D N N
336415W Guided missile and space vehicle propulsion units and propulsion unit parts, nsk, total
2013 7,145 0.0 D D N N
336419 Other guided missile and space vehicle parts and auxiliary equipment 2014 2,856,998 4.5 D D 89,860 89,860336419 Other guided missile and space vehicle parts and auxiliary equipment 2013 2,758,061 2.4 D D 138,611 138,611 3364191 Missile and space vehicle components, parts, and subassemblies 2014 2,478,006 5.1 D D 89,860 89,860 3364191 Missile and space vehicle components, parts, and subassemblies 2013 2,426,154 2.7 D D 138,611 138,611 3364193 Developing and making prototypes of missile and space vehicle parts and
components2014 285,275 0.2 D D N N
3364193 Developing and making prototypes of missile and space vehicle parts and components
2013 260,038 1.8 D D N N
336419W Other guided missile and space vehicle parts and auxiliary equipment, nsk, 2014 93,716 12.9 D D N N 336419W Other guided missile and space vehicle parts and auxiliary equipment, nsk, 2013 71,869 0.0 D D N N
33641XX Undistributed aerospace products and parts 2014 N X 113,071,133 102,868,213 N N 33641XX Undistributed aerospace products and parts 2013 N X 104,990,544 95,716,810 N N

Table
Page 185
NAICS-based Product Code Description Year
Value of Product
Shipments
Relative Standard Error
(%)
Total Export Value of Goods
Domestic Export Value
of Goods
General Import Value
of Goods
Consumption Import Value
of Goods
Manufacturing and International Trade Report: 2014 and 2013(1)In thousands of dollars. Values are based on manufacturing data from the 2014 Annual Survey of
Manufactures and administrative records from official U.S. import and export merchandise trade statistics. (1) Data for 2013 supersede the data that were previously published in the 2013 Manufacturing and International Trade Report.
336510 Railroad rolling stock 2014 20,644,721 0.3 3,454,373 3,328,157 1,394,239 1,411,252336510 Railroad rolling stock 2013 18,563,846 0.3 3,408,005 3,295,070 1,184,748 1,184,614 3365102 Locomotives, new and rebuilt, including parts (excluding engines) 2014 11,211,898 0.3 1,160,877 1,121,312 214,044 249,166 3365102 Locomotives, new and rebuilt, including parts (excluding engines) 2013 10,125,784 0.1 1,300,978 1,260,556 187,832 187,832 3365103 Train and train cars, freight and passenger, new, excluding parts 2014 5,402,621 0.8 472,146 454,606 36,702 36,702 3365103 Train and train cars, freight and passenger, new, excluding parts 2013 4,621,441 0.6 436,103 426,048 10,840 10,840 3365105 Cars (street, subway, trolley, and rapid transit), rebuilt (including parts) and
railway maintenance of equipment and parts (including parts and other work 2014 3,784,688 1.2 1,821,349 1,752,240 1,143,492 1,125,384
3365105 Cars (street, subway, trolley, and rapid transit), rebuilt (including parts) and railway maintenance of equipment and parts (including parts and other work
2013 3,594,823 1.5 1,670,924 1,608,466 986,075 985,941
336510W Railroad rolling stock, nsk, total 2014 245,515 1.5 N N N N 336510W Railroad rolling stock, nsk, total 2013 221,797 0.3 N N N N336611 Ships and ship repair 2014 24,581,535 1.3 2,085,208 1,908,035 380,613 660,681336611 Ships and ship repair 2013 25,346,088 0.8 2,026,182 1,956,908 791,012 1,687,037 3366111 Ships, barges, and platforms, nonpropelled, new construction 2014 3,485,310 1.9 178,094 156,352 62,256 62,251 3366111 Ships, barges, and platforms, nonpropelled, new construction 2013 3,308,240 0.8 771,733 758,034 87,712 310,278 3366113 Ships (including combat ships, troop transport vessels, fleet auxiliaries, and
service craft), self-propelled, military, new construction2014 11,585,804 1.3 297,162 297,162 37 70,338
3366113 Ships (including combat ships, troop transport vessels, fleet auxiliaries, and service craft), self-propelled, military, new construction
2013 12,715,124 0.1 30,000 30,000 0 45,540
3366116 Ships, self-propelled, nonmilitary, new construction 2014 2,328,887 3.2 1,349,085 1,204,427 267,622 455,683 3366116 Ships, self-propelled, nonmilitary, new construction 2013 2,061,358 3.4 935,522 888,653 660,327 1,289,095 3366118 Ship repair, military 2014 4,496,315 4.0 N N N N 3366118 Ship repair, military 2013 4,583,547 4.0 N N N N 336611A Ship repair, nonmilitary 2014 1,456,239 11.0 N N N N 336611A Ship repair, nonmilitary 2013 1,456,442 4.0 N N N N 336611W Ships and ship repair, nsk, total 2014 1,228,981 8.4 N N N N 336611W Ships and ship repair, nsk, total 2013 1,221,377 0.9 N N N N 336611X Undistributed ships and ship repair 2014 N X 260,867 250,094 50,698 72,408 336611X Undistributed ships and ship repair 2013 N X 288,926 280,221 42,973 42,124

Table
Page 186
NAICS-based Product Code Description Year
Value of Product
Shipments
Relative Standard Error
(%)
Total Export Value of Goods
Domestic Export Value
of Goods
General Import Value
of Goods
Consumption Import Value
of Goods
Manufacturing and International Trade Report: 2014 and 2013(1)In thousands of dollars. Values are based on manufacturing data from the 2014 Annual Survey of
Manufactures and administrative records from official U.S. import and export merchandise trade statistics. (1) Data for 2013 supersede the data that were previously published in the 2013 Manufacturing and International Trade Report.
336612 Boats 2014 7,854,774 1.2 1,167,415 1,100,340 954,465 954,451336612 Boats 2013 7,100,381 1.7 1,147,149 1,100,835 922,132 922,117 3366121 Motorboats, outboard, including commercial and military (excluding sailboats
and lifeboats)2014 3,438,416 1.5 213,765 211,357 37,981 37,981
3366121 Motorboats, outboard, including commercial and military (excluding sailboats and lifeboats)
2013 3,172,512 3.3 218,599 216,265 26,249 26,249
3366123 Motorboats, inboard, cabin cruisers, including commercial and military (excluding sailboats and lifeboats)
2014 1,580,470 3.3 539,231 496,235 680,190 680,190
3366123 Motorboats, inboard, cabin cruisers, including commercial and military (excluding sailboats and lifeboats)
2013 1,438,844 0.8 506,307 488,716 666,835 666,835
3366125 Inboard-outdrive boats, including commercial and military (excluding sailboats and lifeboats)
2014 1,323,152 2.8 306,070 298,403 16,102 16,102
3366125 Inboard-outdrive boats, including commercial and military (excluding sailboats and lifeboats)
2013 1,154,778 4.6 308,598 297,071 28,233 28,233
3366128 Boats, all other types, excluding military and commercial 2014 574,615 5.7 108,349 94,345 220,192 220,178 3366128 Boats, all other types, excluding military and commercial 2013 470,813 3.6 113,645 98,782 200,815 200,801 336612W Boats, nsk, total 2014 938,120 3.8 N N N N 336612W Boats, nsk, total 2013 863,434 0.1 N N N N336991 Motorcycles, bicycles, and parts 2014 6,089,067 3.1 2,288,903 2,073,581 4,762,053 4,820,907336991 Motorcycles, bicycles, and parts 2013 6,027,963 0.6 2,254,388 2,026,839 4,786,767 4,774,795 3369912 Cycles, including parts (excluding children's two-wheel sidewalk cycles with
solid or semipneumatic tires)2014 830,174 17.0 114,528 70,621 1,519,815 1,518,181
3369912 Cycles, including parts (excluding children's two-wheel sidewalk cycles with solid or semipneumatic tires)
2013 708,228 5.1 114,982 69,920 1,484,053 1,483,385
3369913 Motorcycles, including three-wheel, motorbikes, motor scooters, mopeds, and parts (including sidecars)
2014 4,932,671 2.4 1,834,063 1,708,097 2,753,568 2,814,075
3369913 Motorcycles, including three-wheel, motorbikes, motor scooters, mopeds, and parts (including sidecars)
2013 5,032,933 0.2 1,795,505 1,649,426 2,828,802 2,817,970
336991W Motorcycles, bicycles, and parts, nsk, total 2014 326,222 0.0 N N N N 336991W Motorcycles, bicycles, and parts, nsk, total 2013 286,801 0.1 N N N N 336991X Undistributed motorcycles, bicycles, and parts 2014 N X 340,312 294,863 488,669 488,651 336991X Undistributed motorcycles, bicycles, and parts 2013 N X 343,901 307,494 473,913 473,440

Table
Page 187
NAICS-based Product Code Description Year
Value of Product
Shipments
Relative Standard Error
(%)
Total Export Value of Goods
Domestic Export Value
of Goods
General Import Value
of Goods
Consumption Import Value
of Goods
Manufacturing and International Trade Report: 2014 and 2013(1)In thousands of dollars. Values are based on manufacturing data from the 2014 Annual Survey of
Manufactures and administrative records from official U.S. import and export merchandise trade statistics. (1) Data for 2013 supersede the data that were previously published in the 2013 Manufacturing and International Trade Report.
336992 Military armored vehicles, tanks, and tank components 2014 2,754,002 1.7 875,946 856,222 256,312 256,312336992 Military armored vehicles, tanks, and tank components 2013 3,916,169 2.7 1,036,016 1,029,335 590,008 590,008 3369920 Military armored vehicles, tanks, and tank components 2014 2,754,002 1.7 875,946 856,222 256,312 256,312 3369920 Military armored vehicles, tanks, and tank components 2013 3,916,169 2.7 1,036,016 1,029,335 590,008 590,008336999 All other transportation equipment 2014 8,004,477 0.9 882,783 827,140 1,189,922 1,228,211336999 All other transportation equipment 2013 7,416,097 0.7 861,546 813,267 1,202,527 1,240,550 3369991 Self-propelled golf carts and industrial in-plant personnel carriers, including 2014 1,076,555 0.0 138,826 138,437 6,763 11,933 3369991 Self-propelled golf carts and industrial in-plant personnel carriers, including 2013 887,232 0.0 142,010 136,194 6,682 11,189 3369994 All-terrain vehicles and parts 2014 4,551,010 0.5 N N 277,934 311,078 3369994 All-terrain vehicles and parts 2013 4,389,545 1.2 N N 251,677 285,647 3369996 All other miscellaneous transportation equipment 2014 1,760,735 3.8 743,957 688,702 905,225 905,199 3369996 All other miscellaneous transportation equipment 2013 1,663,033 0.4 719,536 677,073 944,168 943,714 336999W All other transportation equipment, nsk, total 2014 616,178 0.0 N N N N 336999W All other transportation equipment, nsk, total 2013 476,287 0.0 N N N N

Table
Page 188
NAICS-based Product Code Description Year
Value of Product
Shipments
Relative Standard Error
(%)
Total Export Value of Goods
Domestic Export Value
of Goods
General Import Value
of Goods
Consumption Import Value
of Goods
Manufacturing and International Trade Report: 2014 and 2013(1)In thousands of dollars. Values are based on manufacturing data from the 2014 Annual Survey of
Manufactures and administrative records from official U.S. import and export merchandise trade statistics. (1) Data for 2013 supersede the data that were previously published in the 2013 Manufacturing and International Trade Report.
337110 Wood kitchen cabinets and countertops 2014 12,333,131 1.8 113,565 107,975 886,328 883,416337110 Wood kitchen cabinets and countertops 2013 12,028,185 0.7 118,310 112,139 736,610 736,608 3371101 Wood kitchen cabinets and related cabinetwork, stock line, for permanent
installation2014 4,986,311 2.8 113,565 107,975 886,328 883,416
3371101 Wood kitchen cabinets and related cabinetwork, stock line, for permanent installation
2013 4,321,378 0.8 118,310 112,139 736,610 736,608
3371104 Wood custom kitchen cabinets and related cabinetwork for permanent installation, excluding those sold directly to the customer at retail
2014 2,083,977 4.9 N N N N
3371104 Wood custom kitchen cabinets and related cabinetwork for permanent installation, excluding those sold directly to the customer at retail
2013 1,949,692 1.5 N N N N
3371107 Bathroom vanities and related cabinetwork for permanent installation, excluding those sold directly to the customer at retail
2014 810,663 3.2 N N N N
3371107 Bathroom vanities and related cabinetwork for permanent installation, excluding those sold directly to the customer at retail
2013 759,971 3.3 N N N N
337110B Wood kitchen cabinet and counter tops, wood and plastics laminated 2014 1,093,911 4.9 N N N N 337110B Wood kitchen cabinet and counter tops, wood and plastics laminated 2013 945,057 3.8 N N N N 337110F Wood bathroom vanity tops, wood and plastics laminated 2014 109,354 15.1 N N N N 337110F Wood bathroom vanity tops, wood and plastics laminated 2013 120,451 9.8 N N N N 337110H Wood kitchen cabinets, bathroom vanities, and related cabinetwork, custom,
for permanent installation, sold directly to the customer at retail2014 1,745,887 5.4 N N N N
337110H Wood kitchen cabinets, bathroom vanities, and related cabinetwork, custom, for permanent installation, sold directly to the customer at retail
2013 2,536,723 1.3 N N N N
337110W Wood kitchen cabinets and countertops, nsk, total 2014 1,503,030 4.9 N N N N 337110W Wood kitchen cabinets and countertops, nsk, total 2013 1,394,914 2.3 N N N N

Table
Page 189
NAICS-based Product Code Description Year
Value of Product
Shipments
Relative Standard Error
(%)
Total Export Value of Goods
Domestic Export Value
of Goods
General Import Value
of Goods
Consumption Import Value
of Goods
Manufacturing and International Trade Report: 2014 and 2013(1)In thousands of dollars. Values are based on manufacturing data from the 2014 Annual Survey of
Manufactures and administrative records from official U.S. import and export merchandise trade statistics. (1) Data for 2013 supersede the data that were previously published in the 2013 Manufacturing and International Trade Report.
337121 Upholstered household furniture 2014 9,360,027 1.5 640,457 539,154 3,731,622 3,730,759337121 Upholstered household furniture 2013 9,146,646 0.4 611,998 518,642 3,401,045 3,399,299 3371211 Upholstered household furniture, excluding stock line dual-purpose sleep 2014 8,129,950 1.7 593,544 507,950 3,533,287 3,532,396 3371211 Upholstered household furniture, excluding stock line dual-purpose sleep 2013 8,021,285 0.5 576,490 494,361 3,218,927 3,217,630 3371214 Dual-purpose sleep furniture (including convertible sofas, jackknife sofa and
chair beds, studio couches, and futons shipped with frames), excluding custom sold directly to the customer at retail
2014 498,278 3.5 46,913 31,205 198,335 198,363
3371214 Dual-purpose sleep furniture (including convertible sofas, jackknife sofa and chair beds, studio couches, and futons shipped with frames), excluding custom sold directly to the customer at retail
2013 476,932 1.6 35,509 24,280 182,118 181,669
337121W Upholstered household furniture, nsk, total 2014 731,799 3.4 N N N N 337121W Upholstered household furniture, nsk, total 2013 648,428 0.1 N N N N

Table
Page 190
NAICS-based Product Code Description Year
Value of Product
Shipments
Relative Standard Error
(%)
Total Export Value of Goods
Domestic Export Value
of Goods
General Import Value
of Goods
Consumption Import Value
of Goods
Manufacturing and International Trade Report: 2014 and 2013(1)In thousands of dollars. Values are based on manufacturing data from the 2014 Annual Survey of
Manufactures and administrative records from official U.S. import and export merchandise trade statistics. (1) Data for 2013 supersede the data that were previously published in the 2013 Manufacturing and International Trade Report.
337122 Nonupholstered wood household furniture 2014 3,852,978 2.9 239,729 162,400 4,365,421 4,365,988337122 Nonupholstered wood household furniture 2013 3,877,252 1.2 231,625 159,131 4,097,027 4,083,561 3371221 Nonupholstered wood den, library, family and living room furniture, excluding
custom sold directly to the customer at retail2014 1,049,605 6.3 N N N N
3371221 Nonupholstered wood den, library, family and living room furniture, excluding custom sold directly to the customer at retail
2013 955,100 3.1 N N N N
3371224 Nonupholstered wood dining room and kitchen furniture (excluding kitchen cabinets), excluding custom sold directly to the customer at retail
2014 472,372 6.3 17,807 14,674 836,269 837,205
3371224 Nonupholstered wood dining room and kitchen furniture (excluding kitchen cabinets), excluding custom sold directly to the customer at retail
2013 537,808 4.1 15,964 14,406 757,428 754,357
3371228 Nonupholstered wood bedroom furniture, excluding custom sold directly to the customer at retail
2014 918,785 5.0 221,922 147,726 2,889,855 2,888,310
3371228 Nonupholstered wood bedroom furniture, excluding custom sold directly to the customer at retail
2013 979,982 0.9 215,661 144,724 2,716,119 2,710,186
337122A Nonupholstered wood infants' and children's furniture, excluding custom sold directly to the customer at retail
2014 151,602 10.0 N N 186,176 185,838
337122A Nonupholstered wood infants' and children's furniture, excluding custom sold directly to the customer at retail
2013 144,421 0.2 N N 202,105 202,006
337122E Nonupholstered wood household furniture, other types (including outdoor, unpainted, and ready-to-assemble), excluding custom sold directly to the customer at retail
2014 327,642 10.6 N N 6,226 6,226
337122E Nonupholstered wood household furniture, other types (including outdoor, unpainted, and ready-to-assemble), excluding custom sold directly to the customer at retail
2013 296,498 2.1 N N 4,254 4,113
337122H Nonupholstered wood household furniture (excluding kitchen cabinets, bathroom vanities, and related cabinetwork), custom sold directly to the
2014 164,826 11.7 N N N N
337122H Nonupholstered wood household furniture (excluding kitchen cabinets, bathroom vanities, and related cabinetwork), custom sold directly to the
2013 176,743 11.0 N N N N
337122W Nonupholstered wood household furniture, nsk, total 2014 768,147 7.6 N N N N 337122W Nonupholstered wood household furniture, nsk, total 2013 786,700 1.8 N N N N 337122X Undistributed nonupholstered wood household furniture 2014 N X N N 446,895 448,409 337122X Undistributed nonupholstered wood household furniture 2013 N X N N 417,121 412,899

Table
Page 191
NAICS-based Product Code Description Year
Value of Product
Shipments
Relative Standard Error
(%)
Total Export Value of Goods
Domestic Export Value
of Goods
General Import Value
of Goods
Consumption Import Value
of Goods
Manufacturing and International Trade Report: 2014 and 2013(1)In thousands of dollars. Values are based on manufacturing data from the 2014 Annual Survey of
Manufactures and administrative records from official U.S. import and export merchandise trade statistics. (1) Data for 2013 supersede the data that were previously published in the 2013 Manufacturing and International Trade Report.
337124 Metal household furniture 2014 2,067,775 2.4 120,092 91,787 3,476,296 3,471,898337124 Metal household furniture 2013 2,035,926 0.6 102,279 76,193 3,251,510 3,240,276 3371241 Metal household furniture, dining room and kitchen, including padded and
plain seating, tables, cabinets, and carts2014 666,478 5.6 N N 598,417 597,663
3371241 Metal household furniture, dining room and kitchen, including padded and plain seating, tables, cabinets, and carts
2013 663,966 0.4 N N 517,205 516,239
3371244 Metal household furniture, outdoor and casual (including beach, lawn, garden, and porch), nonupholstered, assembled and ready-to-assemble
2014 574,275 2.1 N N 1,049,338 1,048,151
3371244 Metal household furniture, outdoor and casual (including beach, lawn, garden, and porch), nonupholstered, assembled and ready-to-assemble
2013 529,724 1.8 N N 985,559 983,169
3371248 Metal household furniture, other types, nonupholstered 2014 664,529 3.9 N N 161,124 160,974 3371248 Metal household furniture, other types, nonupholstered 2013 712,293 0.8 N N 183,286 183,203 337124W Metal household furniture, nsk, total 2014 162,493 11.6 N N N N 337124W Metal household furniture, nsk, total 2013 129,943 0.0 N N N N 337124X Undistributed metal household furniture 2014 N X 120,092 91,787 1,667,417 1,665,109 337124X Undistributed metal household furniture 2013 N X 102,279 76,193 1,565,460 1,557,664337125 Household furniture (except wood and metal) 2014 616,772 1.4 180,570 163,897 1,394,092 1,393,039337125 Household furniture (except wood and metal) 2013 650,635 0.5 175,994 162,185 1,218,869 1,216,598 3371250 Household furniture (excluding wood and metal), nonupholstered 2014 616,772 1.4 180,570 163,897 1,394,092 1,393,039 3371250 Household furniture (excluding wood and metal), nonupholstered 2013 650,635 0.5 175,994 162,185 1,218,869 1,216,598

Table
Page 192
NAICS-based Product Code Description Year
Value of Product
Shipments
Relative Standard Error
(%)
Total Export Value of Goods
Domestic Export Value
of Goods
General Import Value
of Goods
Consumption Import Value
of Goods
Manufacturing and International Trade Report: 2014 and 2013(1)In thousands of dollars. Values are based on manufacturing data from the 2014 Annual Survey of
Manufactures and administrative records from official U.S. import and export merchandise trade statistics. (1) Data for 2013 supersede the data that were previously published in the 2013 Manufacturing and International Trade Report.
337127 Institutional furniture 2014 4,519,406 2.3 2,624,428 2,223,083 10,423,826 10,415,974337127 Institutional furniture 2013 4,444,870 0.7 2,483,609 2,106,029 9,788,718 9,765,631 3371271 School furniture (excluding library), excluding stone and concrete 2014 925,309 2.9 N N 104,430 104,400 3371271 School furniture (excluding library), excluding stone and concrete 2013 892,818 1.8 N N 113,296 113,243 3371275 Public building and related furniture (excluding bar, bowling center, cafeteria,
restaurant, and school)2014 1,183,513 3.7 437,059 389,109 549,939 550,087
3371275 Public building and related furniture (excluding bar, bowling center, cafeteria, restaurant, and school)
2013 1,327,310 1.0 386,801 349,155 539,971 538,895
3371278 Public bar, bowling center, cafeteria, and restaurant furniture 2014 773,539 5.7 38,630 35,332 3,514 3,374 3371278 Public bar, bowling center, cafeteria, and restaurant furniture 2013 726,871 2.2 44,496 42,810 3,763 3,709 337127B Institutional furniture, other types 2014 1,354,466 5.5 367,821 322,052 787,875 785,852 337127B Institutional furniture, other types 2013 1,234,148 1.2 333,849 288,658 758,535 758,454 337127W Institutional furniture, nsk, total 2014 282,580 9.9 N N N N 337127W Institutional furniture, nsk, total 2013 263,724 3.2 N N N N 337127X Undistributed institutional furniture 2014 N X 1,780,918 1,476,590 8,978,066 8,972,262 337127X Undistributed institutional furniture 2013 N X 1,718,463 1,425,406 8,373,152 8,351,330337211 Wood office furniture 2014 2,634,854 2.4 162,594 136,733 849,206 848,889337211 Wood office furniture 2013 2,562,087 1.5 173,107 147,445 814,269 814,331 3372111 Wood office seating, including upholstered 2014 799,493 3.8 N N N N 3372111 Wood office seating, including upholstered 2013 789,012 1.9 N N N N 3372114 Wood office desks and desk extensions 2014 644,431 5.0 N N N N 3372114 Wood office desks and desk extensions 2013 621,977 2.6 N N N N 3372117 Wood office files, storage units, and tables 2014 619,484 5.4 N N N N 3372117 Wood office files, storage units, and tables 2013 651,970 3.8 N N N N 337211A Wood office furniture, other types (including panel and desking system
accessories and components)2014 382,679 7.4 N N N N
337211A Wood office furniture, other types (including panel and desking system accessories and components)
2013 346,144 6.0 N N N N
337211W Wood office furniture, nsk, total 2014 188,766 6.8 N N N N 337211W Wood office furniture, nsk, total 2013 152,985 0.3 N N N N 337211X Undistributed wood office furniture 2014 N X 162,594 136,733 849,206 848,889 337211X Undistributed wood office furniture 2013 N X 173,107 147,445 814,269 814,331

Table
Page 193
NAICS-based Product Code Description Year
Value of Product
Shipments
Relative Standard Error
(%)
Total Export Value of Goods
Domestic Export Value
of Goods
General Import Value
of Goods
Consumption Import Value
of Goods
Manufacturing and International Trade Report: 2014 and 2013(1)In thousands of dollars. Values are based on manufacturing data from the 2014 Annual Survey of
Manufactures and administrative records from official U.S. import and export merchandise trade statistics. (1) Data for 2013 supersede the data that were previously published in the 2013 Manufacturing and International Trade Report.
337212 Custom architectural woodwork and millwork 2014 5,888,368 1.2 N N 21,392 21,392337212 Custom architectural woodwork and millwork 2013 5,994,736 1.1 N N 23,275 23,275 3372120 Custom architectural woodwork, millwork, and fixtures 2014 5,888,368 1.2 N N 21,392 21,392 3372120 Custom architectural woodwork, millwork, and fixtures 2013 5,994,736 1.1 N N 23,275 23,275337214 Office furniture (except wood) 2014 7,159,246 1.1 222,192 201,443 435,936 435,867337214 Office furniture (except wood) 2013 6,688,000 0.5 224,319 208,336 403,777 403,708 3372141 Office seating, including upholstered, excluding wood 2014 1,029,525 2.3 N N N N 3372141 Office seating, including upholstered, excluding wood 2013 961,204 3.4 N N N N 3372144 Office desks and desk extensions, excluding wood 2014 313,602 9.0 N N N N 3372144 Office desks and desk extensions, excluding wood 2013 185,141 0.9 N N N N 3372147 Office files, storage units, and tables, excluding wood 2014 1,385,019 3.5 63,614 57,098 137,250 137,232 3372147 Office files, storage units, and tables, excluding wood 2013 1,356,750 0.6 59,808 58,280 141,015 141,012 337214A Office furniture, other types (including panel and desking systems), excluding 2014 4,284,389 0.9 N N N N 337214A Office furniture, other types (including panel and desking systems), excluding 2013 4,039,565 0.2 N N N N 337214W Office furniture (except wood), nsk, total 2014 146,712 17.1 N N N N 337214W Office furniture (except wood), nsk, total 2013 145,340 0.1 N N N N 337214X Undistributed office furniture (except wood) 2014 N X 158,579 144,345 298,686 298,634 337214X Undistributed office furniture (except wood) 2013 N X 164,511 150,056 262,762 262,696

Table
Page 194
NAICS-based Product Code Description Year
Value of Product
Shipments
Relative Standard Error
(%)
Total Export Value of Goods
Domestic Export Value
of Goods
General Import Value
of Goods
Consumption Import Value
of Goods
Manufacturing and International Trade Report: 2014 and 2013(1)In thousands of dollars. Values are based on manufacturing data from the 2014 Annual Survey of
Manufactures and administrative records from official U.S. import and export merchandise trade statistics. (1) Data for 2013 supersede the data that were previously published in the 2013 Manufacturing and International Trade Report.
337215 Showcases, partitions, shelving, and lockers 2014 6,641,438 1.5 1,692,405 1,369,717 5,895,626 5,900,836337215 Showcases, partitions, shelving, and lockers 2013 6,595,186 0.8 1,598,760 1,325,860 5,335,561 5,339,628 3372151 Lockers, partitions, and shelving (excluding custom), wood 2014 143,575 8.4 N N N N 3372151 Lockers, partitions, and shelving (excluding custom), wood 2013 141,299 2.6 N N N N 3372155 Fixtures (bank, office, and store), wood, excluding custom 2014 708,884 6.1 N N N N 3372155 Fixtures (bank, office, and store), wood, excluding custom 2013 765,293 1.8 N N N N 3372157 Partitions, prefabricated, assembled and knock-down, excluding wood 2014 577,556 3.5 N N N N 3372157 Partitions, prefabricated, assembled and knock-down, excluding wood 2013 471,681 0.9 N N N N 337215A Shelving and lockers, excluding wood 2014 950,165 3.2 N N N N 337215A Shelving and lockers, excluding wood 2013 1,054,724 2.8 N N N N 337215E Storage racks and accessories, excluding wood 2014 1,486,971 2.9 N N N N 337215E Storage racks and accessories, excluding wood 2013 1,338,377 1.4 N N N N 337215G Fixtures (bank, office, and store), excluding wood 2014 1,421,763 2.7 N N N N 337215G Fixtures (bank, office, and store), excluding wood 2013 1,507,138 2.5 N N N N 337215J Furniture frames, wood 2014 351,327 11.7 N N N N 337215J Furniture frames, wood 2013 317,020 1.3 N N N N 337215L Furniture dimensions, hardwood and softwood, and plastic and metal
furniture parts and frames (excluding furniture hardware)2014 564,090 3.3 1,200,330 993,463 4,140,807 4,147,415
337215L Furniture dimensions, hardwood and softwood, and plastic and metal furniture parts and frames (excluding furniture hardware)
2013 514,215 2.1 1,096,705 932,734 3,762,139 3,766,989
337215W Showcases, partitions, shelving, and lockers, nsk, total 2014 437,106 8.0 N N N N 337215W Showcases, partitions, shelving, and lockers, nsk, total 2013 485,440 1.8 N N N N 337215X Undistributed showcases, partitions, shelving, and lockers 2014 N X 492,074 376,255 1,754,819 1,753,420 337215X Undistributed showcases, partitions, shelving, and lockers 2013 N X 502,055 393,126 1,573,422 1,572,639

Table
Page 195
NAICS-based Product Code Description Year
Value of Product
Shipments
Relative Standard Error
(%)
Total Export Value of Goods
Domestic Export Value
of Goods
General Import Value
of Goods
Consumption Import Value
of Goods
Manufacturing and International Trade Report: 2014 and 2013(1)In thousands of dollars. Values are based on manufacturing data from the 2014 Annual Survey of
Manufactures and administrative records from official U.S. import and export merchandise trade statistics. (1) Data for 2013 supersede the data that were previously published in the 2013 Manufacturing and International Trade Report.
337910 Mattresses 2014 8,336,504 1.0 140,543 127,642 477,798 477,630337910 Mattresses 2013 8,097,485 0.5 134,335 122,237 431,419 431,046 3379101 Mattresses, innerspring (including polyurethane, rubber topper pads, and
mattresses sold as part of Hollywood beds), excluding crib-size2014 4,869,096 1.4 N N 9,924 9,924
3379101 Mattresses, innerspring (including polyurethane, rubber topper pads, and mattresses sold as part of Hollywood beds), excluding crib-size
2013 4,685,344 0.9 N N 10,326 10,270
3379104 Mattresses, other types 2014 1,750,952 1.5 59,719 54,332 379,551 379,487 3379104 Mattresses, other types 2013 1,725,158 0.3 59,436 54,506 345,192 344,956 3379107 Foundations, excluding innerspring units and foundations incorporated into
hybrid-type flotation sleep ensembles and electric adjustable sleep 2014 1,291,603 2.4 12,383 11,852 13,462 13,462
3379107 Foundations, excluding innerspring units and foundations incorporated into hybrid-type flotation sleep ensembles and electric adjustable sleep
2013 1,294,966 0.4 9,112 8,814 14,816 14,810
337910A Sleep system ensembles and mattresses, excluding conventional waterbeds 2014 226,739 0.0 N N N N 337910A Sleep system ensembles and mattresses, excluding conventional waterbeds 2013 172,460 0.2 N N N N 337910W Mattresses, nsk, total 2014 198,115 4.0 N N N N 337910W Mattresses, nsk, total 2013 219,557 0.1 N N N N 337910X Undistributed mattresses 2014 N X 68,442 61,458 74,861 74,757 337910X Undistributed mattresses 2013 N X 65,787 58,917 61,085 61,009337920 Blinds and shades 2014 1,827,640 2.8 63,277 44,556 1,341,707 1,334,679337920 Blinds and shades 2013 1,758,485 1.1 70,915 51,472 1,299,395 1,297,877 3379202 Window shades, including accessories and rollers 2014 1,095,204 3.2 N N N N 3379202 Window shades, including accessories and rollers 2013 1,003,506 1.1 N N N N 3379204 Venetian blinds, including components and parts 2014 258,816 4.2 28,054 22,778 607,776 602,112 3379204 Venetian blinds, including components and parts 2013 290,855 0.5 31,511 27,183 600,319 599,975 3379208 Blinds and shades, other types (including curtain and drapery fixtures, poles,
and rods)2014 401,593 3.7 N N N N
3379208 Blinds and shades, other types (including curtain and drapery fixtures, poles, and rods)
2013 339,286 3.9 N N N N
337920W Blinds and shades, nsk, total 2014 72,027 s 45.1 s N N N N 337920W Blinds and shades, nsk, total 2013 124,839 7.0 N N N N 337920X Undistributed blinds and shades 2014 N X 35,223 21,778 733,931 732,567 337920X Undistributed blinds and shades 2013 N X 39,404 24,289 699,077 697,902

Table
Page 196
NAICS-based Product Code Description Year
Value of Product
Shipments
Relative Standard Error
(%)
Total Export Value of Goods
Domestic Export Value
of Goods
General Import Value
of Goods
Consumption Import Value
of Goods
Manufacturing and International Trade Report: 2014 and 2013(1)In thousands of dollars. Values are based on manufacturing data from the 2014 Annual Survey of
Manufactures and administrative records from official U.S. import and export merchandise trade statistics. (1) Data for 2013 supersede the data that were previously published in the 2013 Manufacturing and International Trade Report.
339112 Surgical and medical instruments 2014 38,847,965 0.8 16,347,443 12,596,916 11,319,113 11,280,452339112 Surgical and medical instruments 2013 38,912,135 0.8 15,806,483 12,219,117 10,623,062 10,573,677 3391120 Surgical and medical instruments 2014 38,847,965 0.8 9,441,035 7,844,479 6,120,948 6,112,729 3391120 Surgical and medical instruments 2013 38,912,135 0.8 9,185,174 7,630,339 5,773,189 5,762,848 339112X Undistributed surgical and medical instruments 2014 N X 6,906,409 4,752,437 5,198,165 5,167,723 339112X Undistributed surgical and medical instruments 2013 N X 6,621,309 4,588,778 4,849,873 4,810,829339113 Surgical appliances and supplies 2014 32,512,306 1.8 10,985,629 9,324,160 12,816,269 12,853,704339113 Surgical appliances and supplies 2013 33,228,583 3.8 10,928,001 9,101,616 12,700,105 12,732,537 3391132 Surgical appliances and supplies, including orthopedic, prosthetic, and 2014 24,136,126 1.9 10,475,785 9,015,895 11,797,450 11,837,287 3391132 Surgical appliances and supplies, including orthopedic, prosthetic, and 2013 24,970,160 5.0 10,425,511 8,797,051 11,709,848 11,746,712 3391134 Hospital beds and specialized hospital furniture 2014 1,703,183 3.8 154,512 124,224 225,850 225,850 3391134 Hospital beds and specialized hospital furniture 2013 1,821,860 1.2 152,904 125,607 241,892 241,574 3391136 Personal safety equipment and clothing, industrial and nonindustrial 2014 4,129,127 4.0 355,332 184,041 792,969 790,568 3391136 Personal safety equipment and clothing, industrial and nonindustrial 2013 4,055,189 2.1 349,586 178,957 748,365 744,251 339113W Surgical appliances and supplies, nsk, total 2014 2,543,870 12.8 N N N N 339113W Surgical appliances and supplies, nsk, total 2013 2,381,373 0.2 N N N N339114 Dental equipment and supplies 2014 4,316,531 1.2 1,397,476 1,285,034 1,282,765 1,282,813339114 Dental equipment and supplies 2013 4,671,132 0.5 1,288,329 1,173,813 1,289,099 1,288,770 3391141 Dental equipment and supplies, professional 2014 3,102,795 1.5 1,397,476 1,285,034 1,282,765 1,282,813 3391141 Dental equipment and supplies, professional 2013 3,323,915 0.7 1,288,329 1,173,813 1,289,099 1,288,770 3391143 Dental equipment and supplies, laboratory 2014 937,580 1.6 N N N N 3391143 Dental equipment and supplies, laboratory 2013 1,089,926 0.5 N N N N 339114W Dental equipment and supplies, nsk, total 2014 276,156 0.7 N N N N 339114W Dental equipment and supplies, nsk, total 2013 257,291 1.0 N N N N

Table
Page 197
NAICS-based Product Code Description Year
Value of Product
Shipments
Relative Standard Error
(%)
Total Export Value of Goods
Domestic Export Value
of Goods
General Import Value
of Goods
Consumption Import Value
of Goods
Manufacturing and International Trade Report: 2014 and 2013(1)In thousands of dollars. Values are based on manufacturing data from the 2014 Annual Survey of
Manufactures and administrative records from official U.S. import and export merchandise trade statistics. (1) Data for 2013 supersede the data that were previously published in the 2013 Manufacturing and International Trade Report.
339115 Ophthalmic goods 2014 5,750,836 1.3 3,380,305 2,646,621 5,087,914 5,078,035339115 Ophthalmic goods 2013 5,963,001 1.4 3,156,133 2,468,011 4,648,329 4,638,212 3391159 Ophthalmic fronts, temples, and focal and contact lenses 2014 3,831,493 1.5 1,397,762 987,913 2,563,967 2,561,867 3391159 Ophthalmic fronts, temples, and focal and contact lenses 2013 3,836,666 1.6 1,375,781 994,851 2,312,179 2,310,061 339115B Ophthalmic goods, other types, including prescription ground eyeglass 2014 1,657,747 2.8 1,982,543 1,658,708 2,523,947 2,516,168 339115B Ophthalmic goods, other types, including prescription ground eyeglass 2013 1,849,591 2.9 1,780,353 1,473,160 2,336,150 2,328,150 339115W Ophthalmic goods, nsk, total 2014 261,596 2.7 N N N N 339115W Ophthalmic goods, nsk, total 2013 276,744 0.5 N N N N339116 Dental laboratory products 2014 4,370,680 1.3 538,185 493,773 413,165 413,167339116 Dental laboratory products 2013 4,487,602 0.8 565,279 527,135 391,805 391,805 3391160 Dental laboratory products 2014 4,370,680 1.3 538,185 493,773 413,165 413,167 3391160 Dental laboratory products 2013 4,487,602 0.8 565,279 527,135 391,805 391,805

Table
Page 198
NAICS-based Product Code Description Year
Value of Product
Shipments
Relative Standard Error
(%)
Total Export Value of Goods
Domestic Export Value
of Goods
General Import Value
of Goods
Consumption Import Value
of Goods
Manufacturing and International Trade Report: 2014 and 2013(1)In thousands of dollars. Values are based on manufacturing data from the 2014 Annual Survey of
Manufactures and administrative records from official U.S. import and export merchandise trade statistics. (1) Data for 2013 supersede the data that were previously published in the 2013 Manufacturing and International Trade Report.
339910 Jewelry and silverware 2014 7,122,979 1.3 35,354,652 8,223,273 39,223,810 39,082,282339910 Jewelry and silverware 2013 7,103,929 0.5 32,518,627 8,199,008 38,390,152 38,258,651 3399101 Jewelry and personal goods, gold and platinum, including engraving,
chasing, or etching (excluding gold and platinum clad or plated to silver and nonprecious metals, or costume)
2014 3,636,101 1.3 10,545,922 4,845,182 6,555,325 6,490,691
3399101 Jewelry and personal goods, gold and platinum, including engraving, chasing, or etching (excluding gold and platinum clad or plated to silver and nonprecious metals, or costume)
2013 3,558,749 0.6 9,962,670 4,778,981 6,999,542 6,943,443
3399102 Jewelry (excluding costume); all other precious metal and types; including silver and silver-clad jewelry; jewelry made of precious stones, semi-precious stones, or pearls; and stamped metal coins
2014 1,110,840 4.5 1,252,252 822,906 3,439,699 3,432,310
3399102 Jewelry (excluding costume); all other precious metal and types; including silver and silver-clad jewelry; jewelry made of precious stones, semi-precious stones, or pearls; and stamped metal coins
2013 1,062,433 1.3 1,155,827 753,698 3,561,988 3,570,578
3399103 Silverware and hollowware, including engraving, chasing, or etching, made of precious solid or clad metal
2014 56,022 7.7 17,740 9,377 57,193 56,967
3399103 Silverware and hollowware, including engraving, chasing, or etching, made of precious solid or clad metal
2013 70,098 1.4 17,505 10,581 60,114 59,428

Table
Page 199
NAICS-based Product Code Description Year
Value of Product
Shipments
Relative Standard Error
(%)
Total Export Value of Goods
Domestic Export Value
of Goods
General Import Value
of Goods
Consumption Import Value
of Goods
Manufacturing and International Trade Report: 2014 and 2013(1)In thousands of dollars. Values are based on manufacturing data from the 2014 Annual Survey of
Manufactures and administrative records from official U.S. import and export merchandise trade statistics. (1) Data for 2013 supersede the data that were previously published in the 2013 Manufacturing and International Trade Report.
3399104 Lapidary work, excluding for watch jewels 2014 476,567 0.1 23,072,790 2,183,589 26,532,190 26,497,560 3399104 Lapidary work, excluding for watch jewels 2013 508,890 0.1 20,964,528 2,350,113 24,974,829 24,918,830 3399105 Jewelers' findings and materials, precious metal (excluding gold, platinum,
and silver plated to nonprecious metal)2014 123,927 9.0 N N 62,613 62,042
3399105 Jewelers' findings and materials, precious metal (excluding gold, platinum, and silver plated to nonprecious metal)
2013 145,899 11.0 N N 54,887 54,650
3399106 Other jewelers' findings and materials, including gold, platinum, and silver plated to nonprecious metal
2014 257,493 1.9 82,555 78,267 35,479 35,312
3399106 Other jewelers' findings and materials, including gold, platinum, and silver plated to nonprecious metal
2013 272,651 2.2 79,887 76,207 33,880 33,746
3399107 Costume jewelry and novelty, including engraving, chasing, or etching, made of nonprecious metal (including gold, platinum, and silver plated to
2014 585,699 5.8 383,394 283,952 2,535,572 2,501,660
3399107 Costume jewelry and novelty, including engraving, chasing, or etching, made of nonprecious metal (including gold, platinum, and silver plated to
2013 743,233 2.3 338,209 229,429 2,695,432 2,668,550
339910W Jewelry and silverware, nsk, total 2014 876,329 5.5 N N N N 339910W Jewelry and silverware, nsk, total 2013 741,976 1.7 N N N N 339910X Undistributed jewelry and silverware 2014 N X N N 5,740 5,740 339910X Undistributed jewelry and silverware 2013 N X N N 9,480 9,425339920 Sporting and athletic goods 2014 9,069,165 4.9 2,545,833 1,997,403 7,276,841 7,237,252339920 Sporting and athletic goods 2013 9,111,805 0.5 2,522,598 1,992,863 7,125,654 7,086,535 3399201 Fishing tackle and equipment 2014 504,110 3.1 174,654 132,053 614,454 613,166 3399201 Fishing tackle and equipment 2013 490,989 2.3 174,331 134,400 610,032 583,003 3399203 Golf equipment (excluding apparel and shoes) 2014 2,517,442 0.6 417,727 333,226 1,006,596 982,619 3399203 Golf equipment (excluding apparel and shoes) 2013 3,134,991 0.3 442,440 344,432 1,154,822 1,148,541 3399205 Playground equipment 2014 643,412 2.3 N N N N 3399205 Playground equipment 2013 612,529 1.2 N N N N 3399207 Gymnasium and exercise equipment 2014 2,404,593 18.3 1,204,094 991,295 2,370,201 2,362,300 3399207 Gymnasium and exercise equipment 2013 1,804,547 1.5 1,146,528 937,711 2,205,225 2,201,176 339920A Other sporting and athletic goods 2014 2,456,200 2.4 749,358 540,828 3,285,590 3,279,167 339920A Other sporting and athletic goods 2013 2,544,463 1.4 759,299 576,320 3,155,574 3,153,815 339920W Sporting and athletic goods, nsk, total 2014 543,408 1.0 N N N N 339920W Sporting and athletic goods, nsk, total 2013 524,286 0.1 N N N N

Table
Page 200
NAICS-based Product Code Description Year
Value of Product
Shipments
Relative Standard Error
(%)
Total Export Value of Goods
Domestic Export Value
of Goods
General Import Value
of Goods
Consumption Import Value
of Goods
Manufacturing and International Trade Report: 2014 and 2013(1)In thousands of dollars. Values are based on manufacturing data from the 2014 Annual Survey of
Manufactures and administrative records from official U.S. import and export merchandise trade statistics. (1) Data for 2013 supersede the data that were previously published in the 2013 Manufacturing and International Trade Report.
339930 Dolls, toys, and games 2014 1,222,318 3.0 2,780,596 1,104,969 17,613,134 17,600,919339930 Dolls, toys, and games 2013 1,143,119 1.7 2,805,890 1,059,543 16,935,314 16,905,394 3399301 Dolls, action figures, toy animals, and stuffed toys, including parts and 2014 59,065 1.0 N N N N 3399301 Dolls, action figures, toy animals, and stuffed toys, including parts and 2013 46,704 0.1 N N N N 3399302 Baby carriages and children's vehicles (including parts for children's vehicles
sold separately), excluding bicycles with pneumatic tires2014 58,478 0.3 1,071,786 479,499 296,866 296,288
3399302 Baby carriages and children's vehicles (including parts for children's vehicles sold separately), excluding bicycles with pneumatic tires
2013 50,747 0.7 1,017,337 467,596 284,704 284,291
3399306 Models (operating and static), craft kits and supplies, natural science kits and sets, and collectors' miniatures
2014 88,732 12.0 2,898 2,178 5,598 5,585
3399306 Models (operating and static), craft kits and supplies, natural science kits and sets, and collectors' miniatures
2013 109,234 2.7 3,287 2,593 5,592 5,592
3399307 Nonelectronic games and puzzles, including parts 2014 210,502 8.6 45,529 38,831 348,450 348,017 3399307 Nonelectronic games and puzzles, including parts 2013 183,536 7.1 58,643 52,906 325,308 325,032 3399308 Other nonelectronic, nonriding toys, including parts and pet toys 2014 261,163 9.7 N N 81,620 81,617 3399308 Other nonelectronic, nonriding toys, including parts and pet toys 2013 260,190 1.1 N N 78,203 78,177 3399309 Other electronic toys and games (including home video games), excluding
cartridges, disks, and tapes2014 266,810 6.0 1,660,382 584,461 4,814,532 4,814,830
3399309 Other electronic toys and games (including home video games), excluding cartridges, disks, and tapes
2013 273,772 5.1 1,726,624 536,448 5,198,039 5,193,594
339930W Dolls, toys, and games, nsk, total 2014 277,567 0.7 N N N N 339930W Dolls, toys, and games, nsk, total 2013 218,936 0.6 N N N N 339930X Undistributed dolls, toys, and games 2014 N X N N 12,066,068 12,054,583 339930X Undistributed dolls, toys, and games 2013 N X N N 11,043,468 11,018,708

Table
Page 201
NAICS-based Product Code Description Year
Value of Product
Shipments
Relative Standard Error
(%)
Total Export Value of Goods
Domestic Export Value
of Goods
General Import Value
of Goods
Consumption Import Value
of Goods
Manufacturing and International Trade Report: 2014 and 2013(1)In thousands of dollars. Values are based on manufacturing data from the 2014 Annual Survey of
Manufactures and administrative records from official U.S. import and export merchandise trade statistics. (1) Data for 2013 supersede the data that were previously published in the 2013 Manufacturing and International Trade Report.
339940 Office supplies (excluding paper) 2014 2,443,882 6.6 649,574 490,360 1,946,423 1,907,598339940 Office supplies (excluding paper) 2013 2,229,394 3.5 629,517 480,989 1,825,308 1,790,255 3399401 Pens, mechanical pencils, markers, and associated parts 2014 521,865 1.1 244,061 141,189 1,042,595 1,009,039 3399401 Pens, mechanical pencils, markers, and associated parts 2013 466,201 13.6 224,297 137,943 1,001,715 973,052 3399402 Lead pencils, art goods, office supplies, and small office equipment,
excluding paper2014 1,021,203 14.0 125,923 97,417 725,486 720,314
3399402 Lead pencils, art goods, office supplies, and small office equipment, excluding paper
2013 834,104 5.3 111,600 85,248 635,730 629,645
3399403 Marking devices, including dies, hand stamps, embossing seals, letters, numerals, stamp pads, stencils, etc.
2014 323,423 6.6 26,611 23,915 61,087 61,108
3399403 Marking devices, including dies, hand stamps, embossing seals, letters, numerals, stamp pads, stencils, etc.
2013 366,996 2.5 29,554 26,981 64,306 64,179
3399404 Carbon paper and inked ribbons 2014 506,156 2.4 252,978 227,839 117,254 117,137 3399404 Carbon paper and inked ribbons 2013 467,441 2.2 264,066 230,817 123,558 123,379 339940W Office supplies (excluding paper), nsk, total 2014 S A N N N N 339940W Office supplies (excluding paper), nsk, total 2013 94,652 1.2 N N N N339950 Signs 2014 11,087,612 2.2 165,659 148,815 254,816 253,304339950 Signs 2013 9,910,474 0.8 143,524 129,924 242,521 241,614 3399501 Electric signs and displays, including scoreboards and trade show exhibits 2014 4,461,200 3.2 80,173 71,579 160,732 160,777 3399501 Electric signs and displays, including scoreboards and trade show exhibits 2013 3,748,722 1.5 64,152 58,834 152,591 152,277 3399503 Nonelectric signs and displays, including trade show exhibits 2014 4,890,505 3.1 85,486 77,237 94,084 92,527 3399503 Nonelectric signs and displays, including trade show exhibits 2013 4,429,587 1.3 79,373 71,089 89,930 89,337 339950W Signs, nsk, total 2014 1,735,907 7.6 N N N N 339950W Signs, nsk, total 2013 1,732,166 0.8 N N N N
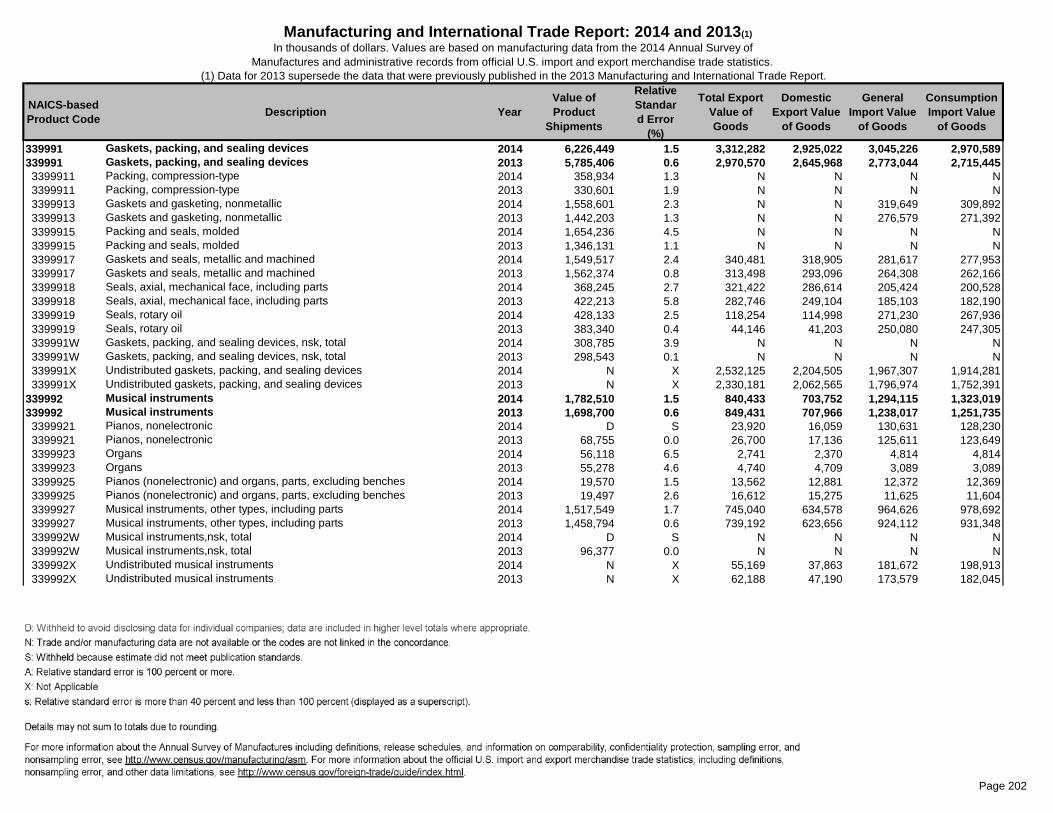
Table
Page 202
NAICS-based Product Code Description Year
Value of Product
Shipments
Relative Standard Error
(%)
Total Export Value of Goods
Domestic Export Value
of Goods
General Import Value
of Goods
Consumption Import Value
of Goods
Manufacturing and International Trade Report: 2014 and 2013(1)In thousands of dollars. Values are based on manufacturing data from the 2014 Annual Survey of
Manufactures and administrative records from official U.S. import and export merchandise trade statistics. (1) Data for 2013 supersede the data that were previously published in the 2013 Manufacturing and International Trade Report.
339991 Gaskets, packing, and sealing devices 2014 6,226,449 1.5 3,312,282 2,925,022 3,045,226 2,970,589339991 Gaskets, packing, and sealing devices 2013 5,785,406 0.6 2,970,570 2,645,968 2,773,044 2,715,445 3399911 Packing, compression-type 2014 358,934 1.3 N N N N 3399911 Packing, compression-type 2013 330,601 1.9 N N N N 3399913 Gaskets and gasketing, nonmetallic 2014 1,558,601 2.3 N N 319,649 309,892 3399913 Gaskets and gasketing, nonmetallic 2013 1,442,203 1.3 N N 276,579 271,392 3399915 Packing and seals, molded 2014 1,654,236 4.5 N N N N 3399915 Packing and seals, molded 2013 1,346,131 1.1 N N N N 3399917 Gaskets and seals, metallic and machined 2014 1,549,517 2.4 340,481 318,905 281,617 277,953 3399917 Gaskets and seals, metallic and machined 2013 1,562,374 0.8 313,498 293,096 264,308 262,166 3399918 Seals, axial, mechanical face, including parts 2014 368,245 2.7 321,422 286,614 205,424 200,528 3399918 Seals, axial, mechanical face, including parts 2013 422,213 5.8 282,746 249,104 185,103 182,190 3399919 Seals, rotary oil 2014 428,133 2.5 118,254 114,998 271,230 267,936 3399919 Seals, rotary oil 2013 383,340 0.4 44,146 41,203 250,080 247,305 339991W Gaskets, packing, and sealing devices, nsk, total 2014 308,785 3.9 N N N N 339991W Gaskets, packing, and sealing devices, nsk, total 2013 298,543 0.1 N N N N 339991X Undistributed gaskets, packing, and sealing devices 2014 N X 2,532,125 2,204,505 1,967,307 1,914,281 339991X Undistributed gaskets, packing, and sealing devices 2013 N X 2,330,181 2,062,565 1,796,974 1,752,391339992 Musical instruments 2014 1,782,510 1.5 840,433 703,752 1,294,115 1,323,019339992 Musical instruments 2013 1,698,700 0.6 849,431 707,966 1,238,017 1,251,735 3399921 Pianos, nonelectronic 2014 D S 23,920 16,059 130,631 128,230 3399921 Pianos, nonelectronic 2013 68,755 0.0 26,700 17,136 125,611 123,649 3399923 Organs 2014 56,118 6.5 2,741 2,370 4,814 4,814 3399923 Organs 2013 55,278 4.6 4,740 4,709 3,089 3,089 3399925 Pianos (nonelectronic) and organs, parts, excluding benches 2014 19,570 1.5 13,562 12,881 12,372 12,369 3399925 Pianos (nonelectronic) and organs, parts, excluding benches 2013 19,497 2.6 16,612 15,275 11,625 11,604 3399927 Musical instruments, other types, including parts 2014 1,517,549 1.7 745,040 634,578 964,626 978,692 3399927 Musical instruments, other types, including parts 2013 1,458,794 0.6 739,192 623,656 924,112 931,348 339992W Musical instruments,nsk, total 2014 D S N N N N 339992W Musical instruments,nsk, total 2013 96,377 0.0 N N N N 339992X Undistributed musical instruments 2014 N X 55,169 37,863 181,672 198,913 339992X Undistributed musical instruments 2013 N X 62,188 47,190 173,579 182,045
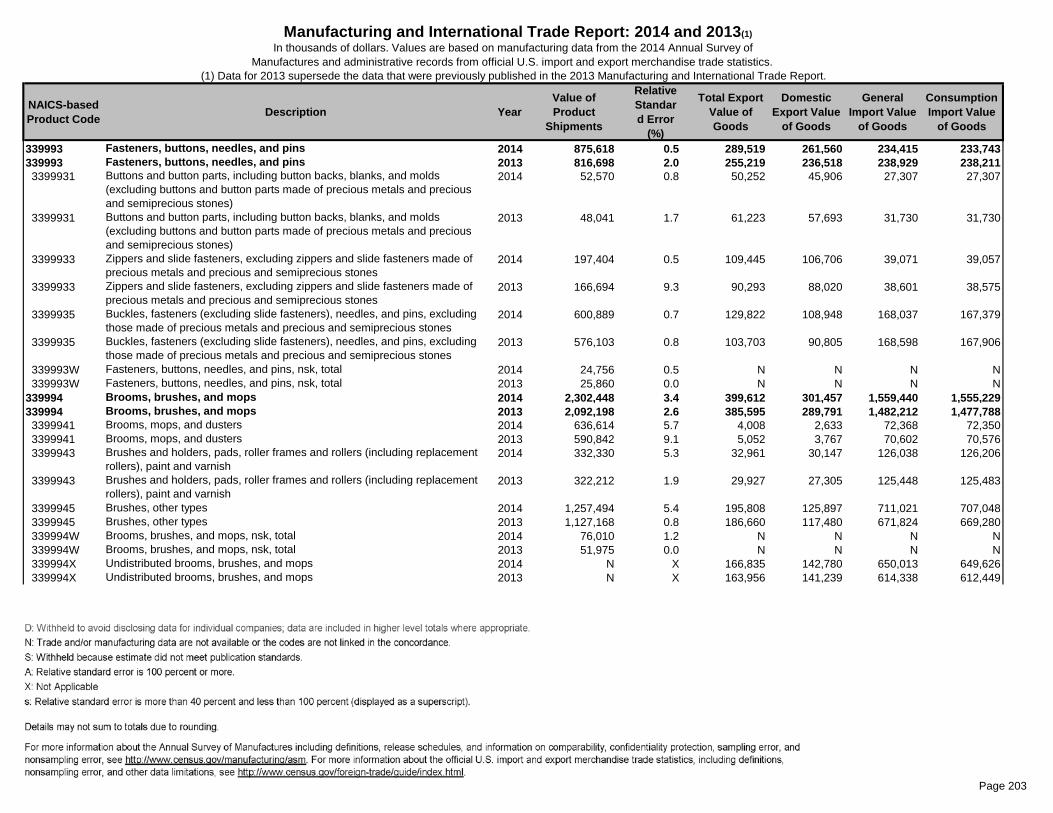
Table
Page 203
NAICS-based Product Code Description Year
Value of Product
Shipments
Relative Standard Error
(%)
Total Export Value of Goods
Domestic Export Value
of Goods
General Import Value
of Goods
Consumption Import Value
of Goods
Manufacturing and International Trade Report: 2014 and 2013(1)In thousands of dollars. Values are based on manufacturing data from the 2014 Annual Survey of
Manufactures and administrative records from official U.S. import and export merchandise trade statistics. (1) Data for 2013 supersede the data that were previously published in the 2013 Manufacturing and International Trade Report.
339993 Fasteners, buttons, needles, and pins 2014 875,618 0.5 289,519 261,560 234,415 233,743339993 Fasteners, buttons, needles, and pins 2013 816,698 2.0 255,219 236,518 238,929 238,211 3399931 Buttons and button parts, including button backs, blanks, and molds
(excluding buttons and button parts made of precious metals and precious and semiprecious stones)
2014 52,570 0.8 50,252 45,906 27,307 27,307
3399931 Buttons and button parts, including button backs, blanks, and molds (excluding buttons and button parts made of precious metals and precious and semiprecious stones)
2013 48,041 1.7 61,223 57,693 31,730 31,730
3399933 Zippers and slide fasteners, excluding zippers and slide fasteners made of precious metals and precious and semiprecious stones
2014 197,404 0.5 109,445 106,706 39,071 39,057
3399933 Zippers and slide fasteners, excluding zippers and slide fasteners made of precious metals and precious and semiprecious stones
2013 166,694 9.3 90,293 88,020 38,601 38,575
3399935 Buckles, fasteners (excluding slide fasteners), needles, and pins, excluding those made of precious metals and precious and semiprecious stones
2014 600,889 0.7 129,822 108,948 168,037 167,379
3399935 Buckles, fasteners (excluding slide fasteners), needles, and pins, excluding those made of precious metals and precious and semiprecious stones
2013 576,103 0.8 103,703 90,805 168,598 167,906
339993W Fasteners, buttons, needles, and pins, nsk, total 2014 24,756 0.5 N N N N 339993W Fasteners, buttons, needles, and pins, nsk, total 2013 25,860 0.0 N N N N339994 Brooms, brushes, and mops 2014 2,302,448 3.4 399,612 301,457 1,559,440 1,555,229339994 Brooms, brushes, and mops 2013 2,092,198 2.6 385,595 289,791 1,482,212 1,477,788 3399941 Brooms, mops, and dusters 2014 636,614 5.7 4,008 2,633 72,368 72,350 3399941 Brooms, mops, and dusters 2013 590,842 9.1 5,052 3,767 70,602 70,576 3399943 Brushes and holders, pads, roller frames and rollers (including replacement
rollers), paint and varnish2014 332,330 5.3 32,961 30,147 126,038 126,206
3399943 Brushes and holders, pads, roller frames and rollers (including replacement rollers), paint and varnish
2013 322,212 1.9 29,927 27,305 125,448 125,483
3399945 Brushes, other types 2014 1,257,494 5.4 195,808 125,897 711,021 707,048 3399945 Brushes, other types 2013 1,127,168 0.8 186,660 117,480 671,824 669,280 339994W Brooms, brushes, and mops, nsk, total 2014 76,010 1.2 N N N N 339994W Brooms, brushes, and mops, nsk, total 2013 51,975 0.0 N N N N 339994X Undistributed brooms, brushes, and mops 2014 N X 166,835 142,780 650,013 649,626 339994X Undistributed brooms, brushes, and mops 2013 N X 163,956 141,239 614,338 612,449

Table
Page 204
NAICS-based Product Code Description Year
Value of Product
Shipments
Relative Standard Error
(%)
Total Export Value of Goods
Domestic Export Value
of Goods
General Import Value
of Goods
Consumption Import Value
of Goods
Manufacturing and International Trade Report: 2014 and 2013(1)In thousands of dollars. Values are based on manufacturing data from the 2014 Annual Survey of
Manufactures and administrative records from official U.S. import and export merchandise trade statistics. (1) Data for 2013 supersede the data that were previously published in the 2013 Manufacturing and International Trade Report.
339995 Burial caskets 2014 633,865 1.2 N N 116,935 116,935339995 Burial caskets 2013 643,711 0.9 N N 119,704 119,704 3399951 Burial caskets and coffins, completely lined and trimmed, adult sizes only, 2014 327,215 1.0 N N 59,459 59,459 3399951 Burial caskets and coffins, completely lined and trimmed, adult sizes only, 2013 352,867 1.0 N N 60,325 60,325 3399953 Burial caskets and coffins, completely lined and trimmed, adult sizes only, 2014 184,000 1.0 N N 57,476 57,476 3399953 Burial caskets and coffins, completely lined and trimmed, adult sizes only, 2013 177,262 2.7 N N 59,380 59,380 3399955 Burial caskets and coffins, other types (including burial boxes and vaults
(excluding concrete and stone), casket shells, casket shipping cases and containers, and children's)
2014 105,428 6.4 N N N N
3399955 Burial caskets and coffins, other types (including burial boxes and vaults (excluding concrete and stone), casket shells, casket shipping cases and containers, and children's)
2013 97,440 0.3 N N N N
339995W Burial caskets, nsk, total 2014 17,222 2.3 N N N N 339995W Burial caskets, nsk, total 2013 16,142 0.0 N N N N339999 All other miscellaneous products 2014 13,116,531 1.8 2,926,626 2,561,960 7,977,658 7,968,986339999 All other miscellaneous products 2013 12,097,664 0.5 3,036,949 2,712,341 7,755,762 7,746,892 3399991 Fire extinguishing equipment, hand-portable and fixed-system (excluding
water sprinkler systems), including parts and attachments2014 1,276,845 2.7 195,322 185,790 202,722 201,680
3399991 Fire extinguishing equipment, hand-portable and fixed-system (excluding water sprinkler systems), including parts and attachments
2013 1,173,771 1.2 188,418 181,644 176,153 174,265
3399993 Coin-operated amusement machines, excluding jukeboxes 2014 2,684,525 0.4 910,885 829,006 646,346 646,269 3399993 Coin-operated amusement machines, excluding jukeboxes 2013 2,935,547 0.5 1,083,312 1,007,855 591,146 591,146 3399995 Candles, including tapers 2014 1,705,799 2.7 292,192 280,916 390,842 390,245 3399995 Candles, including tapers 2013 1,723,041 0.5 284,187 274,845 398,207 398,120 3399997 Umbrellas and parasols, including parts 2014 54,644 0.0 27,485 18,742 490,795 491,291 3399997 Umbrellas and parasols, including parts 2013 57,347 0.0 25,741 17,209 489,522 488,205 3399999 Artificial trees, flowers, fruits, and wreaths, including feathers and plumes 2014 67,864 6.4 41,396 28,934 805,284 804,776 3399999 Artificial trees, flowers, fruits, and wreaths, including feathers and plumes 2013 71,911 1.9 39,852 27,732 731,182 730,567 339999E Mirror and picture frames and framed pictures 2014 606,443 3.9 41,103 31,170 437,136 435,931 339999E Mirror and picture frames and framed pictures 2013 596,731 3.5 39,665 26,785 432,918 431,749 339999K Other miscellaneous fabricated products 2014 2,811,984 4.8 1,418,243 1,187,402 5,004,534 4,998,792 339999K Other miscellaneous fabricated products 2013 2,478,087 1.5 1,375,774 1,176,273 4,936,634 4,932,839 339999W All other miscellaneous products, nsk, total 2014 3,908,427 4.9 N N N N 339999W All other miscellaneous products, nsk, total 2013 3,061,228 0.9 N N N N