Embed Size (px)
Citation preview
Manufactured Sand –Impacts on Concrete Pavement
Design Inputs, Construction, and Predicted Performance
Tara Cavalline, PhD, PEUniversity of North Carolina at Charlotte
Iowa Better Concrete ConferenceNovember 14, 2019
Overview1) Background
– Drivers of increased manufactured sand (MS) use – Characteristics of MS vs. natural sand (NS)– Advantages and disadvantages of MS– State specifications regarding MS
2) North/South Carolina experience with MS in paving mixtures– Past / future projects– Forecast
3) NCDOT research on MS – new pavement design inputs– predicted performance
4) Closing thoughts/questions
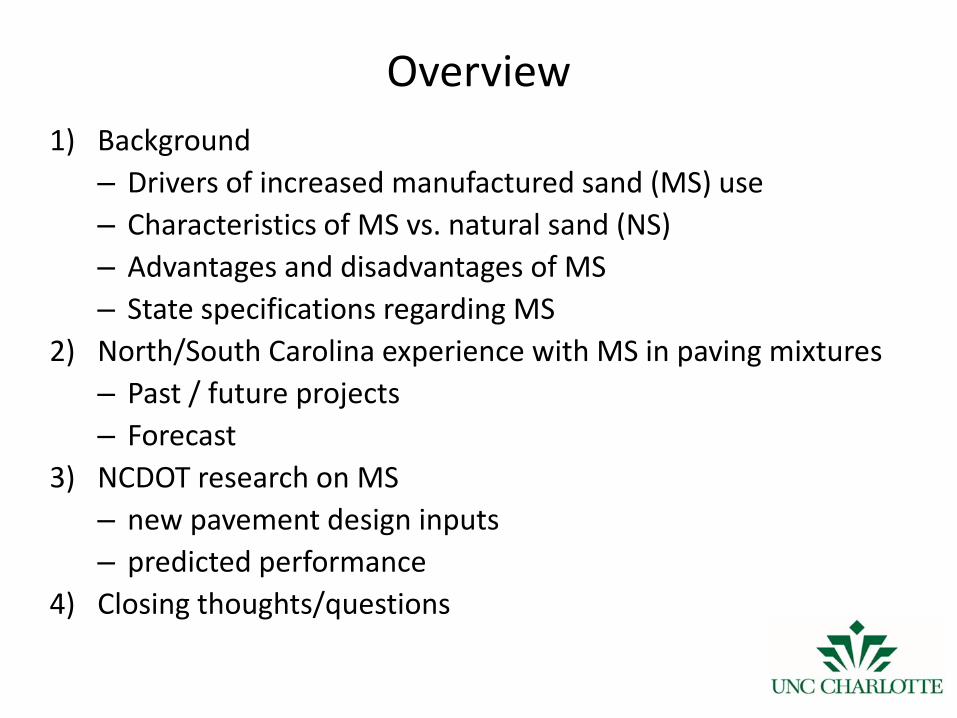
Drivers of increased MS use• Growing demand for fine aggregates• Remote location of natural sand pits• Issues with less-desirable NS sources (silts/clay)• Issues with permitting new sand pits• Environmental issues with dredging• Increased emphasis on resource recovery and sustainability• Risk and cost
Jeff Greenburg, Getty Images
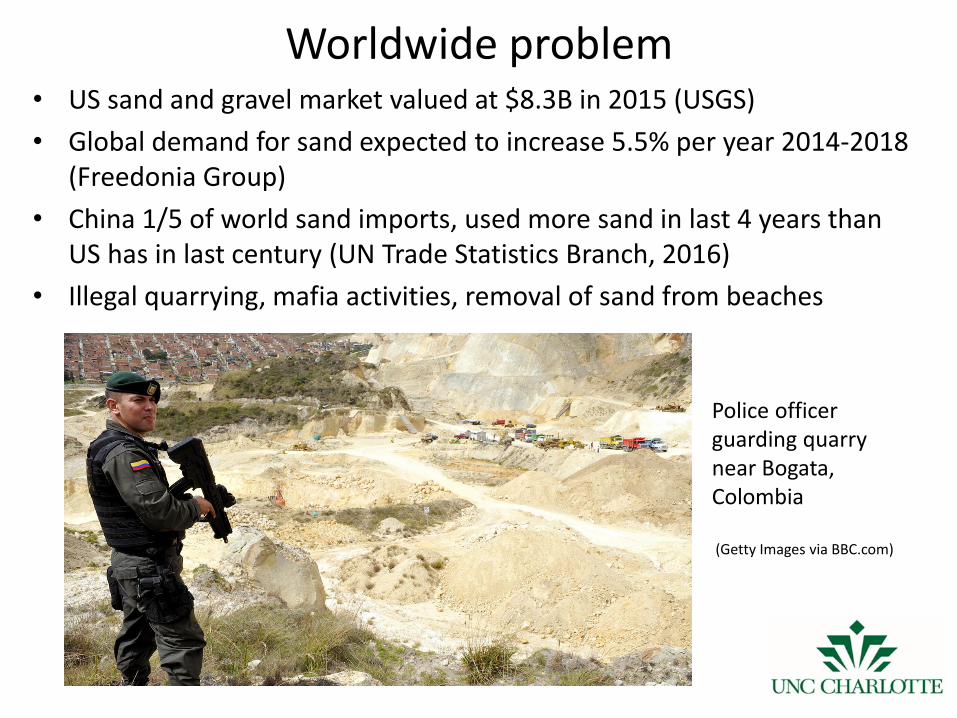
Worldwide problem• US sand and gravel market valued at $8.3B in 2015 (USGS)• Global demand for sand expected to increase 5.5% per year 2014-2018
(Freedonia Group)• China 1/5 of world sand imports, used more sand in last 4 years than
US has in last century (UN Trade Statistics Branch, 2016)• Illegal quarrying, mafia activities, removal of sand from beaches
Police officer guarding quarry near Bogata, Colombia
(Getty Images via BBC.com)
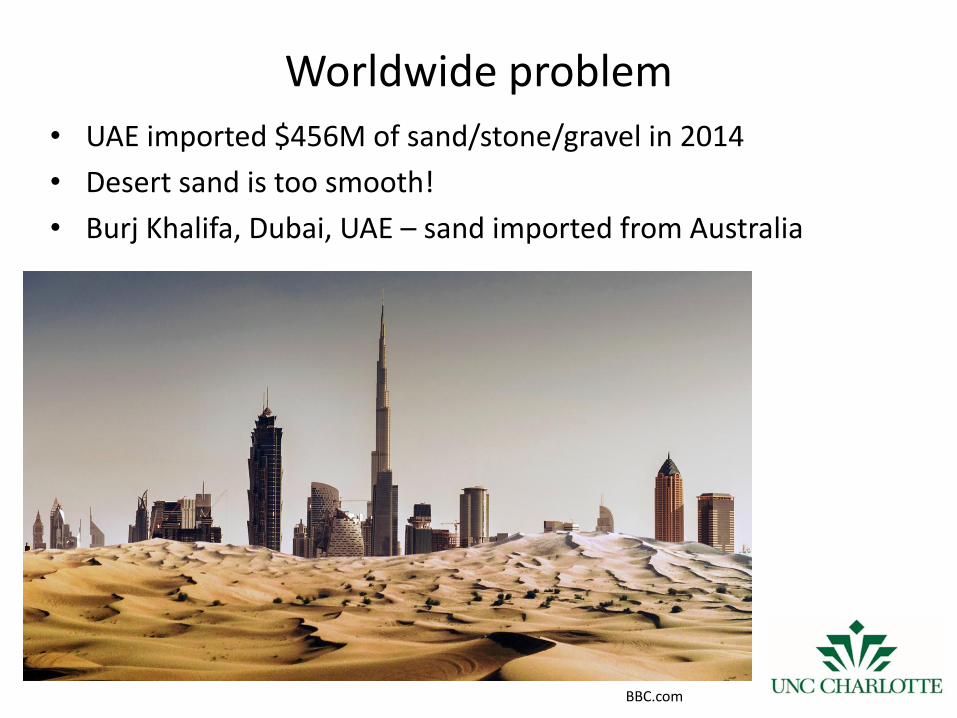
Worldwide problem• UAE imported $456M of sand/stone/gravel in 2014• Desert sand is too smooth!• Burj Khalifa, Dubai, UAE – sand imported from Australia
BBC.com
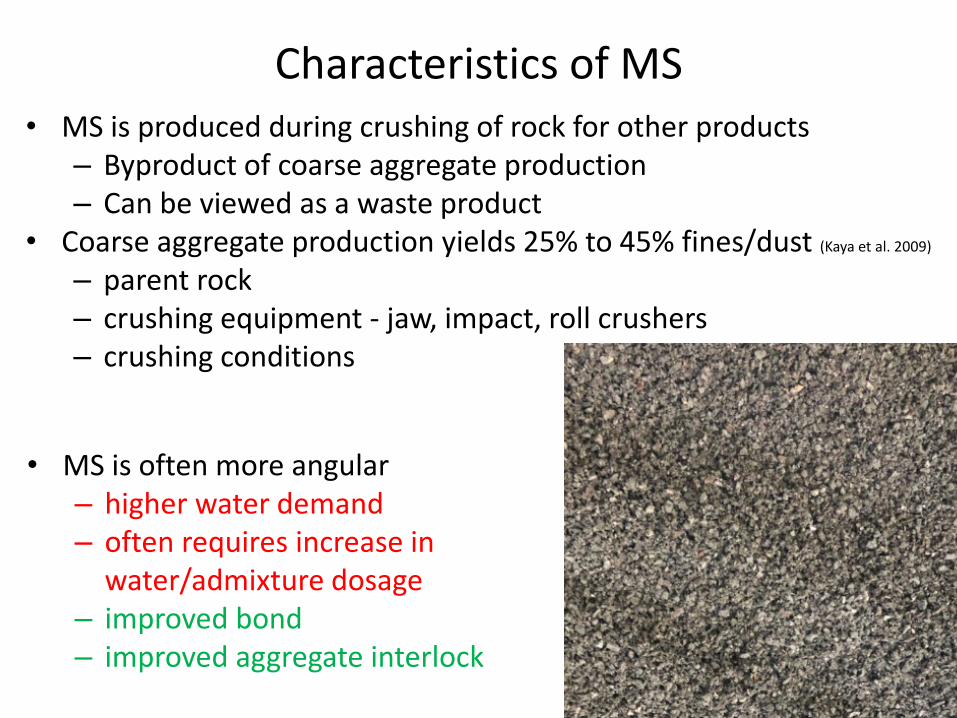
Characteristics of MS• MS is produced during crushing of rock for other products
– Byproduct of coarse aggregate production– Can be viewed as a waste product
• Coarse aggregate production yields 25% to 45% fines/dust (Kaya et al. 2009)
– parent rock– crushing equipment - jaw, impact, roll crushers– crushing conditions
• MS is often more angular– higher water demand– often requires increase in
water/admixture dosage – improved bond – improved aggregate interlock
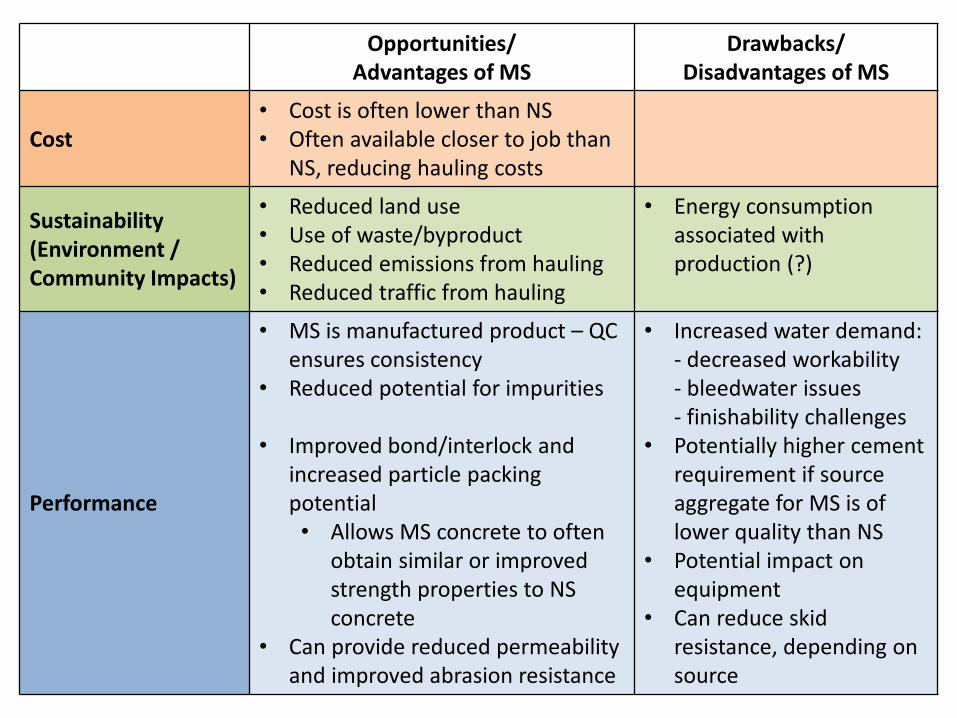
Opportunities/Advantages of MS
Drawbacks/Disadvantages of MS
Cost• Cost is often lower than NS• Often available closer to job than
NS, reducing hauling costs
Sustainability(Environment / Community Impacts)
• Reduced land use• Use of waste/byproduct• Reduced emissions from hauling• Reduced traffic from hauling
• Energy consumption associated with production (?)
Performance
• MS is manufactured product – QC ensures consistency
• Reduced potential for impurities
• Improved bond/interlock and increased particle packing potential• Allows MS concrete to often
obtain similar or improved strength properties to NS concrete
• Can provide reduced permeability and improved abrasion resistance
• Increased water demand:- decreased workability- bleedwater issues- finishability challenges
• Potentially higher cement requirement if source aggregate for MS is of lower quality than NS
• Potential impact on equipment
• Can reduce skid resistance, depending on source

State Specifications Regarding MS• Many agencies do not allow MS in concrete• Many agencies do allow MS in concrete
• Acceptance requirements for MS:– Some agencies allow MS if it meets requirements for NS– Often conformance to AASHTO M 6 is required– Some agencies require MS to come from an approved source– Some agencies provide enhanced testing for deleterious
substances
• Use restrictions for MS– Some agencies do not allow MS on a frictional surface– Some agencies restrict certain types of MS to avoid polishing
issues
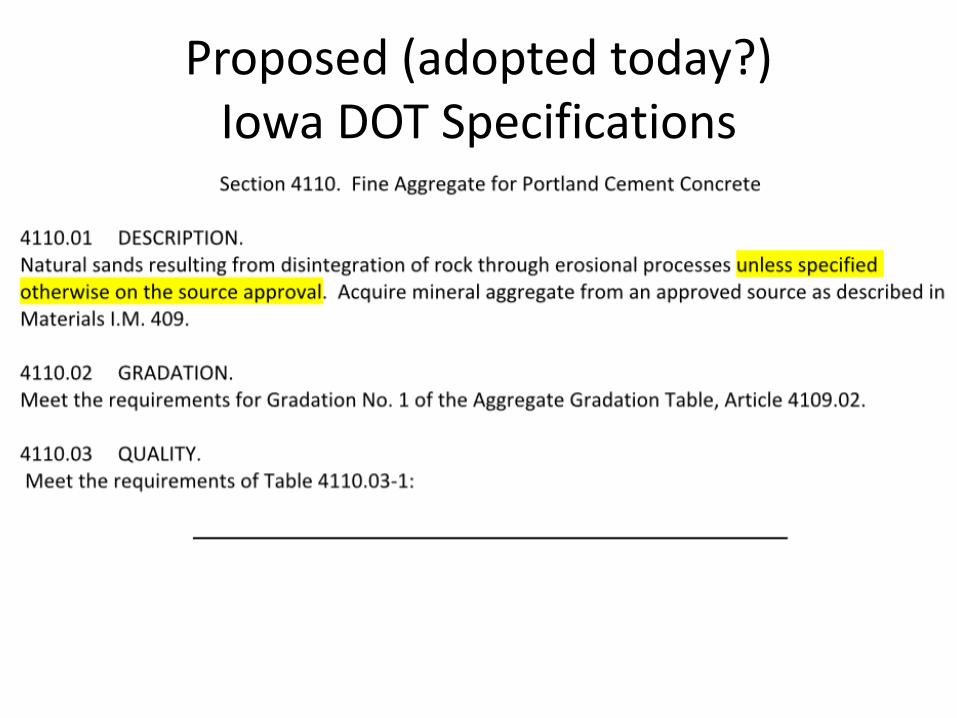
Proposed (adopted today?)Iowa DOT Specifications
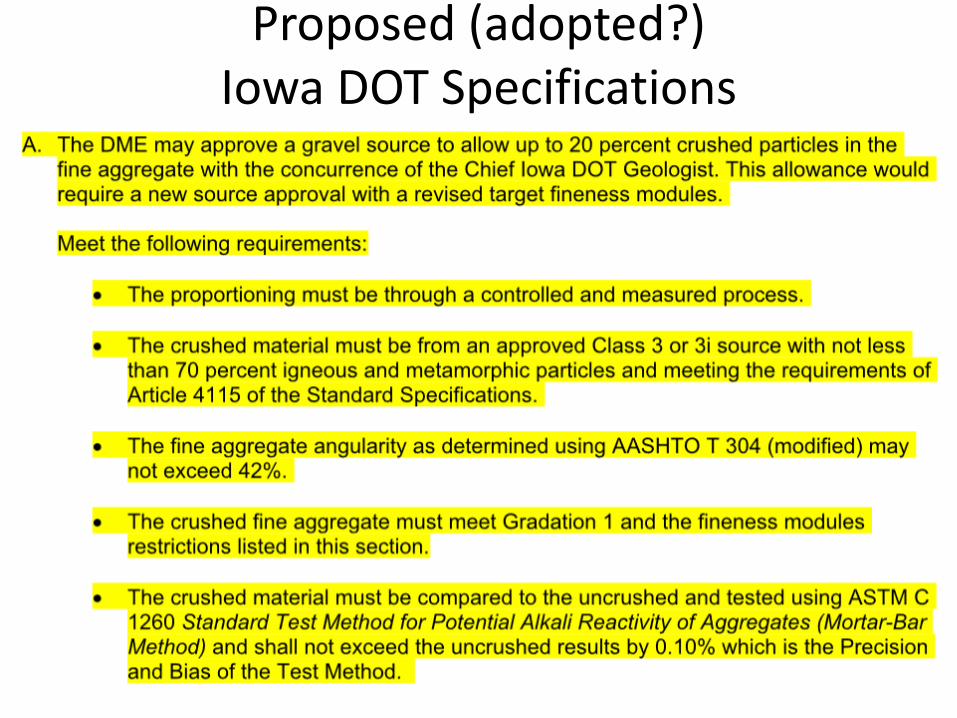
Proposed (adopted?) Iowa DOT Specifications
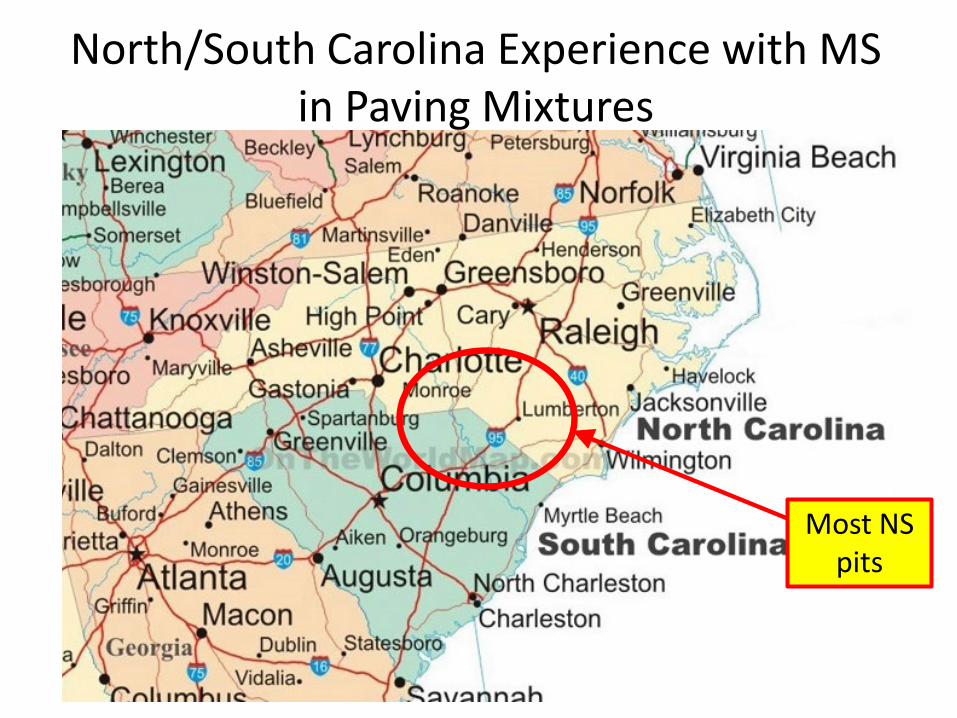
North/South Carolina Experience with MS in Paving Mixtures
Most NS pits
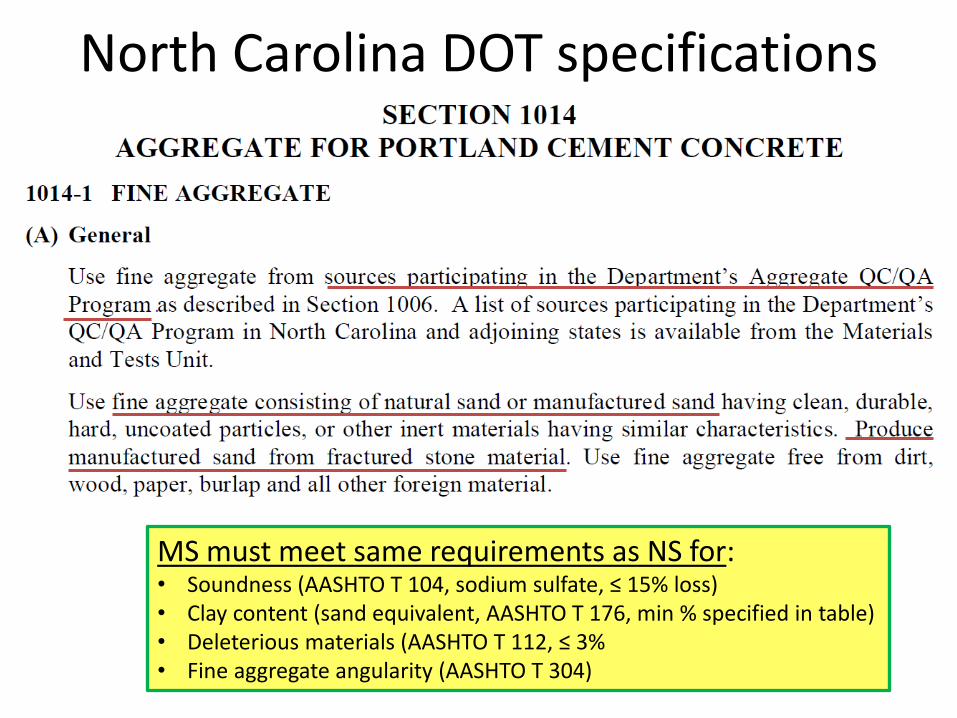
North Carolina DOT specifications
MS must meet same requirements as NS for:• Soundness (AASHTO T 104, sodium sulfate, ≤ 15% loss)• Clay content (sand equivalent, AASHTO T 176, min % specified in table)• Deleterious materials (AASHTO T 112, ≤ 3%• Fine aggregate angularity (AASHTO T 304)
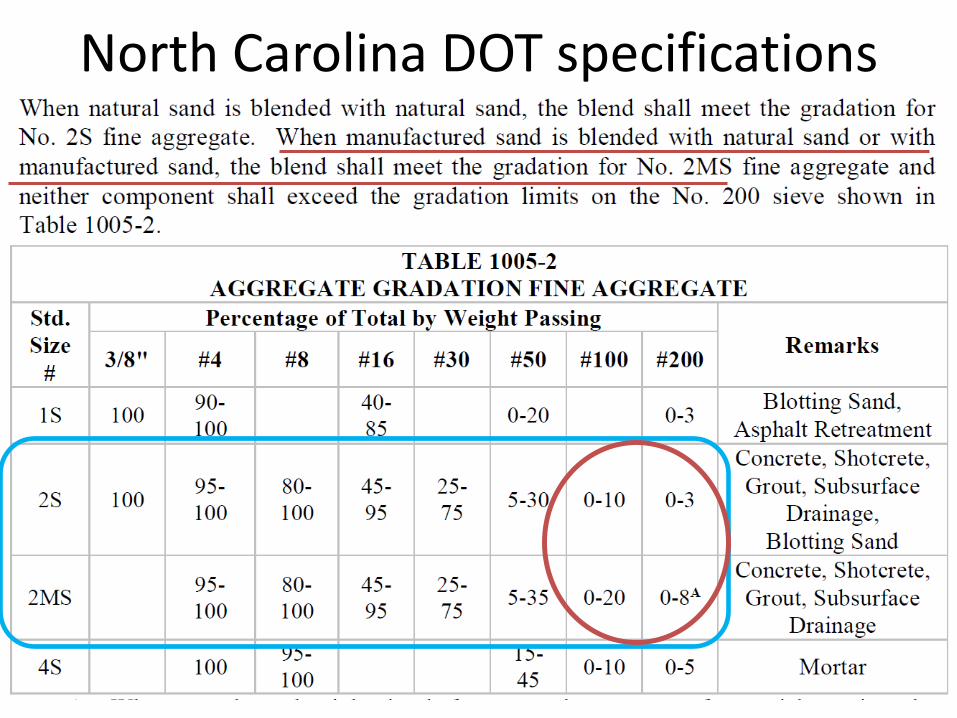
North Carolina DOT specifications
North/South Carolina Experience with MS in Paving Mixtures
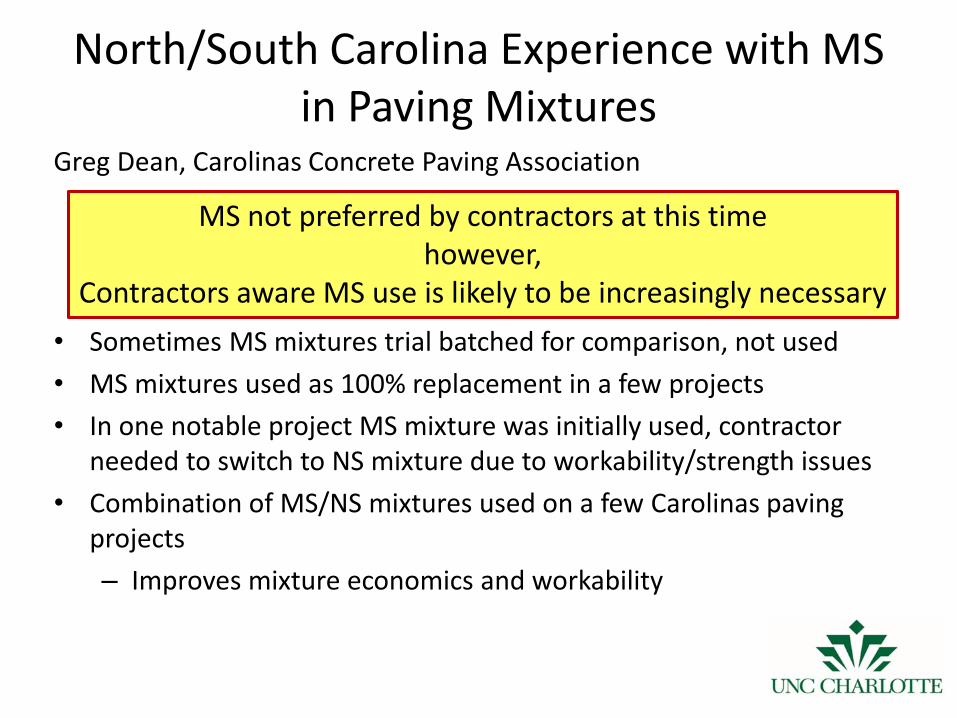
Greg Dean, Carolinas Concrete Paving Association
• Sometimes MS mixtures trial batched for comparison, not used• MS mixtures used as 100% replacement in a few projects• In one notable project MS mixture was initially used, contractor
needed to switch to NS mixture due to workability/strength issues• Combination of MS/NS mixtures used on a few Carolinas paving
projects– Improves mixture economics and workability
MS not preferred by contractors at this timehowever,
Contractors aware MS use is likely to be increasingly necessary
I-85 Widening – Concord, NC
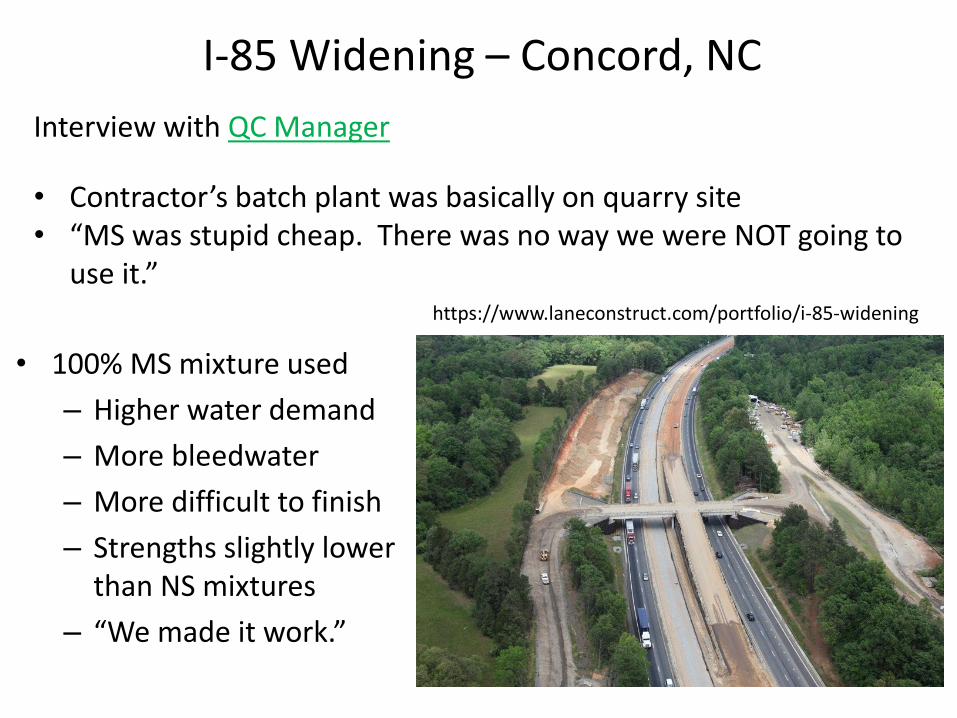
• 100% MS mixture used– Higher water demand– More bleedwater– More difficult to finish– Strengths slightly lower
than NS mixtures– “We made it work.”
https://www.laneconstruct.com/portfolio/i-85-widening
Interview with QC Manager
• Contractor’s batch plant was basically on quarry site• “MS was stupid cheap. There was no way we were NOT going to
use it.”
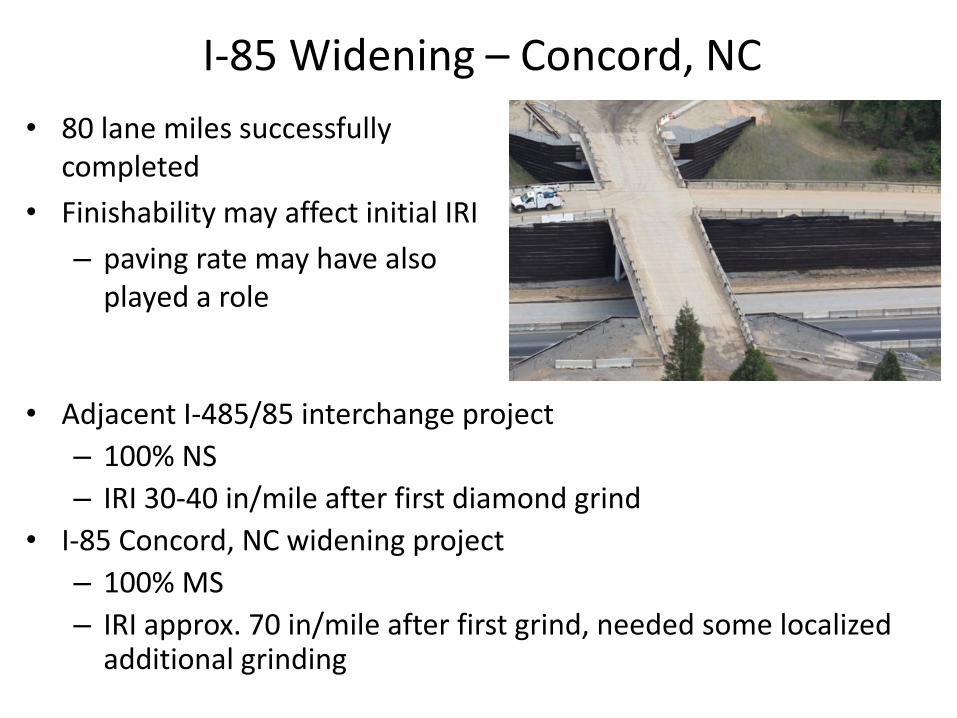
I-85 Widening – Concord, NC • 80 lane miles successfully
completed• Finishability may affect initial IRI
– paving rate may have also played a role
• Adjacent I-485/85 interchange project – 100% NS– IRI 30-40 in/mile after first diamond grind
• I-85 Concord, NC widening project– 100% MS– IRI approx. 70 in/mile after first grind, needed some localized
additional grinding
I-85 Widening – Concord, NC
Interview with Paving Superintendent• Confirmed higher initial IRI from initial profilograph readings• Finishers disliked MS mixture• Tougher on equipment
– Use Dowel Bar Inserter technology– Harsher MS mixture resulted in additional wear to nose
pieces, overbuild devices on oscillating correcting beam– Similar sized projects
• 100% NS mixture – required 1 replacement set of nose pieces, 1 set of overbuild devices
• 100% MS mixture – required 5 sets of each
Company Execs: “More of it is coming (MS), so you better get used to it.”
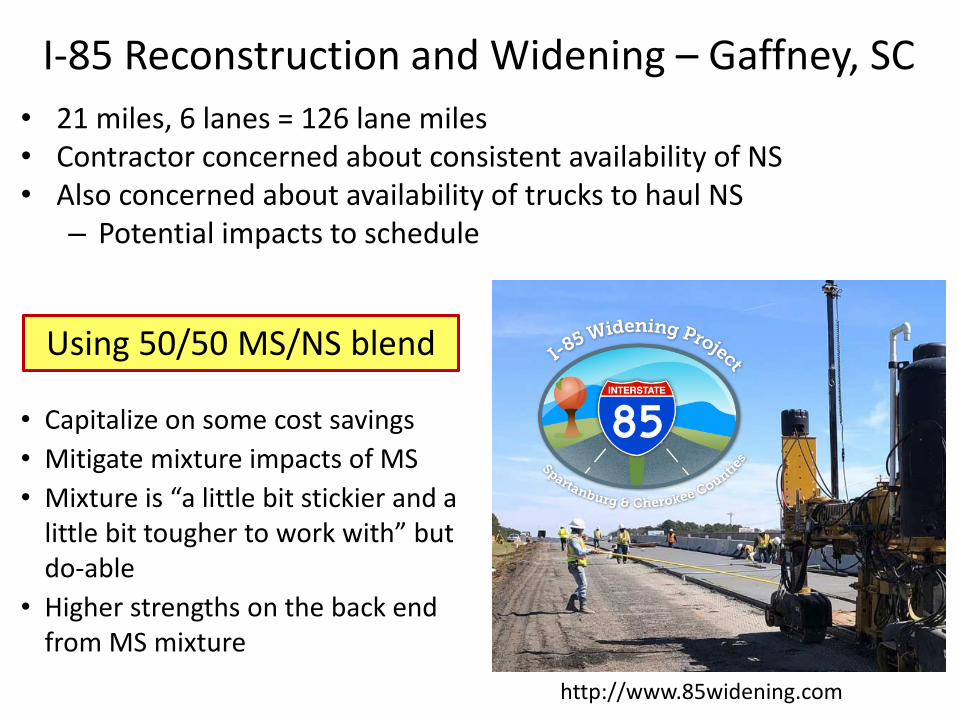
I-85 Reconstruction and Widening – Gaffney, SC • 21 miles, 6 lanes = 126 lane miles• Contractor concerned about consistent availability of NS• Also concerned about availability of trucks to haul NS
– Potential impacts to schedule
• Capitalize on some cost savings• Mitigate mixture impacts of MS• Mixture is “a little bit stickier and a
little bit tougher to work with” but do-able
• Higher strengths on the back end from MS mixture
http://www.85widening.com
Using 50/50 MS/NS blend
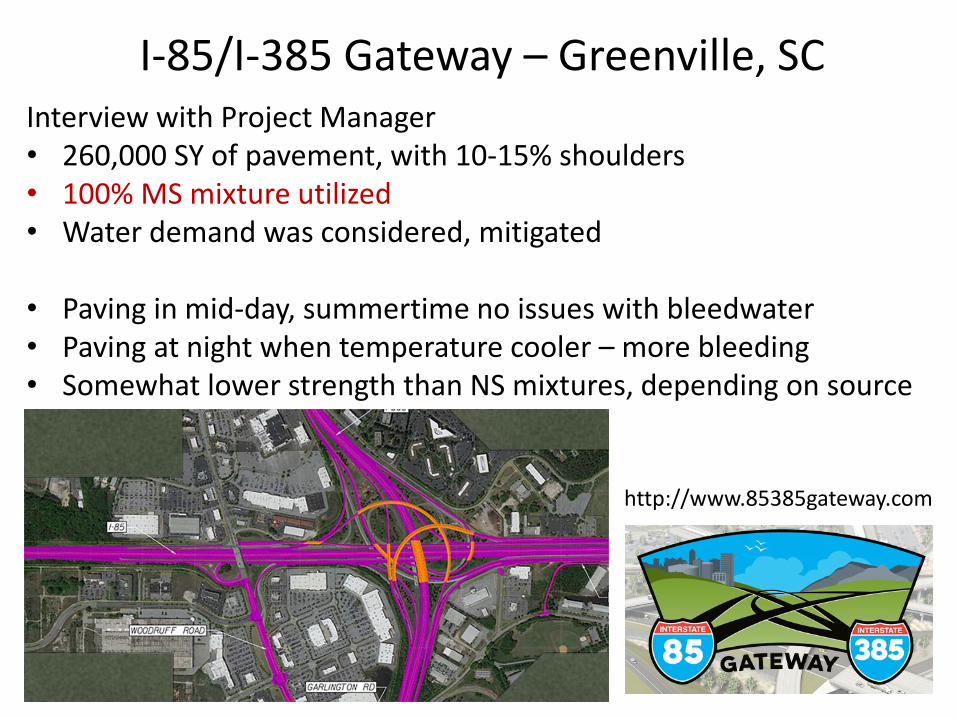
I-85/I-385 Gateway – Greenville, SC Interview with Project Manager• 260,000 SY of pavement, with 10-15% shoulders• 100% MS mixture utilized • Water demand was considered, mitigated
• Paving in mid-day, summertime no issues with bleedwater• Paving at night when temperature cooler – more bleeding• Somewhat lower strength than NS mixtures, depending on source
http://www.85385gateway.com
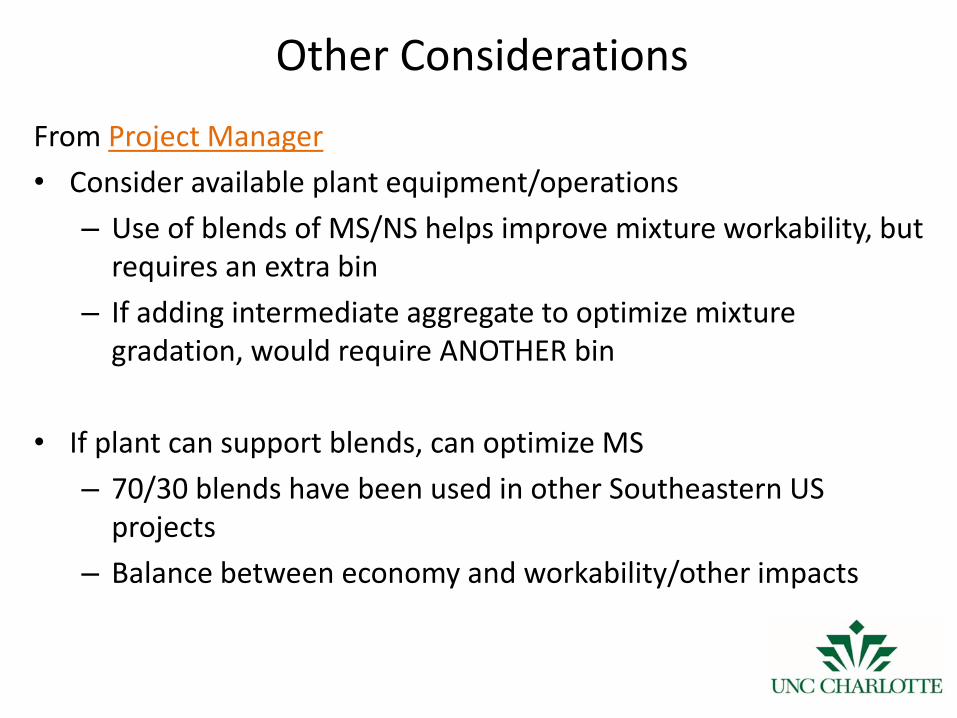
Other Considerations
From Project Manager• Consider available plant equipment/operations
– Use of blends of MS/NS helps improve mixture workability, but requires an extra bin
– If adding intermediate aggregate to optimize mixture gradation, would require ANOTHER bin
• If plant can support blends, can optimize MS – 70/30 blends have been used in other Southeastern US
projects– Balance between economy and workability/other impacts
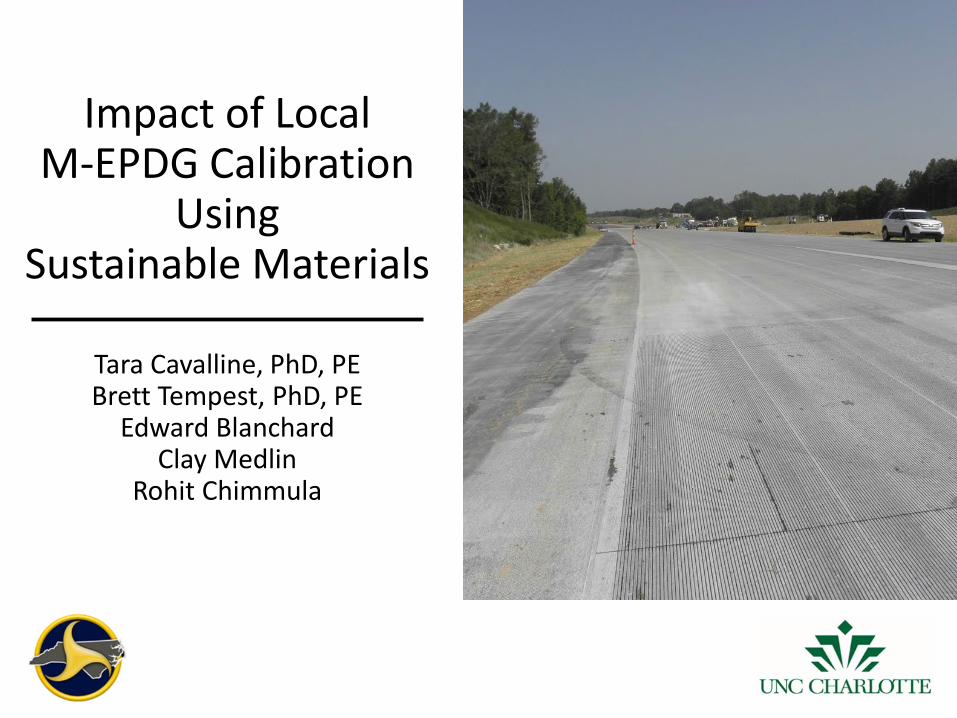
Impact of Local M-EPDG Calibration
Using Sustainable Materials
Tara Cavalline, PhD, PE Brett Tempest, PhD, PE
Edward BlanchardClay Medlin
Rohit Chimmula
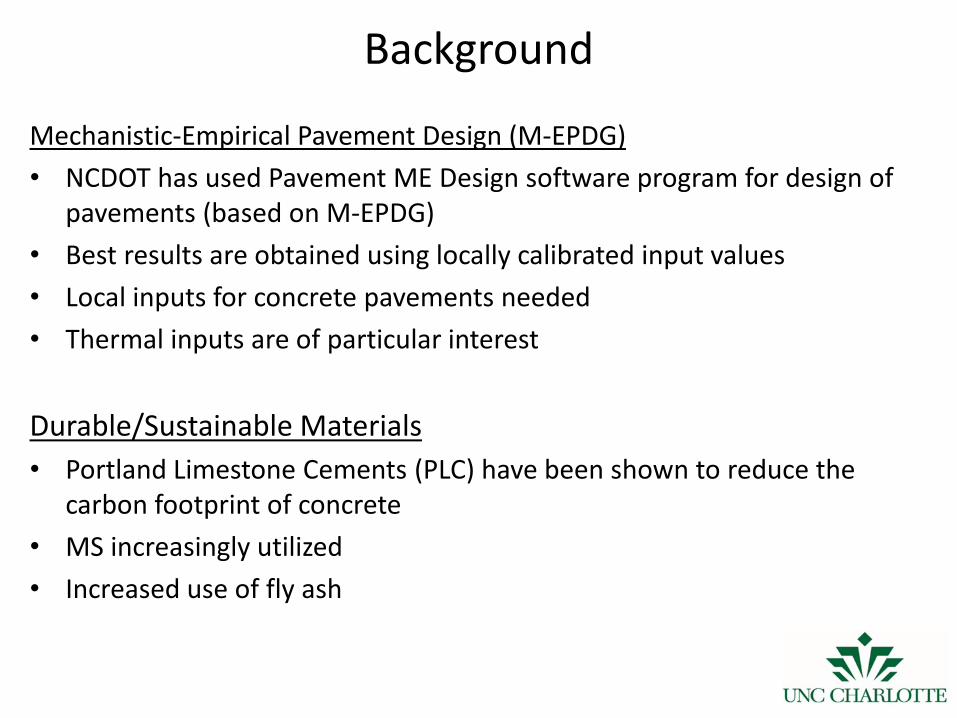
Background
Mechanistic-Empirical Pavement Design (M-EPDG)• NCDOT has used Pavement ME Design software program for design of
pavements (based on M-EPDG)• Best results are obtained using locally calibrated input values• Local inputs for concrete pavements needed• Thermal inputs are of particular interest
Durable/Sustainable Materials• Portland Limestone Cements (PLC) have been shown to reduce the
carbon footprint of concrete• MS increasingly utilized • Increased use of fly ash
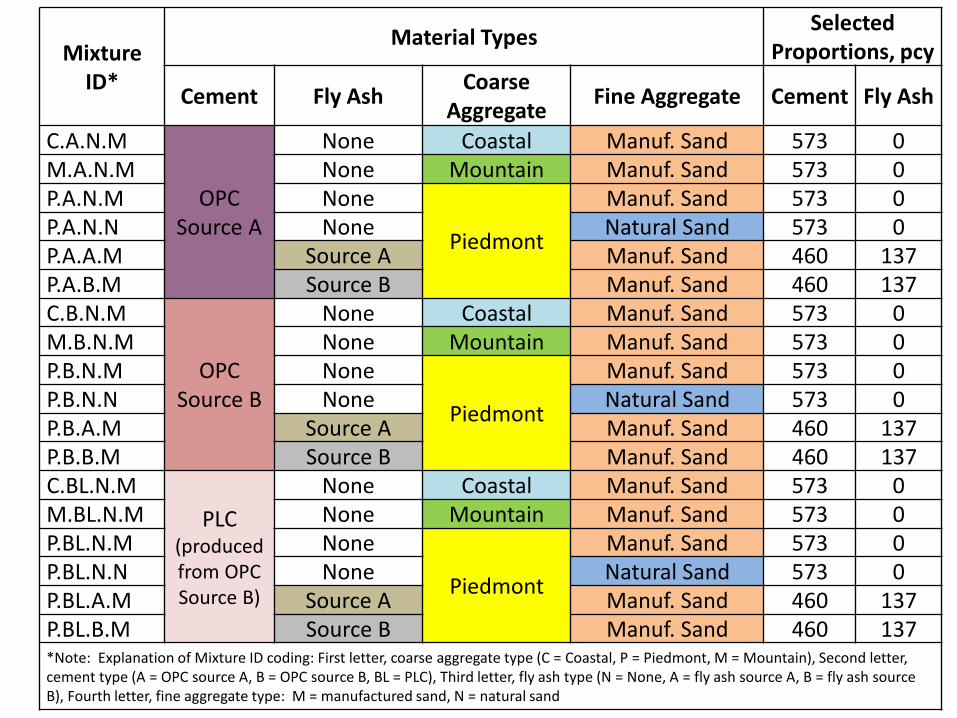
Mixture ID*
Material Types Selected Proportions, pcy
Cement Fly Ash Coarse Aggregate Fine Aggregate Cement Fly Ash
C.A.N.M
OPC Source A
None Coastal Manuf. Sand 573 0M.A.N.M None Mountain Manuf. Sand 573 0P.A.N.M None
Piedmont
Manuf. Sand 573 0P.A.N.N None Natural Sand 573 0P.A.A.M Source A Manuf. Sand 460 137P.A.B.M Source B Manuf. Sand 460 137C.B.N.M
OPC Source B
None Coastal Manuf. Sand 573 0M.B.N.M None Mountain Manuf. Sand 573 0P.B.N.M None
Piedmont
Manuf. Sand 573 0P.B.N.N None Natural Sand 573 0P.B.A.M Source A Manuf. Sand 460 137P.B.B.M Source B Manuf. Sand 460 137C.BL.N.M
PLC (produced from OPC Source B)
None Coastal Manuf. Sand 573 0M.BL.N.M None Mountain Manuf. Sand 573 0P.BL.N.M None
Piedmont
Manuf. Sand 573 0P.BL.N.N None Natural Sand 573 0P.BL.A.M Source A Manuf. Sand 460 137P.BL.B.M Source B Manuf. Sand 460 137*Note: Explanation of Mixture ID coding: First letter, coarse aggregate type (C = Coastal, P = Piedmont, M = Mountain), Second letter, cement type (A = OPC source A, B = OPC source B, BL = PLC), Third letter, fly ash type (N = None, A = fly ash source A, B = fly ash source B), Fourth letter, fine aggregate type: M = manufactured sand, N = natural sand
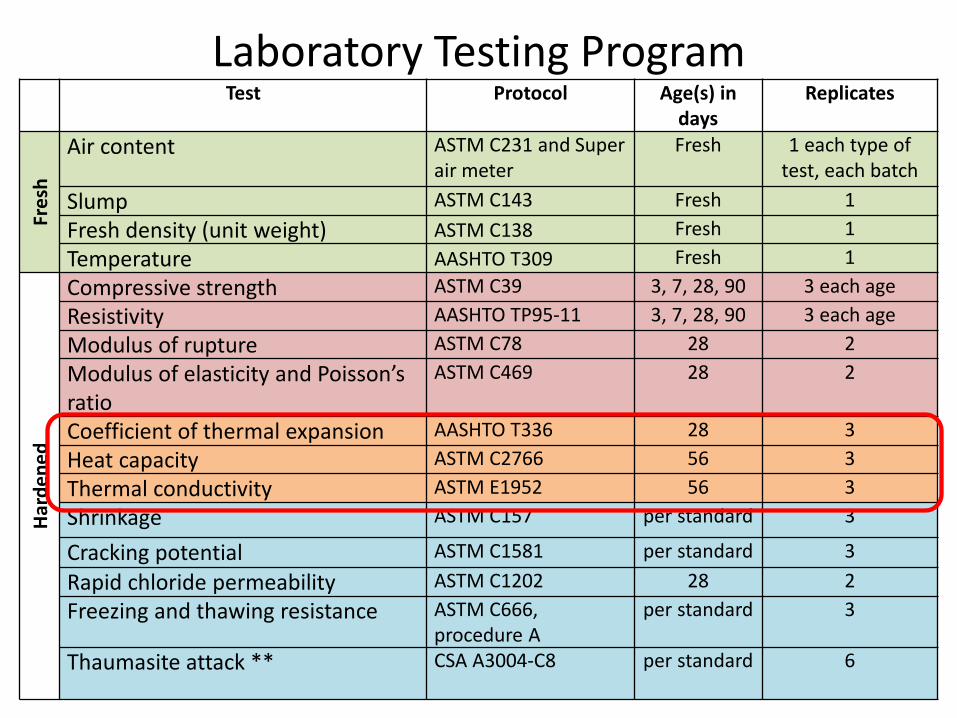
Laboratory Testing ProgramTest Protocol Age(s) in
daysReplicates
Fres
h
Air content ASTM C231 and Super air meter
Fresh 1 each type of test, each batch
Slump ASTM C143 Fresh 1Fresh density (unit weight) ASTM C138 Fresh 1Temperature AASHTO T309 Fresh 1
Hard
ened
Compressive strength ASTM C39 3, 7, 28, 90 3 each ageResistivity AASHTO TP95-11 3, 7, 28, 90 3 each ageModulus of rupture ASTM C78 28 2Modulus of elasticity and Poisson’s ratio
ASTM C469 28 2
Coefficient of thermal expansion AASHTO T336 28 3Heat capacity ASTM C2766 56 3Thermal conductivity ASTM E1952 56 3Shrinkage ASTM C157 per standard 3
Cracking potential ASTM C1581 per standard 3Rapid chloride permeability ASTM C1202 28 2Freezing and thawing resistance ASTM C666,
procedure Aper standard 3
Thaumasite attack ** CSA A3004-C8 per standard 6
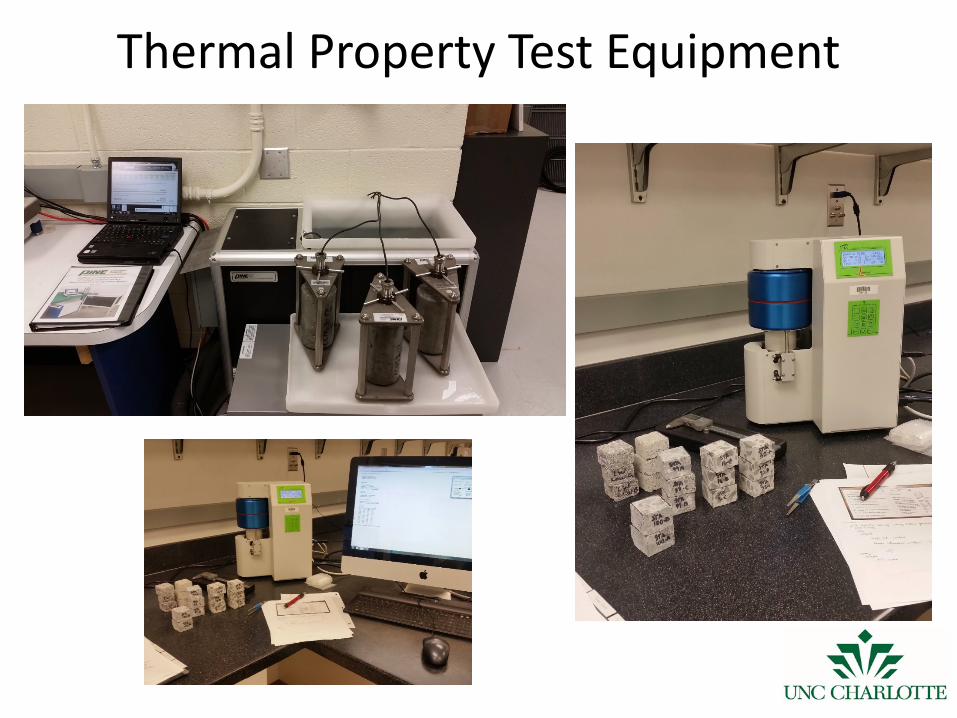
Thermal Property Test Equipment
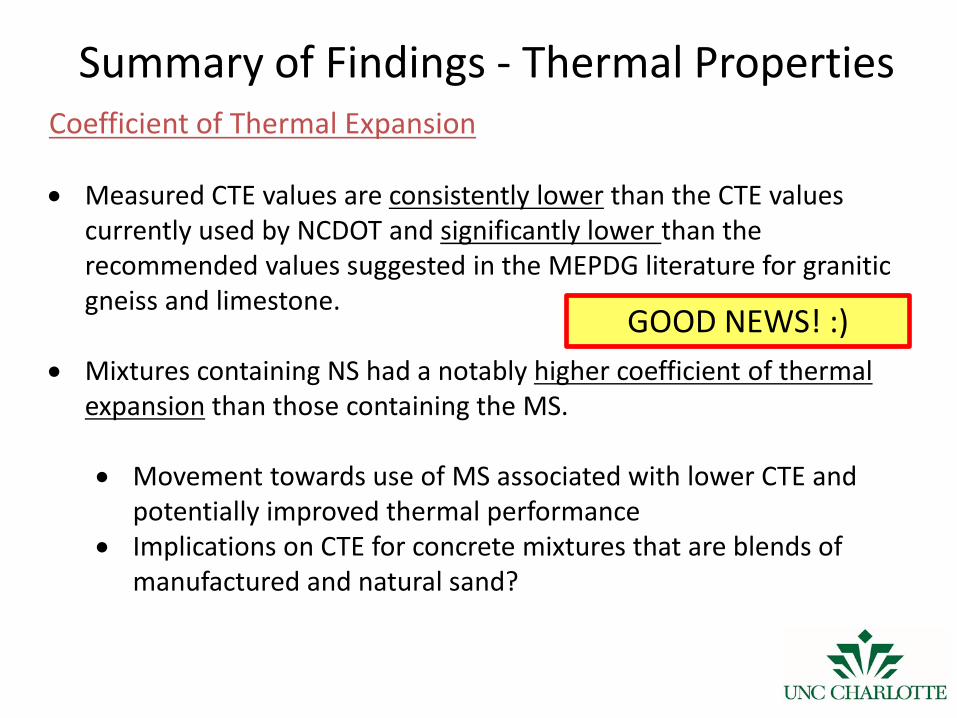
Summary of Findings - Thermal PropertiesCoefficient of Thermal Expansion
• Measured CTE values are consistently lower than the CTE values currently used by NCDOT and significantly lower than the recommended values suggested in the MEPDG literature for granitic gneiss and limestone.
• Mixtures containing NS had a notably higher coefficient of thermal expansion than those containing the MS.
• Movement towards use of MS associated with lower CTE and potentially improved thermal performance
• Implications on CTE for concrete mixtures that are blends of manufactured and natural sand?
GOOD NEWS! :)
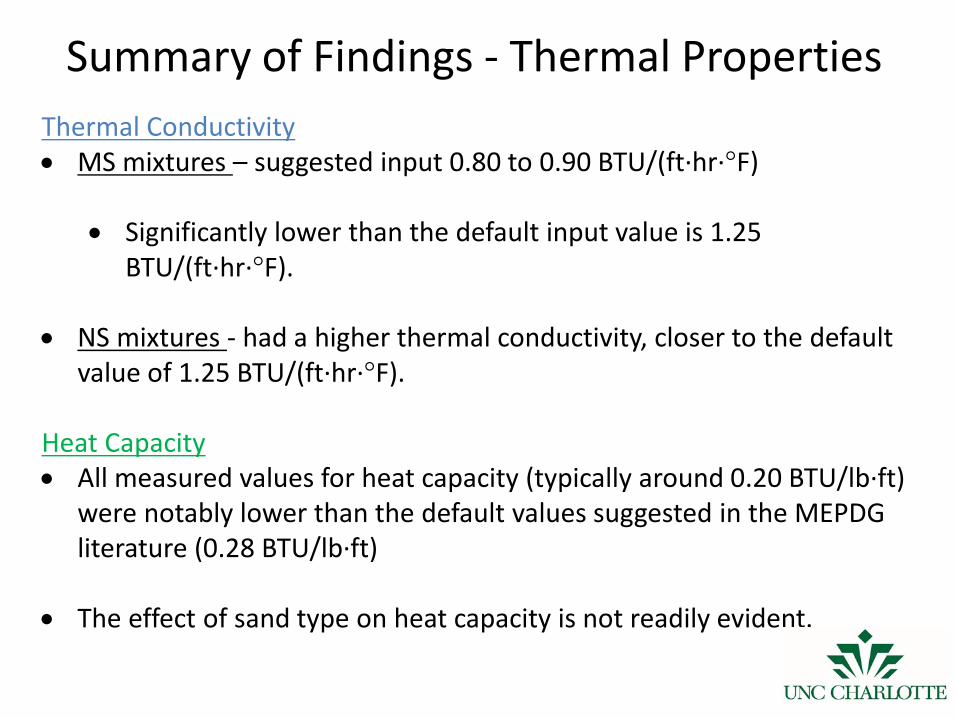
Thermal Conductivity• MS mixtures – suggested input 0.80 to 0.90 BTU/(ft·hr·°F)
• Significantly lower than the default input value is 1.25 BTU/(ft·hr·°F).
• NS mixtures - had a higher thermal conductivity, closer to the default value of 1.25 BTU/(ft·hr·°F).
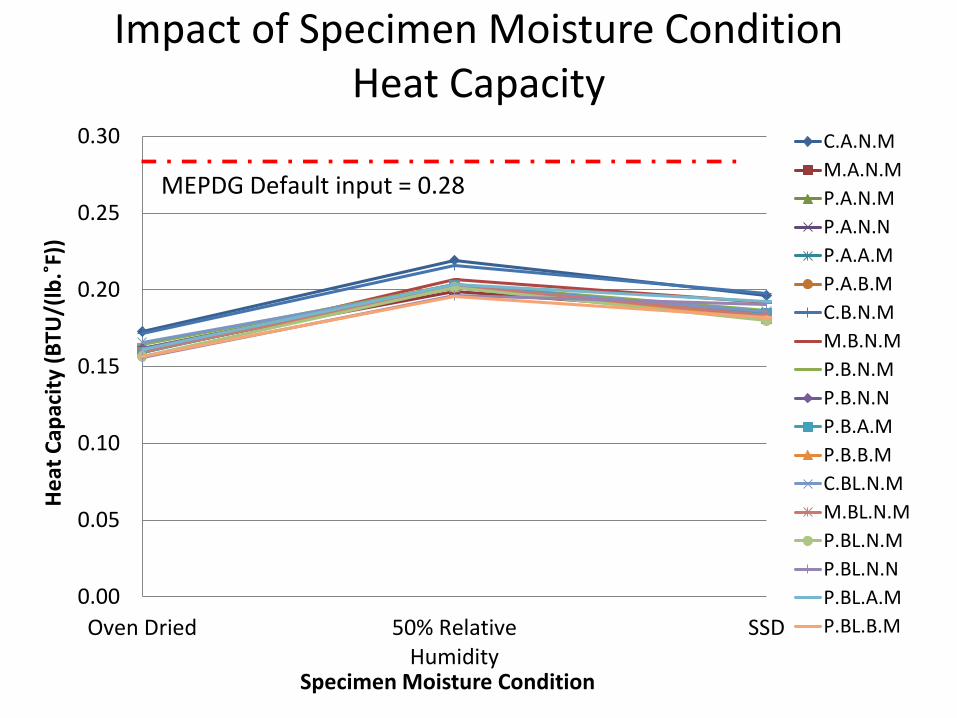
Heat Capacity • All measured values for heat capacity (typically around 0.20 BTU/lb·ft)
were notably lower than the default values suggested in the MEPDG literature (0.28 BTU/lb·ft)
• The effect of sand type on heat capacity is not readily evident.
Summary of Findings - Thermal Properties
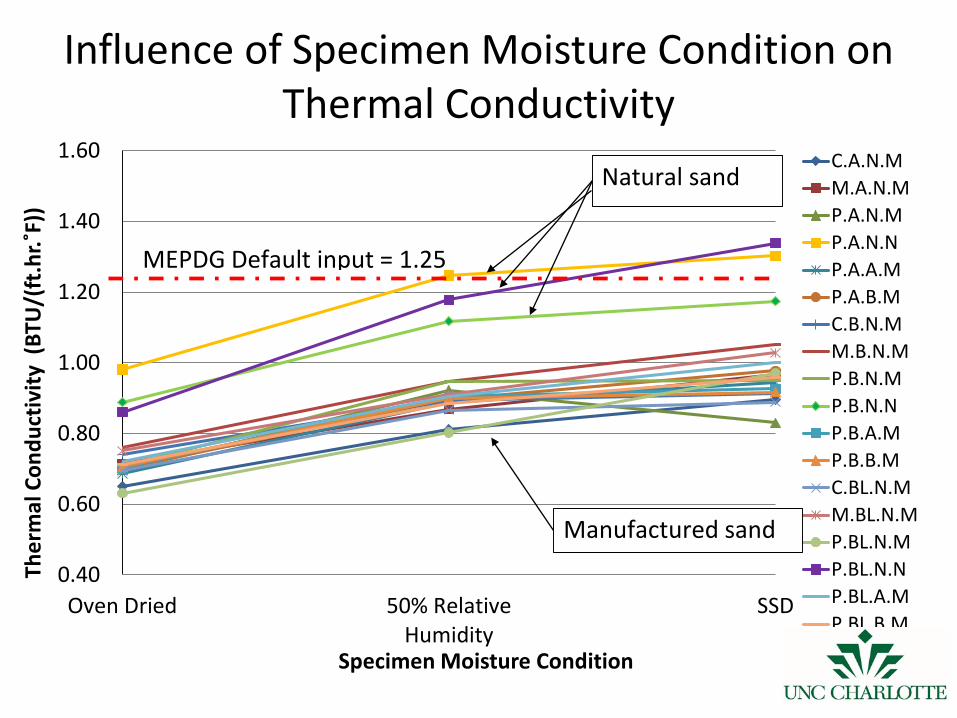
Influence of Specimen Moisture Condition onThermal Conductivity
0.40
0.60
0.80
1.00
1.20
1.40
1.60
Oven Dried 50% RelativeHumidity
SSD
Ther
mal
Con
duct
ivity
(BT
U/(
ft.h
r.˚F)
)
Specimen Moisture Condition
C.A.N.MM.A.N.MP.A.N.MP.A.N.NP.A.A.MP.A.B.MC.B.N.MM.B.N.MP.B.N.MP.B.N.NP.B.A.MP.B.B.MC.BL.N.MM.BL.N.MP.BL.N.MP.BL.N.NP.BL.A.MP.BL.B.M
Manufactured sand
MEPDG Default input = 1.25
Natural sand
0.00
0.05
0.10
0.15
0.20
0.25
0.30
Oven Dried 50% RelativeHumidity
SSD
Hea
t Cap
acity
(BTU
/(lb
.˚F))
Specimen Moisture Condition
C.A.N.MM.A.N.MP.A.N.MP.A.N.NP.A.A.MP.A.B.MC.B.N.MM.B.N.MP.B.N.MP.B.N.NP.B.A.MP.B.B.MC.BL.N.MM.BL.N.MP.BL.N.MP.BL.N.NP.BL.A.MP.BL.B.M
MEPDG Default input = 0.28
Impact of Specimen Moisture ConditionHeat Capacity
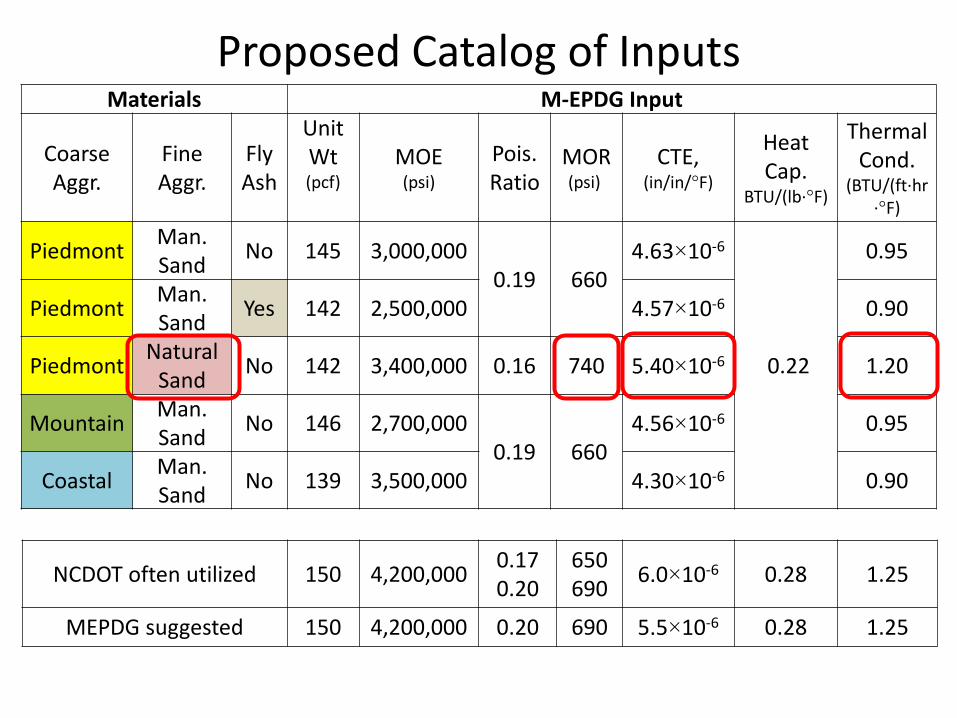
Proposed Catalog of InputsMaterials M-EPDG Input
Coarse Aggr.
Fine Aggr.
Fly Ash
Unit Wt(pcf)
MOE(psi)
Pois.Ratio
MOR (psi)
CTE, (in/in/°F)
Heat Cap.
BTU/(lb·°F)
Thermal Cond.
(BTU/(ft·hr·°F)
Piedmont Man. Sand No 145 3,000,000
0.19 6604.63×10-6
0.22
0.95
Piedmont Man. Sand Yes 142 2,500,000 4.57×10⁻⁶ 0.90
Piedmont NaturalSand No 142 3,400,000 0.16 740 5.40×10⁻⁶ 1.20
Mountain Man. Sand No 146 2,700,000
0.19 6604.56×10-6 0.95
Coastal Man. Sand No 139 3,500,000 4.30×10⁻⁶ 0.90
NCDOT often utilized 150 4,200,000 0.170.20
650690 6.0×10⁻⁶ 0.28 1.25
MEPDG suggested 150 4,200,000 0.20 690 5.5×10⁻⁶ 0.28 1.25
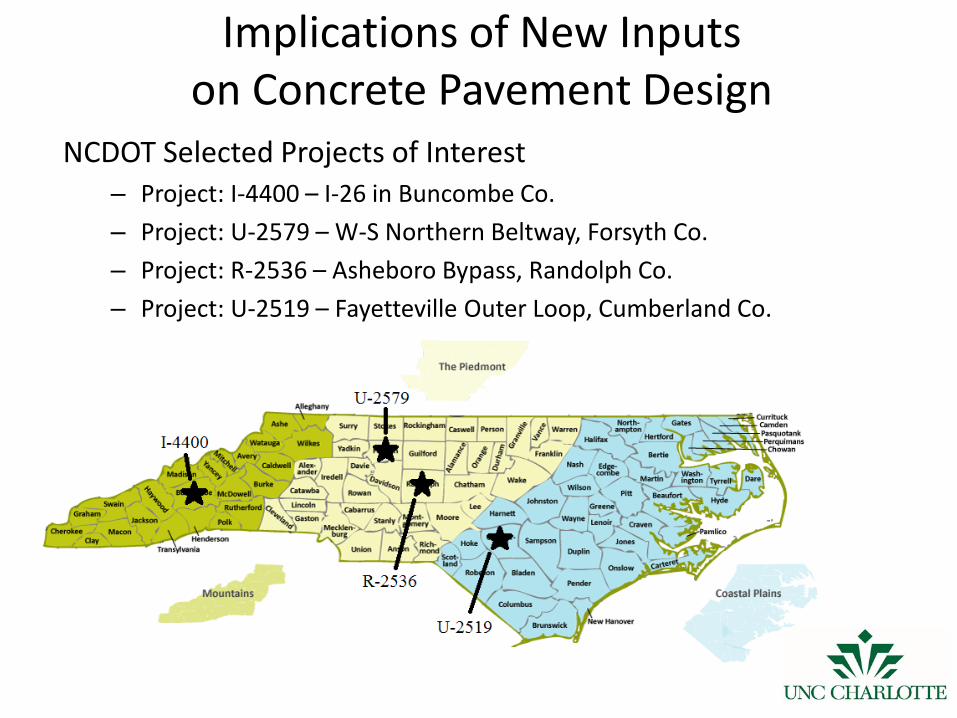
Implications of New Inputs on Concrete Pavement Design
NCDOT Selected Projects of Interest– Project: I-4400 – I-26 in Buncombe Co.– Project: U-2579 – W-S Northern Beltway, Forsyth Co.– Project: R-2536 – Asheboro Bypass, Randolph Co. – Project: U-2519 – Fayetteville Outer Loop, Cumberland Co.
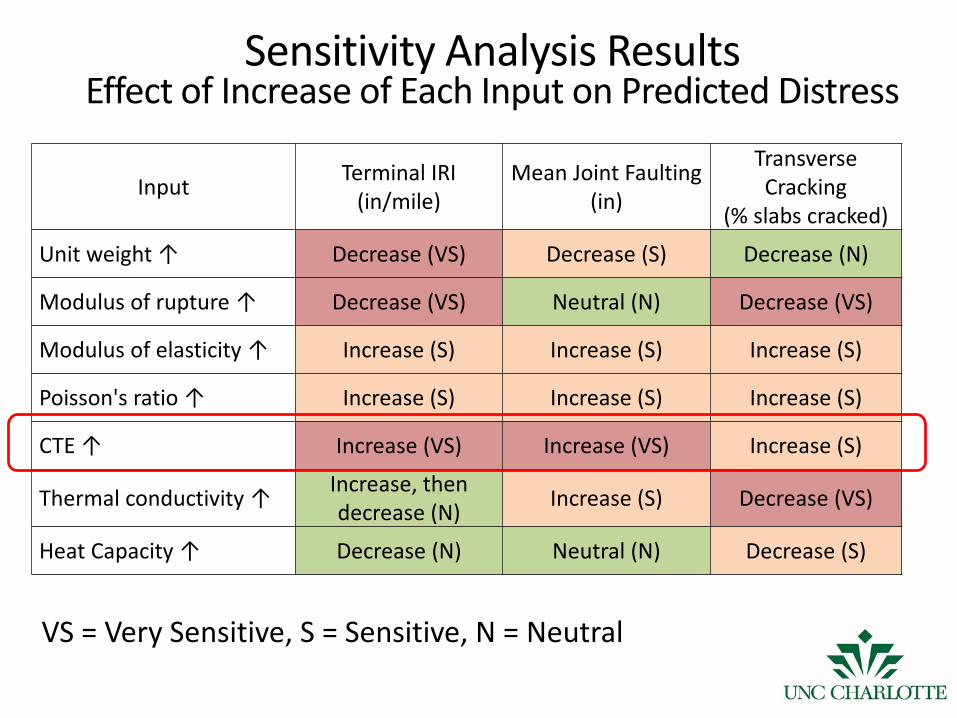
Sensitivity Analysis Results Effect of Increase of Each Input on Predicted Distress
Input Terminal IRI (in/mile)
Mean Joint Faulting (in)
Transverse Cracking
(% slabs cracked)
Unit weight ↑ Decrease (VS) Decrease (S) Decrease (N)
Modulus of rupture ↑ Decrease (VS) Neutral (N) Decrease (VS)
Modulus of elasticity ↑ Increase (S) Increase (S) Increase (S)
Poisson's ratio ↑ Increase (S) Increase (S) Increase (S)
CTE ↑ Increase (VS) Increase (VS) Increase (S)
Thermal conductivity ↑ Increase, then decrease (N) Increase (S) Decrease (VS)
Heat Capacity ↑ Decrease (N) Neutral (N) Decrease (S)
VS = Very Sensitive, S = Sensitive, N = Neutral
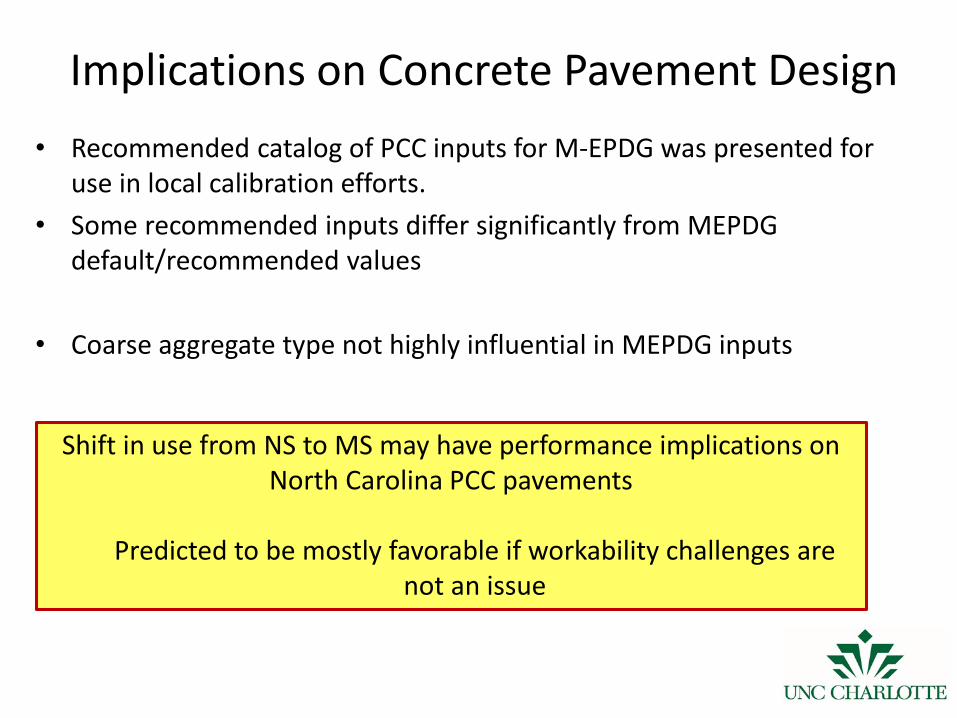
• Recommended catalog of PCC inputs for M-EPDG was presented for use in local calibration efforts.
• Some recommended inputs differ significantly from MEPDG default/recommended values
• Coarse aggregate type not highly influential in MEPDG inputs
Implications on Concrete Pavement Design
Shift in use from NS to MS may have performance implications on North Carolina PCC pavements
Predicted to be mostly favorable if workability challenges are not an issue
Thank you!• Greg Dean – Carolinas Concrete Paving Association• Fred White, Chris Ange, Willie Barnett – Lane Construction• John Romaine, Adam Bruner – Zachry Construction• Clark Morrison, Brian Hunter, Sam Fredrick, Chris Peoples, Nilesh Surti - NCDOT
• Brett Tempest – UNC Charlotte• Edward Blanchard, Clayton Medlin, Rohit Chimmula – formerly UNC Charlotte
Resources• Whitney, D., Fowler, D.W., and Rached, M. (2013). Use of Manufactured Sands
for Concrete Pavement. Report FHWA/TX-13/0-6255-1. Texas Department of Transportation, Austin, TX.
• Cavalline, T.L., Tempest, B.Q., Blanchard, E.H., Medlin, C.D., and Chimmula, R.R. (2018). “Improved Data for Mechanistic-Empirical Design for Concrete Pavements”. Final Report, Project FHWA/NC/2015-03, North Carolina Department of Transportation. August 2018.
• Cavalline, T.L., Tempest, B.Q., Blanchard, E., Medlin, C., Chimmula, R. and Morrison, C. (2018). “Impact of Local Calibration Using Sustainable Materials for Rigid Pavement Analysis and Design.” ASCE Journal of Transportation: Part B Pavements, 144(4).
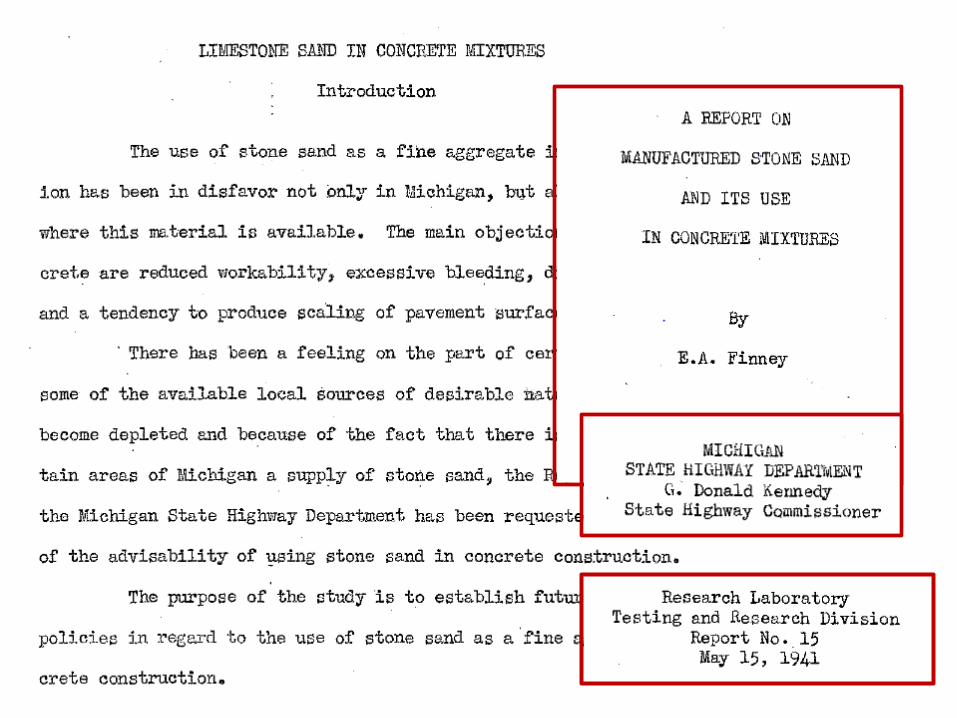
• Finney, E.A. (1941). A Report on Manufactured Stone Sand and Its Use in Concrete Mixtures. Michigan State Highway Department.
• Pilegis, M., Gardner, D, and Lark, R. (2016). “An Investigation into the Use of Manufactured Sand as a 100% Replacement for Fine Aggregate in Concrete.” Materials, 9, 440.