Embed Size (px)
Citation preview

Broad Lane, Sheffield, S3 7HQTelephone:+44 (0)114 289 2000Facsimile: +44 (0)114 289 2500
© Crown copyright 2002
Manual handling in refuse collection
HSL/2002/21
Human Factors Group
Andrew DJ Pinder PhD and Ed Milnes MSc
Dr Andrew PinderProject Leader:
Summary
Objectives
1. To review scientific literature on manual handling operations in refuse collection.
2. To identify risk factors for musculoskeletal disorders in refuse collection in an urbanenvironment. A variety of collection systems for domestic and trade waste werestudied including the collection of recyclable waste in wheeled bins andnon-recyclable waste in bags and wheeled bins.
3. To provide recommendations for methods of reducing the risks of musculoskeletaldisorders in refuse collection.
Main Findings
1. A significant body of, largely European, scientific literature exists on manualhandling in refuse collection.
2. The findings of the literature are consistent with the observations made in this study.
3. Refuse collection and recycling practices vary between and within localities.
4. A wide range of factors, such as terrain, architecture, road layouts and traffic, thehabits of drug addicts, local feeling on wheelie bins, and time of day, can affect thekind of manual handling operations carried out in refuse collection.
5. Refuse collectors use a variety of methods to make their task easier, such as sendingcrew members ahead of the vehicle to gather refuse bags into piles.
6. Coding of postures using OWAS showed that overall, stressful postures wereadopted for small percentages of time with almost all falling into Action Category 1,which is deemed to not require action to reduce the risks from them.
7. Manual handling of refuse sacks usually involves handling several sacks at once, heldand carried separately in each hand. Refuse collectors generally use stoopingpostures to pick up bags. Stooping and twisting postures occur frequently but theoverall duration of each one is very short.
8. Typical weights of domestic refuse sacks are between 4 and 6 kg. Fewer than 10%weigh more than 12 kg. It is rare that a sack weighs more than 20 kg.
9. Refuse sacks are usually thrown onto the back of the vehicle rather than being liftedand placed into it. This is a dynamic action usually carried out while the worker isstill walking.
10. Throwing bags into a refuse lorry requires the lifting of the hands above theshoulders, though this occurs for relatively short durations.
11. The heights at which bags have to be thrown into refuse lorries (the ‘rave heights’)are such that approximately half of the male working population would haveproblems throwing the heaviest bags into the lorries.
12. Bag handling occurs at a moderately high frequency with approximately 7 lifts,carries and throws per minute during periods of actual collection of bags.
13. Refuse in bags can be hazardous due to the presence of sharp objects such as brokenglass or discarded syringes. There are also hazards from foul or infectious material.
14. On some occasions the old style of round non-wheeled dustbin are still manuallylifted and emptied into the refuse vehicle.
15. A variety of sizes of wheelie bin are used by business premises and large residentialbuildings, ranging from the domestic 240 litre size to 1100 litre Eurobins and Paladinbins. Some business premises bag their refuse in preference to a wheelie bin service.
16. There is a general move from Paladins to Eurobins since they are easier to handlemanually and do not require specialised clamping systems for mechanical handling.Some local authorities have installed bulk refuse storage systems that are emptiedmechanically without any manual handling.
17. Pushing and pulling virtually never occur on rounds dealing with refuse in bags.Considerable amounts of pushing and pulling occur on rounds dealing with wheeliebins. Pulling of bins is slightly more common than pushing them.
18. Even on rounds that are ostensibly dealing solely with wheeled bins, significantmanual handling of refuse bags and other loose refuse also occurs.
19. Refuse collectors walk considerable distances each day. Apart from when travellingin the refuse lorry, their lower limb postures are largely standing or walking.
20. The cardiovascular demands of the different methods of refuse collection do notappear to be excessive for normally fit workers.

Main Recommendations
1. Wherever possible, refuse collection should be carried out using wheelie bins ofappropriate sizes rather than bags or small dustbins.
2. As Government policy is to increase the amount of waste recycled, partly through thetaxation of landfill, schemes which encourage householders to separate recyclablewaste will become more common. Where recycling collections are made by localauthorities or their contractors, separate wheelie bins should be provided whereverpossible.
3. The schedules of recycling / no-recycling collections should be matched to therelative volumes of recyclable and non-recyclable material to keep the volumescollected approximately constant.
4. Where use of wheelie bins is impractical, collection of bags is likely to continueunless bulk collection facilities can be implemented. In these circumstancesrecycling should be encouraged by the provision of green bins and bags.
5. Old-style dustbins should never be emptied manually into refuse vehicles. Wherehouseholders still use them they should be encouraged to line them with black bagsbefore putting refuse into them.
6. Eurobins should be:
a. Handled by two people whenever possible;
b. Transported across dropped kerbs wherever possible and particularly when beingreturned after emptying which is when most of the pulling back up kerbs wouldusually occur.
7. When moving any size of bin the refuse collectors should:
a. Ensure there is sufficient space to manoeuvre the bin by moving surroundingobstacles, opening doors, etc.
b. Try to avoid pushing or pulling the bin across obstacles such as steps and kerbs.
c. Seek assistance when having trouble moving a bin - particularly if moving it upor down a slope or kerb or step.
8. Manufacturers should be encouraged to consider the following changes / aspects ofthe bins:
a. Increasing wheel diameter;
b. Use of lightweight materials - especially in the larger 360 and 1100 litreEurobins.
9. Where possible, lorries without lifting gear and with a low rave height should beprovided for rounds dealing solely with bags. Where the same vehicles are used fordifferent rounds, consideration should be given to demounting the lifting gear for thebags-only rounds.
10. Where lifting gear is fitted, the rave bar should be lowered when not collectingwheelie bins. This recommendation should only be ignored if specific safety risksthat outweigh the manual handling risks of keeping the bar up can be clearlydemonstrated.
11. The refuse collectors should be involved in a scheme with the relevant localauthorities to identify areas where improvements could be made to their workenvironment. This would consider where kerbs should be dropped, ramps installed,alleys and pavements resurfaced and rubble or building waste cleared.
12. Refuse collectors and local residents / trade proprietors should all be involved inschemes to reduce the refuse collectors’ workload. The refuse collectors couldidentify the premises and types of problems they face, e.g., fetching bins from thebacks of shops, etc. Suggestions could then be made to residents / proprietors abouthow they can help.
13. Refuse collectors should be provided with effective PPE for their hands and legs.This would not only help reduce the risk of lacerations, infections and disease but itmay also enable refuse collectors to grip, hold and carry refuse in optimal ways, i.e.,held in a balanced way and not held so far away from the legs.

Contents
594.4. Heart rate data . . . . . . . . . . . . . . . . . . . . . . . . . . . . . . . . . . . . . . . . . . . . . . . . . .514.3.3. Trade round (bins / bags) . . . . . . . . . . . . . . . . . . . . . . . . . . . . . . . . . . . . . . . .464.3.2. Green bin round . . . . . . . . . . . . . . . . . . . . . . . . . . . . . . . . . . . . . . . . . . . . . . . .414.3.1. Bags rounds . . . . . . . . . . . . . . . . . . . . . . . . . . . . . . . . . . . . . . . . . . . . . . . . . . . .414.3. Photographic records . . . . . . . . . . . . . . . . . . . . . . . . . . . . . . . . . . . . . . . . . . . .394.2.4. Sizes of object handled on the trade round . . . . . . . . . . . . . . . . . . . . . . . . .374.2.3. Use of the hands in handling refuse . . . . . . . . . . . . . . . . . . . . . . . . . . . . . . .344.2.2. Type of object being handled . . . . . . . . . . . . . . . . . . . . . . . . . . . . . . . . . . . . .324.2.1. Types of handling operations carried out . . . . . . . . . . . . . . . . . . . . . . . . . . .324.2. Results of analysis of handling operations . . . . . . . . . . . . . . . . . . . . . . . . .314.1.5. Assignment of postures to OWAS Action Categories . . . . . . . . . . . . . . . .294.1.4. Leg postures / activities . . . . . . . . . . . . . . . . . . . . . . . . . . . . . . . . . . . . . . . . . .274.1.3. Positions of hands relative to the shoulders . . . . . . . . . . . . . . . . . . . . . . . .254.1.2. Trunk postures . . . . . . . . . . . . . . . . . . . . . . . . . . . . . . . . . . . . . . . . . . . . . . . . . .244.1.1. Introduction . . . . . . . . . . . . . . . . . . . . . . . . . . . . . . . . . . . . . . . . . . . . . . . . . . . . .244.1. Results of posture analysis . . . . . . . . . . . . . . . . . . . . . . . . . . . . . . . . . . . . . . .244. Results . . . . . . . . . . . . . . . . . . . . . . . . . . . . . . . . . . . . . . . . . . . . . . . . . . . . . . . .233.5.2. Assignment of postures to OWAS Action Categories . . . . . . . . . . . . . . . .213.5.1. Posture coding . . . . . . . . . . . . . . . . . . . . . . . . . . . . . . . . . . . . . . . . . . . . . . . . . .203.5. Postural analysis . . . . . . . . . . . . . . . . . . . . . . . . . . . . . . . . . . . . . . . . . . . . . . . .203.4. Heart rate monitoring . . . . . . . . . . . . . . . . . . . . . . . . . . . . . . . . . . . . . . . . . . . .203.3. Measurement of bag weights . . . . . . . . . . . . . . . . . . . . . . . . . . . . . . . . . . . . .193.2. Details of the refuse collection rounds studied . . . . . . . . . . . . . . . . . . . . . .193.1.4. Other methods of refuse collection . . . . . . . . . . . . . . . . . . . . . . . . . . . . . . . .183.1.3. Trade round . . . . . . . . . . . . . . . . . . . . . . . . . . . . . . . . . . . . . . . . . . . . . . . . . . . .183.1.2. Domestic rounds . . . . . . . . . . . . . . . . . . . . . . . . . . . . . . . . . . . . . . . . . . . . . . . .183.1.1. Systems of refuse collection . . . . . . . . . . . . . . . . . . . . . . . . . . . . . . . . . . . . . .183.1. Introduction . . . . . . . . . . . . . . . . . . . . . . . . . . . . . . . . . . . . . . . . . . . . . . . . . . . . .183. Methods . . . . . . . . . . . . . . . . . . . . . . . . . . . . . . . . . . . . . . . . . . . . . . . . . . . . . . .172.7. Long term effects of changes in working patterns . . . . . . . . . . . . . . . . . . .172.6. Job rotation . . . . . . . . . . . . . . . . . . . . . . . . . . . . . . . . . . . . . . . . . . . . . . . . . . . . .162.5.2. Physical capacity of refuse collectors . . . . . . . . . . . . . . . . . . . . . . . . . . . . . .162.5.1. Psychosocial factors . . . . . . . . . . . . . . . . . . . . . . . . . . . . . . . . . . . . . . . . . . . . .162.5. Effects on health and fitness / survival in the job . . . . . . . . . . . . . . . . . . . .152.4. Pushing and pulling . . . . . . . . . . . . . . . . . . . . . . . . . . . . . . . . . . . . . . . . . . . . .
82.3. Mechanical load on the low back . . . . . . . . . . . . . . . . . . . . . . . . . . . . . . . . . . .72.2.5. Laboratory study of refuse collection methods . . . . . . . . . . . . . . . . . . . . . . .62.2.4. Study of actual working practices . . . . . . . . . . . . . . . . . . . . . . . . . . . . . . . . . .62.2.3. Effect of changing work practices . . . . . . . . . . . . . . . . . . . . . . . . . . . . . . . . . .52.2.2. Daily workload of refuse collectors . . . . . . . . . . . . . . . . . . . . . . . . . . . . . . . . .52.2.1. Comparison of dustbins and black bags . . . . . . . . . . . . . . . . . . . . . . . . . . . .52.2. Energetic demands of refuse collection . . . . . . . . . . . . . . . . . . . . . . . . . . . . .12.1. Occupational health problems in refuse collection . . . . . . . . . . . . . . . . . . . .12. Literature review . . . . . . . . . . . . . . . . . . . . . . . . . . . . . . . . . . . . . . . . . . . . . . . . .11. Introduction . . . . . . . . . . . . . . . . . . . . . . . . . . . . . . . . . . . . . . . . . . . . . . . . . . . . . .
768. Bibliography . . . . . . . . . . . . . . . . . . . . . . . . . . . . . . . . . . . . . . . . . . . . . . . . . . . .747. Recommendations . . . . . . . . . . . . . . . . . . . . . . . . . . . . . . . . . . . . . . . . . . . . . .736.3.3. Resident / proprietor involvement . . . . . . . . . . . . . . . . . . . . . . . . . . . . . . . . .726.3.2. Physical environment changes . . . . . . . . . . . . . . . . . . . . . . . . . . . . . . . . . . . .726.3.1. Lowering the rave rail on the refuse truck . . . . . . . . . . . . . . . . . . . . . . . . . .726.3. Work environment changes (lift height, kerbs, steps, etc.) . . . . . . . . . . . .726.2. Changes to the design of wheelie bins . . . . . . . . . . . . . . . . . . . . . . . . . . . . .706.1. Changes to methods of refuse collection . . . . . . . . . . . . . . . . . . . . . . . . . . .706. Manual handling risk control methods . . . . . . . . . . . . . . . . . . . . . . . . . . . . .695.5. Physical fitness . . . . . . . . . . . . . . . . . . . . . . . . . . . . . . . . . . . . . . . . . . . . . . . . .695.4. PPE and additional health risks . . . . . . . . . . . . . . . . . . . . . . . . . . . . . . . . . . .685.3.2. Kerbs, steps and obstructions . . . . . . . . . . . . . . . . . . . . . . . . . . . . . . . . . . . .685.3.1. Manoeuvring bins in restricted spaces . . . . . . . . . . . . . . . . . . . . . . . . . . . . .685.3. Handling of wheelie bins . . . . . . . . . . . . . . . . . . . . . . . . . . . . . . . . . . . . . . . . .675.2.5. Throw in height of the truck (‘rave height’) . . . . . . . . . . . . . . . . . . . . . . . . . .675.2.4. Trunk twisting and raising the arms above shoulder height . . . . . . . . . . .665.2.3. Stooping while picking up bags . . . . . . . . . . . . . . . . . . . . . . . . . . . . . . . . . . .665.2.2. Handling of round dustbins . . . . . . . . . . . . . . . . . . . . . . . . . . . . . . . . . . . . . . .635.2.1. Weights of bags . . . . . . . . . . . . . . . . . . . . . . . . . . . . . . . . . . . . . . . . . . . . . . . .635.2. Bag handling . . . . . . . . . . . . . . . . . . . . . . . . . . . . . . . . . . . . . . . . . . . . . . . . . . .635.1. MSD risk factors . . . . . . . . . . . . . . . . . . . . . . . . . . . . . . . . . . . . . . . . . . . . . . . .635. Discussion . . . . . . . . . . . . . . . . . . . . . . . . . . . . . . . . . . . . . . . . . . . . . . . . . . . . .624.5. Bag weights . . . . . . . . . . . . . . . . . . . . . . . . . . . . . . . . . . . . . . . . . . . . . . . . . . . .614.4.3. Trade round (bins / trade sacks) . . . . . . . . . . . . . . . . . . . . . . . . . . . . . . . . . .604.4.2. Green wheelie bins round . . . . . . . . . . . . . . . . . . . . . . . . . . . . . . . . . . . . . . . .594.4.1. Bags round . . . . . . . . . . . . . . . . . . . . . . . . . . . . . . . . . . . . . . . . . . . . . . . . . . . . .

Tables
70Table 28. Summary of heart rate data . . . . . . . . . . . . . . . . . . . . . . . . . . . . . . . . . . .65Table 27. Risk assessment for handling wheelie bins . . . . . . . . . . . . . . . . . . . . . .64Table 26. Risk assessment for handling of bags . . . . . . . . . . . . . . . . . . . . . . . . . .31Table 25. OWAS Action Categories assigned to postures . . . . . . . . . . . . . . . . . .25Table 24. Details of video recorded (times are in hh:mm:ss) . . . . . . . . . . . . . . . .23
Table 23. Percentages of time in a posture and OWAS assignments toAction Categories . . . . . . . . . . . . . . . . . . . . . . . . . . . . . . . . . . . . . . . . . . . .
23Table 22. OWAS Action Categories . . . . . . . . . . . . . . . . . . . . . . . . . . . . . . . . . . . . .22Table 21. Assignment of postures to Behavioural Classes / Elements . . . . . . .19Table 20. Details of the rounds studied . . . . . . . . . . . . . . . . . . . . . . . . . . . . . . . . . .17Table 19. Combinations of jobs studied by Kuijer et al. (1999) . . . . . . . . . . . . . .15
Table 18. Forces at the hands when handling a 240 litre wheelie bin(from Table 1 of Schibye et al., 2001a) . . . . . . . . . . . . . . . . . . . . . . . . .
12Table 17. Daily number of events for the three methods of refuse
collection. Data from Table 4 of de Looze et al. (1995) . . . . . . . . . . .
11Table 16. Data from Table 3 of de Looze et al. (1995) on significance
of effects on spinal loading in different methods of handling . . . . . . .
9Table 15. Variables studied for 1100 litre metal wheelie bins
(‘containers’) . . . . . . . . . . . . . . . . . . . . . . . . . . . . . . . . . . . . . . . . . . . . . . . . . .
9Table 14. Variables studied for two-wheel wheelie bins
(‘mini-containers’) . . . . . . . . . . . . . . . . . . . . . . . . . . . . . . . . . . . . . . . . . . . . .
9Table 13. Variables studied for bag handling . . . . . . . . . . . . . . . . . . . . . . . . . . . . . .8Table 12. Bin weights found by Jäger et al. (1984) . . . . . . . . . . . . . . . . . . . . . . . . .8
Table 11. Heart rate and oxygen consumption in refuse collection(from Table 3 in Frings-Dresen et al., 1995b) . . . . . . . . . . . . . . . . . . . . .
7Table 10. Times spent in the different activities . . . . . . . . . . . . . . . . . . . . . . . . . . . .7Table 9. Typical weights for different methods of collecting refuse . . . . . . . . . .7Table 8. Field study of refuse collection (Frings-Dresen et al., 1995a) . . . . . . . .5
Table 7. Table 5 from Kemper et al. (1990) for refuse collectorshandling polythene bags (n=23) . . . . . . . . . . . . . . . . . . . . . . . . . . . . . . . . .
5Table 6. Effect of changing from dustbins to black bags . . . . . . . . . . . . . . . . . . .4
Table 5. Energetic load related to waste collection (Poulsen et al.,1995) . . . . . . . . . . . . . . . . . . . . . . . . . . . . . . . . . . . . . . . . . . . . . . . . . . . . . . . .
4Table 4. Mechanical loads estimated in studies of refuse collection
(after Poulsen et al., 1995) . . . . . . . . . . . . . . . . . . . . . . . . . . . . . . . . . . . . .
3
Table 3. Annual incidence rates, per 1000 employees, ofoccupational accidents in Denmark, 1984 to 1992 (afterPoulsen et al., 1995) . . . . . . . . . . . . . . . . . . . . . . . . . . . . . . . . . . . . . . . . . . .
3
Table 2. Annual incidence rates, per 1000 employees, of reportedhealth problems in Denmark, 1984 to 1992 (after Poulsen etal., 1995) . . . . . . . . . . . . . . . . . . . . . . . . . . . . . . . . . . . . . . . . . . . . . . . . . . . . .
2Table 1. Factors influencing the work conditions of waste collectors
(Poulsen et al., 1995) . . . . . . . . . . . . . . . . . . . . . . . . . . . . . . . . . . . . . . . . . .

Figures
45Figure 35. Handling of pieces of broken glass . . . . . . . . . . . . . . . . . . . . . . . . . . . . .45Figure 34. Bin being tipped into truck . . . . . . . . . . . . . . . . . . . . . . . . . . . . . . . . . . . . .44Figure 33. Bins being carried to and emptied into lorry . . . . . . . . . . . . . . . . . . . . .44Figure 32. Plastic dustbin being emptied into back of lorry . . . . . . . . . . . . . . . . . .43Figure 31. Black bags being lifted from the pavement . . . . . . . . . . . . . . . . . . . . . .43Figure 30. Black bags / refuse being lifted from the pavement . . . . . . . . . . . . . . .42Figure 29. Black bags being loaded into lorry . . . . . . . . . . . . . . . . . . . . . . . . . . . . . .42Figure 28. Black bags ready for collection . . . . . . . . . . . . . . . . . . . . . . . . . . . . . . . . .41Figure 27. Black bags being carried and thrown into lorry . . . . . . . . . . . . . . . . . . .40Figure 26. Mean durations (s) spent handling different size bins . . . . . . . . . . . . .40Figure 25. Relative time spent handling different size bins . . . . . . . . . . . . . . . . . .39Figure 24. Frequency of handling of different sizes bins . . . . . . . . . . . . . . . . . . . .39Figure 23. Mean durations (s) of hand use . . . . . . . . . . . . . . . . . . . . . . . . . . . . . . . .38Figure 22. Relative times spent using the hands . . . . . . . . . . . . . . . . . . . . . . . . . . .37Figure 21. Frequency of use of the hands in handling refuse . . . . . . . . . . . . . . . .36Figure 20. Mean durations (s) of handling different objects . . . . . . . . . . . . . . . . . .36Figure 19. Relative time spent handling different objects . . . . . . . . . . . . . . . . . . . .35Figure 18. Frequency of handling of different objects . . . . . . . . . . . . . . . . . . . . . . .34Figure 17. Mean durations (s) of different manual handling operations . . . . . . .33
Figure 16. Duration of different manual handling operations(percentage of visible time) . . . . . . . . . . . . . . . . . . . . . . . . . . . . . . . . . . . .
32Figure 15. Occurrences of different manual handling operations . . . . . . . . . . . . .31Figure 14. Mean durations (s) of leg activities . . . . . . . . . . . . . . . . . . . . . . . . . . . . .30Figure 13. Activity of legs (percentage of visible time) . . . . . . . . . . . . . . . . . . . . . .29Figure 12. Occurrences of changes of leg actions . . . . . . . . . . . . . . . . . . . . . . . . . .29Figure 11. Mean durations (s) of hand positions relative to the shoulder . . . . . . .28Figure 10. Relative durations of positions of hands relative to shoulders . . . . . . .28Figure 9. Number of times hand coding changed . . . . . . . . . . . . . . . . . . . . . . . . .27Figure 8. Mean durations (s) of trunk postures . . . . . . . . . . . . . . . . . . . . . . . . . . .26Figure 7. Posture of trunk (percentage of time visible) . . . . . . . . . . . . . . . . . . . . .26Figure 6. Occurrences of different trunk postures . . . . . . . . . . . . . . . . . . . . . . . . .20Figure 5. Weighing of bags with a Mecmesin dynamometer . . . . . . . . . . . . . . . .14
Figure 4. Fig. 4 from Schibye et al. (2001a): Directions of resultantforces in the initial and sustained phases of pushing andpulling a 240 litre wheelie bin. . . . . . . . . . . . . . . . . . . . . . . . . . . . . . . . . . .
14
Figure 3. Fig. 3 from Schibye et al. (2001a), showing the sequence ofevents during (a) pushing and (b) pushing. The numbersdenote time from the onset of the operation and the arrowsindicate the size and direction of resultant forces . . . . . . . . . . . . . . . .
13Figure 2. Fig 2. from Schibye et al. (2001a), an example resultant
force trace from a pushing operation. . . . . . . . . . . . . . . . . . . . . . . . . . . .
10
Figure 1. Estimates of spinal compression for a single subject of deLooze et al. (1995) for (a) picking up / throwing bags; (b)tilting / pushing a small wheelie-bin; (c) pulling an 1100 litrewheelie bin; and (d) lifting an 1100 litre wheelie bin up akerb. . . . . . . . . . . . . . . . . . . . . . . . . . . . . . . . . . . . . . . . . . . . . . . . . . . . . . . . .

68Figure 68. Variations in height of the lip at the back of the refuse truck . . . . . . .62Figure 67. Distribution of weights of bags . . . . . . . . . . . . . . . . . . . . . . . . . . . . . . . . .61Figure 66. Trade round, Subject B . . . . . . . . . . . . . . . . . . . . . . . . . . . . . . . . . . . . . . .61Figure 65. Trade round, Subject A . . . . . . . . . . . . . . . . . . . . . . . . . . . . . . . . . . . . . . .60Figure 64. Green wheelie bins . . . . . . . . . . . . . . . . . . . . . . . . . . . . . . . . . . . . . . . . . . .59Figure 63. Bags round, Subject B . . . . . . . . . . . . . . . . . . . . . . . . . . . . . . . . . . . . . . . .59Figure 62. Bags round, Subject A . . . . . . . . . . . . . . . . . . . . . . . . . . . . . . . . . . . . . . . .58Figure 61. The point of release of the last sack . . . . . . . . . . . . . . . . . . . . . . . . . . . .58Figure 60. Two-handed lift and twisting throw of the last sack . . . . . . . . . . . . . . .57Figure 59. Two-handed lift of the third sack from the ground . . . . . . . . . . . . . . . .57Figure 58. Two-handed throw of the second sack into the truck . . . . . . . . . . . . .57Figure 57. One-handed throw of the first sack into the back of the truck . . . . . . .56Figure 56. Carrying three trade sacks and starting to throw the first . . . . . . . . . .56Figure 55. 360 litre bin and trade sack being loaded into truck . . . . . . . . . . . . . . .55Figure 54. 360 litre bin being returned to distant storage location . . . . . . . . . . . .55Figure 53. Removal of 360 litre bin from refuse store . . . . . . . . . . . . . . . . . . . . . . .54Figure 52. 240 litre trade bins being manoeuvred in alleys . . . . . . . . . . . . . . . . .53
Figure 51. Refuse collectors attempting to free a Eurobin stuck on thebin lift in the up position . . . . . . . . . . . . . . . . . . . . . . . . . . . . . . . . . . . . . . .
53Figure 50. Shaking and lowering of 1100 litre bin . . . . . . . . . . . . . . . . . . . . . . . . . .52
Figure 49. Loading and lifting of Eurobin onto truck after removingexcess waste and closing lid . . . . . . . . . . . . . . . . . . . . . . . . . . . . . . . . . . .
52Figure 48. Pulling of full 1100 litre bin to truck . . . . . . . . . . . . . . . . . . . . . . . . . . . . .51Figure 47. Eurobin being wheeled from store . . . . . . . . . . . . . . . . . . . . . . . . . . . . . .50
Figure 46. Removal of waste from a wheelie bin to avoid handling it upand down a flight of steps . . . . . . . . . . . . . . . . . . . . . . . . . . . . . . . . . . . . .
50Figure 45. Handling of green bins up and down steps . . . . . . . . . . . . . . . . . . . . . .50Figure 44. Handling of green bins up and down steps . . . . . . . . . . . . . . . . . . . . . .49Figure 43. Combined handling of bins and bags on green bins round . . . . . . . .49Figure 42. Carrying and throwing of side waste . . . . . . . . . . . . . . . . . . . . . . . . . . . .48Figure 41. Handling of side waste on green bins round . . . . . . . . . . . . . . . . . . . . .48Figure 40. 240 litre green bin being pushed onto bin lift . . . . . . . . . . . . . . . . . . . . .47Figure 39. Handling of bins across kerbs . . . . . . . . . . . . . . . . . . . . . . . . . . . . . . . . . .47Figure 38. 240 litre green bins being pushed toward lorry . . . . . . . . . . . . . . . . . . .46Figure 37. Labels on grey and green bins . . . . . . . . . . . . . . . . . . . . . . . . . . . . . . . . .46Figure 36. Back alleys with hard and unmade surfaces . . . . . . . . . . . . . . . . . . . . .

1. INTRODUCTION
This work was undertaken as a result of a request from Field Operations Directorate (FOD) inthe HSE Bristol Area Office. FOD asked the Ergonomics Section at HSL for help with aproject they were carrying out on behalf of the Services Sector looking at risks of refusecollection. While there is a wide range of workplace hazards that refuse collectors areexposed to, this report examines the risks of musculoskeletal disorders (MSDs) as a result ofthe manual handling elements of the work.
Staff from the Human Factors Unit of HSE’s Health Directorate (HD D2) in Bootle were alsoinvolved in the work. FOD had identified an urban local authority in the south east ofEngland that was willing to participate in the project. A visit was made on 6 and 7 December2000 in order to gather information relating to the manual handling work done by the refusecollectors.
2. LITERATURE REVIEW
2.1. Occupational health problems in refuse collection
Poulsen et al. (1995) reviewed the range of occupational health problems that occur in refusecollection and their possible causes from a number of studies largely published in Europe andnot in English.
They characterised the work of refuse collectors as involving much heavy lifting as well aspulling and pushing of containers and carts. Both of these are known risk factors for low backpain. They described the work as also possibly containing work above shoulder level,frequent forceful exertions, static contractions and extreme joint positions. These areoccupational risk factors for MSDs in the neck, shoulders and arms.
They listed a wide variety of factors that influence the work conditions of refuse collectors(Table 1). They reported Danish incidence rates of a variety of health problems between 1984and 1992 and calculated relative risks for refuse collectors when compared to the total workforce (Table 2). The relative risk for refuse collectors developing musculoskeletal problemswas 1.9, i.e., refuse collectors were 1.9 times more likely to develop musculoskeletalproblems than the rest of the Danish working population. They also reported accident ratesfor the same period (Table 3) and noted that the most commonly reported accidents werefractures, sprains, wounds, soft tissue accidents and poisonings.
1

Table 1. Factors influencing the work conditions of waste collectors (Poulsen et al., 1995)
Temperature/HumiditySeasonal variations
Once per day/week/fortnight/monthFrequency of collection
Biodegradable wastePaperPlasticsGlassResidual wasteGarden wasteOther
UnseparatedSource separated
Type of waste
Old / new multi-storey housesOld / new one-family homesPublic institutionsRural residentsLeisure time districtsOthers
Type of district
With / without comprimatorManual / automatic emptyingLow / high emptying
Bag with / without cartBin with / without cartDomestic containers (110, 240 litres)Large area containers (400, 600, 1100 litres)
Open lorryClosed truck
High / low cabin
Domestic facilities
Waste collection truck
Type of equipment
Permanent / temporary employmentPiece rate / hourly wage
Work organisation
Large / small / self-employed carriersType of company
2

Table 2. Annual incidence rates, per 1000 employees, of reported healthproblems in Denmark, 1984 to 1992 (after Poulsen et al., 1995)
1.3 - 6.32.80.140.05Gastrointestinal 0.2 - 2.50.60.050.08Circulation0.5 - 1.40.80.310.39Brain damage0.8 - 5.32.00.10.05Nerves / senses3.6 - 10.06.00.360.06Infectious diseases1.2 - 2.01.61.30.84Skin diseases1.6 - 2.21.93.51.9Musculoskeletal diseases0.09 - 0.80.50.510.95With defective hearing0.9 - 3.91.40.530.38Other respiratory diseases1.8 - 3.92.60.580.22Allergic respiratory diseases1.4 - 1.71.58.35.5Reported diseases
95%confidence
interval
Relative riskIncidence ratefor refusecollectors
Incidence ratefor total work
force
Diagnostic group
Table 3. Annual incidence rates, per 1000 employees, of occupationalaccidents in Denmark, 1984 to 1992 (after Poulsen et al., 1995)
3.7 - 5.34.46.61.5Unknown types9.9 - 20.214.21.70.12Poisonings3.5 - 9.55.80.870.15Chemical burns6.7 - 8.67.614.41.9Soft tissue accidents1.3 - 2.91.91.30.67Thermal accidents3.4 - 4.23.818.74.9Wounds7.5 - 8.68.145.95.7Sprains2.5 - 3.83.14.91.6Fractures0.4 - 2.91.10.220.2Amputations
0.00.00.03Fatal accidents5.4 - 5.95.694.616.8Accidents, in general
95%confidence
interval
Relative riskIncidence ratefor refusecollectors
Incidence ratefor total work
force
Accident type
They summarised studies which have estimated mechanical load during refuse collection(Table 4) and noted that several had demonstrated that the load on the L5/S1 intervertebraldisc frequently exceeded recommended limits when handling all sizes of wheelie bins overcurbs or pulling them.
They also summarised studies that had examined the metabolic demands of refuse collection(Table 5). Of these studies they cite Hansson and Klussell (1977) to the effect that thesedemands were dependent on the weight of the bags or containers. They also cited Friberg andIsaksson (1974) as finding particularly high metabolic loads when wheelie bins and bags weretransported up and down stairs as compared to level ground. Stassen et al. (1992) found thatwaste collection both in bags and the smaller, domestic, wheelie bins can result inunacceptably high metabolic loads. Markslag et al. (1993) showed that the metabolicdemands were greater during carrying and throwing 7 kg bags of rubbish than during pushingand pulling wheelie bins.
3

Table 4. Mechanical loads estimated in studies of refuse collection (after Poulsen et al., 1995)
Lift over kerb 5400 N (L5/S1)1100 litre wheelie bins (+185 kg)Tilt/push 1510-2280 N (L5/S1); Tilt/push 1860-2650 N (L5/S1120, 240 litre wheelie bins (+22, 60 kg)
Markslag et al.(1993)
Standing 3400-5200N (L5/S1); walking 3240-4680 N (L5/S1)17aDM, BM,VR
7 kg bagsMean over day 22.4% MVCMPF, DM1100 litre wheelie binsMean over day 3.8% MVCMPF, DM120 and 240 litre wheelie bins
Stassen et al.(1992)
Mean over day 14.2% MVC116bMLF, DMBags
Pedersen et al.(1992)
L5/S1 torque often >170 Nm; Shoulder torque often >50-70% MVC for>10% of working day
1aDM, BM240 and 1100 litre wheelie binsJäger et al. (1984)L5/S1 torque often 200-400 Nm6aEMG, BM110 and 240 litre wheelie bins
ReferenceMechanical loadNMethodsSystem
Notes: N = Number of workers in study; EMG = Electromyography; BM = Biomechanical models; DM = Dynamometric measurement; VR = Video recording; MLF = Maximumlifting force; MPF = Maximum pushing force; MVC = Maximum voluntary contraction.
Table 5. Energetic load related to waste collection (Poulsen et al., 1995)
1100 litre wheelie bins (+110 kg)120, 240 litre wheelie bins (+22 kg)
Markslag et al. (1993)VO2: waste bags > wheelie bins17aVO27 kg bagsLuttmann et al. (1992)Work pulse 40 bpm6HR1100 litre wheelie bins
33% of workers VO2>30% VO2max (8hr); 17% of workers VO2>50% VO2max (1hr)1100 litre wheelie bins51% of workers VO2>30% VO2max (8hr); 32% of workers VO2>50% VO2max (1hr)120, 240 litre wheelie bins
Stassen et al. (1992)59% of workers VO2>30% VO2max (8hr); 55% of workers VO2>50% VO2max (1hr)116bHR, VO2BagsHR 97 bpm; average 8 hr VO2 < 30% of VO2maxBins
Kemper et al. (1990)HR 100 bpm; average 8 hr VO2 < 30% of VO2max23bHR, VO2BagsMean work pulse 39 bpm (45 bpm when empty wheelie bins returned)700, 1100 litre wheelie binsMean work pulse 37 bpm (48 bpm when in basements)120, 240 litre wheelie bins
Boldt et al. (1990)Mean work pulse 37 bpm10+15bHRBags36% VO2max1000 litre wheelie bins
Klimmer et al. (1982)50% VO2max17(28)b
HR, VO2110, 240 litre wheelie bins60, 70% of VO2max (37/82 kg)Bins on cart
Hansson and Klussell(1977)
58, 63% of VO2max (34/54 kg)8aHR, VO2,VE
BagsReferenceEnergetic levelNMethodsSystem
N = number of subjects; VO2 = rate of oxygen consumption; VO2max = maximal rate of oxygen consumption; VE = pulmonary ventilation rate; HR = heart rate; Work pulse =increase in heart rate above resting rate; a = Laboratory study; b = Field study
4

They concluded that these studies showed that refuse collectors exceeded the limits proposedby NIOSH (Waters et al., 1994) for biomechanical (3400 kN on the L5/S1 intervertebral disc)and metabolic load (33% VO2max for all day lifting tasks) when carrying out certain tasks.They noted that no field studies had been carried out into how factors such as workorganisation, equipment, or locality affected whether the limits were exceeded or not. Theysuggested a survey of the industry was needed which would identify high risk work conditionsand establish the relationship between them and the incidence of musculoskeletal problems.However, they noted that such a study would be extremely time and resource consuming andthat since the biomechanical and metabolic loads depended on a range of work factors therecould be difficulties in characterising the exposure of individual workers.
2.2. Energetic demands of refuse collection
2.2.1. Comparison of dustbins and black bags
Kemper et al. (1990) found that replacing the old style of round dustbins (weighing 6 kg) withblack bags and a twice weekly collection with a once weekly collection had the results shownin Table 6 for ten of 35 workers in a Dutch town.
Table 6. Effect of changing from dustbins to black bags
nsnsP<0.05P<0.05P<0.01Significance
30.399.73.414.6%13.4 kg11700 kgBlack bags
28.397.42.713.8%12.8 kg6900 kgDustbins
% VO2maxHR (bpm)Lifts perminute
Load as %of isometric
strength
Meanweight per
throw
Dailyamount
They commented that “the action of just throwing the bag into the car consisted of a far moreefficient movement than the emptying of the dustbin into the car”.
2.2.2. Daily workload of refuse collectors
Kemper et al. (1990) studied the effect of the new working system on 23 of the refusecollectors (Table 7).
Table 7. Table 5 from Kemper et al. (1990) for refuse collectors handlingpolythene bags (n=23)
ns from 60 minnsnsSignificance
0-20084.3-112.80.5-119.512.3-21.312.4-17.8Range
598.210.22.51.43SD
8598.399.516.815.1Mean
Time >50%VO2max (min)
Heart rate at30% VO2max
(bpm)
Heart rate(bpm)
%FMax perthrow
Weight perthrow (kg)
5

Thirteen of the 23 men exceeded the 20% Fmax lifting criterion; seven had a mean heart rategreater than that for 30% VO2max, and 14 spent more than 60 minutes at a level greater than50% VO2max. They therefore concluded that the lifting weight should be decreased and thewalking time increased to remove peaks in loads.
Luttmann et al. (1992) studied six males handling 1100 litre Eurobins after reviewing anumber of studies published in languages other than English, particularly in German. Thesestudies showed discrepancies between actual and scheduled work durations due to ‘job andfinish’ work systems encouraging workers to complete the work as rapidly as possible andhence not take rest breaks. Luttman et al. Sought, firstly, to recommend a system of breaksjustified by work physiology and, secondly, to calculate an ‘ergonomic transportationcapacity’ that fulfilled the economic requirement of efficient refuse collection while protectingthe health of the employees. Part of the study was reported in Jäger et al. (1984).
They suggested that a recovery break should be long enough for the heart rate to return to itsresting level. They also noted that there is no continuity in the load during refuse collectionwith high loads while containers are being transported and low loads during walking ordriving between collection areas.
They found work pulses of 39 and 43 bpm above resting heart rate in city centre areas /suburbs and residential areas at collection rates of 0.5 and 0.6 containers per minuterespectively. They compared this to a recommended limit of 40 bpm above a supine restingheart rate, noting that their measured work pulse values were minimum values since a sittingrest heart rate was used to calculate them. They therefore recommended breaks of at least 10minutes taken every hour. They also concluded that the ergonomic transportation capacitywas between 140 and 160 containers per shift, depending on the city district and thereforerecommended a nominal value of 150 containers per three man crew (driver plus two loaders).
2.2.3. Effect of changing work practices
Kemper et al. (1990) implemented three changes in the work routine of a group of 16 refusecollectors in order to spread the load over the working day. These were: 1) to reduce the paceof walking, both with and without bags; 2) to reduce the number of bags lifted to no more thantwo bags at a time; and 3) to introduce more breaks in the mornings.
Their results were confounded because during the study period there was a 15% increase inthe total weights handled and a concomitant increase in the distances walked. The meanworking time increased by 23 minutes. Twenty minutes of this was due to an increase in timewalking while not carrying. The mean number of bags handled was reduced to 1.8 and theweight lifted per throw was reduced from 15.1 kg to 13.4 kg. The mean number of breaksincreased from 2 to 3.6. After making a correction for the increase in distance and load theyconcluded that the pace of walking had increased while the load carried had decreased.
2.2.4. Study of actual working practices
Frings-Dresen et al. (1995a) carried out a field study of 116 male refuse collectors (Table 8).Collectors of refuse bags spent a substantial part of the day stooping, throwing and carrying.They also loaded for shorter periods than wheelie bin collectors. Bag collection involves
6

lifting smaller weights many times a day. Handling wheelie bins requires pushing and pullinglarger loads less frequently. They concluded from indirect estimates of oxygen consumptionfrom heart rate data that refuse collection by bags should be increasingly replaced withcollection using wheeled containers.
Table 8. Field study of refuse collection (Frings-Dresen et al., 1995a)
173380 min300-360min
14,000 kg110 kg1201100 litreEurobins
3251100 min300-360min
11,000 kg22 kg500240 litrewheelie bins
555980 min240 min11,000 kg7 kg1,500Bags
%>1hr>50% VO2max
% > 30%VO2max
Time onbreaks
Timecollecting
Weightcollected
Meanweight
No ofitems
Collectionmethod
2.2.5. Laboratory study of refuse collection methods
Frings-Dresen et al. (1995b) compared the energy expenditure in a laboratory study of threemethods of refuse collection. Based on the results of the earlier field study (Frings-Dresen etal. (1995a) they developed typical profiles of the different tasks for the simulations (Tables 9to 11). Using a theoretical limit of an average of 30% of VO2max over a working day, theyargued that collection of polythene bags is only acceptable for very short working hours andsmall amounts of refuse. They recommended that workers aged over 40 years should work foronly 1.7 hours per day and collect only 4000 kg of bagged refuse. They thereforerecommended replacing bag collections with wheeled bin collections.
Table 9. Typical weights for different methods of collecting refuse
110 kg1100 litre four wheeled bins22 kg240 litre two-wheeled bins7 kgPolythene bags, in a city area and a suburb
Typical weightsCollection method
Table 10. Times spent in the different activities
100.0%00:01:30Total6.7%00:00:06Throwing46.7%00:00:42Standing / operating mechanism13.3%00:00:12Walk, Carry & Throw6.7%00:00:06Stooping26.7%00:00:24Walking% timeTotal durationActivity
7

Table 11. Heart rate and oxygen consumption in refuse collection (from Table 3in Frings-Dresen et al., 1995b)
10.3% (1.9%)0.38 (0.08)86 (12)Quiet standing at rest5
28.4% (4.9%)0.97 (0.20)100 (13)Collecting 1100 litre wheelie bins4
34.1% (6.0%)1.18 (0.29)107 (16)Collecting 240 litre wheelie bins3
37.2% (6.9%1.27 (0.26)113 (17)Collecting bags in a suburb2
44.5% (7.0%)1.53 (0.34)121 (17)Collecting bags in a city area1
Work load(% VO2max)
Mean (SD) VO2Mean (SD)heart rate (bpm)
TaskRankorder
2.3. Mechanical load on the low back
Jäger et al. (1984) used electromyography to examine activity of the low back musculatureduring handling of three types of dustbins: 110 litre plastic cylindrical bins, 120 and 240 litreplastic wheelie bins and 1100 litre metallic wheelie bins. The weights they measured for thethree sizes of bins are summarised in Table 12.
They found a peak in electrical activity when the 1100 litre bins were transported acrosskerbs. In field studies they found that these bins were handled by both one and two workers.Estimates of lumbosacral torques showed that a single worker lifting a 1100 litre bin up a kerbcould decrease the lumbar load by 33% from 360 Nm to 240 Nm by bending his knees.Where a second person was helping this value could be reduced to as little as 90 Nm,depending on the position and posture of the second person.
Table 12. Bin weights found by Jäger et al. (1984)
9.0 kg5.8 kg6.2 kgSD of filled weight
43.9 kg33.3 kg22.9 kgMean filled weight
17.0 kg11.0 kg6.5 kgEmpty weight
240 litre wheelie bin120 litre wheelie bin110 litre plasticdustbin
For smaller bins, EMG of the biceps brachii, deltoid, erector spinae and vastus lateralismuscles, showed that every muscle was more active during transport of a dustbin than duringunloaded walking. Also, the muscular activities were very high when dustbins weretransported up or down stairs.
They concluded that a second person should help transport the 1100 litre containers upkerbstones rather than a single person attempting it. They also suggested that the containersshould be transported across dropped kerbs and that the size of wheels could be increased tohelp. Other recommendations were that moving wheelie bins or carrying round bins up anddown stairs should be avoided. Their overall conclusion was that the move to wheeled binshad economic advantages but created new problems if they were transported in the same wayand positioned in the same places as the 10 - 50 litre bins used previously.
8

de Looze et al. (1995) carried out a biomechanical study as part of the laboratory study ofthree methods of refuse collection reported by Frings-Dresen et al. (1995b). Using an inversedynamic analysis they used a biomechanical model to estimate lumbar spinal loading fromforces measured at the hands and the positions of anatomical landmarks measured using aVICON motion analysis system. They studied multiple variables for each of the three tasks.Details are set out in Tables 13 to 15.
Table 13. Variables studied for bag handling
11.2 kg6.3 kg1.25 m11.2 kg6.3 kg0.68 mLift, carry 5 m and
throw
11.2 kg6.3 kg1.25 m11.2 kg6.3 kg0.68 mLift and throw
Bag weightThrow-in heightTask
Table 14. Variables studied for two-wheel wheelie bins (‘mini-containers’)
1.16 m1.01 m17 + 60 kg1.16 m1.01 m17 + 22 kg240 litre1.01 m0.90 m11 + 60 kg1.01 m0.90 m11 + 22 kg120 litrePull 0.5 m on
pavement, down0.11 m high kerb &1.0 m on road
1.16 m1.01 m17 + 60 kg1.16 m1.01 m17 + 22 kg240 litre1.01 m0.90 m11 + 60 kg1.01 m0.90 m11 + 22 kg120 litrePush 0.5 m on
pavement, down0.11 m high kerb &1.0 m on road
Handle heightWeight + loadCapacityTask
Table 15. Variables studied for 1100 litre metal wheelie bins (‘containers’)
1.09 m185 + 0 kg0.72 mLift up 0.11 m high
kerb
185 + 200 kg185 +110 kg1.09 mPull 2.0 m on
pavement
185 + 200 kg185 + 110 kg1.09 mPush 2.0 m on
pavement
Empty weight + loadHandle heightTask
9
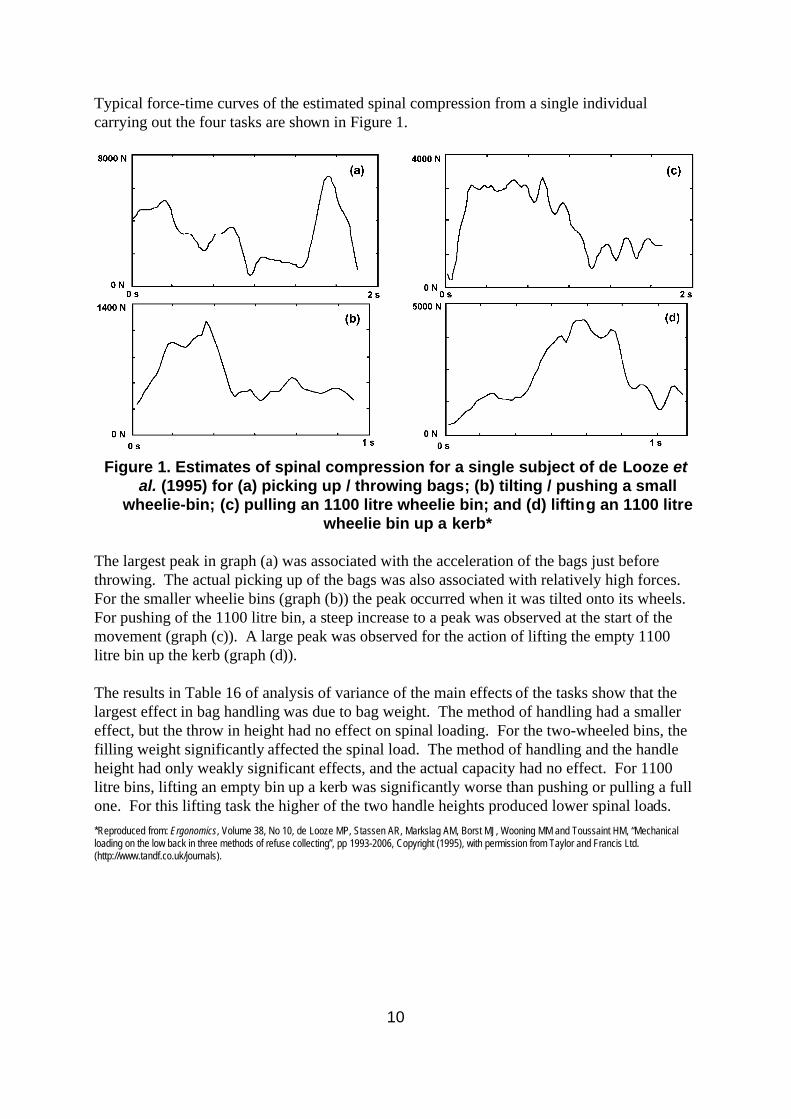
Typical force-time curves of the estimated spinal compression from a single individualcarrying out the four tasks are shown in Figure 1.
Figure 1. Estimates of spinal compression for a single subject of de Looze etal. (1995) for (a) picking up / throwing bags; (b) tilting / pushing a small
wheelie-bin; (c) pulling an 1100 litre wheelie bin; and (d) lifting an 1100 litrewheelie bin up a kerb*
The largest peak in graph (a) was associated with the acceleration of the bags just beforethrowing. The actual picking up of the bags was also associated with relatively high forces.For the smaller wheelie bins (graph (b)) the peak occurred when it was tilted onto its wheels.For pushing of the 1100 litre bin, a steep increase to a peak was observed at the start of themovement (graph (c)). A large peak was observed for the action of lifting the empty 1100litre bin up the kerb (graph (d)).
The results in Table 16 of analysis of variance of the main effects of the tasks show that thelargest effect in bag handling was due to bag weight. The method of handling had a smallereffect, but the throw in height had no effect on spinal loading. For the two-wheeled bins, thefilling weight significantly affected the spinal load. The method of handling and the handleheight had only weakly significant effects, and the actual capacity had no effect. For 1100litre bins, lifting an empty bin up a kerb was significantly worse than pushing or pulling a fullone. For this lifting task the higher of the two handle heights produced lower spinal loads.*Reproduced from: Ergonomics, Volume 38, No 10, de Looze MP, Stassen AR, Markslag AM, Borst MJ, Wooning MM and Toussaint HM, “Mechanicalloading on the low back in three methods of refuse collecting”, pp 1993-2006, Copyright (1995), with permission from Taylor and Francis Ltd.(http://www.tandf.co.uk/journals).
10

Table 16. Data from Table 3 of de Looze et al. (1995) on significance of effects on spinal loading in different methods ofhandling
P<0.00159.54ShearLower handle heightP<0.00124.38CompressionHandle height 0.72 m or 1.09 m for lifting
ns0.80Shearns0.73CompressionFilling weight 110 or 200 kg; 0 kg for
lifting
P<0.00119.96ShearLifting empty containerworse than pushing /pulling full ones
P<0.00174.00CompressionPush, pull or lift1100 litre wheelie binsP<0.054.40Shear
Lowest handlens1.51CompressionHandle height 0.90 m, 1.01 m or 1.16 mP<0.00122.17Shear
Heavier weightP<0.00115.36CompressionFilling weight 22 kg or 60 kgns4.40Shearns1.51Compression120 litre or 240 litrens1.10Shear
Tilt / pullP<0.055.42CompressionTilt / push or tilt / pull120 / 240 litre wheelie binsns2.36Shear
ns1.17CompressionThrow-in height 0.68 m or 1.25 mP<0.00154.22Shear
Heavier bagP<0.00129.60CompressionBag weight 6.3 kg or 11.2 kg
P<0.0111.36ShearPick up / throwP<0.054.90CompressionPick up / throw or pick up / walk / throwBags
Factor causinggreatest loading
Significance ofdifference
F ratioMeasure of spinalloading
FactorCollection method
11

Table 17 shows that, on average, each refuse collector will handle approximately 800 bags perday. Approximately 75% of these will be carried towards the truck and thrown in and theremainder will be picked up near the truck and thrown straight in. Where wheelie bins areconcerned they are as likely to be pulled as to be pushed. The large 1100 litre bins arehandled much less frequently in a shift and are slightly more likely to be pulled rather thanpushed. Lifting them up kerbs is actually a very rare event. This presumably reflects refusecollectors deliberately avoiding doing this very heavy task unless absolutely necessary bymaking use of features of the pavements such as ramps and dropped kerbs.
Table 17. Daily number of events for the three methods of refuse collection.Data from Table 4 of de Looze et al. (1995)
3Lift134Pull103PushLarge containers (n=18)518Tilt and pull490Tilt and push120/240 litre wheelie bins
(n=47)
587Walk / throw in220Stand / throw in807Pick upBags (n=15)
Mean events per working dayActivityCollection method
de Looze et al. (1995) noted that refuse collection is characterised by short bursts of activity,some of which involve high peak forces on the lumbar spine. However, the frequency ofexposure to these forces varies greatly between the different collection methods. They arguedthat, because of the magnitude and frequency of the peak forces, the bags method should bediscouraged. They noted that the peak during lifting exceeded the NIOSH Action Limit in themajority of trials, and that they had restricted movements to the sagittal plane in order to beable to use their dynamic two-dimensional linked-segment model. In reality, throwing of bagsis accompanied by considerable spinal twisting and asymmetric loading.
No significant differences in spinal loading were found between the two throw-in heights.They tested the difference in net moments at the shoulder, and reported (without presentingdata) that they were significantly lower at the lower- throw in heights.
Handling of mini-containers produces significantly smaller forces than the bags method, withthe NIOSH Action Limit not being reached, for a smaller number of events. Therefore, theyrecommended replacing bags by wheelie bins wherever possible.
Pulling of full 1100 litre containers resulted in spinal compression above the NIOSH ActionLimit. The main difference between this method and the others was the much lowerfrequency of handling. They therefore argued that it was another possible alternative to bags,especially if the highest peaks could be eliminated by removing the need to lift containers upkerbs by lowering the kerbs, and by making the task a two-man operation.
Jäger et al. (2000) reported an analysis of total daily lumbar load using a dynamicbiomechanical model, for a number of tasks, including refuse collection. Using measurementsof approximately 50 bins, they estimated that horizontal pushing or pulling forces for moving
12

wheelie bins are 13% of the bin weight. They found that an individual emptied 1007 bins in ashift, with a mean weight of 20 kg, 10th and 90th percentiles of 11 and 33 kg and a maximumof 97 kg. They found that the transportation and emptying conditions of dustbins variedconsiderably, leading to diverse patterns of lumbar loading.
Schibye et al. (2001a) compared the mechanical load on the low back and shoulders duringpushing and pulling a 240 litre two-wheeled refuse bin with the load during lifting andcarrying the same load in bags and bins. They used a three-dimensional force transducer tomeasure the forces on the handle of the wheelie bin and a motion analysis system and abiomechanical model to estimate the forces inside the body. The bin was loaded with 25 or50 kg. The paper bag and the 6 kg, 100 litre, plastic dustbin were loaded with 7 kg or 25 kg.Subjects lifted the bag or dustbin onto their backs without any constraints on technique.
During pushing the force at the hands (Table 18) was directed downwards-backwards in thetilting operation and downwards-forwards during the initial and sustained phases of the actualpush. During pulling the tilting force was downwards-forwards and upwards-forwards in thefollowing pull operations (Figures 2, 3, 4). The direction of force was hardly affected byincreasing the weight in the wheelie bin from 25 to 50 kg. However, the magnitudes of theresultant and horizontal force did increase. The forward inclination of the trunk was greater inthe initial phase than in the sustained phase of all movements. It was the same for pushingand pulling but increased when the load was increased from 25 to 50 kg. The net torque atL4/L5 was generally small and not affected by an increase in the weight of the container. Thelargest values occurred during tilting before pulling and the values in the initial phase werelarger than the values during the sustained phase.
Figure 2. Fig 2. from Schibye et al. (2001a), an example resultant force tracefrom a pushing operation*
The compressive forces during lifting bags and dustbins were much greater than at any pointduring pushing and pulling. However, the loads during carrying 25 kg on the back werecomparable to those during pushing and pulling 25 kg.*Reproduced from: Clinical Biomechanics, Volume 16, No 7, Schibye B, Sogaard K, Martinsen D and Klausen K, “Mechanical load on the low back andshoulders during pushing and pulling of two-wheeled waste containers compared with lifting and carrying of bags and bins”, p 552 , Copyright (2001), withpermission from Elsevier Science Ltd.
13

Figure 3. Fig. 3 from Schibye et al. (2001a), showing the sequence of eventsduring (a) pushing and (b) pushing. The numbers denote time from theonset of the operation and the arrows indicate the size and direction of
resultant forces*
Figure 4. Fig. 4 from Schibye et al. (2001a): Directions of resultant forces in theinitial and sustained phases of pushing and pulling a 240 litre wheelie bin*
They concluded that, during pushing and pulling, the compression force at the L4/L5 disc wasbetween 400-1600 N, never exceeding the 3400 N limit used by NIOSH. This was also thecase during standing with a full paper bag or bin on the back, but the compressive force couldexceed this limit during lifting of the bag or bin. They attributed the difference betweenlifting and standing to differences in back muscle activity and noted that during pushing andpulling an extension torque counteracts the flexion torque produced by gravity on the forwardleaning upper body. However, during lifting, the weight of the trunk and the bag combine toproduce a much larger flexion torque.*Reproduced from: Clinical Biomechanics, Volume 16, No 7, Schibye B, Sogaard K, Martinsen D and Klausen K, “Mechanical load on the low back andshoulders during pushing and pulling of two-wheeled waste containers compared with lifting and carrying of bags and bins”, p 552 - 553, Copyright (2001),with permission from Elsevier Science Ltd.
14

Table 18. Forces at the hands when handling a 240 litre wheelie bin (fromTable 1 of Schibye et al., 2001a)
1995142485016621115625Pull2353133-6650153998-6625PushSustained251722424350241271794425Pull28115276-64502374219-6925PushInitial31181201-20502970138-4425Pull6211222-167501099118-15325PushTilting
Trunk forwardinclination
°
Horizontalforce
N
Push/pullforce
N
Direction °
Weight kg
MethodPhase
0° = horizontal forwards, ±180° = horizontal backwards, 90° = vertical upwards , -90° = vertical downwards;Values are means from seven subjects
2.4. Pushing and pulling
van der Beek et al. (1999) cited a study reported in Dutch by Hoozemans et al. (1996) thatshowed that varying the height of the centre of gravity of a two-wheeled dustbin changed thevertical forces necessary for pulling and pushing them. The horizontal force needed was notaffected. They also cite a study by Donders et al. (1996) (also in Dutch) which showed thatvariations between subjects accounted for 80% of variations in pushing and pulling forces ofwheeled dustbins. They therefore hypothesised that the personal working technique is of greatimportance in pushing and pulling of MMH aids and suggested that experienced workerswould exert the pulling force in a more efficient direction. Presumably the variation is alsopartly accounted for by variations in the handle heights and therefore in the angles of the binsthat the subjects chose when performing the tasks.
Laursen and Schibye (2002) investigated the forces involved in pushing and pulling 240 litrewheelie bins on flagstones, paving stones, and grass. In the sustained phase of a push or pullthe largest hand forces occurred on grass and the smallest on flagstones. Only smallcomponents of force occurred outside the movement plane. The trunk inclination increased asthe magnitude of the vertical force component increased but was not related to the horizontalcomponent.
Generally they found that push and pull forces were comparable in both the tilting and initialphase of the pull / push, but that sustained pushing forces were greater than sustained pullingforces. They attributed this to the downward force required to push increasing the rollingresistance whereas the upward force of pulling would decrease it. Balancing a two-wheeledcontainer creates additional restrictions on the force vector and on the posture adopted, butthese stability requirements did not seem to cause any particular load on the lumbar spine.Also, they reported that the overall biomechanical load was low when compared to a task suchas lifting.
15

2.5. Effects on health and fitness / survival in the job
2.5.1. Psychosocial factors
Lund et al. (2001) attempted to test the hypothesis that early retirement / long-termunemployment is influenced by psychosocial factors such as low decision authority, low skilldiscretion and high ergonomic exposures. Of a cohort of 2618 Danish male refuse collectorsand municipal workers carrying out physically heavy outdoor work 24.9% left their job in thefollowing 2.5 years. Of these, 31% were in another job, 15.6% were unemployed, 10.3% werereceiving disability pensions or long-term sickness benefit, and 12.1% were receiving earlyretirement pensions. They found that the factors affecting selection out of the job were thephysical and psychosocial work environment factors of self-rated ‘extreme bending of theback’, low skill discretion and low decision authority. Unemployment was also associatedwith pushing of heavy loads and extreme bending of the back. They suggested that ergonomicimprovements in the work environment could potentially decrease the number of peoplebecoming unemployed.
2.5.2. Physical capacity of refuse collectors
Schibye et al. (2001b) investigated whether waste collection had a training effect ordeleterious ‘wearing’ effect on the workers’ physical capacity. They compared young and oldgroups of refuse collectors with age-matched control groups without physically heavy work.The older refuse collector group was significantly heavier and had significantly higher BodyMass Index (BMI) than the aged control group. The two younger groups did not differ onheight, weight, or BMI.
They found that both elderly groups had 30% lower maximal oxygen uptake than the youngworkers, corresponding to a 1% annual decrease in VO2max independent of job type. Since theolder workers were heavier, the weight related VO2max decreased even more, by 40%. Usingthe assumption that the elderly workers initially had the same aerobic capacity as the youngerworkers, they concluded that there was no training or wearing effect due to waste-collectionwork when compared with non-physically heavy work. Because of the obesity of the olderwaste collectors they argued that it was necessary either to reduce the work load on them or toincrease their fitness by specific aerobic training and weight loss.
There was a general tendency to greater muscle strength in the working groups compared tothe controls, which could be interpreted as a training effect. Shoulder abduction strength was45% greater in the elderly working group than the elderly control group. However, they notedthat other studies had found that a physically heavy job is no guarantee of high musclestrength. They also argued that the generally higher capacity found among younger wastecollectors might, alternatively, indicate a healthy worker selection effect taking place withinthe first few years of doing the job. If this was so, then it seemed to be based on musclestrength, particularly shoulder strength, not aerobic capacity.
16

2.6. Job rotation
Kuijer et al. (1999) investigated the effect of job rotation on physical workload in refusecollection in Holland. Four groups of four workers were studied who undertook differentcombinations of refuse collection and street sweeping (Table 19).
Table 19. Combinations of jobs studied by Kuijer et al. (1999)
Street sweepers alternating on half shift basis with drivingSDRefuse collection alternating on half shift basis with street sweepingRSSolely street sweepingSSSolely refuse collectionRR
TasksGroup
They measured energetic load by measuring heart rate over the working day and by manuallycoding trunk posture every 15 seconds. They found that job rotation had no effect on theintensity with which the task was performed but decreased the perceived load and theenergetic load. The postural load of the trunk was less for street sweepers than for refusecollectors, but perceived fatigue and exertion did not differ. This was attributed to either amore heterogeneous physical workload or to psychological factors making the job withrotation less monotonous and reducing the perceived load.
2.7. Long term effects of changes in working patterns
Kuijer et al. (2000) compared the workload of a group of Dutch refuse collectors (‘Study III’)with the results of two earlier studies. The first had been carried out on the same workforce(‘Study I’, Kemper et al., 1990) and the second was a national study (‘Study II’, Frings-Dresenet al., 1995a) which resulted in guidelines (Frings-Dresen et al., 1995b) which had beenimplemented not long before the study. The amount of refuse collected in bags did not differbetween the three studies. In Study III more two-wheeled bins were handled and more refusecollected per minute than in Study I or Study II.
They concluded that the energetic workload had not been reduced compared to the originalstudy 12 years previously, nor did it differ from the national study and therefore that refusecollection can still be classified as heavy physical work despite the changes made. However,the perceived exertion was lower and the postures were more favourable in the latest study.The one additional difference was that a recycling scheme had been implemented with ‘grey’and ‘green’ refuse being collected on alternate weeks. Since all the measurements had beenmade on grey weeks, and the level of recycling was not known, there may be differencesbetween the workloads for the different types of collection.
17
3. METHODS
3.1. Introduction
3.1.1. Systems of refuse collection
The local authority that had been identified as willing to co-operate with the study proved tobe a suitable location for evaluating manual handling of refuse using a variety of methods andworking practices for refuse collection. For normal domestic waste, some areas have a servicewhere black bags are collected every week, between Monday and Friday. Other areas havewheelie bins that are collected weekly. Some areas have grey wheelie bins for ordinary refuseand green wheelie bins for recyclable refuse. These are collected on alternate weeks. Therecycling service does not include glass or newspapers and householders are encouraged totake these to receptacles in supermarket car parks.
The terrain in this city varies from flat to hilly. Also, some older houses are built with doorsopening directly onto the street and with a long alley running behind the houses along thelength of the street. Access is often only via the ends of these alleys. In these circumstancesthe householders are expected to leave rubbish bags in the alley by their back gate. The refusecollectors carry the bags from the gates to the end of the alley where the truck is waiting.
All refuse collection vehicles belonging to the local authority are fitted with lifting gear toenable the mechanical emptying of wheelie bins into the vehicles. Each vehicle, includingthose used for recycling rounds, also has a mechanical compactor fitted at the rear to reducethe volume of the waste loaded into it. When bags are collected they have to be thrown overthe bin lifters and a bar at the back of the vehicle designed to stop the refuse falling back out.This bar is known as a ‘rave bar’ or ‘rave rail’ and its height as the ‘rave height’.
3.1.2. Domestic rounds
The domestic rounds in this city all start at 6:00 AM. A system of ‘job and finish’ allows acrew to go home once they have completed their round. As a result, the crews work asquickly as possible and tend to skip breaks to finish the job early. The 6:00 AM start isenforced by the keys to the vehicles being held at the depot overnight and not handed out untilthat time. Crews have adopted a number of practices to allow them to get ahead on thecollection and to make their lives easier. Thus, it was normal for not all the crew to report tothe depot at either the start or end of the shift, but some would meet the vehicle part waythrough the round and be dropped off at the end. This was especially so if their homes werebetween the start or finish of the round and the depot since this saves them travelling to thedepot. As a result, some would go to the start of the round well before 6:00 AM and startgathering bags into piles ready for collection by the crew members accompanying the vehicle.
3.1.3. Trade round
A trade round operates from 12:30 PM on Mondays to Fridays to collect refuse frombusinesses in the city. This is a service where the business pays according to the level ofservice, with large businesses would have daily collections, whereas small ones might onlyhave a weekly collection. A number of commercial firms also provide a business refuse
18

collection service in competition with the local authority. The round varies from day to dayand it would be unusual for the crew to work along a street collecting from all the premises onit since locations can be quite far apart. Since many of the businesses are in the city centre thecrew need to time the round carefully to avoid evening rush hour traffic jams. Refuse iscollected in both bags and wheelie bins. The large green ‘trade sacks’ were of a heavier andgrade of plastic than typically found in domestic black bags. Three sizes of bins were in use:1100 litres (‘Eurobins’), 360 litres and 240 litres.
3.1.4. Other methods of refuse collection
A variety of other refuse collection methods exist in different parts of the country, includingthe use of so-called ‘Paladin’ bins. These are large cylindrical metal wheeled bins used forrefuse in commercial premises and multi-occupancy dwelling, such as blocks of flats. Theyare usually located underneath refuse chutes.
Paladin bins are seen as being very heavy to move and difficult to manoeuvre. Otherproblems are that they have a relatively small wheelbase and high centre of gravity and aretherefore likely to topple over, especially on slopes. They are perceived as being bulky,unsightly and potentially unhygienic, as attracting fly tipping and being noisy due to theirmetal construction They are also difficult to load onto the lifting mechanism on the rear of thelorry. A special clamp is required on the lifting mechanism due to the round shape of thePaladin bin. This therefore makes it difficult for the same vehicle to deal with ordinarywheelie bins and Paladins. There is a general tendency to phase them out by replacing themwith the 1100 litre ‘Eurobins’ though some local authorities have replaced manual handling ofPaladins with crane emptying of much larger underground containers.
3.2. Details of the refuse collection rounds studied
HSL staff followed three refuse collection rounds on the Thursday afternoon and the Fridaymorning. The main details of these rounds can be seen in Table 20. At that time of yearsunrise is approximately 08:00 and sunset 16:00. HD and FOD staff had followed a bagsround earlier on the Thursday.
Table 20. Details of the rounds studied
Both driver and loaderTwo loadersTwo loadersHeart ratemonitoring
Heavy rain, wind, coldDry, still, cold, brightsunlight from dawn
Dry, still, cold, brightsunlight from dawn
Weather
15:30-18:00 7 Dec.09:30-11:30 8 Dec.06:00-09:00 8 Dec.Start and finish ofround following
6.5 to 7.5 hours6.5 to 8 hours8.5 to 9 hoursRound duration12:3006:0006:00Round start time245Number in crew
Trade bins (240, 360and 1100 litre sizes) plusgreen trade bags andloose refuse.
240 litre green wheeliebins for recyclablematerial. Grey (ordinaryrefuse) and green weeksalternate.
BagsType of roundRound CRound BRound A
19

3.3. Measurement of bag weights
Bag weights were recorded during a 1 hour 20 minute period of one round using a Mecmesinforce dynamometer. A large hook fitted to the dynamometer was used to lift the bags andmeasure the weights in kilograms. This was done by going ahead of the crew and weighingmost of the bags left on the pavement by the householders. Weights were recorded by oneperson lifting the bag with the dynamometer and the other person videoing the display (Figure5). The bags were then dropped to the ground again for collection. On return to thelaboratory the weights shown on the display were transcribed from the video.
Figure 5. Weighing of bags with a Mecmesin dynamometer
3.4. Heart rate monitoring
Heart rates were recorded using Polar Heart Monitors, model Vantage NV (Finland, PolarElectro Oy). These consist of a signal detector and transmitter worn around the chest and awrist watch that picks up, displays and stores the signal. Sweat bands were worn over thewatches to protect them from damage. Heart rates were measured for six subjects across threerounds. The watches were initially set to record the mean heart rate every five seconds,though one subject manually set his watch to record every heart beat with the result that thewatch only recorded 40 minutes of data for him. After retrieval from the subjects, the datawere downloaded from the watches to a computer for analysis using Polar software (PolarPrecision Performance v2.1, 1999: Finland, Polar Electro Oy).
3.5. Postural analysis
Video was used as the primary means of recording posture data and work rates. The videowas analysed using Observer Pro software. Working posture was broken down into thecategories provided by the OVAKO Working Posture Analysis System (OWAS). The firstpart of the analysis coded changes in the back, arms, and leg postures adopted, the manualhandling operations being carried out and the loads being handled. The second part used thesedata to examine the frequency, relative times and mean durations of particular postures ormanual handling operations.
20

Video was taken of three rounds using a pair of Panasonic Mini DV cameras. The typicalprocess was for two observers to follow the refuse truck in a car. As appropriate one observerfollowed on foot taking video or still photographs while the other drove the car. Filmingconcentrated on the periods when rubbish was actively being collected and loaded into thevehicle. Therefore, periods when the crew were travelling between locations where rubbishwas to be collected were generally not filmed. It is therefore impossible to draw conclusionsfrom the films about the proportion of time usually spent collecting rubbish and the proportionspent in travelling.
Because of the time of day and year much of the footage was shot during the hours ofdarkness. Therefore, much of the footage is dependent on artificial sources of light such asstreet lighting and the headlights of the observers’ car. However, the high visibility clothingworn by the crews helped locate and identify them. Heavy rain on the first day added to theproblems of visibility.
The nature of such a process of videoing is that activities of interest are filmed. Therefore, thecameras were often panned to follow an individual as he collected sacks or wheelie bins andbrought them to the truck. With a crew of four or five it is impossible to capture every eventwith only two cameras, even if the filming did tend to concentrate on the back of the truckwhere all rubbish was brought. Therefore, individuals are not seen on the tape for extendedperiods and appear and disappear from it. Also, when several individuals were gathered roundthe back of the truck to throw rubbish in they would often obscure the camera’s view of otherindividuals.
3.5.1. Posture coding
Video was coded using the OWAS system (Karhu et al., 1977, 1981, Vedder, 1998). Thiswas done using the Observer Pro video analysis system (Noldus Information Technology BV,Wageningen, The Netherlands). This provides precise control of the video tape (Carey andGallwey, 1998) while postures were being coded. V4.0 of the Observer Support Package forVideo Analysis was used on an IBM compatible PC running Windows NT. The video wasdigitised to MPEG-1 format using a Broadway Pro card and the digitised file was played backthrough the Observer software.
The Observer software was set up for ‘Focal Sampling’. This is a real time method of codingwith defined events being coded at the point of their occurrence. It is therefore possible tomeasure the duration of a particular action and identify if sequences of events recur. Subjectswere defined to correspond to each member of the crew being videoed. Four BehaviouralClasses were defined corresponding to the three body parts and the force level category thatare classified in the OWAS system. An additional Behavioural Class was defined to allow amore meaningful classification of the handling operations occurring. This permitteddistinction between lifting, lowering, pushing, pulling, carrying and throwing.
Within each Behavioural Class, Elements were defined corresponding to each of the posturesfor the corresponding body part. Within the Rubbish Behavioural Class, Modifiers were usedto allow a description of the number of hands being used, the type of refuse being collected,and whether a bin was full or empty. A ‘no entry’ element was also defined for each bodypart. Each Element was assigned to a different keystroke to allow rapid coding via the
21

computer keyboard. This combination of Subjects, Behavioural Classes and Elementsallowed each of the subjects being observed to be coded separately for the duration of thevideo. The Behavioural Classes and Elements are listed in Table 21:
Table 21. Assignment of postures to Behavioural Classes / Elements
Bin contains refuseBin empty of refuse
FullEmpty
Bin state
240 litre wheelie bin360 litre wheelie bin1100 litre EurobinStandard dustbin
240 litre360 litre1100 litreDustbin
Bin sizeNumber of bags held by a hand1-6Bags no
Action by left hand onlyAction by right hand onlyAction by both hands
LeftRightBoth
HandsDefault
No manual handlingLift rubbish bagLower rubbish bag to groundCarry / hold rubbish bagThrow bag into truckRounds A/B push wheelie binRounds A/B pull wheelie binRound C push wheelie binRound C pull wheelie binRubbish out of view
Bags noBags noBags noBags noBin stateBin stateBin stateBin state
NoneHandsHandsHandsHandsHandsHandsBin sizeBin sizeNone
No loadLiftLowerCarryThrowPushPullPushPullNot seen
Rubbish
DefaultLoad < 10 kgLoad between 10 kg and 20 kgLoad > 20 kgLoad not visible
<10 kg<20 kg>20 kgMissing
Load
DefaultBoth legs unloadedLoading on both legs, knees straightLoading on one leg, knee straightLoading on both legs, both knees bentLoading on one leg, knee bentKneeling on one or both kneesBody being moved by the legsLegs not visible
SittingStand2Stand12 Bent1 BentKneelWalkNo legs
Legs
DefaultBoth arms below shouldersOne arm above shouldersBoth arms above shouldersArms not visible
2 Below1 Above2 AboveNo Arms
Arms
DefaultTrunk upright and not rotatedTrunk flexedTrunk rotatedTrunk flexed and rotatedTrunk not visible
StraightBentTwistedB&TWNo Back
Back
DefinitionModifier 2Modifier 1ElementBehaviouralClass
Coding started either at the start of the video or at a point where sufficient light was availableto allow individuals’ postures to be observed and coded. Where necessary, the file wasstepped through frame by frame. Due to the difficulty of knowing the load at the hand it wasalways coded as less than 10 kg. Missing codes were entered when workers were not visible.
22

3.5.2. Assignment of postures to OWAS Action Categories
The WinOWAS software (Tampere University Technology, Occupational and SafetyEngineering, 1996) implements an algorithm that assigns Action Categories using thepercentage of time that a person spends with a body part in a particular posture. This allowsdifferent degrees of severity to be assigned to the same posture, depending on the proportionof the time that is spent in any particular posture. It is therefore a substantial refinement of theoriginal classification system (Karhu et al., 1977) which assigned postures to ActionCategories irrespective of whether they were frequently adopted or only rarely adopted. Themeanings of the different Action Categories were given in Table 22. The postures,percentages of time and associated Action Categories are listed in Table 23.
Table 22. OWAS Action Categories
Action required immediatelyExtremely harmful postureAC 4
Action required as soon as possibleDistinctly harmful postureAC 3
Action required in the near futureSlightly harmful postureAC 2
No action requiredNormal posture AC 1
Action requiredMeaningAction Category
Table 23. Percentages of time in a posture and OWAS assignments to ActionCategories
0-100%> 20 kg0-100%< 20 kg0-100%< 10 kgLoad
80-100%0-80%Walking50-100%20-50%0-20%Kneeling
70-100%30-70%5-30%0-5%Standing on one bent knee70-100%30-70%5-30%0-5%Standing on two bent knees
30-80%0-30%Standing on one leg80-100%0-80%Standing on two legs90-100%0-90%SittingLegs
70-100%20-70%0-20%Both above shoulder80-100%30-80%0-30%One below shoulder
0-100%Both below shoulderArms70-100%30-70%5%-30%0-5%Bent and Twisted
50-100%20-50%0-20%Twisted80-100%30-80%0-30%Bent
0-100%StraightBackAC 4AC 3AC 2AC 1PostureBody part
23
4. RESULTS
4.1. Results of posture analysis
4.1.1. Introduction
In interpreting the following charts the limitations of the videoing and coding processes mustbe remembered. It was not possible in the time available to ensure that the video shot wassystematically representative of all refuse collection activities of the area, or even of therounds followed. The location was chosen because it had a mixture of collection methods.Therefore, the situation in localities where only single methods are used will differ. Also,there are other systems of refuse collection such as the use of Paladin bins that do not occurhere, and variants of the methods observed, such as the distribution of black bags tohouseholds.
The video was shot by following rounds that represented the range of collection methods inuse by the local authority. This was done for 2-3 hours per round over a two day period inearly December. The choice of different days of the week or a different time of year mighthave affected the activities observed. This was particularly clear with the green bins roundwhere the crew stated that they collected significantly more refuse on a grey week.
The actual video recorded depended upon what the persons with the video cameras could see.Most was shot from a car following the round so tended to concentrate on activities at the rearof the truck and those activities occurring near the truck such as carrying bags, pushing fullbins onto the bin lift and pulling empty ones from it. It was far less likely to capture moredistant activities such as removing black bags from dustbins or collecting them from houseboundaries or collecting and returning wheelie bins from and to storage locations. Whileseveral members of a crew of four or five might be visible at the rear of the truck on a numberof occasions, inevitably individuals would appear and rapidly disappear from view. If anattempt was made to follow an individual with the camera then the activities of the otherswould almost certainly be missed while this was happening.
Also, because of the time of year, much of the video was taken after nightfall on the first dayand before dawn on the second. While the video cameras can adapt to a wide variety of lightlevels, inevitably the picture quality is much poorer than would have been obtained in brightsunlight in the summer. There tend to be highlights within the pictures depending on thepositioning of street lamps, head lamps and the reflective high-visibility clothing worn by therefuse collectors. Therefore, the amount of usable video for each round was relatively short.
Because it was decided to adopt a posture coding method it was possible to code whenpostures changed from one category to another (e.g., from trunk straight to trunk bent). Thisallowed the Observer software to calculate durations of postures. As five BehaviouralElements were defined, this process was labour intensive and therefore coding from video wasessential. Despite various attempts within the ergonomics community to devise checklist /diagrams / portable computers for posture coding, accurate coding in real time is effectivelyimpossible, especially if more than one code is being recorded. Using digitised video withThe Observer provides the ability to move instantaneously to any point and to view the videorepeatedly frame-by frame, at almost any speed, and in either direction. These features allow
24

the coder to avoid information overload, to process information at a speed consistent withhuman abilities, to time events accurately, to extract multiple items of information from asingle frame, to determine from a sequence of frames the nature of an action when this mightbe ambiguous in a single frame, and to correct errors. However, the coding process is stillprone to error because of a number of factors. Firstly, it involves deciding what constitutes aparticular posture or activity. Secondly, the coder may not be able to maintain concentrationsufficiently to code completely accurately. Thirdly, individuals may be partly obscured byother objects or because of the angle of view or the object being handled so that their actionsmay not be completely certain. Fourthly, the postures being coded are not precisely defined,so that the boundary between a straight back and a twisted back is not defined and thereforemay depend on the judgement of the coder.
Because of all these considerations it is necessary to describe the posture coding as at bestindicative. Therefore, strong inferences must not be drawn from small differences betweenclasses or between rounds. However, despite these limitations, it is believed that usefulinformation has been obtained by the videoing and coding processes.
Table 24 gives start and finish times of the video recorded. From the length of video and theelapsed time the percentage of possible time filmed has been calculated. Film segmentsranged in length from nearly two minutes to nearly 25 minutes. The elapsed time between thestart and end of a film segment ranged from under five minutes to nearly 1 hour 25 minutes.The percentage of time filmed ranged from 7.7% to 67.9%. There was overlap between filmshot on the same round because two cameras were in use, and on occasions the same eventswere visible in both videos.
Table 24. Details of video recorded (times are in hh:mm:ss)
No7.7%00:01:5300:24:3317:21:1714:56:44CYes35.7%00:18:2000:51:2518:07:5617:16:31B
Yes17.5%00:22:4602:10:2017:10:1414:59:547/12/2000AC (Tradebins /sacks)
No37.3%00:04:2200:11:4210:57:0710:45:25BYes13.3%00:11:1601:24:5411:53:0710:28:138/12/2000AB (Green
bins)
No29.0%00:23:2801:20:4909:12:5507:52:06CYes39.2%00:01:5200:04:4607:04:1806:59:32BYes67.9%00:24:4600:36:2907:36:0106:59:228/12/2000AA (Bags)
Coded?% timefilmed
Filmduration
Elapsedtime
FinishStartDateFilmRound
4.1.2. Trunk postures
Figure 6 shows the number of times that changes of back posture were coded. They are codedas the posture that was being adopted rather than the one being left. Therefore, between 50and 70% of changes of back posture were into upright, straight, postures. Under 15% wereinto bent and twisted postures. Between 10 and 30% were into bent postures, and theremaining 8 to 15% were into postures where the trunk was twisted but not bent.
25

0%
10%
20%
30%
40%
50%
60%
70%
80%
90%
100%
Bent and twisted 10 1 17 9 24
Twisted 23 7 11 11 17
Bent 39 5 16 24 51
Straight 87 30 96 59 82
Bags round (A) Bags round (B) Green bins round Trade round (A) Trade round (B)
Figure 6. Occurrences of different trunk postures
Figure 7 shows how the actual time spent in the different back postures varied across the fivesegments of video coded. The refuse collectors spent between 78% and 89% of the time theywere visible with their trunks straight, i.e., vertical. There were 9% differences between thetwo segments from the bags round and the two segments from the trade round. As a result,there were variations in the amounts of time spent in bent, twisted, and bent and twistedpostures. Overall then, it can be concluded that refuse collectors spent between 10 and 20%of their time when actually handling rubbish (not driving in the truck between locations orback to the depot) in non-ideal (i.e., bent and/or twisted) trunk postures.
0%
10%
20%
30%
40%
50%
60%
70%
80%
90%
100%
Bent and twisted 1.3% 0.3% 6.8% 1.4% 4.1%
Twisted 2.1% 5.4% 3.9% 5.9% 5.2%
Bent 16.1% 5.0% 4.2% 4.8% 12.6%
Straight 80.4% 89.4% 85.0% 87.9% 78.1%
Bags round (A) Bags round (B) Green bins round Trade round (A) Trade round (B)
Figure 7. Posture of trunk (percentage of time visible)
26

Figure 8 shows the mean time in seconds spent in each trunk posture. The values for straightpostures of between 5.3 and 13 seconds will be underestimates since most of the time whenindividuals were not visible on camera they will have been walking to and from the truck.Mean times in bent postures ranged between 1.7 and 3.0 seconds; in twisted postures between0.7 and 4.7 seconds; in the combined bent and twisted postures 0.5 and 3.9 seconds. Fromthis it can be concluded that, in general, only relatively brief periods are spent in the non-idealtrunk postures, though the times spent in twisted postures were greater in rounds involvinghandling wheelie bins. This probably reflects a tendency to adopt twisted postures whenpulling and pushing bins, especially if done one-handed. The bent, and bent and twistedpostures were almost exclusively associated with lifting bags from the ground.
0.01.02.03.04.05.06.07.08.09.0
10.011.012.013.014.0
Straight 6.7 5.3 8.6 13.0 6.8
Bent 3.0 1.8 2.6 1.7 1.8
Twisted 0.7 1.4 3.5 4.7 2.2
Bent and twisted 1.0 0.5 3.9 1.3 1.2
Bags round (A) Bags round (B) Green bins round Trade round (A) Trade round (B)
Figure 8. Mean durations (s) of trunk postures
4.1.3. Positions of hands relative to the shoulders
Figure 9 shows how often the coding of hand position relative to the shoulders changed.Between 20 and 40% of the coding changes were due to the hands ceasing to be visible, if, forinstance the individual walked out of the field of view of the camera. While the majority ofthe events show that both hands were below shoulder height, one or both hands went aboveshoulder height on a significant number of occasions. It is clear from the video that this wasalmost exclusively associated with throwing bags into the vehicles. That this still occurred onthe two rounds dealing with wheelie bins reflects the fact that the trade round was dealingwith both bins and sacks, and that the green bins round also had to deal with a level of sidewaste, usually in plastic bags.
27
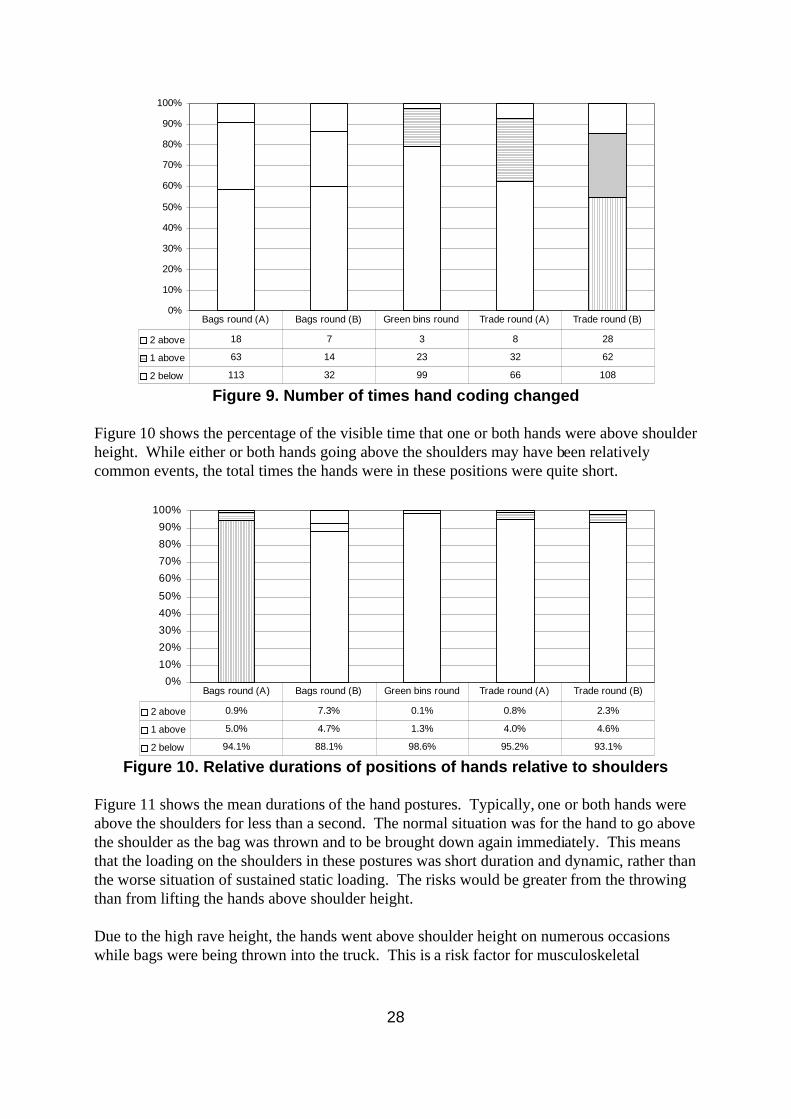
0%
10%
20%
30%
40%
50%
60%
70%
80%
90%
100%
2 above 18 7 3 8 28
1 above 63 14 23 32 62
2 below 113 32 99 66 108
Bags round (A) Bags round (B) Green bins round Trade round (A) Trade round (B)
Figure 9. Number of times hand coding changed
Figure 10 shows the percentage of the visible time that one or both hands were above shoulderheight. While either or both hands going above the shoulders may have been relativelycommon events, the total times the hands were in these positions were quite short.
0%10%20%30%40%50%60%70%80%90%
100%
2 above 0.9% 7.3% 0.1% 0.8% 2.3%
1 above 5.0% 4.7% 1.3% 4.0% 4.6%
2 below 94.1% 88.1% 98.6% 95.2% 93.1%
Bags round (A) Bags round (B) Green bins round Trade round (A) Trade round (B)
Figure 10. Relative durations of positions of hands relative to shoulders
Figure 11 shows the mean durations of the hand postures. Typically, one or both hands wereabove the shoulders for less than a second. The normal situation was for the hand to go abovethe shoulder as the bag was thrown and to be brought down again immediately. This meansthat the loading on the shoulders in these postures was short duration and dynamic, rather thanthe worse situation of sustained static loading. The risks would be greater from the throwingthan from lifting the hands above shoulder height.
Due to the high rave height, the hands went above shoulder height on numerous occasionswhile bags were being thrown into the truck. This is a risk factor for musculoskeletal
28
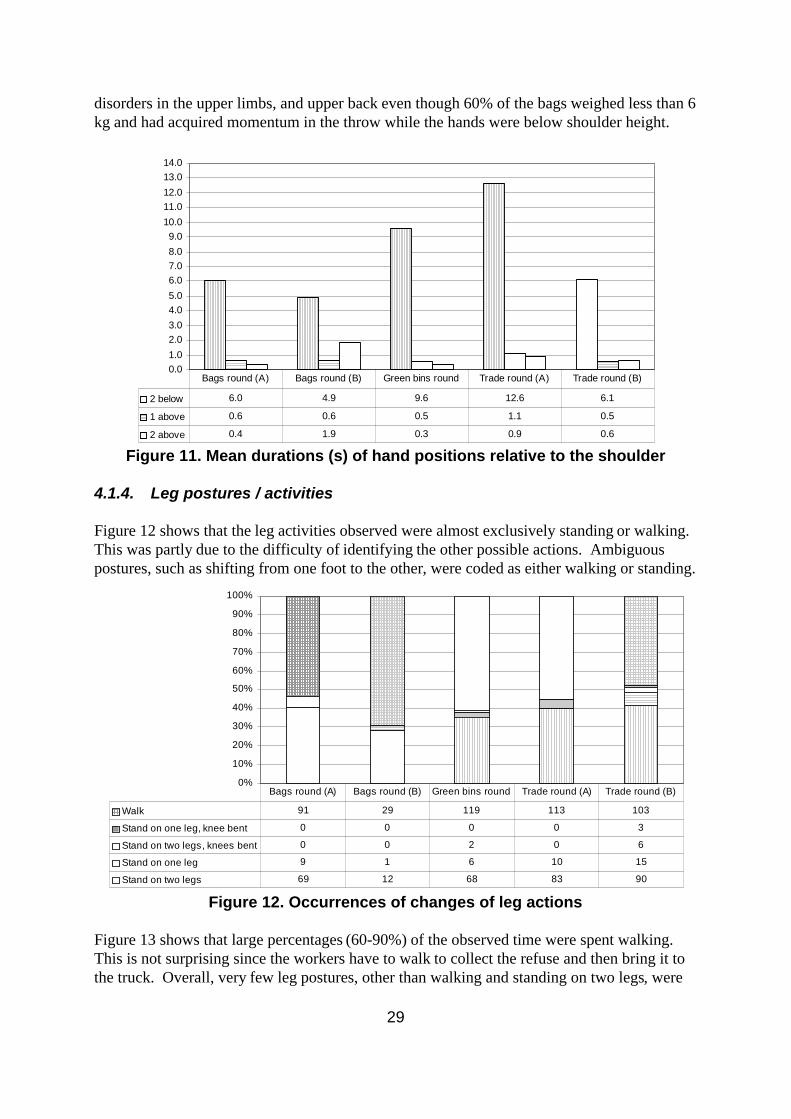
disorders in the upper limbs, and upper back even though 60% of the bags weighed less than 6kg and had acquired momentum in the throw while the hands were below shoulder height.
0.01.02.03.04.05.06.07.08.09.0
10.011.012.013.014.0
2 below 6.0 4.9 9.6 12.6 6.1
1 above 0.6 0.6 0.5 1.1 0.5
2 above 0.4 1.9 0.3 0.9 0.6
Bags round (A) Bags round (B) Green bins round Trade round (A) Trade round (B)
Figure 11. Mean durations (s) of hand positions relative to the shoulder
4.1.4. Leg postures / activities
Figure 12 shows that the leg activities observed were almost exclusively standing or walking.This was partly due to the difficulty of identifying the other possible actions. Ambiguouspostures, such as shifting from one foot to the other, were coded as either walking or standing.
0%
10%
20%
30%
40%
50%
60%
70%
80%
90%
100%
Walk 91 29 119 113 103
Stand on one leg, knee bent 0 0 0 0 3
Stand on two legs, knees bent 0 0 2 0 6
Stand on one leg 9 1 6 10 15
Stand on two legs 69 12 68 83 90
Bags round (A) Bags round (B) Green bins round Trade round (A) Trade round (B)
Figure 12. Occurrences of changes of leg actions
Figure 13 shows that large percentages (60-90%) of the observed time were spent walking.This is not surprising since the workers have to walk to collect the refuse and then bring it tothe truck. Overall, very few leg postures, other than walking and standing on two legs, were
29
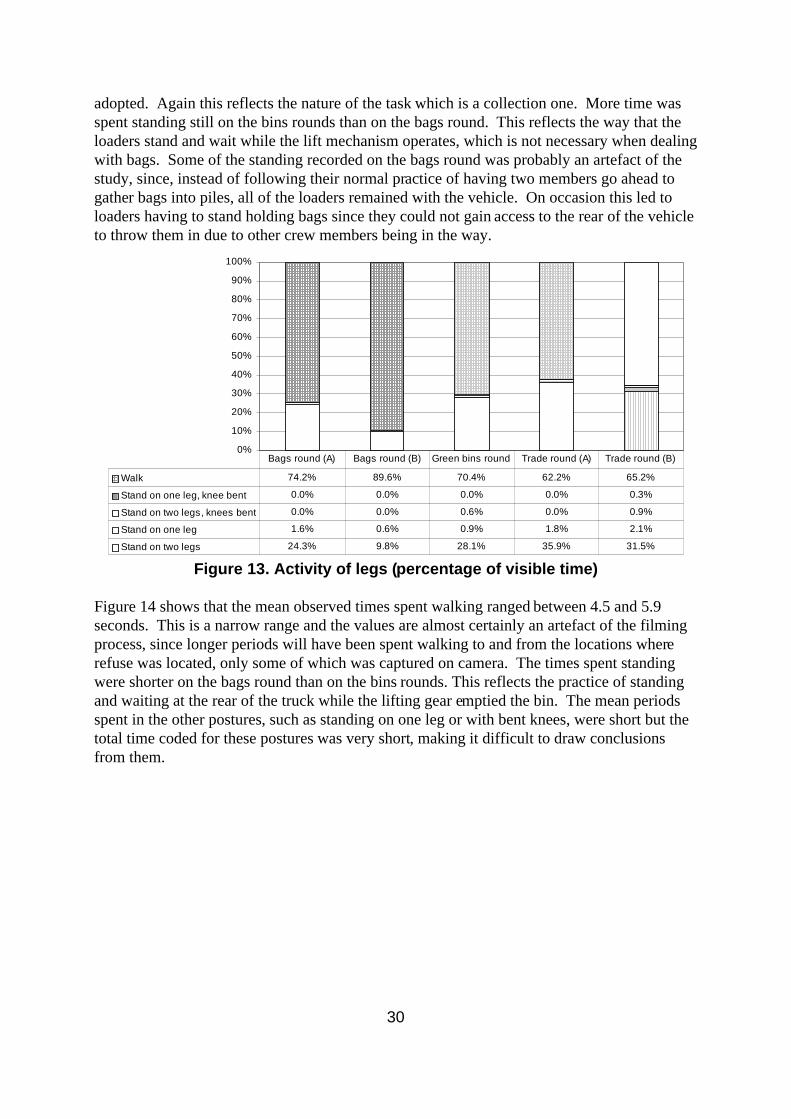
adopted. Again this reflects the nature of the task which is a collection one. More time wasspent standing still on the bins rounds than on the bags round. This reflects the way that theloaders stand and wait while the lift mechanism operates, which is not necessary when dealingwith bags. Some of the standing recorded on the bags round was probably an artefact of thestudy, since, instead of following their normal practice of having two members go ahead togather bags into piles, all of the loaders remained with the vehicle. On occasion this led toloaders having to stand holding bags since they could not gain access to the rear of the vehicleto throw them in due to other crew members being in the way.
0%
10%
20%
30%
40%
50%
60%
70%
80%
90%
100%
Walk 74.2% 89.6% 70.4% 62.2% 65.2%
Stand on one leg, knee bent 0.0% 0.0% 0.0% 0.0% 0.3%
Stand on two legs, knees bent 0.0% 0.0% 0.6% 0.0% 0.9%
Stand on one leg 1.6% 0.6% 0.9% 1.8% 2.1%
Stand on two legs 24.3% 9.8% 28.1% 35.9% 31.5%
Bags round (A) Bags round (B) Green bins round Trade round (A) Trade round (B)
Figure 13. Activity of legs (percentage of visible time)
Figure 14 shows that the mean observed times spent walking ranged between 4.5 and 5.9seconds. This is a narrow range and the values are almost certainly an artefact of the filmingprocess, since longer periods will have been spent walking to and from the locations whererefuse was located, only some of which was captured on camera. The times spent standingwere shorter on the bags round than on the bins rounds. This reflects the practice of standingand waiting at the rear of the truck while the lifting gear emptied the bin. The mean periodsspent in the other postures, such as standing on one leg or with bent knees, were short but thetotal time coded for these postures was very short, making it difficult to draw conclusionsfrom them.
30

0.0
1.0
2.0
3.0
4.0
5.0
6.0
7.0
Stand on two legs 2.5 1.5 4.0 3.8 2.5
Stand on one leg 1.3 1.1 1.4 1.6 1.0
Stand on two legs, knees bent 0.0 0.0 2.9 0.0 1.0
Stand on one leg, knee bent 0.0 0.0 0.0 0.0 0.8
Walk 5.9 5.5 5.7 4.9 4.5
Bags round (A) Bags round (B) Green bins round Trade round (A) Trade round (B)
Figure 14. Mean durations (s) of leg activities
4.1.5. Assignment of postures to OWAS Action Categories
Table 25 shows the Action Categories assigned to the percentages of time in Figures 7, 10 and13 using the boundaries in Table 23. All but two fell into AC 1. The amount of combinedbending and twisting of the trunk fell into AC 2 for the green bins round because thepercentage was 6.8% as opposed to the boundary of 5%. Some of this may be due to thetendency of workers to pull bins with one hand behind them. Because the difference from thethreshold is very small, at only 1.8%, even if the filming and coding could be shown to beerror free, the uncertainties of the boundaries of the OWAS Action Categories mean that itwould be difficult to justify intervention to attempt to reduce this value.
Table 25. OWAS Action Categories assigned to postures
AC 1AC 1AC 1AC 1AC 1Standing on two legsAC 1AC 1AC 1AC 1AC 1Standing on one legAC 1AC 1AC 1AC 1AC 1Standing on two legs, knees bentAC 1AC 1AC 1AC 1AC 1Standing on one leg, knee bentAC 1AC 1AC 1AC 2AC 1WalkingAC 1AC 1AC 1AC 1AC 12 hands below shoulder heightAC 1AC 1AC 1AC 1AC 11 hand above shoulder heightAC 1AC 1AC 1AC 1AC 12 hands above shoulder heightAC 1AC 1AC 1AC 1AC 1Straight trunkAC 1AC 1AC 1AC 1AC 1Bent trunkAC 1AC 1AC 1AC 1AC 1Twisted trunkAC 1AC 1AC 2AC 1AC 1Bent and twisted trunk
Traderound (B)
Traderound (A)
Green binsround
Bagsround (B)
Bagsround (A)
The amount of walking, at 90%, on the second film segment of the bags round also fell in toAC 2 since it exceeded 80%. However, since the total length of this film was under two
31

minutes and because the much longer first segment had a value of 74%, and because of thelimitations of the filming and coding discussed above, it is reasonable to ignore this.
4.2. Results of analysis of handling operations
4.2.1. Types of handling operations carried out
Figure 15 shows the different forms of handling occurring in the different rounds as thenumbers of changes of action recorded. Between 15 and 40% of changes of action involvedthe subject having no load in the hands. In the bags round pushing and pulling virtually neveroccurred. By contrast, in the bins rounds, significant numbers of pushing and pulling eventswere recorded. Pulling of bins was more commonly observed than pushing them.Unsurprisingly, large numbers of lifts, carries and throws occurred in the bags round. Smallernumbers occurred on the trade round, which was a mixture of bins and sacks. Because of thepresence of side waste on the green bins round some bag handling was required so a certainnumber of these events also occurred then.
0%
10%
20%
30%
40%
50%
60%
70%
80%
90%
100%
One hand only 45 6 43
No hand action 56 21 86 69 96
Pull 0 2 65 34 17
Push 0 2 53 26 9
Throw 85 15 23 16 48
Carry/hold 80 26 47 9 68
Lower 18 6 12 9 8
Lift 79 16 43 19 104
Bags round (A) Bags round (B) Green bins round Trade round (A) Trade round (B)
Figure 15. Occurrences of different manual handling operations
With regard to the time spent in each of the activities (Figure 16), the workers had no load intheir hands for between 45 and 62% of the visible time, and therefore were not carrying outmanual handling operations. The amount of time spent carrying or holding ranged widely,from 15% to 43% for the bags round; 10% for the green bins round and from 3% to 21% forthe trade round. No time was spent pulling on the bags round and under 1% pushing. On thegreen bins round 13% of the time was spent in pushing, and almost twice, 23% spent pulling.For the trade round almost equal times were spent in pushing and pulling (18% and 23% / 6%
32
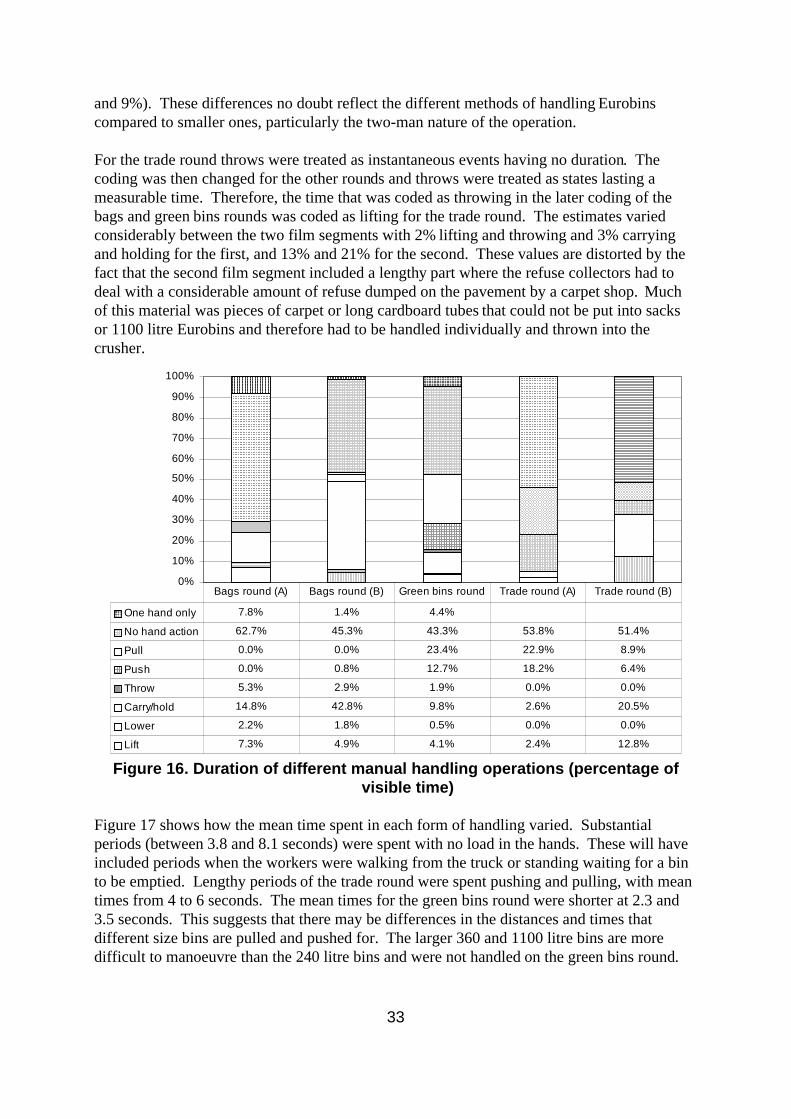
and 9%). These differences no doubt reflect the different methods of handling Eurobinscompared to smaller ones, particularly the two-man nature of the operation.
For the trade round throws were treated as instantaneous events having no duration. Thecoding was then changed for the other rounds and throws were treated as states lasting ameasurable time. Therefore, the time that was coded as throwing in the later coding of thebags and green bins rounds was coded as lifting for the trade round. The estimates variedconsiderably between the two film segments with 2% lifting and throwing and 3% carryingand holding for the first, and 13% and 21% for the second. These values are distorted by thefact that the second film segment included a lengthy part where the refuse collectors had todeal with a considerable amount of refuse dumped on the pavement by a carpet shop. Muchof this material was pieces of carpet or long cardboard tubes that could not be put into sacksor 1100 litre Eurobins and therefore had to be handled individually and thrown into thecrusher.
0%
10%
20%
30%
40%
50%
60%
70%
80%
90%
100%
One hand only 7.8% 1.4% 4.4%
No hand action 62.7% 45.3% 43.3% 53.8% 51.4%
Pull 0.0% 0.0% 23.4% 22.9% 8.9%
Push 0.0% 0.8% 12.7% 18.2% 6.4%
Throw 5.3% 2.9% 1.9% 0.0% 0.0%
Carry/hold 14.8% 42.8% 9.8% 2.6% 20.5%
Lower 2.2% 1.8% 0.5% 0.0% 0.0%
Lift 7.3% 4.9% 4.1% 2.4% 12.8%
Bags round (A) Bags round (B) Green bins round Trade round (A) Trade round (B)
Figure 16. Duration of different manual handling operations (percentage ofvisible time)
Figure 17 shows how the mean time spent in each form of handling varied. Substantialperiods (between 3.8 and 8.1 seconds) were spent with no load in the hands. These will haveincluded periods when the workers were walking from the truck or standing waiting for a binto be emptied. Lengthy periods of the trade round were spent pushing and pulling, with meantimes from 4 to 6 seconds. The mean times for the green bins round were shorter at 2.3 and3.5 seconds. This suggests that there may be differences in the distances and times thatdifferent size bins are pulled and pushed for. The larger 360 and 1100 litre bins are moredifficult to manoeuvre than the 240 litre bins and were not handled on the green bins round.
33
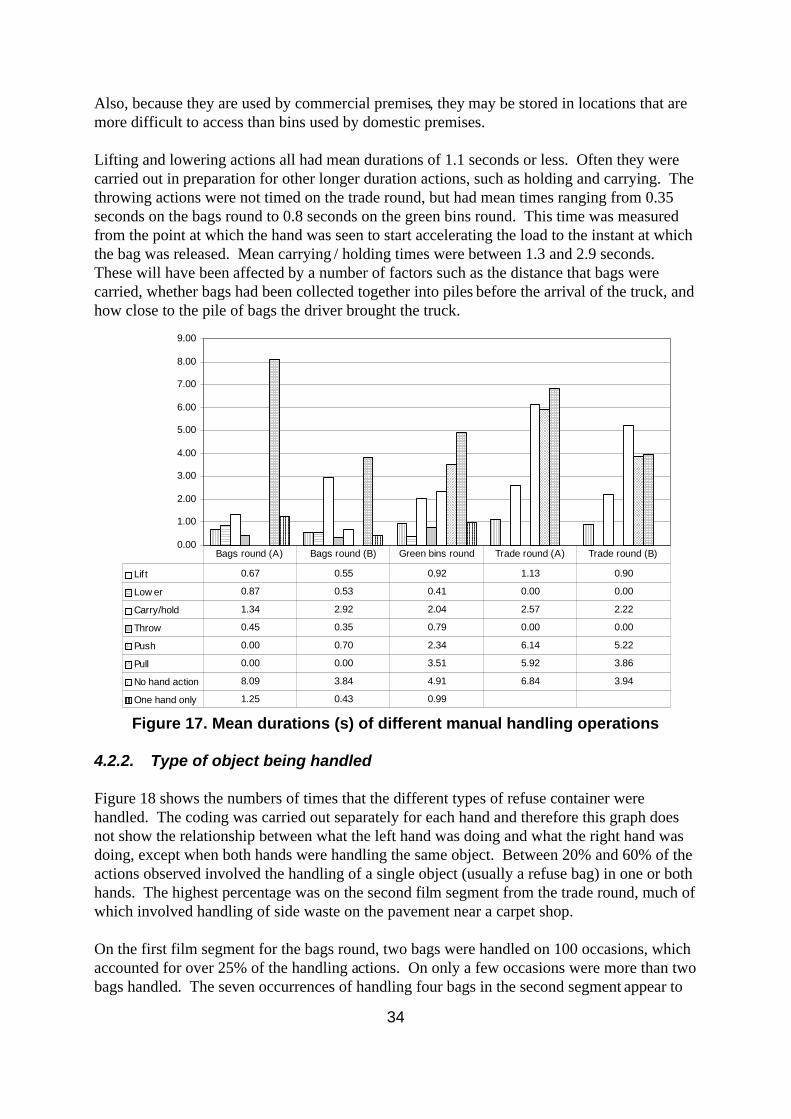
Also, because they are used by commercial premises, they may be stored in locations that aremore difficult to access than bins used by domestic premises.
Lifting and lowering actions all had mean durations of 1.1 seconds or less. Often they werecarried out in preparation for other longer duration actions, such as holding and carrying. Thethrowing actions were not timed on the trade round, but had mean times ranging from 0.35seconds on the bags round to 0.8 seconds on the green bins round. This time was measuredfrom the point at which the hand was seen to start accelerating the load to the instant at whichthe bag was released. Mean carrying / holding times were between 1.3 and 2.9 seconds.These will have been affected by a number of factors such as the distance that bags werecarried, whether bags had been collected together into piles before the arrival of the truck, andhow close to the pile of bags the driver brought the truck.
0.00
1.00
2.00
3.00
4.00
5.00
6.00
7.00
8.00
9.00
Lif t 0.67 0.55 0.92 1.13 0.90
Low er 0.87 0.53 0.41 0.00 0.00
Carry/hold 1.34 2.92 2.04 2.57 2.22
Throw 0.45 0.35 0.79 0.00 0.00
Push 0.00 0.70 2.34 6.14 5.22
Pull 0.00 0.00 3.51 5.92 3.86
No hand action 8.09 3.84 4.91 6.84 3.94
One hand only 1.25 0.43 0.99
Bags round (A) Bags round (B) Green bins round Trade round (A) Trade round (B)
Figure 17. Mean durations (s) of different manual handling operations
4.2.2. Type of object being handled
Figure 18 shows the numbers of times that the different types of refuse container werehandled. The coding was carried out separately for each hand and therefore this graph doesnot show the relationship between what the left hand was doing and what the right hand wasdoing, except when both hands were handling the same object. Between 20% and 60% of theactions observed involved the handling of a single object (usually a refuse bag) in one or bothhands. The highest percentage was on the second film segment from the trade round, much ofwhich involved handling of side waste on the pavement near a carpet shop.
On the first film segment for the bags round, two bags were handled on 100 occasions, whichaccounted for over 25% of the handling actions. On only a few occasions were more than twobags handled. The seven occurrences of handling four bags in the second segment appear to
34

have been a very rare occurrence, probably involving small bags, in what was a very shortpiece of film. No pushing or pulling occurred in the first film, and there were only a couple ofoccurrences in the second. In all three film segments involving bin handling more actionsinvolving filled bins were observed than ones involving empty bins. On a few occasions onthe bags round and green bins round bin lids were handled while bags were removed from thebins to avoid handling bins in awkward locations such as up and down long flights of steps.The bins that were handled in the second film segment from the bags round were round 110litre bins which were emptied into the back of the truck.
0%
10%
20%
30%
40%
50%
60%
70%
80%
90%
100%
No load 101 27 129 69 96
Empty bin 0 2 38 23 9
Filled bin 0 2 80 37 17
Bin lid 4 0 13 0 0
4 bags 0 7 1 0 0
3 bags 17 0 7 0 0
2 bags 100 10 16 5 21
1 bag 141 46 88 48 207
Bags round (A) Bags round (B) Green bins round Trade round (A) Trade round (B)
Figure 18. Frequency of handling of different objects
Figure 19 shows the relative times spent handling different objects. The refuse collectors hadno load in their hands for between 50% and 70% of the time observed on the bags round. Forthe bins rounds, approximately 50% of the time was spent with the hands unloaded. For thelonger film segment of the bags round, 16% of the time was spent handling one bag per hand,10% handling two bags, and under 2% handling three bags. Of the 29.5% of the observedtime spent handling, nearly 90% was spent with one or two bags per hand.
Sixteen per cent of the observed time for the green bins round was spent handling waste not inbins and 36% was spent handling bins so over 50% of the observed time was spent handling.Despite the round being only supposed to deal with recyclable material placed in easilyidentifiable wheelie bins there was still a significant amount of handling of bags and otherside waste. For the first film segment of the trade round, only 5% of the observed time wasspent handling bags, event though the round is described as a mixture of bins and trades sacks,but 41% was spent handling bins. The second segment included the clearing of a largeamount of refuse dumped on the pavement near a carpet shop that will have contributed to the33% of time spent handling ‘bags’.
35

0%
10%
20%
30%
40%
50%
60%
70%
80%
90%
100%
No load 70.5% 46.8% 47.7% 53.8% 51.4%
Empty bin 0 0.5% 14.3% 15.6% 6.6%
Filled bin 0 0.3% 21.8% 25.5% 8.7%
Bin lid 1.4% 0.0% 0.8% 0.0% 0.0%
4 bags 0.0% 9.9% 0.0% 0.0% 0.0%
3 bags 1.7% 0.0% 0.4% 0.0% 0.0%
2 bags 9.9% 14.5% 2.3% 0.3% 3.4%
1 bag 16.4% 28.0% 12.7% 4.7% 29.9%
Bags round (A) Bags round (B) Green bins round Trade round (A) Trade round (B)
Figure 19. Relative time spent handling different objects
Figure 20 shows the mean durations of handling observed for the different objects. For thefirst film segment of the bags round, the mean time for bag handling was below 1 second.
0.00
1.00
2.00
3.00
4.00
5.00
6.00
7.00
8.00
1 bag 0.84 1.08 1.41 0.87 1.06
2 bags 0.72 2.58 1.41 0.59 1.20
3 bags 0.73 0.00 0.62 0.00 0.00
4 bags 0.00 2.52 0.00 0.00 0.00
Bin lid 2.54 0.00 0.58 0.00 0.00
Filled bin 0.00 0.40 2.66 6.06 3.76
Empty bin 0.00 0.30 3.67 5.95 5.41
No load 5.04 3.08 3.60 6.84 3.94
Bags round (A) Bags round (B) Green bins round Trade round (A) Trade round (B)
Figure 20. Mean durations (s) of handling different objects
36

This short duration of bag handling reflects the practice of crew members having gone aheadto gather bags into piles. The instances of bag handling on the bins round were also of shortmean duration, with a maximum of 1.4 seconds. The periods without any load in the handswere of relatively long duration, ranging from 3.1 seconds to 6.9 seconds on the differentfilms. Of similar lengths were the times spent handling empty and full bins. This suggeststhat the longer times spent handling full bins than handling empty ones (Figure 19) areprobably artefacts of the filming tending to concentrate on full bins being brought to the truckrather than empty ones being taken away.
4.2.3. Use of the hands in handling refuse
Figure 21 shows how the number of occasions on which objects were being handled by theleft hand, by the right hand, or by both hands together varied. Because of the differences incoding methods used to deal with the trade round, where different bin sizes were coded, andthe other rounds, where bin handling was coded but bin size was not coded, the values forhands on the trade round in Figures 21 to 23 relate only to handling of bags.
0%
10%
20%
30%
40%
50%
60%
70%
80%
90%
100%
No load 101 27 129 69 96
Bins 60 26
Both hands 35 17 59 19 92
Right hand 116 29 93 9 67
Left hand 111 21 91 25 69
Bags round (A) Bags round (B) Green bins round Trade round (A) Trade round (B)
Figure 21. Frequency of use of the hands in handling refuse
For the bags round it was relatively unusual for both hands to be handling the same load, butthe two hands were used separately at almost exactly the same frequency. This reflects thetendency of workers to reduce the number of trips they had to make by transporting as muchas possible by carrying bags in both hands. It implies that loading on the body was largelysymmetrical because of this practice, rather than the more stressful asymmetrical loading thatwould have been produced if one-handed carrying had been employed.
For the green bins round, relatively more two-handed handling occurred. This will be due tothe inclusion of two-handed pushing of wheelie bins in the values rather than a change totwo-handed handling of black bags. However, a commonly observed tendency was for theindividual to pull one bin and push another at the same time or to carry a bag in one hand and
37

to pull or push a bin with the other (Figure 43). For the trade round there was a greatertendency for two-handed handling of ‘bags’ to occur. The actual trade sacks being collectedwere observably bigger than normal black bags (see Figures 28 and 55) but no data werecollected on their weights.
Figure 22 shows the relative total times each hand was in use separately or both hands were inuse. The percentages should be treated with caution as they do not adequately distinguishperiods when only one hand was in use from periods when both hands were in use handlingdifferent objects. Despite this, single-handed handling of objects, often with each hand beingused for different objects, was more common than two-handed handling of a single object.There were also variations in which hand was used more, which suggests, as with the numberof actions, that the total load was relatively evenly distributed across the hands in all rounds.
0%
10%
20%
30%
40%
50%
60%
70%
80%
90%
100%
No load 70.5% 46.8% 47.7% 53.8% 51.4%
Bins 41.1% 15.3%
Both hands 4.2% 7.3% 16.2% 3.0% 15.9%
Right hand 8.9% 33.7% 18.5% 0.7% 7.6%
Left hand 16.4% 12.2% 17.6% 1.4% 9.8%
Bags round (A) Bags round (B) Green bins round Trade round (A) Trade round (B)
Figure 22. Relative times spent using the hands
Figure 23 shows how the mean durations of hand use varied across the different filmsegments. Apart from the very short second segment of the bags round, the differences withina round are all less than 1 second. The longest durations are in the green bins round andprobably reflect the influence of pulling and pushing bins for periods of several seconds.
38

-
1.00
2.00
3.00
4.00
5.00
6.00
7.00
8.00
Left hand 1.07 1.03 1.89 0.51 1.04
Right hand 0.55 2.06 1.94 0.67 0.84
Both hands 0.87 0.77 2.67 1.36 1.27
Bins 0.00 0.35 2.98 6.02 4.33
No load 5.04 3.08 3.60 6.84 3.94
Bags round (A) Bags round (B) Green bins round Trade round (A) Trade round (B)
Figure 23. Mean durations (s) of hand use
4.2.4. Sizes of object handled on the trade round
The three sizes (240, 360 and 1100 litre) of bin on the trade round were coded separately buton the other rounds no distinction was made since almost all were 240 litres. Figure 24 showshow the frequencies of handling varied for the different size bins and of ‘bags’ (the ‘bags’classification included a large amount of side waste that was too large to be put into bags,such as carpet offcuts and long cardboard tubes). The Eurobins were handled more frequentlythan the two smaller sizes, which were found equally often.
0%
10%
20%
30%
40%
50%
60%
70%
80%
90%
100%
No load 69 96
Bags 53 228
1100 litre bins 26 15
360 litre bins 16 6
240 litre bins 18 5
Trade round (A) Trade round (B)
Figure 24. Frequency of handling of different sizes bins
39
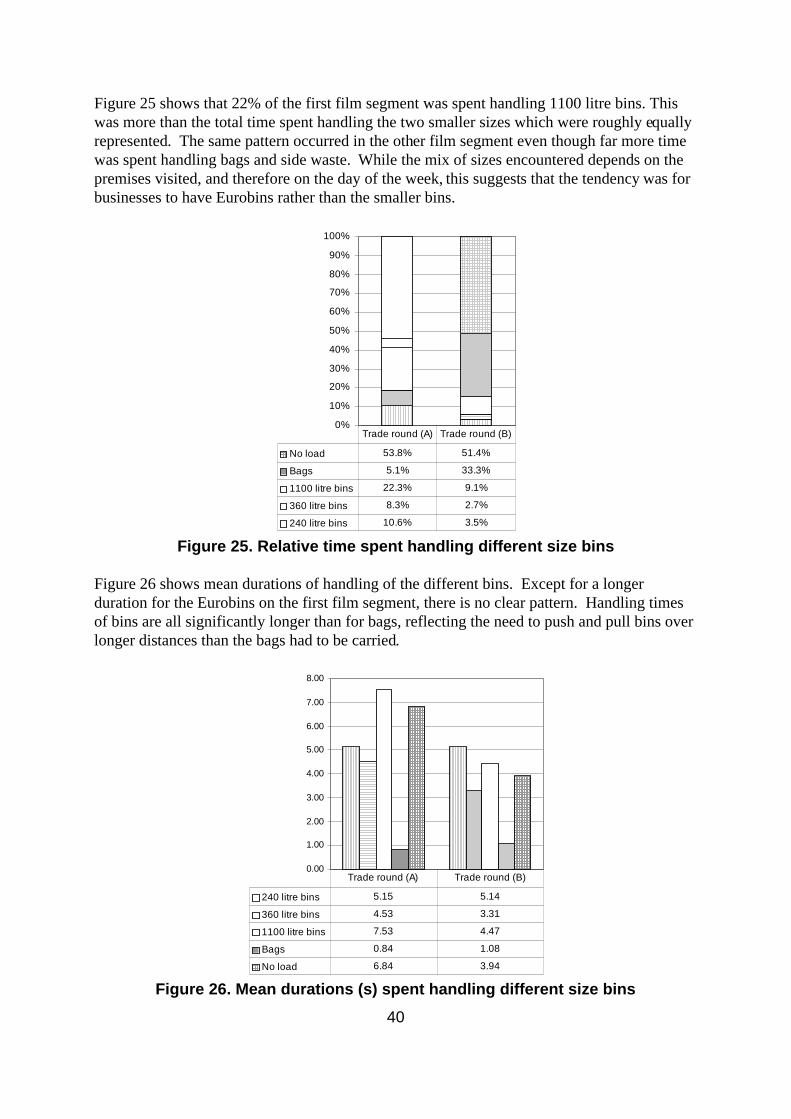
Figure 25 shows that 22% of the first film segment was spent handling 1100 litre bins. Thiswas more than the total time spent handling the two smaller sizes which were roughly equallyrepresented. The same pattern occurred in the other film segment even though far more timewas spent handling bags and side waste. While the mix of sizes encountered depends on thepremises visited, and therefore on the day of the week, this suggests that the tendency was forbusinesses to have Eurobins rather than the smaller bins.
0%
10%
20%
30%
40%
50%
60%
70%
80%
90%
100%
No load 53.8% 51.4%
Bags 5.1% 33.3%
1100 litre bins 22.3% 9.1%
360 litre bins 8.3% 2.7%
240 litre bins 10.6% 3.5%
Trade round (A) Trade round (B)
Figure 25. Relative time spent handling different size bins
Figure 26 shows mean durations of handling of the different bins. Except for a longerduration for the Eurobins on the first film segment, there is no clear pattern. Handling timesof bins are all significantly longer than for bags, reflecting the need to push and pull bins overlonger distances than the bags had to be carried.
0.00
1.00
2.00
3.00
4.00
5.00
6.00
7.00
8.00
240 litre bins 5.15 5.14
360 litre bins 4.53 3.31
1100 litre bins 7.53 4.47
Bags 0.84 1.08
No load 6.84 3.94
Trade round (A) Trade round (B)
Figure 26. Mean durations (s) spent handling different size bins40
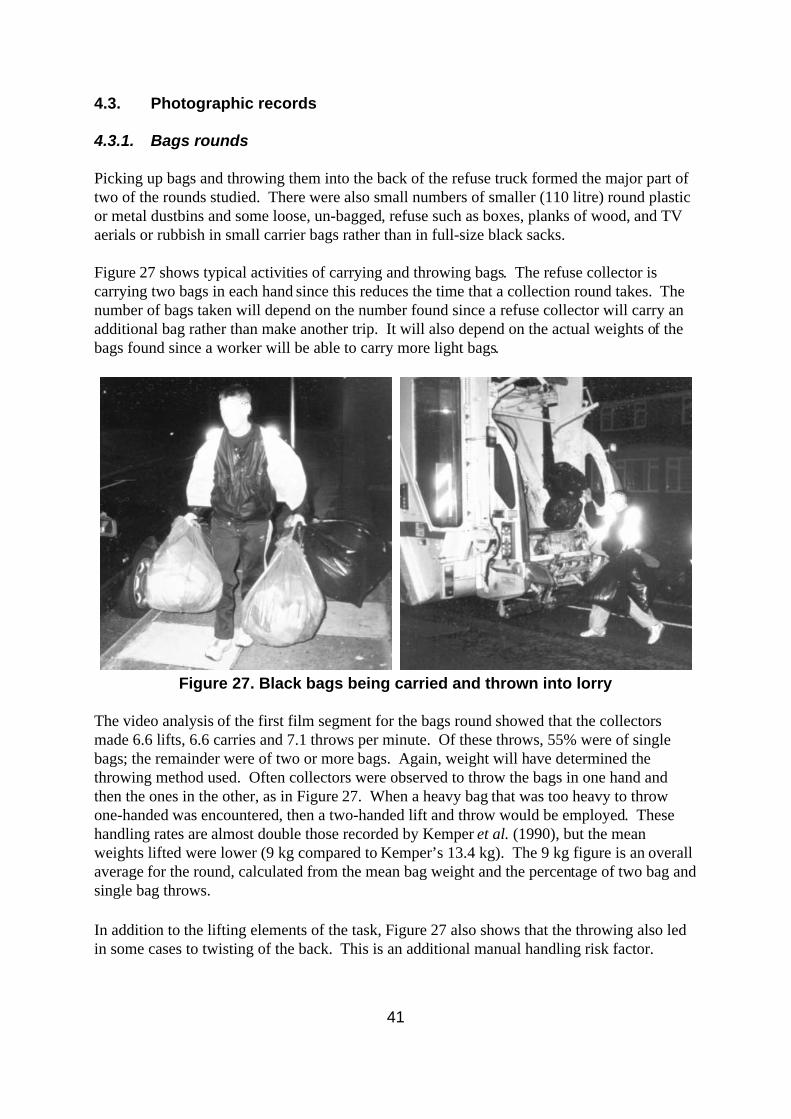
4.3. Photographic records
4.3.1. Bags rounds
Picking up bags and throwing them into the back of the refuse truck formed the major part oftwo of the rounds studied. There were also small numbers of smaller (110 litre) round plasticor metal dustbins and some loose, un-bagged, refuse such as boxes, planks of wood, and TVaerials or rubbish in small carrier bags rather than in full-size black sacks.
Figure 27 shows typical activities of carrying and throwing bags. The refuse collector iscarrying two bags in each hand since this reduces the time that a collection round takes. Thenumber of bags taken will depend on the number found since a refuse collector will carry anadditional bag rather than make another trip. It will also depend on the actual weights of thebags found since a worker will be able to carry more light bags.
Figure 27. Black bags being carried and thrown into lorry
The video analysis of the first film segment for the bags round showed that the collectorsmade 6.6 lifts, 6.6 carries and 7.1 throws per minute. Of these throws, 55% were of singlebags; the remainder were of two or more bags. Again, weight will have determined thethrowing method used. Often collectors were observed to throw the bags in one hand andthen the ones in the other, as in Figure 27. When a heavy bag that was too heavy to throwone-handed was encountered, then a two-handed lift and throw would be employed. Thesehandling rates are almost double those recorded by Kemper et al. (1990), but the meanweights lifted were lower (9 kg compared to Kemper’s 13.4 kg). The 9 kg figure is an overallaverage for the round, calculated from the mean bag weight and the percentage of two bag andsingle bag throws.
In addition to the lifting elements of the task, Figure 27 also shows that the throwing also ledin some cases to twisting of the back. This is an additional manual handling risk factor.
41

Figure 28. Black bags ready for collection
At various points on the bags rounds there were large piles of bags for collection (Figure 28).In certain cases these had been arranged by members of the collection team going ahead. Inother cases they had been placed in piles by the public. This method reduced the amount oftime spent walking collecting and carrying bags. It also split the handling of bags between theworkers so that the ones ahead of the truck did the lifting and carrying to the kerbside whilethe ones behind the truck did the lifting and throwing into the truck. This meant that the moststrenuous tasks of carrying and throwing are split between different individuals. It alsoincreases the rate of loading bags into the truck, but decreases the number and duration ofstops the truck makes. The net effect is to increase the overall rate of collection, which isdesirable from the workers’ perspective since they operate on a ‘job and finish’ basis.
Figure 29. Black bags being loaded into lorry
42

Figure 29 shows a typical bag carrying posture. The bags are held away from the body inorder to reduce contact with the legs. This serves two purposes: it makes walking easier andreduces the risks of injuries from ‘sharps’ (sharp objects). However, holding bags away fromthe body means that the weight of the bags is taken solely through the arms and shoulders. Bycontrast, in other occupations, carrying objects, such as boxes, would often be done byholding the object with two hands against the front of the body, thereby transmitting theweight directly to the trunk, increasing the control over the load and reducing the load on thearms and shoulders.
Figures 30 and 31 show the stooping postures that were common during bag rounds. It isclear from the video that the collectors often lifted bags from the ground at large horizontaldistances from their feet. It is likely therefore that the initial part of the lift actually involvedpulling the loads towards them as they straightened up and that the loads handled in this waywere the light ones. Stooping is often preferred by workers to squat or semi-squat liftsbecause it requires less energy expenditure since only the trunk is being moved, not the wholebody.
Figure 30. Black bags / refuse being lifted from the pavement
Figure 31. Black bags being lifted from the pavement
43

Figures 32 to 34 show plastic bins being lifted and emptied into the refuse truck. Weighingthree full plastic bins gave a mean weight of 16.2 kg. These bins have to be lifted over therave bar at the back of the truck which is at approximately shoulder height of the individualshown. Therefore, he has to lift parts of the bin to above head height. Clearly tallerindividuals would be more able to lift to these heights than the relatively short individualshown.
The manual handling task is made more complex by the need to change grip repeatedly duringthe emptying of such a bin. While there are handles at the top of such bins which can be usedfor lifting from the ground or carrying, emptying the bin, as shown, requires the grasping ofthe rim and of the base and, possibly, both sides of the base. Also, factors such as theslipperiness of the bin due to rain or other contaminants will affect the ease of handling.
Figure 32. Plastic dustbin being emptied into back of lorry
Figure 33. Bins being carried to and emptied into lorry
44

Figure 34. Bin being tipped into truck
While the majority of refuse is not intrinsically harmful or is adequately wrapped, on occasionrefuse collectors come across hazardous items such as pieces of broken glass, as shown inFigure 35, or discarded syringes. It is normal for them to wear Kevlar trousers to protectagainst contact injuries from sharp objects in plastic bags. They also all had gloves that theywore at intervals throughout the rounds. The glass shown in Figure 35 was clearly visible andthe individuals handling it took sufficient care that they did not suffer injury despite notwearing gloves. It is common for local authorities to ask householders to wrap sharp objectsin multiple layers of newspaper to prevent injuries to their workers. However, if this locationhad been visited before daybreak or if the glass had been inadequately wrapped or just put intoa plastic bag so that it was not easily identifiable then the risk of injury from handling it wouldhave been significantly higher.
Figure 35. Handling of pieces of broken glass
One feature of the city where the study was carried out is that in some areas refuse is collectedfrom alleys running along the length of a road behind the houses. These may only haveentrances at the ends of the street meaning that all refuse bags have to be carried to either endbefore they can be loaded into the truck. As shown in Figure 36, the surfaces may vary fromgood tarmac surfaces along which it is easy to walk and wheelie bins could be pushed orpulled, to overgrown muddy tracks where it will be necessary to fight through undergrowthsuch as brambles.
45

Figure 36. Back alleys with hard and unmade surfaces
4.3.2. Green bin round
Figure 37 shows the labels placed on grey and green bins in an area where recyclingcollections are carried out. These encourage householders to separate their waste intorecyclable and non-recyclable. However, the expectation is that glass bottles and jars will berecycled via bottle banks in supermarket car parks. When recyclable material is collected it istipped straight from the green bin into a standard refuse lorry with a crusher. No attempt ismade by the crew to exclude material that shouldn’t be recycled and no attempt is made toseparate the waste. Once the lorry is full, it is driven to the waste transfer station and emptied.The material is loaded onto a belt and sorted manually. While this task was not seen duringthe visit, the sorting must be a physically demanding and hazardous task because of the needto separate different types of recyclable waste from the crushed material while leaving theresidue of unrecyclable waste which should not have been collected.
Figure 37. Labels on grey and green bins
Often the bins had to be bumped up and down kerbs (Figure 39), though where dropped orlow kerbs (Figure 38) were available they were used.
46
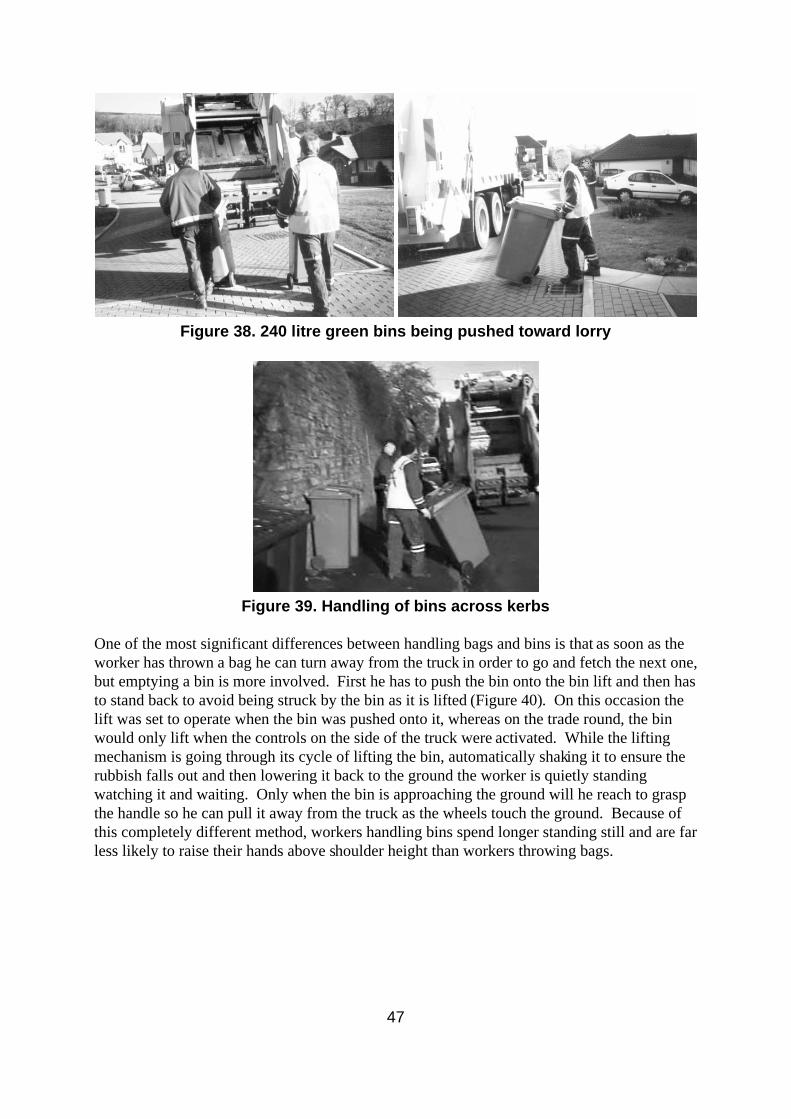
Figure 38. 240 litre green bins being pushed toward lorry
Figure 39. Handling of bins across kerbs
One of the most significant differences between handling bags and bins is that as soon as theworker has thrown a bag he can turn away from the truck in order to go and fetch the next one,but emptying a bin is more involved. First he has to push the bin onto the bin lift and then hasto stand back to avoid being struck by the bin as it is lifted (Figure 40). On this occasion thelift was set to operate when the bin was pushed onto it, whereas on the trade round, the binwould only lift when the controls on the side of the truck were activated. While the liftingmechanism is going through its cycle of lifting the bin, automatically shaking it to ensure therubbish falls out and then lowering it back to the ground the worker is quietly standingwatching it and waiting. Only when the bin is approaching the ground will he reach to graspthe handle so he can pull it away from the truck as the wheels touch the ground. Because ofthis completely different method, workers handling bins spend longer standing still and are farless likely to raise their hands above shoulder height than workers throwing bags.
47

Figure 40. 240 litre green bin being pushed onto bin lift
At some locations, numbers of bins had to be retrieved from outbuildings. The positioning ofmany of these stores behind the buildings that they serve meant that retrieval involved pullingor pushing the bins longer distances than on typical residential streets where the bins are leftin front of the houses.
Officially, the green bin round dealt with green 240 litre wheelie bins only (Figures 38-40). Inmany cases the bins were only partly filled. However, side waste, such as bags or cardboardboxes, was often encountered and had to be loaded into the truck (Figures 41-43). Sometimesthis entailed handling both a bin and a bag simultaneously (Figure 43).
Figure 41. Handling of side waste on green bins round
48

Figure 42. Carrying and throwing of side waste
Figure 43. Combined handling of bins and bags on green bins round
Both hilly and flat areas were covered by this round. There were a number of premises wherethe bins had to be pulled up, and then back down, flights of stairs (Figures 44-45). While, onthis occasion the flight of steps was relatively short, it did create problems with pulling theheavier bins up the steps and with controlling the empty bins being dragged down them whichtended to bounce around.
At one location the bins were stored at the top of a large flight of steps with an awkwardcorner at the bottom. The refuse collector chose (Figure 46) to remove the rubbish from thebin and manually carry it down the steps rather than have the difficulty of manhandling the bindown the steps and then back up them. This was made more difficult by the fact that therubbish was in small bags, rather than a large refuse sack, meaning that the worker had to pickthem out of the bottom of the bin and then carry several small bags down the steps.
There is probably no easy solution to such problems in the hilly parts of an area whererecycling rounds occur. Ramps are only possible for relatively small changes of level due tothe need to avoid steep slopes that would be particularly hazardous in wet or icy conditions.
49

Figure 44. Handling of green bins up and down steps
Figure 45. Handling of green bins up and down steps
Figure 46. Removal of waste from a wheelie bin to avoid handling it up and
down a flight of steps
50

4.3.3. Trade round (bins / bags)
The trade round dealt with a wide range of bin and refuse types ranging from bags to 1100litre Eurobins. As Figure 47 indicates, the refuse collectors acknowledged that best practicewas to move the Eurobins in pairs. This is a positive finding and is supported by theliterature, which suggests that working in teams like this can reduce spinal loading by as muchas 75%. Where possible the Eurobins were pushed / pulled across dropped kerbs or ramps butin situations where this was not possible, full Eurobins had to be dropped down kerbs and theemptied bins pulled back up.
Figure 47. Eurobin being wheeled from store
As can be seen from Figures 48-50, considerable effort can be required to move a full bin. Avariety of pulling and pushing postures were adopted depending on the weight of the bin, theprecision with which it needed to be directed (most precisely at the point of bringing it to thebin lift), and the slope (if any) of the ground. Postures could be one or two-handed and weretypically asymmetrical, with the hand(s) either to one side or behind the trunk. Sometimesboth hands were on the same handle on the bin and sometimes on separated handles.
51

The sequence does not show that, before loading the bin onto the lifting mechanism, excessbags visible in Figure 48 were manually removed from the top and thrown into the truck. Thisthen allowed the top of the bin to be moved to the closed position (Figure 49) before the binwas actually lifted.
Figure 48. Pulling of full 1100 litre bin to truck
Figure 49. Loading and lifting of Eurobin onto truck after removing excess
waste and closing lid
The lifting mechanism consisted of two parts which therefore could allow two smaller bins tobe lifted independently. Because of the mixture of bin sizes being handled, the mechanismswere set so that they could only operate when the buttons on the control panels on the side ofthe vehicle were being pressed. A different practice was observed on the green bin roundwhere 240 litre bins were being pushed onto the mechanism, activating a switch, which liftedthem automatically. This positioning of the controls means that the operator must stand to theside of the vehicle out of the path of the bin being lifted. The manual control meant that asingle operator could empty one of the smaller bins using one side of the mechanism, but bothoperators were required to work together to empty one of the Eurobins using both sides of themechanism. This has the advantage that it will lead to the workers not handling these bins asindividuals. The actual emptying process involved three stages: lifting the bin, shaking it tomake the contents fall out, and lowering it down to the ground. The timings on the video
52
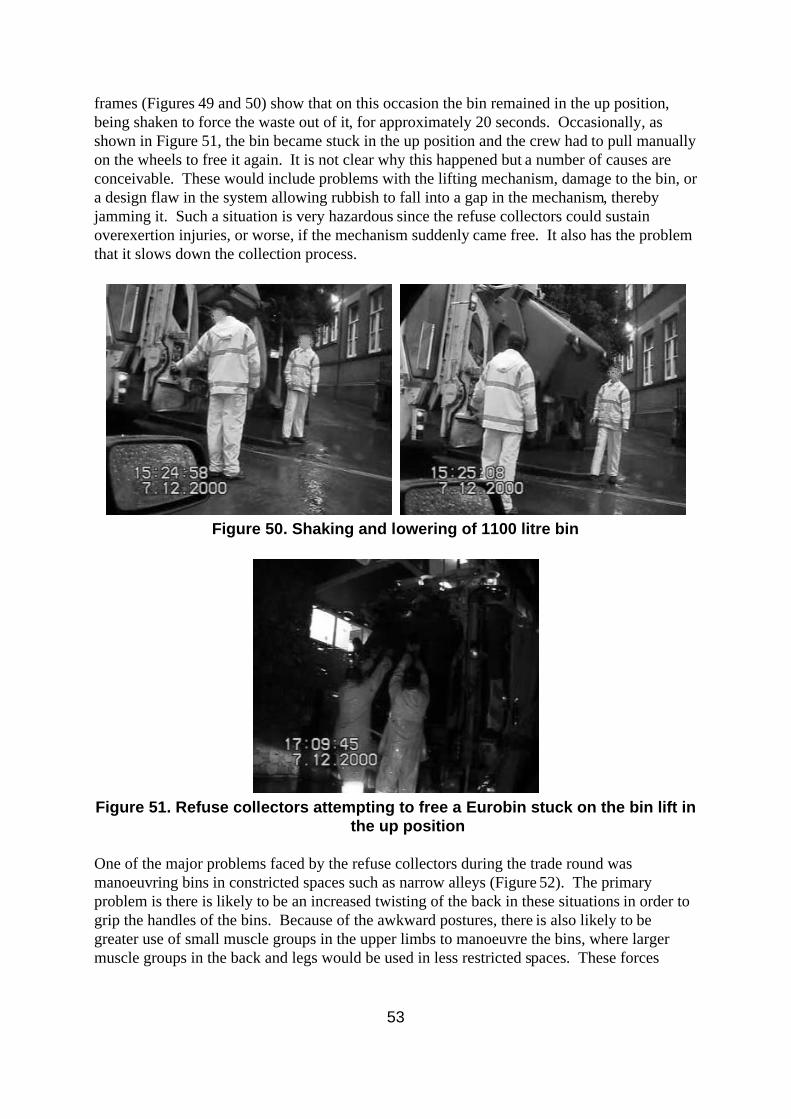
frames (Figures 49 and 50) show that on this occasion the bin remained in the up position,being shaken to force the waste out of it, for approximately 20 seconds. Occasionally, asshown in Figure 51, the bin became stuck in the up position and the crew had to pull manuallyon the wheels to free it again. It is not clear why this happened but a number of causes areconceivable. These would include problems with the lifting mechanism, damage to the bin, ora design flaw in the system allowing rubbish to fall into a gap in the mechanism, therebyjamming it. Such a situation is very hazardous since the refuse collectors could sustainoverexertion injuries, or worse, if the mechanism suddenly came free. It also has the problemthat it slows down the collection process.
Figure 50. Shaking and lowering of 1100 litre bin
Figure 51. Refuse collectors attempting to free a Eurobin stuck on the bin lift inthe up position
One of the major problems faced by the refuse collectors during the trade round wasmanoeuvring bins in constricted spaces such as narrow alleys (Figure 52). The primaryproblem is there is likely to be an increased twisting of the back in these situations in order togrip the handles of the bins. Because of the awkward postures, there is also likely to begreater use of small muscle groups in the upper limbs to manoeuvre the bins, where largermuscle groups in the back and legs would be used in less restricted spaces. These forces
53

would need to be applied to the bins to move them into a position from which they can bepushed or pulled along the alleys / through narrow gaps.
Other problems arise with narrow alleys and doorways due to obstructions and poor groundsurfaces. The space restrictions may mean that such obstructions cannot be avoided. Thismay cause overexertion injuries as bins are pulled or pushed over them. The space restrictionswill also reduce the ability of other refuse collectors to assist in these situations.
Figure 52. 240 litre trade bins being manoeuvred in alleys
Figure 52 also shows another problem that occurred on the trade round: manoeuvring 240 litrebins up and down steps. In this case a full bin is being pulled down a set of steps, again in analley. Given that these bins can weigh up to approximately 75 to 80 kg this activity could leadto excessive compressive forces on the lower back.
Contamination of steps is yet another hazard that can be seen in Figure 52. There are blackbags and loose refuse on the ground creating slipping and tripping hazards that could haveresulted in loss of balance whilst the refuse collector was trying to manoeuvre a bin up ordown the steps, especially in wet conditions. This combination of hazards could result insprain injuries, abrasions, bruising, etc., if a fall were to occur.
Figure 53 shows a case where a refuse collector was removing a 360 litre bin from its store.This is an example of a situation where he could have reduced the precision of manoeuvreneeded by opening the second door and giving himself more space. However, this would then
54

have increased the time spent opening and closing the doors and would therefore have slowedthe round down slightly.
Figure 53. Removal of 360 litre bin from refuse store
Occasionally, locations were encountered where the bin was stored at some considerabledistance from the point to which the vehicle could be brought. Figure 54 shows a 360 litre binbeing returned from the truck up a path leading to a sports field and a building in the distantbackground. Such problems can only be overcome by proper vehicular access to the site.
Figure 54. 360 litre bin being returned to distant storage location
55
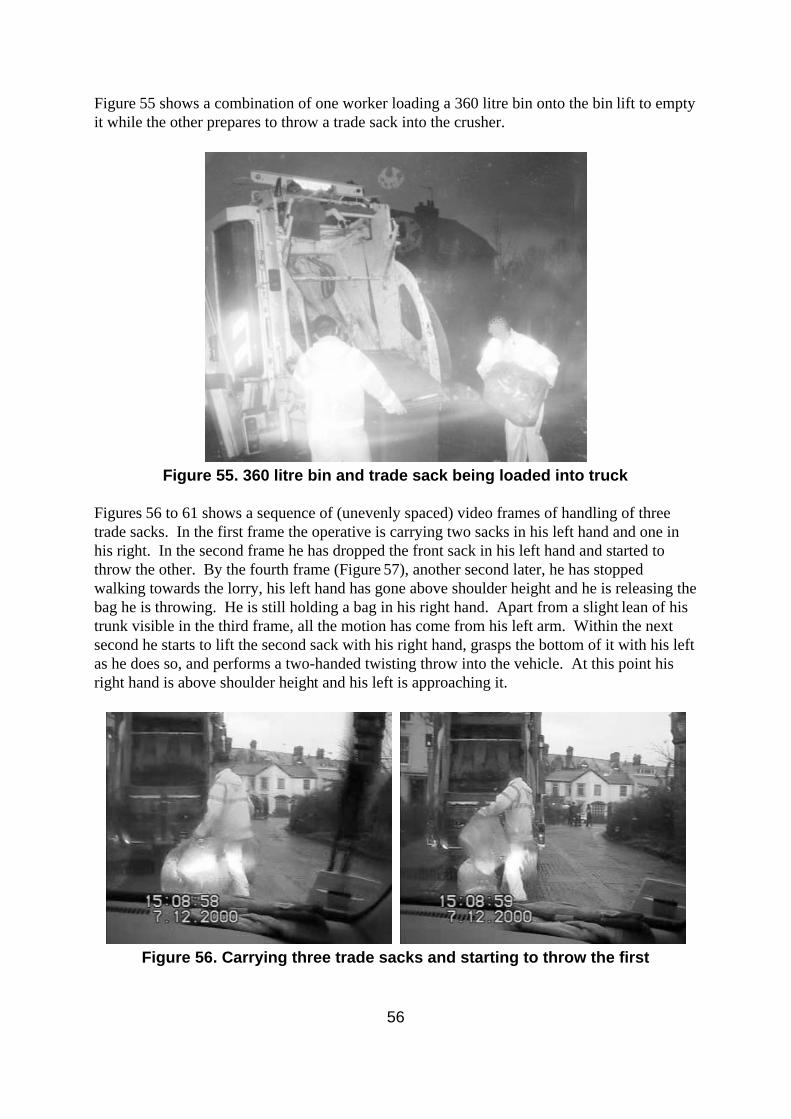
Figure 55 shows a combination of one worker loading a 360 litre bin onto the bin lift to emptyit while the other prepares to throw a trade sack into the crusher.
Figure 55. 360 litre bin and trade sack being loaded into truck
Figures 56 to 61 shows a sequence of (unevenly spaced) video frames of handling of threetrade sacks. In the first frame the operative is carrying two sacks in his left hand and one inhis right. In the second frame he has dropped the front sack in his left hand and started tothrow the other. By the fourth frame (Figure 57), another second later, he has stoppedwalking towards the lorry, his left hand has gone above shoulder height and he is releasing thebag he is throwing. He is still holding a bag in his right hand. Apart from a slight lean of histrunk visible in the third frame, all the motion has come from his left arm. Within the nextsecond he starts to lift the second sack with his right hand, grasps the bottom of it with his leftas he does so, and performs a two-handed twisting throw into the vehicle. At this point hisright hand is above shoulder height and his left is approaching it.
Figure 56. Carrying three trade sacks and starting to throw the first
56

Figure 57. One-handed throw of the first sack into the back of the truck
Figure 58. Two-handed throw of the second sack into the truck
Two seconds later (Figure 59) he is stooping to start a two-handed lift of the third sack. As hebrings his trunk upright (Figure 60) he starts a twisting throw, bringing his hands to aboveshoulder height as he releases the sack (Figure 61). The process of loading three sacks intothe truck takes only five seconds from walking up to the vehicle to releasing the third sack.
Figure 59. Two-handed lift of the third sack from the ground
57

Figure 60. Two-handed lift and twisting throw of the last sack
Figure 61. The point of release of the last sack
58
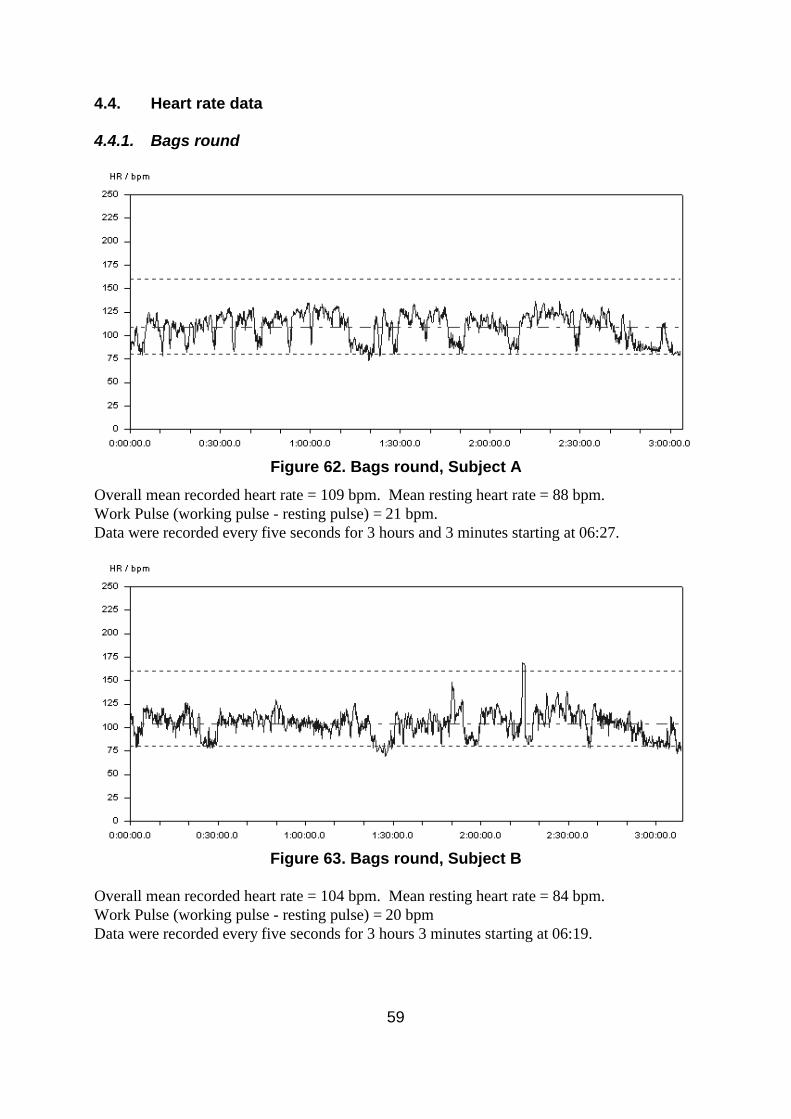
4.4. Heart rate data
4.4.1. Bags round
Figure 62. Bags round, Subject AOverall mean recorded heart rate = 109 bpm. Mean resting heart rate = 88 bpm.Work Pulse (working pulse - resting pulse) = 21 bpm.Data were recorded every five seconds for 3 hours and 3 minutes starting at 06:27.
Figure 63. Bags round, Subject B
Overall mean recorded heart rate = 104 bpm. Mean resting heart rate = 84 bpm.Work Pulse (working pulse - resting pulse) = 20 bpmData were recorded every five seconds for 3 hours 3 minutes starting at 06:19.
59

4.4.2. Green wheelie bins round
Figure 64. Green wheelie bins
Overall mean recorded heart rate = 96 bpm. Mean resting heart rate = 76 bpm.Work Pulse (working pulse - resting pulse) = 20 bpmData were recorded every five seconds for 6 hours 30 minutes starting at 05:59.
Data were recorded from another subject for every heart beat for 46 minutes starting at 09:23.The heart rate monitor had been handed to the driver at 06:00 with a request to ask a crewmember they would pick up part way to wear it. It was explained that the watch was pre-setand a single button press would start recording. The worker changed the recording intervalfrom 5 s to the beat by beat setting and did not start recording until several hours into theround. As a result, the watch memory was full when it was collected at approximately 12:30,having recorded only 46 minutes of data. The graph of the data is not shown since it does notreflect the heart rate over the shift.
60

4.4.3. Trade round (bins / trade sacks)
Figure 65. Trade round, Subject AOverall mean recorded heart rate = 101 bpm. Mean resting heart rate = 87 bpm.Work Pulse (working pulse - resting pulse) = 14 bpmData were recorded every five seconds for 2 hours 35 minutes starting at 14:49.
Figure 66. Trade round, Subject BOverall mean recorded heart rate = 101 bpm. Mean resting heart rate = 82 bpm.Work Pulse (working pulse - resting pulse) = 19 bpmData were recorded every five seconds for 2 hours 32 minutes, starting at 14:50.
61
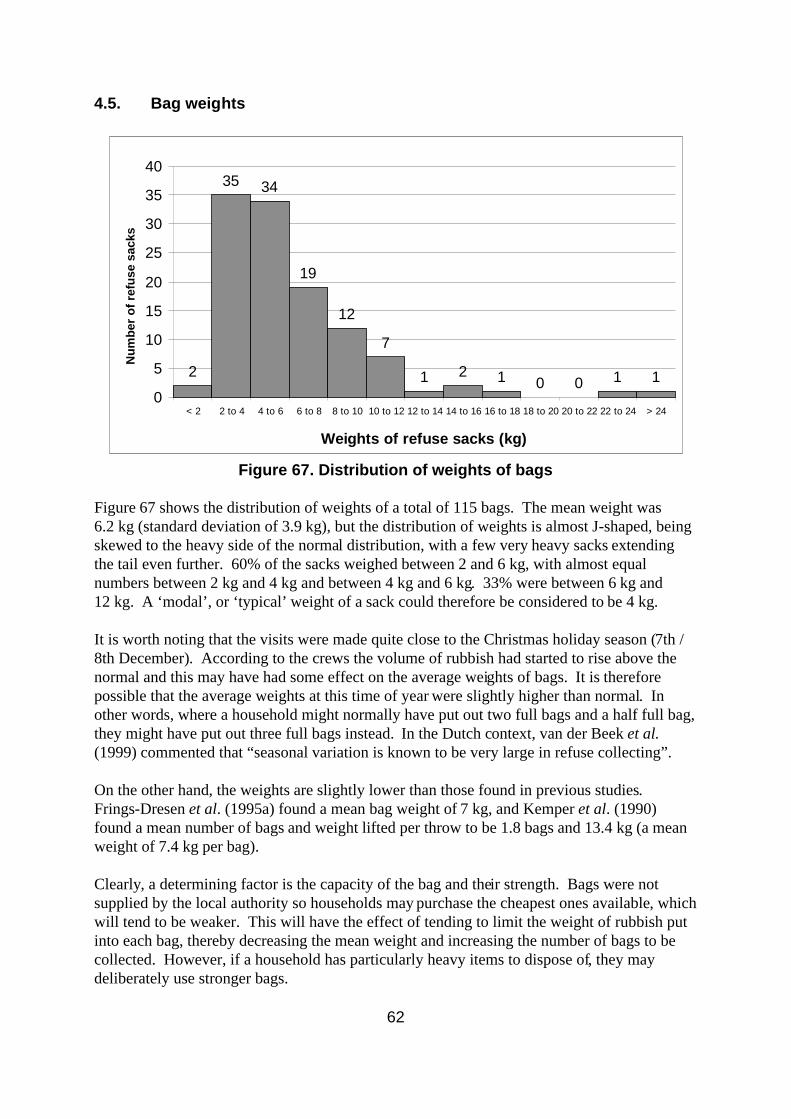
4.5. Bag weights
2
35 34
19
12
7
1 2 1 0 0 1 10
5
10
15
20
25
30
35
40
< 2 2 to 4 4 to 6 6 to 8 8 to 10 10 to 12 12 to 14 14 to 16 16 to 18 18 to 20 20 to 22 22 to 24 > 24
Weights of refuse sacks (kg)
Num
ber o
f ref
use
sack
s
Figure 67. Distribution of weights of bags
Figure 67 shows the distribution of weights of a total of 115 bags. The mean weight was6.2 kg (standard deviation of 3.9 kg), but the distribution of weights is almost J-shaped, beingskewed to the heavy side of the normal distribution, with a few very heavy sacks extendingthe tail even further. 60% of the sacks weighed between 2 and 6 kg, with almost equalnumbers between 2 kg and 4 kg and between 4 kg and 6 kg. 33% were between 6 kg and12 kg. A ‘modal’, or ‘typical’ weight of a sack could therefore be considered to be 4 kg.
It is worth noting that the visits were made quite close to the Christmas holiday season (7th /8th December). According to the crews the volume of rubbish had started to rise above thenormal and this may have had some effect on the average weights of bags. It is thereforepossible that the average weights at this time of year were slightly higher than normal. Inother words, where a household might normally have put out two full bags and a half full bag,they might have put out three full bags instead. In the Dutch context, van der Beek et al.(1999) commented that “seasonal variation is known to be very large in refuse collecting”.
On the other hand, the weights are slightly lower than those found in previous studies.Frings-Dresen et al. (1995a) found a mean bag weight of 7 kg, and Kemper et al. (1990)found a mean number of bags and weight lifted per throw to be 1.8 bags and 13.4 kg (a meanweight of 7.4 kg per bag).
Clearly, a determining factor is the capacity of the bag and their strength. Bags were notsupplied by the local authority so households may purchase the cheapest ones available, whichwill tend to be weaker. This will have the effect of tending to limit the weight of rubbish putinto each bag, thereby decreasing the mean weight and increasing the number of bags to becollected. However, if a household has particularly heavy items to dispose of, they maydeliberately use stronger bags.
62

5. DISCUSSION
5.1. MSD risk factors
The hazards that refuse collectors are exposed to vary depending on the type of collectionround they are working on. The bags rounds present musculoskeletal risks associated withstooping to pick up bags, lifting and throwing bags and occasional lifting of bins to aboveshoulder height. Also much of the handling was asymmetric, with one-handed lifting andcarrying, and trunk twisting and many of the loads themselves were asymmetric and withrelatively poor grips. The trade round and the green wheelie bin round present risksassociated with pushing and pulling bins up and down kerbs, steps and across thresholds, andexerting forces in awkward postures to manoeuvre bins. While the use of wheelie binsdramatically reduces the scale of manual handling, inevitably some bags are found on theserounds, so the associated risks are not completely removed. It also significantly reduces therisks from hazardous waste since it is enclosed in a solid bin rather than a flimsy plastic bag.
Tables 26 and 27 list the risk factors that need to be considered in a manual handling riskassessment under the 1992 Manual Handling Operations Regulations for wheelie bins andbags, respectively. In an approach based on the checklist of Appendix 1 of L23, the HSEguidance on the 1992 MHOR, (HSE, 1998), these tables indicate whether a risk factor ispresent, and if so, its frequency, its possible harmful consequences, and an estimate of theease of eliminating the risk factor. Finally, possible solutions are listed, along with factorsaffecting the ease of implementing these possible solutions.
5.2. Bag handling
5.2.1. Weights of bags
The filter in Appendix 1 of L23 (HSE, 1998) states that, for lifts at approximately knee height,which is typical for lifting and carrying black bags, a detailed risk assessment should becarried out if a male worker has to lift, infrequently, more than 10 kg (load between elbow andarm’s length away) or 20 kg (load beyond elbow distance away). However, the lift rate on thebags round was over 6 lifts per minute. The guidance suggests that the filter values should becut by 50% at this rate, which would give values of 5 and 10 kg per lift.
Most bags were lifted close to the feet so that the mean (6.2 kg) and modal bag weights(4.0 kg) came within this range. However, because a number of the bags exceed this weightrange and because, in many cases, more than one bag is lifted at once in each hand, the actualweights handled are likely to be significantly in excess of the filter values. Thus, lifting two4 kg bags in each hand would give a total load of 16 kg. Where bags have to be lifted, ratherthan thrown, into the truck, they have to be lifted to head height or above. The guidelinevalue for infrequent lifts to head height are 10 kg and 5 kg for ‘near’ and ‘far’ lifts. Reducingthese figures by 50% for the effect of frequency gives figures of 5 kg and 2.5 kg. Therefore, itcan be concluded that such lifting is hazardous to at least some of the male workingpopulation.
63

Table 26. Risk assessment for handling of bags
Gloves worn only some oftime
Check suitability of PPE4Injuries due to non-use ofPPEYes
Other factors:Is movement or posture hindered by clothing orpersonal protective equipment?
Safe system of work andsharps handling policy
2Sharps / trapping accidentsX� call for special information/training?Exclusively male workforceX� hazard those who are pregnant?
Health screening /inoculations
5Infection / MSDs� hazard those with a health problem?Healthy worker effectFitness testing4FatigueX� require unusual strength / height?
HighMedMinorNoIndividual capability - does the job:Not practical in winterOnly collect in daylight5VariousX� poor lighting conditions?
5Harder to handle large loadsX� strong air movements?Not practicalOnly collect in fine weather5FatigueX� hot/cold/humid conditions?
5Slips, trips and fallsX� variations in levels?CostRepave poor areas4Slips & tripsX� poor floors?Cost, life span of vehicleNew truck design4MSDsX� constraints on posture?
The working environment - are there:Acceptability to usersGloves & Kevlar trousers3Contact injuries; infectionX� intrinsically harmful (e.g., sharp/hot)?
Educate public4Loss of controlX� unstable/unpredictable?4Loss of grip, MSDsX� difficult to grasp?
More liftsSmaller bags5MSDsX� bulky/unwieldy?
Weaker bags more likely tosplit
Educate public; weakerbags
4MSDsX� heavy?The loads - are they:
“Wheelie bins3FatigueX� a work rate imposed by a process?X� insufficient rest or recovery?
“Wheelie bins3FatigueX� repetitive handling?“Wheelie bins3Slips and trips, MSDsX� unpredictable movement of loads?
X� strenuous pushing or pulling?“Wheelie bins3FatigueX� long carrying distances?“Wheelie bins3WRULDX� large vertical movement?“Wheelie bins3WRULDX� reaching upwards?“Wheelie bins5Low back painX� stooping?“Wheelie bins5Low back painX� twisting?
Terrain, public antipathyWheelie bins5Low back painX� holding loads away from the trunk?The tasks - do they involve:
RegularOccasional
Rare
Factors affecting thesuggested solution(s)?
Possible solutions?Ease of eliminat-ing the risk? (1=
very easy; 5= veryhard)
Possible harmful conse-quences of the risk?
YesHow frequently?
NoFactors listed in Schedule 1 of the MHOR 1992
64
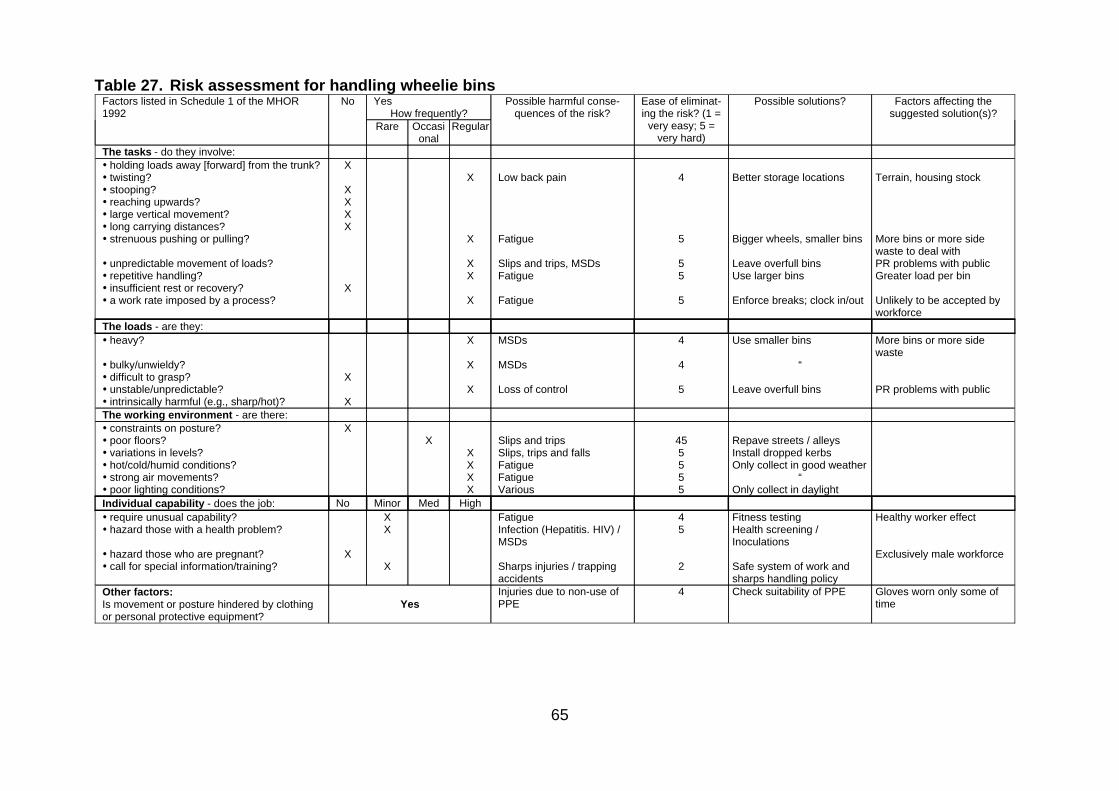
Table 27. Risk assessment for handling wheelie bins
Gloves worn only some oftime
Check suitability of PPE4Injuries due to non-use ofPPEYes
Other factors:Is movement or posture hindered by clothingor personal protective equipment?
Safe system of work andsharps handling policy
2Sharps injuries / trappingaccidents
X� call for special information/training?Exclusively male workforceX� hazard those who are pregnant?
Health screening /Inoculations
5Infection (Hepatitis. HIV) /MSDs
X� hazard those with a health problem?Healthy worker effectFitness testing4FatigueX� require unusual capability?
HighMedMinorNoIndividual capability - does the job:Only collect in daylight5VariousX� poor lighting conditions?
“5FatigueX� strong air movements?Only collect in good weather5FatigueX� hot/cold/humid conditions?Install dropped kerbs5Slips, trips and fallsX� variations in levels?Repave streets / alleys45Slips and tripsX� poor floors?
X� constraints on posture?The working environment - are there:
X� intrinsically harmful (e.g., sharp/hot)?PR problems with publicLeave overfull bins5Loss of controlX� unstable/unpredictable?
X� difficult to grasp?“4MSDsX� bulky/unwieldy?
More bins or more sidewaste
Use smaller bins4MSDsX� heavy?The loads - are they:
Unlikely to be accepted byworkforce
Enforce breaks; clock in/out5FatigueX� a work rate imposed by a process?X� insufficient rest or recovery?
Greater load per binUse larger bins5FatigueX� repetitive handling?PR problems with publicLeave overfull bins5Slips and trips, MSDsX� unpredictable movement of loads?
More bins or more sidewaste to deal with
Bigger wheels, smaller bins5FatigueX� strenuous pushing or pulling?X� long carrying distances?X� large vertical movement?X� reaching upwards?X� stooping?
Terrain, housing stockBetter storage locations 4Low back painX� twisting?X� holding loads away [forward] from the trunk?
The tasks - do they involve:
RegularOccasional
Rare
Factors affecting thesuggested solution(s)?
Possible solutions?Ease of eliminat-ing the risk? (1 =
very easy; 5 =very hard)
Possible harmful conse-quences of the risk?
YesHow frequently?
NoFactors listed in Schedule 1 of the MHOR1992
65

Mital et al. (1997) list maximum recommended weights for a range of manual handling tasks.For lifting from the ground to a height of 1.83 m (i.e., to approximately head height) they givevalues of 9 kg and 6 kg as acceptable to 90% of the male working population at rates of fourand eight lifts per minute respectively. These figures relate to two-handed lifts of a 34 cmdeep box with handles. While a one-handed lift and throw of a bag is different to atwo-handed lift of a box, the mean measured bag weight of 6.2 kg and the modal value of 4 kgsuggest that the actual lifting of the bags at 6 - 7 lifts per minute to the back of the truck iswithin the capability of almost all male workers. Less than 10% of sacks weighted more than12 kg. Mital et al. (1997) also quote a figure of 26 kg as acceptable to 50% of the malepopulation at a frequency of one lift per minute. This suggests that the heaviest bagsencountered can be loaded into the refuse lorry by only half of the male population andtherefore constitute a significant hazard. When confronted by such bags, weaker refusecollectors may find it necessary to obtain help from other crew members.
The nature of the refuse collection task means that the operators do not know how heavy anitem will be until they have begun to lift it, though visual clues, such as the fullness of thebag, may give them some indication. The bag weight data indicates that less than one intwenty bags weighed over 14 kg, but occasionally bags may weigh as much as 22 or 24 kg.Because the normal practice is to grasp the bag at the top where it is tied the refuse collectorcan get a feel for the weight of the bag by pulling at it and if need be release it again if it is tooheavy.
5.2.2. Handling of round dustbins
The traditional dustbins were found only occasionally (such as towards the end of bags round)and had a mean weight of approximately 16 kg. These bins had to be lifted over shoulderheight often with one or both arms extended in order to tip their contents into the refuse truck.Even held close to the trunk this weight exceeds the 10 kg filter figure for infrequent lifts.The combination of awkward lifting and reaching postures, lack of suitable handholds andpotentially high weights of the bins and their contents make this a potentially high risk task forinjury to the lower back and possibly the shoulders.
5.2.3. Stooping while picking up bags
It was clear from the video that the normal practice is for workers to stoop while picking upbags (Figures 29-31). This is well known to be the preferred method of handling, especiallywhen carrying out frequent or repetitive handling. The long-standing advocacy by manualhandling trainers, particularly those of the kinetic handling school, of bending the knees notthe back, has had little impact upon real-world manual handling. This is partly due tostooping being more energy efficient than squatting and partly due to it only being practicalfor two-handed lifting of compact loads. While involving the strong leg muscles is desirable,especially when handling heavy loads, such a handling technique is only appropriate for asmall proportion of the loads observed on the bags round. Also, training has been shown notto be an effective method of reducing manual handling injuries. Generally, because the bagsare large, relatively light (60% under 6 kg) and several can be grasped and lifted with onehand, it is not surprising that the refuse collectors stoop to pick them up, as this is almostcertainly the most efficient method of handling them. Thus to handle two 4 kg bags in each
66

hand gives a total load of 16 kg. To handle three 2 kg bags in each hand would give a totalload of only 12 kg.
5.2.4. Trunk twisting and raising the arms above shoulder height
When throwing bags into the refuse truck, the refuse collectors were often seen to twist theirtrunks (Figure 68). However, such actions were always dynamic and of short durationoccupying 2.1% and 5.4% of the time coded from the two film segments of the bags round.Such upright twisting is of lower risk than when combined with bending or stooping or whenexerting large forces in a static posture or when carrying it out for a much greater proportionof the time.
The video shows the refuse collectors raising their arms over shoulder height when throwingbags into the truck (Figure 68). The postural analysis showed that they spent between 6 and12% of the coded time with one or both hands above the shoulders. However, becauseangular momentum can be imparted to the bags throughout the swing phase, the forces beingexerted by the time the arms have reached this height will be less than would be required tolift the bag to the same height. If there is not enough space to swing the bags cleanly (i.e., tostart exerting the swinging force when the bags are being held at knuckle height) then the fullweight would have to be lifted over the lip at the back of the truck.
Further exploration of the issue highlighted by de Looze et al. (1995), of the high forcesassociated with acceleration of bags just before release in a throw, would be helpful since thethrowing of bags was carried out with the trunk upright. It is surprising that they obtainedlarger truncal compressive estimates for this aspect than for the lifting of bags from theground which is likely to have been carried out with the trunk in at least partial flexion.
5.2.5. Throw in height of the truck (‘rave height’)
Figure 68 shows the rave bar at the back of the truck at two heights. On the left, it is abovethe top of the control panel on the side of the truck. On the right, it is a similar distance belowthe top of the panel. Lifting the bar increases the height that bags must be thrown over andbins lifted over which increases the risk to the refuse collectors. They expressed a strongpreference for having it at the lower height but said they had been told not to lower it bymanagement for safety reasons. They were unable to say what these reasons were.
At a later date the local authority provided measurements of the rave rail heights in the up anddown positions on a selection of their vehicles. The heights ranged from 1.245 m to 1.345 min the down position and from 1.42 m to 1.575 m in the up position. On the type of vehiclefollowed on the bags round the down height was 1.345 m and the up height was 1.5 m, givinga difference of 0.155 m.
The preference of the workers for a marginally lower throw-in height was strong. de Looze etal. (1995) were unable to demonstrate a difference in spinal loading due to two significantlydifferent throw in heights (0.68 and 1.25 m) but did demonstrate a difference in shoulderloading. This finding is somewhat surprising and begs the question of where the additionalshoulder moment was going to at the higher height if it was not being transmitted to the back.Analysis of the throwing technique, particularly the height and direction of release for the two
67

heights might clarify this issue. It may, therefore, reflect a limitation of their model. In suchcircumstances, the subjective preferences of the workers performing a job are often a muchbetter guide to the stressfulness of a manual handling task than even a sophisticatedbiomechanical model, which, by its very nature, is a significant simplification of a complexmechanical system.
Figure 68. Variations in height of the lip at the back of the refuse truck
5.3. Handling of wheelie bins
5.3.1. Manoeuvring bins in restricted spaces
Manoeuvring bins through doorways and in alleys, around obstructions and up and downflights of stairs can lead to refuse collectors twisting their backs and adopting awkwardpostures whilst exerting forces to move the bins. The problems can be overcome to someextent by looking for ways to make moving the bins less awkward by opening both doors ifdouble doors are available on refuse stores and moving obstructions (e.g., bags or smallerbins) before attempting to move the bins. Team work has a part to play by ensuring thatindividuals help each other when attempting to move a bin in a particularly awkward location.
5.3.2. Kerbs, steps and obstructions
Lifting or pulling bins up kerbs was observed on a number of occasions during the trade roundand green wheelie bin rounds. The literature review found that spinal compression reachedpeaks when pulling bins up kerbs and were particularly high for the larger 1100 litre bins.
These bins were only moved across kerbs, not up and down steps. Typically, Eurobins wouldbe pulled or pushed down kerbs when full and pulled back up the kerbs after they had beenemptied. The action of pulling up kerbs, although infrequent, has been found to cause spinalcompression forces above the NIOSH Action Limit. The refuse collectors that we observedwere aware that they often needed to use two people to move them. They also made efforts to
68

manoeuvre the bins across dropped kerbs and to avoid pulling them up kerbs, thus reducingspinal compression as much as possible.
The 360 litre wheelie bins were typically handled by one refuse collector as shown in Figures53 to 55. There is not a great deal in the literature about the weight of these, but a mean filledweight of 65 to 70 kg was estimated from the weight of a 110 litre bin of approximately 22 kgfound by Jäger et al. (1984). They also found that the horizontal push-pull forces for binswere approximately 13% of bin weight. This provides an estimated push-pull force of around9 kg (90 N) for the 360 litre bins. It is not clear whether this estimation is a starting / stoppingforce or a sustained push / pull load. If it is the starting / stopping force, it falls well withinthe 25 kg (250 N) guideline figure in L23 (HSE, 1998). If it is, the sustained movement forcealso falls within the 10 kg (100 N) guideline. However, as Figures 53 to 55 also show, thesebins are frequently handled down slopes and steps. Supporting these bins down steps or kerbsor even pulling them across obstacles could increase the push-pull force considerably andshould therefore be avoided wherever reasonably practicable. If it is found that a largenumber of these bins have to be moved down steps or across kerbs, then steps should be takento reduce this number as far as possible.
5.4. PPE and additional health risks
Sharp objects such as glass and metal in refuse, particularly in bags, can lead to cuts to thelegs and arms and hands. For this reason, the refuse collectors are issued with high visibilitytrousers and jackets made with Kevlar to provide protection against this hazard. Whileprotective trousers and jackets will be put on before the start of the shift, they need to becomfortable enough to be worn in all weather conditions that are encountered during the shift.Thus, particularly in summer, if the workers are becoming overheated due to exertion they arelikely to remove outer layers of clothing, particularly jackets. This will then remove thesharps protection and expose them to the hazard. Therefore, the workers should beencouraged to remove layers of clothing below the jackets and then to put the jackets back on.Also, such protective ensembles should be designed to remove perspiration from the skin.
They are also issued with gloves to protect the hands. These were worn when thoughtnecessary, but often the workers chose to leave them in the vehicle cab. Since these can beput on and off with ease, they are only likely to be worn when the individual perceives a directneed to protect his hands. Thick or stiff gloves which making gripping bags more difficult arelikely to be worn less than is ideal.
Related to the use of PPE against sharps, there appears to be a significant drugs problem in thecity and crews were very aware of locations where they were likely to find discarded needlesor bags containing discarded needles. It was apparent that the risk of blood-borne diseasesuch as Hepatitis or HIV/Aids was of concern to them.
5.5. Physical fitness
The heart rate data that were recorded give an indication of how physically demanding therefuse collectors’ work load is. Table 28 provides a summary of the data in Figures 62 to 66.
69

Table 28. Summary of heart rate data
16.5 (14, 19)101 (101, 101)Trade bins and sacks2095 (94, 96)Green wheelie bins20.5 (21, 20)106.5 (109, 104)Bags
Overall mean working pulse(and individual values)
Overall mean heart rate (andindividual values)
Round type
Astrand and Rodahl (1986) classify workload leading to mean heart rates between 90 and 110bpm as ‘moderate work’. This can be considered an acceptable level and is the category intowhich all the recorded heart rates fell. Similarly, the work pulses (the mean increase in heartrate when working) of around 20 bpm are not considered excessive. Action would need to betake if these were greater than 40 bpm, i.e., twice the current values.
The data shows a trend towards the bags round leading to higher heart rates than the wheeledbin rounds. We do not have enough data to say whether this is a significant difference and thelevels are still within the acceptable ‘moderate work’ category. However, this is an indicationthat a move towards replacing bags and small bins with wheelie bins would help to reduce therefuse collectors overall workload further.
6. MANUAL HANDLING RISK CONTROL METHODS
6.1. Changes to methods of refuse collection
The literature review showed from a number of perspectives that, wherever practicable, bagsshould be replaced with wheelie bins. One of the main reasons behind this is the highermetabolic demands of picking up, carrying and throwing bags compared to pushing andpulling bins. Heart rates, work loads and energy consumption were all found to be higherwhen collecting bags compared to collecting wheelie bins. Postures such as stooping andholding bags away from the body are additional reasons why, ideally, bags should be replacedby wheelie bins. The mean heart rate of the two operators collecting bags was 106 to 107bpm whereas the mean heart rate for the green wheelie bin round and the trade round were 95and 101 bpm respectively. Although we did not collect sufficient data to determine thesignificance of these differences, they show a trend that reflects the view in the literature thatbag collection is the more physically demanding of the different types of refuse collection.
The round dustbins, although only handled occasionally in the area visited, are awkward tohandle because of their size and shape. Also, the handles may not be well designed, therebymaking the lifting and tipping of them more difficult, with potentially awkward wrist and armpostures. Emptying them into the lorry involves carrying then lifting a significant weight tohead height or above and controlling the motion of the bin so that the refuse falls out but thebin doesn’t fall into the crusher. The introduction of black bags was intended to remove theneed for handling them. The move from the very old steel bins to aluminium or plastic binshas significantly reduced the weights of the bins in circumstances where they do still need tobe handled. It is likely that many householders will continue to use them as a storagecontainer to hold the black bags, particularly since this is tidier than loose bags and preventsanimals damaging the bags and spreading their contents when scavenging for food. In suchcircumstances it is simple for the refuse collector to remove the lid and lift the bag out of thebin, then replacing the lid. Handling of the whole bin is likely to occur only if the
70

householder has filled it with refuse but neglected to use plastic sacks. Because of thedifficulties of handling and the greater weights, handling them represents a greater risk thanthrowing bags. Therefore, they should be removed from circulation as soon as possible andrefuse collected in bags only, or the bags and small bins should be replaced with standard 240litre wheelie bins.
It is likely that the use of such bins can never be completely eliminated but the manualemptying of them should only occur in exceptional circumstances. Therefore, a number ofapproaches could be adopted when they are found
1. Leave the bin full with a sticker attached informing the householder that refuse mustbe put into black bags before it will be collected.
2. Empty the bin but leave a leaflet or sticker asking the householder to use plastic bags.
3. Provide council officers with a list of persistent offenders so that letters can bewritten to them to ask them to use plastic sacks.
4. Empty the contents of the bin into a sack.
5. Manually handle the bin either singly, or for particularly heavy ones, in a team of twopeople.
The approach adopted will depend on the council. Options 1 to 3 above would require activemanagement and authority wide implementation with strong management support for workersdealing with irate members of the public whose refuse had not been collected. Option 4would require the provision of sacks for the workers to use. It would be easiest to implementin an area where refuse sacks were supplied anyway as part of the collection service.However, such a provision of sacks would tend to eliminate the problem since householderswould not have the problem of providing sacks. Option 5 is the most likely to occur in theshort term, especially since refuse collectors are likely to see themselves as strong individualswho should be able to handle the occasional dustbin. Moreover, the processes ofself-selection into the job and attrition of the weaker individuals from the job will almostcertainly lead to a healthy worker, survivor, effect.
However, if these bins continue to be used there are some ways of reducing the risks theypresent to collectors by using particular lifting techniques. One method would be to lift thebin onto the first available ledge on the back of the truck. The refuse collector could then leanthe bin into the truck so that the top of the bin rests on the ‘lip’ of the main refuse space. Hecould then take hold of the base of the bin (which would be around waist height) and pivot itupwards with the top of the bin still resting on the main ‘lip’. This would empty the binwithout the need for the lifting of the full weight above shoulder height. It would also reducethe amount of twisting while lifting because the refuse collectors could stand directly behindthe bin when lifting the base to tip out the contents.
71

6.2. Changes to the design of wheelie bins
Changes could be made to the wheels of the bins in order to reduce the strain of pullingwheeled bins over small obstacles and up kerbs. Given that there may still be cases where thebins need to be pulled up kerbs the wheels should ideally have a radius slightly greater thanthe (mean) height of a large kerb. This would allow them to be rolled up kerbs more easily byeliminating the initial vertical lifting element of the task. We did not take measurements ofthe wheels on the bins, but from the photographs there does appear to be potential forincreasing the wheel diameter. Manufacturers would need to investigate appropriatedimensions during the design process.
Use of lightweight materials could be investigated by bin manufacturers. Given that the binsmay sometimes need to be pulled up slopes, steps, kerbs and over obstructions, any reductionin basic bin weight would be of benefit to the refuse collectors. Manufacturers should beencouraged to look at ways of using new materials whilst maintaining the bins’ current robustproperties.
6.3. Work environment changes (lift height, kerbs, steps, etc.)
6.3.1. Lowering the rave rail on the refuse truck
The height of the rave rail at the rear of the truck determines how high bags must be thrown orlifted and how high the round dustbins must be lifted. This bar is set to the high position ifwheelie bins are being collected. However, the current official practice is to leave it up, for‘safety reasons’, even when only bags and small bins are being collected. We were not toldthe exact nature of this safety hazard and therefore can not make any judgements on whether itoutweighs the increased manual handling risks of keeping the bar high. However, on the basisof manual handling alone, the rail should be dropped as low as possible when bags andnon-wheelie bins are being collected. This would reduce the overall height that the refusemust be lifted to and would reduce the overall workload of the refuse collectors.
The other alternative would be to have lorries without the lifting gear on the bags rounds. Inthe city studied the lorries were allocated to specific rounds so this would be possible, eventhough all had the lifting gear fitted. This system has the advantage that if necessary any truckcan be used on any other round, and if occasional wheelie bins are found on a bags round,then they can be dealt with mechanically. If necessary, because lifting mechanisms are boltedto the rear of the truck, typically with six bolts, it would be possible to remove the lifting gearin preparation for a bags round on any particular day.
6.3.2. Physical environment changes
As already discussed, wheeled bins should be transported across dropped kerbs whereverpossible. The council should be encouraged to investigate where it would be useful to dropkerbs. Ideally, the refuse collectors should be involved in schemes to identify problem areasand recommend improvements. Improvements may not just involve dropping kerbs, but mayalso include provision of ramps to replace steps, resurfacing of alleys and pavements andremoval of unnecessary obstructions.
72

6.3.3. Resident / proprietor involvement
In a number of cases we observed that refuse bags and wheelie bins were located somedistance from where the refuse truck could be parked. This increases the distance that refusemust be carried, pushed or pulled, and potentially increases the number of hazardsencountered when taking the refuse to the truck (steps, potholes, ridges, threshold boundaries,kerbs, etc.). Whilst in some cases this could not be avoided (wheelie bins in dedicated storageareas) there were other situations where the bins or bags or loose refuse were at the back ofshops and buildings or down alleyways. In these situations it would be helpful if shopkeepersor trade proprietors or residents, brought their refuse to a more accessible location on the daythat the collection round is made.
As with the issue of physical environment alterations, it would be good to involve the refusecollectors in a scheme of this kind. They will be able to identify problem locations andperhaps suggest ways of improving access to the refuse and bins. The action taken could be ablanket request to the relevant people highlighting the problems with refuse in places that arehard to access and ways that they could help. Alternatively, it may just be that particularpremises / proprietors and owners are contacted with specific requests to help in whateverways they feasibly can.
73

7. RECOMMENDATIONS
1. Wherever possible, refuse collection should be carried out using wheelie bins ofappropriate sizes rather than bags or small dustbins.
2. As Government policy is to increase the amount of waste recycled, partly through thetaxation of landfill, schemes that encourage householders to separate recyclablewaste will become more common. Where recycling collections are made by localauthorities or their contractors, separate wheelie bins should be provided whereverpossible.
3. The schedules of recycling / no-recycling collections should be matched to therelative volumes of recyclable and non-recyclable material to keep the volumescollected approximately constant.
4. Where use of wheelie bins is impractical, collection of bags is likely to continueunless bulk collection facilities can be implemented. In these circumstancesrecycling should be encouraged by the provision of green bins and bags.
5. Old-style dustbins should never be emptied manually into refuse vehicles. Wherehouseholders still use them they should be encouraged to line them with black bagsbefore putting refuse into them.
6. Eurobins should be:
a. Handled by two people whenever possible;
b. Transported across dropped kerbs wherever possible and particularly when beingreturned after emptying, which is when most of the pulling back up kerbs wouldusually occur.
7. When moving any size of bin the refuse collectors should:
a. Ensure there is sufficient space to manoeuvre the bin by moving surroundingobstacles, opening doors, etc.
b. Try to avoid pushing or pulling the bin across obstacles such as steps and kerbs.
c. Seek assistance when having trouble moving a bin - particularly if moving it upor down a slope or kerb or step.
8. Manufacturers should be encouraged to consider the following changes / aspects ofthe bins:
a. Increasing wheel diameter;
b. Use of lightweight materials - especially in the larger 360 and 1100 litreEurobins.
74

9. Where possible, lorries without lifting gear and with a low rave height should beprovided for rounds dealing solely with bags. Where the same vehicles are used fordifferent rounds, consideration should be given to demounting the lifting gear thebags-only rounds.
10. Where lifting gear is fitted, the rave bar should be lowered when not collectingwheelie bins. This recommendation should only be ignored if specific safety risksthat outweigh the manual handling risks of keeping the bar up can be clearlydemonstrated.
11. The refuse collectors should be involved in a scheme with the relevant localauthorities to identify areas where improvements could be made to their workenvironment. This would consider where kerbs should be dropped, ramps installed,alleys and pavements resurfaced and rubble or building waste cleared.
12. Refuse collectors and local residents / trade proprietors should all be involved inschemes to reduce the refuse collectors’ workload. The refuse collectors couldidentify the premises and types of problems they face, e.g., fetching bins from thebacks of shops, etc. Suggestions could then be made to residents / proprietors abouthow they can help.
13. Refuse collectors should be provided with effective PPE for their hands and legs.This would not only help reduce the risk of lacerations, infections and disease but itmay also enable refuse collectors to grip, hold and carry refuse in optimal ways, i.e.,held in a balanced way and not held so far away from the legs.
.
75

8. BIBLIOGRAPHY
Astrand,P.O and Rodahl,K. (1986).Textbook of Work Physiology: Physiological Bases of Exercise.(New York: McGraw-Hill Book Company), Third Edition.
Boldt,A., Essmat,M., Frosch,A., Heinze,W., Pruszkowski,V., Richter,H. and Vogler,M.(1990)Bericht über die arbeitswissenschaftliche und arbeitsmedizinische Untersuchungdeer Belastungs-und Beanspruchungssituation deer bei der Hausmüllabfuhr desLandesbetriebes Hamburger Stadtreinigung beschäftigten Müllwerker, Hamburg:Landesbetrieb Hamburger Stadtreinigung, pp. 1-125 (in German).
Carey,E.J. and Gallwey,T.J. (1998).The use of video techniques to analyse postural stress. In: Kumar,S. (Ed.) Advancesin Occupational Ergonomics and Safety(Amsterdam: IOS Press), pp. 198-201.
de Looze,M.P., Stassen,A.R., Markslag,A.M., Borst,M.J., Wooning,M.M. andToussaint,H.M. (1995).Mechanical loading on the low back in three methods of refuse collecting.Ergonomics, 38, (10), 1993-2006.
Donders,N.C.G.M. (1996).Variantiebronnen in blootstelling aan handmatig duwen en trekken. Coronel Institutefor Occupational and Environmental Health, Academic Medical Centre / University ofAmsterdam, Amsterdam (in Dutch).
Friberg,M. and Isaksson,A. (1974)Renhållningspersonalens arbetsmiljö. Del 4. Kartläggande studier av fysiskabelastningsfaktorer och ergonomisk utformning. ASF-projekt 74/253, K-Konsult,Ingenjöere och Arkitekter, pp. 1-45 (in Swedish).
Frings-Dresen,M.H.W., Kemper,H.C.G., Stassen,A.R.A., Crolla,I.A.F.M. andMarkslag,A.M.T. (1995a).The daily work load of refuse collectors working with three different collectingmethods : a field study.Ergonomics, 38, (10), 2045-2055.
Frings-Dresen,M.H.W., Kemper,H.C.G., Stassen,A.R.A., Markslag,A.M.T., deLooze,M.P. and Toussaint,H.M. (1995b).Guidelines for energetic load in three methods of refuse collecting.Ergonomics, 38, (10), 2056-2064.
Hansson,J.E. and Klusell,L. (1977)Ergonomiska spesialstudier av kärring och bäring av sopor. Undersökningsrapport1977:9, Arbetarskyddsstyrelsen, Sweden pp. 5-46 (in Swedish).
Health And Safety Executive (1998).Manual Handling: Manual Handling Operations Regulations 1992. Guidance onRegulations.(Sudbury, Suffolk: HSE Books), Second Edition
76
Hoozemans,M.J., Frings-Dresen,M.H., van der Beek,A.J. and Donders,N.C.G.M.(1996)Fysieke belasting bij het gebruik van SULO mini-containers met verminderde inhoud.Coronel Institute for Occupational and Environmental Health, Academic MedicalCentre / University of Amsterdam, Amsterdam (in Dutch).
Jäger,M., Luttmann,A. and Laurig,W. (1984).The load on the spine during the transport of dustbins.Applied Ergonomics, 15, (2), 91-98.
Jäger,M., Jordan,C., Luttmann,A. and Laurig,W. (2000).Evaluation and assessment of lumbar load during total shifts for occupational manualmaterials handling jobs within the Dortmund Lumbar Load Study - DOLLY.International Journal of Industrial Ergonomics, 25, (6), 553-571.
Karhu,O., Kansi,P. and Kuorinka,I. (1977).Correcting working postures in industry: A practical method for analysis.Applied Ergonomics, 8, (4), 199-201.
Karhu,O., Harkonen,R., Sorvali,P. and Vepsalainen,P. (1981).Observing working postures in industry: Examples of OWAS application.Applied Ergonomics, 12, (1), 13-17.
Kemper,H.C.G., Van Aalst,R., Leegwater,A., Maas,S. and Knibbe,J.J. (1990).The physical and physiological workload of refuse collectors.Ergonomics, 33, (12), 1471-1486.
Klimmer, Von F., Kylian,H. Rutenfranz,J. and Grund-Eckardt,R. (1982).Belastungs-und Beanspruchungsanalyse verschiedener Tätigkeiten bei tierMüllabfuhr.Zeitschrift fur Arbeitswissenscaft 36 (NF): 90-94 (in German).
Kuijer,P.P., Visser,B. and Kemper,H.C. (1999).Job rotation as a factor in reducing physical workload at a refuse collectingdepartment.Ergonomics, 42, (9), 1167-1178.
Kuijer,P., Frings-Dresen,M., de Looze,M., Visser,B. and van der Beek,A. (2000).Work situation and physical workload of refuse collectors in three different timeperiods.International Journal of Industrial Ergonomics, 26, (5), 509-519.
Laursen,B. and Schibye,B. (2002).The effect of different surfaces on biomechanical loading of shoulder and lumbarspine during pushing and pulling of two-wheeled containers.Applied Ergonomics, 32, (2), 167-174.
Lund,T., Iversen,L. and Poulsen,K.B. (2001).Work environment factors, health, lifestyle and marital status as predictors of jobchange and early retirement in physically heavy occupations.American Journal of Industrial Medicine, 40, 161-169.
77

Luttmann,A., Laurig,W. and Jäger,M. (1992).Logistical and ergonomic transportation capacity for refuse collection workers: Awork physiology field study.Ergonomics, 35, (9), 1045-1061.
Markslag,A.M.T., Stassen,A., de Looze,M.P., Kemper,H.C.G., Frings-Dresen,M. andToussaint,H.M. (1993).Biomechanische en energetische belasting van huisvuilbeladers. AcadenischMedisch Centrum, Amsterdam, pp. 1-40 (in Dutch).
Mital,A., Nicholson,A.S. and Ayoub,M.M. (1997)A Guide to Manual Materials Handling(London: Taylor & Francis), Second Edition.
Pedersen,M.B., Christensen,H. and Søgaard,K. (1992).Traek og skub of 2- og 4-hjulede vogne, AMI-rapport nr. 38/1992. National Instituteof Occupational Health, Denmark, pp. 1-28 (in Danish).
Poulsen,O.M., Breum,N.O., Ebbehoj,N., Hansen,A.M., Ivens,U.I., van Lelieveld,D.,Malmros,P., Matthiasen,L., Nielsen,B.H. and Nielsen,E.M. (1995).Collection of domestic waste. Review of occupational health problems and theirpossible causes.The Science of the Total Environment, 170, (1-2), 1-19.
Schibye,B., Sogaard,K., Martinsen,D. and Klausen,K. (2001a).Mechanical load on the low back and shoulders during pushing and pulling oftwo-wheeled waste containers compared with lifting and carrying of bags and bins.Clinical Biomechanics, 16, (7), 549-559.
Schibye,B., Hansen,A.F., Sogaard,K. and Christensen,H. (2001b).Aerobic power and muscle strength among young and elderly workers with andwithout physically demanding work tasks.Applied Ergonomics, 32, (5), 425-431.
Stassen,A., Crolla,I., Frings-Dresen,M. and Kemper,H.C.G. (1992)Arbeidsbelasting van huisvuilbeladers bij reinigingsdiensten. Faculteit derGeneeskunde, Vrije Universiteit, Amsterdam, pp. 1-46 (in Dutch).
van der Beek,A.J., Hoozemans,M.J.M., Frings-Dresen,M.H.W. and Burdorf,A. (1999)Assessment of exposure to pushing and pulling in epidemiological field studies: Anoverview of methods, exposure measures, and measurement strategies.International Journal of Industrial Ergonomics, 24, (4), 417-429.
Vedder,J. (1998).Identifying postural hazards with a video-based occurrence sampling method.International Journal of Industrial Ergonomics, 22, (4-5), 373-380.
78


![HSL-3 EXPANSION ANCHOR · 2020. 10. 15. · Updated: Oct-20 4 HSL-3-SH / HSL-3-SKa) Shear V Rec HSL-3 / HSL-3-B [kN] 14,3 17,8 17,8 20,1 29,3 34,6 24,5 36,9 50,8 HSL-3-G 14,3 14,9](https://img.pdfslide.us/doc/110x75/61188027c3aeb93d607a5cb7/hsl-3-expansion-anchor-2020-10-15-updated-oct-20-4-hsl-3-sh-hsl-3-ska-shear.jpg)