Embed Size (px)
Citation preview

Lao People’s Democratic Republic
Peace, Independence, Democracy, Unity, Prosperity
Manual
For
Public Investment Program (PIP)
Program Management
(Version 3.0)
Ministry of Planning and Investment
August, 2010

Preface
This manual provides the general concept and methods of Public Investment Program (PIP)
management on a “program” basis. It is designed for government personnel that have duties related
to PIP management.
Laws and Decrees prescribe the definition of PIP, and define procedures, roles and responsibilities
for agencies concerned in PIP management. However, these Laws and Decrees do not mention
deeply as to explain specific methods on how to manage PIP as a program, nor as projects. “PIP
Manual for Program Management”, along with “PIP Manual for Project Management”, aims to
provide effective PIP management methods and tools that would support the effectuation and
enforcement of laws, decrees and regulations in Lao PDR.
This manual explains the basic procedure of PIP program management. It describes the information
flow and coordination that are essential for program management between the Ministry of Planning
and Investment (MPI), central and provincial government organizations.
It also touches upon technical aspects that are required for PIP program management. However,
these aspects are carefully adjusted so that with the current level of general capacity for government
officers, they could be able to adapt up with relative ease.
In the latter half of this manual, specific program management methods and tools are introduced.
Although some procedures require new tools and systems, it was made sure that they are utilized
with minimum modification from the currently existing procedures.
Methods and tools shown in this manual were co-developed by MPI and JICA technical cooperation
“Project for Capacity Building in PIP Management (PCAP)” and its second phase “Project for
Enhancing Capacity in PIP Management (PCAP2)”, and their validation was taken place through
workshops and training sessions in some central and provincial government organizations. These
methods and tools will further evolve according to the development of capacity in organizations and
individuals.
The Revised Version 3.0 was introduced in August 2010. In addition to the original contents,
caseworks of the Project Objective Tree (POT), Chronology Chart and PIP Mapping were newly
included. These caseworks were completed thanks to the cooperation from Oudomxay, Khammuan
and Saravan Provinces, as well as the Ministry of Public Works and Transportation (MPWT).
Training sessions will be continuously commenced within the initiative of MPI, to ensure that the
principles, definitions and methods of PIP management are correctly understood and shared among
government personnel related.

Abbreviations
CompAss Comparative Assessment
DPI Provincial Department of Planning and Investment
DPSO District Planning and Statistics Office
EA Environmental Assessment
ECC Environmental Compliance Certificate
EIA Environmental Impact Assessment
EMP Environmental Management Plan
EPL Environmental Protection Law
F/S Feasibility Study
GIS Geographical Information System
GoL Government of Laos
IEE Initial Environmental Examination
JICA Japan International Cooperation Agency
MAF Ministry of Agriculture and Forestry
MEM Ministry of Energy and Mining
MIC Ministry of Industry and Commerce
MOE Ministry of Education
MOF Ministry of Finance
MOFA Ministry of Foreign Affairs
MOPH Ministry of Public Health
MPI Ministry of Planning and Investment
MPI-DIC Department of International Cooperation, MPI
MPI-DOE Department of Evaluation, MPI
MPI-DOP Department of Planning, MPI
MPWT Ministry of Public Works and Transportation
NSEDP National Socio-Economic Development Plan
ODA Official Development Assistance
PCAP Project for Capacity Building in PIP Management
PCAP2 Project for Enhancing Capacity in PIP Management
PIP Public Investment Program
PM Prime Minister
PMO Prime Minister’s Office
PSTEO Provincial Science Technology and Environment Office
PO Project Owner
POT Program Objective Tree
PWT Public Works and Transportation
SEDP Socio-Economic Development Plan
SPAS Simplified Project Assessment Sheet
SPES Simplified Project Evaluation Sheet
WREA Water Resources and Environment Administration

Manual for PIP Program Management
Main Contents
Preface
Abbreviation
Section 0 General Background of the Manual
Section I Definition of PIP as a Program
Section II Management Flow and Methods of PIP as a Program
ANNEX

Manual for PIP Program Management (version 3.0) Section 0
0-1
0. General Background of the Manual
0.1. Introduction
Manual for PIP Program Management is a guide to effective Public Investment Program (PIP)
management from a comprehensive program-level viewpoint. Contents of this manual deals with
PIP program management, as defined in Section I, a comprehensive scheme within a sector or
region, comprising of individual PIP projects and other investment schemes that share the
same development effect.
This manual is developed for government personnel that have duties of formulating and
monitoring public investment plans under their respective Socio-Economic Development Plan
(SEDP). However, all government personnel that are related to PIP in some way are
recommended to observe the contents for better understanding of the public investment plan and
its management concept.
The Public Investment Law issued in December 2009, along with related Decrees and
Regulations issued by the government are effective for respective organizations to formulate and
manage PIP. However, the statements are confined to basic functions and tasks, and do not
mention the specific duties and methods required for each organization, moreover the flow of
duties in a standard PIP management flow. As such, this Manual was developed after carefully
studying the current PIP management circumstances, and adapted the contents in accordance to its
requirements. Existing concepts, methods and tools were utilized as much as possible, along with
new features where necessary, so that personnel with current capabilities could understand its
outline without totally having to cope with new approaches.
The Manual will evolve in the future in accordance with the development of capacity by the
personnel, along with the improvement of PIP management circumstances; such as presence of
accurate data and PIP project information.
0.2. Purpose of the Manual
This manual is developed as guidance to government organizations and its personnel involved in
PIP management, aiming to create a consensus of definitions, terminologies procedure, methods
and tools used in PIP management.
The manual also has a purpose of developing capacity for government personnel related to PIP
management. It is for those who require basic knowledge for specific methods or tools within the
PIP procedure.
As its name shows, this manual focuses on management of PIP as a program. It touches upon the
requirements of managing PIP as a comprehensive and strategic program. Procedure and methods
of management for individual PIP projects are mentioned in the “Manual for PIP Project

Manual for PIP Program Management (version 3.0) Section 0
0-2
Management”. Development of two manuals “Manual for PIP Program Management” and
“Manual for PIP Project Management” are not intended to clearly separate the concept of the
two definitions. Rather, they are separated so that users can understand the importance of program
management and project management from both ends. Naturally, there are some topics that are
described in both manuals, with their expressions changed due to the objectives of each manual.
0.3. Structure of the Manual
Apart from this section where the background of the manual itself is explained, there are two
major sections in this manual. Section I explains the Definition of PIP as a Program along with
explanation of the PIP program unit. Section II explains the management flow of PIP as a
program, along with specific methods and tools that constitute a PIP program unit.
0.4. Users of the Manual
Main users of the manual are government personnel whose duties are directly related to
management of PIP as a program, namely officers in the Ministry of Planning and Investment
(MPI), Planning Departments in government organizations, and provincial Department of
Planning and Investment (DPI). These personnel take the core role in the management of PIP as a
program. Their duties function not only as a leading role in materializing development targets and
plans, but also as advisors to line ministry and sector department personnel, through provision of
guidelines to plan and implement better PIP projects.
This manual does not touch the standards or methods of the final authorization process by the
Decision Makers. However, it rather functions as a guideline so that Decision Makers may obtain
appropriate program strategies that support their decision making.
In this sense, it is requested that Decision Makers also observe this manual, and understand the
contents that facilitates their decisions.

Manual for PIP Program Management Section I
I-1
Manual for PIP Program Management
Section I Definition and Management Flow of PIP as a Program
Contents
1 Definitions .................................................................................................................................... 2
1.1 Three Major Aspects of Development Target Achievement ............................................ 2
1.2 Public Investment Program ............................................................................................... 3
1.3 Relations between NSEDP and PIP as a Program ........................................................... 5
2 PIP Program Unit ....................................................................................................................... 6
2.1 Variation of PIP Program Units ......................................................................................... 7
2.2 Concept of PIP Program Unit Management ..................................................................... 7
2.3 Three Perspectives of PIP Program Unit Management ................................................... 8

Manual for PIP Program Management Section I
I-2
Section I Definition and Management Flow of PIP as a Program
This section explains the overall concept of PIP as a Program is its management flow.
1 Definitions
The terms “Public Investment Program (PIP)” and “PIP project” are commonly used among
government personnel in Lao PDR. This chapter covers the primary definition of these key terms,
including how they relate to the achievement of national, sector, and regional development goals.
1.1 NSEDP and SEDP
The National Socio-Economic Development Plan (NSEDP) is the national agenda for development,
and outlines the government direction to achieve medium-term economic and social development
targets. The Sixth NSEDP, 5-Year Plan (2006-2010) is currently under way.
Under the NSEDP, the Socio-Economic Development Plan (SEDP) is made within each sector
ministry and region (provinces and districts) to provide its specific targets respectively.
In addition, as of August, 2010, the next NSEDP and the SEDP for 2011 to 2015 in respective sector
ministries and regions are also being finalized.
1.2 Three Major Aspects to Achieve Development Target
NSEDP and SEDP targets are achieved
through contribution of 3 major aspects.
Apart from public investment consisting of
domestic, ODA and loans, private
investment; domestic and foreign, and
achievement by society have their respective
targets and goals. NSEDP and SEDP target
are achieved only through the contribution of
each aspect, whatever sector or region it is
managed.
Public investment is defined as investment from government resources, domestic or foreign, with
the objective of development in the sector and/or region. Domestic PIP projects, ODA in forms of
grant, technical assistance and loan are main components. Provision of public infrastructure (ex.
roads, bridges, irrigation systems, public hospitals and schools, rural electrification etc.) and
technical promotion (ex. training) is generally done using public investment.
Private investment is defined as investment from private resources. Private companies, domestic and
foreign, invest with the objective of making profit, which indirectly benefits the development of
Figure 1: NSEDP/SEDP and 3 Major Aspects
NSEDPNSEDP
Provincial/Sector SEDPProvincial/Sector SEDPProvincial/Sector SEDP
Private Investment
(Domestic, Foreign)
Public Investment
(Domestic, ODA, Loan)
Achievement
by Society
NSEDPNSEDP
Provincial/Sector SEDPProvincial/Sector SEDPProvincial/Sector SEDP
Private Investment
(Domestic, Foreign)
Public Investment
(Domestic, ODA, Loan)
Achievement
by Society

Manual for PIP Program Management Section I
I-3
market economy growth. It would also contribute to development of employment, triggering
increase of income and stability of life to the people.
Achievement by society is defined as contribution of society and/or individual people. With the
nature of the target set in the NSEDP and SEDP, the peoples’ efforts for improvement in their living
standards and daily activities contribute greatly to its achievement. For example, production
activities by farmers have an important role in the development of the nation. Attendance to schools
by children or health precautions by families can also be counted as part of contribution from the
society.
Importance of Public investment for NSEDP
Amongst these 3 major aspects, it can be said that public investment plays the most important role. It
not only contributes directly to the achievement of NSEDP/SEDP targets, it also has a role of being
the “mastermind” of promoting private investment and achievements by society, through provision
of appropriate surroundings so that they could contribute in their ways. For example, construction of
access roads and public markets enable private investors for better performance, triggering further
growth of economy. Construction of schools and hospitals and training of teachers, doctors and
nurses provide the opportunity for the society to improve their conditions in education and health, all
contributing to the NSEDP/SEDP targets respectively.
1.3 Public Investment Program (PIP)
Public investment in Lao PDR is managed under the Public Investment Program (PIP). Key terms
related to “PIP” in this manual are defined as follows;
Key Terminology on PIP
< “Project” in general >
A project is an individual investment scheme that has a specific Project Purpose (i.e. completion
of infrastructure, achievement of certain output), within a certain scale of time.
Input required for the project is decided in the planning stages. Activities of a project is done within
the planned schedule, and referred to as “project implementation”.
< “Program” in general>
A program is a comprehensive scheme within one sector or region, comprising of no less than one
project and other investment means that share the same effect.
A program has a target within a certain scale of time, normally in mid-term or long-term bases. It
relates to upper strategies such as development plans and targets.
<Public investment project in general>
A public investment project is a project that composes public investment.

Manual for PIP Program Management Section I
I-4
Public investment project is a general definition. However, actually in Laos, all the public
investment projects are listed in PIP. Therefore, public investment projects in Laos practically mean
PIP project.
(about public investment, refer to the previous section 1.2)
<PIP (PIP as a program )>
PIP is a program that unifies individual public investment projects to achieve the Socio-Economic
Development Plan (NSEDP/SEDP) in Lao PDR.
PIP is often expressed with its conceptual framework, PIP Program Units.
<PIP Project>
A PIP Project is a public investment project that composes PIP.
The public investment projects are one of the three measures to achieve the NSEDP. As all the
public investment projects in Lao PDR are managed under PIP, we can call them the PIP projects.
Actually a PIP project means “a project in the PIP”.
The above mentioned two conceptual levels in PIP should be separated. In order to
distinguish “PIP” and “PIP Project” hereinafter in this manual, we call the Public
Investment Program “PIP as a program” and call a project composing PIP “PIP Project”.
<PIP Program Unit>
PIP Program Unit is a conceptual framework within PIP as a program, which comprises PIP
projects structurally organized to achieve a common target with indicators in a specific subject in
sector and/or area in region.
A PIP Program Unit often has lower levels of the PIP Program Units.
(Source: PCAP2 Project Manual)
Conceptual structure of PIP Program Unit
In this manual, on component unit of PIP as a program is described hereon as a PIP program unit. A
PIP program unit has targets that should be achieved within a certain scale of time, normally in
mid-term or long-term bases. These targets relate to superordinate strategies and plans such as the
development plans and targets. The PIP program units also carry a number of individual PIP projects.
These PIP projects are planned and monitored to ensure that the targets within the PIP program units
are achieved in the most effective and efficient way.
An individual PIP project within a PIP program unit share logical relations. PIP projects are planned
and implemented as an important means to fulfill a PIP program unit.
Although PIP as a program and individual PIP projects share the similar target of achieving

Manual for PIP Program Management Section I
I-5
Figure 2: NSEDP and PIP as a Program(1)
Figure 3: NSEDP and PIP as a Program (2)
NSEDP/SEDP, they have differences. PIP as a program is more comprehensive and carries large
goals, while PIP projects concentrate on certain investment schemes where its goal is limited. It can
also be said that while PIP projects have their own budget for implementation, PIP as a program has
a conceptual approach, hence does not have specific budget for its implementation.
1.4 Relations between NSEDP and PIP as a Program
PIP is the government’s tools to achieve the National
Socio-Economic Development Plan. It is done through
the utilization of both domestic public expenditure and
Official Development Assistance (ODA).
It is generally very difficult to determine the direct
influence of the projects in PIP to the NSEDP. Therefore, when considering the relevance of each
PIP project, it is important to examine the logical relationship with SEDP and its intermediate goals.
PIP as a program function as a public investment programming tool that translates the NSEDP,
SEDP and macroeconomic sector policies into PIP projects. PIP as a program is elaborated and
designed in consistency with the NSEDP, with PIP projects carefully selected within the priorities of
the PIP program units, and implemented with the aim of maximizing benefits using limited
resources.
PIP as a program also functions a role of
indirectly supporting the promotion of
private investment and achievements by
society, through provision of appropriate
surroundings. Many PIP projects are
planned and implemented with the
expectations to promote private investment
in a certain sector and/or region, or to
enhance the society to improve their living standards. In some cases the PIP project itself would be
planned and implemented jointly with private investors or the society. PIP as a program works as a
guideline when planning and implementing such PIP projects.
NSEDPNSEDP
Provincial/Sector SEDPProvincial/Sector SEDPProvincial/Sector SEDP
Public Investment
(Domestic, ODA, Loan)
PIP as a Program
NSEDPNSEDP
Provincial/Sector SEDPProvincial/Sector SEDPProvincial/Sector SEDP
Public Investment
(Domestic, ODA, Loan)
PIP as a Program
PIP as a Program
NSEDPNSEDP
Provincial/Sector SEDPProvincial/Sector SEDPProvincial/Sector SEDP
Private Investment
(Domestic, Foreign)
Public Investment
(Domestic, ODA, Loan)
Achievement
by Society
PIP as a Program
NSEDPNSEDP
Provincial/Sector SEDPProvincial/Sector SEDPProvincial/Sector SEDP
Private Investment
(Domestic, Foreign)
Public Investment
(Domestic, ODA, Loan)
Achievement
by Society

Manual for PIP Program Management Section I
I-6
Figure 4: PIP Program Units
2 PIP Program Unit
A PIP program unit is one unit of PIP as a
program. It consists of several PIP projects,
similar to the sector/province categorization
used in the Annual PIP budget list, but are
used to monitor PIP project outputs and
outcomes toward the development effect. PIP
program units are located under development
plans, overlooking individual PIP projects.
Development plans, PIP program units and
individual PIP projects can be sorted in a
cause and effect order. The number of PIP program units varies depending on the development plan
of the sector or region.
The benefits of formulating PIP program units are as follows;
To form action plan for development targets achievement. Development plans generally
clarifies goals and directions of the nation/sector/region, however it does not state specific plans
of action. In order to ensure the achievement of development goals within the target period,
strategic planning of action plans with the viewpoint of PIP program units are useful.
To realize outcome-based PIP project management. When planning a PIP project, a clear
objective and expected development effect by itself must be formulated, but it is also obliged to
formulate the role of contribution toward the achievement of development goals. PIP program
units are tools to connect these individual PIP projects to development plans, especially in the
planning process.
To monitor achievement of development plans. Monitoring individual PIP projects is
essential. However, it is not enough to understand the whole picture of development in the
nation/sector/region. PIP program units help monitoring achievements of development plans by
linking its intermediate indicators with the performance and effect of PIP projects.
To ensure accountability of development plan achievement to the society. As the
responsibility of the nation, it is important to provide intermediate progress of development
target achievement to the society. Provision of the achievement progress may trigger motivation
and further cooperation from the society for further development. PIP program units act as a
tool to display the status quo of progress toward the society in their familiar level.
Development
PlansSector
SEDP
PIP
Unit
Public Investment
Program (PIP) Unit
Provincial
SEDP
PIP
Unit
PIP
Unit
PIP
Unit
PIP
Unit
Individual PIP Projects
National Socio-Economic Development Plan
PIP
Projects
PIP
Projects
PIP
Projects
PIP
Projects
PIP
Projects
PIP
Projects
PIP
Program Units

Manual for PIP Program Management Section I
I-7
2.1 Variation of PIP Program Units
PIP program units are formulated under SEDP. Therefore, PIP Program units can be formulated
under any sectorial (ministry) or regional (province) SEDP. PIP program units can also be
formulated at district/kun-ban/ban levels, as long as their targets and activities (projects) are existent.
In all PIP program units, sectorial (or sub-sectorial) and regional coverage must be considered,
although the coverage level differs depending on the unit. The following explains characteristics of
PIP program units depending on their superordinate SEDP.
(1) PIP Program Units under Sectorial (Ministry) SEDP
Sectorial SEDP or SEDP for ministries set up targets within important sub-sectors in the field of
expertise required for that sector. Naturally, PIP program units would be formulated by sub-sectors,
and further divided by regions. Since many PIP projects are already categorized under such
sub-sectors in its planning stages, it is relatively easy to allot them once the PIP projects are
identified. However, since the coverage of sectorial SEDP is on a nationwide level, it is difficult to
obtain sub-sector information in regional levels, where PIP projects are done under its own initiative.
(2) PIP Program Units under Provincial SEDP
Provincial SEDP carry targets of important sectors within the province. PIP program units would be
formulated by sector, and sub-sectors are divided within the same PIP program unit. It is also
necessary to keep sub-regional (districts/kun-ban/ban levels) viewpoint into consideration, because
individual PIP projects are still too small to influence the provincial SEDP altogether.
(3) PIP Program Units in District/Kun-ban/Village Levels
Although SEDP at these levels may not exist, PIP program units could still be formulated. It is done
by identifying specific targets for the sub-region, and analyzing the activity components (including
PIP projects).
The common sectors or regions within PIP program units from ministries, provinces and other levels
can be shared. For example, information in the sectorial (ministry) PIP program unit under a certain
sub-sector can be shared with a provincial PIP program unit. Through discussions, both parties
would eventually benefit by seeking the most efficient and effective way to achieve their own goals.
2.2 Concept of PIP Program Unit Management
PIP program units are managed mainly with the initiative of MPI/DPI, but achievement
responsibilities for sectorial and regional program units itself lies on the organizations that are
directly in charge the unit. It can be said that MPI/DPI is responsible of the framework of PIP as a
program, and the organizations of the sector/region is responsible of its contents of the program unit
itself.
As mentioned above, the common goal for the nation is to achieve the 5 year NSEDP, and the
sectorial/regional SEDP as its intermediate achievement. Although a PIP program unit is comprised
of PIP projects in its sector or region, the program unit itself has an objective larger than that of

Manual for PIP Program Management Section I
I-8
Figure 5: PIP as a Program “Box with a Signboard”
individual PIP projects. It functions as a “Box with a Signboard” for a particular sector or region,
where individual PIP projects inside the unit (or
“box”) could be easily categorized and installed.
Therefore, management of a PIP program unit
maintains a certain line with management of
individual PIP projects. It is ensured that the program
unit could always be observed in a large scale.
2.3 Three Perspectives of PIP Program Unit
Management
Observing a PIP program unit requires a
comprehensive viewpoint. In order to conduct smooth
management of a PIP program unit, the following three perspectives have to be covered.
Logical Viewpoint: PIP as a program functions as a link between development plans and individual
PIP projects. It can be said that development plans, PIP program units and individual PIP projects are
linked in a logical, cause and effect order. The logical order helps to understand the comprehensive
coverage of PIP projects under the development target. It also functions to detect whether enough (or
more than enough) PIP projects are existent to accomplish certain development targets.
Chronological Viewpoint: In addition to the logical viewpoint, chronological viewpoint, or time
sequence in the level of PIP as a program, is also an important factor. Once a mid-term development
target is set, the government has to monitor whether the situation is progressing towards its
achievement. Especially when individual PIP projects that are logically linked with certain
development targets are in progress, or have been completed and providing positive effects, it is
essential to monitor their achievement not only from the viewpoint of these individual PIP projects,
but also from the comprehensive viewpoint.
Geographical Viewpoint: Regional strategy is an important component for development target
achievement. National goals would not be achieved if proper regional coverage is not considered.
Also, by observing locations of PIP projects geographically, it would not only allow efficient
coverage of similar projects, but also would be able to find out PIP projects of different type that
could complement with each other, such as linkage with construction of access roads and hospitals,
etc.
When managed through the abovementioned three viewpoints, PIP as a program potentially
functions as a supporting method to both development targets and individual PIP projects.
Individual
PIP Projects
PIP as a Program
For xxx sector
Individual
PIP Projects
PIP as a Program
For xxx sector

Manual for PIP Program Management Section II
II-1
Manual for PIP Program Management
Section II Management Flow and Methods of PIP as a Program
Contents
1. Management Flow of PIP as a Program ................................................................................... 2
2. Formulation of PIP as a Program .............................................................................................. 3
2.1. Analysis of SEDP ................................................................................................................. 3
2.2. Formulation of PIP Program Units ................................................................................... 6
(1) Identification of PIP Program Units .............................................................................. 6
(2) Formulation of Program Objective Tree ....................................................................... 7
(3) Formulation of Chronology Chart .............................................................................. 10
2.3. Formulation of PIP Map................................................................................................... 13
(1) Formulation of a PIP Map............................................................................................ 14
(2) Conclusion and Outputs ............................................................................................... 15
(3) Using GIS ....................................................................................................................... 16
3. Monitoring PIP Program Units and PIP Maps ...................................................................... 16
3.1. Monitoring PIP Program Units ........................................................................................ 17
(1) Project Objective Tree .................................................................................................. 17
(2) Chronology Chart ............................................................................................................. 17
3.2. Monitoring PIP Map ......................................................................................................... 19
3.3. Reflection of Monitoring Results to Individual PIP Projects ........................................ 20
(1) Reflection to Absolute Assessment/Evaluation ........................................................... 20
(2) Reflection to Comparative Assessment ....................................................................... 21
4. Evaluation of PIP Program Units ............................................................................................ 21
4.1. Achievements and Progress of PIP Program Unit Targets ............................................ 22
4.2. Evaluation Through 5 Evaluation Criteria ..................................................................... 22
(1) Relevance ....................................................................................................................... 22
(2) Effectiveness .................................................................................................................. 22
(3) Efficiency ....................................................................................................................... 23
(4) Impact ............................................................................................................................ 23
(5) Sustainability ................................................................................................................. 23
4.3. Conclusion and Recommendations .................................................................................. 23
4.4. Reflection of Evaluation Results ...................................................................................... 24
(1) To Evaluation of SEDP ................................................................................................. 24
(2) To New SEDP Through Project Effects ....................................................................... 24

Manual for PIP Program Management Section II
II-2
Figure 1: 6 Stages in Management of PIP as a Program
Section II Management Flow and Methods of PIP as a Program
This section explains the steps to manage PIP as a Program. It also explains specific methods and tools
used for program management.
1. Management Flow of PIP as a Program
Management of PIP as a program is generally conducted in a mid-term perspective. PIP Program Units
are formulated from the SEDP 5 Year Plan, and is monitored on an annual basis, and modified in form
of an annual rolling plan. It can be said that PIP Program Units are used as monitoring tools for SEDP
achievement.
The process for management of PIP as a Program can be divided into the following 6 stages. Detailed
explanation of each stage is explained from Chapter 2 onwards.
(1) Analysis of SEDP
Since PIP as a program is formulated based on the SEDP, it is first necessary to analyze the SEDP. It is
done through comparing the achievements of the past and present SEDP, and find out its new and
ongoing features. Since new targets for the coming 5 years are set, it is important the share these
targets in prior to formulating PIP Program Units.
(2) Formulation of PIP Program Units
Based on the analysis results, PIP Program Units are identified by dividing the main targets of the
SEDP. Details of PIP Program Units can be formulated by analyzing the relation of the SEDP and
individual PIP projects from a logical viewpoint using the Program Objective Tree (POT). They can
further be formulated from the chronological viewpoint using the Chronology Chart. This series of
studies should be done at the beginning of the mid-term, as soon as the SEDP 5 Year plan is
announced.
(3) Formulation of PIP Map
Based on analysis results of the SEDP, PIP Maps are formulated by plotting PIP project locations and
other necessary information related to SEDP targets (geographic information, locations of key
facilities, social indicators, etc).,. Scale and size of maps used in this process differ depending on the
(6) Reflection of
Results to
New SEDP
(5) Evaluation of
PIP Program Unit
(4) Monitoring
PIP Program Unit
& PIP Map
(2) Formulation of
PIP Program Unit
(1) Analysis
Of SEDP
(3) Formulation of
PIP Map
Formulation M&E Results
(6) Reflection of
Results to
New SEDP
(5) Evaluation of
PIP Program Unit
(4) Monitoring
PIP Program Unit
& PIP Map
(2) Formulation of
PIP Program Unit
(1) Analysis
Of SEDP
(3) Formulation of
PIP Map
Formulation M&E Results

Manual for PIP Program Management Section II
II-3
level of PIP Program Unit studied. For example, when studying a PIP Program Unit in the sectorial
(minister) level, a map covering the whole nation is used. When studying a PIP Program Unit in
regional levels, smaller scale maps are used according to the scale of region studied (ex. provincial
maps, district maps). This series of studies should also be done at the beginning of the mid-term, as
soon as the SEDP 5 Year plan is announced.
(4) Monitoring PIP Program Unit and PIP Map
PIP Program Units and the PIP map is generally monitored in an annual basis. After the annual SEDP
is announced along with the PIP budget guideline, contents of each PIP Program Unit along with the
PIP map is revised according to the changes in its plans. PIP project information is also updated, with
new projects included and completed projects checked.
(5) Evaluation of PIP Program Unit
PIP Program Units are evaluated before the 5 Year SEDP concludes. Its objective is to check the
achievement level of PIP Program Units within its mid-term period. In addition to checking the
performance of individual PIP projects, indirect sectorial and regional performances must also be
checked. The evaluation study results would be an important reference to planning the SEDP for the
next mid-term plan.
(6) Reflection of Results to New SEDP
Evaluation results, including recommendations and lessons learned from the evaluation studies could
be used as reference to the next SEDP. PIP Program Units could be studied comprehensively, along
with private investment progress and achievements by the society.
When the new SEDP is planned and announced, it is again analyzed in order to formulate a new set of
PIP Program Units.
2. Formulation of PIP as a Program
The 3 first stages in the process of program management flow are procedures for formulation of PIP as
a Program. The following sub-chapters explain specific methods of formulating PIP as a program.
2.1. Analysis of SEDP
As explained in Section I, NSEDP is the national agenda for development, outlining the government
direction to achieve mid-term economic and social development target. Under the NSEDP, SEDP are
made within sector ministries and provinces respectively.
It is done through comparing the achievements of the past and present SEDP, and find out its new and
ongoing features. Since new targets for the coming 5 years are set, it is important the share these
targets in prior to formulating PIP Program Units.

Manual for PIP Program Management Section II
II-4
Although it is important to thoroughly understand the SEDP, the following indicates some of the most
important topics that are essential to analyze when formulating PIP as a program.
Chart 1: Topics for SEDP Analysis
Topic Analysis Points
Composition of existing development
plans
Names and objectives of the development plans that have been
prepared.
They could be 20 years, 10 years, 5 years, 2.5 years and annual
plan. Find the reasons behind the terms (why the certain
development plan was set in this certain period)
Overall Development Strategy in the 20
years plan
Understand the development direction of the sector/region,
including the general direction in the long-term.
Macro-indicators, main tasks and guidelines within the term also
must be studied
Mid-term (10 years) Development
Strategy
Understand the development direction of the sector/region,
including the general direction in the long-term.
Macro-indicators, main tasks and guidelines within the term also
need to be understood.
Check whether the indicators match with longer development
plans (such as the 20 years plan), since they can be the mid-term
milestones of a long-term plan
Plan Targets and Tasks in the 20 years and
5 years plans
Understand the mid-term economic/social/environmental
targets.
Check whether a mid-term PIP budget guideline exists,
Thematic and Cross-Cutting Areas There are many cross-cutting and multidimensional subjects that
cannot be categorized in a certain sector. These subjects must be
monitored from a comprehensive viewpoint. Subjects include
poverty reduction, gender equity, environmental conservation,
private sector development, science & technology etc.
Sectorial and Sub-sectorial Development Understand goals (along with target indicators) within each
sector and its sub-sectors.
Seek connections with cross-cutting areas and other sectors.
Regional Development Understand goals (along with target indicators) within the
regions and sub-regions.
Seek connections among sector and sub-sector strategies (ex.
provincial and district strategies).
Seek connections with neighboring regions and sub-regions.
The point of these analyses is to express the SEDP in as quantitatively as possible. If there are
important topics that are expressed in a qualitative way, it is important to quantify them.
Casework of Analysis
ANNEX 1 presents examples of the development plan analysis on: 1) Provincial SEDP (PSEDP) and

Manual for PIP Program Management Section II
II-5
2) Sector Development Plan of a model sector, Public Works and Transportation sector (PWTDP) in 3
provinces, a) Oudomxay, b) Khammuan and c) Saravan.
Findings from the analysis
Through the casework analysis, some findings can be shown as follows;
1) Mid-term plan
Some provinces do not have a 10 year PSEDP that show mid-term (10 years) development
directions, macro indicators and target and tasks. The 10 year plan generally should show those
elements as midterm milestones of a 20 year development plan. In addition, the 10 year plan can
clarify goals after achievement of the first 5 year plan within the 20 year-span of development
strategy. Thus, the goals in 20 years, 10 years and 5 years can be presented in a common
development scenario within the span of 20 years. In this sense, development directions, macro
indicators, target and tasks to be achieved in 10 years should be prepared at beginning of the 20
year strategy, and reviewed and amended every 5 years in authorized procedures.
2) Thematic and cross cutting areas
Every SEDP document describes contents of development contexts by sector. This structure is
common as development plan documents. However, it is also essential for the documents to
mention about development in cross-cutting areas, such as environment, gender issues and
poverty reduction, which has already been described in the NSEDP. Poverty reduction is a
particularly important issue in the areas as it can be considered to be the overall goal of all the
development plans. In addition, environmental consideration is currently a key global issue for
sustainable development. Therefore, it will be necessary that development context in each sector
mentions at least how it can contribute to achieve the goals in each of the cross cutting areas.
3) Regional development issue
Some PWT plans do not mention target regions, the principle and goals on development. It is
necessary even for sector development plans to mention the elements shown in “Chart 1”. In
addition, viewpoint of regional development is essential to cross-cutting issues such as reduction
of poverty and economic disparity among regions.
4) Terminology
Some key technical terms e.g. goal, target, objective, indicator, activity, project and program are
often used different meaning and coverage depending on the development plan document.
Especially, the terms “activity” and “project”; generally considered as a different level in PIP; are
often used as the same meaning.. In order to avoid such confusion, it is necessary to clarify the
definition of each term as well as the structure among the terms. It is recommendable to attach a
glossary of key words in the beginning of the development plans.
5) Quantitative elements of indicators
Many indicators in the development plan do not have enough quantitative elements. There are

Manual for PIP Program Management Section II
II-6
many indicators that mention just the narrative summary of conditions to be achieved after
implementation of the plans. This lack of quantitative elements of the indicators not only
weakens concreteness of the subject that the plans aim to achieve but also disables quantitative
monitoring and evaluation of progress and achievement of the plans. Indicators generally should
mention aspects of: 1) what; 2) how much; 3) how well; 4) by when and; 5) where even in a
narrative expression.
2.2. Formulation of PIP Program Units
As mentioned in Section I, PIP as a program becomes a form of PIP Program Units, through logical
disassembling of the SEDP. Since the SEDP is formed in a 5 year term, PIP Program Units are also
formed in a 5 year cycle. The basic foundation of PIP Program Units would not change during the
course of the 5 years unless there is drastic change in the development plan or policy. However, when
new subjects or issues arise in the development plan level, new PIP Program Units are considered to be
formed or revised.
PIP Program Units are developed through workshops that involve staffs from planning departments
and sector organizations.
DPI takes the initiative of the workshop when formulating provincial level PIP Program Units.
Representatives from sector departments and districts are invited as workshop members. In principle,
Program Units are considered from the sectorial viewpoint. However, when sub-regional (district,
kum-bans, village) viewpoint is an important factor (for example, there are districts that are considered
as the poorest, thus SEDP instructs a necessity to monitor through its 5 years) they can be considered
from both sector and sub-regional viewpoints. MPI members take part as an advisory status.
MPI members, along with support from the Planning Department of the sector ministry would take the
initiative of the workshop when formulating ministry level PIP Program Units. Representatives from
sub-sector departments and provincial sector departments are invited as workshop members. In
principle, the Program Units are considered from the sub-sectorial viewpoint. However, when regional
viewpoint is an important factor (for example, a certain sector has special interests in special regions;
such as the Boloven Plateau for the agriculture sector development).
The following procedures show the specific steps to formulate PIP Program Units.
(1) Identification of PIP Program Units
Based on the analysis of SEDP, PIP Program Units are identified by dividing the main targets of the
SEDP. Contents in Sectorial and Sub-sectorial Development, along with Regional Development
would be the candidates for PIP Program Units. If a provincial SEDP is studied, Thematic and
Cross-cutting Areas would also be a candidate of a PIP Program Unit.
The number of PIP Program Units within an SEDP depends on the scale of the sector or province
studied, and its balance of management capacity. A manageable number of PIP Program Units within a

Manual for PIP Program Management Section II
II-7
sector or province would be around 10, although it depends on the size and coverage of each PIP
Program Unit.
Ensure that quantitative targets for Program Units are clear. For each Program Unit, it is
recommendable to have a few quantitative indicators, so that the Program Units have certain
dimension towards achievement of its super-ordinate target.
It is very important to determine the categorization and number of PIP Program Units, since these may
change the policy and direction of PIP management for the 5 years during SEDP implementation.
After it is agreed within the workshop members, it is important to report to Decision Makers for
approval, so that there is a clear consensus of the policy and direction.
(2) Formulation of Program Objective Tree
A Program Objective Tree (POT) is formulated for every Program Unit. A POT is a tree-like diagram
with 3 main levels. The target of the Program Unit on the top level, intermediate targets are placed in
the second/middle level, and PIP projects are located in the third level, below the related intermediate
targets respectively.
The vertical relations within the 3 levels are
constituted in logical form. Program Unit
targets have cause-and-effect relations
between each intermediate targets. The
intermediate targets also have
cause-and-effect relations with their
respective PIP projects.
A POT is normally made from the top level, working downwards to the bottom. However, in some
cases where the intermediate targets; or the second level; is not clear, it is developed simultaneously
with the alignment of PIP projects; or the third level. The following steps are the standard methods on
how to develop the POT.
Step 1: Make consensus on the Program Unit target and its indicators
After stage (1), the categorization of the Program Units are made, along with their respective
quantitative targets. In order to develop the POT, it
is important to have consensus of the target and
coverage of each Program Unit and its
indicators.
Step 2: Develop logical intermediate target
and its indicators
Since Program Units represent one
component of SEDP, they may not have direct
Figure 2: Program Objective Tree and Cause-Effect Relations
Program Unit Target
(indicator)
Intermediate Targets (indicators)
Indicator A Indicator B Indicator C Indicator D
PIP Project
PIP Project
PIP Project
PIP Project
PIP Project
PIP Project
PIP Project
PIP Project
PIP Project
PIP Project
PIP Project
PIP Project
PIP Project
PIP Project
PIP Project
PIP Project
cause
effect
effect
cause
Program Unit Target
(indicator)
Intermediate Targets (indicators)
Indicator A Indicator B Indicator C Indicator Dcause
effect
Figure 3: Program Unit and Intermediate Targets

Manual for PIP Program Management Section II
II-8
Figure 4: Listing PIP projects
logical connections with individual PIP projects, although they indirectly belong to the same category.
Even if they do, it may take accomplishments of many PIP projects; too many to manage; for the
achievement of the Program Unit target. Therefore, it is recommendable to break up the Program Unit
indicators into smaller components, so that the effects for individual PIP projects could be directly
linked with its effect towards the Program Unit target achievement.
Step 3: Align new and ongoing PIP projects that directly relate to the Program Unit target
After setting intermediate targets, place PIP projects that affect each target. PIP projects include those
that are both new and ongoing. PIP projects that are on feasibility studies are also listed.
In addition, PIP projects that have just completed, or those that are completed recently and are in
operation, are also listed. This is to ensure that the true effect of PIP projects, present and past, is
monitored so that their contribution is included in the achievement of intermediate goals.
Furthermore, PIP projects that indirectly contribute to
the intermediate target, although the project produces a
direct effect to another intermediate target, is also
included in the list. As a result, some PIP projects may
appear under a number of different intermediate targets.
All listed PIP projects must have indicators that show
the effect toward its intermediate target indicators. By
adding up these indicators, the direct contribution of PIP projects towards the intermediate target, as of
present, would be clear.
Step 4: Find out further requirements within the third level to fulfill intermediate targets.
If the SEDP is still in its early years, existing PIP project plans may not be enough to provide effect to
fulfill intermediate targets. In this step, the workshop members discuss potential PIP projects, or other
alternative methods to achieve the intermediate targets.
If sectors or regions where private investment and achievement of society has a certain direct
contribution toward achievement of intermediate goals, it is necessary to quantify them before
discussion of potential PIP projects are made.
After these aspects are confirmed, workshop participants discuss on how to achieve the intermediate
target through potential direct and indirect PIP projects.
After the workshop agrees to consider planning certain PIP projects, sector/regional department begins
project identification and planning as a means to achieve the intermediate target.
Step 5: Find out fundamental issues in the first and second levels that may hinder the
achievement of the intermediate target indicators.
Intermediate Targets (indicators)
Indicator A (achievement target of certain subject)
Planned PIP Projects New PIP Projects (F/S) Ongoing PIP Projects
Completed PIP Projects PIP Projects in Operation
PIP Projects
Completed PIP Projects
Completed PIP Projects
PIP Projects in Operation
PIP Projects in Operation
Planned PIP Projects
Planned PIP Projects
Ongoing PIP Projects
Ongoing PIP Projects
New PIP Projects (F/S)
New PIP Projects (F/S)
Former PIP Projects already in effect PIP Projects that have
Indirect effectPIP Projects that have
Indirect effect

Manual for PIP Program Management Section II
II-9
Some intermediate targets may not be achieved through increasing or improving PIP projects. Other
assumptions may be needed, including causes that are not controllable (natural causes,
macro-economic effects etc.). In such cases, there is a need to analyze such causes and find possible
countermeasures that enable target achievement.
If countermeasures are unavailable or unrealistic, it may be necessary to report its background to the
Decision Maker. It is important that when providing the report, speculation of the achievement level as
compared to the original target is needed.
Conclusion and Outputs
The following are the conclusion and outputs through the POT workshop;
POT: A POT would be an important reference when monitoring the PIP Program Unit. It also helps
trying to identify the status of the PIP project when conducting absolute and comparative assessments.
The POT would be revised annually, according to the development of individual PIP projects and their
contribution to the intermediate target.
New PIP Project Identification: New PIP projects may be proposed through the course of discussing
the achievement of intermediate goal. However, it does not mean that the newly proposed project is
assured. The sector or region that is liable to be responsible of the project would start project
identification and feasibility studies.
Suggestions on Intermediate Target Achievement: Further suggestions in the PIP Program Unit
level may be turned out to the Decision Maker. Depending on the topic, further discussions may be
made to resolve issues.
Caseworks of POT
ANNEX 2 shows caseworks for POT of 1) PSEDP and 2) PWTDP in 3 provinces, a) Oudomxay, b)
Khammuan and c) Saravan for 2006-2010. Moreover, an ideal example of POT is recommended at the
end of the ANNEX 2, which reflects lessons through the casework .
Findings on the analysis
Through the analysis to formulate POT caseworks, some findings can be shown as follows;
1) Consistency between provincial SEDP and Sector DP
There are some contradictions in development contexts between PSEDPs and PWTDPs. Some sets of
both types of plans often show mutually different objectives, Intermediate Targets and even listed PIP
projects. Provincial SEDP is an integrated development plan across all the sectors, which should have
been merged after the final draft of all the Sector Development Plans in the province, therefore,
basically contradiction should not exist. It is supposed that this was caused due to reasons such as: 1)
responsible agencies of each plan had obstacles on mutual communication and collaboration or; 2) the
draft of Sector Development Plans could not meet the due date of compiling Provincial SEDP.
2) Cause-and-effect relations between intermediate targets and PIP projects
The vertical relations between intermediate targets and PIP projects are often weak. The intermediate

Manual for PIP Program Management Section II
II-10
targets should have cause-and-effect relations with their respective PIP projects. However, some PIP
projects miss the clear measure to achieve which intermediate target in the plan. In addition, even
some intermediate indicators are missing PIP projects that should be linked.
(3) Formulation of Chronology Chart
A Chronology Chart is also formulated for every Program Unit. While POT identifies the relations
between intermediate targets and PIP projects from the logical approach, Chronology Chart shows
their relations in “time” sequence. It is formed in a chart that illustrates the progress of the
intermediate targets and PIP project results.
Chart 2: Chronology Chart
Intermediate TargetsExpected Achievementby End of Mid-Term
unit/% 1st Year 2nd Year 3rd Year 4th Year 5th Year
unit cccc dddd eeee ffff aaaa
% 55% 70% 75% 85% 100%
unit gggg hhhh iiii kkkk bbbb
% 45% 65% 80% 90% 100%
PIP Project Name Period/Project Effect Indicator 1st Year 2nd Year 3rd Year 4th Year 5th Year
<Period> project operation
in progress (-2) year to 1st year
<Project Effect Indicator> operation
Increase in dry season riceproduction by xxx tons
not completed
rice productionin dry season
increased by xxxtons
rice productionin dry season further
increased by xxxtons
<Period> project operation
3 years from 1st to 3rd year
<Project Effect Indicator> 1st trial 2nd trail operation
Increase in dry season riceproduction by xx tons
increase by aa tons increase by aa tons increase by xx tons
Increase in wet season riceproduction by xx tons
increase by bb tons increase by bb tons increase by xx tons
<Period> project operation
2 years from 3rd to 4th year
<Project Effect Indicator> partial operation operation
Increase in wet season riceproduction by xx tons
increase by xx tons increase by xx tons
Improvement of water dranageConstruction of banks and ridges for
wet season crop
bar
unit
Rice crop improvement projectUse and study capabilities of improvedcrops that have been developed in the
agriculture institution
xxx region irrigation projectIrrigation for dry season rice
productionunit
bar
bar
unit
Rice Production for wet seasons in xxxregion increases
aaaa tons / wet season
Rice production for dry season in xxxxregion increases
bbbb tons / dry season
IntermediateTargets
Mid-termTargets(Indicators)
Annual Achievements(Plans) by volume
Annual Achievements(Plans) by % of Target
Annual Progress of Target & PIP Project Effect
PIPProjects
Period ofProject
ProjectEffectIndicators
ProjectImplementation
Operationof ProjectResults
AnnualProjectEffects
The following steps are standard methods on how to develop the Chronology Chart.
Step 1: Obtain Indicators
Chronology Chart shows the chronologic improvement of indicators. Therefore, indicators that are
measured in intermediate targets and PIP projects are essential. As for PIP projects, indicators showing
effects after completion and during operations are also necessary. It is important to obtain annual
progress of these indicators, so that true progress and the effect by PIP projects can be observed.
In order to obtain annual progress indicators toward the intermediate target, the SEDP, along with the
POT are used. If the SEDP or its surrounding material do not provide such information, statistics and

Manual for PIP Program Management Section II
II-11
reports in regions or sectors can be referred. If still not obtained, it is necessary to determine the
indicators through discussions with regional and sectorial officials.
In order to obtain annual effects by PIP projects, project documents and assessment reports are of
good reference. As for projects that have positive effects to the intermediate target, and are already
completed and in operation, it is necessary to refer to the organization responsible.
Step 2: Place Intermediate Targets, Including Chronological Progress of its Achievement
After obtaining annual indicators, they are then inserted into the Chronology Chart. The upper rows of
the chart are filled out with the following information;
Chart 3: Chronology Chart, Intermediate Targets and their Annual Progress
Intermediate TargetsExpected Achievementby End of Mid-Term
unit/% 1st Year 2nd Year 3rd Year 4th Year 5th Year
unit cccc dddd eeee ffff aaaa
% 55% 70% 75% 85% 100%
unit gggg hhhh iiii kkkk bbbb
% 45% 65% 80% 90% 100%
PIP Project Name Period/Project Effect Indicator 1st Year 2nd Year 3rd Year 4th Year 5th Year
<Period>
<Project Effect Indicator>
<Period>
Rice Production for wet seasons in xxxregion increases
aaaa tons / wet season
Rice production for dry season in xxxxregion increases
bbbb tons / dry season
(a) IntermediateTargets
(b) Mid-termTargets (Indicators)
(C)Annual Achievements(Plans) by volume
(d) Annual Achievements(Plans) by % of Target
Annual Progress of Target & PIP Project Effect
(a) Intermediate Targets: Describe the Intermediate Targets that represents the Program Unit. When
more than one Intermediate Targets are present, list all.
(b) Mid-term Targets (Indicators): Write the expected target indicator that should be achieved at the
end of the mid-term. If there are any baseline figures (indicators of the current situation), it would
be advisable to include these figures, too. (ex. Rice production in xxx region increases from the
current level of xxxx tons to a mid-term target of yyyy tons)
(c) Annual Achievements (Plans) by Volume: Indicate the annual progress targets. Obviously at the
5th
year, you would expect that the mid-term target has achieved. Depending on the target itself
and its approach towards achievement, the annual progress may have fluctuation.
(d) Annual Achievement (Plans) by % of Target: Indicate the percentage of annual progress
achievement (plan) as compared to the intermediate target. At the 5th year, this rate should reach
100%.
Step 3: Place PIP Projects, Including Chronological Progress of its Effects
The next step is to insert PIP projects related to the intermediate targets that were identified in the POT.
The chart is filled with the following procedure;

Manual for PIP Program Management Section II
II-12
Chart 4: Chronology Chart, PIP Projects and their Annual Progress of Effect
Intermediate TargetsExpected Achievementby End of Mid-Term
unit/% 1st Year 2nd Year 3rd Year 4th Year 5th Year
unit cccc dddd eeee ffff aaaa
% 55% 70% 75% 85% 100%
unit gggg hhhh iiii kkkk bbbb
% 45% 65% 80% 90% 100%
PIP Project Name Period/Project Effect Indicator 1st Year 2nd Year 3rd Year 4th Year 5th Year
<Period> project operation
in progress (-2) year to 1st year
<Project Effect Indicator> operation
Increase in dry season riceproduction by xxx tons
not completed
rice productionin dry season
increased by xxxtons
rice productionin dry season further
increased by xxxtons
<Period> project operation
3 years from 1st to 3rd year
<Project Effect Indicator> 1st trial 2nd trail operation
Increase in dry season riceproduction by xx tons
increase by aa tons increase by aa tons increase by xx tons
Increase in wet season riceproduction by xx tons
increase by bb tons increase by bb tons increase by xx tons
Rice crop improvement projectUse and study capabilities of improvedcrops that have been developed in the
agriculture institution
unit
xxx region irrigation projectIrrigation for dry season rice
productionunit
bar
bar
Rice Production for wet seasons in xxxregion increases
aaaa tons / wet season
Rice production for dry season in xxxxregion increases
bbbb tons / dry season
Annual Progress of PIP Project Effect
(a)PIP Projects
(b)Period ofProject
(c)ProjectEffectIndicators
(d)ProjectImplementation
(e)Operation ofProject Results
(f)AnnualProjectEffects
(a) PIP Projects: Describe the name of the PIP project that is categorized under the PIP Program Unit.
It is preferable if the Project Code is described along with its name, to clarify the exact project.
(b) Period of Project: Describe the (expected) period and duration of PIP project implementation.
(c) Project Effect Indicators: Describe the indicators that affect the intermediate target, with its own
target in the project-level. It must be ensured that the target itself relates to the intermediate target.
(d) Project Implementation: Draw a bar within the years of implementation.
(e) Operation of Project Results: If the project effects are likely to take appear only after operation of
completed results, or if indicators are liable to improve during operation, draw a bar until the point
where the effect does not influence the intermediate target.
(f) Annual Project Effects: Describe annual progress indicators of the effects caused by the project.
Continue description after completion of the projects under “operation” if the effects are liable to
appear or improve during operation of the project results.
Step 4: Find Out Chronological Issues
After reflecting all intermediate target indicators and PIP projects from the POT, discuss whether the
whole Program Unit is chronologically realistic to put into implementation. The physical capacity of
work within the region/sector, along with predicted budget/financial limitations must be considered in
the discussion.
When issues are raised, discuss countermeasures to resolve them with the first priority of achieving the
intermediate target. However, it is necessary for countermeasures to maintain reality by facing and
analyzing the actual conditions and limitations.
Conclusion and Outputs
The following are the conclusion and outputs through the completion of Chronology Chart;

Manual for PIP Program Management Section II
II-13
Figure 5: National-level Map and Regional Level Map
Chronology Chart: A Chronology Chart would be an important reference when monitoring the PIP
Program Unit in time sequence. It also helps identifying the chronological status of PIP projects when
conducting absolute and comparative assessments. The Chronology Chart would be revised annually
along with POT, according to the development of individual PIP projects and their contribution to the
intermediate target.
Chronological Allocation/Reallocation of PIP Projects: Through the formulation process and
discussion process, some PIP projects may be found unrealistic to achieve within its timeframe, or is
necessary to speed up its development. In such cases, recommendations toward allocating a new
schedule for those PIP projects may arise. For PIP projects that have been suggested through POT,
planning, implementation and operations schedules may be discussed and shared.
Suggestions on Intermediate Target Achievement: Further suggestions in the PIP Program Unit
level may be submitted to the Decision Maker. Depending on the topic, further discussions may be
made to resolve issues.
Caseworks of the Chronology Chart
ANNEX 3 shows caseworks for the Chronology Chart of: 1) Provincial SEDP and 2) Sector
Development Plan of a model sector i.e. Public Works and Transportation (PWT) sector in 3 provinces,
a) Oudomxay, b) Khammuan and c) Saravan for 2006-2010.
Findings on the analysis
Through the analysis to formulate caseworks of Chronology Chart, some findings can be shown as
follows;
1) Quantitative element of indicators
As mentioned in articles of the other PIP tools, there are not enough sets of quantitative indicators
in the development plans. Therefore, it was difficult to mention target value as milestones of every
implementation year in the Chronology Chart. The development plan should have clear indicators
with specified numeric value.
2) Cause-and-effect relations between intermediate targets and PIP projects
This issue is also referred in the article on POT. As cause-and-effect relations between
intermediate target and PIP projects are weak in the plan, the examples of Chronology Chart must
have some blanks of PIP projects that would achieve Intermediate target. The development plans
should have basic logics that projects are not objectives but measures to achieve specified targets.
2.3. Formulation of PIP Map
After development of the PIP Program Units with logical and chronological viewpoints, it is then
observed from a geographical viewpoint. Whatever the coverage of SEDP or PIP Program Unit it is
studied, it is important to strategically observe geographical locations of intermediate target
distribution and their PIP projects through maps of respective scale. Scale and size of maps differ
depending on the level of PIP Program Unit studied.
Manual for PIP Program Management Section II
II-14
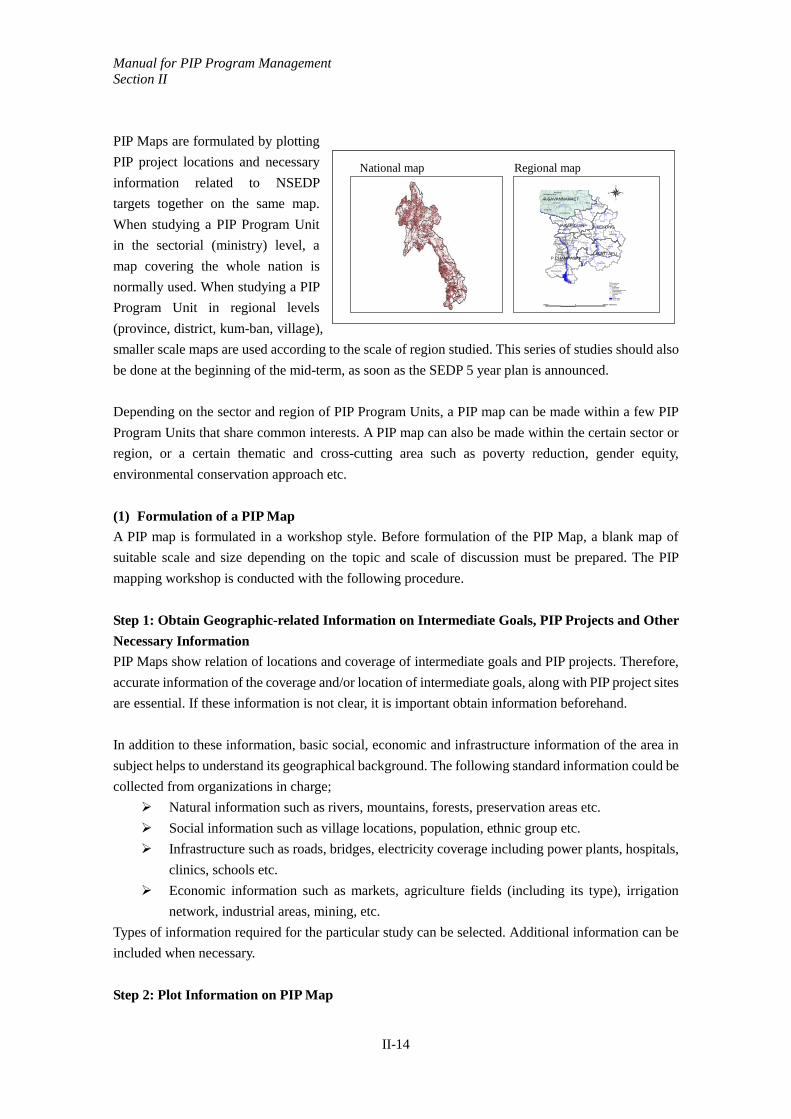
PIP Maps are formulated by plotting
PIP project locations and necessary
information related to NSEDP
targets together on the same map.
When studying a PIP Program Unit
in the sectorial (ministry) level, a
map covering the whole nation is
normally used. When studying a PIP
Program Unit in regional levels
(province, district, kum-ban, village),
smaller scale maps are used according to the scale of region studied. This series of studies should also
be done at the beginning of the mid-term, as soon as the SEDP 5 year plan is announced.
Depending on the sector and region of PIP Program Units, a PIP map can be made within a few PIP
Program Units that share common interests. A PIP map can also be made within the certain sector or
region, or a certain thematic and cross-cutting area such as poverty reduction, gender equity,
environmental conservation approach etc.
(1) Formulation of a PIP Map
A PIP map is formulated in a workshop style. Before formulation of the PIP Map, a blank map of
suitable scale and size depending on the topic and scale of discussion must be prepared. The PIP
mapping workshop is conducted with the following procedure.
Step 1: Obtain Geographic-related Information on Intermediate Goals, PIP Projects and Other
Necessary Information
PIP Maps show relation of locations and coverage of intermediate goals and PIP projects. Therefore,
accurate information of the coverage and/or location of intermediate goals, along with PIP project sites
are essential. If these information is not clear, it is important obtain information beforehand.
In addition to these information, basic social, economic and infrastructure information of the area in
subject helps to understand its geographical background. The following standard information could be
collected from organizations in charge;
Natural information such as rivers, mountains, forests, preservation areas etc.
Social information such as village locations, population, ethnic group etc.
Infrastructure such as roads, bridges, electricity coverage including power plants, hospitals,
clinics, schools etc.
Economic information such as markets, agriculture fields (including its type), irrigation
network, industrial areas, mining, etc.
Types of information required for the particular study can be selected. Additional information can be
included when necessary.
Step 2: Plot Information on PIP Map
Phin
Karum
Ta-Oy
Sanxai
Pakxong
Xepon
Nong
Phouvong
Saravan
Laman Dakchung
Khong
Vapi
PathoumphonSanamxai
Songkhon
Mounlapamok
Thapangthong
Xaisettha
Xonbouri
Soukhouma
Phalanxai
Laongam
Champhon
Lakhonpheng
Phonthong
Champasak
Toumlan
Thateng
Khongxedon
Xanasomboun
Samouay
Atsaphangthong
Bachiangchareunsouk
Samakkhixai
Pakxe
P.SAVANNAKHET
P.CHAMPASAKP.ATTAPU
P.SARAVAN P.XEKONG
Whole_admin
Whole_hy-pol
Whole_roadPaved RoadStreet TownImproved unpaved roadUnpaved Road
Temporaly RoadFoot Pass210722103
Prov.shp
Central.shp
100000 0 100000 Kilometers
N
EW
S
National map Regional map

Manual for PIP Program Management Section II
II-15
After collecting accurate geographic information, they are then plotted respectively onto the PIP map.
Intermediate Targets: Plot intermediate targets on the PIP map. If intermediate targets cover the whole
range of the map, they can be compiled as explanatory notes. In this case, ensure that the coverage of
the targets is clear and accurate.
PIP Projects: Plot PIP projects on the PIP map. Locate the project site accurately. If a certain PIP
project covers a certain range within the map, indicate its coverage. Also write indicators of the PIP
project effect that is related to the intermediate targets studied. Highlight projects depending on its
status i.e. ongoing, new, planning stage etc.
Basic Information: Plot basic information that relate to the PIP Program Units, or the studies.
Step 3: Analyze the Geographical Situation
After plotting all information, analyze the completed PIP map. They could be analyzed from the
following two viewpoints;
Coverage of Intermediate Targets: Check whether the coverage is geographically feasible or too
small/large. Also check whether the natural, social, infrastructure or economic conditions within the
area suitable for intermediate target achievement.
Locations of PIP Projects: Check whether PIP projects are located with a fair coverage to ensure
intermediate target achievement. Also check whether the conditions surrounding the PIP projects
(natural, social. Infrastructure and economic conditions) are appropriate enough to achieve its
intended target.
(2) Conclusion and Outputs
The following are the conclusion and outputs through the completion of PIP Map;
PIP Map: The PIP Map itself shows the comprehensive view of the geographic coverage of indicators,
and locations of PIP projects that contribute to the target achievement. It would also show the intensity
of PIP projects in certain regions by comparing two different locations in the PIP map.
Geographical Suggestions on PIP Projects: If discussions are made in the process of after
completion of the PIP map, they would also be of reference. At the PIP project level, project locations
are clarified, and furthermore for new planned projects, strategic suggestions on the locations can be
made.
Geographical Suggestions on Intermediate Targets: Further suggestions in the PIP Program Unit
level may be turned out to the Decision Maker. Depending on the topic, further discussions may be
made to resolve issues.

Manual for PIP Program Management Section II
II-16
(3) Using GIS
Since the recommended the process of developing the PIP map is through workshops, it is necessary to
use blank maps of large size, so that participants can plot information with ease. However, since
information technology advancement over the few years would allow new ways to develop the PIP
map.
Geographical Information System (GIS) can be utilized by additionally plotting intermediate targets
and PIP projects from electronic maps in an efficient manner. Many provinces and ministries obtain
GIS maps. It is recommended to obtain GIS information with the necessary data.
Examples of PIP Map using free GIS software
PCAP 2 Project developed examples of PIP maps of the 5 year PWT sector development plan
2006-2010 in 3 provinces, Oudomxay, Khammuan and Saravan. The maps were prepared by a free
GIS software, MapWindow1 (see ANNEX 4). Measure features of the maps are as follows;
1) Target area: 3 monitor provinces of PCAP2 project
Oudomxay
Khammuan
Saravan
2) Embedded data
Administrative boundary
National Road(All province)
Provincial and Rural Road
Topography
River
Village (include health center, school)
Location of PIP projects listed in PWT sector development plan for 2006-2010
3) Available functions
Viewer function: to view
Basic data
Actual Infrastructure
PIP projects in PWT sector listed in plan 2006-2010
Editor function: to edit
Basic data
PIP projects in PWT sector listed in plan 2006-2010
Data Analysis
3. Monitoring PIP Program Units and PIP Maps
1 http://www.mapwindow.org/

Manual for PIP Program Management Section II
II-17
PIP Program Units, including POT and Chronology Chart, along with PIP Maps are formulated based
on the mid-term SEDP, and would be the basic framework during its 5 years. However, they need to be
monitored and updated annually along with the annual SEDP, in order to keep track of progress
towards the achievement of their intermediate targets. The following sub-chapters explain the
monitoring methods for each component.
3.1. Monitoring PIP Program Units
Monitoring of PIP Program Units is done simultaneously with the procedure of PIP budget request of
the following fiscal year. The objectives of monitoring are to (a) reflect the previous years’ results and
indicators, (b) confirm the direction of the Program Unit within the annual SEDP and the PIP budget
for the current year, and (c) utilize the monitoring results to support the selection of PIP projects and its
budget allocation.
With this process, implementing results and its issues of the previous year is identified, and
furthermore, general direction towards formulating the annual SEDP and PIP budget request for the
following year can be confirmed.
(1) Project Objective Tree
The main task of monitoring the POT is to arrange PIP projects. Since status of each PIP project
change annually, there is a need to update them into the most recent status. Status of PIP projects that
have started its implementation in the previous year is changed from new to ongoing. PIP projects that
have just completed must change from ongoing to completed, or in operation. For projects that are
completed, obtain the indicators in completion.
For PIP projects that are newly planned, a discussion is made on which Program Unit it belongs to.
After absolute assessment has been completed, it is temporarily included in the POT. It is officially
included after the project, including its budget has been approved by the National Assembly. It is
important to make sure that the indicators are related to the intermediate target
Operational projects that have completed accomplishment of their targeted effect may be removed
from the POT. However, it must be ensured that the intermediate target figures are adjusted based on
the accomplishment of the project results.
A POT, with all PIP project information updated would be completed.
(2) Chronology Chart
Most of the efforts in monitoring are intensified in the Chronology Chart. Since they show the annual
flow of targets, indicators and PIP projects, it is important that specific figures are updated.

Manual for PIP Program Management Section II
II-18
Chart 5: Chronology Chart Monitoring Points
Intermediate TargetsExpected Achievement
by End of Mid-Termunit/% 1st Year 2nd Year 3rd Year 4th Year 5th Year
unit cccc dddd eeee ffff aaaa
% 55% 70% 75% 85% 100%
unit gggg hhhh iiii kkkk bbbb
% 45% 65% 80% 90% 100%
PIP Project Name Period/Project Effect Indicator 1st Year 2nd Year 3rd Year 4th Year 5th Year
<Period> project operation
in progress (-2) year to 1st year
<Project Effect Indicator> operation
Increase in dry season riceproduction by xxx tons
not completed
rice productionin dry season
increased by xxxtons
rice productionin dry season further
increased by xxxtons
<Period> project operation
<Project Effect Indicator> 1st trial 2nd trail operation
Increase in dry season riceproduction by xx tons
increase by aa tons increase by aa tons increase by xx tons
Increase in wet season riceproduction by xx tons
increase by bb tons increase by bb tons increase by xx tons
<Period> project operation
2 years from 3rd to 4th year
<Project Effect Indicator> partial operation operation
Increase in wet season riceproduction by xx tons
increase by xx tons increase by xx tons
Improvement of water dranageConstruction of banks and ridges for
wet season crop
bar
unit
Rice crop improvement projectUse and study capabilities of improvedcrops that have been developed in the
agriculture institution
unit
xxx region irrigation projectIrrigation for dry season rice
productionunit
bar
bar
Rice Production for wet seasons in xxxregion increases
aaaa tons / wet season
Rice production for dry season in xxxxregion increases
bbbb tons / dry season
Annual Achievements byvolume
Annual Achievrmrent by% of Target
Operationof ProjectResults
AnnualProjectEffects
Monitoring Year
Monitoring of Chronology Chart is done with the following steps;
Step 1: Obtain Updated Indicators
Obtain all indicators from the annual SEDP, PIP project reports and sectorial/regional resources.
Confirm whether updated figures are actual results or estimation, and ensure to update actual figures
as soon as they are newly obtained. Compare beforehand whether the actual results and the original
plans, and highlight ones that have significantly not reached its expectations.
Step 2: Place Monitoring Indicators for Intermediate Targets
Chart 6: Monitoring Annual Intermediate Targets
It is important to plot the most updated figures, from actual results to its estimations. Ensure that the
actual results are plotted as soon as the information is available. As for estimations, it is crucial to first
observe the actual results, and check whether increasing indicators are necessary.
After calculating the updated percentage of achievement, if the percentage has dropped as compared to
the plan, it is essential that countermeasures for recovery in the remaining years be considered.
Intermediate TargetsExpected Achievement
by End of Mid-Termunit/% 1st Year 2nd Year 3rd Year 4th Year 5th Year
unit cccc dddd eeee ffff aaaa
% 45% (55%) 70% (70%) 75% 85% 100%
unit gggg hhhh iiii kkkk bbbb
% 38% (45%) 61% (65%) 80% 90% 100%
PIP Project Name Period/Project Effect Indicator 1st Year 2nd Year 3rd Year 4th Year 5th Year
<Period> project operation
in progress (-2) year to 1st year
<Project Effect Indicator> unit operation
xxx region irrigation projectIrrigation for dry season rice
production
bar
Rice Production for wet seasons in xxxregion increases
aaaa tons / wet season
Rice production for dry season in xxxxregion increases
bbbb tons / dry season
Annual Achievements byvolume
Annual Achievrmrent by% of Target
Monitoring Year

Manual for PIP Program Management Section II
II-19
Step 3: Place PIP Project Effect Indicators
Check each PIP project for its annual progress and update the chart, along with any changes of
expected plans.
Step 4: Plot New PIP Projects, Remove Achieved projects (or effects)
As for new projects introduced in the POT, they are added to the chart along with their indicators of
annual effects. For operational projects that have completed accomplishment of their targeted effect
that were removed from the POT, it is also removed from the Chronology Chart. However, it must be
ensured that the intermediate target figures are adjusted based on the accomplishment of the project
results.
Step 5: Check the Overall Accomplishment
Compare the actual results plotted to the original plan. If the achievement level is significantly lower
than of annual plan, consider countermeasures for recovery.
3.2. Monitoring PIP Map
The PIP Map is also updated annually. The main task of monitoring the PIP Map is to update
intermediate targets and status of PIP projects. Monitoring of the PIP Map is done with the following
steps;
Step 1: Obtain Updated Geographic-related Information
With the same reference of the POT, obtain indicators from the annual SEDP, PIP reports and
sectorial/regional resources. Find the exact locations for newly planned PIP projects, along with
surrounding indicators.
Step 2: Replace Updated Information on PIP Map
Reflect the updated information on the PIP map. If the original PIP Map is made manually on paper, it
is recommendable to make a copy and overwrite it, so that the progress would be shown. Plot the
locations of new PIP projects. Also plot related information that may affect the intermediate indicators,
PIP Project Name Period/Project Effect Indicator 1st Year 2nd Year 3rd Year 4th Year 5th Year
<Period> project operation
in progress (-2) year to 1st year
<Project Effect Indicator> operation
Increase in dry season riceproduction by xxx tons
not completed
rice productionin dry season
increased by xxxtons
rice productionin dry season further
increased by xxxtons
<Period> project operation
<Project Effect Indicator> 1st trial 2nd trail operation
Increase in dry season riceproduction by xx tons
increase by aa tons increase by aa tons increase by xx tons
Increase in wet season riceproduction by xx tons
increase by bb tons increase by bb tons increase by xx tons
<Period> project operation
2 years from 3rd to 4th year
<Project Effect Indicator> partial operation operation
Increase in wet season riceproduction by xx tons
increase by xx tons increase by xx tons
xxx region irrigation projectIrrigation for dry season rice
productionunit
bar
Improvement of water dranageConstruction of banks and ridges for
wet season crop
bar
unit
Rice crop improvement projectUse and study capabilities of improvedcrops that have been developed in the
agriculture institution
unit
bar
Operationof ProjectResults
AnnualProjectEffects
Monitoring Year
Chart 7: Monitoring PIP Projects

Manual for PIP Program Management Section II
II-20
from project documents.
Step 3: Monitor Overall Accomplishments and Progress
Compare the actual results plotted to the original plan. If duplication within PIP project coverage is
found, consider avoidance through discussions within project owners. If there are any PIP projects that
are liable to spread its effects by expanding coverage, suggest to the sector/region in charge of its
possibility, along with the project owner.
3.3. Reflection of Monitoring Results to Individual PIP Projects
In the process of monitoring the PIP Program Units, updated information from PIP projects are
reflected as much as possible.
Monitored information in PIP Program Units toward individual PIP projects is reflected with 2 steps.
The first step is when each PIP project is receiving absolute assessment or evaluation, and the second
step is when PIP projects are grouped and are conducting comparative assessment. The following
explains the 2 steps of reflecting PIP Program Unit monitoring results to individual PIP projects;
(1) Reflection to Absolute Assessment/Evaluation
Monitoring results of PIP Program Units are utilized in absolute assessment or evaluation. Ways of
utilization changes depending on the progress stage of the project that is assessed or evaluated.
Projects in the Identification Level: Although this stage does not require absolute assessment, PIP
Program Units can provide guidance to newly identified projects. The general outline of size, coverage
and timing of the PIP project which is to be planned, including its expected effects in the operational
stage can be worked out based on requirements from POT, Chronology Charts and PIP Maps.
New PIP Projects before Construction: Absolute assessment of newly planned projects is the most
important stage in the PIP project planning process. The PIP project in this stage has to be fully
relevant to the SEDP in order to be implemented and expected effects during and after the project also
must be clear. In order to measure these aspects, PIP Program Units and their tools provide detailed
information of these assessment aspects.
Ongoing PIP Projects: PIP Program Unit tools help the assessment of ongoing PIP projects in
observing expected effects. Within the Chronology Chart, annual progress of contribution to the
intermediate target from the effects of each PIP project is listed. Assessment of relevance and
effectiveness can be conducted by comparing the expected progress with the actual situation.
Completed PIP Projects: Terminal evaluation is conducted for completed PIP Projects. PIP Program
Unit tools support the evaluation through the Chronology Chart, when checking the effect of the
project in completion. For projects that are further handed over for operation, indicators of the project
effect can be compared with the operation and maintenance plan of the project, thus confirming both
the effect (positive impact) and sustainability of the project.

Manual for PIP Program Management Section II
II-21
Completed PIP Projects in Operation: PIP Program Unit tools are also useful when post evaluation
is conducted for completed PIP projects that are in operation. Indicators of project effects can be
compared with the actual operational effects.
(2) Reflection to Comparative Assessment
A Comparative Assessment Workshop is normally done among PIP projects that are in the same sector
or region. In most cases, PIP projects categorized within the same POT can be compared. In such case,
intermediate targets can be considered as the assessment criteria. Comparing the contribution of each
PIP project towards these intermediate targets in volume would be a guideline of scoring each project.
Chronology Chart is also good reference when conducting comparative assessment. By
understanding the chronological status toward the intermediate targets within the mid-term plan, the
overall direction of comparative assessment may be clarified. Coefficient rating of assessment criteria
may also be considered based on the chronological status of the 5 year plan.
PIP Maps are useful especially when comparing projects within the same region. PIP projects could
be selected based on undone areas of development or areas where further improvement is needed, as
compared to other regions and sectors.
4. Evaluation of PIP Program Units
There are 2 objectives in evaluating PIP
Program Units. The first objective is to
support the evaluation of the current SEDP,
and second is to transfer effects of PIP
projects to the new SEDP and its PIP
Program Units.
Nearing the completion of the 5-year term
for the SEDP, the SEDP needs to be
evaluated with the objective of
understanding the progress toward the 2020 target, and refer the evaluation results towards the
formulation of the upcoming SEDP for the next 5 years. Since PIP Program Units are closely related to
the SEDP, it is recommendable to conduct evaluation sessions for PIP Program Units first so that it
would be a good reference when evaluating the SEDP.
Some individual PIP projects and their effects in progress would cross over current and new SEDP
periods. These PIP projects must be identified in the process of evaluating the PIP Program Units, so
that their effects will be reflected in the new SEDP.
Evaluation of
Current SEDP
Development of
New SEDP
Formulation of
New PIP Program
Units
Transfer Ongoing Effects of
PIP Projects To New SEDP
and PIP Program Units
Transfer Ongoing Effects of
PIP Projects To New SEDP
and PIP Program Units
Evaluation of
PIP Program Units
reflection
reflection
Evaluation of
Current SEDP
Development of
New SEDP
Formulation of
New PIP Program
Units
Transfer Ongoing Effects of
PIP Projects To New SEDP
and PIP Program Units
Transfer Ongoing Effects of
PIP Projects To New SEDP
and PIP Program Units
Evaluation of
PIP Program Units
reflection
reflection
Evaluation of
Current SEDP
Development of
New SEDP
Formulation of
New PIP Program
Units
Development of
New SEDP
Formulation of
New PIP Program
Units
Transfer Ongoing Effects of
PIP Projects To New SEDP
and PIP Program Units
Transfer Ongoing Effects of
PIP Projects To New SEDP
and PIP Program Units
Evaluation of
PIP Program Units
reflection
reflection
Figure 6: Two Objectives in Evaluating PIP Program Units

Manual for PIP Program Management Section II
II-22
Evaluation of PIP Program Units is done before the formulation of the coming SEDP. Therefore, it has
to be done as soon as the final year of monitoring for the PIP Program Units is completed.
The following sub-chapters explain the procedure of evaluation for PIP Program Units.
4.1. Achievements and Progress of PIP Program Unit Targets
Before conducting evaluation, it is important to measure the previous achievements of the PIP
Program Unit. It is done by monitoring the PIP Program Units as is done annually. Since evaluation is
generally done in its final year, the results are compared with the original plans. For intermediate
targets that have not achieved its original expectations, it is highlighted for further analysis during the
evaluation session.
It is also important to observe the past progress of intermediate target achievements within the 5 years,
whether or not the targets have been achieved. They must be further analyzed during the evaluation
session.
4.2. Evaluation Through 5 Evaluation Criteria
PIP Program Units are evaluated through 5 evaluation criteria. Although the same criteria is used with
PIP project management, specific evaluation questions are different due to the different objectives at
the project and program levels. Furthermore, they are not scored or rated in the way PIP project
assessment is done. The evaluation study team provides comprehensive comments of the PIP Program
Unit based on the results. The following are the specific evaluation questions in each criterion, and
which program tool may be useful to find the comments related to the question;
(1) Relevance
Relevance is measured whether the PIP Program Unit is still relevant at the point of evaluation. In rare
cases, although the PIP Program Unit was fully relevant at the time of planning, the status may have
changed due to the changes in the surroundings (i.e. environment, policy, international relations,
economy, natural causes etc.). Therefore, it is necessary to reconfirm the status as of today. PIP
Program Unit in evaluation is studied from both the effect (SEDP) and cause (PIP projects) viewpoints.
Following are the specific points of studies.
Whether the logical structure among SEDP and the PIP Program Unit is relevant at the time of
evaluation. (POT)
Whether the logical structure between the PIP Program Unit and PIP projects are relevant at the
time of evaluation. (POT)
Whether the area coverage of the PIP Program Unit was relevant. (PIP Map)
(2) Effectiveness
Effectiveness of the PIP Program Unit is, plainly, whether the PIP program achieved its expected target.
It also ensures whether the PIP projects that were logically located have contributed to its
achievement.
Whether the PIP Program Unit was effective. Whether the PIP Program Unit achieved its

Manual for PIP Program Management Section II
II-23
expected target. (POT)
Whether the intermediate targets directly affected the achievement of the PIP Program Unit, or
has any assumptions positively/negatively affected. (POT/Chronology Chart)
(3) Efficiency
Efficiency of the PIP Program Unit is measured based on the combination of effects within PIP
projects. It measured whether their performance, combination, financial distribution, chronological
alignment and geographical distribution of PIP projects within the PIP Program Unit are efficiently
considered.
Whether the combination of PIP projects (new/ongoing/operation, domestic/ODA) were efficient
enough. (POT)
Whether performance of individual PIP project(s) have affected efficiency of PIP Program Unit.
(Chronology Chart)
Whether financial distribution among PIP projects have affected efficiency of PIP Program Unit.
(POT/Chronology Chart)
Whether the chronological alignment of PIP projects were efficient enough. (Chronology Chart)
Whether the geographical distribution of PIP projects were efficient enough. (PIP Map)
(4) Impact
Measurement of Impact is done in both positive and negative viewpoints. It is also measured whether
the PIP Program Unit had direct impact to its SEDP, and whether there were any indirect impacts to
other Program Units or SEDP topics.
(Positive Direct Impact) Whether the PIP Program Unit has affected positively to the SEDP in
subject. (POT/Chronology Chart)
(Positive Indirect Impact) Whether the PIP Program Unit has affected positively to other PIP
Program Units. (POT)
(Negative Direct Impact) Whether the PIP Program Unit has affected negatively to the SEDP in
subject. (POT/Chronology Chart)
(Negative Indirect Impact) Whether the PIP Program Unit has affected negatively to other PIP
Program Units or other areas in SEDP. (POT)
(5) Sustainability
Specifically speaking sustainability will not be a direct criterion, since the PIP Program Unit is
completed once the current SEDP has ended. However, realistically, many components of the current
PIP Program Unit would be further handed over for accomplishment, in order to achieve the long term
goal in 2020. Therefore, questions are asked whether the provision of effect is needed in both sectorial
and regional viewpoints.
Whether the PIP Program Unit has potential to continue to provide effect toward 2020 goal in;
Sectorial strategic viewpoint. (Chronology Chart)
Regional strategic viewpoint. (PIP Map)
4.3. Conclusion and Recommendations
After studying abovementioned questions, study results are compiled and provided with overall
conclusion. Furthermore, recommendations are made with the consideration of the following aspects;
As reference when conducting evaluation of the current SEDP
Guideline when setting up new goals in the new SEDP.
Reference when setting up realistic targets in the new SEDP
Manual for PIP Program Management Section II
II-24
Reference of geographical progress and its distribution for the new SEDP.
Transfer ongoing effects of the current PIP Program Unit to new SEDP and PIP Program Unit.
Obviously, PIP Program Units that have not achieved their targets are important issues to be further
discussed. Therefore, careful analysis on the issues must be done, and included in the conclusion.
Countermeasures should also be studied and provided as recommendations.
4.4. Reflection of Evaluation Results
As indicated in the beginning of this chapter, the conclusion and recommendations of PIP Program
Unit evaluation could be reflected to two aspects; one for SEDP evaluation and the other to the new
SEDP and PIP Program Unit. Following are guidelines of reflecting the evaluation results to each of
the aspects;
(1) To Evaluation of SEDP
PIP Program Units combined logically form the SEDP. However, there are still other aspects of
contribution, such as private investment or achievement of the society, of which they are combined
with PIP Program Units, form the achievement of the SEDP as a whole.
Therefore, by evaluating all PIP Program Units, it is capable to understand the direct contribution of
PIP to SEDP, as well as indirect contribution; supporting private investment and the society. Through
further analysis, sectorial and regional weight for the current SEDP can be evaluated so the
distribution of new SEDP can become reasonable.
By understanding the direct influence of PIP by sector and region toward SEDP, it would help in
formulating the new SEDP along with direct expectations from PIP contribution.
(2) To New SEDP Through Project Effects
Although a fresh target in the SEDP is set up every 5 years, some PIP project effects may take longer
terms to appear, and range over two SEDP periods. Through PIP Program Units evaluation, these PIP
projects are identified and its information is transferred to the next SEDP (and PIP Program Unit that
relates to the PIP project). This helps the start of a new SEDP implementation.
Underachieved PIP Program Units, as well as PIP projects also have to be listed, along with possible
countermeasures. These countermeasures should be considered, and it necessary, included in the next
SEDP or PIP Program Units for follow-up.

ANNEX
Examples of PIP tools in Monitor Provinces of PCAP2 Project
ANNEX1. Summary Table of development Plan Analysis
(1) Oudomxay Province
1) 5 year Provincial Socio Economic Development Plan 2006-2010-
2) 5 year Public Works and Transportation Sector development Plan 2006-2010-
(2) Khammuane Province
1) 5 year Provincial Socio Economic Development Plan (PSEDP) 2006-2010
2) 5 year Public Works and Transportation Sector development Plan 2006-2010
(3) Saravane Province
1) 5 year Provincial Socio Economic Development Plan 2006-2010
2) 5 year Public Works and Transportation Sector development Plan 2006-2010
ANNEX 2. Program Objective Tree
(1) Oudomxay Province
1) 5 year Provincial Socio Economic Development Plan 2006-2010
2) 5 year Public Works and Transportation Sector development Plan 2006-2010
(2) Khammuane Province
1) 5 year Provincial Socio Economic Development Plan (PSEDP) 2006-2010
(3) Saravane Province
1) 5 year Provincial Socio Economic Development Plan 2006-2010
2) 5 year Public Works and Transportation Sector development Plan 2006-2010
(4) Ideal Structure of POT
ANNEX 3. Chronology Chart
(1) Oudomxay Province
1) 5 year Public Works and Transportation Sector development Plan 2006-2010
(2) Saravane Province
1) 5 year Public Works and Transportation Sector development Plan 2006-2010
ANNEX 4. Mapping
(1) Oudomxay Province
5 year Public Works and Transportation Sector development Plan 2006-2010
(2) Khammuane Province
5 year Public Works and Transportation Sector development Plan 2006-2010
(3) Saravane Province
5 year Public Works and Transportation Sector development Plan 2006-2010
Note: The PCAP study team could not obtain the theoretical document of 5 year Public Works and Transportation Sector Development Plan 2006-2010 in Khammuane Province, except project list. Therefore, this manual could not prepare Program Objective Tree and Chronology Chart of the plan in Khammuane province.

Long term development
directions
(1). Share of agriculture and forestry cover 42%, (2). industry covers 28%, and (3). services covers 30%
(1). Agriculture and forestry grows by 7%, (2). Industry grows by 12-13% and (3). service sector grows by 10-11% of PGDP
(1). Adult literacy rate of people aged 15-40 reaches 80% by 2000
(2). School-age children enrollment rate reaches 75%
(3). Life expectancy reaches 56 for men and 58 for women
3
Mid-term development
strategy in the 10 years plan
for 2010
Mid-term (10 years)
development directions, macro
indicators and target and tasks
(1). Agriculture and forestry grows by 1.5time, (2). Industry grows 28.8% and (3). service sector grows 21% of PGDP compared to 2005
(1). Share of agriculture and forestry covers 41%, (2). industry covers 30% and (3). services covers 25%
(1). Adult literacy rate of people aged 15-40 reaches 100%
(2). 95% of children aged 6-10 will be able to access to school
(3). Life expectancy approximately 66 years
(4). Complete eradicating basic poverty by 2010
* It is confirmed by Department of Planning and Investment of Odomxay Province, February 24, 2009
4. The mid term review at 2.5 years of 5-year plan: Summary of the Implement of the 6th 5-year Socio-economic Development Plan from
2005-2007 of Oudomxay Province (DPI of Oudomxay, issued date: August, 2008)
2. The 10-year plan by 2010: The 10-year SEDP Development Plan in Oudomxay province was not available for the study team*
5. The annual plan: The Socio-economic Development Plan for 2008-2009 of Oudomxay Province (DPI of Oudomxay, issued date: September
29, 2008)
ANNEX
Examples of PIP tools in Oudomxay, Khammuan and Saravan Provinces
ANNEX1. Summary Table of Development Plan Analysis
(1) Oudomxay Province
5. It is estimated that the total financing from 2001-2020 would be 900 billion kip of which the public investment is 800 billion kip and 100 billion
kip from bank credits, the private domestic and foreign investment and etc
1) 5 year Provincial Socio-Economic Development Plan (PSEDP) 2006-2010
No Topic Analysis points Contents
1 Composition of existing plans
1. The 20-year strategy by 2020: Socio-Economic Development Plan Now-2000 an Now -2020 of Oudomxay Province (Department of Planning
and Cooperation, issued date: 5/3/1999)
3. The 5-year plan by 2010: (Draft) The 6th 5-year of Socio-economic Development Plan (2006-2010) of Oudomxay Province (DPI of
Oudomxay, Issued date: 12/1/2009)
Plan Targets and Tasks
5 years development directions
1. Economic Development
2. Socio-Development
The plan was not available for the study team*
To develop socio-economic continuously. Agriculture and forestry, industry, and services production grow 2-3 times compared to current time.
Upgrade living standard of ethnic people and escape from basic poverty. Education, health, culture, labor and social welfare will be developed.**
To expand the Resolutions of the Central Party Congress VI and of the Provincial Party Committee IV and V by interpreting the plan into
programs and projects based on the 8 national priority programs
Macro indicators
1. PGDP per capita is $2000, and annual average economic growth 9-10%
2. Annual Revenue collection will be 12-13% of PGDP
3. Low inflation based on the actual capability
4. Achieving the objectives and targets of the socio-economic development requires the annual investment as equivalent to 30-35% of GDP of
which the public investment should not be less than 14% of GDP.
There are 3 priority focal areas for development in provincial level including (1). Nambak, Xay district; (2). Nahome, Bang district; and (3).
Namka, Houn district.
There are 7 priority focal areas in district level including (1). Namhang, Xay district; (2). Tardmouan, La district; (3). Namsetai, Namor district;
(4). Houingouan, Nga district; (5). Namkon, Bang district; (6). Namphoun, Houn district; and (7). Namkong, Parkbang district.
Overall development strategy
in the 20 year strategy
5 years development strategy
for 2010
Plan Targets and Tasks
5Thematic and cross cutting
areas in the 5 years plan
4
Multi-sectorial and cross
cutting issues related to overall
and sectorial targets such as
poverty reduction
6Regional development in the 5
years plan
Target region, principle and
goals on development in the
region
Macro indicators
1. PGDP will be 2,016.33 billion kip, PGDP per capita is $640, Annual economic growth is 16.6%,
2. Annual Revenue collection will be 3.5-4% of PGDP
Did not mention in the plan
1. Economic Development
2. Socio-Development
2
1

3
Mid-term development strategy
in the 10 years PWT sector plan
by 2010
Mid-term development goals by
2010
1 Communication plays an important role on accessing production areas and village groups for development throughout the province.
2 To reduce no. of villages without road access
3 To solve poverty problem and facilitate other sectors development
1 To have better facilitate on tourism development, traveling and contacting to each other
Did not mention
1 Try to develop urban areas in all aspects
1 To have better promote and manage these activities, the district will grow well
2) 5 year Public Works and Transportation Sector Development Plan 2006-2010
No Topic Analysis points Contents
5
Thematic and cross cutting
areas in the 5 years PWT sector
plan
Multi-sector and cross cutting
issues related to overall and
sector targets such as poverty
reduction
Did not mention
* Communication:
* Transportation
1 Composition of existing PWT sector plans
1. The 20 year strategy by 2020: Communication, Transport, Post and Construction Sector Development Plan from 2008-2015-2020
(Department of CTPC issued date: ….)
2. The 10-year Plan by 2010: The 10-year development plan until 2010 was not available for the study team*
3. The 5-year Plan by 2010: (Draft) the Implementation of the Socio-economic Development Plan from 2001-2005 and the Plan for 2006-2010 (
Department of Communication, Transport, Post and Construction, issued date: April 5, 2005)
4. Mid-term review of the 5 year plan: There have not been combined yet. There are only by sub-sectors review. Confirmed by Department of
PWT Sector, February 24, 2009
5. Annual Plan: Summary of the Implementation of Socio-economic Development Plan for 2007-2008 and the Plans for 2008-2009 (Department
of PWT, issued date: September, 2008)
6. The 5-year Priority Plan by 2010: (Draft) the Priority Plan for Public Works and Transport Sector Activities during (2006-2010) of
Oudomxay Province (Updated version, January 2008) (Department of Public Works and Transport, issued date: January 2008)
2
Overall development strategy in
the 20 year PWT sector plan by
2020
Long term development
directions
1. To expand the Resolutions of the Central Party Congress VIII and directions of the Provincial and Ministry of Public Works and Transport by
continuing develop communication to access to focal areas of province and districts.
2. Facilitate other sectors development especially food production, health, education, and other sectors to reduce poverty
Long term macro indicators
(1) Tarred roads reach 30%, (2) laterite-paved roads reach 70%, (3) construct 10 bridges; (4) Construct tarred roads in urban planning areas 70%
and (5) Pave laterite in urban planning areas 100%
(6) To complete constructing bus stations in all districts
(7) Construct waste disposal areas in all districts
The plan was not available for the study team*
45 years development strategy in
PWT sector by 2010
5 years development goals by
2010
1. To expand the Resolutions of the Central Party Congress VI and of the Provincial Party Committee and the directions and targets of Ministry of
Transport and Public Works. TPW development is contribute strongly to poverty reduction and facilitates other sectors development especially on
socio-economic development
5 years macro indicators by 2010
1. Roads access to villages for 70% (usable for 2 seasons) and 80% (usable for 1 season) of all villages.
2. Construct 2 post offices
3. Inland transportation for goods and passengers reach 33,712tons and 27,748 people; Water transportation for goods and passengers reach 8,442
tons and 38,189 people; and Air transportation for goods and passengers reach 16.98 tons and 7,250 respectively
* Urban Planning and Water Supply
* Housing, Company Management and Construction Techniques
6
Objectives of (PWT) sector and
sub-sectors* Post and Telecommunication
Sectorial and Sub-sectorial
Development in the 5 years
PWT sector plan
2

1. Construct and upgrade national roads and bridges
2. Construct and upgrade provincial, district and rural roads and bridges
3. Maintain the existing roads and bridge
4. Play attention on water communication and airport to be able to use regularly
1. Construct 1 public transportation facility (station)
2. Open public transportation route to Vietnam
3. Improve public transportation association in 7 districts
1. Expand post offices and service unit to focal areas
2. Improve post services including saving
3. Expand tele. system to each district and to focal areas that have condition
4. Install fiber optic cable in 5 districts
1. Install light along the provincial roads
2. Establish waste management unit in each district
3. Construct water supply system in 2 districts
4. Construct roads in 7 districts urban planning areas
5. Expand and upgrade road in urban planning areas
6. Constrctu tarred roads in provincial capital
7. Construct waste disposal area
1. Improve construction management
2. Manage private construction
3. Support the local arts
4. Manage producing and importing construction materials
Connection of the above goals
with cross cutting areas and the
other sectors
* Confirmed by PWT Department, February 24, 2009
* Transportation
* Post and Telecommunication
* Urban Planning and Water Supply
Goals of sub-sectors in PWT
sector
* Communication:
* Housing, Company Management and Construction Techniques
To facilitate other socio-economic sectors development
7Regional development in the 5
years PWT sector plan
Target region, principle and
goals on development in the
region
Development areas and village groups for development
6
Sectorial and Sub-sectorial
Development in the 5 years
PWT sector plan (continued)
3

Long term development
direction
By 2020, (1). the share of Agriculture and Forestry will cover 25%, (2). Industry and Handicraft will cover 45.63% and (3). Services
sectors will cover 28.63% of GDP
By 2010, (1). 100% of total urban population and (2). 65% of highland population will have access to clean water
3
Mid-term development
strategy in the 10 years plan
for 2010
Mid-term (10 years plan)
development directions, macro
indicators and target and tasks
5 years development directions
* Share of (1). Agriculture and Forestry covers 47.6%, (2). Industry covers 32.9%, and (3). services covers 19.5% of GDP
* Increase productivity of (1). agriculture and forestry to 6%, (2). industrial and handicraft to 9.9%, and (3). services to 10.2%
(1). Primary school enrollment rate reaches 95% and (2). dropout rate decreases to 2%
* Confirmed by department of planning and investment of Khammouan province on February 24, 2009
3Mid-term development strategy
in the 10 years PWT sector plan
Mid-term (10 years by 2010)
development goals
5 years macro indicators by 2010
Objectives of (PWT) sector and
sub-sectors
Goals of sub-sectors in PWT
sector
Connection and relation of the
target sectors to objective sector
analysis
* Confirmed by Department of PWT of Khammouan
** Only the projects' list is existed (Department of Transportation and Public Works of Khammouan Province, issued date: 29/1/2009)
(2) Khammuan Province
1) 5 year Provincial Socio Economic Development Plan (PSEDP) 2006-2010
No Topic Analysis points Contents
1 Composition of existing plans
1. The 2020 Plan: The report of Master Plan for Socio-economic Development of Khammouan Province from 1998-2020 (Committee for
Planning and Investment, Planning Department, issued date: 12/1998)
2. The 10 years plan by 2010: The 10 years SEDP Development Plan in Khammuan province was not available for the study team*
3. The 5 Year Plan by 2010: Summary of the 5 years Socio-economic development (2000-2004) and the Socio-economic Development Plan until
2010 of Khammouan Province (Issued date: ……...)
4. The 2.5 Year Plan: Mid-term Review of Socio-economic Development Plan for 2006-2010 of Khammouan Province (Department of Planning
and Investment, issued date: …..)
4. Public investment will be 25-30% of PGDP
Plan Targets and Tasks
1. Economic Development
2. Culture and Social Development
5Thematic and cross cutting
areas in the 5 years plan
Multi-sectorial and cross
cutting issues related to overall
and sectorial targets such as
poverty reduction
1. Expected that Foreign Investments in Khammouan will be about 1,428 million, domestic investments (private) will be about 370.85 billion kip
5. The Annual Plan: The Implementation of Socio-economic Development Plan for 2007-2008 and the Plan for 2008-2009 of Khammouan
Province (Department of Planning and Investment of Khammouan Province, issued date: ….)
2Overall development strategy
in the 2020 Plan
Reduce poverty and eradicate hunger
Macro indicators
(1). PGDP is $510 by 2010, (2). $1208 by 2020; (3). During 2001-2010, PGDP grow 11-12% and (4). During 2010-2020, PGDP will grow 9-
9.5%; (5). The average of GDP per capita is $922-1033/person/year by 2010 and (6). $1791-2015/person/year by 2020
7.) To earn revenue 18-19% of PGDP by 2010 and 8.) 20-21% of provincial GDP by 2020
Plan Targets and Tasks
1. Economic Development
2. Culture and Social Development
The 10 Year Socio-economic Development Plan was not available for the study team*
4 5-year Development Strategy
To reduce poverty
Macro indicators
1. PGDP 1931,4billion kip, PGDP per capita meet $400-450
2. Annual average economic growth rate 8-10%
3. Annual revenue collection will be 70 billion kip or over 10-12% of provincial GDP
2. Eradicate poverty by 70% of total poor households in mountainous area and 95% of poor households in flatland areas by investing in 69
projects including infrastructure development.
3. Promote science and technology
6Regional development in the 5
years plan
Target region, principal and
goals on development in the
region
1. Flatland (18.7%) covers Hinboun, a part of Naikai and Yommalard districts. These areas are suitable to plant crops, trees, raise livestock and
big industries.
2. Plateau area (46.3%) covers Thakak, Nongboke, Sebangfai, Xaybouathong and a part of Hinboun. These areas are suitable for agriculture
(crops and livestock) especially rice and short-life crops
3. Highland area (35%) covers Boualapha, a part of Yommalard and Nakai districts. These areas are suitable for planting fruits, long-term
commercial trees, raising big livestock
4. The 2.5 years plan: the Mid-term Review of the Implementation of Socio-economic Development Plan of PWT Sector of Khammouan
Province (Department of PWT, issued date: August 28, 2008)
Was not available for the study team
Was not available for the study team
Was not available for the study team
5
Thematic and cross cutting
areas in the 5 years PWT sector
plan
Multi-sartorial and cross cutting
issues related to overall and
sartorial targets such as poverty
reduction
Was not available for the study team
5. The annual plan: Summary of the Implementation of Socio-economic Development Plan the first half of 2007-2008, expect for the second half
of 2007-2008 and the plan for 2008-2009 of PWT sector (Department of PWT, issued date: March 27, 2008)
2) 5 year Public Works and Transportation Sector Development Plan 2006-1010
Topic Analysis points Contents
2Overall Development Strategy in
the 2020 Strategy Plan
Long term development direction
Was not available for the study team
Macro indicators
1 Composition of existing PWT sector plans
1. The 20 year strategy by 2020: was not available for the study team*
2. The 10-year Plan by 2010: was not available for the study team*
3. The 5-year plan by 2010: was not available for the study team except only draft projects' list **.
7 Regional developmentTarget region, principle and
goals on development in the
region
Was not available for the study team
Was not available for the study team
45 years development strategy in
PWT sector
5 years development goals by
2010Was not available for the study team
Was not available for the study team
6
Sectorial and Sub-sectorial
Development in the 5 years
PWT sector plan
4

Long term development
direction
* The share of : 1). Agriculture and Forestry covers 52%, 2). Industry and Handicraft covers 20%, and 3). Services sectors covers 26% of
GDP
1). Develop Human Capacity to be better than current time 80%, to meet 100% of literate
2). To ensure the social security
3
Mid-term development
strategy in the 10 years plan
for 2010
Mid-term (10 years)
development directions, macro
indicators and target and tasks
5 years development directions
* The share of (1). Agriculture and Forestry covers 52,38%, (2). Industry and Handicraft covers20.72%, and (3). Services sectors covers
26.9% of PGDP
* To focus on human resource development. (1). 90% of school-age children can access to school. (2). Adult literacy (Aged 15-48) rate up
to 95%
* (1).The life expectancy will be at least 66-70 years, (2). Mortality of children under 5 will be reduced from 96.6/1000 live births (2000) to
70/1000live births (2010) and (3). Infant mortality will be reduce from 75.8/1000 live births (2000) to 50/1000 live births (2010)
(1). Saravane district (11 village groups, 167 villages), each village group has to complete village development 40% of all villages in the
group
(2). Laongam district (8 village groups, 112 villages), each village group has to complete village development 50% of all villages in the
group
(3). Kongxedone district (9 village groups, 107 villages), each village group has to complete village development 50% of all villages in the
group
(4). Lakhonepheng district (8 village groups, 90 villages), each village group has to complete village development 50% of all villages in the
group
(5). Vapy district (6 village groups, 65 villages), each village group has to complete village development 40% of all villages in the group
(6). Toumlan district (7 village groups, 67 villages), each village group has to complete village development 30% of all villages in the group
(7). Taoy district (10 village groups, 56 villages), each village group has to complete village development 30% of all villages in the group
(8). Samuay district (8 village groups, 58 villages), each village group has to complete village development 30% of all villages in the group
1. Flatland areas for development covers 5 districts (Saravane, Khongxedone, Lakonepheng, Vapy and Toumlan districts) which focus on
(1) Planting rice, (2) industrial crops and (3) trees, (4) raising small livestock, (5) promoting handicraft and (6) tourism
2. Plateau areas for development covers Laongam district, part of Saravane, Khongxedone, and Vapy districts which focus on (1) planting
industrial trees and (2) long-term and short-term crops; (3) Establishing agro-processing industries
3. Highland (Mountainous) area covers 2 districts (Taoy and Samuay districts) which focus on (1) Planting commercial trees and crops; (2)
raising big livestock, (3) Promoting eco-tourism including ethnicity, historical objects, and natural tourist sites; (4) upgrade services, trade
and investment along Lao-Vietnam border; (5) develop communication and telecommunication sector, and human resource
* Confirmed by department of planning and investment of Saravane Province on February 24, 2009
1 Composition of existing plans
1) 5 year Provincial Socio Economic Development Plan (PSEDP) 2006-2010
Plan Targets and Tasks
1. The 20 years strategy by 2020: (Draft) The Strategy Plan for Socio-economic Development of Saravane Province from 2001-2020
(Department Planning and Investment of Saravane Province, issued date: 24/10/2001)
2. The 10 years plan by 2010: The 10 years SEDP Development Plan in Saravane Province was not avaolable for the study team*
3. The 5 Years Plan by 2010: Report of the Implementation of the 5th 5 Years Socio-economic Development and the 6th 5 Years of Socio-
economic Development Plan (2006-2010) of Saravane Province (Department of Planning and Investment of Saravane Province, issued date:
12/2006)
4. The mid term review at 2.5 years of 5 years plan The Report of Mid-term Review of the Six 5 Years of Socio-economic Development (2006-
2008) and the plan for 2008-2010 (Department of Planning and Investment of Saravane Province, issued date: …2008)
No Topic Analysis points Contents
5. The Annual Plan: Summary of the Implementation of the Socio-economic Development Plan for 2007-2008 and the plan for 2008-2009 (
Department of Planning and Investment of Saravane Province, issued date: October 27, 2006)
2Overall development strategy
in the 20 year strategy
1. By 2020, The living standard level of people in Saravane Province will be 3 times better than living standard of people in 2005
Macro indicators
1. To increase provincial GDP up to 3.332.9 billion kip, annual economic growth on average 9-10% and the average of GDP per capita is $960-
1000/person/year
2. To invest in Economic sectors 50%, culture and social sectors 30% and other sectors 20%
3. To invest in (1). flatland areas 25%, (2). Plateau areas 25%, (3). highland areas 20%, (4). border areas 15% and (5). urban areas 15%
4. Annual revenue collection 12-15% of PGDP
1. Economic Development
2. Culture and Social Development
The 10 Year Socio-economic Development Plan is no existence, it was confirmed by Department of Planning and Investment, March 2009.
45 years development strategy
for 2010
1. By 2010, The living standard level of people in Saravane Province will be 3 times better than living standard of 2005
Macro indicators1. To increase Provincial GDP on average 9-10% /year, GDP per capita meet $800
2. To earn revenue up to 70 billion kip/year which is equal to over 15% of provincial GDP
Plan Targets and Tasks
6Regional development in the 5
years plan
Target region, principle and
goals on development in the
region
Dividing focal regions for development which depend on location, real potential of each region, technique, budget from each sector (domestic and
ODA), Saravane was divided into three focal region for development:
1. Economic Development
2. Culture and Social Development
5Thematic and cross cutting
areas in the 5 years plan
Multi-sartorial and cross
cutting issues related to overall
and sartorial targets such as
poverty reduction
1. Focal village groups for Economic, culture and social development including 67 village groups in 8 districts; namely
2. From 2006-2010, the province must complete eradicating poverty of the entire 106 poor villages and releasing households' poverty at least 80%
of total households
(3) Saravane Province
5

Long term development direction
3
Mid-term development strategy
in the 10 years PWT sector plan
by 2010
Mid-term development goals by
2010
5 years macro indicators by 2010
1 Continue implementing the 5-year socio-economic development plan (2006-2010) of the Party Committee
2 Continue follow all instructions of the higher level and create Marco-management work plan
3 To have seminar on political thinking to CTPC staff to be strongly aware of policies and become senior staff
4 To review, plan, and implement short-term and long-term CTPC development plan
5 To review and follow the laws and regulation on CTPC activities correctly and appropriately
6 To have wide cooperation between internal and external
7 Cooperate with ministry, international organizations to attract development fund to have more CTPC activities
8 To follow up, inspect, manage on collecting technical and service charge revenues correctly and on time
1 Communication play an important roles on facilitate other works to grow, therefore, communication should be expanded more quickly
2To have better Marco management by dividing clear tasks between provincial and district level (province is strategy unit and district is
planning unit)
3 To make Saravane province to have a way access to the sea and to have more convenient and faster trading with Vietnam and Thailand
4 To reduce poverty of ethnic people especially people who live in mountainous and remote areas and increase provincial revenue year by year
1 Improve transportation for goods and services (passengers) to have access to all district municipalities and to focal areas for development
2 To have suitable service charge management
3 Improve searching, arranging and keeping systems of vehicles' documents and strictly prevent documents from any losses and damages.
4 Restrict on the regulations and declarations of MCTPC on importing all types of vehicles.
5 Collecting and seeking for revenue on time and correctly
1 To make post and telecommunication access districts through out the province and extend to focal areas for development
2 Concentrate on improving post and telecommunication services.
1 Pay attention on housing management in some districts
2 Manage annual price per unit of construct building
3 To have better urban areas development (Saravane district)
4 To cooperate with MCTPC to attract urban development project to develop Saravane district
1 Expand water supply network to cover 90% of urban areas and plan to expand to one more district that has possible condition
2 Cooperate with public health sector to expand water-shed system in 2 district that have possible condition
3 Encourage and support provincial water supply state-own enterprise to have self-sufficiency in term of finance
1 Cooperate with MCTPC to construct and improve national road in Saravane area which make it useable for 2 seasons
2 Concentrate on constructing and repairing roads between provinces and districts (8 districts) to be useable for 2 seasons
3Concentrate on constructing roads and bridges including for big vehicles to be usable for 2 seasons covering 337 villages and usable for 1
season covering 198 villages
4Continue conducting survey-design to ask for approval to construct Tarred roads with length of 299km including national roads 220km,
provincial roads 46k, municipal roads 17km, and specific roads 16km
5 Propose to conduct survey-design for constructing 2 new roads (new arrival) with length of 43km
5. The annual plan: Summary of the Implementation of PWT Sector Development Plan for 2007-2008 and the Plan for 2008-2009
6. The priority Plan: The Priority Plan of Public Works and Transport Sector Development during 2006-2010 (Updated version, January 2008)
(Department of PWT of Saravane Province, Issued date: 1/2008)
2) 5 year Public Works and transportation Sector Development Plan 2006-2010
No. Topic Analysis points Contents
2
Overall development strategy in
the 20 year PWT sector plan by
2020
The plan was not available for the study team*
Long term macro indicators
1 Composition of existing PWT sector plans
1. The 20 year strategy by 2020: The 20 years strategy by 2020 was not available for the study team except only the projects' list of
Infrastructure Development Plan of PWT until is existed (Department of PWT of Saravane Province, no. 1581, issued date: 9/2008). *
2. The 10-year Plan by 2010: The 10 years development plan until 2010 was not available for the study team*
3. The 5-year plan by 2010: The 5 yeas Strategy Plan for Public Works and Transport Sector Development from 2006-2010 of Saravane
Province (Department of CTPC of Saravane Province, issued date: 5/2006)
4. Mid-term review of the 5-year plan: The Summary of the Implementation of Public Works and Transport Sector Development Plan for 2006-
2010 (Mid-term Summary) (Department of PWT of Saravane Province, issued date: February 2007)
No existence, it is confirmed by Department of PWT of Saravane Province on Febuary 24, 2009
45 years development strategy in
PWT sector
5 years development goals by
2010
Continue to develop communication network to reduce poverty of ethnic groups especial in highland and facilitate other activities related to
national socio-economic development
Did not mention
45 years development strategy in
PWT sector by 2010Overall directives by 2010
5
Thematic and cross cutting
areas in the 5 years PWT sector
plan
Multi-sector and cross cutting
issues related to overall and
sector targets such as poverty
reduction
Did not mention
6
Objectives of (PWT) sector and
sub-sectors
* Communication:
* Transport and Vehicles Management
* Post and Telecommunication
* Housing and Urban Planning
* Water Supply
* Communication:
Sectorial and Sub-sectorial
Development in the 5 years
PWT sector plan
Goals of sub-sectors in PWT
sector
6

1Continue improving inland transportation for goods and upgrade technical standard of vehicles by constructing 1 truck station and
establishing truck association between Lao-Vietnam and Lao-Thai borders for 1 company
2 Continue improving inland transportation services to be more convenient and safer
3Improve water transportation for goods and passengers in Kangkhonglouang-Thailand check point to have big ships for caring 3-6 tons
goods and ships for passengers must have rescue cloth
4 Encourage weight measurement staff to strict on the rules
5 To propose to MCPTC to Construct 2 modern weight measurement check points
Continue implementing vehicles and traffic management such as:
1 To complete changing new no. plates by 2006.
2 To have better manage registered no license, prevent them from being faked, and ensure faster services
3 Continue to improve driving school
4 Continue to inspect and follow up using walkie-talkie illegally
1 Continue to improve post system to be faster and ensure preventing any losses and damages
2 Expand post network to 3 mountainous districts
3 Open Western Union money transfer between countries
1 Increase 512 no. for telephone center for Saravane provincial capital
2 Increase 1,024 phone no. in 2 districts
3 Install call center 512 no. and wireless 800no. in Lakonpheng district
4 Install wireless phone for 800 no. in Toumlane district
1 Install home phone in 3 highland districts for 72 no. and mobile phone for 900 no.
1 Increase cable for 3 districts with length of 12,500m
2 Install Fiber Optic Cable from Km 21, road to Parksong to Saravane district
1 Install 4 public phone boxes in 4 districts
1 Run electricity line to Tongkam village, Laongam district and install 75 kw automatic electric machine
2Construct fence and parking lot for provincial telecommunication office and construct telecommunication office in Toumlan and Taoy
districts
1 Pay attention on managing, monitoring, and observing houses' construction prices, quality, and technical standard
2 Collecting the actual price annually to control the central price and improve construction companies to follow the MCPTC's standard
3 Prepare establishing Association of Architect and Construction Engineer
1 Concentrate on establishing urban planning for 3 districts covering 950 ha
2 Encourage investors from several sectors to make the concession on waste disposal in 4 districts
3 Establish management and urban development (outside Saravane district municipality) committees
1Construct Tarred roads with length 4000m, pave DBST on the existing tarred road with length 2000m, and construct drainage system with
length 500m
2 Construct roads a long river with length 2500m
3 Construct 2 parks
4 Construct waste disposal areas 5000 ha
5 Install roadsides light 7000m (only for Tarred roads)
6 Arrange one village model for sector wide development
7 Manage constructing buildings in urban areas by basing on urban planning that has been set
1 Propose budget for conducting survey-design water supply system in 2 districts
2 Cooperate with health sector to expand water-shed in 2 highland districts
3 Support and manage project for constructing water supply system in rural areas (only possible areas)
4 Continue expanding the existing water supply system in urban areas to reach 90% and control waste water for 15%
5 Encourage and strengthen provincial water supply state-own enterprise to become self-sufficiency in of term of financial support
Connection and relation of the
target sectors to objective sector
analysis
6
* Urban Planning
* Telecommunication
# Basic Telephone Center and Wireless Phone Project (CDMA)
# Project of Installing Rural Home Phone and Mobile Phone
# Installation of Cable and Fiber Optic Cable project
* Transportation:
* Vehicles and Traffic
* Post
Regional development in the 5
years PWT sector plan
Target region, principle and
goals on development in the
region
Did not mention
# Installation of Public Phone Boxes Project
# Installation of Households Electricity and Construct buildings
*Housing
Sectorial and Sub-sectorial
Development in the 5 years
PWT sector plan (continued)
Goals of sub-sectors in PWT
sector (continued)
* Confirmed by PWT Department, February 24, 2009
* Saravane District Development
* Water Supply
To facilitate other activities related to socio-economic development
7
7

1
ANNEX 2. Program Objective Tree
(1) Oudomxay Province
1) 5 year Provincial Socio Economic Development Plan 2006-2010
*Economic Sectors Development
(1). PGDP = 2,016.33 billion kip, (2). Annual economic growth rate is 16.6%
(3). Share of Agriculture and Forestry is 41%, (4). Industry is 30.20%, and (5). Services is 5% of GDP
Increase agriculture
and forestry products 1.5
time compared to 2005
Invest in 38 projects
with the cost of
97,440.86 million
kip
Increase industrial
products 28.8%
compared to 2005
1). Develop electricity
system to 150-200 MW
2). Promote medium and
small industries
3). Improve productivity of
Handicraft
Invest in 8 major
projects with the cost
of 5,250 million kip
Increase services
21% compared to 2005
1). Stop slash and burn
cultivation and reduce
poverty
2). produce
commercial products
3). Promote stable
agriculture and raising
livestock
Invest in 53 projects
with the cost of
521,265 million kip
Public Works
and Transport
Development
Trade
Development Tourism
Development
Finance and
Banking
Development
1). Develop roads from
provincial municipality to focal
and community areas
2). Construct small roads from
villages to provincial roads
3). Construct bridges
4). Install fix phone and post
boxes in some villages and etc
5). Complete upgrade urban
planning in each village
6). Water supply to big city
7). Upgrade quality of inland,
water, and air transportations
1). Expand
trade network
2). Construct
duty free zone
3). Balance
between import
and export
1). Improve
tourism
services, tourist
sites
2). Increase
capability of
tourist guides.
1). Increase PIP
investment and
private investment
for 6% and 9 % of
PGDP
2). Encourage more
saving and
borrowing
Invest in 27 projects with the cost of
24,147.1 million kip
Invest in 13
major
priority
projects

2
Education Health Information
and Culture
Labor and
Welfare
* Social and Culture Sectors Development
(1). Control population growth rate on average not more than 2.4% per year
and to have life expectancy 66 years
(2). 95% children aged 6-10 will be able to get into schools
(3). Adult literacy rate of people aged 15-40 will be 100%
(4). Reduce basic poverty by 2010
1). Train 75% of all
teachers
2). 90% of children
aged 6-10 have access
to primary schools
3). 100% of staff
graduated from high
school and etc.
1). Expand health care
network
2). Try to install medical
boxes in most of village
3). Reduce infant mortality
to 45/1000
4). To ensure vaccines for
children and women and
etc.
1). Improve information
and culture network
2). Promote national
culture
1). Helpless opportunity
people
Invest in 16 projects
with the cost of 33,353
million kip
Invest in 25 projects
with the cost of 39,864
million kip
Invest in 21 projects
with the cost of 10,383
million
Invest in 21 projects
6,329 million kip
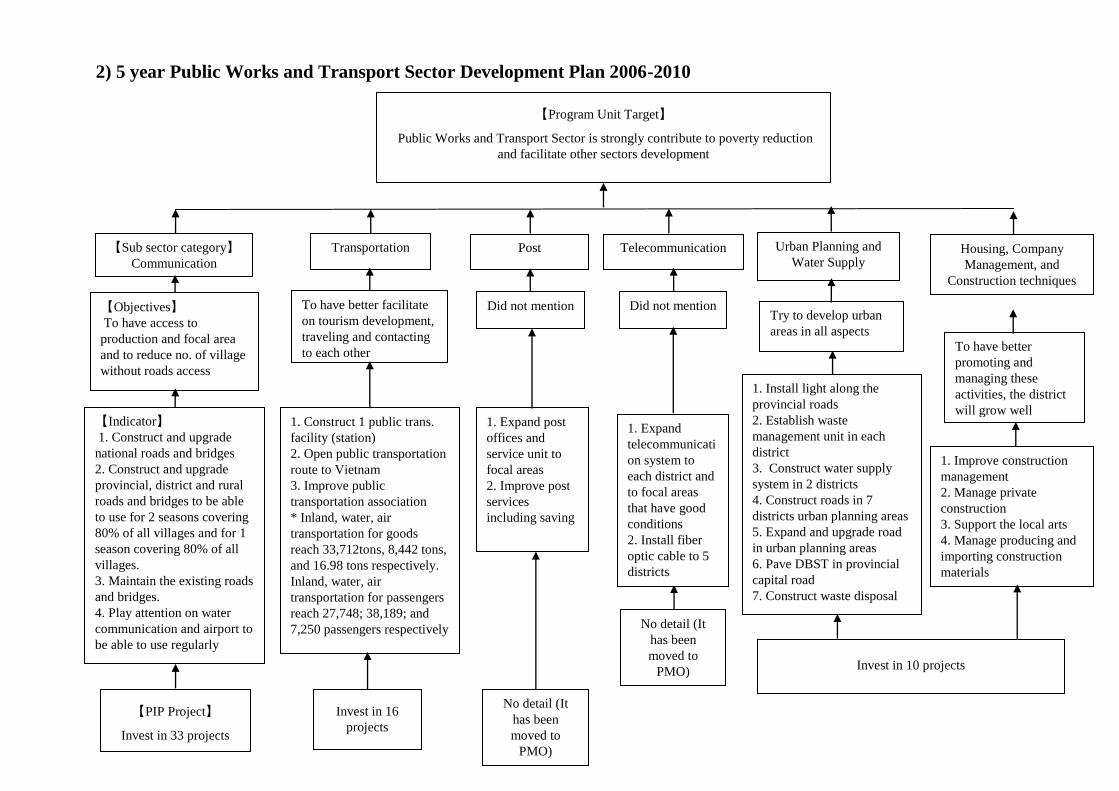
3
2) 5 year Public Works and Transport Sector Development Plan 2006-2010
【Indicator】
1. Construct and upgrade
national roads and bridges
2. Construct and upgrade
provincial, district and rural
roads and bridges to be able
to use for 2 seasons covering
80% of all villages and for 1
season covering 80% of all
villages.
3. Maintain the existing roads
and bridges.
4. Play attention on water
communication and airport to
be able to use regularly
1. Improve construction
management
2. Manage private
construction
3. Support the local arts
4. Manage producing and
importing construction
materials
To have better
promoting and
managing these
activities, the district
will grow well
【Program Unit Target】
Public Works and Transport Sector is strongly contribute to poverty reduction
and facilitate other sectors development
【Sub sector category】
Communication
Post Telecommunication Urban Planning and
Water Supply Housing, Company
Management, and
Construction techniques
Transportation
1. Construct 1 public trans.
facility (station)
2. Open public transportation
route to Vietnam
3. Improve public
transportation association
* Inland, water, air
transportation for goods
reach 33,712tons, 8,442 tons,
and 16.98 tons respectively.
Inland, water, air
transportation for passengers
reach 27,748; 38,189; and
7,250 passengers respectively
【PIP Project】
Invest in 33 projects
Invest in 16
projects
1. Expand post
offices and
service unit to
focal areas
2. Improve post
services
including saving
Try to develop urban
areas in all aspects
1. Expand
telecommunicati
on system to
each district and
to focal areas
that have good
conditions
2. Install fiber
optic cable to 5
districts
1. Install light along the
provincial roads
2. Establish waste
management unit in each
district
3. Construct water supply
system in 2 districts
4. Construct roads in 7
districts urban planning areas
5. Expand and upgrade road
in urban planning areas
6. Pave DBST in provincial
capital road
7. Construct waste disposal
area
【Objectives】
To have access to
production and focal area
and to reduce no. of village
without roads access
To have better facilitate
on tourism development,
traveling and contacting
to each other
Did not mention Did not mention
No detail (It
has been
moved to
PMO)
No detail (It
has been
moved to
PMO) Invest in 10 projects

4
(2) Khammouan Province
1) 5 year Provincial Socio Economic Development Plan (PSEDP) 2006-2010
(PIP Project)
Invest in 2 major
projects
(Indicators) Rice
output meets
272,530 tons/year
(Sub sector)
Planting
Forestry
Irrigation
Electricity
Processing
industries
Handicraft
Reduce slash
and burn
cultivation and
plant trees
10,000-
15,000ha
Supply water in
dry season for
26,000 ha
85% of total
population will
be able to have
access to
electricity
Focus on agro-
processing and
wood
processing
industries
Increase
handicraft
products to
15%/year
Support mining
industries and
constructing
Cement
industry
Livestock and
Aquaculture
Increase no. of
livestock: 100,000
buffaloes, 80,000
cows, 150,000 pigs,
12,000 goats, 800,000
poultry and supply fish
to markets reaches
9000-10,000 tons /year
Invest in 3 major
projects
Continue invest
in 10 projects
that have not
been done
Focus on 2
major projects
(SPRE 1 and
SPRE 2)
Mining
Did not mention
about any
program or
project
Did not mention
about any
programs or
projects
Did not mention
about any
program and
project Invest in 4 major
projects
【Development goal】1. Poverty reduction. 2. Political stability and social security
【Thematic and
Cross Cutting
Issues】
【Macro Indicator& Overall Target of Economic Sector】】
(1). PGDP = 1,931.32billion kip
(2). Share of Agriculture and Forestry 47.6%,
(3). Industry is 32.9%, and
(4). Services is 19.5% of PGDP
【Indicator by main sectors】
Increase agriculture and forestry
productivities 6%/year
Increase industrial productivities
on average 9.9% /year
Increase services
10.2%/year
【Macro Indicator& Overall Target of Social
Sector】
(1). Primary school enrollment rate reaches 95%.
(2). Dropout rate decrease to 2%

5
Invest in 16 major
projects*
Did not mention
about any
programs or
projects
PWT Trade and
tourism
Banking and
Finance
1. 85% of provincial capital and
focal areas for development have
road access and 65% of highland
areas have road access.
2. Expand and develop urban
planning and water supply system
3. Expand telecommunication
system.
1. Export
$103,264
million; import
$96,302 million
2. Increase no.
of tourists to 9-
10%
1. Pay back debts
and reduce projects
that out of the plan
2. Collect revenue
182,24 billion kip
and expenditure
165,25 billion kip
3. Encourage more
saving and
investment Invest in 6 major
projects
【Thematic and Cross Cutting Issues】 【Macro Indicator& Overall Target of Economic Sector】
(1). PGDP = 1,931.32billion kip
(2). Share of Agriculture and Forestry 47.6%,
(3). Industry is 32.9%, and
(4). Services is 19.5% of PGDP
【Indicator by main sectors】
Increase agriculture
and forestry productivities
6%/year
Increase industrial productivities
on average 9.9% /year
Increase services
10.2%/year
【Macro Indicator& Overall Target of Social Sector】*Culture and Social Development
(1). Primary school enrollment rate reaches 95%.
(2). Dropout rate decrease to 2%
【Development goal】1. Poverty reduction. 2. Political stability and social security

6
Did not
mention any
project
- To apply suitable
science and
technology to
agriculture,
industry, services
and living of local
Education
Development
Primary school
enrollment rate 95%,
repetition and dropout
rate reduce to 2% and
adult literacy rate up to
95%
Sports
Development
1. Building up
sport players
2. Construct
stadium in each
district
Labor and
social welfare
Inspect using labors
based on labor laws
and reduce importing
foreign labors
Health
Development
1. Reduce infant
mortality rate to 5%
2. Access to clean
water 69.07%, toilet
50% and have
vaccines 75-80%/year
Information and
culture
Development
Did not mention
any project Did not mention
any project
Invest in 8
major projects
【Thematic and Cross Cutting
Issues】
[Macro Indicator& Overall Target of Economic Sector]
(1). PGDP = 1,931.32billion kip
(2). Share of Agriculture and Forestry 47.6%,
(3) Industry is 32.9%, and
(4). Services is 19.5% of PGDP
【Macro Indicator& Overall Target of Social
Sector】*Culture and Social Development
(1). Primary school enrollment rate reaches 95%.
(2). Dropout rate decrease to 2%
【Development goal】1. Poverty reduction. 2. Political stability and social security
1. Expand information
and radio station
network
2. Construct Culture
Park in each district
3. Construct culture 5
culture villages in each
district
Did not mention
any project
Did not mention
any project
* Invest in 69 projects with
total cost of 156.74 billion
kip of which:
1. Income promotion: 27
projects (13.12 billion kip)
2. Technical promotion: 20
projects (5.8 billion kip)
3. Infrastructure
development: 22 projects
(137.82 billion kip)
Eradicate poverty by 70%
of total poor households in
mountainous areas and
95% of total poor
households in flatland
areas Focusing on
development of 2
districts in
mountainous areas
(Boualapha and Nakai)
and 3 districts in
flatland areas
Did not
mention any
project
Promote
science and
Technology
- To apply suitable
science and
technology to
agriculture,
industry, services
and living of local
people

7
(2) Khammuan Province
1) 5 year Provincial Development Plan (PSEDP) 2006-2010
(PIP Project)
Invest in 2 major
projects
(Indicators) Rice
output meets
272,530 tons/year
Invest in 16 major
projects*
Did not mention
about any
programs or
projects
(Sub sector)
Planting
【Development Goal】
1. Poverty reduction 2. Political stability and social security
【Thematic and Cross Cutting Issues】 [Macro Indicator& Overall Target of Economic Sector]
(1). PGDP = 1,931.32billion kip
(2). Share of Agriculture and Forestry 47.6%,
(3). Industry is 32.9%, and (4). Services is 19.5% of PGDP
【Indicator by main sectors】
Increase agriculture
and forestry productivities
6%/year
Increase industrial productivities
on average 9.9% /year
Increase services
10.2%/year
Forestry Irrigation Electricity Processing
industries
Handicraft Public Works
Transportation
Trade and
tourism
Banking and
Finance
Reduce slash
and burn
cultivation and
plant trees
10,000-
15,000ha
Supply water in
dry season for
26,000 ha
85% of total
population will
be able to have
access to
electricity
Focus on agro-
processing and
wood
processing
industries
Increase
handicraft
products to
15%/year
1. 85% of provincial capital and
focal areas for development have
road access and 65% of highland
areas have road access.
2. Expand and develop urban
planning and water supply system
3. Expand telecommunication
system.
Support mining
industries and
constructing
Cement
industry
1. Export
$103,264
million; import
$96,302 million
2. Increase no.
of tourists to 9-
10%
Livestock and
Aquaculture
Increase no. of
livestock: 100,000
buffaloes, 80,000
cows, 150,000 pigs,
12,000 goats, 800,000
poultry and supply fish
to markets reaches
9000-10,000 tons /year
Invest in 4 major
projects
Invest in 3 major
projects
Continue invest
in 10 projects
that have not
been done
Focus on 2
major projects
(SPRE 1 and
SPRE 2)
Mining
1. Pay back debts
and reduce projects
that out of the plan
2. Collect revenue
182,24 billion kip
and expenditure
165,25 billion kip
3. Encourage more
saving and
investment
Did not mention
about any
program or
project
Did not mention
about any
programs or
projects
Did not mention
about any
program and
project
Invest in 6 major
projects
[Macro Indicator& Overall Target of Social Sector]
(1). Primary school enrollment rate reaches 95%.
(2). Dropout rate decrease to 2%

8
Figure 2: Program Objective Tree of the 5-year Public Works and Transport Sector Development Plan of Khammuan Province
* Note: The PCAP2 team could not obtain the theoretical document. Only projects’ list was obtained (Please see the attached document).
Therefore, we do not have intermediate targets and other necessary information or indicators to create Program Objective Tree,
Chronology Chart and List of Intermediate and Final Targets (table 3 of TOR, 2009/03/12)
* Invest in 69 projects with
total cost of 156.74 billion kip
of which:
1. Income promotion: 27
projects (13.12 billion kip)
2. Technical promotion: 20
projects (5.8 billion kip)
3. Infrastructure development:
22 projects (137.82 billion
kip)
Did not
mention any
project
Education
Development
Primary school
enrollment rate 95%,
repetition and
dropout rate reduce
to 2% and adult
literacy rate up to
95%
Sports
Development
1. Building up
sport players
2. Construct
stadium in
each district
Labor and
social
welfare
Inspect using labors
based on labor laws
and reduce
importing foreign
labors
Health
Development
1. Reduce infant
mortality rate to 5%
2. Access to clean
water 69.07%, toilet
50% and have
vaccines 75-80%/year
Information
and culture
Development
1. Expand information and
radio station network
2. Construct Culture Park
in each district
3. Construct culture 5
culture villages in each
district
Did not
mention any
project
Did not
mention any
project
Invest in 8
major
projects
Did not
mention any
project
Did not
mention any
project
Promote
science and
Technology
Eradicate poverty by 70% of total poor
households in mountainous areas and 95%
of total poor households in flatland areas
1. Poverty reduction
2. Political stability and social security
Thematic and Cross Cutting Issue
Focusing on development
of 2 districts in
mountainous areas
(Boualapha and Nakai)
and 3 districts in flatland
areas
- To apply suitable
science and
technology to
agriculture,
industry, services
and living of local
people
(1). PGDP = 1,931.32billion kip
(2). Share of Agriculture and Forestry 47.6%
(3). Industry is 32.9% , and
(4). Services is 19.5% of PGDP
*Culture and Social Development
(1). Primary school enrollment rate reaches
95%. (2). Dropout rate decrease to 2%

9

9
(3) Saravane Province
1) 5 year Provincial Socio Economic Development Plan (PSEDP) 2006-2010
Increase agriculture
and forestry products
15.5%/year. To reduce poverty,
ensure food security, stop slash
and burn cultivation
[Development goals] Upgrade living standard level of people for 3 times compared to 2005
Thematic and Cross-
Cutting Issues
* Economic Sectors Development.
(1). PGDP = 3,332.9 billion kip. (2). Share of
Agriculture and Forestry is 52.38%, (3). Industry
is 20.72% and (4). Services is 26.9% of GDP
*Culture and Social Development
(1). 90% of school-age children can
access to school, (2). Ensure social
security
Invest in 11 big
projects
Increase industrial products
on average 27.07%/ year
Increase services
24.26%/year
Energy and
Mining
CTPC Banking
and Finance
Trade Tourism
Invest in
4 big
projects
Invest in
5 big
projects
Invest in
3 big
projects
Invest in 7
big projects Invest in 8
big projects

10
Thematic and Cross-
cutting Issues
Education
Invest in 2
big projects Invest in 1
big project
Invest in 4
projects
Invest in 3
big projects
Invest in 4
projects
Sports Health Information
& Culture
Labor and
Social welfare
Focal village
Development
and Poverty
reduction
Land
Development
Plan
Science,
technology &
environment
Invest in 6
big projects
Invest in 1
big project
Invest in 2
big projects
(1). PGDP = 3,332.9 billion kip. (2). Share of
Agriculture and Forestry is 52.38%, (3). Industry
is 20.72% and (4). Services is 26.9% of GDP
*Culture and Social Development
(1). 90% of school-age children can
access to school, (2). Ensure social
security
[Development goals] Upgrade living standard level of people for 3 times compared to 2005

11
2) 5 year Public Works and Transport Sector Development Plan (2006-2010)
Communication, Transport, Post and Construction
Invest in 21
projects Invest in 4 projects No project is
listed
Invest in 13 projects
The targets (Please
see Table: 1.2
Summary Table of
PWT Sector
Development Plan
2006-2010)
The targets
(See summary table)
The targets
(See summary table) The targets (See
summary table)
The targets (See
summary table)
The targets
(See summary
table)
The targets (please
see summary table)
*Communication
- Pave DBST
118.4km, pave
gravel 179 km,
survey, repair,
upgrade and etc
* Post and
telecommunication
- Increase post offices up
to 8 units
- Increase home phone,
automatic, and mobile
phone centers up to 10, 7
and 7 places respectively
* Housing
- Inspect housing
plan 4,928 m² and
95 houses will be
approved
* Urban
Planning
* Water Supply
- 49 peal water
companies will be
established
*Transportation
In 2010, (1). Inland,
(2). water, (3). air
transportation serve
2,416; 1,771, and 645
passengers
respectively
* Vehicle and traffic
In 2010, (1) 32,500
vehicles will have
technical check
(2). 8750 new vehicles
& (3). 4500 pp will be
issue the licenses
No project is
listed

12
(4) 1. Ideal Structure of POT

13
2. An Example of Ideal Structure of POT
Example of Program Objective Tree of Education Sector (not real)
Name of Program Unit A
Indicators
Projects
Overall Target
All the children are able to access to better quality of primary
education
PIP Project A-
5
1. Increase net enrollment rate to 98% by 2015
2. Reduce dropout and repetition rates by less
than 8 and 7 percent respectively
1. Construction completed primary
schools project
2. School foods project
3. Free primary education project
4. Provision of textbooks and uniforms
project
Name of Program Unit B
Indicators
Projects
Human Resources improvement
By 2015,
1. Upgrade 5000 teachers,
2. Train more than 1000 teachers,
3. Recruit 500 teachers,
4. Increase 30% of salary base for
teachers and others
B: program to improve quality of eudcation
Curriculum improvement
By 2015, improve quality of
primary school curriculum such as
1. Teacher's guildebook,
2. Textbooks,
3. Tutorial calendar, and etc
1. Curriculum
development
project
1. Human Resources Management
project including components:
(1) upgrading,
(2) trainining,
(3) recruiting,
(4) increasing salary, and etc other projects
other pojects other projects
A: Primary education promotion program
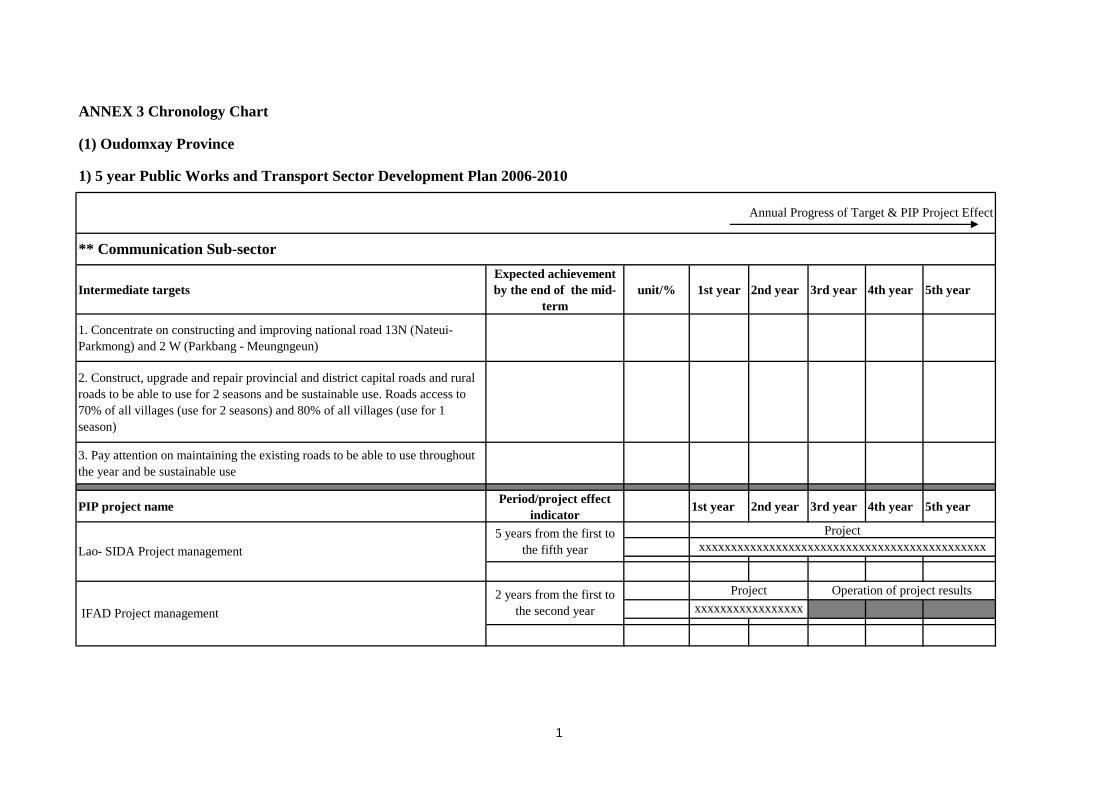
Intermediate targets
Expected achievement
by the end of the mid-
term
unit/% 1st year 2nd year 3rd year 4th year 5th year
1. Concentrate on constructing and improving national road 13N (Nateui-
Parkmong) and 2 W (Parkbang - Meungngeun)
2. Construct, upgrade and repair provincial and district capital roads and rural
roads to be able to use for 2 seasons and be sustainable use. Roads access to
70% of all villages (use for 2 seasons) and 80% of all villages (use for 1
season)
3. Pay attention on maintaining the existing roads to be able to use throughout
the year and be sustainable use
PIP project namePeriod/project effect
indicator1st year 2nd year 3rd year 4th year 5th year
Project Operation of project results
Annual Progress of Target & PIP Project Effect
** Communication Sub-sector
IFAD Project management
2 years from the first to
the second year xxxxxxxxxxxxxxxxx
x
ANNEX 3 Chronology Chart
1) 5 year Public Works and Transport Sector Development Plan 2006-2010
(1) Oudomxay Province
Lao- SIDA Project management
5 years from the first to
the fifth year
Project
xxxxxxxxxxxxxxxxxxxxxxxxxxxxxxxxxxxxxxxxxxxxx
1

Project
xxxxxxxxxxxxxxxxxxxxxxxxxxxxxxxxxxxxxxxxxxxxx
Project
xxxxxxxxxxxxxxxxxxxxxxxxxxxxxxxxxxxxxxxxxxxxxxx
Project
xxxxxxxxxxxxxxxxxxxxxxxxxxxxxxxxxxxxxxxxxxxxxxx
Period repair and rehabilitation of roads in Lar district
5 years from the first to
the fifth year
Period repair and rehabilitation of roads in Namor district
5 years from the first to
the fifth year
Regular repair of 36 roads with length 657km
5 years from the first to
the fifth year
Period repair and rehabilitation of roads in Xay district
5 years from the first to
the fifth year
Project
xxxxxxxxxxxxxxxxxxxxxxxxxxxxxxxxxxxxxxxxxxxxx
Period repair and rehabilitation roads in Nga district
5 years from the first to
the fifth year
Period repair and rehabilitation of roads in Bang district
Project
xxxxxxxxxxxxxxxxxxxxxxxxxxxxxxxxxxxxxxxxxxxxxxx
Project
xxxxxxxxxxxxxxxxxxxxxxxxxxxxxxxxxxxxxxxxxxxxxxx
5 years from the first to
the fifth year
Management of the regular repair in 7 districts
5 years from the first to
the fifth year
Management of the Period repair and rehabilitation
5 years from the first to
the fifth year
Purchasing road construction materials
5 years from the first to
the fifth year
Project
xxxxxxxxxxxxxxxxxxxxxxxxxxxxxxxxxxxxxxxxxxxxxxx
Project
xxxxxxxxxxxxxxxxxxxxxxxxxxxxxxxxxxxxxxxxxxxxxxx
Project
xxxxxxxxxxxxxxxxxxxxxxxxxxxxxxxxxxxxxxxxxxxxxxx
2
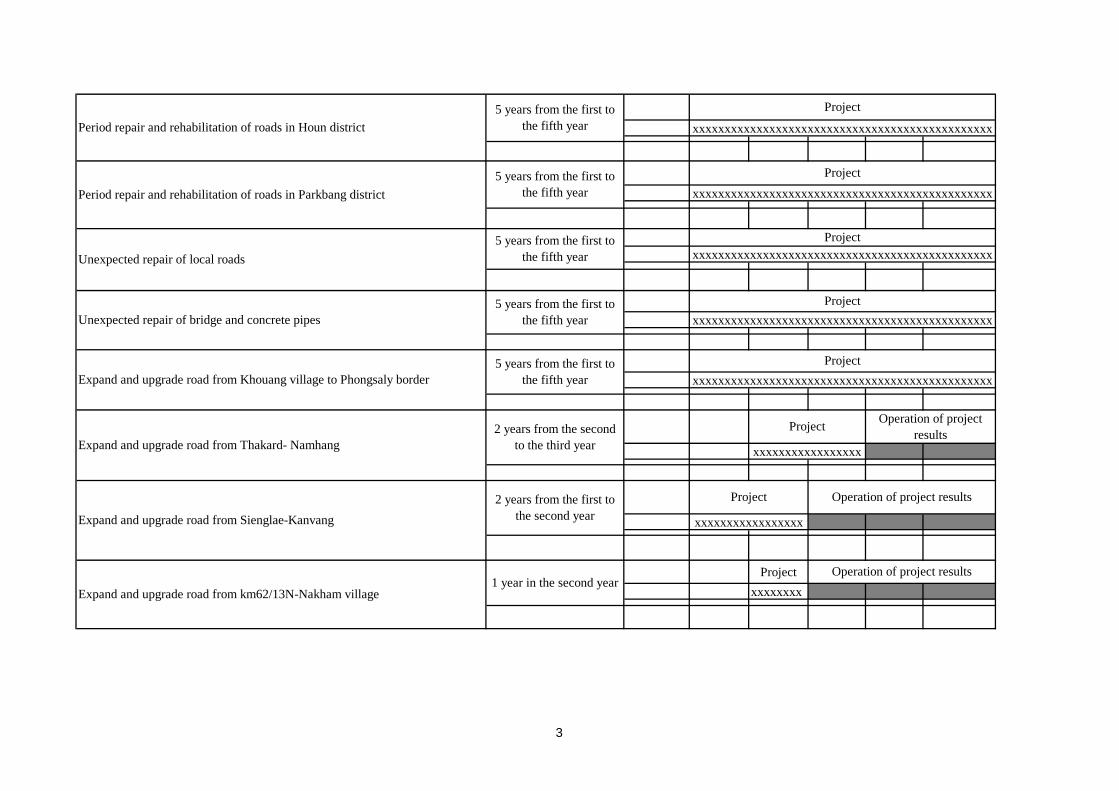
Project
xxxxxxxx
Project
xxxxxxxxxxxxxxxxx
Operation of project results
Operation of project results
Project
xxxxxxxxxxxxxxxxxExpand and upgrade road from Thakard- Namhang
2 years from the second
to the third year
Expand and upgrade road from Sienglae-Kanvang
2 years from the first to
the second year
Project
xxxxxxxxxxxxxxxxxxxxxxxxxxxxxxxxxxxxxxxxxxxxxxx
Project
xxxxxxxxxxxxxxxxxxxxxxxxxxxxxxxxxxxxxxxxxxxxxxx
Expand and upgrade road from km62/13N-Nakham village1 year in the second year
Unexpected repair of local roads
5 years from the first to
the fifth year
Unexpected repair of bridge and concrete pipes
5 years from the first to
the fifth year
Operation of project
results
Expand and upgrade road from Khouang village to Phongsaly border
5 years from the first to
the fifth year
xxxxxxxxxxxxxxxxxxxxxxxxxxxxxxxxxxxxxxxxxxxxxxx
Period repair and rehabilitation of roads in Houn district
5 years from the first to
the fifth year
Period repair and rehabilitation of roads in Parkbang district
5 years from the first to
the fifth year
Project
xxxxxxxxxxxxxxxxxxxxxxxxxxxxxxxxxxxxxxxxxxxxxxx
Project
Project
xxxxxxxxxxxxxxxxxxxxxxxxxxxxxxxxxxxxxxxxxxxxxxx
3

ProjectOperation of
Projectxxxxxxxx
Project
xxxxxxxx
Project
xxxxxxxx
Project
xxxxxxxx
Operation of project
results
Expand and upgrade road from Namhangtai-Saluang
Operation of project results1 year in the first year
Project Operation of project results
xxxxxxxxxxxxxxxx
Expand and upgrade road from Mokka-Namjong1 year in the first year
Operation of project results
Project
Expand and upgrade road from Naxay-Namvinneur1 year in the forth year
Expand and upgrade road from Nasavang-Namkam village
2 years from the second
to the third yearxxxxxxxxxxxxxxxxx
Expand and upgrade road from Fan village-Tardnamkad1 year in the first year
Operation of project results
Expand and upgrade road from Phouat-Sopjalang
2 years from the first to
the second year
xxxxxxxxxxxxxxxxxx
Project
Expand and upgrade road from Phouthong village- Houipod
2 years from the forth to
the fifth year
Project
xxxxxxxxxxxxxxxxxx
Expand and upgrade road from Homexay-Houihoke
2 years from the forth to
the fifth year
4

Project
xxxxxxxx
Project
xxxxxxxx
Project
xxxxxxxx
Project
xxxxxxxx
Operation….
Construct new road from Nga district-Lardhan (Luangphabang border)
2 years from the first to
the second year
Operation of project
results
Project
xxxxxxxxxxxxxxxxx
Operation of project results
Construct new road from Namor-Xay-Bang-Houn districtsNo detail
2 years from the second
to the third year
Construct new road from Tardmonun, Lar district-Namlang, Xay district1 year in the first year
Operation of project results
Project Operation of project
Operation of project results
xxxxxxxxxxxxxxxxx
Construct new road from Parkbang-Parktha, Khonkoud (Borkeo border)
3 years from the second
to the forth
Project
xxxxxxxxxxxxxxxxxxxxxxxxxx
Expand and upgrade road from Phonhome-Houihere1 year in the second year
xxxxxxxxxxxxxxxxx
Operation of project results
Operation of project results
Project
Construct new road from Tangkok-Nalae (Luangnamtha border)
2 years from the first to
the second year
Expand and upgrade road from Namhangtai-Moklahung1 year in the second year
Expand and upgrade road from Nampa-Tongpang1 year in the third year
Construct new road from Houn district-Houihoke (Borkeo border)
5

Project
xxxxxxxx
Project
xxxxxxxx
Project
xxxxxxxx
Operation of project results
Construct the third Namkor bridgesNo detail
Construct Nampark bridge (Lar district)1 year in the first year
Operation of project results
Construct Namsae bridges (Namor district)1 year in the first year
Construct new road from Phonsaard-Meunghougtongsaleung villageNo detail
Construct new road from Mang village-Meunghongtongsaleung village
Project
Construct new road from Houihoke-Phouviengxay
3 years from the third to
the fifth year
xxxxxxxxxxxxxxxxxxxxxxxxxxxxxxxxxxxxxx
xxxxxxxxxxxxxxxxxxxxxxxxxxxx
Project
No detail
Construct new road from km 17/2-TanogporNo detail
Construct new road from Laovang-ParkpouiNo detail
Construct new road from Namphoun area- Bang border
4 years from the second
to the fifth year
Operation of project results
Construct new road from Siengdy-SibouheungNo detail
Construct new road from Phoutoum-Katangnga1 year in the first year
6

Intermediate targetsExpected achievement
by the end of the mid-unit/% 1st year 2nd year 3rd year 4th year 5th year
1. Improve and construct National Roads in Saravanh area to be able to use for
2 seasons
2. Construct and repair provincial and district roads in 8 districts
3. Construct road access to villages that can be able to use for 1or 2 seasons for
535 villages (88%)
4. Survey and pave DBST for 299km including national roads 220km,
provincial capital road s 46km and district municipality road 17km and special
road 16km
5. Survey and construct new roads
PIP project namePeriod/project effect
indicator1st year 2nd year 3rd year 4th year 5th year
Project
xxxxxxxx
Annual Progress of Target & PIP Project Effect
(2) Saravane Province
2. Survey and pave DBST on National road no. 15 B with 1 concrete bridge
from Napong to Saravanh
1) 5 year Public Works and Transport Sector Development Plan 2006-2010
2 years from the second
to the third year
Project Operation of project
xxxxxxxxxxxxxxxxx
** Communication Sub-sector
1. Survey and pave DBST on National road no. 15 Saravanh- R16 border
(Vietnam)
3 years from the first to
the third year
Project Operation of project
xxxxxxxxxxxxxxxxxxxxxxxxxx
3. Survey and pave DBST on road no. 6901 from Junction 13S-Kangkongluang
port
1 year in the third year
Operation of project
7

Project
xxxxxxxx
Project
xxxxxxxx
Project
xxxxxxxx
Project
xxxxxxxx
Project
xxxxxxxx
Project
xxxxxxxx
Project
xxxxxxxx
xxxxxxxxxxxxxxxxxx
4. Survey and pave DBST on road no. 6905 from Junction 15(check point 71)-
S3 border
1 year in the third year
Operation of project results
7. Pave DBST on Saravanh District municipality roads with walking path
2 years from the forth to
the fifth year
Project
xxxxxxxxxxxxxxxxxx
5. Pave laterite on Route no. 6958 from junction 1G, Toumlane district-
junction no. 15 with Bele bridge
1 year in the second year
Operation of project results
6. Pave laterite Route no. 6910 junction 15, Samoui district-R11 border with
Bele bridge
2 years from the forth to
the fifth year
Project
8. Pave DBST on Laongam District municipality roads with concrete pipes1 year in the second year
Operation of project results
9. Pave DBST on Samoui District municipality roads1 year in the second year
Operation of project results
Operation of project
10. Pave laterite on Route no. 6903 from junction 15-Sunjayon, Kareum border
with Bele bridge
1 year in the first year
Operation of project results
11. Pave laterite on Route no. 6915 from Thataopoun-Kareum district border
with Bele bridge
1 year in the second year
Operation of project results
12. Pave laterite on Route no. 6906 from Vapee district- junction 6906,
Natandong village with Bele bridge
1 year in the third year
8

Project
xxxxxxxx
Project
xxxxxxxx
Project
xxxxxxxx
Project
xxxxxxxx
Project
xxxxxxxx
Project
xxxxxxxx
Project
xxxxxxxx
Operation of project results
13. Pave laterite on Route no. 36 from junction 1H-Hangphou village with
Bele bridge
1 year in the first year
Operation of project results
14. Pave laterite on Route no. 6951 from junction 13S-Thakhansoumsour
village
1 year in the fifth year
15. Pave laterite on Route no. 6934 from junction 15-Nongfungyong1 year in the first year
16. Pave DBST on Route no. 7273 Tardlor area1 year in the first year
Operation of project results
17. Pave DBST on Route no. 7278 junction 15-Kangkoung (Parkset)1 year in the second year
Operation of project results
18. Construct route no. 5501 Parksebangnoun-Thakhansoumsour village with
Bele bridge (Provincial road)
1 year in the second year
Operation of project results
19. Construct route no. 6907 from Nongboua village -Junction 1G Phonsavanh
village (district road)
1 year in the first year
Operation of project results
9

PIP Map of PWT sector 5 year plan 2006-2010 in Oudomxay Province

PIP Map of PWT sector 5 year plan 2006-2010 in Khammouane Province

PIP Map of PWT sector 5 year plan 2006-2010 in Saravane Province

Copyright© 2010 by
Ministry of Planning and Investment
Printing supported by JICA-PCAP2