Embed Size (px)
Citation preview

ManualArtologik
Survey&Report
Version 4.3
© Artisan Global Media

Manual
Artologik Survey&Report
Survey&Report is a multilingual program for creating surveys quickly andeasily. You secure a high response rate by distributing the survey both by email and posting a link on your website. A few clicks gives you customreports that are updated with each new incoming answer. Then publish thereports online or export them as PDFs, Word documents or PowerPoints.Survey&Report is built on the Microsoft ASP.NET platform.
Why Survey&Report?
● Easy to learn and simple to use – help texts and instructional videosin the program
● Web surveys distributed via e-mail or links on a website – for fastdata collection
● Fast survey construction – use custom question and surveytemplates
● Ask follow-up questions based on a respondent’s answers orcategory affiliations
● Multilingual surveys – when your respondents speak differentlanguages
● Reports at the press of a button – all the charts and tables you need
● Custom designs – match your graphic profile
Copyright and TrademarkCopyright © 2018 Artisan Global Media, Videum Science Park, SE 351 96 VÄXJÖ, SWEDENArtisan Global Media has intellectual property rights relating to technology embodied in the product that is described in this document. This document and the product to which it pertains are distributed under licenses restricting their use, copying, distribution and decompilation. No part of the procduct or of this document may be reproduced in any form by any means without prior written authorixation of Artisan Global Media.
Artologik is a registered trademark of Artisan Global Media.

Manual 3
Table of contentAbout the manual ............................................................................................11Home Page........................................................................................................12
Warning notifications in the top menu.........................................................................13Evaluate............................................................................................................14
Start page....................................................................................................................16New Evaluation............................................................................................................16
Create a New blank evaluation..............................................................................16Create a New evaluation from template................................................................16
Find Evaluations..........................................................................................................17Survey Status..............................................................................................................18Respondents...............................................................................................................18
Add Respondents..................................................................................................18Survey...............................................................................................................19
New Survey ................................................................................................................19Creating New Empty Surveys ...............................................................................19Copying Surveys ...................................................................................................19Creating Surveys with Survey Templates .............................................................20
Finding Surveys...........................................................................................................20My surveys...................................................................................................................21
Filtering of the list...................................................................................................22Handling several surveys at a time........................................................................23
Survey Status .............................................................................................................23Reopening Surveys...............................................................................................24Archiving Surveys..................................................................................................25Restoring from archive...........................................................................................25Creating Predefined Reports.................................................................................26
Survey Construction....................................................................................................26Basic Information ..................................................................................................27
Properties ........................................................................................................27Introductory Text .............................................................................................41Page Headers/Footers ....................................................................................43Thank You Message........................................................................................43Consent Form..................................................................................................44Consent Refused.............................................................................................45
Templates..............................................................................................................45Position............................................................................................................46Removing a template.......................................................................................46Save.................................................................................................................46
Questions ..............................................................................................................46Overview .........................................................................................................46Creating Questions .........................................................................................47Editing Questions ............................................................................................48Copying Questions...........................................................................................48Aligning Questions...........................................................................................48Removing Questions .......................................................................................48Question Icons.................................................................................................48Creating New Pages .......................................................................................49Switching Between Pages ...............................................................................49Importing Questions.........................................................................................49Edit Mode.........................................................................................................50
© Artisan Global Media

Manual 4
Translating Surveys ........................................................................................64Arranging Questions .......................................................................................64Question Visibility.............................................................................................65Filters ..............................................................................................................67Conditions........................................................................................................72Quota................................................................................................................88
Design ...................................................................................................................90Customising Themes ......................................................................................91The Qustion Settings Tab................................................................................95
Preview .................................................................................................................95Paper Surveys..................................................................................................95
Respondents..........................................................................................................96Searching for respondents...............................................................................98Editing respondents ........................................................................................99Anonymising respondents................................................................................99Removing respondents....................................................................................99Answering a survey on behalf of a respondent..............................................100Exporting the list.............................................................................................100
Finish Construction .............................................................................................100Information ....................................................................................................100The Survey's Publication Period ...................................................................101Respondent surveys......................................................................................101
Data Collection .........................................................................................................101Adding Respondents .....................................................................................101Editing Respondents .....................................................................................112Survey-specific Log-ins..................................................................................114
Mailings................................................................................................................115Sending E-mails ............................................................................................115Mailings..........................................................................................................118Paper Mail......................................................................................................126
Paper Survey ......................................................................................................127Setup .............................................................................................................128Create ............................................................................................................130Import ............................................................................................................131
Text Answers.......................................................................................................132Export ..................................................................................................................133Closing Surveys ..................................................................................................135Linking to public surveys......................................................................................135
Reports............................................................................................................136Report........................................................................................................................136Aggregate Report (SR-Advanced Report).................................................................136Hierarchy report.........................................................................................................136To work with reports..................................................................................................137New Report ...............................................................................................................138
Organisation Access............................................................................................139Report Readers...................................................................................................139
New Aggregate Report..............................................................................................139Finding Reports ........................................................................................................139Properties..................................................................................................................140
Information...........................................................................................................140Limits....................................................................................................................141Design..................................................................................................................141Organisation Access............................................................................................141Status...................................................................................................................142Report Readers...................................................................................................142Header/Footer .....................................................................................................143
© Artisan Global Media
Manual 5
Editing Headers/Footers................................................................................143Data Set ....................................................................................................................143
Editing Variables..................................................................................................145Settings for Numeric Questions ....................................................................145Settings for Calendar Questions ...................................................................146
Copying Variables................................................................................................146Recoding Variables .............................................................................................147
Recoding Multiple Variables Simultaneously ................................................148Generating Reports.............................................................................................148Export...................................................................................................................149Presenting variables from other surveys.............................................................149
Add Data Set..................................................................................................149Delete Data Set..............................................................................................149
Comparing Surveys.............................................................................................149Creating a Compare Data set........................................................................150Presenting Comparisons in the Report..........................................................151
Computed Variables............................................................................................152Create computed variable..............................................................................152Edit Computed Variable.................................................................................153Present the frequency of a computed variable..............................................153
Analyse functions.................................................................................................154Creating analyse functions.............................................................................154Examples of how to use analyse functions....................................................155
Text Analysis........................................................................................................161Create Text Analysis Variable........................................................................161Edit Text Analysis Variable............................................................................161Basic Information...........................................................................................161Words.............................................................................................................162Categories......................................................................................................162Conversions...................................................................................................164Exclusions......................................................................................................165Lists................................................................................................................166Regular Expressions......................................................................................166
Hierarchy variables..............................................................................................167Creating a hierarchy variable.........................................................................168Editing a hierarchy variable............................................................................168
Delete a hierarcy variable....................................................................................170Report Content..........................................................................................................170
Report Items........................................................................................................170Adding Report Items......................................................................................170Copying Report Items....................................................................................171Reordering Report Items................................................................................172Removing Report Items.................................................................................172
Sections...............................................................................................................172Adding Sections.............................................................................................172Splitting in two Columns.................................................................................172Reordering Sections.......................................................................................173Removing Sections........................................................................................173
Elements..............................................................................................................173Inserting Elements.........................................................................................173Editing Elements............................................................................................173Removing Elements.......................................................................................174
Editing Tables......................................................................................................174Frequency Tables..........................................................................................174Statistical Tables............................................................................................175Data Tables....................................................................................................175
© Artisan Global Media

Manual 6
Change Tables...............................................................................................175Series.............................................................................................................177Background Series.........................................................................................179Filter Series....................................................................................................181
Editing charts.......................................................................................................181Chart Types....................................................................................................182Chart Settings................................................................................................192Positioning Map..............................................................................................194Limits..............................................................................................................194Axes...............................................................................................................194Series.............................................................................................................197Background Series.........................................................................................198Filter Series....................................................................................................200
Editing Hybrid Elements......................................................................................201Settings for the hybrid element......................................................................201The Structure of the Hybrid Element..............................................................201The content of the Hybrid Element................................................................205
Preview .....................................................................................................................205Layout .......................................................................................................................206
Creating Layouts .................................................................................................206Editing or Removing Layouts...............................................................................206Editing Content ...................................................................................................206
Export .......................................................................................................................208Exporting Directly ................................................................................................208Saving Export Definitions.....................................................................................208
Distribution and Subreports ......................................................................................209Dashboard View ..................................................................................................209Publication Period and Access ...........................................................................209Distributing Reports via E-mail............................................................................210
Creating New Mailings...................................................................................210E-mail History.................................................................................................211
Public Report View...............................................................................................211Subreports ..........................................................................................................212
Creating Subreports.......................................................................................212Editing Subreports..........................................................................................214
Report Readers...................................................................................................215Logging in as a report reader....................................................................................216Aggregate Reports....................................................................................................217
Basic Information.................................................................................................218Surveys..........................................................................................................218Selection........................................................................................................222
Report Content.....................................................................................................225Adding tables and text items..........................................................................225Editing tables..................................................................................................226Editing text items............................................................................................232Removing tables and text items.....................................................................232
Preview................................................................................................................232Templates........................................................................................................233
Survey Templates .....................................................................................................233Creating New Survey Templates.........................................................................233Copying a Survey Template ...............................................................................233Finding Templates ..............................................................................................233Basic Information ................................................................................................234
Settings..........................................................................................................234Access............................................................................................................234Automation.....................................................................................................235
© Artisan Global Media

Manual 7
Questions ............................................................................................................235Design .................................................................................................................236Preview ...............................................................................................................236Reports................................................................................................................236
New predefined report....................................................................................237Connecting Predefined report........................................................................237Editing Predefined report...............................................................................237
Question Templates .................................................................................................239Editing Question Templates ................................................................................239
Translating Question Templates....................................................................240Previewing Question Templates .........................................................................240Access.................................................................................................................240
Report Templates......................................................................................................241Editing Report Templates ...................................................................................241
Saving Changes to Report Templates...........................................................241Creating New Report Templates....................................................................241Deleting and Renaming Report Templates....................................................241Editing Item Templates .................................................................................242Enabling all Series.........................................................................................244Creating New Item Templates........................................................................244Copying Item Templates................................................................................245Deleting and Renaming Item Templates........................................................245
Survey Design...........................................................................................................245Survey Themes....................................................................................................245
Editing Themes .............................................................................................245Creating New Themes ..................................................................................246Removing Themes.........................................................................................246Renaming Themes.........................................................................................246Access............................................................................................................246
Header.................................................................................................................247Edit.................................................................................................................247Access............................................................................................................248
Footer...................................................................................................................249Edit.................................................................................................................249Access............................................................................................................250
Thank you message............................................................................................251Edit.................................................................................................................251Access............................................................................................................252
Report Design............................................................................................................252Report Themes....................................................................................................252
Editing Themes .............................................................................................252Creating New Themes ..................................................................................254Removing Themes ........................................................................................255Access............................................................................................................255
Header.................................................................................................................255Edit.................................................................................................................255Access............................................................................................................256
Footer...................................................................................................................257Edit.................................................................................................................257Access............................................................................................................258
Public Design.............................................................................................................259Header.................................................................................................................259
Edit.................................................................................................................259Administration................................................................................................260
Users.........................................................................................................................260Users ...................................................................................................................260
© Artisan Global Media
Manual 8
List .................................................................................................................260Editing Users..................................................................................................261From a File.....................................................................................................264From LDAP ...................................................................................................267
Groups ................................................................................................................268List .................................................................................................................268Properties.......................................................................................................269User Rights....................................................................................................270
Respondents.............................................................................................................276Respondents .......................................................................................................276
Searching for Respondents ..........................................................................277Editing Respondents......................................................................................277Quick Editing..................................................................................................278Removing Respondents.................................................................................278Adding Respondents .....................................................................................278Editing Respondents .....................................................................................286
Respondent Attributes.........................................................................................288Respondent Properties..................................................................................288Respondent Categories.................................................................................289Survey-Specific Categories ...........................................................................290Respondent category links.............................................................................291
Settings................................................................................................................293Group-specific Settings..................................................................................293Other Settings................................................................................................293
Manage respondents...........................................................................................294Delete respondents........................................................................................294Manage Duplicates........................................................................................294
E-mails and Mailings.................................................................................................295Templates ...........................................................................................................295
E-mails ..........................................................................................................295Paper Mail .....................................................................................................297System templates ..........................................................................................297
Mailing Schedule.................................................................................................299Creating New Mailings...................................................................................299List..................................................................................................................299Editing Mailings..............................................................................................299
E-mail Accounts ..................................................................................................300Incoming E-mails............................................................................................300
Settings .....................................................................................................................301Survey..................................................................................................................301
General Settings ...........................................................................................301Categories .....................................................................................................303Automation.....................................................................................................304
Application...........................................................................................................305Layout.............................................................................................................305Menu links......................................................................................................305
SSL .....................................................................................................................307Organisation..............................................................................................................308
Adding organisations...........................................................................................308Moving organisations...........................................................................................308Deleting organisations.........................................................................................309Organisation information......................................................................................309Surveys, users and respondents.........................................................................309About organisations in general............................................................................310
Connecting users to organisations.................................................................310Users belonging to several organisations......................................................310
© Artisan Global Media

Manual 9
Set organisation access.................................................................................310Languages and Translations ....................................................................................311
Settings................................................................................................................311Application Languages ..................................................................................311Survey Languages ........................................................................................311Translation Scripts.........................................................................................312
Translation ..........................................................................................................312Survey Texts .................................................................................................312Survey Helptexts ...........................................................................................313Report Texts ..................................................................................................313Report Helptexts............................................................................................314
Image and Document Libraries.................................................................................315My Files and Public Files.....................................................................................315Searching for and Listing Files ...........................................................................315Inserting Files .....................................................................................................315
Properties ......................................................................................................316Creating Folders..................................................................................................316Uploading Files....................................................................................................316Moving and Copying Files...................................................................................316Renaming Files....................................................................................................317Replacing Files....................................................................................................317Removing Files and Folders ...............................................................................317Image Editing ......................................................................................................318
Resizing and Cropping Images......................................................................318Metadata .......................................................................................................319
Text Analysis.............................................................................................................319Category Lists......................................................................................................320
Create New List..............................................................................................320Editing and Deleting List................................................................................320
Conversion Lists..................................................................................................320Create New List..............................................................................................320Editing and Deleting List................................................................................320
Exclusions Lists...................................................................................................321Create New Exclusion....................................................................................321Editing and Deleting List................................................................................321
Regular Expressions............................................................................................321Paper Surveys ..........................................................................................................322LDAP ........................................................................................................................322
Creating and Editing LDAP Connections.............................................................323Connection ....................................................................................................323Settings .........................................................................................................323Groups ...........................................................................................................324Users .............................................................................................................324
Plug-ins .....................................................................................................................324Statistics....................................................................................................................325
User activity.........................................................................................................325Survey activity......................................................................................................325
Personal data..................................................................................................327Personal data report..................................................................................................327
Information on users............................................................................................327Report.............................................................................................................327Removing or anonymising users....................................................................329
Information on respondents.................................................................................329Report.............................................................................................................330Removing or anonymising respondents.........................................................330
Individual answers...............................................................................................331
© Artisan Global Media

Manual 10
Settings......................................................................................................................331Consent Forms..........................................................................................................332
Consent - Survey.................................................................................................332Edit consent - Survey.....................................................................................332Access............................................................................................................333
Consent Resufed - Survey...................................................................................334Edit consent refused - Survey........................................................................334Access............................................................................................................334
Edit consent - Add respondent............................................................................334Edit consent - User..............................................................................................334Edit consent - Add User......................................................................................335
Help.................................................................................................................336Manual ......................................................................................................................336About ........................................................................................................................336
© Artisan Global Media
Manual 11
About the manual
This manual describes, in addition to the functions of the basic program,also functions in the plug-ins SR-Advanced Survey, SR-Advanced Reportand SR-LDAP. In the text it is described which functions are available ineach plug-in.
© Artisan Global Media

Manual 12
Home PageThe home page is displayed directly upon log-in. It can also be accessed by clicking the Survey&Report heading above the main menu.
In the box Recent, under the headings Surveys and Reports, you find the latest surveys and reports, respectively, you have created. You can go directly to a survey or a report by clicking its name. You also find shortcuts to creating new surveys/reports, or finding existing ones.
If you have already chosen a survey and then return to the home page you will find another box with shortcuts to various stages in the work process of the current survey, under the headings Survey construction, Data collection and Reports.
At the bottom of the program window, there is a bar where shortcuts to the surveys and reports you have worked with during the current session are displayed. The survey and the report which you work with at the moment are displayed in white text, while surveys and reports you have worked with earlier in the session are displayed in grey text. Click on a survey or a report to continue working with it.
In the field at the top of the program window you find a menu which you access by clicking your name.
In this menu you can change your password, switch to another application language or log out of the program. By clicking the menu option My profile you can edit your display name, first name, last name and e-mail address. Here you can also decide if you want to have the program's main menu on the left or on the right, and if the program window as default should have a fixed width or fill the full width of the screen. The width of the program window can also be changed temporarily during the session. Click the button to fill the full width of the screen, or the button to give the window a fixed width.
If you have created organisations in the system, any users belonging to more than one organisation will have this drop down list:
The user can in this case select one of the organisations and by doing this get access to, for example, any templates connected to the selected organisation.
© Artisan Global Media

Manual 13
Warning notifications in the top menu• Admin password
When the program is installed, there is from the start a single user (with the user name admin) in the system. As a precaution, this user's password should be changed. If you log in to the program with the user role Super Administrator, a security warning is displayed at the top of the program window, as long as the password has not been changed. The warning disappears when the password is changed. You can also hide the warning by clicking one of these buttons:
• Confirm - The warning will not be displayed again.
• Dismiss - The warning will be displayed the next time a super administrator logs in.
• Surveys that have not yet been anonymisedUnder Administration > Settings > Surveys > General settings, Anonymisation warnings can be enabled. This means that all users will see a notification on how many surveys have passed the appropriate time limit, without the respondents being anonymised. The number refers to surveys that the user has reading rights to. The user has two options:
• See - The user is transferred to the page My surveys which displays a list of the surveys that should have been anonymised according to system settings.
• Dismiss - The anonymisation warning is displayed again the next time the page is reloaded.
© Artisan Global Media
Manual 14
EvaluateIf you use the plugin SR-Evaluate you can see the menu Evaluate. From this menu you create surveys using a step by step guide where you start to select what kind of survey you would like to create (a web survey, paper survey or mixed survey), as well as whether you would like to use a template or not. You go through the construction phase under Evaluation > Survey Construction by clicking the button Next at the end of each step. Please remember to save your changes on all pages where you can find a Save button.
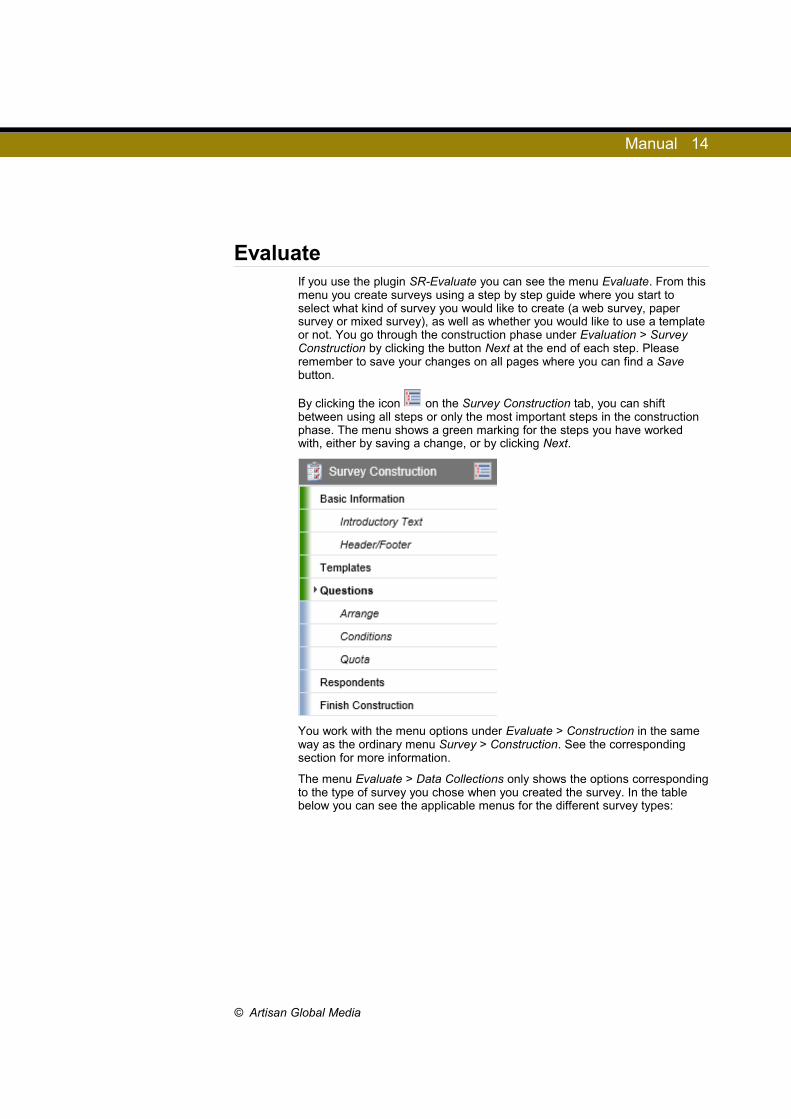
By clicking the icon on the Survey Construction tab, you can shift between using all steps or only the most important steps in the construction phase. The menu shows a green marking for the steps you have worked with, either by saving a change, or by clicking Next.
You work with the menu options under Evaluate > Construction in the same way as the ordinary menu Survey > Construction. See the corresponding section for more information.
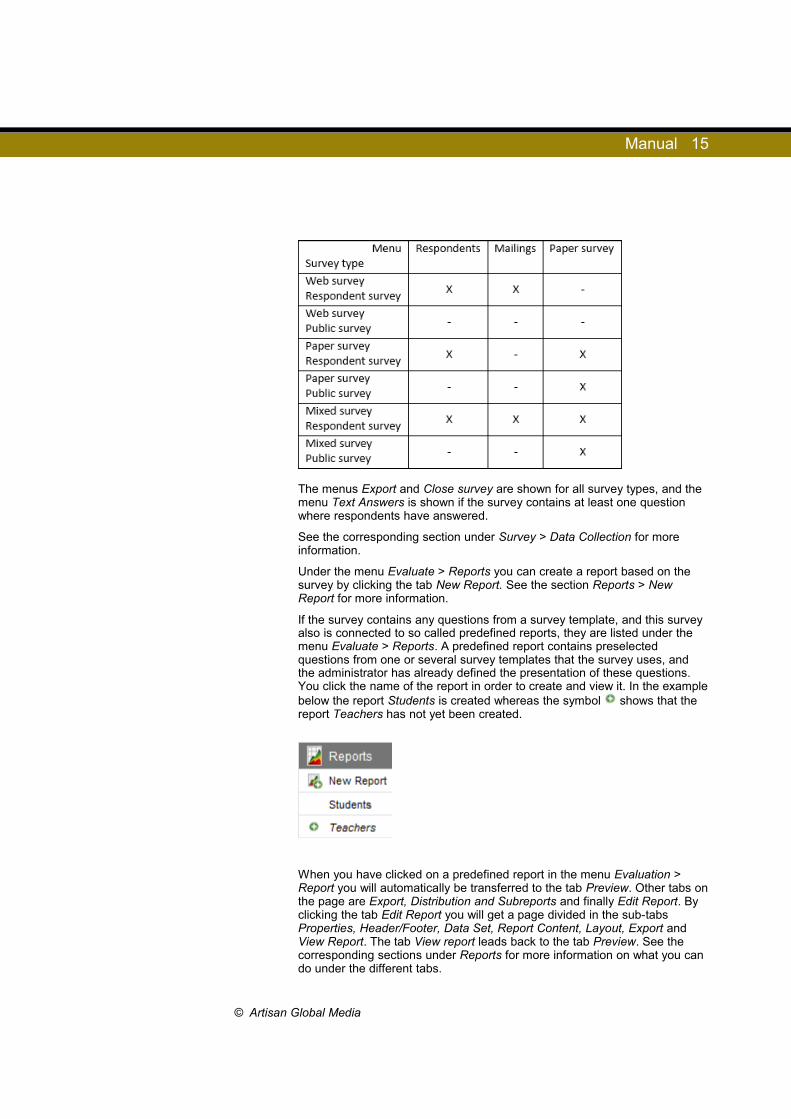
The menu Evaluate > Data Collections only shows the options corresponding to the type of survey you chose when you created the survey. In the table below you can see the applicable menus for the different survey types:
© Artisan Global Media
Manual 15
The menus Export and Close survey are shown for all survey types, and the menu Text Answers is shown if the survey contains at least one question where respondents have answered.
See the corresponding section under Survey > Data Collection for more information.
Under the menu Evaluate > Reports you can create a report based on the survey by clicking the tab New Report. See the section Reports > New Report for more information.
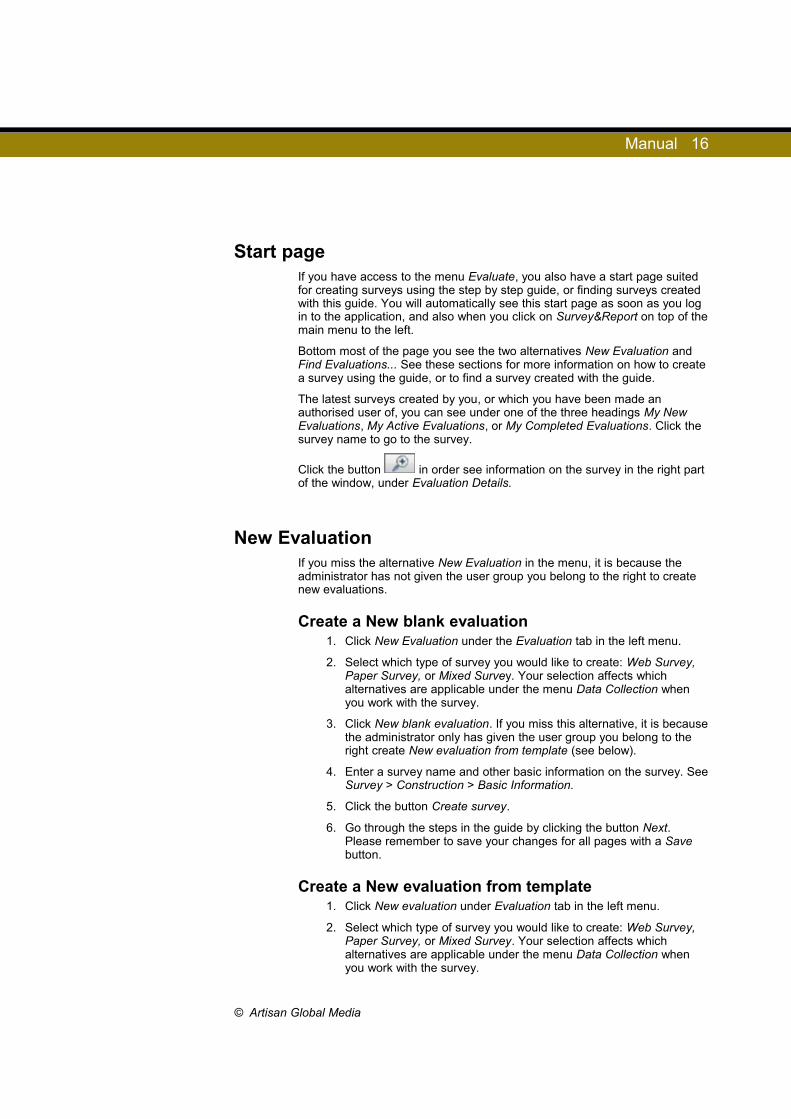
If the survey contains any questions from a survey template, and this survey also is connected to so called predefined reports, they are listed under the menu Evaluate > Reports. A predefined report contains preselected questions from one or several survey templates that the survey uses, and the administrator has already defined the presentation of these questions. You click the name of the report in order to create and view it. In the example below the report Students is created whereas the symbol shows that the report Teachers has not yet been created.
When you have clicked on a predefined report in the menu Evaluation > Report you will automatically be transferred to the tab Preview. Other tabs on the page are Export, Distribution and Subreports and finally Edit Report. By clicking the tab Edit Report you will get a page divided in the sub-tabs Properties, Header/Footer, Data Set, Report Content, Layout, Export and View Report. The tab View report leads back to the tab Preview. See the corresponding sections under Reports for more information on what you can do under the different tabs.
© Artisan Global Media
Manual 16
Start pageIf you have access to the menu Evaluate, you also have a start page suited for creating surveys using the step by step guide, or finding surveys created with this guide. You will automatically see this start page as soon as you log in to the application, and also when you click on Survey&Report on top of the main menu to the left.
Bottom most of the page you see the two alternatives New Evaluation and Find Evaluations... See these sections for more information on how to create a survey using the guide, or to find a survey created with the guide.
The latest surveys created by you, or which you have been made an authorised user of, you can see under one of the three headings My New Evaluations, My Active Evaluations, or My Completed Evaluations. Click the survey name to go to the survey.
Click the button in order see information on the survey in the right part of the window, under Evaluation Details.
New EvaluationIf you miss the alternative New Evaluation in the menu, it is because the administrator has not given the user group you belong to the right to create new evaluations.
Create a New blank evaluation1. Click New Evaluation under the Evaluation tab in the left menu.
2. Select which type of survey you would like to create: Web Survey, Paper Survey, or Mixed Survey. Your selection affects which alternatives are applicable under the menu Data Collection when you work with the survey.
3. Click New blank evaluation. If you miss this alternative, it is because the administrator only has given the user group you belong to the right create New evaluation from template (see below).
4. Enter a survey name and other basic information on the survey. See Survey > Construction > Basic Information.
5. Click the button Create survey.
6. Go through the steps in the guide by clicking the button Next. Please remember to save your changes for all pages with a Save button.
Create a New evaluation from template1. Click New evaluation under Evaluation tab in the left menu.
2. Select which type of survey you would like to create: Web Survey, Paper Survey, or Mixed Survey. Your selection affects which alternatives are applicable under the menu Data Collection when you work with the survey.
© Artisan Global Media

Manual 17
3. Click New evaluation from template.
4. Select which template you want to base your survey on by clicking it. Topmost on the page, you can filter the survey templates shown in the list by choosing a survey category.
Alternatively, write a search text and click .
5. Enter survey name, survey type, publication period and whether the survey should be closed automatically when the publication period ends. Other basic information is inherited from the template which the survey is based on. If you want to change anything in the basic information, you can return to the Basic information by clicking the button Previous. Read more about the settings under Survey > Construction > Basic Information.
6. Click the button Create survey.
7. Go through the steps in the guide by clicking the button Next. Please remember to save your changes for all pages with a Save button.
Find EvaluationsWhen you click Find Evaluations... a pop-up window is opened where you can see the surveys created with evaluation which you are entitled to administrate. The surveys are listed with this information:
• (public survey)
• ID
• Name
• Status
• Publication period
• Owner (who created the survey)
You can click one of the headings in order to get the list in either ascending, or descending order regarding the selected information.
If there is a large number of surveys you can use the topmost search field in order to find a certain survey. Write the entire name or a part of the name in the field and click the button Search.
You can also filter the list by using the Advanced Search .
Open the survey you would like to work with by clicking the name. You can
also click the button in order to see information on number of questions, or number of responses among other details.
© Artisan Global Media
Manual 18
Survey StatusThis page is shown when you have selected a survey under Find survey...
followed by clicking the icon to the right of the survey name, under the menu Evaluation.
On this page you can see the following information on the survey:
• Survey name
• Category
• Survey type
• Theme
• Publication period
• Survey URL(s)
• Number of questions
• Number of pages
• If the construction is finished
• Number of respondents
• Number of responses
• Response rate
• Number of reports based on the survey
• Survey status - Construction, Active, Publication Pending, Closed or Archived
Bottommost there is a button Continue that you click in order to move on to the last visited step in the guide.
Depending of the survey status, there are buttons in order to finish the construction, as well as to delete, close, reopen, or to archive the survey. Read more about this buttons in the section Survey > Survey status. There is also information about the possible predefined reports that are shown on the page, and how you create these by using the button Create reports.
Respondents
Add RespondentsClick the button Add Respondents... The import is made in the same way as under Survey > Data Collection. See this section for more information.
© Artisan Global Media

Manual 19
SurveyWhen you expand the Survey menu the options New survey and Find survey... are displayed. Choose the appropriate option depending on whether you want to create a new survey or work on an existing one.
If you have already chosen a survey to work with, the name and status of that survey is displayed at the top of the menu.
You can go to the Survey status page for the survey by clicking the icon.
New Survey A new survey can be created by:
• Creating an empty survey. • Copying an existing survey. • Creating the survey based on a survey template.
Creating New Empty Surveys 1. Click on New survey under Survey in the main menu. The New
survey option can also be found on the home page which is displayed directly after login. You can also go to the home page by clicking Survey&Report above the main menu.
2. Enter a name for the survey. 3. You can enter the other information on the page either now or at a
later date, read about the Basic information for further details. 4. Click on Create survey.
Copying Surveys 1. Click the down arrow next to New survey in the main menu. 2. Select Copy ... 3. When a pop-up window appears, click on the survey you want to
copy. To preview the survey, click the icon on the right. The surveys that are available in the list are those which have the setting "May be copied by everyone" activated. You can also copy the surveys you have created yourself, and the ones you have been connected to as an authorized user. Super administrators have the right to copy all surveys.
4. Enter a name for the new survey. The program will suggest a name based on the name of the original survey.
5. You can add other information to this page, either now or at a later date. See the section on Basic information.
6. Click on Create survey.
You can also copy a survey by clicking the Copy Survey... button at the bottom of the Survey Status page. This page appears when you select a
survey under Find survey... You can also access it by clicking the icon to the right of the survey name in the Survey menu. After clicking the Copy Survey button you follow the steps 4-6 above.
© Artisan Global Media

Manual 20
Creating Surveys with Survey Templates Survey templates are created by users who through their user group have access to the menu Templates > Survey Templates > New Survey Template. See this section for information on how to create survey templates. To use them, you do the following:
1. Click the down arrow next to New survey in the main menu. 2. Select Template ... 3. When a pop-up window appears, click on the template you want to
use. To preview the template, click the icon on the right. 4. Enter a name for the new survey. The program will suggest a name
based on that of the template. 5. You can add other information to this page, either now or at a later
date. See the section on Basic information. 6. Click on Create survey.
Finding SurveysWhen you click on Find survey ... a pop-up window opens where the 50 newest surveys are listed. Click the Search button to list all surveys, except for those that are filed in the archive. Mark the check box at Include surveys from the archive if you want to include those too. The surveys are listed using the following headings:
• Survey name• Status• Survey type (respondent or public)• Owner (the user that created the survey)• Category• Responses (the number of respondents who have answered the
survey)
You can click on these headings to sort the list in an alphabetical order, ascending or descending, according to each respective heading.
If there is a large number of surveys, you can use the search box at the top of the page to find a particular survey. Type in a search term in the box and click on Search. Both full and partial survey names can be used as search terms.
There is also an advanced search mode that you access by clicking
the button, next to the Search button. In that mode, you can search for survey name, survey type (public survey or respondent survey), period within which the survey was published, survey category, status (construction, publication pending, active, closed or filed in archive), survey language and owner (the user that created the survey). Make your selections and click the Search button.
Select the survey you want to work on by clicking on it.
© Artisan Global Media
Manual 21
My surveysThe page My Surveys can display a list of every survey you have access to, but the setting Only my surveys is default. Through this page you can anonymise, close and archive one or more of the surveys that you have rights to modify. You can also restore surveys from the archive.
List content:
Status icons
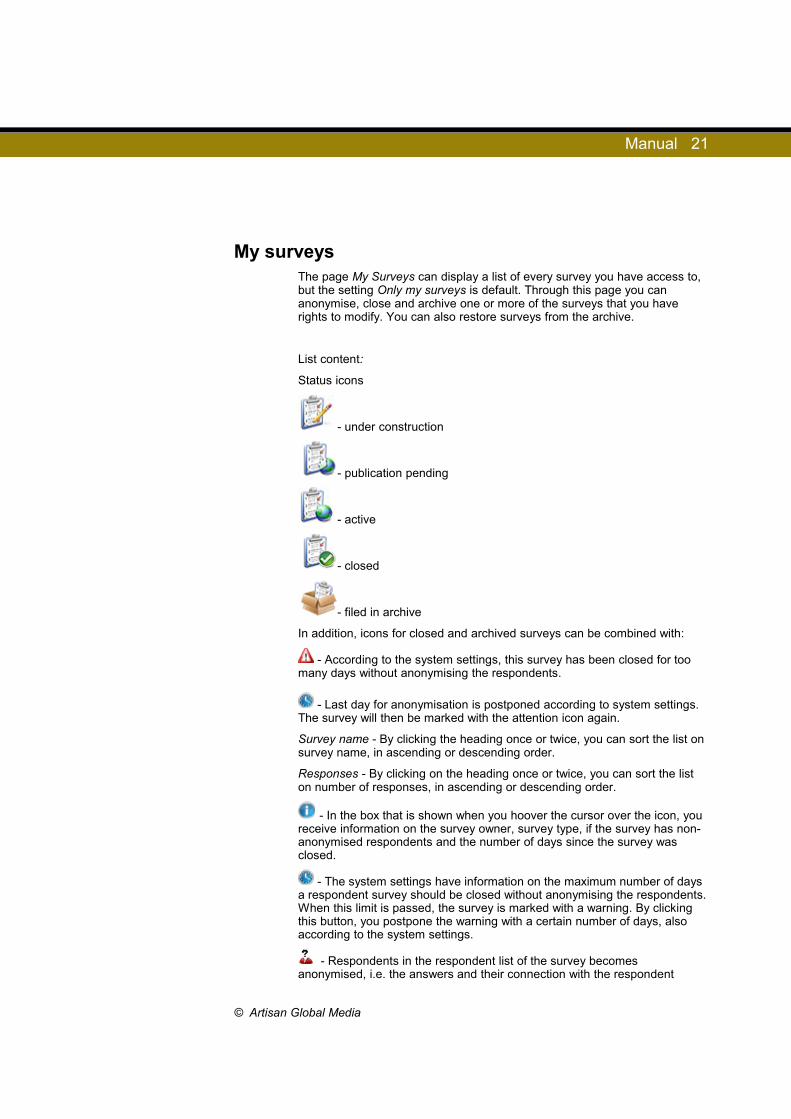
- under construction
- publication pending
- active
- closed
- filed in archive
In addition, icons for closed and archived surveys can be combined with:
- According to the system settings, this survey has been closed for too many days without anonymising the respondents.
- Last day for anonymisation is postponed according to system settings. The survey will then be marked with the attention icon again.
Survey name - By clicking the heading once or twice, you can sort the list on survey name, in ascending or descending order.
Responses - By clicking on the heading once or twice, you can sort the list on number of responses, in ascending or descending order.
- In the box that is shown when you hoover the cursor over the icon, you receive information on the survey owner, survey type, if the survey has non-anonymised respondents and the number of days since the survey was closed.
- The system settings have information on the maximum number of days a respondent survey should be closed without anonymising the respondents. When this limit is passed, the survey is marked with a warning. By clicking this button, you postpone the warning with a certain number of days, also according to the system settings.
- Respondents in the respondent list of the survey becomes anonymised, i.e. the answers and their connection with the respondent
© Artisan Global Media

Manual 22
categories are retained, but other respondent data are cleared.
Depending on the current status:
- Close the survey
- Archive survey
- Restore from archive
- To the status page of the survey
Filtering of the listIf there are a large number of surveys in the list, you can use the search field at the top to find a particular survey. Enter the search argument in the field and click the Search button. As a search argument, you can use the entire, or parts of the survey name.
Via the button , you get to the advanced search mode were you can search on survey name, type (public survey or respondent survey), period when the survey was published, survey category, status (construction, pending publication, active, closed or archived), language, owner (who created the survey) as well as organisation if used.
Other filtering options:
• Include surveys from the archive - Initially the list is displayed without archived surveys.
• Only my surveys - Initially all surveys that you own are displayed, but by unmarking this setting you will see all surveys you have read permissions to.
• Only surveys that have not been anonymised - Using this setting you will see the surveys that have not been anonymised, even though it is more days since the survey closed than deemed appropriate according to the settings of the system.
© Artisan Global Media

Manual 23
Handling several surveys at a timeYou select/deselect a survey by clicking once in the field for survey name, responses, or information icon. The selection is shown by the line becoming blue-coloured. (The effect is visible first after moving the cursor.) If you want to handle several surveys at a time, you can select multiple rows. All surveys in the list can be marked via the Select All button in the bottom menu.
Depending on which surveys you have selected in the list, corresponding buttons appear in the bottom menu:
• Postpone anonymisation
• Anonymise
• Close survey
• Archive survey
• Restore from archive
Survey Status This page appears when you select a survey under Find survey...
Using the icon to the right of the survey name in the left menu Survey, is another way to get to this page.
The Survey status page serves as a home page for the survey. Here you can choose what tasks you want to perform under the headings Survey construction, Data collection and Reports. The options under the latter two are available once the survey construction phase has been completed.
The page also displays the following information about the chosen survey:
• Survey name
• Category
• Survey type - Respondent survey or Public survey
• Theme - which theme has been chosen for the survey design
• Publication period
• The survey URL - the web address for the survey
• Number of questions
• Number of pages
• Whether or not construction has been completed
• Number of respondents (respondent surveys only)
• Expected number of responses (public surveys only)
• Number of responses
• Response rate
• Number of reports based on the survey
© Artisan Global Media
Manual 24
• Survey status - Construction, Active, Publication pending, Closed, or Filed in the archive
• Answer statistics - a chart that shows, per day, the number of Submitted answers and Unsubmitted answers (answers where the respondent has started to answer without submitting the survey)
Depending on the survey status, the following buttons may or may not be available below:
• Finish construction... - only if the current survey status is Construction. See the section called Finish construction for more information.
• Remove - only if current survey status is Construction, Publication pending, Closed or Filed in the archive.
• Close survey... - only if the current survey status is Active or Publication pending. See the section called Close survey for more information.
• Reopen survey - only if the current status of the survey is Closed. See below.
• Archive survey - only if the current status of the survey is Closed. See below.
• Restore from archive - only if the current status of the survey is Filed in archive. See below.
• Anonymise - only if the current status of the survey is Closed. See below.
Regardless of the survey status, the button Copy survey... is always available. This button is used for creating a copy of the survey. Users who have the right to create survey templates have also access to the button Copy as template... Click this button to create a survey template which is identical to the current survey. Give the survey template a name and click the Create Template button. Please note that the original survey is not affected when you save it as a survey template.
Reopening SurveysA survey with the status Closed can be reopened, and its status will then be Active.
By clicking the icon you go to the Survey status page where you will find the button Reopen survey. Confirm with OK.
© Artisan Global Media

Manual 25
Archiving SurveysSurveys that are not current, but that you wish to save for future reference, can be archived. They are then still available in the system, but they will not be displayed in the results when your search for surveys. The default settings in the Find Survey... pop-up window specify that surveys filed in the archive are not to be displayed among the search results. However, you can choose to display them by marking the check box at Include surveys from the archive.
The same applies to searches under Find report... Reports based on archived surveys are only displayed if you mark the check box at Include reports from surveys in the archive.
If a survey is to be archived, it must be Closed first.
By clicking the icon you go to the Survey status page where you will find the button Archive survey. Confirm with OK.
Note: By archiving surveys and setting the rules for automatic data clean-up, surveys with its responses and reports will be removed from both the system and the database. If you instead remove a survey via the Delete button, the survey will disappear, including its responses and reports, from the system, but remains in the database.
Restoring from archiveIf you have enabled Data clean-up, surveys that have been archived longer than a certain number of days will be erased. At the same time, questions and answers, appurtenant reports, survey specific respondents, as well as the respondents that have been connected to only this archived survey, will be erased too. An easy way to save a survey from the data clean-up is to restore it from the archive. Read more on Data clean-up under Administration > Settings > Survey > Automation.
1. Open the start page of the survey, Survey Status, by clicking the
icon .
2. Click the button Restore from archive. The status of the survey is now Closed.
© Artisan Global Media

Manual 26
Creating Predefined ReportsThe heading Predefined reports and the button Create reports are displayed if the survey contains questions from survey templates. To survey templates, so-called predefined reports can be connected. A predefined report contains questions from one or more survey templates, and in the report, it has been defined how these questions should be presented. Read more about predefined reports in the section Templates > Survey templates > Reports.
Under the heading Predefined reports, a table shows which predefined reports are available, and from which survey template(s) their questions are gathered. Mark the check box next to the reports you want to create and click
the Create reports button. The symbol indicates that the report has already been created.
Survey ConstructionThe Survey construction menu gives you access to the following subpages:
• Basic information - You enter a survey name, the publication period and define the Introductory text and Headers/Footers.
• Questions - You construct the questions for the survey and you also translate multilingual surveys, manage page breaks and create Filters.
• Design - You select and edit the visual design Theme of the survey.
• Preview - You see what the survey will look like to the respondents. This is also where you can test the filters you may have created.
• Finish construction - here you choose a number of settings upon completing the construction phase. The survey then becomes Active
© Artisan Global Media
Manual 27
Basic Information
Properties
Information 1. First you need to decide on a Survey name.
2. Select whether the survey is to be a Respondent survey, or a Public survey. A respondent survey can only be answered by those respondents who have been connected to it under Survey > Data Collection > Respondents, while a Public survey can be answered by anyone who has access to the URL for the survey.
Select the respondent type for your survey if you want to:
* obtain a more reliable result - you will know who has responded, and that no one has submitted their answers more than once
* be able to send reminders, straight from the program, to those who have not yet responded
* use respondent categories, ie. known background facts, in your reports
Select the public type if you want to:
* simplify survey distribution - the survey link is the same for everyone, and thus it can easily be published on a website or sent out via e-mail
Anonymous respondent surveys
Choosing the respondent type gives you the possibility to mark the check box Anonymous.
Strict anonymity means that you no longer can:
• look in the respondent list to see which respondents that have answered
• answer the survey for a respondent from the respondent list
• see who has received mailings (Exception: The respondents with bounced e-mails are listed under
Furthermore, it is required that the survey is closed before you can:
• export raw data under Data Collection > Export
• create a report based on the survey
• see/edit text answers (under Data Collection > Text answers)
The application can be set to allow exceptions from the strict anonymity on survey level. Read more under Administration > Settings > Survey > General Settings.
In that case, the check box Allow exceptions from the restrictions which apply to anonymous surveys is shown.
© Artisan Global Media
Manual 28
This means a lighter degree of anonymity; the answers of the respondent are connected to respondent categories but no other respondent data, such as the name. In other words, you cannot see who has answered what. In the same time you evade the restrictions mentioned in the bullet list above.
NB: If the survey is set to be anonymous when you finish the construction, it cannot be reverted to be non-anonymous.
Consent
The following settings are displayed only if administrators have activated the consent that the respondent approves before answering the survey, under Personal data > Settings.
• Ask for consent - The setting is displayed if it is optional for the survey owner to use the respondent's consent on the specific survey.
• Consent form - The standard form can be exchanged for a form in the list. The new form can be further customised under the activated tab Consent Form.
• Consent refused page - The default form can be exchanged for a form in the list. The new form can be further customised under the tab Consent Refused.
Language
If the survey is to be monolingual, make sure that the correct language is selected under Default language. Buttons and referential information will appear in that language in the survey.
If respondents speaking different languages are to answer the survey, it can be made multilingual. You then need to select Yes under Multilingual and specify the languages that are to be used in the drop down list. The administrator determines which languages are to be available in this list under Administration > Languages and Translations > Settings > Survey languages. The questions in multilingual surveys are translated under Survey > Survey Construction > Questions > Translate Survey.
Language is a required field in the respondent details, and all respondents will automatically receive every survey in their specified languages. If a survey has not been translated into the respondent's preferred language he or she will instead receive the survey in the language that has been selected as the survey's Default language.
Next to the headline Owner you can see which user that created the survey.
CategorySelect to which category or categories your survey will belong, by marking the check box next to the desired categories. If a survey category has subcategories, you click the button to expand it.
In the Find Survey menu, you can in the advanced search mode use survey category as a search argument.
© Artisan Global Media

Manual 29
Basic Information
Information
1. First you need to decide on a Survey name.
2. Select whether the survey is to be a Respondent survey, or a Public survey. A respondent survey can only be answered by those respondents who have been connected to it under Survey > Data Collection > Respondents, while a Public survey can be answered by anyone who has access to the URL for the survey.
Select the respondent type for your survey if you want to:
* obtain a more reliable result - you will know who has responded, and that no one has submitted their answers more than once
* be able to send reminders, straight from the program, to those who have not yet responded
* use respondent categories, ie. known background facts, in your reports
Select the public type if you want to:
* simplify survey distribution - the survey link is the same for everyone, and thus it can easily be published on a website or sent out via e-mail
Anonymous respondent surveys
Choosing the respondent type gives you the possibility to mark the check box Anonymous.
Strict anonymity means that you no longer can:
• look in the respondent list to see which respondents that have answered
• answer the survey for a respondent from the respondent list
• see who has received mailings (Exception: The respondents with bounced e-mails are listed under Details)
Furthermore, it is required that the survey is closed before you can:
• export raw data under Data Collection > Export
• create a report based on the survey
• see/edit text answers (under Data Collection > Text answers)
The application can be set to allow exceptions from the strict anonymity on survey level. Read more under Administration > Settings > Surveys > General Settings.
In that case, the check box Allow exceptions from the restrictions which apply to anonymous surveys is shown.
This means a lighter degree of anonymity; the answers of the respondent are connected to respondent categories but no other respondent data, such as
© Artisan Global Media

Manual 30
the name. In other words, you cannot see who has answered what. In the same time you evade the restrictions mentioned in the bullet list above.
NB: If the survey is set to be anonymous when you finish the construction, it cannot be reverted to be non-anonymous.
Consent
The following settings are displayed only if administrators have activated the consent that the respondent approves before answering the survey, under Personal data > Settings.
• Ask for consent - The setting is displayed if it is optional for the survey owner to use the respondent's consent on the specific survey.
• Consent form - The standard form can be exchanged for a form in the list. The new form can be further customised under the activated tab Consent Form.
• Consent refused page - The default form can be exchanged for a form in the list. The new form can be further customised under the tab Consent Refused.
Language
If the survey is to be monolingual, make sure that the correct language is selected under Default language. Buttons and referential information will appear in that language in the survey.
If respondents speaking different languages are to answer the survey, it can be made multilingual. You then need to select Yes under Multilingual and specify the languages that are to be used in the drop down list. The administrator determines which languages are to be available in this list under Administration > Languages and Translations > Settings > Survey languages. The questions in multilingual surveys are translated under Survey > Survey Construction > Questions > Translate Survey.
Language is a required field in the respondent details, and all respondents will automatically receive every survey in their specified languages. If a survey has not been translated into the respondent's preferred language he or she will instead receive the survey in the language that has been selected as the survey's Default language.
Next to the headline Owner you can see which user that created the survey.
CategorySelect to which category or categories your survey will belong, by marking the check box next to the desired categories. If a survey category has subcategories, you click the button to expand it.
In the Find Survey menu, you can in the advanced search mode use survey category as a search argument.
© Artisan Global Media
Manual 31
Settings
Respondent Data Settings
These settings only apply to Respondent surveys. When a respondent is added to the system, his or her personal data is added in their Respondent details. For each survey, you then need to make certain decisions regarding the respondents and their data. These settings determine whether the respondent is able to see, and possibly even edit, his or her personal data when answering the survey.
• Specify whether personal data is to be:
• Hidden - the respondent cannot see his/her personal data
• Visible is shown in the upper right corner of the survey, next to the respondent's name. When the respondent has clicked the button, he or she can check his/her personal data.
• Visible and editable is shown in the upper right corner of the survey, next to the respondent's name. When the respondent has clicked the button, he or she can check his/her person data and edit it. Read more under Data Collection > Respondents.
Note: The buttons above are not shown in the mobile view of the survey. The desktop view must be used also when the respondents uses mobile devices.
Under Visible and Visible and editable you can select whether the setting is also to apply to respondent categories (Include categories) and respondent properties (Include properties).
• If you select Yes to activate the setting Allow comment, it will be possible to write a comment on each respondent in the respondent list. This can be useful for those who interview respondents.
• When a respondent tries to go to the survey after it has been submitted, normally, the message "You have already replied to this survey" is displayed. The setting Allow respondents to modify answers after submitting the survey makes it possible for the respondents to go to the survey and change their answers, even after it is submitted. The setting is only available on non-anonymous respondent surveys. If you activate this setting you should inform the respondents that their submitted answers will be updated as soon as they click Next page (if the survey is multi-page) or Save, not only when they click Submit.
© Artisan Global Media

Manual 32
Settings for Public Surveys
These settings only apply to public surveys. A Public survey requires no log-in and can thus be answered by anyone who has access to the survey link. To make it more difficult for a person to fill out the survey several times, you can choose between the following settings regarding submissions from a single computer. The following options are available:
• No limitations• Only one submission per computer• New submission possible [a specified number of hours] hour(s)
after the previous submission
The latter option can be useful when it is expected that the survey will be answered from a computer that is shared by many people. The setting makes it impossible to click Send survey again and again, but after a specified time has passed and it can be assumed that a new person is using the computer, it will again be possible to fill out and submit the survey.
You have also the possibility to enter an Expected number of responses. The program will use this number to calculate the response rate.
Respondent Categories
Sometimes it is desirable to use previously known facts about respondents as background variables for the Reports. To let you avoid having to ask about such, already known, information in the surveys, the administrator can define so-called Respondent categories and subcategories under Administration > Settings > Surveys > Categories. One such example is the category Sex with the subcategories Male and Female. The correct subcategory for each respondent category needs to be entered in the details for each respondent and can of course be re-used on other surveys.
NB: You must add the respondent categories before you finish the survey construction. This cannot be done when the survey is active.
Adding Respondent Categories Respondent categories can only be used on surveys of the Respondent survey type.
1. Click the Add ... button under Respondent categories.2. In black text you see the general categories created under
Administration > Respondents > Respondent Attributes > Categories. Categories displayed in green are so-called survey-specific categories. For information on how to create them, please see below.
3. Mark the categories you want to use for your survey. By clicking the down arrow you will be able to see the subcategories available for each category.
4. Click OK.
Survey –specific categoriesThe respondent categories which should be available to use for all surveys, are created under Administration > Respondents > Respondent Attributes > Categories. If you work with a survey and want to add a respondent category not yet created, you have the possibility to create a so-called survey-specific respondent category. Use this possibility if you don’t expect the new category to be used generally by all users, but merely on this particular survey and maybe also on surveys that you yourself will create in the future.
© Artisan Global Media
Manual 33
The owner of the survey where the category was created, as well as administrators, are able to use survey-specific category on other surveys.
1. Click the button Add… under the headline Respondent Categories.2. Click the New category… button3. Click the button4. Enter the name of the new category in all active languages and click
Save5. Click on the new category. A second column is displayed to the right
of the first one.6. Click the button above the second column to create the first
subcategory.7. Enter a name in all active languages and click Save8. Repeat steps 6-7 to create the other subcategories. The
subcategories are displayed in the second column.9. If you want to create an additional level of subcategories, you click a
category in the second column, and then the button above the third column. In that way you can build a hierarchical structure with the desired number of levels. Each level is symbolized by a new column.
10. Click Save11. Mark the check box next to the category under Survey-specific
categories and click OK. 12. The category is displayed in red text in the list under Respondent
categories. When you click Save, the colour changes to green. The category is now created and connected to the survey.
The survey-specific categories can be edited and deleted by the administrator under Administration > Respondents > Respondent Attributes > Survey-specific categories.
Removing Respondent Categories
1. Mark the check box next to the categories you wish to remove.2. Click on Remove.
Layout
Header/Footer
Here you select whether a page header and/or footer are to appear at the top and bottom of each page in the survey. In the drop down lists Header and Footer, you can choose among the templates for headers and footers which have been created under Templates > Survey Design. In the drop down list, each template is displayed with an ID to the left, and a preview of its layout. You can also select the option None, if you do not wish to display a header/footer.
When you have selected a header or footer, the tab Header/Footer becomes available. Under this tab, you can customise the header/footer you have selected. See this section for more information.
If you have customised a header or a footer under the Header/Footer tab, it
is displayed in the drop down list with the symbol * instead of an ID. The symbol indicates that it is a customised header or footer. Note that the
© Artisan Global Media

Manual 34
program only saves the latest customised header/footer. If you select another header/footer, and customise it, the previous one disappears from the drop down list.
Survey themeThe look of the survey regarding fonts, colours and so on are determined by the selected Survey theme. Choose a pre-defined layout or the standard layout. Users who are authorized to edit the selected theme in a survey can then make changes and create a custom design under Survey > Survey Constrcution > Design.
Numbering
Select whether or not the questions are to be numbered, and if so, how they are to be numbered:
• None - suitable if you want to number the questions yourself, for instance as 1a, 1b, etc.
• Decimal - questions are numbered sequentially: 1, 2, 3, etc.
• Roman - questions are numbered sequentially: I, II, III, etc.
You can later choose for each question if the numbering should be displayed or not.
Progress indicator
Select whether or not to display a Progress indicator (specifying how much of the survey has been completed) at the bottom of each page in the survey. The progress can be displayed graphically in the form of a horizontal bar or as text:
• None - neither a bar nor text is displayed
• Progress bar, Pages - a progress bar indicates how many percent of the pages have been completed, including the page currently viewed by the respondent
• Progress bar, Questions - a progress bar indicates how many percent of the survey questions have been completed, including the page currently viewed by the respondent
• Text, Pages - the page currently viewed by the respondent as well as the total number of pages are displayed as text, e.g. 2/5
• Text - Questions - the number of questions including the page currently viewed by the respondent and the total number of questions are shown as text, e.g. 8/20
The alternatives above cannot be edited in the theme under the menu Design.
The progress indicator could also be of the type Navigation, and be used by the respondent in order to jump between pages in the survey.
• Buttons - each page number is shown as a rectangular button in the lower part of the page
• Page numbers, Linked - each page number is shown as a link in the lower part of the page
© Artisan Global Media

Manual 35
• Dropdown list - each page number is shown as an alternative in the dropdown list
• Page numbers, Not linked - each page number is shown in the lower part of the page, but the respondent can only navigate one page forward or backward at the time using the buttons Next page and Previous page
In the theme template under the menu Design you could also affect the appearance of the type Navigation. Read more in the section Design.
Note! It is inadvisable to give respondents the possibility to jump between pages if the survey contains compulsory questions and/or filters.
One question per page
Marking the check box One question per page is an easy way of creating a page break after each question. You can also create custom page breaks under Survey > Survey Construction Questions > Arrange.
Page break after introductory text
Mark this check box if you want the the first page of the survey to contain only the introductory text. The questions will consequently start at the second page. The introductory text is created under the tab Introductory text.
Mobile
The program creates automatically a survey version adapted to mobile devices. Respondents using a mobile device when answering the survey will get this version as default. Here you can change the default view for mobile devices to Desktop if you want to, and also decide whether it shall be possible to switch between Mobile and Desktop. You can see what the mobile version looks like by clicking the Mobile view button under the menu Survey > Survey Construction > Preview.
Survey texts
Under Administration > Languages and Translations > Translation > Survey Texts, administrators decide general texts for buttons and messages that the respondent sees while answering a survey. By marking the check box Enable custom texts for this survey, you can change the texts, specific for the current survey, for the following buttons / checkbox / message:
• Submit
• Save
• Next page
• Previous page
• 'Accept' button'
• Refuse' button
• Checkbox title
• Confirm refusal
© Artisan Global Media

Manual 36
Access
Authorised Users
If you want users other than yourself to be able to work on the survey, you can add them as Authorized users. These users also gain access to and are authorized to create and view reports based on the survey. Users who (through their group) have the right Survey Access > All surveys, are automatically considered Authorized users on all surveys and need not be added.
If you have created organisations under Administration > Organisations, you can only add users who belong to at least one of the organisations you belong to yourself, unless you do not belong to a user group with the right Add authorized users regardless of organisation.
You can also connect groups to the survey. By doing this, you give all users in the group authority to the survey.
Adding Authorised Users
1. Click the Add... button2. Mark the check box next to the users and groups you want to
connect to the survey3. Click OK
Removing Authorised Users
1. Mark the check box next to the users or groups you want to remove.2. Click on Remove.
Other settings
• May be copied by everyone - The setting determines who shall have the right to copy the survey when selecting New survey > Copy Survey…
• Yes – the survey can be copied by all users
• No – the survey can only be copied by users who (through their group) have the right Survey Access > All surveys, the owner (the user who created the survey) and users or groups connected to the survey under Authorized users.
• Make this survey private - Users can through their user group be given the right to see all surveys. The setting Make this survey private means that those users will not see the current survey. No other than the user who created the survey, any authorized users who have been connected, and super administrators will then see the survey.
• Minimum response count to view result - You specify the number of respondents who must have answered before you can create a report on the survey, and export the answers from Data Collection > Export. This setting can be made on all surveys, regardless of type, but is primarily used for anonymous surveys to prevent that the result can be displayed when only a few respondents have answered. In this way, the anonymity is protected even for those who answer in an early stage.
© Artisan Global Media

Manual 37
After the survey construction is finished, the value can only be changed by super administrators.
For each survey type, a default value can be defined which is prefilled when surveys are created. This is made under Administration > Settings > Surveys > General settings.
• Allow 'Individual answers' variable in the report dataset - If you activate the setting Allow 'Individual answers' variable in the report dataset, it will be possible in reports based on the survey to display each individual respondent's answers separately. In the report, you can for example use the Answers variable as a background series on a question, and thereby create a contingency table where the answers are grouped per respondent. You can also use the Answers variable as a selection in a sub-report, and thereby create a report containing an individual respondent's answers.
• Maximum number of respondents - If the function Limit amount of respondents per survey is activated in the system, you can gather two facts regarding how many respondents that are possible to connect to the survey. Your individual limit is written in brackets and is generated from the settings concerning the user groups you belong to. If you need to exceed the limit, you can add a user with a higher limit as an authorised user (see above). This user is then able to add the extra respondents to the survey.
Further, if the authorised user has the right to increase the limit on survey level (see the section User rights), he/she could increase the number in the box. This will consequently mean that the possibility to add the extra respondents is handed over to the owner of the survey.
A Super Administrator also sees an extra check box to mark; Maximum number of respondents is unlimited. Such a mark makes the survey excluded from all settings regarding respondent limitations.
Organisation access
If you have created organisations under Administration > Organisations you can under the heading Organisation Access decide which organisations are to have access to the survey, by marking the check box next to the desired organisations. The organisation you belong to (or, if you belong to several organisations, the one which is selected in the organisation drop down list) is already marked. To be able to give an organisation access to surveys, you must belong to this organisation yourself.
If you have a hierarchical structure of organisations, any parent organisations to selected organisations will automatically be selected. The symbol to the right of an organisation indicates that the organisation has access to the survey, while organisations without access have the symbol.
To have access to the survey, users in the connected organisations must (through their group) have the right Survey Access > All surveys.
© Artisan Global Media
Manual 38
Publishing
You need to specify a publication period for the survey, e.g. the time during which the survey is open for answering. Start and end dates can be entered manually by typing in the dates on the keyboard or by clicking the calendar icon and selecting the correct dates in the calendar. The date format depends on the language you selected at log-in. If your selected language is English, you enter the dates in a DD-MM-YYYY format. The publication period can be extended, for instance if you have not received a sufficient number of responses, even after you have completed the Survey construction phase.
You can close the survey manually, see the section on Closing surveys, but to make sure that this task is not forgotten, you can select for the survey to be closed automatically. By marking the check box Automatically close the survey when above selected publication period ends, you ascertain that this is done automatically for you. If you want the user who created the survey to be notified of that the survey has been automatically closed, you mark the check box Send a notification e-mail to the owner when the survey is closed.
The content of the e-mail is decided by a general template created by the administrator under Administration > E-mails and Mailings > E-mail Templates > Notify survey owner message.
Validation message
When a respondent submits a survey, a message is displayed in case a compulsory question is not answered, or if an invalid answer has been given to a question. Next to the headline Validation message, you can choose from two ways of displaying these messages.
• Default means that an icon is displayed next to a question that has not been answered correctly. By hovering the cursor over the icon, the respondent can see a tooltip describing what is wrong.
• If you instead select Extended, information is displayed at the top of the survey with links to all questions that have not been answered correctly. Selecting the extended presentation is a way of making the survey accessible for visual impaired people using screen reader software.
Printing of the survey
If you select Yes at the setting Respondent may print survey before sending it, the respondent will have a Print button next to the Submit button, when answering the survey. When printing, it is recommended that a setting is enabled in the browser that allows the background (colours and images) to be printed.
The 'Save' and 'Previous page' buttons
When answering a non-anonymous respondent survey, the respondent has access to the Save button. This button can be used for saving the answers, if the respondent wants to leave the survey without submitting it, and resume later. You can hide this button, by selecting No at Respondents are allowed to save and resume the survey at a later date, if you want the respondents to submit the survey directly when answering it.
If you want the respondents to answer the pages of the survey in the order you have decided, without having the possibility to go back to previously
© Artisan Global Media

Manual 39
answered pages, you select No at Respondents are allowed to go back to previous page. The respondent will then not have access to the button Previous page when answering the survey.
When a survey has been submitted
When you finish the survey construction, you decide what should happen when a respondent has submitted the survey. Select one of these options:
• Display a 'Thank you message - see information below• Open this web page - specify a URL the respondent is redirected to
If you choose to display a thank you message, you can here select the message to display. In the drop down list Thank you message, you can choose among the templates for thank you messages which have been created under Templates > Survey Design. In the drop down list, each template is displayed with an ID to the left, and a preview of its layout. You can also select the option Simple, if you wish to display a message saying Thank you for your participation. This text can be changed under Administration > Languages and Translations > Translation > Survey Texts.
When you have selected a thank you message, the tab Thank You Message is activated. You can there customise a message specific for this survey. See this section for more information.
If you have customised a thank you message under the Thank you message tab, it is displayed in the drop down list with the symbol * instead of an ID.
The symbol indicates that it is a customised thank you message. Note that the program only saves the latest customised thank you message. If you select another thank you message, and customise it, the previous one disappears from the drop down list.
If you choose to display a thank you message, you can also activate the setting Allow respondents to download a PDF with their answers. The button Download answers will then be available as a part of the thank you message. The PDF file will contain the respondent's answers to the questions which have been answered. Not answered questions will not be included.
If you want to give the respondents a confirmation of that their answers have been registered, you can on respondent surveys activate the setting Send respondents a confirmation e-mail on submit. An e-mail will then be sent to the e-mail address the respondent has in his/her details. If you activate the setting Include a copy of the answers in the e-mail a PDF file containing the respondent's answers will be attached to the confirmation e-mail. If more than one e-mail account have been configured in your Survey&Report, you can select which one of them to send the confirmation e-mail from. The content of the e-mail is decided by the template you select at E-mail template. Templates for the confirmation e-mail are created by the administrator under Administration > E-mails and Mailings > E-mail Templates > On Submit message.
© Artisan Global Media

Manual 40
Survey URL(s)
Next to URL you can see the URL of the survey. The first part of the URL address refers to your system and cannot be changed. The automatically generated ending of the type Survey/234, however, is possible to change into something more describing, for example health.
Customise the URL of the survey
1. Write a free text in the field Custom URL. Note that the ending of the URL may not start with survey, preview or report. The URL of the survey must be unique and may not contain the characters & ? # : %.
2. Save your changing. Now you can see how the URL address contains your ending instead of Survey/(number).
Public preview
Before you finish the survey construction, you may want other people to preview the survey and approve it. By selecting Yes at Enabled under Public preview, the survey becomes available via the link displayed at URL. If you want to protect the survey with a password, you select Yes at Password protected, and enter the desired password in the field below.
Anyone who goes to the survey via the link, will get a message saying that the survey is displayed in a preview mode. If respondent categories are connected to the survey, the button Respondent categories is available in the preview mode. This button can be used to view the survey from different respondent categories' perspective, and to test any filters showing/hiding questions depending on which category the respondent belongs to.
© Artisan Global Media
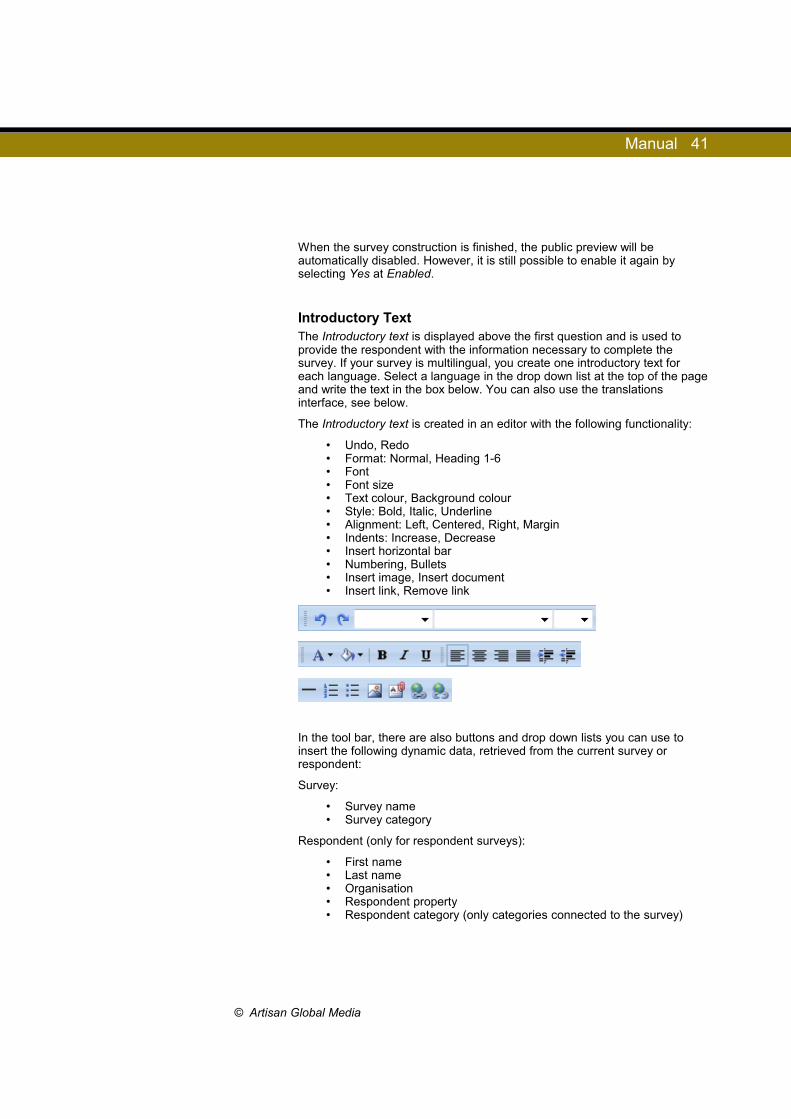
Manual 41
When the survey construction is finished, the public preview will be automatically disabled. However, it is still possible to enable it again by selecting Yes at Enabled.
Introductory Text The Introductory text is displayed above the first question and is used to provide the respondent with the information necessary to complete the survey. If your survey is multilingual, you create one introductory text for each language. Select a language in the drop down list at the top of the page and write the text in the box below. You can also use the translations interface, see below.
The Introductory text is created in an editor with the following functionality:
• Undo, Redo • Format: Normal, Heading 1-6 • Font • Font size • Text colour, Background colour • Style: Bold, Italic, Underline • Alignment: Left, Centered, Right, Margin • Indents: Increase, Decrease • Insert horizontal bar • Numbering, Bullets • Insert image, Insert document • Insert link, Remove link
In the tool bar, there are also buttons and drop down lists you can use to insert the following dynamic data, retrieved from the current survey or respondent:
Survey:
• Survey name• Survey category
Respondent (only for respondent surveys):
• First name• Last name• Organisation• Respondent property• Respondent category (only categories connected to the survey)
© Artisan Global Media

Manual 42
Inserting Images1. Place the text cursor where you want to insert the image and click
the button to open the image archive.2. Click on the folder containing the image you want to insert, or
search for it by clicking the icon.3. Select the image by clicking on its name in the list, so that its row is
highlighted in a contrasting colour.4. Click on the Insert button.
Please refer to the Administration > Document and Image Library section for more information on how to upload images to the image archive.
Aligning Images
You can align an image to the right or to the left, letting the text in the same paragraph wrap around it. Right-click on the image and select Placement (Left or Right), and the margins you like to have around the image.
Linking to files
1. button to go to the document archive.2. Click on the folder containing the file you want to create a link to, or
search for it by clicking the icon.3. Select the file by clicking on its name in the list, so that its row is
highlighted in a contrasting colour.4. Click on the Insert button.
Please refer to the Administration > Document and Image Library section for more information on how to upload files to the document archive.
Linking to web or e-mail addresses1. Highlight the text or the image you want to link. Highlighting images
is made differently in different web browsers. In some browsers you just click the image, and in others you must click and drag from one end of the image to the other.
2. Click the button.3. Select the tab Hyperlink or the tab E-mail, depending on what type
of address you want to link to.4. Enter the desired Address.5. Click OK.
Translating Introductory TextsIf your survey is multilingual, you create one introductory text for each language. When you have written the text in one language you can translate it into the other languages by pressing the Translate button. A new interface will then open where you specify the source language (your original) in the left part of the window and the language you are translating into in the right part of it.
The button, which you find between the two fields, can provide help with the translation, giving you an automated translation into your chosen language. It is advisable that you check the suggested translation and
© Artisan Global Media
Manual 43
correct any mistakes. For the automatic translation service to work, it must be set up in the in the Administration. See the section on Languages and translations for more information on how this is done.
Page Headers/Footers Under Basic information > Properties > Layout, you select whether a page header or footer is to be displayed at the top and bottom of each page in the survey. You can, in the drop down lists Header and Footer, choose from the templates for headers and footers which have been created under Templates > Survey Design. The tab Header/Footer becomes available if you have selected a template in any of the drop down lists Header and Footer. The tab is not available if the option None is selected in both of the drop down lists.
Under the tab Header/Footer, you can make your own changes to the layout of the selected header/footer.
Editing Headers/Footers If your survey is multilingual, you first need to select the language for which you want to customise the header and footer. Then click either Edit header or Edit footer, depending on which of the two you want to edit.
You edit the header/footer in an editor where you can write and format text, and insert images, links and dynamic survey and respondent data. See the section Survey > Survey Construction > Basic Information > Introductory text for information on how to insert and align images, and how to link to files and to web and e-mail addresses.
Finally, click Save.
Translating Page Headers/FootersIf your survey is multilingual, you can create language-specific page headers and footers for each active language. When you have edited the page header or footer in one language you can, before exiting the edit mode, translate them into other languages by clicking the Translate button. In the window that then opens you first select your source language in the left-hand part of the window, and the language you want to translate into on the right.
The button can help you save time by providing you with an automatic translation into your chosen language. It is advisable that you check that the proposed translation is correct. For the automatic translation to work, a connection to a translation service must be set up. See the section on Languages and translations for information on how to do this.
Thank You MessageUnder Basic information > Properties > Publishing, you can select that a thank you message is to be displayed when a respondent submits the survey. You can, in the drop down list Thank you message, choose from the templates for thank you messages which have been created under Templates > Survey Design > Thank you message. The tab Thank you
© Artisan Global Media

Manual 44
message becomes available if you have selected a template in the drop down list Thank you message. The tab is not available if the option Simple is selected in the drop down list.
Under the tab Thank you message, you can make your own changes to the layout of the selected thank you message.
Editing Thank You MessageIf your survey is multilingual, you first need to select the language for which you want to customise the thank you message.
You edit the thank you message in an editor where you can write and format text, and insert images, links and the survey's name and survey category. See the section Survey > Survey Construction > Basic Information > Introductory text for information on how to insert and align images, and how to link to files and to web and e-mail addresses.
Translating Thank you messageIf your survey is multilingual, you can create a language-specific thank you message for each active language. When you have edited the thank you message in one language, you can translate it into other languages by clicking the Translate button. In the window that then opens you first select your source language in the left-hand part of the window, and the language you want to translate into on the right.
The button can help you save time by providing you with an automatic translation into your chosen language. It is advisable that you check that the proposed translation is correct. For the automatic translation to work, a connection to a translation service must be set up. See the section on Languages and translations for information on how to do this.
Consent FormThe tab Consent Form becomes activated when you change the default form in the selection list Properties > Basic Information > Information > Consent Form to one of the templates created under Personal data > Consent Forms > Consent - Survey.
Customising Consent FormIf your survey is multilingual, choose the language version of the form that you want to edit in the selection box at the top.
You edit the consent form in an editor where you can write and format text as well as insert photos and links. See the section Survey > Construction > Basic Information > Introductory text for information on how to insert and adjust images, and how to link to files, web or email addresses.
Click Save when done.
© Artisan Global Media
Manual 45
Translating Consent FormIf your survey is multilingual, you can create a language-specific consent form for each active language. When you have edited the consent form in one language, you can translate it into other languages by clicking the Translate button. In the window that then opens you first select your source language in the left-hand part of the window, and the language you want to translate into on the right.
The button can help you save time by providing you with an automatic translation into your chosen language. It is advisable that you check that the proposed translation is correct. For the automatic translation to work, a connection to a translation service must be set up. See the section on Languages and translations for information on how to do this.
Consent RefusedThe tab Consent Refused becomes activated when you change the default form in the selection list Properties > Basic Information > Information > Consent Refused Page to one of the templates created under Personal data > Consent Forms > Consent Refused - Survey.
Customising and translation of the consent refused page is performed in the same way as for Consent Form.
TemplatesOne way to create a survey is to base it on a survey template. In the menu Survey > Survey Construction > Templates you can add questions that have been predefined in templates to your survey, even after the survey is created. This is useful if you want to combine questions from several survey templates in the same survey. Adding more templates does not influence the Basic Information or the Design of the survey. The survey templates are created under Templates > Survey Templates.
Two columns are displayed under Survey Construction > Templates:
The left column Available shows all the templates which can be added to the survey.
In the left upper corner you can filter them by category or search text. You
choose one or more categories, or write a search text and click . Only the templates matching your search criteria will be displayed. Click the image on the left of the template title to preview this template.
Click on the right side of the selected template to add this template to your survey.
In the right column Selected you see the templates chosen for this survey.
© Artisan Global Media
Manual 46
You can add as many templates to one survey as you like.If a survey is created based on a template, this template will be the main template. It is not possible to delete the main template from a survey here,
which is indicated by this icon .
PositionYou can change the order of the templates in the column Selected through drag & drop, as long as the position is not predefined by the template under Templates> Survey Templates> Basic Information> Settings (Preferred position: top/ bottom).
If the position of a template has been pre-defined, the questions included are automatically displayed at the respective position. If multiple templates have been defined with the same setting for Preferred Position, their order in the column Selected determine their position in the survey. To check your configuration, click Save and Preview, or Save and refresh the page, the column Selected will then appear in the desired order. If you try to save an order which does not correspond to the templates' predefined settings for preferred position, you will get a message saying that the templates were reordered due to position settings.
Removing a template
To remove a chosen template from this survey click on the right side of the added template.
SaveWhen you have finished click Save. By clicking on Save and preview your changes are saved and you can preview the survey in a pop up window.
Questions
Overview When you click the Questions menu you get an overview of all the questions in your survey. If the survey does not yet contain any questions, you only see this button:
Click on this button to create the first question.
© Artisan Global Media
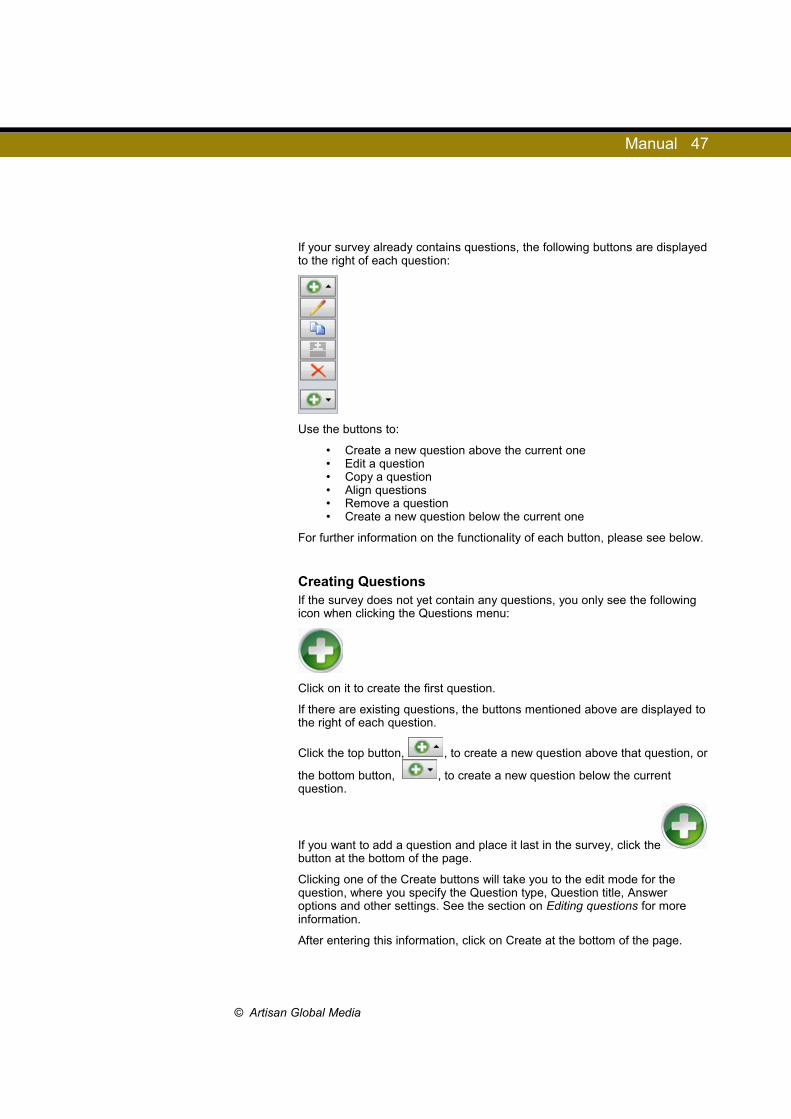
Manual 47
If your survey already contains questions, the following buttons are displayed to the right of each question:
Use the buttons to:
• Create a new question above the current one • Edit a question • Copy a question • Align questions • Remove a question • Create a new question below the current one
For further information on the functionality of each button, please see below.
Creating Questions If the survey does not yet contain any questions, you only see the following icon when clicking the Questions menu:
Click on it to create the first question.
If there are existing questions, the buttons mentioned above are displayed to the right of each question.
Click the top button, , to create a new question above that question, or
the bottom button, , to create a new question below the current question.
If you want to add a question and place it last in the survey, click the button at the bottom of the page.
Clicking one of the Create buttons will take you to the edit mode for the question, where you specify the Question type, Question title, Answer options and other settings. See the section on Editing questions for more information.
After entering this information, click on Create at the bottom of the page.
© Artisan Global Media
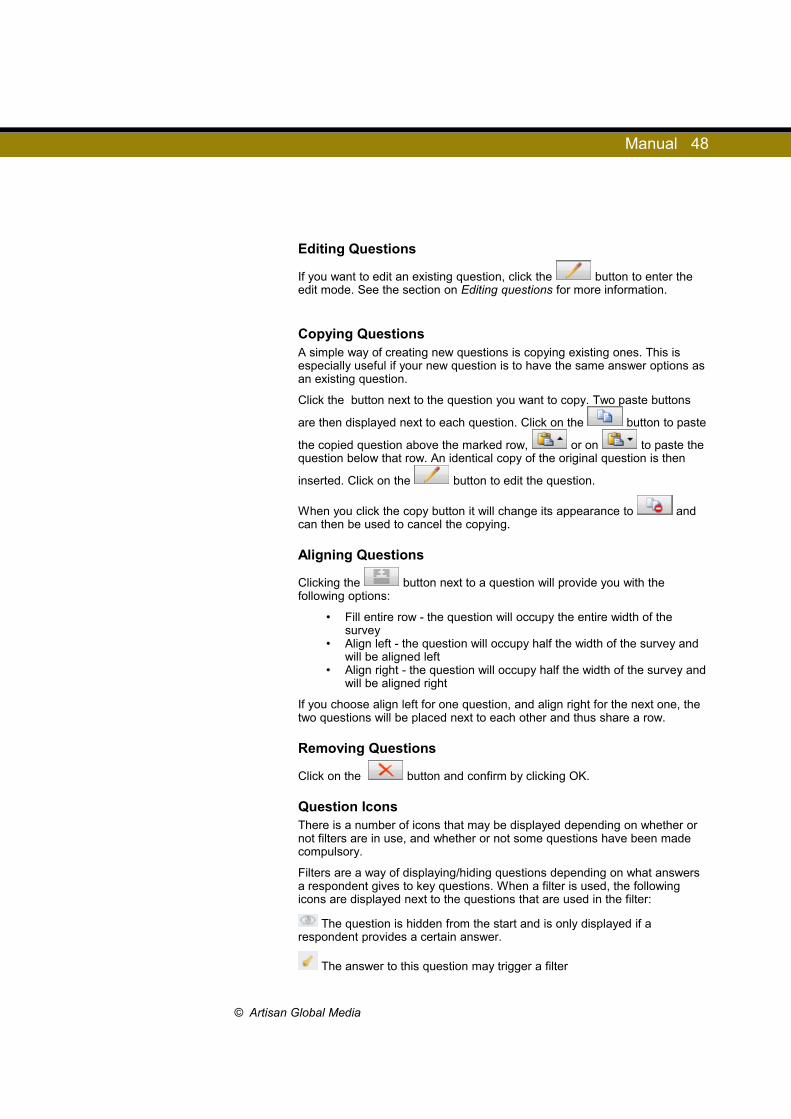
Manual 48
Editing Questions
If you want to edit an existing question, click the button to enter the edit mode. See the section on Editing questions for more information.
Copying QuestionsA simple way of creating new questions is copying existing ones. This is especially useful if your new question is to have the same answer options as an existing question.
Click the button next to the question you want to copy. Two paste buttons
are then displayed next to each question. Click on the button to paste
the copied question above the marked row, or on to paste the question below that row. An identical copy of the original question is then
inserted. Click on the button to edit the question.
When you click the copy button it will change its appearance to and can then be used to cancel the copying.
Aligning Questions
Clicking the button next to a question will provide you with the following options:
• Fill entire row - the question will occupy the entire width of the survey
• Align left - the question will occupy half the width of the survey and will be aligned left
• Align right - the question will occupy half the width of the survey and will be aligned right
If you choose align left for one question, and align right for the next one, the two questions will be placed next to each other and thus share a row.
Removing Questions
Click on the button and confirm by clicking OK.
Question IconsThere is a number of icons that may be displayed depending on whether or not filters are in use, and whether or not some questions have been made compulsory.
Filters are a way of displaying/hiding questions depending on what answers a respondent gives to key questions. When a filter is used, the following icons are displayed next to the questions that are used in the filter:
The question is hidden from the start and is only displayed if a respondent provides a certain answer.
The answer to this question may trigger a filter
© Artisan Global Media

Manual 49
The question is part of a filter
Read more about this in the Filters section.
If a question is compulsory the following icon is displayed:
If the survey has been created from a survey template whose questions are
locked, the icon is displayed next to the questions that are part of the survey template. These questions cannot be edited, deleted or moved.
Creating New Pages If you want to insert a page break after the last question on a page, click the New page button. A new empty page then appears and you click the
button at the top of the page to create the first question on the new page. This new page will not be saved until a question has been created on it.
Another way of creating new pages is to click on the Arrange tab and create them via that page. There, you can also change the order of the questions and move them between pages. See Arrange for more information.
Switching Between Pages If your survey contains several pages, you can switch between them by pressing the buttons at the bottom of each page.
You can use the following methods for changing pages:
• Click on the page number.
• Go back or forward one page at a time using the and buttons.
• Go to the first or last page by clicking the and buttons respectively.
Importing QuestionsBy clicking on Import questions at the bottom of the page, you open a window that lets you search for and import questions from other surveys.
You first need to find the survey that contains the question and you do this by typing in the full or partial survey name in the search field and clicking on Search. If you leave the search field empty, all surveys except for those that are filed in the archive will be listed. If you want to import a question from a survey in the archive, you mark the check box at Include surveys from the archive.
© Artisan Global Media

Manual 50
Then, click on the survey that contains the question your want to import. All its questions will then be listed in the right part of the window. If you know parts of the wording in the question title, you can also use the search field under Questions to manually enter and search for it.
Select the question(s) you want to import and click on OK. The question(s) will then be inserted last in your survey.
Edit Mode
TitleIn the Title field you type in the wording of the actual question. If you have chosen not to activate automatic question numbering, you may also want to write a number directly before the question.
The general appearance of the question titles is determined by the settings chosen under Survey construction > Design. You can also format individual
question titles using the button which can be found to the right of each question.
Question Types
Type
This menu lets you choose a suitable type for the question you want to ask. In the Type drop down list, Standard questions is the default option. The other options are Informational texts and Advanced questions. The latter is only available for customers with the SR-Advanced Survey plug-in.
Standard Questions
All question types have been divided into categories and put under different headings.
Single-Choice Questions
These are used when the question only allows for one answer option to be selected among multiple alternatives.
Yes/No - the answer options Yes and No are added automatically.
Radio Buttons - all answer options are visible
© Artisan Global Media

Manual 51
Drop Down List - uses less space when there are many answer options
Rating - suitable for rating objects, people, statements etc.
Multiple-Choice Questions
These are used when it is to be possible to select multiple answer options.
Check Boxes - all answer options are visible
Select Box - uses less space when there are many answer options. Please inform your respondents that they can press down the Ctrl or Shift buttons to select several options.
© Artisan Global Media

Manual 52
Matrix
A matrix is used when the same set of answer options is to be used for several questions.
Radio Buttons - only one answer option can be selected
Check Boxes - multiple answer options can be selected
Rating - suitable for rating objects, statements etc.
© Artisan Global Media

Manual 53
Ranking - used for ranking a set of objects. Each answer option can only be selected once.
Numeric
These are used when answers containing numeric values are required.
Field - provides a field into which only numbers can be entered
Interval - an interval with two end points is specified using numbers.
Slider - a numeric value is specified using a slider
Interval Slider - an interval (with two end points) is specified using a slider.
Multiple - one numeric field is provided for each subquestion. Answers must be given in numbers.
© Artisan Global Media
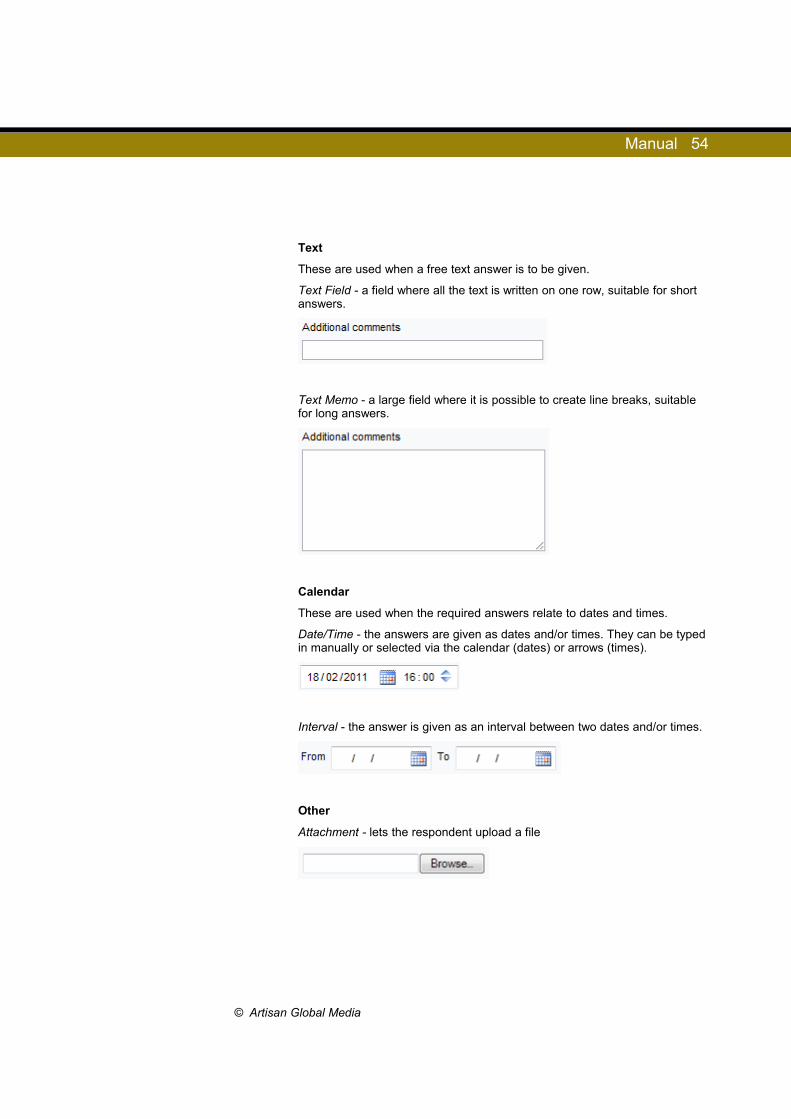
Manual 54
Text
These are used when a free text answer is to be given.
Text Field - a field where all the text is written on one row, suitable for short answers.
Text Memo - a large field where it is possible to create line breaks, suitable for long answers.
Calendar
These are used when the required answers relate to dates and times.
Date/Time - the answers are given as dates and/or times. They can be typed in manually or selected via the calendar (dates) or arrows (times).
Interval - the answer is given as an interval between two dates and/or times.
Other
Attachment - lets the respondent upload a file
© Artisan Global Media
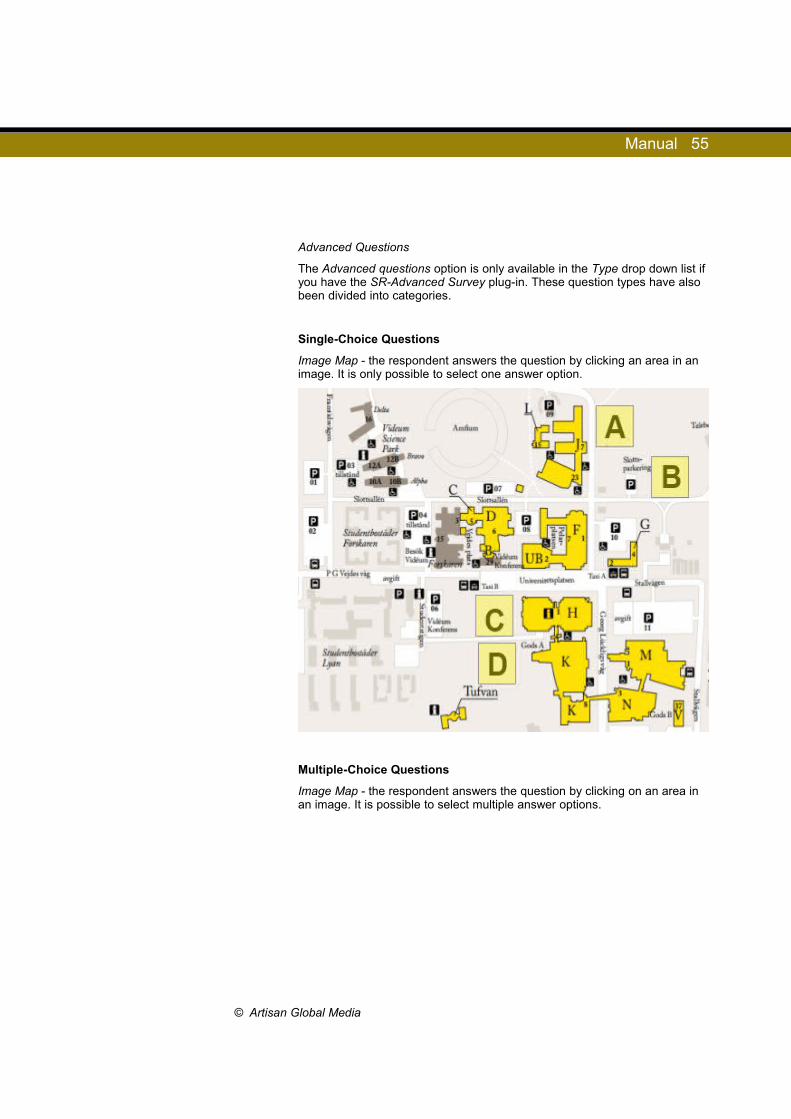
Manual 55
Advanced Questions
The Advanced questions option is only available in the Type drop down list if you have the SR-Advanced Survey plug-in. These question types have also been divided into categories.
Single-Choice Questions
Image Map - the respondent answers the question by clicking an area in an image. It is only possible to select one answer option.
Multiple-Choice Questions
Image Map - the respondent answers the question by clicking on an area in an image. It is possible to select multiple answer options.
© Artisan Global Media
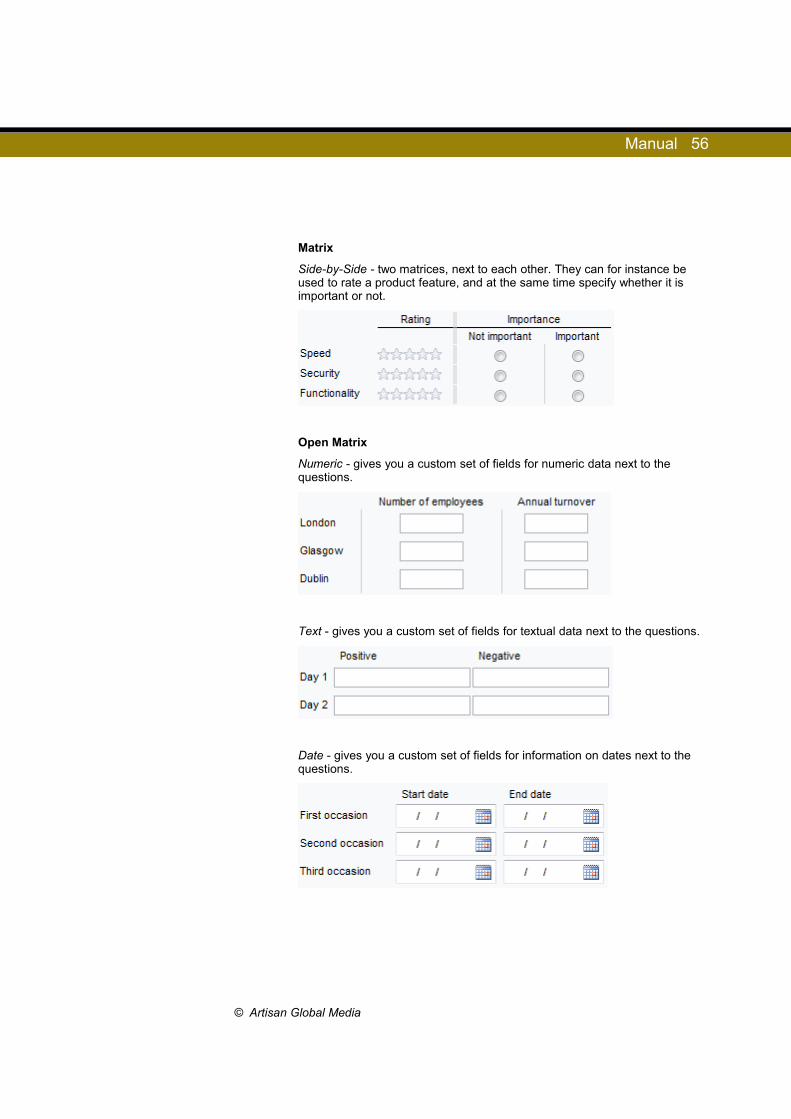
Manual 56
Matrix
Side-by-Side - two matrices, next to each other. They can for instance be used to rate a product feature, and at the same time specify whether it is important or not.
Open Matrix
Numeric - gives you a custom set of fields for numeric data next to the questions.
Text - gives you a custom set of fields for textual data next to the questions.
Date - gives you a custom set of fields for information on dates next to the questions.
© Artisan Global Media

Manual 57
Time - gives you a custom set of fields for information regarding times next to the questions.
Informational Texts
You can insert informational texts anywhere in the survey, for instance to introduce a series of questions on a particular topic, or to use as a conclusion at the end of the survey.
1. Click on Add question in the place in the survey where you would like to add the Informational text.
2. In the Type drop down list, select Informational text.3. Choose a type: Text or Pop-up text4. Enter a Title. This will be displayed as the section heading.5. Create a text using the editor. If you have chosen the Text type, the
text will be displayed directly below the title in the survey. The Pop-up text type entails that only the heading is displayed in the survey. The respondent then has to click the View button to read the entire text. Pop-up texts take up little space and are thus useful for long texts, as well as when it is to be an active choice by the respondent to read the entire text.
Theme
The survey theme is used for all question in the survey as default. However, depending on your given rights in the system, you can change the layout of a separate question by using another theme on question level. The application applies all the settings you have defined under the headings Question and Question Title in the different question, to this question only.
SettingsUnder Settings the following settings can be chosen. Some are general and apply to all question types, while others are only available for certain question types.
General (available for all question types):
• Compulsory - the question must be answered
• Hidden from the start - the question is hidden until the respondent gives a particular answer that triggers settings in a logic.
© Artisan Global Media

Manual 58
• Include a comment field - a field for additional comments is provided in conjunction with the question. Specify the heading you wish to use for the comment field under Comments label.
• Display question numbering - if either Decimal or Roman was selected under Numbering in the Basic Information, the questions will be given numbers automatically. Here you determine whether the number is to be displayed for the chosen question.
• Export ID – Only available for those who have the SR-Advanced Survey plug-in. In the export file generated under Survey > Data Collection > Export, the question will have the name you enter here.
Specific Answer Options
• "I don't know" - adds the answer option 'I don't know' to the question. The text and value can be adjusted in the table with answer alternatives. The setting is available for the following question types: Yes/No, Radio buttons, Drop down list, Check boxes, Multiple-choice list, Matrix - Radio buttons, Matrix - Check boxes and Matrix - Ranking.
• ' I don't know ' is hidden until the question fails a validation check for compulsory questions - can be added when the ' I don't know '-alternative above is used for compulsory questions. The setting is used for encouraging the respondent to choose one of the other alternatives. First when the respondent has tried to leave the question unanswered, the ' I don't know ' - alternative is shown.
• Blank option - adds a blank answer option that the respondent then fills out if none of the other options apply. This setting is available for the following question types: Radio buttons, Drop down list, Check boxes and Multiple-choice list.
Search mode for answer options
• Enable search mode - the setting is available for the question types: Drop down list and Select Box. If you mark this check box, a search field is shown under the question in the survey. The respondent writes in the entire alternative or parts of the alternative which he/she would like to choose. The matching search alternatives are shown in a list and the respondent can select the intended answer option from the list.
Under the heading Search mode texts you have the possibility to adjust the texts that the respondent will read in the survey as he/she answers this kind of question.
Please note! The search mode for answer options does not work in the mobile mode. There the question is shown as an ordinary drop down list/select box.
• Force the respondent to perform a search when the question contains more than 75 answer options - can be used if you have marked the function above. At more than 75 answer options, all answer options cannot be displayed at once. Only the first 50 alternatives are shown before a search is made. To avoid giving these 50 alternatives an advantage, you can require that all alternatives are hidden until a search is made.
© Artisan Global Media

Manual 59
Limit Number of Chosen Answers
• Minimum number of chosen answers - this setting is available for the following two question types: check boxes and select box. If you activate this setting, a field appears where you specify the minimum number of answers that must be chosen. If you specify a minimum number, the question will be automatically marked as compulsory, but you can unmark the check box at Compulsory if you want to.
• Maximum number of chosen answers - this setting is available for the following two question types: check boxes and select box. If you activate this setting, a field appears where you specify the maximum number of answers that can be chosen.
Orientation
• Horizontal or Vertical - This setting is available for the following question types: Single-choice radio buttons and Multiple-choice check boxes. It determines whether the question's answer options are presented horizontally or vertically. If you choose horizontal, you can also choose to center the text.
Paper survey orientation
• Horizontal or Vertical - This setting is available for the question types Yes/No, Radio Buttons, Drop Down List, Rating, Check Boxes and Select Box, provided that you have the SR-Advanced Survey plug-in. It determines whether the question's answer options are presented horizontally or vertically in the paper survey version.
Rating
• Display labels - this setting is available for the following question types: Rating and Matrix - Rating. It specifies whether or not a data label containing the selected answer is to be displayed.
Settings for Numbers
• Use limits - this setting is available for the following question types: Numeric - Field, Numeric - Interval and Numeric - Multiple and entails that the respondent's answer must be within the limits set under Min and Max. If a given answer is outside of these limits an error message is displayed informing the respondent that the answer is invalid.
• Decimal fractions - this setting is available for the following question types: Numeric - Field, Numeric - Interval and Numeric - Multiple and determines whether decimals are allowed in the answers, or whether whole numbers must be used.
• Min, Max and Steps - Min and Max are used in conjunction with the Use limits setting (see above) or for the question types Slider and Interval slider. Min and Max then specify the end points of the scales, while Steps defines the intervals.
• Display data label, Display prefix and Display suffix - these settings are available for the following question types: Slider and Interval Slider, and specify whether a data label with the given answer is to be displayed under the slider, and whether texts are displayed at
© Artisan Global Media

Manual 60
• the end points of the scale. The texts are entered in the empty fields below Display prefix and Display suffix. You can for instance add the minimum and maximum values for the scale as the prefix and suffix, or write a text to describe them.
Click the button if you want to format the text.
Validation
• Valid e-mail address - this setting is available for Text field questions and helps ascertain that the respondent's answer is in the correct format.
• Limited number of characters - available for the Text field and Text memo question types. The setting lets you specify a Min and Max number of characters to be used by the respondent to answer the question.
Calendar
• Date/Time - this setting is available for the following question types: Date/Time and Date/Time - Interval and lets you select what the question is to contain by marking the appropriate check boxes.
• Validate dates - this setting is available for the following question types: Date/Time and Date/Time - Interval. It lets you specify the earliest and latest dates or times that can be selected by the respondents.
Image map (only available with the SR-Advanced Survey plug-in)
• Display answer options as text - specifies whether the answer options also are to be displayed as text, or only as clickable areas in the image.
• Display tool tips - specifies whether the answer option text is displayed as a tool tip when the respondent hovers the mouse over the area.
• Display areas - specifies whether areas are to be always visible in the image.
• Display hovering - specifies whether areas are to be highlighted when the respondent hovers the mouse over them or, if they are always visible, whether they should then change colour.
Matrix - Side by side (only available with the SR-Advanced Survey plug-in)
• You select the question types for the two matrices in the select boxes named Question type left matrix and Question type right matrix. Choose among the following question types:
• Radio buttons
• Check boxes
• Rating
• Ranking
• NumericText
© Artisan Global Media

Manual 61
Open matrix - Numeric (only available with the SR-Advanced Survey plug-in)
• Validation - specify which sum you want to validate: None, Rows, Columns or Total. Then enter the values of your choice at Min sum and Max sum respectively.
• Summation Mode - specify what you want to display the sum for: None, Rows, Columns or Total.
Open matrix - Time (only available with the SR-Advanced Survey plug-in)
• Limit to 24 hours - if this setting is active, the respondent cannot enter more than 24 hours per field.
• Validation - specify which sum you want to validate: None, Rows, Columns or Total. Then enter the values of your choice at Min sum and Max sum respectively.
• Summation Mode - specify what you want to display the sum for: None, Rows, Columns or Total.
Answer OptionsThis heading is displayed for all question types where the respondent is to choose from set answer options. From the start, there is only one field which
is intended for the first answer option. Click the button to add new fields for as many answer options as you want. It is also possible to create new answer options by pressing the tab key. To remove an answer option,
just click the button next to it.
Type in the text for the answer option in the empty field. Click the button if you want to format the text, for instance by highlighting parts of it.
All the answer options receive a numeric value which is displayed in the Value field. This number will be used for the answer option in the reports. The options are assigned numbers automatically, which means that the first answer option will be number 1, the second option number 2 and so on. You can, however, change them any way you want.
If you want to change the order of the answer options, click on the button which you can find on the left side of the row. When the marker turns into a move cursor, press down the left mouse button and drag the answer option to its new place.
If you have many answer options you can paste the answer options instead. Click the lower tab Text. Paste the answer options, separated by a line break. Shift to the tab List in order to see the answer options and make adjustments if needed.
In addition to the set options, options such as 'I don't know' and blank fields are available for use with some questions. See Specific answer options above for more information.
© Artisan Global Media

Manual 62
SubquestionsWhen using matrices, the same answer options are used for multiple questions (here referred to as subquestions). The subquestions are displayed as headings for the rows of the matrix, and the answer options are displayed as headings for the columns. In the image below, various web browsers are used as subquestions:
Subquestions are created in the same way as the answer options, see Answer options above.
Question Types with Specific Answer OptionsThe question types below are only available with the SR-Advanced Survey plug-in.
Matrix - Side-by-Side
This question type contains two matrices. The answer options are created in the same way as they are for other question types under the headings Left matrix answer options and Right matrix answer options. You can also add a Title for each matrix.
Image Map
Answers to this type of question are given by clicking areas in an image. The answer options are, as per usual, created under the Answer options heading. For each answer option you need to specify whether it is to be displayed as a Circle or a Rectangle in the image, and whether the specified areas are to be Visible or not.
Click on Select image and choose one from the Image library. Please refer to the Image and document library for more information on how to upload and use images.
You can then specify areas anywhere in the picture and move them around by clicking, dragging and dropping them. In order to see which area corresponds with a particular answer option, click the text field where you typed in the answer option. The area will then be highlighted in the image. Expand or reduce the size of an area by clicking the little square next to its frame.
Under Area colours you select how the areas are to be coloured when the respondent answers the question. The following options are available:
• Normal, Normal - the answer option has not been selected and the marker is not hovering over the set area.
• Normal, Hovering - the answer option has not been selected and the marker is hovering over the set area.
© Artisan Global Media

Manual 63
• Selected, Normal - the answer option has been selected and the marker is not hovering over the set area.
• Selected, Hovering - the answer option has been selected and the marker is hovering over the set area.
Click the appropriate field for each option you would like to use and choose a colour. It is also possible to manually enter colour codes in the fields.
Design Mode If you want to display an image or a video together with a question, or add text to provide additional information on the topic, you click the Design tab.
Design container
Both images and extra text are inserted via so-called Design containers. Under the Design container heading you select where they are to be inserted:
• Top - above the question • Left - to the left of the question • Right - the right of the question • Bottom - below the question
The Top and Bottom sections take up the entire width of the survey. The Left and Right sections can be resized by dragging the dotted line.
In addition to these, there is another Design container called Center which is where the actual question is placed. It is possible to add text, images and videos to this container too.
Adding Text Areas
1. After you have created a Design container, click it and select Add text area in the list that appears.
2. A Text area is then inserted. Click the white field to open an editor. 3. Enter and format your text in the editor. Click OK. 4. When you have finished, click Save.
If you want to edit the text later, click the white field to open the editor again.
Adding Images
1. After you have created a new Design container, click it and select Add image in the list that appears.
2. Choose which image to insert. (Please refer to the section on the Image and document library for more information on how to upload and insert images.)
3. Click Save.
© Artisan Global Media

Manual 64
Adding Media files
1. After you have created a new Design container, click it and select Add media in the list that appears.
2. Select the video you want to insert. Read more about uploading and inserting videos on the Image and document library page.
3. Click Save.
Moving Text Areas, Images and Media files
By clicking and dragging the title bar of either the Text area, the Image or the Media, you can move it to a different place within the same Design container, or to a different section.
Removing Text Areas, Images and Media files
Click Remove in the title bar of the Text area, Image or Media.
Translating Surveys If your survey is multilingual, you use the Translate page to do the translation. The translation interface is divided into two sections. The left half is where you see the original text: just select which language to translate from (your source language). The right half is where you select which language to translate the text into.
Every question and every answer option has its own line with a field where
you type in the translation. To the right of the field is a button which you click on if you want to format the text, just like you did when you created the original question.
When translating, you can get some help by pressing the button. It gives you an automatic translation of the text and can be found between the two language fields (it then translates the entire text) as well as on each row (it then translates the text on that row). Since the translation is automated, it is advisable that you check that the proposed translation is accurate. Also, for the translation to work, a connection to a translation service must be set up in the Administration. Please refer to the Languages and translations section for more information on how to do this.
If a respondent's details call for a language that is not used in the survey, or if the survey has not been translated into that language, he or she will receive the survey in its default language (the default language is specified in the Basic information).
Arranging Questions This page lets you change the order of the questions in the survey. You can also create new pages, or transfer questions between the different pages of your survey.
© Artisan Global Media
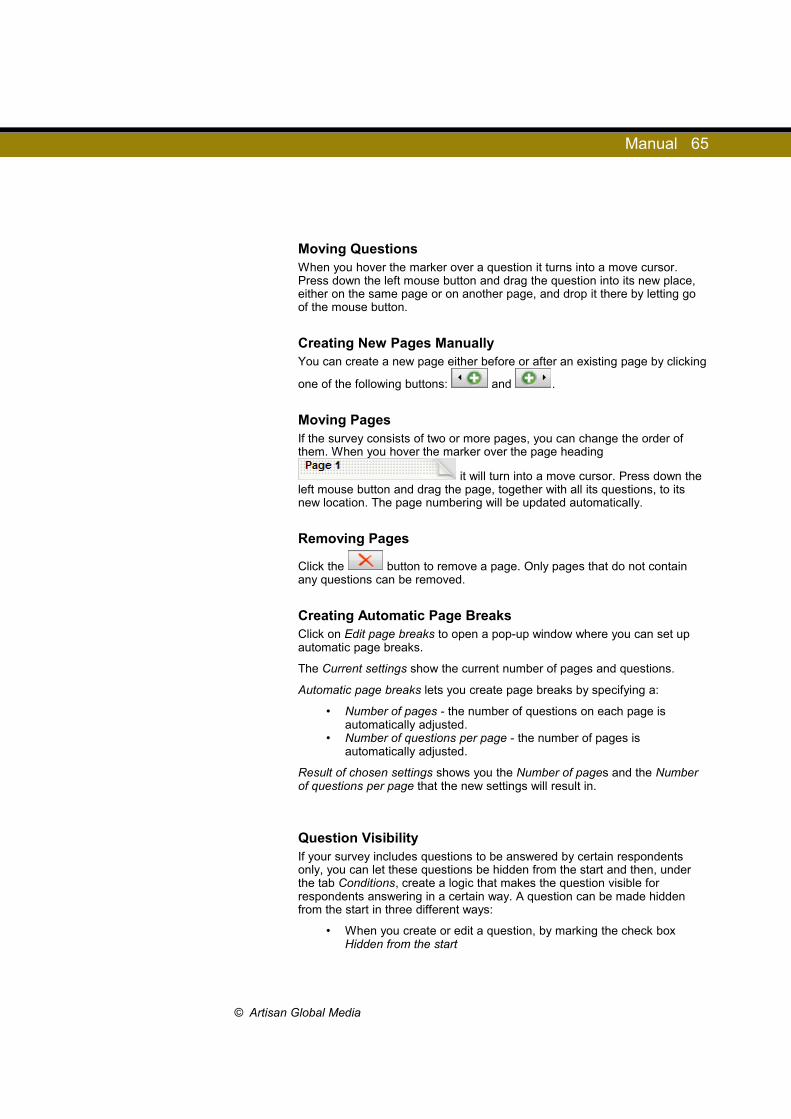
Manual 65
Moving Questions When you hover the marker over a question it turns into a move cursor. Press down the left mouse button and drag the question into its new place, either on the same page or on another page, and drop it there by letting go of the mouse button.
Creating New Pages Manually You can create a new page either before or after an existing page by clicking
one of the following buttons: and .
Moving Pages If the survey consists of two or more pages, you can change the order of them. When you hover the marker over the page heading
it will turn into a move cursor. Press down the left mouse button and drag the page, together with all its questions, to its new location. The page numbering will be updated automatically.
Removing Pages
Click the button to remove a page. Only pages that do not contain any questions can be removed.
Creating Automatic Page Breaks Click on Edit page breaks to open a pop-up window where you can set up automatic page breaks.
The Current settings show the current number of pages and questions.
Automatic page breaks lets you create page breaks by specifying a:
• Number of pages - the number of questions on each page is automatically adjusted.
• Number of questions per page - the number of pages is automatically adjusted.
Result of chosen settings shows you the Number of pages and the Number of questions per page that the new settings will result in.
Question VisibilityIf your survey includes questions to be answered by certain respondents only, you can let these questions be hidden from the start and then, under the tab Conditions, create a logic that makes the question visible for respondents answering in a certain way. A question can be made hidden from the start in three different ways:
• When you create or edit a question, by marking the check box Hidden from the start
© Artisan Global Media
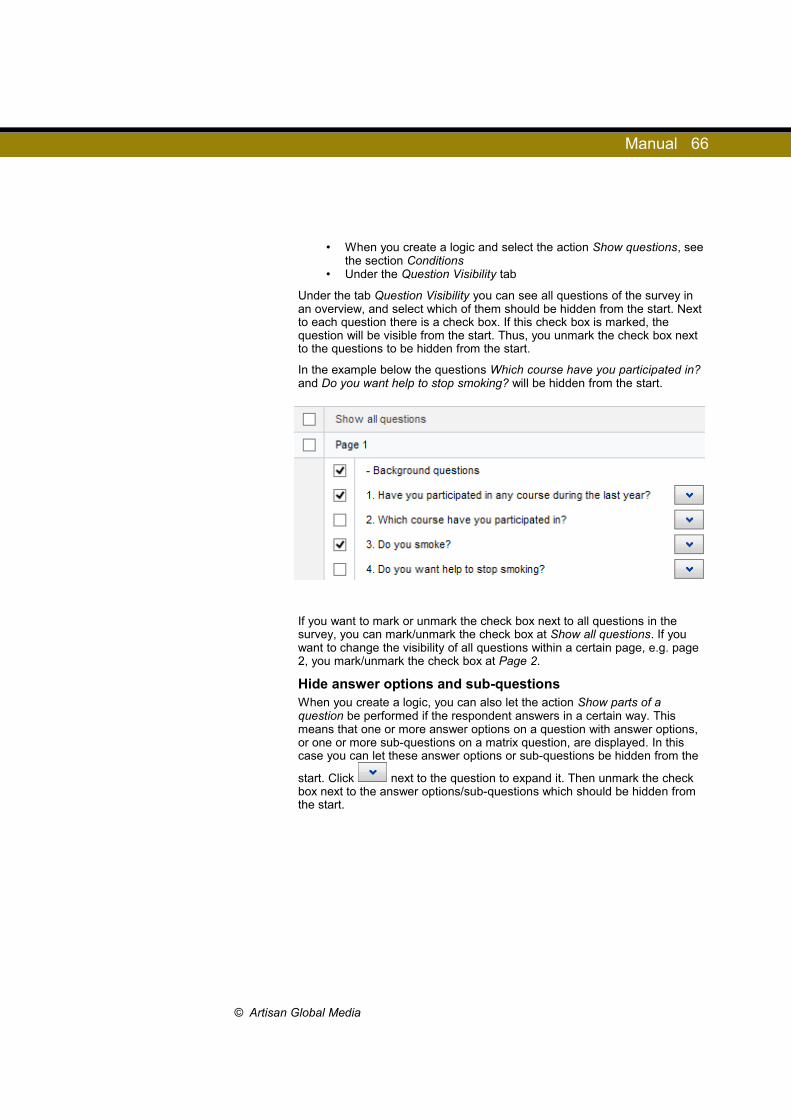
Manual 66
• When you create a logic and select the action Show questions, see the section Conditions
• Under the Question Visibility tab
Under the tab Question Visibility you can see all questions of the survey in an overview, and select which of them should be hidden from the start. Next to each question there is a check box. If this check box is marked, the question will be visible from the start. Thus, you unmark the check box next to the questions to be hidden from the start.
In the example below the questions Which course have you participated in? and Do you want help to stop smoking? will be hidden from the start.
If you want to mark or unmark the check box next to all questions in the survey, you can mark/unmark the check box at Show all questions. If you want to change the visibility of all questions within a certain page, e.g. page 2, you mark/unmark the check box at Page 2.
Hide answer options and sub-questionsWhen you create a logic, you can also let the action Show parts of a question be performed if the respondent answers in a certain way. This means that one or more answer options on a question with answer options, or one or more sub-questions on a matrix question, are displayed. In this case you can let these answer options or sub-questions be hidden from the
start. Click next to the question to expand it. Then unmark the check box next to the answer options/sub-questions which should be hidden from the start.
© Artisan Global Media
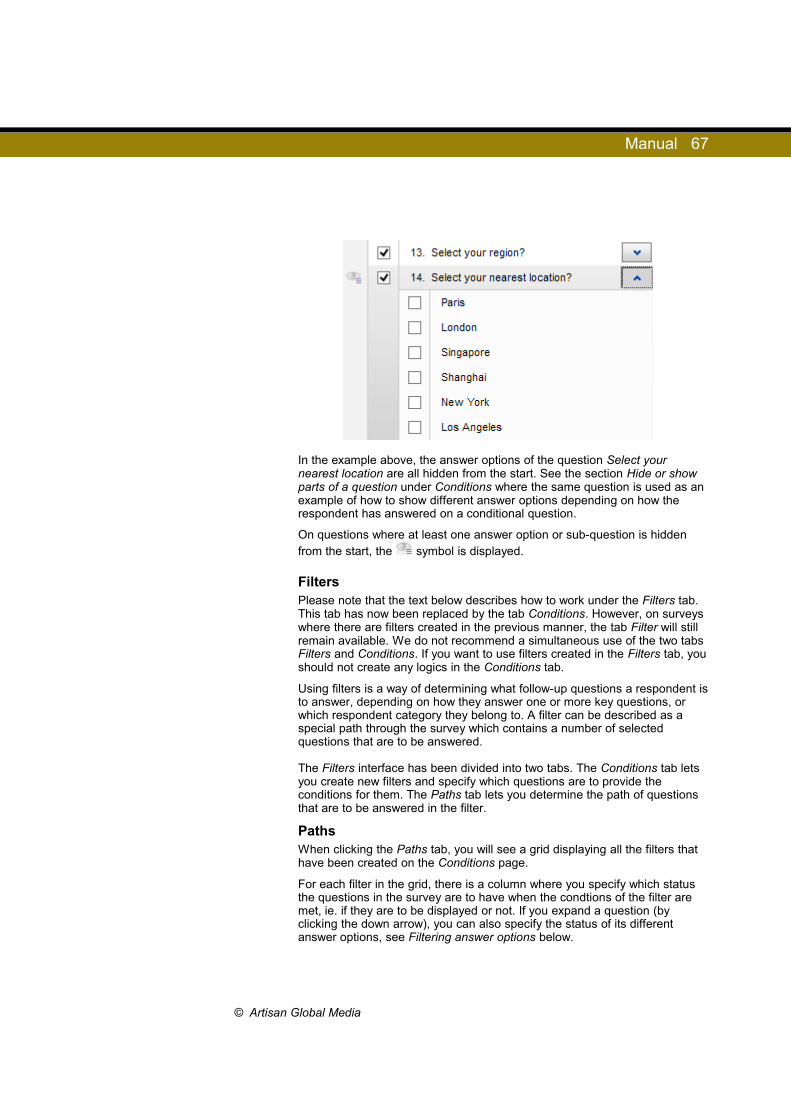
Manual 67
In the example above, the answer options of the question Select your nearest location are all hidden from the start. See the section Hide or show parts of a question under Conditions where the same question is used as an example of how to show different answer options depending on how the respondent has answered on a conditional question.
On questions where at least one answer option or sub-question is hidden from the start, the symbol is displayed.
Filters Please note that the text below describes how to work under the Filters tab. This tab has now been replaced by the tab Conditions. However, on surveys where there are filters created in the previous manner, the tab Filter will still remain available. We do not recommend a simultaneous use of the two tabs Filters and Conditions. If you want to use filters created in the Filters tab, you should not create any logics in the Conditions tab.
Using filters is a way of determining what follow-up questions a respondent is to answer, depending on how they answer one or more key questions, or which respondent category they belong to. A filter can be described as a special path through the survey which contains a number of selected questions that are to be answered.
The Filters interface has been divided into two tabs. The Conditions tab lets you create new filters and specify which questions are to provide the conditions for them. The Paths tab lets you determine the path of questions that are to be answered in the filter.
Paths When clicking the Paths tab, you will see a grid displaying all the filters that have been created on the Conditions page.
For each filter in the grid, there is a column where you specify which status the questions in the survey are to have when the condtions of the filter are met, ie. if they are to be displayed or not. If you expand a question (by clicking the down arrow), you can also specify the status of its different answer options, see Filtering answer options below.
© Artisan Global Media

Manual 68
You specify the status by clicking on the coloured rectangle representing the question or answer option. The colour of it then changes. The different colours have the following meanings:
Visible
Hidden
The status cannot be changed. The question provides the conditions for a filter
The question's answer options have different statuses
The question inherits the status from the previous filter whose conditions are met
Filtering Answer Options
Click the down arrow next to a question to view a list of all its answer options. You can then select, on an option-by-option basis, whether they are to be visible or hidden. This way you can let respondents get different answer options to choose from, depending on how they answered the conditional question.
An example: A company organizes training sessions in a number of cities. Each city has its own instructors. In the evaluation survey that follows, respondents are first asked to specify their location and then who their instructor was. By creating a filter for each city, you can ensure that the respondents only choose from the instructors that are based in the city they specified.
Arranging the Filters
On the far left in the grid is the text No filter which refers to the default settings for each question e.g. whether they are to be visible or hidden if no filter is applied. The filters are then presented schematically from left to right. The order in which the filters are presented in the grid is of importance when two filters are designed so that both their conditions can be met by the same respondent. If the two filters have then specified different statuses for a question, the filter that is the furthest to the right will determine whether the question is displayed or hidden.
An example: The survey above has two filters. According to Filter 1, Question C will be hidden whereas Filter 2 specifies that Question C should be visible. If a respondent answers in such a way that both filter conditions are met, Question C will be visible. Filter 2, which is the furthest to the right, will thus determine the status of Question C.
When a question has been given the status of Inherits the status of the previous filter whose conditions have been met, the status is inherited from left to right. The question thus inherits the status from the filter that is the closest to the left (and whose conditions have been met).
© Artisan Global Media
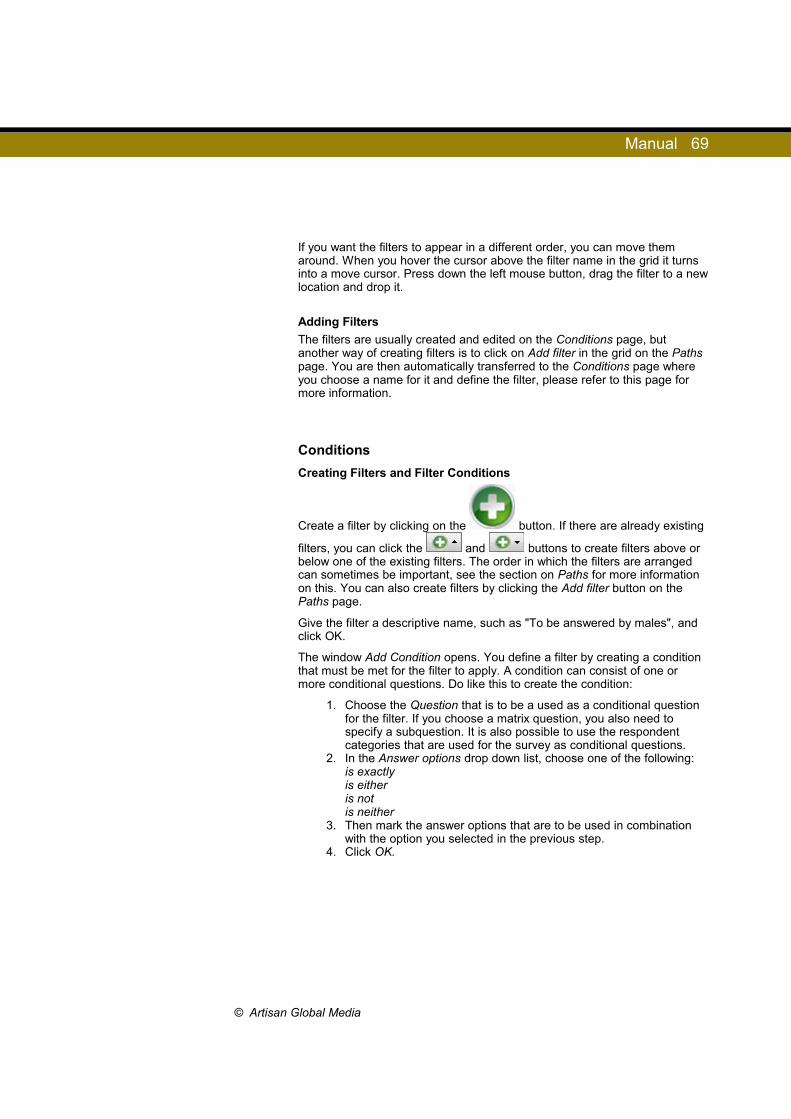
Manual 69
If you want the filters to appear in a different order, you can move them around. When you hover the cursor above the filter name in the grid it turns into a move cursor. Press down the left mouse button, drag the filter to a new location and drop it.
Adding Filters
The filters are usually created and edited on the Conditions page, but another way of creating filters is to click on Add filter in the grid on the Paths page. You are then automatically transferred to the Conditions page where you choose a name for it and define the filter, please refer to this page for more information.
Conditions
Creating Filters and Filter Conditions
Create a filter by clicking on the button. If there are already existing
filters, you can click the and buttons to create filters above or below one of the existing filters. The order in which the filters are arranged can sometimes be important, see the section on Paths for more information on this. You can also create filters by clicking the Add filter button on the Paths page.
Give the filter a descriptive name, such as "To be answered by males", and click OK.
The window Add Condition opens. You define a filter by creating a condition that must be met for the filter to apply. A condition can consist of one or more conditional questions. Do like this to create the condition:
1. Choose the Question that is to be a used as a conditional question for the filter. If you choose a matrix question, you also need to specify a subquestion. It is also possible to use the respondent categories that are used for the survey as conditional questions.
2. In the Answer options drop down list, choose one of the following: is exactly is either is not is neither
3. Then mark the answer options that are to be used in combination with the option you selected in the previous step.
4. Click OK.
© Artisan Global Media

Manual 70
Example 1: You have chosen a question of the Yes/No type as your conditional question, and you want to create a filter that is applied for those who select Yes. You then choose is exactly and mark the answer option Yes.
Example 2: You have chosen a question of the Radio button type for your condition. The answer options are Very poor, Poor, Good and Very good, and you want to create a filter that is applied to those respondents who have left a positive answer. You then choose is either and select the answer options Good and Very good.
The filter is inserted, symbolized by a large rectangle containing the filter name in the upper left corner and a column with a number of icons on the right.
The conditional question is symbolized by a gray rectangle in the filter under Condition 1. A text is displayed indicating which question and answer options have been selected, and to the right there are icons for editing, removing and adding more conditional questions, see below.
You can now go back to the Paths tab and select which questions are to be answered by those who answer in a way that meets the filter conditions. See this section for more information.
Editing and Removing Conditional Questions
Click on the button to edit the question, for instance to change question or to select other answer options.
If you want to remove the question, click the button.
Adding Extra Conditional Questions
It is possible to create a condition that is comprises several questions.
An example: In your survey, you first ask the respondents to specify their sex, and then their nationality. You want to create a filter for Australian women, and therefore you create a condition that combines the answers to the two questions Sex (is exactly female) and Nationality (is exactly Australian).
You can add an extra conditional question by clicking the button next to an existing question. Define the question (see step 2-5 in the Creating filter conditions section above). The new question will be inserted below the existing one.
© Artisan Global Media
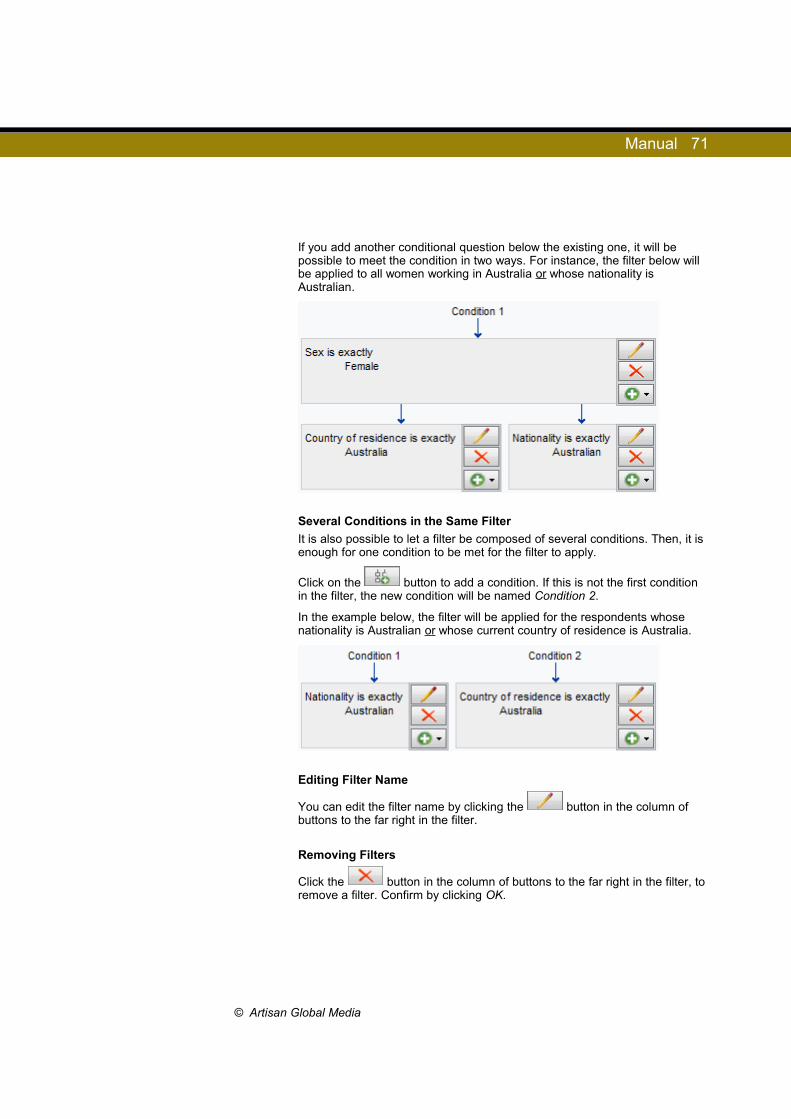
Manual 71
If you add another conditional question below the existing one, it will be possible to meet the condition in two ways. For instance, the filter below will be applied to all women working in Australia or whose nationality is Australian.
Several Conditions in the Same Filter
It is also possible to let a filter be composed of several conditions. Then, it is enough for one condition to be met for the filter to apply.
Click on the button to add a condition. If this is not the first condition in the filter, the new condition will be named Condition 2.
In the example below, the filter will be applied for the respondents whose nationality is Australian or whose current country of residence is Australia.
Editing Filter Name
You can edit the filter name by clicking the button in the column of buttons to the far right in the filter.
Removing Filters
Click the button in the column of buttons to the far right in the filter, to remove a filter. Confirm by clicking OK.
© Artisan Global Media
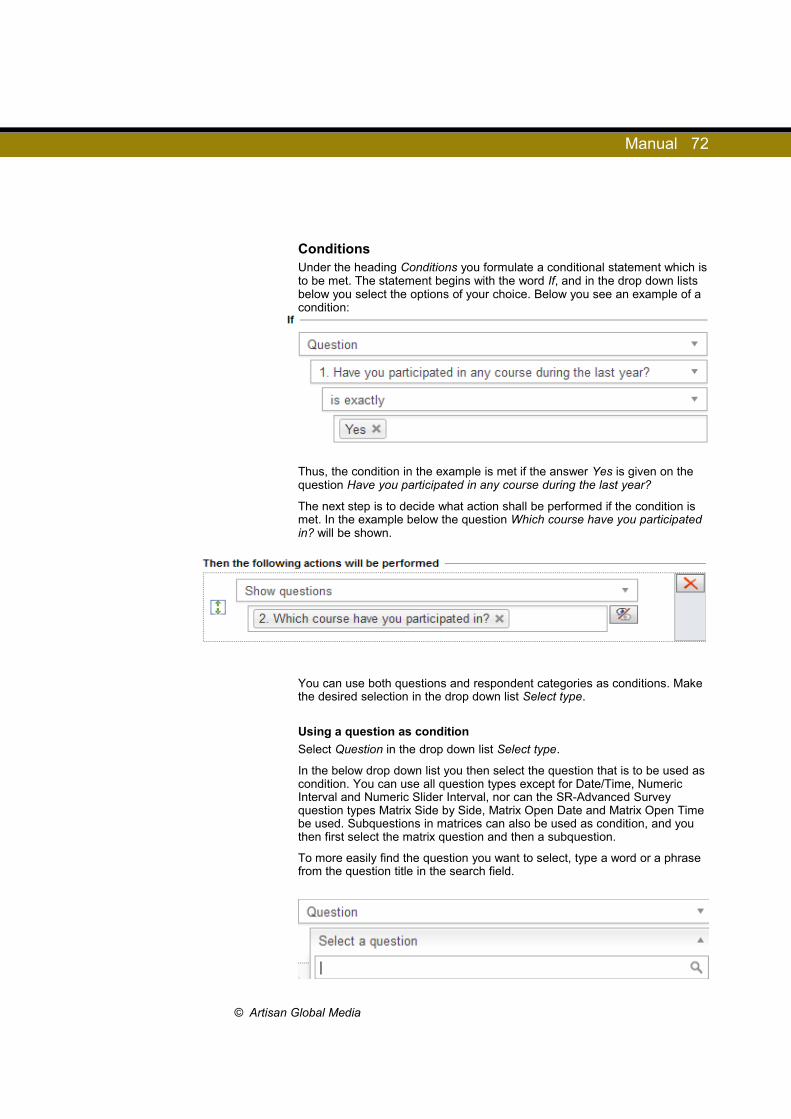
Manual 72
ConditionsUnder the heading Conditions you formulate a conditional statement which is to be met. The statement begins with the word If, and in the drop down lists below you select the options of your choice. Below you see an example of a condition:
Thus, the condition in the example is met if the answer Yes is given on the question Have you participated in any course during the last year?
The next step is to decide what action shall be performed if the condition is met. In the example below the question Which course have you participated in? will be shown.
You can use both questions and respondent categories as conditions. Make the desired selection in the drop down list Select type.
Using a question as condition
Select Question in the drop down list Select type.
In the below drop down list you then select the question that is to be used as condition. You can use all question types except for Date/Time, Numeric Interval and Numeric Slider Interval, nor can the SR-Advanced Survey question types Matrix Side by Side, Matrix Open Date and Matrix Open Time be used. Subquestions in matrices can also be used as condition, and you then first select the matrix question and then a subquestion.
To more easily find the question you want to select, type a word or a phrase from the question title in the search field.
© Artisan Global Media
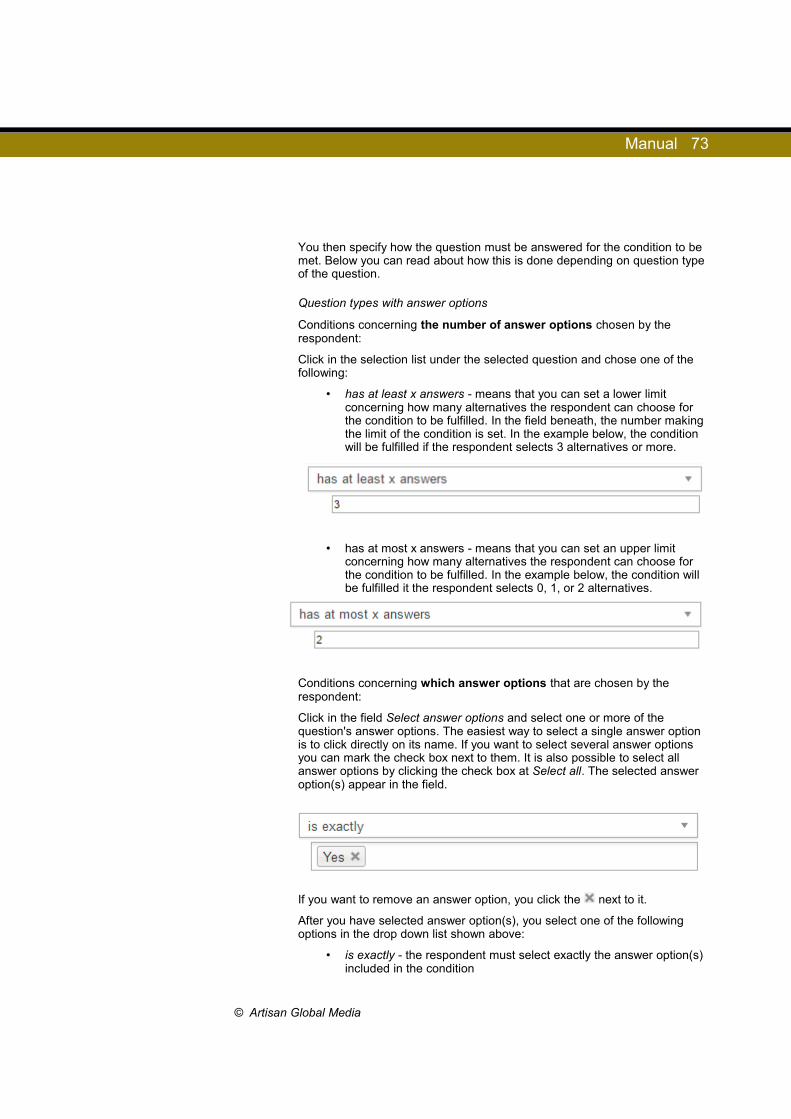
Manual 73
You then specify how the question must be answered for the condition to be met. Below you can read about how this is done depending on question type of the question.
Question types with answer options
Conditions concerning the number of answer options chosen by the respondent:
Click in the selection list under the selected question and chose one of the following:
• has at least x answers - means that you can set a lower limit concerning how many alternatives the respondent can choose for the condition to be fulfilled. In the field beneath, the number making the limit of the condition is set. In the example below, the condition will be fulfilled if the respondent selects 3 alternatives or more.
• has at most x answers - means that you can set an upper limit concerning how many alternatives the respondent can choose for the condition to be fulfilled. In the example below, the condition will be fulfilled it the respondent selects 0, 1, or 2 alternatives.
Conditions concerning which answer options that are chosen by the respondent:
Click in the field Select answer options and select one or more of the question's answer options. The easiest way to select a single answer option is to click directly on its name. If you want to select several answer options you can mark the check box next to them. It is also possible to select all answer options by clicking the check box at Select all. The selected answer option(s) appear in the field.
If you want to remove an answer option, you click the next to it.
After you have selected answer option(s), you select one of the following options in the drop down list shown above:
• is exactly - the respondent must select exactly the answer option(s) included in the condition
© Artisan Global Media

Manual 74
• is either - the respondent must select any of the answer options included in the condition
• is not - the respondent must not select exactly the answer option(s) included in the condition
• is neither - the respondent must not select exactly any of the answer options included in the condition
Instead of letting answer options be included in the condition, you can select one of the following:
• is not answered - the respondent must not have answered the question
• is answered - the respondent must have answered the question
Example 1, single-choice question:
In the example above, the question Have you participated in any course during the last year? is used as condition. This is a Yes/No question, and the respondents who answer Yes shall be asked a supplementary question. In this case both is exactly and is either can be used.
Example 2, single-choice question
The question Do you smoke? in the example above is a Radio Buttons question. Those who answer Yes, every day or Yes, sometimes shall be asked a supplementary question. In this case, the option is either must be used.
© Artisan Global Media
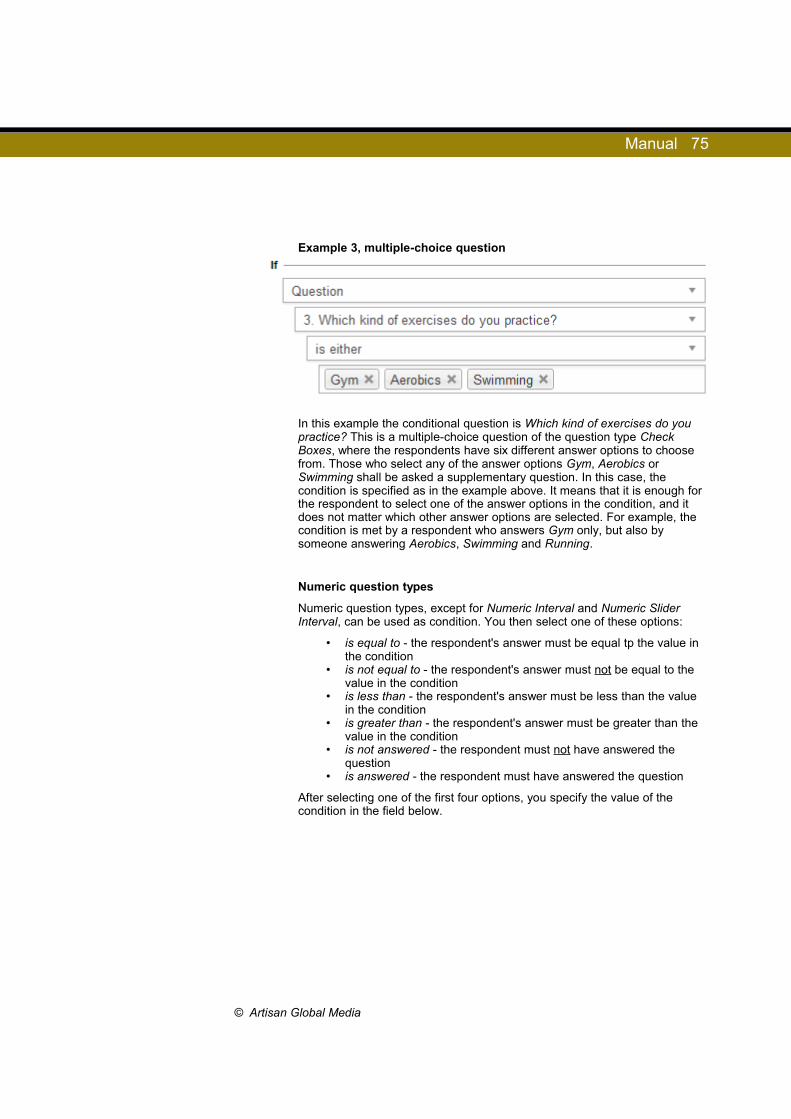
Manual 75
Example 3, multiple-choice question
In this example the conditional question is Which kind of exercises do you practice? This is a multiple-choice question of the question type Check Boxes, where the respondents have six different answer options to choose from. Those who select any of the answer options Gym, Aerobics or Swimming shall be asked a supplementary question. In this case, the condition is specified as in the example above. It means that it is enough for the respondent to select one of the answer options in the condition, and it does not matter which other answer options are selected. For example, the condition is met by a respondent who answers Gym only, but also by someone answering Aerobics, Swimming and Running.
Numeric question types
Numeric question types, except for Numeric Interval and Numeric Slider Interval, can be used as condition. You then select one of these options:
• is equal to - the respondent's answer must be equal tp the value in the condition
• is not equal to - the respondent's answer must not be equal to the value in the condition
• is less than - the respondent's answer must be less than the value in the condition
• is greater than - the respondent's answer must be greater than the value in the condition
• is not answered - the respondent must not have answered the question
• is answered - the respondent must have answered the question
After selecting one of the first four options, you specify the value of the condition in the field below.
© Artisan Global Media

Manual 76
In the example below, the condition is met by respondents answering 2501 or higher.
Text question types
Text question types can also be used as condition. You then select one of these options:
• is exactly - the respondent's answer must be identical to the text in the condition
• contains - the respondent's answer must contain the text in the condition
• does not contain - the respondent's answer must not contain the text in the condition
• starts with - the respondent's answer must start with the text in the condition
• ends with - the respondent's answer must end with the text in the condition
• is not answered - the respondent must not have answered the question
• is answered - the respondent must have answered the question
After selecting one of the first five options, you specify the text to be used in the condition in the field below.
In the example below, the condition is met by respondents whose answer contains the word environment.
Using a respondent category as condition
Select Respondent category in the drop down list Select type. The Respondent category option is available only if you have connected at least one respondent category to the survey.
In the drop down list below you then select the respondent category to be used in the condition.
© Artisan Global Media
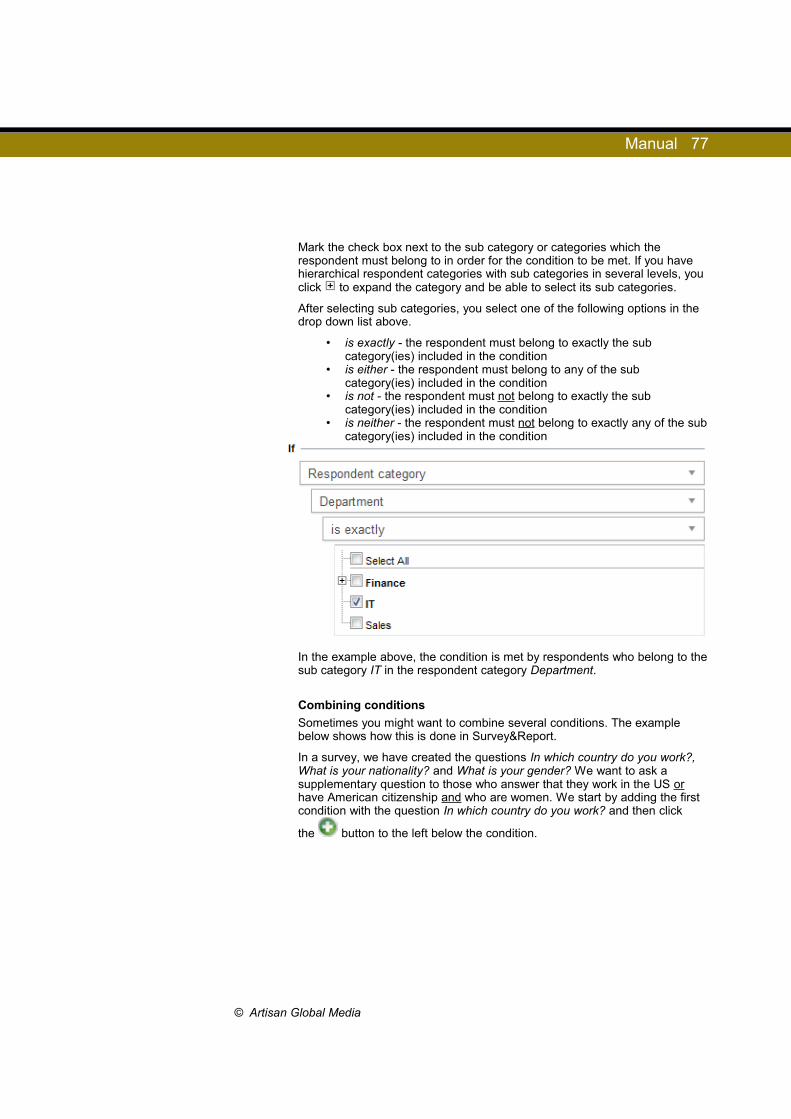
Manual 77
Mark the check box next to the sub category or categories which the respondent must belong to in order for the condition to be met. If you have hierarchical respondent categories with sub categories in several levels, you click to expand the category and be able to select its sub categories.
After selecting sub categories, you select one of the following options in the drop down list above.
• is exactly - the respondent must belong to exactly the sub category(ies) included in the condition
• is either - the respondent must belong to any of the sub category(ies) included in the condition
• is not - the respondent must not belong to exactly the sub category(ies) included in the condition
• is neither - the respondent must not belong to exactly any of the sub category(ies) included in the condition
In the example above, the condition is met by respondents who belong to the sub category IT in the respondent category Department.
Combining conditions
Sometimes you might want to combine several conditions. The example below shows how this is done in Survey&Report.
In a survey, we have created the questions In which country do you work?, What is your nationality? and What is your gender? We want to ask a supplementary question to those who answer that they work in the US or have American citizenship and who are women. We start by adding the first condition with the question In which country do you work? and then click
the button to the left below the condition.
© Artisan Global Media
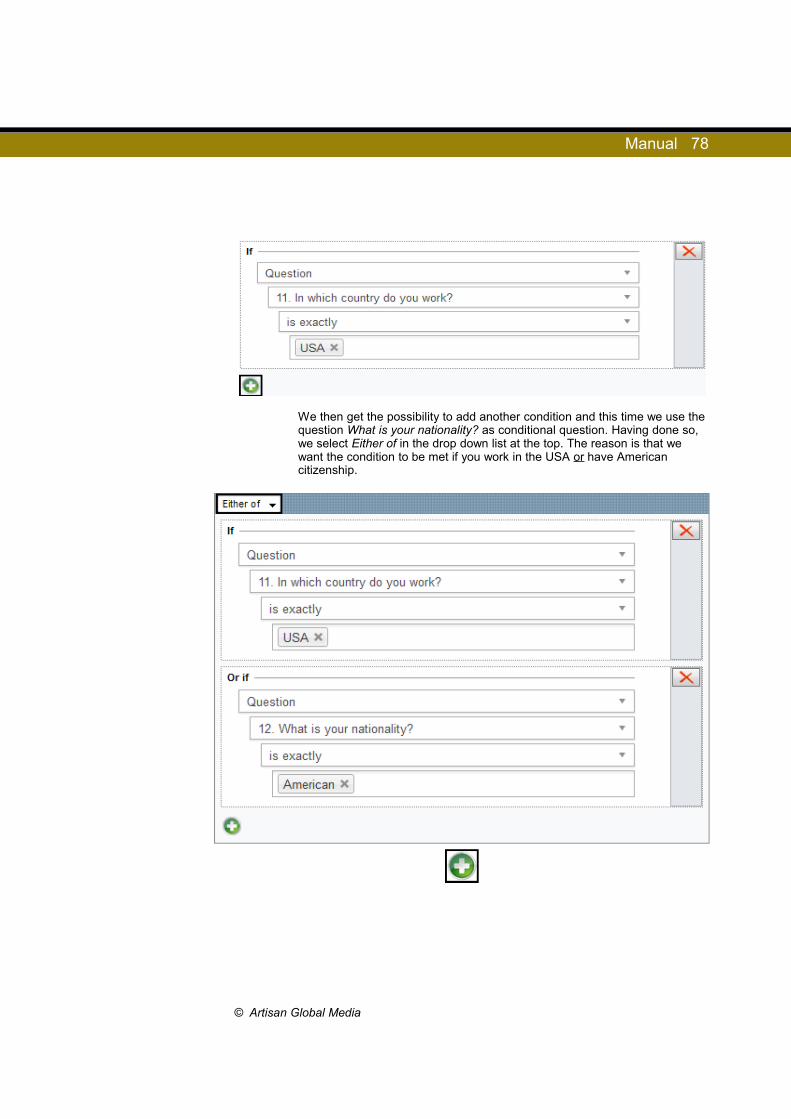
Manual 78
We then get the possibility to add another condition and this time we use the question What is your nationality? as conditional question. Having done so, we select Either of in the drop down list at the top. The reason is that we want the condition to be met if you work in the USA or have American citizenship.
© Artisan Global Media
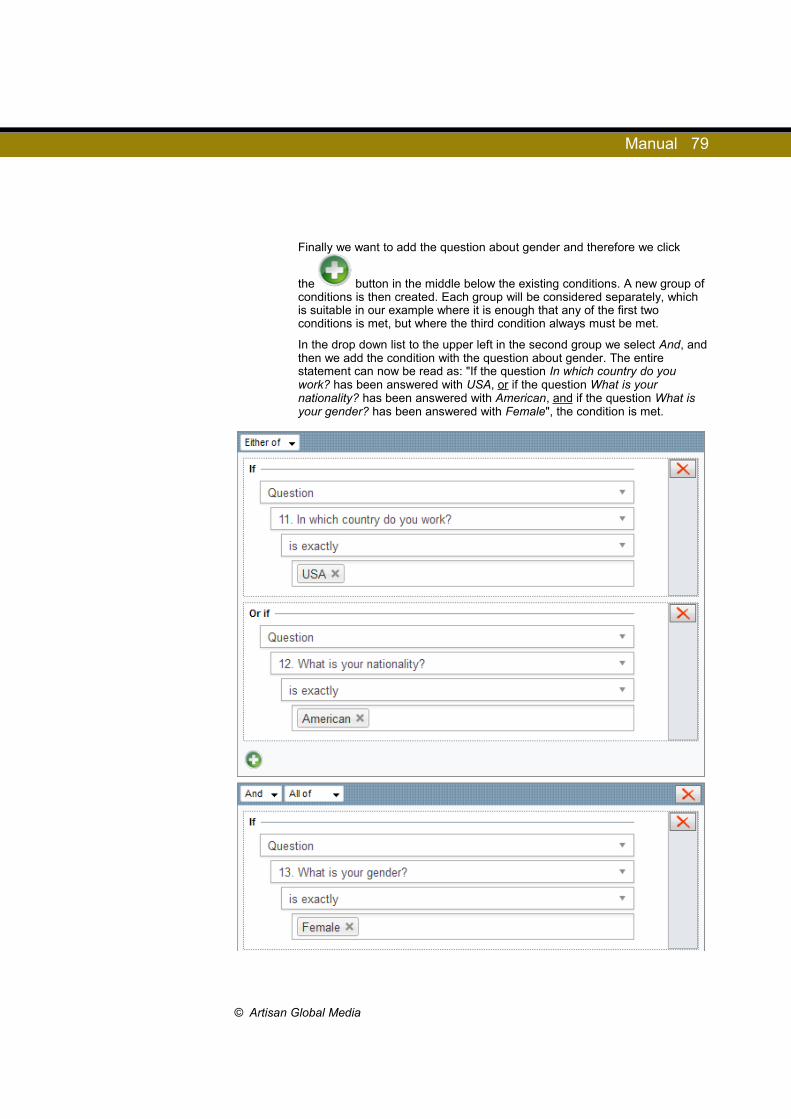
Manual 79
Finally we want to add the question about gender and therefore we click
the button in the middle below the existing conditions. A new group of conditions is then created. Each group will be considered separately, which is suitable in our example where it is enough that any of the first two conditions is met, but where the third condition always must be met.
In the drop down list to the upper left in the second group we select And, and then we add the condition with the question about gender. The entire statement can now be read as: "If the question In which country do you work? has been answered with USA, or if the question What is your nationality? has been answered with American, and if the question What is your gender? has been answered with Female", the condition is met.
© Artisan Global Media

Manual 80
Inactivate the conditions
If you want a certain action to be performed for all respondents, without any condition being met, for example that a pop-up message is shown directly when the survey is loaded, you can unmark the check box next to Conditions.
ActionsWhen you have created the condition, it is time to decide what will happen if the condition is met. You can choose from the following actions:
• Hide questions• Show questions• Go to a question• Hide parts of a question• Show parts of a question• Show a popup• Go to a website• End survey and show message
Below you can read about how the different actions work, and how you define them.
Hide or show questions
What most people want to do when creating a logic is to make one or more questions answerable for certain respondents only. This can be achieved by performing the action Hide questions on a question that is visible from the start (and in that way hide it from the respondents who are not to answer it), or the action Show questions on a question that is hidden from the start (to show it for those you want to answer it).
A question can be made hidden from the start in three different ways:
1. When you create or edit a question, by marking the check box Hidden from the start.
© Artisan Global Media
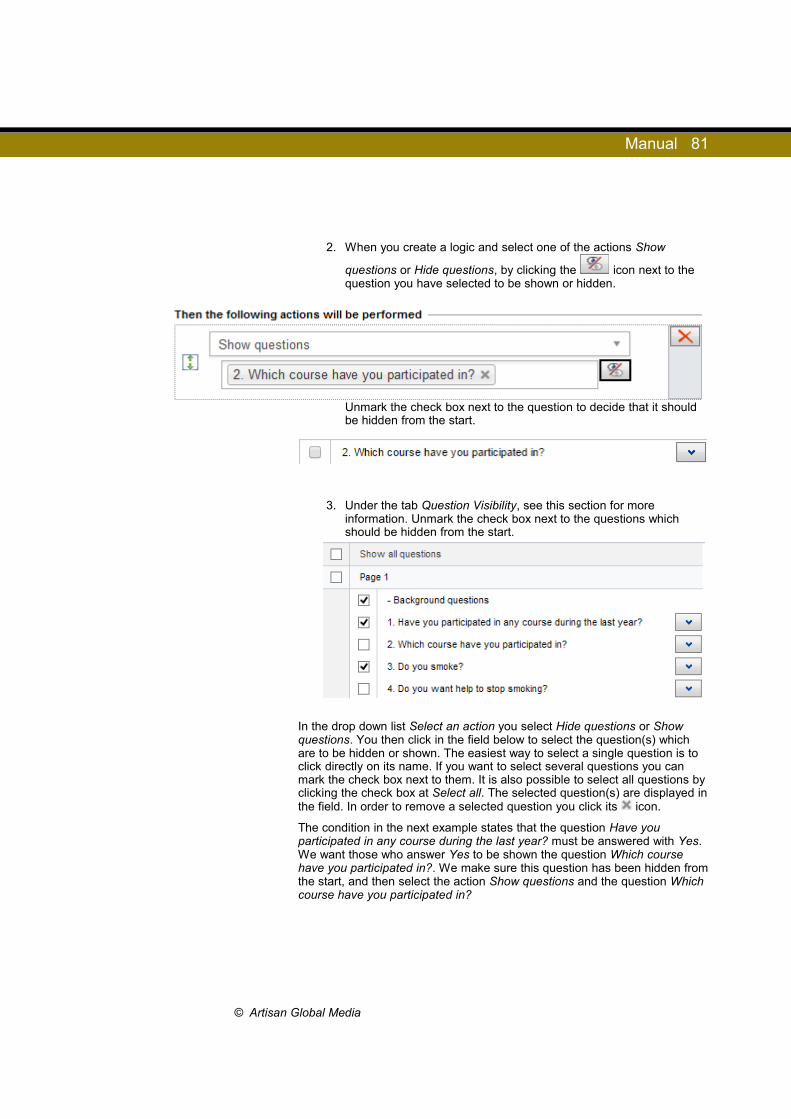
Manual 81
2. When you create a logic and select one of the actions Show
questions or Hide questions, by clicking the icon next to the question you have selected to be shown or hidden.
Unmark the check box next to the question to decide that it should be hidden from the start.
3. Under the tab Question Visibility, see this section for more information. Unmark the check box next to the questions which should be hidden from the start.
In the drop down list Select an action you select Hide questions or Show questions. You then click in the field below to select the question(s) which are to be hidden or shown. The easiest way to select a single question is to click directly on its name. If you want to select several questions you can mark the check box next to them. It is also possible to select all questions by clicking the check box at Select all. The selected question(s) are displayed in the field. In order to remove a selected question you click its icon.
The condition in the next example states that the question Have you participated in any course during the last year? must be answered with Yes. We want those who answer Yes to be shown the question Which course have you participated in?. We make sure this question has been hidden from the start, and then select the action Show questions and the question Which course have you participated in?
© Artisan Global Media
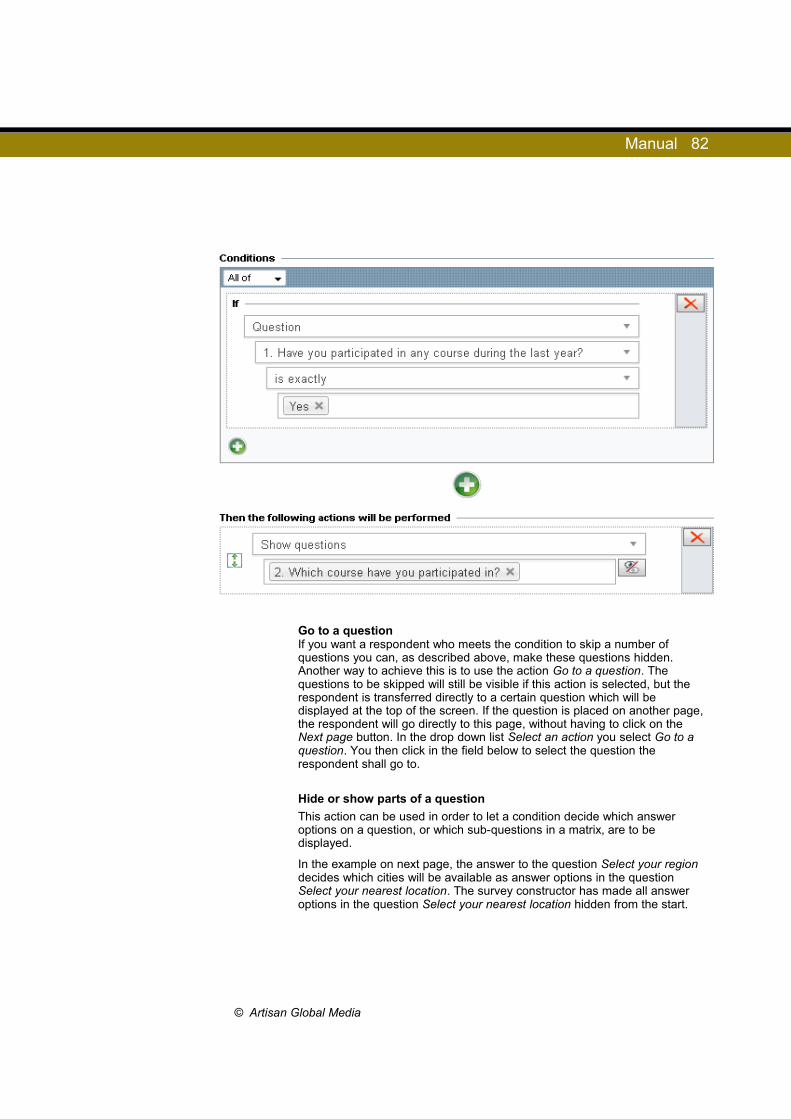
Manual 82
Go to a questionIf you want a respondent who meets the condition to skip a number of questions you can, as described above, make these questions hidden. Another way to achieve this is to use the action Go to a question. The questions to be skipped will still be visible if this action is selected, but the respondent is transferred directly to a certain question which will be displayed at the top of the screen. If the question is placed on another page, the respondent will go directly to this page, without having to click on the Next page button. In the drop down list Select an action you select Go to a question. You then click in the field below to select the question the respondent shall go to.
Hide or show parts of a question
This action can be used in order to let a condition decide which answer options on a question, or which sub-questions in a matrix, are to be displayed.
In the example on next page, the answer to the question Select your region decides which cities will be available as answer options in the question Select your nearest location. The survey constructor has made all answer options in the question Select your nearest location hidden from the start.
© Artisan Global Media

Manual 83
This can be made under the tab Question Visibility or by clicking the button next to the field where you select the answer options to be displayed, after selecting a question. In both cases, you expand the question by clicking
, and unmark the check box next to the answer options (or sub-questions in a matrix) to be hidden from the start.
The condition below is met by those who answer Europe on the conditional question. The action Show parts of a question has then been selected, after that the question Select your nearest location and finally that the answer options Paris and London should be shown.
© Artisan Global Media

Manual 84
Show a pop-upUse this action to show a message to respondents meeting the condition. The message will be shown in a pop-up, directly after the condition is met. Select Show a pop-up in the drop down list Select an action, and type the message in the field below.
If the survey is multilingual, the button will be displayed in the field where the message is written. Click the button to translate the message to the other languages.
Go to a website
If you select this action the respondent will be transferred to a website when the condition is met. Select Go to a website in the drop down list Select an action, and type the web site's URL in the field below. If you mark the check box Open URL in a new window, the website will be opened in a new window (or a new tab, depending on the browser settings). If the check box is left unmarked, the website will be opened in the same window where the survey was previously displayed.
End survey and show message
Sometimes you might want to avoid getting answers from respondents who give a certain answer to a question. Example: A survey starts with the question Have you participated in the course?. You only want those who answer Yes to answer the rest of the survey. For respondents answering No, the action End survey and show message should be performed. These respondents will then not be able to proceed with answering the questions in the survey, or submit it. Instead a message is shown where you inform them that they cannot continue answering the survey.
Select End survey and show message in the drop down list Select an action, and type the message in the editor below.
© Artisan Global Media

Manual 85
If the survey is multilingual, the button will be displayed in the tool bar. Click the button to translate the message to the other languages.
Combining several actions
If you want to, you can let a condition result in several actions being
performed. After you have added the first action, you click the button below the existing action, in order to add another one. In the example below, a pop-up will first appear, and then the respondent will go to the specified question.
If you want to change the order in which the actions are performed, you
place the cursor on the icon to the left of an action, and drag and drop it to another place.
Please note that the action End survey and show message cannot be combined with other actions. If you create such an action, having already created actions of other types, all other actions will be removed.
Advanced settingsUnder the tab Advanced settings you decide when the logic should be applied and its action performed. There you find the following events:
• when a survey page is loaded - the action is performed if the condition is met already when the respondent enters the page.
• when a conditional question is answered or the answer is changed - the action is performed if the respondent meets the condition by answering a conditional question or changing the answer
• before a survey page is left - the action is performed if the condition is met when the respondent leaves the page
• when the survey is submitted
© Artisan Global Media

Manual 86
As default, all four events is selected. The action will be performed when the first selected event (in sequence from the top) occurs.
Thus, you unmark an event if you do not want the action to be performed when the event occurs.
Example 1:
A logic has a condition which is met if the respondent has not answered a conditional question. Since the question is unanswered when the respondent enters the page where the question is located for the first time, the action will be performed directly when the respondent enters the page. If you do not want the action to be performed until the respondent leaves the page (if the question is then still unanswered) you unmark the check box at when a survey page is loaded.
Example 2:
You are making a "quiz" survey with one question per page, and where you have inactivated the possibility to go back to the previous page. When the respondent leaves the page, a message saying whether the answer was correct or not should be displayed. If the message would be displayed directly when the question was answered, the respondent would be able to change an incorrect answer. For that reason you unmark the check box at when a conditional question is answered or the answer is changed.
Example 3:
One type of action is Go to a website. When this action is performed a specified web page will be opened, in the same window or in a new window, for the respondents who answer in a certain way. If you prefer that these respondents get a link to the web page instead, in the thank you message which is displayed after submitting the survey, you unmark all events but when the survey is submitted.
Logic overviewWhen you click the Conditions tab you come to an overview where you see the logics already created. They are listed with name and one or more icons showing what kind of action will be performed if the condition of the logic is met. The following icons can be displayed.
- one or more questions are hidden or shown
- a message is shown
- the respondent goes to a question
- the respondent is transferred to a web site
- the survey is terminated
© Artisan Global Media

Manual 87
Editing and deleting logicClick on a logic in the overview to get to its edit mode. When you edit a logic you can change its name, condition(s) and action(s). If you want to delete a
condition or an action, click on the button to the right of the condition/action. Click the Remove button to delete the entire logic.
Arranging and grouping logicsIn the overview under the Conditions tab, already created logics are listed. In some cases the order in which they are listed might be important. This will, for example, apply if a respondent by giving a certain answer to a question meet the condition of two separate logics. Since the logics are applied in sequence starting at the top, the upper logic will first be performed and then the logic with a lower position. Please note that if the action of the upper logic is that the survey will be terminated, the lower logic's action will not be performed. You can change a logic's position by dragging and dropping it to another place.
If you create a great number of logics in a survey, you can divide them into different logic groups to get a better overview.
Click the Add logic group button to create a new group. Give the group a
name and click the button. As soon as you have created the new group, a new column will appear on the left hand side of the page. This column will contain the groups you create. Your new group is listed under a group called Default group. This group contains any logics created before you created the new group.
If you want to change the name of the Default group you click it, change its
name and click the button. In the same way, you can change the name of other groups.
When you have more than one group and want to create a new logic, you start by clicking the group the logic is to belong to. You then create the logic as described above. If you want to edit an existing logic, you click the group where it is placed and then the logic.
You can move a logic from a group to another by drag and drop. In the example below, a logic is being moved to Group 2.
© Artisan Global Media

Manual 88
QuotaIn the section Conditions you can read about how to define conditions which leads to certain actions being performed if the condition is met. An example of such an action is that a hidden question becomes visible for respondents answering a conditional question in a certain way.
Quota works in a similar manner and here too you create conditions which are to be met and actions that should be performed. However, in a quota you also specify a Quota limit, i.e. how many respondents can meet the condition before it starts to apply. Thus, the purpose of creating a quota can be to limit the number of respondents answering in a certain way, for example when making an application.
Example: A company creates a survey to work as a course application form. The maximum number of participants is 45, and their aim is to have an equal number of participants from each of their three regions. To achieve this they create a quota for each region, where the quota limit is set to 15. In the image below you can see how the quota is specified for one of the regions. The condition is that the question Which region do you belong to? is answered with West, and the action to be performed is that the survey is terminated and a message is shown.
© Artisan Global Media

Manual 89
Create quota
To create a quota you click the button, or the button Add quota.
Give the quota a name. The name will not be visible to the respondent. For your own sake you should give the quota a name which describes what the purpose of the quota is, e.g. Maximum number of men = 25.
Quota limit and Current value
In the Quota limit field you specify how many respondents can meet the quota's condition before its action is performed.
At Current value you can see the received number of answers meeting the quota's condition has been received so far. If the number of received answer has reached the quota limit, and you despite this want to allow more answers meeting the condition, you can click the Reset button to reset Current value to 0.
Only trigger on submit
You mark the check box Only trigger on submit if you want the action to be performed only when the respondent clicks the Submit button. In the example with the registration form, you might want the respondents to be able to send their application even though the maximum number of participants has been reached. If you select this option the respondent will, after clicking Submit, get a message saying the application has been received and they are placed in the standby queue.
If you combine the setting Only trigger on submit with the action End survey and show message, the respondent will get the message after clicking the Submit button but the answers will in this case not be registered.
Conditions
Under the heading Conditions you formulate a conditional statement which is to be met. The statement begins with the word If, and in the drop down lists below you select the options of your choice. Please refer to the section Survey > Survey Construction > Questions > Conditions for more information on how to specify conditions.
Actions
When you have created the condition, it is time to decide what will happen if the condition is met. Please refer to the section Survey > Survey Construction > Questions > Conditions for more information on how to specify actions.
© Artisan Global Media

Manual 90
Quota overviewWhen you click the Quota tab you see an overview with the quotas already created. They are listed with name and one or more icons showing what kind of action will be performed if the condition of the quota is met. The following icons can be displayed:
- one or more questions are hidden or shown
- a message is shown
- the respondent goes to a question
- the respondent is transferred to a web site
- the survey is terminated
Editing and deleting quotaClick on a quota in the overview to get to its edit mode. When you edit a quota you can change its name, quota limit, condition(s) and action(s). If you
want to delete a condition or an action, click on the button to the right of the condition/action. Click the Remove button to delete the entire quota.
Arranging quotasIn the overview under the Quota tab, already created quotas are listed. In some cases the order in which they are listed might be important. This will, for example, apply if a respondent by giving a certain answer to a question meet the condition of two separate quotas. Since the quotas are applied in sequence starting at the top, the upper quota will first be performed and then the quota with a lower position. Please note that if the action of the upper quota is that the survey will be terminated, the lower quota's action will not be performed. You can change a quota's position by dragging and dropping it to another place.
Design When you created the survey you selected a theme in the Basic information. A theme is a design template that determines the overall look of the survey, as well as that of the individual questions and question titles.
If you want to change the theme, you do that under Theme on the Design page. The Theme drop down list lets you choose from all the themes that have been created in the system. If you click on a theme name, you get an instant preview of what the survey would look like if you chose that theme. Click on Save as survey theme to confirm your choice.
© Artisan Global Media

Manual 91
Customising Themes To the right of the preview, you find the window Customise theme where you, under the tab Theme settings, can customise the theme settings for the current survey. To be able to save the changes, it is required that you have access to the button Save theme settings. This button is only available as long as the survey has the status Construction, and only for users who (through their group) have the right Save theme settings.
The settings under the Theme settings tab are grouped under the headings Survey, Question, Question title, Progress indicator and Advanced.
Settings for Surveys Width - select Auto if you want the survey width to be adapted to the respondent's web browser. Otherwise, specify a fixed width in pixels.
Margin - the empty space around the survey. The margins above and below the survey are specified at Vertical while the margins for the sides are specified at Horizontal. The Centered check box under Horizontal is used to center the survey if you selected a fixed width in pixels under Width.
Padding - the empty space between the survey's edges and the actual text (or images). The margins above and below the text are specified at Vertical while the margins for the sides are specified at Horizontal.
Font - choose from Arial, Comic Sans MS, Courier new, Georgia, Helvetica, Impact, Lucida Sans, Tahoma, Times new roman and Verdana
Font size - specify the text size as a percentage. The size of the question titles can be specified separately, see Settings for question titles below
Font colour - select a colour by clicking the coloured rectangle or by entering a colour code
Background - the look of the background around the survey: Colour (Background colour), Gradient (From colour, To colour) or Image, see below
Inner background - the look of the area behind the text: Colour (Background colour) or Image, see below
Background colour - select a colour by clicking the coloured rectangle, or by entering a colour code
From colour, To colour - available if Transition was chosen for the Background. Choose the two colours you want to use in the same way as above.
Image - available if you selected an Image either as your Background or Inner background. Click to select an image in the library.
Repeat - available if you chose to use an Image as your Background or Inner Background. Specify whether the image is to be displayed just once in the background (No repeat), repeated both horizontally and vertically (Repeat), only horizontally (Repeat horizontally) or only vertically (Repeat vertically). Repeating an image with a discrete design can provide a spectacular background.
Placement - available if you chose to use an Image for your Background or Inner Background. Select where to place the image, or, if it is to be repeated, where the first image is to be placed.
© Artisan Global Media

Manual 92
Attachment - available if you chose to use an Image as your Background or Inner Background. Specify whether the image is to have a static location in the survey (Scroll) or on the screen (Fixed).
BordersUsing various types of borders, you can create a frame around the survey. You determine their design by specifying a Style, a Colour, and a Width for each of the Borders: Top, Right, Bottom and Left.
Style - choose between eight different styles, or select None if you do not want a border.
Colour - select a colour by clicking the coloured rectangle, or by entering a colour code
Width - select a width between 0 (no border) and 10
Settings for Questions Each question comprises a distinct section that can have a surrounding frame and a background colour.
Rendering - choose Frame (a standard frame is then placed around each question) or Styled (choose whether you want frames around each question as well as what they will look like, and whether the sections are to have a background colour). If you choose a Frame, the question title will be displayed as part of the frame. Since some web browsers cannot create line breaks in the question title when you have chosen Frame, it is recommended that you use Styled if your question titles are very long. Otherwise they run a risk of being cut off mid-way.
Margin
Questions - the empty space below each question
Padding - the internal margin for each question
Answer options - the margins above and below each answer option, and above and below each subquestion in matrices
Line spacing - the spacing between the lines in the answer options, the recommended setting is Automatic
Style - the formatting options: Bold, Italic and Underline
The settings below are only available if Styled was selected at Render.
Background colour - the colour behind the actual questions. Choose a colour by clicking the coloured rectangle on the right, or by entering a colour code. If no colour is specified, the survey background (Inner Background) or the images selected for Layer 1 and Layer 2 will be used.
Layers
It is possible to place one or two images directly behind each question.
Layer 1 - this image will be placed behind the image in Layer 2.
Layer 2 - this image will be placed on top of the image in Layer 1.
Background - Under the headings Layer 1 and Layer 2, select whether an Image is to be inserted behind the question, otherwise select None.
© Artisan Global Media
Manual 93
Image - available if you chose Image as your Background. Click on to retrieve an image from the library.
Repeat - available if you chose to use an Image as your Background. Select whether the image is to be displayed in only one place in the background (No recurrence), or if it is to be repeated be side-by-side horizontally (Repeat horizontally), vertically (Repeat vertically) or both horizontally and vertically (Repeat). An image with a discrete design can provide a spectacular background if repeated across the entire background.
Placement - available if you chose to use an Image as your Background. Select where the image is to be placed, or, if it is repeated across the page, where the first image is to be placed.
BordersThe frame around a question consists of a number of borders. You decide where to place the borders and how they should look, by specifying the Style, Colour and Width for each of the following borders: Top, Bottom, Left and Right
Style - select the type of border, or choose None if you do not want a border
Colours - select a colour by clicking on the coloured rectangle, or by entering the colour code
Width - specify a widthbetween 0 (= no border) and 10
Settings for Question TitlesThe question titles can be formatted separately.
Allow custom styles for questions - this setting activates any individual
formatting that is done via the button in the question's edit mode. For images to appear in the question title, this setting must be activated.
Margins - the empty space between the question title and the answer options.
Font - choose from Arial, Comic Sans MS, Courier new, Georgia, Helvetica, Impact, Lucida Sans, Tahoma, Times new roman and Verdana
Font size - specify the size as a percentage
Line spacing - the spacing between the lines in the answer options, useful if each answer option takes up several lines.
Font colour - select a colour by clicking the coloured rectangle, or by entering a colour code
Style - the formatting options: Bold, Italic and Underline.
Settings for Progress indicator (the Navigation alternatives)If you have selected one of the navigation alternatives as a progress indicator under Basic Information > Properties > Layout, you can adjust the appearance using the following settings:
Margin
• Vertical - state a number between 0 and 10, the higher number the larger margin between the bottommost question and the lower edge of the page.
© Artisan Global Media

Manual 94
• Horizontal - state a number between 0 and 10, the higher number the larger space between the field/button for the page numbers (does not apply to the dropdown list)
Padding
• Vertical - state a number between 0 - 10, the higher number the higher field/buttons for the page numbers (does not apply to the dropdown list)
• Horizontal - state a number between 0 - 10, the higher number the wider field for the page numbers (does not apply to buttons or dropdown list)
Font - choose from Arial, Comic Sans MS, Courier new, Georgia, Helvetica, Impact, Lucida Sans, Tahoma, Times new roman and Verdana
Font size - choose from 90%, 100%, 125%, 150% or 200%
Font and background colour - choose the colour by clicking in the rectangle after the field, or by entering a colour code in the fieldFont and background colour can be chosen for the following types of pages in the navigation:
• Default
• Active page
• Visited page with unanswered questions
• Page with all questions completed
• Page with no questions
• Page with compulsory questions
Style - you can also choose different style on the page numbers for every type of page above:
• Bold (does not apply to the dropdown list)
• Italic
• Underlined (does not apply to the dropdown list)
Advanced settingsYou who have knowledge of CSS can change the presentation style via the style sheet of the survey. It is available for the users who have been given the right to Edit theme with style sheet editor (CSS) under Administration > Users > Groups > Templates.
in order to open the editor.
© Artisan Global Media

Manual 95
The Qustion Settings TabThe Customise theme window also provides you with the Question settings tab.
Under the heading Width of subquestion columns, you find specific settings for those question types that have subquestions, eg. Matrix questions and Numeric - multiple. These question types consist of two "columns", one for the title of the subquestion and one for its answer options. The setting you choose determines the width (in percent) for the column with the subquestion title. If you, for instance, specify that the question title is to take up 30% of the survey width, the column with the answer options will take up 70%. This way you can ensure a suitable division, and avoid unnecessary line breaks.
Under the heading Answer option spacing, you make settings concerning the question types Yes/No, Radio Buttons and Check Boxes. Under the Theme settings tab, at Question > Margin > Answer options, you find a general setting for the spacing between the answer options, but here under Question settings you can make this setting per question. The settings you make here also affect the spacing between the answer options on questions where you have chosen a horizontal orientation. As long as you have not changed a setting, the slider is placed to the far left, with the symbol -. This means that the general setting under Theme settings apply.
The settings under this tab can be chosen for the entire survey, for each page, or for each individual question. You find them under the following headings:
• Adjust all on this survey• Adjust all on this page• Available on this page - click on to go to the question.
Click on Save question settings to save your changes.
Preview The Preview displays the survey exactly as it will appear to the respondent. It also lets you test any filters you may have created in order to inform you on how questions are displayed or hidden according to the settings for the filter.
If your survey is multilingual, you select which language version you want to preview by clicking the different tabs at the top of the page.
Paper SurveysThe SR-Advanced Survey plug-in contains the Paper survey function. If you plan on printing your survey and using it as a paper survey, you can get a preview of what it will look like on this page. The settings you choose here can also be found on the Data collection > Paper survey > Setup tab. On this page, however, you have the possibility to get a preview of the survey before you even finish constructing it.
Design Select which Fonts and Font sizes are to be used for question titles and answer options. When printed, the question titles will be in bold.
© Artisan Global Media
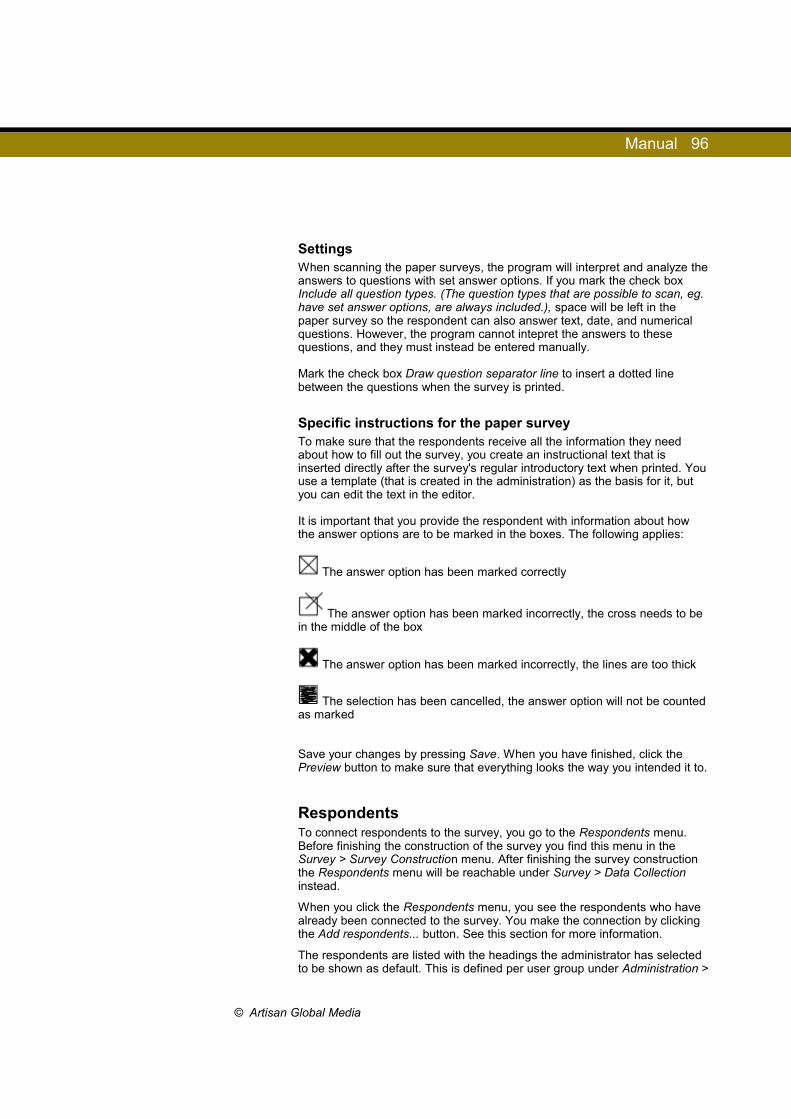
Manual 96
Settings When scanning the paper surveys, the program will interpret and analyze the answers to questions with set answer options. If you mark the check box Include all question types. (The question types that are possible to scan, eg. have set answer options, are always included.), space will be left in the paper survey so the respondent can also answer text, date, and numerical questions. However, the program cannot intepret the answers to these questions, and they must instead be entered manually.
Mark the check box Draw question separator line to insert a dotted line between the questions when the survey is printed.
Specific instructions for the paper surveyTo make sure that the respondents receive all the information they need about how to fill out the survey, you create an instructional text that is inserted directly after the survey's regular introductory text when printed. You use a template (that is created in the administration) as the basis for it, but you can edit the text in the editor.
It is important that you provide the respondent with information about how the answer options are to be marked in the boxes. The following applies:
The answer option has been marked correctly
The answer option has been marked incorrectly, the cross needs to be in the middle of the box
The answer option has been marked incorrectly, the lines are too thick
The selection has been cancelled, the answer option will not be counted as marked
Save your changes by pressing Save. When you have finished, click the Preview button to make sure that everything looks the way you intended it to.
RespondentsTo connect respondents to the survey, you go to the Respondents menu. Before finishing the construction of the survey you find this menu in the Survey > Survey Construction menu. After finishing the survey construction the Respondents menu will be reachable under Survey > Data Collection instead.
When you click the Respondents menu, you see the respondents who have already been connected to the survey. You make the connection by clicking the Add respondents... button. See this section for more information.
The respondents are listed with the headings the administrator has selected to be shown as default. This is defined per user group under Administration >
© Artisan Global Media
Manual 97
Respondents > Settings > Group specific settings. If you click the button, you can decide for yourself which columns to display, by marking the check box next to the desired columns.
Sort the list according to different criteria by clicking the column heading of your choice. You can also filter the list by clicking the icon in the heading of the desired column, and enter the text you want to filter by in the text field. If you, for example, filter the E-mail address column by the text @artologik.com, only the respondents with e-mail addresses matching this text will be displayed. The icon indicates that the column is already filtered. If you want to remove the filtering, you click the icon, hover the cursor over the text field, and click in the upper right corner of the field.
To the far left, there is a column showing if the respondent has answered or not. There you find one of these symbols:
The respondent has not started to answer the survey
The respondent has started to answer the survey, but has not submitted it
The respondent has submitted the survey
The respondent is a multi-respondent type with a stated maximum number of answers. If you place the cursor over the icon, a small window is shown with information on how many of the possible answers that are submitted so far.
If the respondent is marked with the information icon, it means that the respondent self has edited her/his personal data through the survey. The icon will remain until a user with the right to edit respondent data has saved the information. In the survey, the respondent will belong to the respondent category he or she stated.
If the option Show answer date has been marked in the window you reach by
clicking the button, the answer date is displayed next to the symbol on the respondents who have submitted the survey. If the survey is anonymous, the word Yes is displayed instead of the date.
To the far right you find two icons. Click the icon to edit the respondent.
See the Editing Respondents section for more information. You click the icon to fill in the survey on the respondent's behalf. See the section Answering a Survey on Behalf of a Respondent below.
If the number of respondents in the list exceeds the number that fits on the page, they will be divided into several pages. Toggle between the pages by clicking the buttons at the bottom of the page.
There are different ways to toggle between the pages:
• Click the desired page number
© Artisan Global Media
Manual 98
• Go one page backwards or forwards by clicking the and icon respectively
• Go to the first or last page by clicking the and icon respectively
Searching for respondentsIt is possible to search for connected respondents in the list. The search function is particularly useful when a large number of respondents are connected to a survey.
The search can be done in two different search modes:
Simple search - a single field lets you enter and search for a:
- First Name - Last Name - Organisation - E-mail Address- Street Address - Zip Code - City - Country - Phone Number - Cell Phone Number
Advanced Search - a more advanced search form lets you use various search terms for the corresponding fields in the respondent details:
- ID - First Name - Last Name - Organisation - E-mail Address- Street Address - Zip Code - City - Country - Phone Number - Cell Phone Number- Language - LDAP source (only available with the plug-in SR-LDAP) - Respondent owner (only available if the function has been activated under Administration > Settings > Surveys > General settings)- Respondents who have edited their personal data- Respondent Categories - Respondent Properties
Go to the advanced search by clicking the button next to the Search button.
The text fields let you enter and search for either whole words or parts of words. If you for instance type in John as your search term, the search results will include respondents by the name of John as well as Johnson.
© Artisan Global Media

Manual 99
Editing respondents
To edit a respondent, click the button on the far right on the respondent's row. Please refer to the section on Editing Respondents for information on how this is done or read the Quick Edit section below.
Quick editThis feature lets you edit the respondent details directly in the list of respondents. To display more columns in the list, and thus be able to edit
them in this way, click the button and mark the check box next to the columns you want to be displayed.
1. Click the Start Quick Edit button, upon which the icon is displayed in all the editable fields in the list
2. Click on the field you want to edit and make your changes.3. Use the Tab (forward) and Shift + Tab (backward) keys to quickly
move between the fields on a row-by-row basis. Use the Enter (down) and Shift + Enter (up) keys to edit the fields column by column. The changes are saved automatically when you leave the field.
4. Click on Exit quick edit mode to return to the normal page mode.
Anonymising respondentsIf the survey is closed, the Anonymise button appears in the bottom menu. Use this button to keep the received responses and their connection to respondent categories, but clear other respondents information for all respondents in the list.
To anonymise an individual respondent, use the Personal data > Personal Data Report > Respondents menu. Via this page it is also possible to anonymise respondents on active surveys.
Removing respondents1. Mark the check box next to the respondent or respondents you wish
to remove. By marking/unmarking the check box next to the column heading you select/deselect all the respondents' check boxes at once.
2. Click the Remove button...3. A window opens where the option Remove respondent from survey
is pre-selected. Leave this option selected if you want the respondents to disappear from the list. If you want to remove the respondent from the survey, but want him/her to remain (with strikethrough text) in the list, select the option Unregister respondent(s) from the survey. Confirm the removal by clicking OK.
Removing from the databaseWhen you remove respondents from the survey, you can at the same time remove them from the respondent database, provided that they are not connected to any other survey. If so, the check box Remove from database is displayed. Mark this check box to remove the selected respondents, who are not connected to any other survey, from the respondent database.
© Artisan Global Media

Manual 100
Removing answersWhen you remove respondents who have submitted answers, the program handles their answers in this way:
• Active survey - the respondent's answer is removed• Closed or archived survey - the respondent's answer is not removed
Answering a survey on behalf of a respondentIn some cases you may need to fill out a survey on a respondent's behalf. It can for instance happen if you perform an interview over the phone, or if you've received someone's answers on paper. It is then possible to manually enter the answers into the system. Click on the icon which can be found on the far right on each respondent's row. The icon's appearance indicates if the
respondent has not opened the survey , started to answer the survey ,
or submitted the survey . Answer the questions and press Submit. As long as you have not finished the survey construction, it is not possible to answer
the survey, and then this icon appears: .
If the setting Allow comment has been activated under Survey > Survey Construction > Basic Information > Properties > Settings, you can click
the icon to enter a comment about the respondent. This can be useful for those who make phone calls to interview respondents, and want to make a
comment on a respondent who was not available. The icon indicates that a comment has already been made. Hover the cursor over the icon to see the comment in a tooltip.
Exporting the listTo export the list of respondents to Excel, click the Export button. If you first perform a search, only the respondents matching your search will be exported.
Finish Construction Completing the Survey construction means locking the survey for further editing. The survey is then considered Active. It is still possible to change the publication period, and to edit the question texts (the reason for this being that any spelling errors can then be corrected). In all other respects the survey ought to be "protected" so that no changes are made after respondents have started answering it. This ensures that all respondents answer the "same" survey.
Information The Information shows you the survey's Title and Survey type (Respondent survey, Anonymous respondent survey or Public survey), and the URL for the survey. If the survey is of the Public type, the URL will take you directly to the survey. If it is of the Respondent type, the URL will take you to the log-in page for the survey.
© Artisan Global Media
Manual 101
The Survey's Publication Period Here you need to enter the start and end dates for the period during which the survey is to be available for answering. Either enter the dates manually via the keyboard, or select the dates in the calendar. When you are using the English version of the program, dates are entered in the following format: DD-MM-YYYY.
Respondent surveysIf the survey is a respondent survey you can, under the heading Respondent Categories, see any respondent categories that have been connected to the survey. The respondent categories you want to use as background variables in the reports, must be connected to the survey before the survey construction is finished.
If you have chosen the setting Anonymous on the survey, information about this will be shown on the page. Please note that this setting cannot be changed after the construction is finished.
Data Collection The Data collection menu provides you with the following sub menus:
• Respondents where you connect respondents to your survey using the respondent database, another survey, an e-mail list, a file or (if you have the SR-LDAP plug-in) an LDAP connection.
• Mailings where you can send e-mails to the respondents to inform them about the survey, remind them to answer it or to thank them for their participation. In the message, it is possible to insert a link that leads directly to the survey.
• Paper survey (only available with the SR-Advanced Survey plug-in) which lets you print and scan surveys that have been answered on paper.
• Text answers where you can edit inappropriate answers given on text questions.
• Export where you can export the raw survey data for further processing and analysis in statistics programs.
• Close survey where you can change the survey status to Closed when you have received a sufficient number of responses.
Adding Respondents You connect respondents to your survey by clicking the Add Respondents... button. In the pop-up window that opens, you can add respondents via six different ways:
• The button New respondent• The tab From the respondent database - search for and connect
respondents via the program's respondent database • The tab From a survey - connect respondents who have
participated in previous surveys • The tab From an E-mail list - type or paste a list of e-mail addresses
© Artisan Global Media

Manual 102
• The tab From a file - connect respondents via an import file • The tab Via LDAP - connect respondents via a directory service.
(This requires the SR-LDAP plug-in.)
See the corresponding section for more information.
New respondentUse this method to add individual respondents (that are not already in the respondent database) to your survey. If you need to add a large number of new respondents, or if you want to connect respondents who are already in the respondent database, you use one of the other methods instead.
1. Click the New respondent button.2. Enter the respondent's personal data. At least one of the fields First
Name, Last Name or E-mail Address must be filled.3. Mark the check box Add as survey-specific respondent if you do not
want the respondent to be added to the general respondent database, but only as a respondent on this survey. Thus, the respondent will only be accessible for those who have the right to administer the survey.
4. Enter the appropriate values for the respondent categories and respondent properties of your choice.
5. Under Log-in Details, click the Manage login... button to specify a username and password for the respondent. See the section on Managing Login Details under Editing Respondents for more information. It is possible to skip this step, the respondent will then be assigned an automatic username and password generated by the program.
6. Click Save. The respondent is now connected to the survey and can be found in the respondent list.
If you have created organisations under Administration > Organisations, and if you have chosen that the respondent will be added to the general respondent database, you can under the heading Organisation Access decide which organisations are to have access to the respondent, by marking the check box next to the desired organisations. The organisation you belong to (or, if you belong to several organisations, the one which is selected in the organisation drop down list) is already marked. To be able to give an organisation access to respondents, you must belong to this organisation yourself.
If you have a hierarchical structure of organisations, any parent organisations to selected organisations will automatically be selected. The symbol to the right of an organisation indicates that the organisation has access to the respondent, while organisations without access have the symbol.
From the Respondent Database When connecting a new respondent to a survey, the user can choose to add the respondent as survey-specific, or add the respondent to the respondent database. Respondents can also be imported directly into the respondent database under Administration > Respondents.
In the tab From the Respondent Database, you can search among respondents who are saved in the respondent database and connect them to your survey.
© Artisan Global Media

Manual 103
You can search for respondents in two different modes:
• Simple Search - a single search field lets you search for a: - First name - Last name - Organisation - E-mail address- Street address - Zip code - City - Country - Phone number - Cell phone number
• Advanced Search - a complete search form lets you use multiple fields for your search: - ID - First name - Last name - Organisation - E-mail address- Street address - Zip code - City - Country - Phone number - Cell phone number- Language - LDAP source (only available with the SR-LDAP plug-in) - Respondent owner (if the setting has been activated under Administration > Settings > Survey > General settings)- Respondent categories - Respondent properties
Go to the advanced search mode by clicking on the button next to the Search button.
The text fields let you enter and search for either whole words or parts of words. For instance, a search term such as John will yield results like respondents by the name of John as well as Johnson.
1. Enter your search criteria and click on Search. Respondents matching your search query then appear in a list. If you click on Search without having entered any search criteria the results will be a list of all the respondents in the database that are not yet connected to the survey.
2. Make sure the check box next to the respondents you wish to connect to the survey are marked. By marking/unmarking the check box in the title row, you mark/unmark all the respondents' check boxes at once.
3. Decide if the respondents should be added as survey-specific respondents, or not. If you mark the check box Add as survey-specific respondents, the respondents will be copied from the general respondent database, and saved in a survey-specific database. This means that any changes made to a respondent's personal data on this survey, will not affect the original respondent in the respondent database.
© Artisan Global Media

Manual 104
4. Click the Add button. The respondents are now connected to the survey and can be found in the respondent list.
Random selection of respondents
If you want to you can let the program make a random selection from the
respondents in the search result. Click the button next to the Add button to open a dialog box where you select one of these options:
• All respondents: all respondents in the search result will be added, even if their check boxes has not been marked
• Selected respondents: the respondents whose check boxes has been marked will be added
• Random - sampling rate: the program will make a random selection and add a number of respondents approximately corresponding to the percentage you have specified. Since the percentage you specify decides the probability for each single respondent to be selected, the number of added respondents can only approximate the specified percentage. The more respondents there are in the search result, the closer the percentage of respondents added is to the specified percentage.
• Random - sample size: the program will make a random selection and add the number of respondents you have stated
Click OK to add the respondents.
From a SurveyUse this option if your survey is aimed at a group that has previously participated in a survey. It could for instance be an employee satisfaction survey that is repeated on an annual basis. You can then choose to connect last year's respondents to this year's survey.
1. First search for the survey you want to use to retrieve the respondents. Enter a whole or partial survey name in the search field, and click the Search button. You can also go the advanced
search mode by clicking the button next to the Search button. In this mode you can search for survey name, survey type (respondent survey or public survey), period within which the survey was published, survey category, status (construction, publication pending, active, closed or filed in archive), survey language and owner (the user that created the survey). Make your selections and click the Search button.
2. Select a survey by clicking on it. The survey's respondents are displayed in a list.
3. Make sure the check boxes are marked next to the respondents you wish to connect to the survey. By marking/unmarking the check box in the title row you mark/unmark all the respondents' check boxes at once.
4. Decide if the respondents should be added as survey-specific respondents, or not. If you mark the check box Add as survey-specific respondents, the respondents who are saved in the general respondent database will be copied from there, and saved in a survey-specific database. This means that any changes made to a respondent's personal data on this survey, will not affect the original respondent in the respondent database. Respondents who have been added as survey-specific respondents on the original survey
© Artisan Global Media
Manual 105
will be added as survey-specific respondents also on this survey, independent of if the check box is marked or not.
5. Click the Add button. The respondents are now connected to the survey and can be found in the respondent list.
If you want to you can let the program make a random selection from the
respondents who were connected to the original survey. Click the button next to the Add button, and select one of the options that results in a random selection. See the section Random selection of respondents under Add respondents > From the respondent database for more information.
From an E-mail ListUse this method if you want to connect a list of e-mail addresses to the survey in a simple way. From the list you insert, the program generates respondents which you can then connect to the survey. The respondents you add this way will always be survey-specific, i.e. you cannot save them in the respondent database.
1. Type or paste the e-mail addresses into the field under E-mail addresses. Use comma, semicolon, space or new line as delimiter.
2. Click the Next button.
The page displays a list of respondents, generated by the program, based on the e-mail addresses you inserted in step 1. In addition to the column E-mail address, the columns First name and Last name are also displayed. The program automatically generates first name and last name if the e-mail address has the format firstname.lastname@domain. First name and last name will also be generated if the respondent is entered in this format in step 1: "Firstname Lastname" <e-mail address>, e.g. "John Smith" <[email protected]>, or "Lastname, Firstname" <e-mail address>, e.g. "Smith, John" <[email protected]>.
When you use this method for connecting respondents, you cannot add two respondents with the same e-mail address. If the respondent is displayed in grey and with the icon , it means that another respondent, either in the list you are importing or in the list of already connected respondents, has the same e-mail address.
3. Make sure the check boxes are marked next to the respondents you wish to connect to the survey. By marking/unmarking the check box in the title row you mark/unmark all the respondents' check boxes at once.
4. Click the Add button. The respondents are now connected to the survey and can be found in the respondent list.
If you want to you can let the program make a random selection from the
respondents in the e-mail list. Click the button next to the Add button, and select one of the options that results in a random selection. See the section Random selection of respondents under Add respondents > From the respondent database for more information.
© Artisan Global Media

Manual 106
From a FileThis is a convenient way of quickly importing and connecting new respondents to your survey. The file must be in one of the following formats:
• Text (.txt)• Text (.tab)• Text (.csv)• Spreadsheet (.xls)• Spreadsheet (.xlsx)
The Sample files section provides you with the following examples:
• import.txt• import.tab• import.csv• import.xls• import.xls (include categories and language codes) - contains
information about valid values for respondent categories and languages
• import.xlsx (with multi category support) - note that this file has specific characteristics, described in the section Multiple-choice of subcategories below
The files contain a title row with fields corresponding to those available in the respondent details, as well as the respondent categories that have been connected to the survey.
If you wish, you can use one of the sample files when creating your own import file. Just delete the names that are already in the file and add your own respondents' details instead. Remember to leave the first row as is, as it will be considered a header row by the program. Also, leave the headings' names unchanged, as the program will then be able to automatically match the columns with the corresponding fields in the program.
Naturally, it is also possible to create your own import file without using one of the sample files. For instance, you may have a record (such as a member list) of all your respondents which you can then export to an Excel file. In that case, the file will still need to be structured so that the first row is left for all the headings. You decide yourself which columns you want to have in the import file. However, you must make sure that the import file contains columns corresponding to the fields which the administrator has defined as key fields. The key fields make a respondent unique, i.e. two respondents cannot have identical values in these fields. For that reason, the import file must contain columns which can be matched with the key fields. It does not matter in which order the columns are arranged.
During the import, you will be able to manually match the columns in the import file with the corresponding fields in the program. If you want the matching to be made automatically, you make sure that the column headings in the import file have exactly the same name as the corresponding fields in the program. For example, a column with the heading E-mail address will be matched with the field E-mail address, while a column with the heading Email will not be automatically matched.
© Artisan Global Media
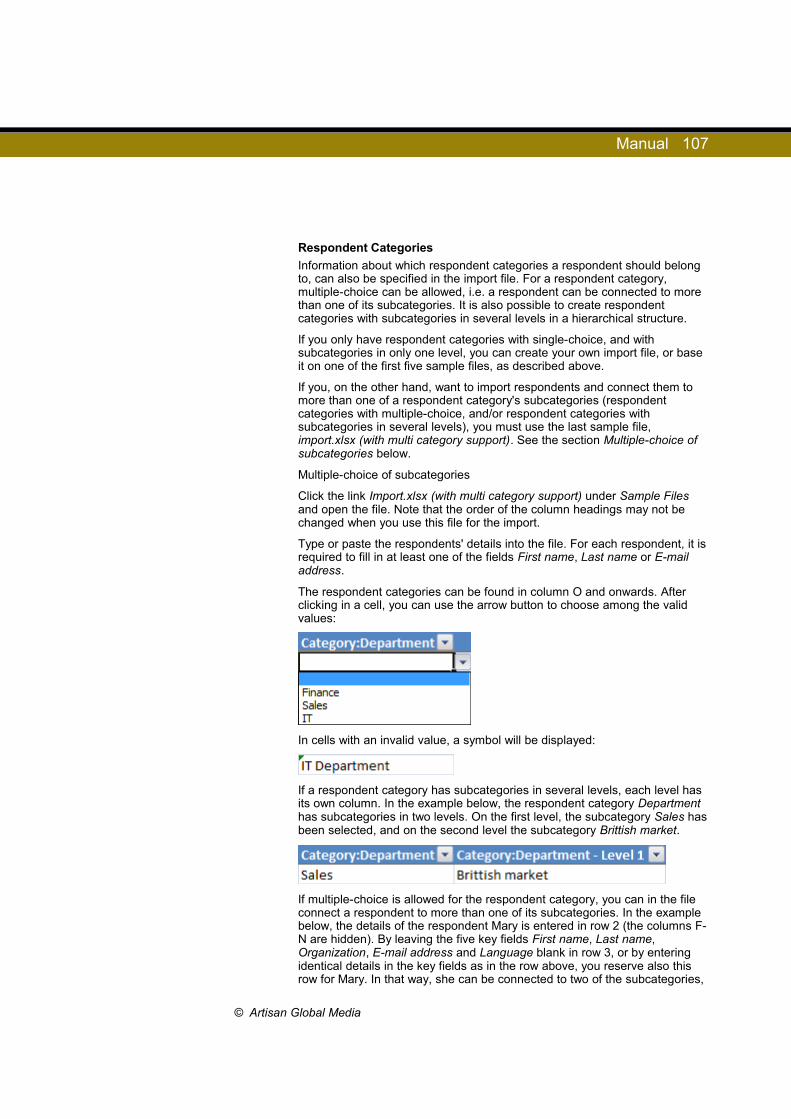
Manual 107
Respondent Categories
Information about which respondent categories a respondent should belong to, can also be specified in the import file. For a respondent category, multiple-choice can be allowed, i.e. a respondent can be connected to more than one of its subcategories. It is also possible to create respondent categories with subcategories in several levels in a hierarchical structure.
If you only have respondent categories with single-choice, and with subcategories in only one level, you can create your own import file, or base it on one of the first five sample files, as described above.
If you, on the other hand, want to import respondents and connect them to more than one of a respondent category's subcategories (respondent categories with multiple-choice, and/or respondent categories with subcategories in several levels), you must use the last sample file, import.xlsx (with multi category support). See the section Multiple-choice of subcategories below.
Multiple-choice of subcategories
Click the link Import.xlsx (with multi category support) under Sample Files and open the file. Note that the order of the column headings may not be changed when you use this file for the import.
Type or paste the respondents' details into the file. For each respondent, it is required to fill in at least one of the fields First name, Last name or E-mail address.
The respondent categories can be found in column O and onwards. After clicking in a cell, you can use the arrow button to choose among the valid values:
In cells with an invalid value, a symbol will be displayed:
If a respondent category has subcategories in several levels, each level has its own column. In the example below, the respondent category Department has subcategories in two levels. On the first level, the subcategory Sales has been selected, and on the second level the subcategory Brittish market.
If multiple-choice is allowed for the respondent category, you can in the file connect a respondent to more than one of its subcategories. In the example below, the details of the respondent Mary is entered in row 2 (the columns F-N are hidden). By leaving the five key fields First name, Last name, Organization, E-mail address and Language blank in row 3, or by entering identical details in the key fields as in the row above, you reserve also this row for Mary. In that way, she can be connected to two of the subcategories,
© Artisan Global Media
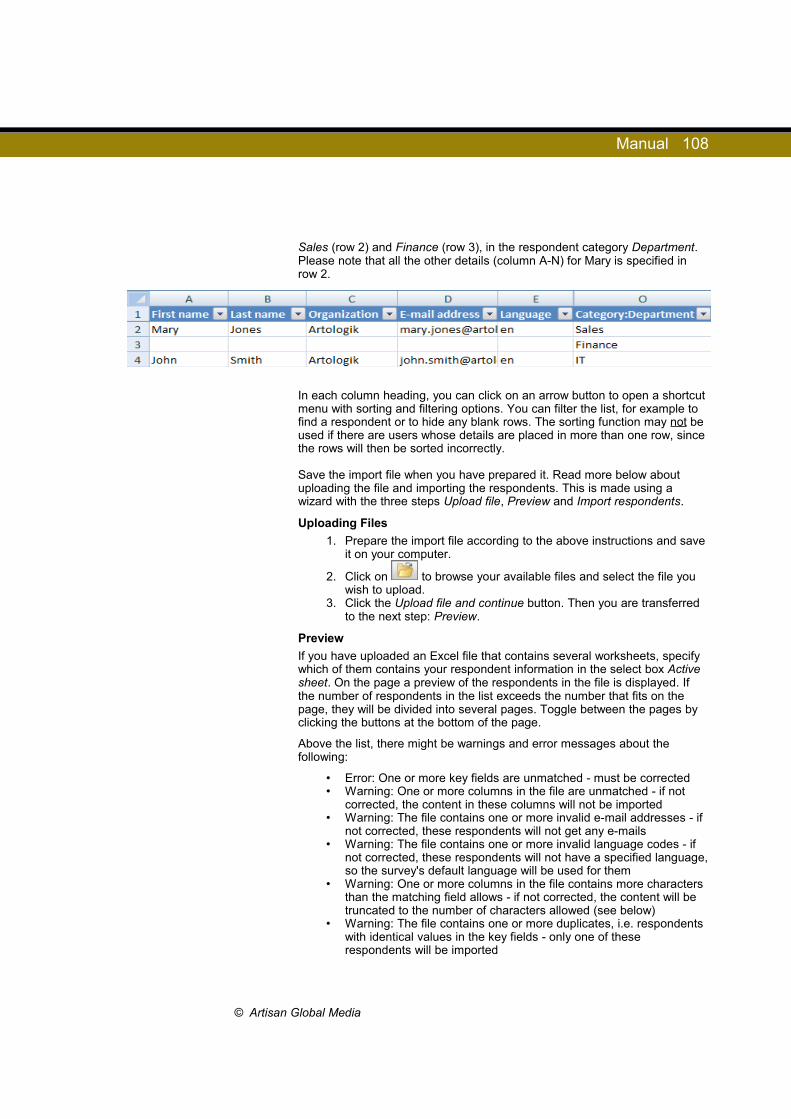
Manual 108
Sales (row 2) and Finance (row 3), in the respondent category Department. Please note that all the other details (column A-N) for Mary is specified in row 2.
In each column heading, you can click on an arrow button to open a shortcut menu with sorting and filtering options. You can filter the list, for example to find a respondent or to hide any blank rows. The sorting function may not be used if there are users whose details are placed in more than one row, since the rows will then be sorted incorrectly.
Save the import file when you have prepared it. Read more below about uploading the file and importing the respondents. This is made using a wizard with the three steps Upload file, Preview and Import respondents.
Uploading Files
1. Prepare the import file according to the above instructions and save it on your computer.
2. Click on to browse your available files and select the file you wish to upload.
3. Click the Upload file and continue button. Then you are transferred to the next step: Preview.
Preview
If you have uploaded an Excel file that contains several worksheets, specify which of them contains your respondent information in the select box Active sheet. On the page a preview of the respondents in the file is displayed. If the number of respondents in the list exceeds the number that fits on the page, they will be divided into several pages. Toggle between the pages by clicking the buttons at the bottom of the page.
Above the list, there might be warnings and error messages about the following:
• Error: One or more key fields are unmatched - must be corrected• Warning: One or more columns in the file are unmatched - if not
corrected, the content in these columns will not be imported• Warning: The file contains one or more invalid e-mail addresses - if
not corrected, these respondents will not get any e-mails• Warning: The file contains one or more invalid language codes - if
not corrected, these respondents will not have a specified language, so the survey's default language will be used for them
• Warning: One or more columns in the file contains more characters than the matching field allows - if not corrected, the content will be truncated to the number of characters allowed (see below)
• Warning: The file contains one or more duplicates, i.e. respondents with identical values in the key fields - only one of these respondents will be imported
© Artisan Global Media
Manual 109
The error message about unmatched key fields must be corrected by clicking the Match fields for import button, before you can click the Next button and proceed. The key fields make a respondent unique, i.e. two respondents cannot have identical values in these fields. See the section Matching Fields for Import below, for information on how to match the fields.
The warnings inform you about things that should be corrected before proceeding. However, it is possible to ignore the warnings and proceed by clicking the Next button.
Regarding the number of characters allowed, the fields have the following limitations on the number of characters they may contain:
• 16 characters - Zip code• 64 characters - User name, Password, Phone number and Cell
phone number• 128 characters - E-mail address, City, Country and Domain• 255 characters - First name, Last name, Organisation and Street
address
If the content of a field in the import file is too long, the value will be truncated to the number of characters allowed.
In the column to the far left, the icon is displayed next to the respondents who have invalid values. The icon is also displayed next to the invalid value. Next to respondents who are duplicates, and for that reason will not be imported, the icon is displayed. By clicking the icon in the heading of the far left column, you can filter the list and display only the respondents who need to be corrected. Select among these options:
• Show valid• Show invalid• Show duplicates
To edit an invalid value, you click on the respondent's row. The icon is then displayed in all fields. Click the icon in the field you want to edit, and enter the new value. To exclude a respondent who you do not want to import,
click the respondent's row and then the icon in the column to the far left. The respondent is then displayed in grey strikethrough text. You can include
the respondent again by clicking the icon.
Before you click Next, you also select if the respondents should be added as survey-specific respondents, or not. If you mark the check box Add as survey-specific respondents, the respondents will not be saved in the general respondent database, but only as respondents on this survey. Thus, they will only be accessible for those who have the right to administer the survey.
Click the Next button to proceed to the last step: Import respondents. If you use organisations, and if you have chosen that the respondents will be added to the general respondent database, there will be an extra step in the wizard where you decide which organisations are to have access to the respondents, see the section Organisation Access below.
© Artisan Global Media

Manual 110
Matching Fields for Import
If necessary, you can click on the Match fields for import button to make sure that the columns in the file are matched with the corresponding fields in the program. If the columns in the import file have exactly the same name as the corresponding fields in the program, a correct matching will be made automatically. For example, a column with the heading E-mail address will be matched with the field E-mail address, while a column with the heading Email will not be automatically matched.
Under Column names (from file) the column headers from the import file are displayed, together with the field in the program which the column currently is matched with. The letter C in the left part of the field indicates that the field is a respondent category, while respondent properties is symbolized by the letter P. Certain fields have a key symbol. These are the key fields, which means that two respondents cannot have identical values in all these fields. The key fields must always be matched with a column in the file, before the import can be completed.
If a field is matched with the wrong column heading, you do like this to achieve a correct matching:
1. Hover the mouse over the field you wish to move, the cursor then turns into a move cursor.
2. Drag the field to the correct column heading, and drop it there. The field that was previously matched with the column, is replaced and moved to the column Available fields for matching. This column displays all fields which are currently not matched with a column in the import file.
To easily discover any not matched columns, you can mark the check box Hide matched columns.
Confirm the matching by clicking OK.
Organisation Access
This step is available only if you have created organisations under Administration > Organisations, and if you have chosen that the respondents will be added to the general respondent database. Then you can here decide which organisations are to have access to the respondents, by marking the check box next to the desired organisations. The organisation you belong to (or, if you belong to several organisations, the one which is selected in the organisation drop down list) is already marked. To be able to give an organisation access to respondents, you must belong to this organisation yourself.
If you have a hierarchical structure of organisations, any parent organisations to selected organisations will automatically be selected. The symbol to the right of an organisation indicates that the organisation has access to the respondents, while organisations without access have the symbol.
Importing Respondents
In the final step in the wizard it is time to import the respondents.
In the list of respondents, make sure the check boxes are marked next to the respondents you wish to connect to the survey. By marking/unmarking the check box in the title row you mark/unmark all the respondents' check boxes at once.
© Artisan Global Media

Manual 111
If you have chosen that the respondents should be added to the general respondent database, i.e. you left the check box Add as survey-specific
respondents unmarked in the previous step, the icon next to a respondent indicates that there is a respondent in the database whose details in the key fields are identical. If you continue the import of this respondent, the existing respondent's details will be updated, using the data from the import file. Only fields which are matched to a column in the import file will be updated. A respondent's log-in details (username and password) will not be updated if the person is connected to an active survey, or if he or she was imported via LDAP (using the SR-LDAP plug-in).
Click the Add button. The respondents are now connected to the survey and can be found in the respondent list.
If you want to you can let the program make a random selection from the
respondents in the import file. Click the button next to the Add button, and select one of the options that results in a random selection. See the section Random selection of respondents under Add respondents > From the respondent database for more information.
Via LDAPThis option requires the SR-LDAP plug-in. The plug-in makes it possible to import respondents via a directory service. For the import to work, the necessary settings must have been chosen under Administration > LDAP. Please refer to this section for information on how this is done.
After you have set up an LDAP source, do the following to import respondents via LDAP:
1. Select an LDAP source in the drop down list at the top of the page.2. Under the heading Search, you find one or more search fields.
Which search fields are available, and which attributes in the directory service you can search for, is decided under Administration > LDAP. Enter a search argument. Use the * character as a wildcard. Click the Search button.
3. The users matching your search are listed. The users have one of the following symbols:
(is not yet in the respondent database)
(is already in the respondent database)4. Mark the check box next to the respondent or respondents you wish
to connect to the survey. By marking/unmarking the check box in the title row, you mark/unmark all the respondents' check boxes at once.
5. Click on Import selected respondents. The respondents are now connected to the survey and can be found in the respondent list.
If you have created organisations under Administration > Organisations, the pop-up window Organisation Access opens when you click Import selected respondents. There you can decide which organisations are to have access to the respondents, by marking the check box next to the desired organisations. The organisation you belong to (or, if you belong to several organisations, the one which is selected in the organisation drop down list) is already marked. To be able to give an organisation access to respondents, you must belong to this organisation yourself.
© Artisan Global Media

Manual 112
If you have a hierarchical structure of organisations, any parent organisations to selected organisations will automatically be selected. The symbol to the right of an organisation indicates that the organisation has access to the respondents, while organisations without access have the symbol.
Editing Respondents
When you click the icon to the right of the respondent's row in the respondent list, a pop-up window opens where you can edit the respondent's personal data. In the pop-up window, you also find the tab Survey where you can see which surveys the respondent is connected to, and the tab Message History where you find a list of all the e-mails that have been sent to the respondent.
Under the heading Respondent details you can edit the following personal data:
• ID - is assigned automatically by the program • Display name - will automatically be Last name, First name • First name • Last name • Organisation • E-mail address • Street address • Zip code • City• Country • Phone number • Cell phone number • LDAP address - whether or not a respondent was imported via
LDAP. Only available with the SR-LDAP plug-in.• Language - choose between all active respondent languages• Respondent type - select Respondent or Survey reader. A Survey
reader cannot answer a survey but receives information about them via a mailing list.
• Owner (if the function has been activated under Administration > Settings > Survey > General settings) - which program user is responsible for the respondent. If the check box The respondent is hidden has been marked, only the owner and administrators can see the respondent.
The system's general respondent categories, and the survey-specific respondent categories that are connected to the survey, are displayed and can be edited under Categories. Respondent categories are used to enter known background facts about respondents and can then be used in the Reports section for doing cross tabulations and filtering data.
For each respondent category, you can select the desired subcategory in a selection list. If the respondent category has subcategories in several levels, a plus sign is displayed under the selection list, with a dotted line starting from the bottom of the selection list.
© Artisan Global Media

Manual 113
Click on the plus sign to display a selection list where you select the subcategory on the next level:
Displayed below is a respondent category without subcategories in several levels, but where it is possible to select several subcategories on the same level. The plus sign has then a dotted line starting from the short side of the selection list:
Click on the plus sign to display a selection list where you make an additional selection on the same level:
Click on the button to remove a selected option.
The Respondent properties can be found under the Properties heading. Respondent properties are text fields that let you add information above and beyond the personal data contained in the Respondent Information.
The log-in details, ie. the username and password that the respondent uses to log in to the survey, can be changed. See Managing log-ins below.
Managing Log-ins When editing an existing respondent, or adding a new one, you can click on Manage log-in under the Log-in details heading to specify a username and password for him or her. If you skip this step, the respondent will be assigned a standardized username and password generated by the program.
Next to the Username fields are two buttons. Click on if you want the program to auto-generate a username. If you have entered a username
manually, click on in order to validate it, i.e. ascertain that it is not used by another user/respondent. The Password field also provides two
buttons. Click on to auto-generate a password or enter your own password in the field
© Artisan Global Media

Manual 114
provided. The button displays the password using normal characters, which is useful if you do not want to distribute the log-in details via an automated e-mail from the program.
The Domain field is available for those who have the SR-LDAP plug-in. Then, this field is filled out automatically when a respondent is imported via LDAP.
Survey-specific Log-insWhen respondents are added or imported into the program, they get a private username and password. These log-in details are either determined by the person adding them to the system or auto-generated by the program. The respondents then use the details to log in to the surveys that they are connected to.
It is possible specify, for individual surveys, that respondents are to use a survey-specific log-in instead of their usual log-in.
An example: A teacher is conducting a survey at a school. The survey is distributed via a letter that is handed out to all the students and that contains the survey address, a username and a password. In order to simplify the log-in process and avoid difficult usernames and passwords, the teacher decides to use survey-specific log-ins with usernames such as Student1, Student2, Student3, etc. and a common password for all the log-ins.
Select Yes under Apply if you want to use survey-specific log-ins for your survey.
Settings for UsernamesStart by selecting the Type of usernames to be generated: Random or Serial.
If you choose Random, the program will generate a username for each respondent with the Number of characters you have specified. The length of the username must be between 4 and 64 characters. At Characters you determine whether the username is to consist of only letters, only numbers, or both letters and numbers.
If, instead, you choose Serial, you need to specify a Pattern for how the usernames are to be created. The serial number (1, 2, 3 etc.) can be combined with a prefix and/or a suffix that you enter in the fields before and/or after [n], which symbolizes the serial number. In the example above, the word Student would be written in the field to the left of [n] - thus resulting in usernames such as Student1, Student2, Student3 etc.
Settings for PasswordsYou select whether the passwords are to be generated at Random or if they should be Fixed (eg. the same password is used for all respondents).
If you choose Random, the program will generate a unique password for each respondent and it will contain the Number of characters you have specified. The password length must be between 4 and 64 characters. Characters lets you determine whether the password is to consist of only letters, only numbers, or both letters and numbers.
If you want all your respondents to use the same password, you select Fixed, and enter the password of your choice at Fixed password.
© Artisan Global Media

Manual 115
Mailings
Sending E-mails You can inform the respondents about a survey being available by sending out an e-mail from the program. In the message you can provide a direct link to the survey.
Several different types of mailings are available, for instance first mailings, reminders and "thank you" notes. If your survey is multilingual, you can send out the information in all the languages used for the survey.
The Send e-mail interface is divided into three tabs. The List tab, see below, gives you the status of existing mailings. When you create a new message or edit an existing one you are transferred to the next tab (the name of which varies depending on which mode you are in). See the section on Editing mailings for information on how new mailings are created and edited here. Under the third tab, Incoming E-mails, you find the incoming e-mails, related to the mailings of this survey. On one hand any reply messages sent by respondents clicking Reply, on the other hand messages saying that the e-mail was undeliverable.
Creating New Mailings Click the New e-mail button at the bottom of the List page.
Choose from the following types:
• First mailing - The mailing will be sent to all respondents. If you add more respondents after sending this, they will receive the message automatically.
• Reminder - The mailing will be sent to all respondents who have not yet submitted the survey. Only available for respondent surveys.
• All respondents - The mailing will be sent to all respondents.
• Respondents who have submitted the survey - The mailing will be sent to all respondents that so far have submitted the survey. Can for instance be used for a "Thank you" message. Only available for respondent surveys.
• Specific respondents - The mailing will be sent to the respondents you have marked in the respondent list.
• Respondents with a survey in progress - The mailing will be sent to the respondents that, at the time for the mailing, have saved the survey but not yet submitted it. The mailing can be used as a reminder to finish and submit the survey. Only available for respondent surveys.
Select the appropriate settings for the new mailing and create a message. See the section on Editing mailings for more information.
© Artisan Global Media

Manual 116
List The List page gives you an overview of all the e-mails that have been created for the survey. The list contains the following information and headings:
• Status
Not sent - the send-out date is later than the current date
Not sent - the mailing is based on a mailing schedule, and has not been confirmed
Sent - the mailing was successfully sent to all recipients
Send date missing - a send date has not been specified
Error - at least one recipient has not received the e-mail
Error - no recipient has received the e-mail
• E-mail type - First mailing, Reminder, Respondents who have submitted the survey, Specific respondents, Respondents with a survey in progress or All respondents.
• Date - the date when the message was or will be sent. For messages that have already been sent, the exact time of the send-out is displayed.
• Subject - the text in the message subject line
• Error - the number of respondents who did not receive the message when it was sent
• Pending - the number of respondents who are waiting for the message to be sent
• Sent - the number of respondents that successfully received the message
• Details - click on for more information about the e-mail, see below.
There are also buttons for pausing and copying the mailing, see below.
Click on the Refresh button to see the changes that have occurred since you opened the page.
Viewing Mailing Details
Click the button under Details if you wish to view more detailed information about a mailing. The respondents (recipients) are listed here with their status (see the List section above), ID and name. If a mailing has already been sent, the e-mail address it was sent to is displayed, as well as when the respondent received it. You can arrange the list in various ways by clicking the different column headings. Click on Refresh to see the changes that have occurred since you opened the window. Respondents who did not
© Artisan Global Media
Manual 117
receive the mailing when it was sent out are displayed in red. See Resending messages below for information on how to correct e-mail addresses and resend messages.
Resending Messages
If a message fails to be delivered to one or more respondents, their names will be displayed in red. Click on a respondent's name to correct any errors in the e-mail address, and to resend the message.
In the window that opens you will find a View errors button. Click this to see whether the error occurred due to incorrect e-mail settings, which in this case must be corrected under Administration > E-mails and mailings > E-mail accounts, or spelling mistakes in the respondent's e-mail address.
If there are errors in the e-mail address, click the Edit e-mail button, correct the e-mail address, and click on Resend message. Confirm that you want to resend the message by clicking OK. If you want to save the corrected e-mail address in the respondent's profile, you click OK when you are asked if the e-mail address shall be updated.
If the message has been resent to a respondent, the icon is displayed on the far left of that respondent's row in the information window. Click on the button to expand the field. You can then see one row of information for each attempt to send the message.
Mailing Schedule
If a mailing schedule has been prepared under Administration > E-mails and Mailings > Mailing schedule, the mailings of the schedule will be automatically created when the survey is created. The mailings are displayed under the List tab, but they will not be sent until they are confirmed.
The symbol is displayed under Status as long as a mailing is not confirmed.
Click the button to the right on the row in order to confirm an individual mailing. If you want to confirm several mailings at the same time, you make sure that their check boxes are marked, and click the Confirm messages button.
Pausing and Copying Mailings
Buttons for pausing and copying mailings are placed to the right on each row.
The button is displayed instead of the pause button as long as the mailing is not confirmed, if the mailing is created based on a mailing schedule.
All the different types of mailings can be paused as long as they have not been sent. As long as the mailing is paused it will not be sent, even if the specified send date passes. However, if you enter the edit mode and then click on Save and send, the mailing will be sent even if it has been paused. Mailings that are of the First mailing type can be paused after they have been sent, which means that none of the respondents that are added later will receive it.
© Artisan Global Media

Manual 118
Click on the button to restart the distribution of the mailing.
The copy button is useful if you for instance want to send out several reminders at different times and dates. Do the following to copy a mailing:
1. Click the button in order to pause the mailing. If the mailing you want to copy has not yet been sent, you have to pause it before you are able to copy it. Mailings of the First mailing type always have to be paused if you want to copy them.
2. Click on the icon next to the original message to copy it. An identical copy will then be created.
3. Edit the new mailing by clicking on it, see the section on Editing mailings for more information. Specify a send date or click on Save and send to send it immediately.
If you create a mailing of the First mailing type, all the respondents who are added after the mailing has been sent out will also receive it as soon as they have been connected to the survey. By using the pause and copy functions, you can make sure that all the respondents that are added later receive a different mailing to the one received by the first respondents. This can for instance be useful if you want to provide the new respondents with additional information. You then need to copy and edit the mailing as per the description above. Any respondents that are then added will receive the new mailing, but the respondents who received the original mailing will not.
Removing Mailings
Mark the check box next to the mailing(s) you wish to remove. By marking/unmarking the check box in the title row you mark/unmark all the mailings at once. NB. Only mailings that have not yet been sent out can be removed. Click the Remove button and confirm with OK.
Mailings
Sending E-mails You can inform the respondents about a survey being available by sending out an e-mail from the program. In the message you can provide a direct link to the survey.
Several different types of mailings are available, for instance first mailings, reminders and "thank you" notes. If your survey is multilingual, you can send out the information in all the languages used for the survey.
The Send e-mail interface is divided into three tabs. The List tab, see below, gives you the status of existing mailings. When you create a new message or edit an existing one you are transferred to the next tab (the name of which varies depending on which mode you are in). See the section on Editing mailings for information on how new mailings are created and edited here. Under the third tab, Incoming E-mails, you find the incoming e-mails, related to the mailings of this survey. On one hand any reply messages sent by respondents clicking Reply, on the other hand messages saying that the e-mail was undeliverable.
© Artisan Global Media

Manual 119
Creating New Mailings
Click the New e-mail button at the bottom of the List page.
Choose from the following types:
• First mailing - The mailing will be sent to all respondents. If you add more respondents after sending this, they will receive the message automatically.
• Reminder - The mailing will be sent to all respondents who have not yet submitted the survey. Only available for respondent surveys.
• All respondents - The mailing will be sent to all respondents.
• Respondents who have submitted the survey - The mailing will be sent to all respondents that so far have submitted the survey. Can for instance be used for a "Thank you" message. Only available for respondent surveys.
• Specific respondents - The mailing will be sent to the respondents you have marked in the respondent list.
• Respondents with a survey in progress - The mailing will be sent to the respondents that, at the time for the mailing, have saved the survey but not yet submitted it. The mailing can be used as a reminder to finish and submit the survey. Only available for respondent surveys.
Select the appropriate settings for the new mailing and create a message. See the section on Editing mailings for more information.
List
The List page gives you an overview of all the e-mails that have been created for the survey. The list contains the following information and headings:
• Status
Not sent - the send-out date is later than the current date
Not sent - the mailing is based on a mailing schedule, and has not been confirmed
Sent - the mailing was successfully sent to all recipients
Send date missing - a send date has not been specified
Error - at least one recipient has not received the e-mail
Error - no recipient has received the e-mail
• E-mail type - First mailing, Reminder, Respondents who have submitted the survey, Specific respondents, Respondents with a survey in progress or All respondents.
© Artisan Global Media

Manual 120
• Date - the date when the message was or will be sent. For messages that have already been sent, the exact time of the send-out is displayed.
• Subject - the text in the message subject line
• Error - the number of respondents who did not receive the message when it was sent
• Pending - the number of respondents who are waiting for the message to be sent
• Sent - the number of respondents that successfully received the message
• Details - click on for more information about the e-mail, see below.
There are also buttons for pausing and copying the mailing, see below.
Click on the Refresh button to see the changes that have occurred since you opened the page.
Viewing Mailing Details
Click the button under Details if you wish to view more detailed information about a mailing. The Respondents (recipients) are listed here with their status (see the List section above), ID and Name. If a mailing has already been sent, the e-mail address it was sent to is displayed, as well as when the respondent received it. You can arrange the list in various ways by clicking the different column headings. Click on Refresh to see the changes that have occurred since you opened the window. Respondents who did not receive the mailing when it was sent out are displayed in red. See Resending messages below for information on how to correct e-mail addresses and resend messages.
Resending Messages
If a message fails to be delivered to one or more respondents, their names will be displayed in red. Click on a respondent's name to correct any errors in the e-mail address, and to resend the message.
In the window that opens you will find a View errors button. Click this to see whether the error occurred due to incorrect e-mail settings, which in this case must be corrected under Administration > E-mails and mailings > E-mail accounts, or spelling mistakes in the respondent's e-mail address.
If there are errors in the e-mail address, click the Edit e-mail button, correct the e-mail address, and click on Resend message. Confirm that you want to resend the message by clicking OK. If you want to save the corrected e-mail address in the respondent's profile, you click OK when you are asked if the e-mail address shall be updated.
If the message has been resent to a respondent, the icon is displayed on the far left of that respondent's row in the information window. Click on the button to expand the field. You can then see one row of information for each attempt to send the message.
© Artisan Global Media

Manual 121
Mailing Schedule
If a mailing schedule has been prepared under Administration > E-mails and Mailings > Mailing schedule, the mailings of the schedule will be automatically created when the survey is created. The mailings are displayed under the List tab, but they will not be sent until they are confirmed.
The symbol is displayed under Status, ss long as a mailing is not confirmed.
Click the button to the right on the row in order to confirm an individual mailing. If you want to confirm several mailings at the same time, you make sure that their check boxes are marked, and click the Confirm messages button.
Pausing and Copying Mailings
There are buttons for pausing and copying mailings on each row in the list of mailings.
The button is displayed instead of the pause button as long as the mailing is not confirmed, if the mailing is created based on a mailing schedule.
All the different types of mailings can be paused as long as they have not been sent. As long as the mailing is paused it will not be sent, even if the specified send date passes. However, if you enter the edit mode and then click on Save and send, the mailing will be sent even if it has been paused. Mailings that are of the First mailing type can be paused after they have been sent, which means that none of the respondents that are added later will receive it.
Click on the button in order to restart the distribution of the mailing.
The copy button is useful if you for instance want to send out several reminders at different times and dates. Do the following to copy a mailing:
1. Click the button in order to pause the mailing you want to copy, if it has not yet been sent. Otherwise you are not able to copy it. Mailings of the First mailing type always have to be paused if you want to copy them.
2. Click on the icon next to the original message to copy it. An identical copy will then be created.
3. Edit the new mailing by clicking on it, see the section on Editing mailings for more information. Specify a send date or click on Save and send to send it immediately.
If you create a mailing of the First mailing type, all the respondents who are added after the mailing has been sent out will also receive it as soon as they have been connected to the survey. By using the pause and copy functions, you can make sure that all the respondents that are added later receive a different mailing to the one received by the first respondents. This can for
© Artisan Global Media

Manual 122
instance be useful if you want to provide the new respondents with additional information. You then need to copy and edit the mailing as per the description above. Any respondents that are then added will receive the new mailing, but the respondents who received the original mailing will not.
Removing Mailings
Mark the check box next to the mailing(s) you wish to remove. By marking/unmarking the check box in the title row you mark/unmark all the mailings at once. NB. Only mailings that have not yet been sent out can be removed. Click the Remove button and confirm with OK.
Editing MailingsIn this section you edit new and existing mailings before you save them. To create a new mailing, click the New e-mail button on the List page.
Settings for Mailings
Mailing type - choose one of the following:
• First mailing - The e-mail will be sent to all respondents. If you add more respondents after sending this, they will receive the mailing automatically.
• Reminder - The e-mail will be sent to all respondents who have not yet submitted the survey. Only available for respondent surveys.
• All respondents - The e-mail will be sent to all respondents.
• Respondents who have submitted the survey - The e-mail will be sent to all the respondents that have submitted the survey. It can for instance be used for a "Thank you" message. Only available for respondent surveys.
• Specific respondents - The e-mail will be sent to all the respondents you have marked in the respondent list.
• Respondents with a survey in progress - The e-mail will be sent to the respondents who at the time for the mailing, have started to answer a survey and saved but not yet submitted it.
Send to
For mailings of the type Specific respondents:
1. Click the icon in order to search among available recipients.
2. Mark the intended respondents.
3. Click the button Add selected in order to move the marked respondents to the list of selected recipients.
For other mailings:
1. Choose who is to receive the mailing; Respondents and/or Survey Readers. Readers cannot answer surveys, they only receive information about them.
© Artisan Global Media
Manual 123
E-mail account - You need to add at least one e-mail account under Administration > E-mails and mailings > E-mail accounts to be able to send out mailings. If several accounts have been added, you need to select which account to use for the current mailing.
Sender information - Select which sender name, sender address and reply address you wish to use for the mailing. If you select Standard, the details specified in the e-mail account settings will be used. If you select Custom, you can use a different sender name, sender address and reply address for this particular mailing.
NB! If you use a sender address that is different from the one specified as the Sender Address in the e-mail account settings, the program cannot receive messages about undeliverable mailings. It will thus not provide you with error messages for the mailings that have not reached all their intended recipients.
The reply address is the address to which any reply e-mails are sent, when the respondent click Reply. If you use a reply address that is different from the one specified as the Reply Address in the e-mail account, any reply e-mails will not be displayed under the Incoming e-mails tab.
Send date - Specify the date and time when the mailing is to be sent out. The date can be selected in the calendar, or entered manually using the keyboard. When using the English version of the program, dates are typed in using a DD-MM-YYYY format. Exact times can also be entered, either manually using the keyboard or by clicking the arrows in the time fields. If no other time is specified, the mailing will be sent at 00:00. After specifying a time, click on Save. NB! If you click on Save and send, the mailing will be sent out immediately, regardless of which date and time you have specified.
Sent date - when a mailing has been sent, the date and time are specified here. Until then, the Not sent text is displayed.
Creating E-mails
Language - if your survey is multilingual, you first need to select one of the languages you specified for the survey in its Basic information. After selecting a language, you use the bottom part of the window to edit the e-mail that is to be sent to the respondents whose details specify this as their selected language. See Mailings for multilingual surveys below for more information.
Subject - Enter the information you want to have in the message subject line.
Attached files
• Click the button if you wish to attach a file in y our message. You can now retrieve the file from the library. See the Image and document library section for more information on how to upload and attach files.
• Click on in order to remove an attached file.
© Artisan Global Media
Manual 124
Message - The actual message is created in an editor that lets you combine text that you write yourself with dynamic data that is retrieved from the current survey or respondent. If a template has been created under Administration > E-mails and mailings > E-mail templates > E-mail, you can use the template as a basis, and edit it to suit the current survey.
The following survey data can be inserted:
• Survey URL - a link to a public survey or to the log-in page for a respondent survey
• Survey name
• Survey start date and Survey end date - the publication period of the survey
The following respondent data can be inserted:
• Survey URL incl. log-in - a link to the respondent survey that provides an automatic personal log-in to the survey.
• First name and Last name - makes the message more personal
• Username and Password - allow the respondent to sign in via the survey's log-in page
• E-mail - the respondent's e-mail address
• Unregister URL - makes it possible for the respondent to unregister from the survey, by clicking a link in the message
• Respondent properties
• Respondent categories (only categories connected to the survey)
The inserted dynamic data is displayed as image icons in the editor. Both the inserted data and the text you have written yourself can be highlighted and formatted with the formatting buttons of the editor. There are also buttons for inserting images and links.
Instead of inserting the link by clicking Survey URL incl. log-in, you can let a word from the text work as link text. If you, for instance, would like to write: “Click here to answer the survey”, do the following to use the word “here” as link text:
1. Mark the word “here”.
2. Click the icon in order to open the link manager.
3. Write *url* in the Url field. If you want the link to transfer you to a log-in page without the automatic log-in, you write *urlnologin* instead.
4. Click OK.
© Artisan Global Media

Manual 125
Saving and sending mailings
When you have finished the message, click one of the Save buttons at the bottom of the page. Click on Save to save your changes and confirm that the mailing is to be sent at the time specified at Send date. Use the Save and send now button if you want to send the mailing immediately. The point in time displayed next to Send date changes to the current time.
Mailings for Multilingual Surveys
If your survey is multilingual, you can create different versions of the message in all the languages you selected in the Basic information of the survey. For each language, you can create a message with a language-specific subject line, message text and attachments. If the details of a respondent call for a language that is not used in the survey, or if no message is created for this language, he or she will receive message in the Default language of the survey.
To create a language-specific message, select a Language in the drop down list, write a subject line and a message text, and attach any files you wish. See Creating e-mails above for more information about this.
If you then want to create a new version of the message in another language, you can use the buttons: Translate subject and Translate body. When you press one of the buttons a window will appear and provide you with a translation interface. In the left half of the window, you select the language you want to translate from (source language), and in the right half you specify the language you want to translate to.
Quick help when translating is provided by the button which gives you an automatic translation of the text. It can be found between the two language fields (it then translates the entire text) as well as on each row (it then translates the text on that row). Since the translation is automated, it is advisable that you check that the proposed translation is accurate. Also, for the translation to work, a connection to a translation service must be set up. Please refer to the Languages and translations section for more information on this.
Save the translation by clicking OK.
Previewing Messages
Click the Preview button to see the message exactly as it will appear to the respondent. If any kind of dynamic respondent data, for instance a First name, has been inserted, the preview will show you an example with one respondent's data. Each respondent will of course see their own personal data.
Removing Mailings
Click on the Remove button and confirm by clicking OK. Mailings can only be removed if they have not yet been sent. You can also remove mailings via the List page. Read more in the section about the List page.
© Artisan Global Media

Manual 126
Incoming E-mailsUnder this tab you find any incoming e-mails, related to the mailings of this survey. Two types of e-mails are displayed here:
• Reply e-mails sent by respondents clicking Reply. These e-mails are not shown here if the reply address of the mailing has been changed, nor if the respondent has deleted the reference code which is generated at the bottom of the message when the respondent clicks Reply.
• Messages saying that the e-mail was undeliverable. To show these e-mails, you mark the check box Display bounced e-mails. These e-mails are not shown here if the sender address of the mailing has been changed.
Next to the tab name Incoming E-mails, you see the number of e-mails, within brackets. The symbol indicates that there are new incoming e-mails. The symbol disappears as soon as a user has visited the tab.
The e-mails are listed under these headings:
• Original message: Subject and e-mail type of the original e-mail related to the incoming e-mail
• Original receiver: Recipient of the original e-mail. This column is displayed only if you have chosen to display bounced e-mails.
• From: Sender of the incoming e-mail• Subject: Subject of the incoming e-mail• Received date: Date and time when the incoming e-mail was
received
The symbol in the far right column indicates that it is a message saying that the e-mail was undeliverable.
Sort the list according to different criteria by clicking the column heading of your choice.
Click an e-mail to read it. When you have opened an e-mail, you can use the Back and Next buttons to go to the previous or next e-mail.
Paper MailIf some respondents do not have an e-mail address, but are still expected to answer the survey over the Internet, you can send them information via regular paper mail.
ListsThe List tab gives you a list of all the respondents that are connected to the survey. Mark the check box next to the respondent(s) you wish to print letters to. By marking/unmarking the check box in the header row you mark/unmark all the respondents' check boxes at once.
Then, click on Create PDF. A PDF file containing one letter for each respondent you selected in the list is then created. The contents of the letter is determined under Edit mailing, please see this section for more information. The top of the letter page displays the respondent's name and address, provided that this is specified in the respondent details.
Open the PDF in the appropriate application and print it.
© Artisan Global Media

Manual 127
Editing MailingsThe content of the letter is created in an editor where you combine text you type in yourself with data retrieved from the current survey and/or respondent. If a template has been created under Administration > E-mails and mailings > Templates > Paper mail, you can use the template content as your basis, and edit parts of it if necessary. If your survey is multilingual, you create one letter text for each language. Start by selecting a language in the drop down list.
The following survey data can be inserted:
• Survey URL - a link to a public survey or to the log-in page for a respondent survey
• Survey name • Survey start date and Survey end date - the survey's publication
period
The following respondent data can be inserted:
• Survey URL incl. log-in - a link to the respondent survey that provides an automatic personal log-in to the survey.
• First name and Last name - to make the message more personal. • Username and Password - to allow the respondent to sign in via the
survey's log-in page. • E-mail - the respondent's e-mail address.
In the editor, the dynamic data is symbolized by image icons. Both the dynamic data and the text you have written yourself can be highlighted and formatted with the editor formatting buttons. The editor also has buttons for inserting images and links.
Paper Survey Sometimes it can be difficult for a respondent to fill out the survey online, for instance if he or she has no computer or e-mail address. It could also be the case that you would like to conduct a survey at a meeting in a conference room without computers. In such cases the Paper survey function, which is a part of the plug-in SR-Advanced Survey, is highly useful. You connect the respondents to the survey as per usual, but you then print the survey and let them fill it out on paper. The completed papers are scanned and converted into a PDF file which is then analyzed by the program, and the responses are thus registered.
The Paper survey function can also be used for public surveys. You then just specify the number of paper surveys you want to print.
When you create your survey, please note that only questions with set answer options can be interpreted by the program when scanning a paper survey. Other question types will be scanned as images and the actual answers then need to be registered manually in the program.
The work on Paper surveys is carried out in three steps on the Setup, Create and Import pages. The last two tabs are available only after you confirm the settings on the Setup page.
© Artisan Global Media

Manual 128
Setup Before you print your paper surveys, you need to make some settings under the tab Setup. Among other things, you specify the font and font size for the text in the survey, as well as what types of questions are to be included. Since the program must know the exact placement of each question on the paper, these settings cannot be changed after they have been confirmed.
On this page you also edit the instructional text that the respondent needs in order to be able to complete the survey correctly.
DesignSelect the Font and Font size you want to use for the question titles and answer options. In the paper survey, all question titles will be in bold.
At Render, you decide if any images in the survey are to be included:
• Text only: images are not included• HTML: images are included• Images as alt text: the alt texts of the images are shown instead of
the images (see Administration > File Manager for information on how the alt text can be edited when an image is inserted)
When a question is edited, so-called Extra information sections can be used to give information adjacent to the question (see Survey > Survey Construction > Questions > Edit question > Design for more information). Mark the check box Question design blocks if you want this content to be included in the paper survey.
SettingsUpon scanning the surveys, the program interprets and registers all the answers provided to questions with set answer options. If you activate the function Include all question types. (The question types that are possible to be analyzed automatically, eg.that have set answer options, are always included.), text areas will be created in the paper survey for respondents to be able to answer text, date and numeric questions. However, the answers provided to these questions cannot be interpreted by the program and must be registered manually. If you activate this setting, you can also decide if these text areas are to have character boxes (mark the check box Draw character boxes for text inputs), and the height of the text areas (enter number of rows at Multiline rows).
Mark the check box Draw question separator line, if you want a dashed line to be inserted between the questions when the survey is printed.
When the paper surveys are printed, each respondent's survey will as default start with a cover page (or several pages, if the content does not fit in one page). The cover page has the respondent's name and address at the top, followed by the survey's introductory text, and instructions for how to complete the paper survey (see below). If you do not want to print the cover page, you mark the check box Skip cover page.
To make the survey fit in fewer pages, you can try to unmark the check box Page break after instruction text. Then the first survey question will be placed directly after the instruction text on the cover page.
Under the Import tab, the scanned paper surveys are uploaded and analyzed. By marking the check box Delete all uploaded PDF files on survey
© Artisan Global Media
Manual 129
close, you make sure that the files which are uploaded to the survey do not occupy space on the survey when they are no longer needed (after the survey is closed).
At the top of each page in the paper survey, there is a barcode. The barcode contains information about which survey and respondent the page belongs to, the page's number, and the survey's language. If you want to, you can let the program render certain information in plain text under the barcode, to make it easier to identify for example which respondent a page belongs to. At Barcode text, you can choose among these options:
• None: no text is rendered• Respondent name: the respondent's first name and last name• Tag: the bar code transformed to a code with numbers and letters• Custom: choose which information to be rendered (see below)
If you select Custom, you design the text in the field below. Click the button to the right of the field to get access to buttons for inserting Tag, First name, Last name and Organisation, and drop down lists for inserting any respondent categories connected to the survey and any respondent properties which have been created in the program.
Matrix SettingsIf the survey contains at least one matrix question, you find the button Matrix settings... at the bottom of the page. Matrix questions consist of two "columns", one for the title of the subquestion and one for its answer options. By clicking the Matrix settings... button, you can decide the width (in percent) for the column with the subquestion title. If you, for instance, specify that the question title is to take up 30% of the survey width, the column with the answer options will take up 70%. This way you can ensure a suitable division, and avoid unnecessary line breaks.
Specific Instructions for Paper Surveys Here you create an informational text that explains to the respondents how the paper survey is to be completed. This text will be presented directly after the survey's regular introductory text when printed. The page provides you with a template that is created in the administration, but you can edit the text so that it suits your particular survey. If your survey is multilingual, you create one instructional text for each language. Start by selecting a language in the drop down list.
The most important information in the instructions concerns how the answer options need to be marked in the check boxes. The following applies:
The answer option has been marked correctly
The answer option has been marked incorrectly, the cross must be in the middle of the box
The answer option has been marked incorrectly, the cross is too thick
Canceled, the answer option will not be counted as being marked
© Artisan Global Media
Manual 130
In the editor, you can also insert data that is retrieved from the current survey and respondent. You can for example insert the survey's URL and the respondent's username and password, to make it possible for the respondent to answer the survey online instead.
The following survey data can be inserted:
• Survey URL - a link to a public survey or to the log-in page for a respondent survey
• Survey name • Survey start date and Survey end date - the survey's publication
period
The following respondent data can be inserted:
• First name and Last name - to make the message more personal.• Organisation• Username and Password - to allow the respondent to sign in via the
survey's log-in page.• Survey URL incl. log-in - a link to the respondent survey that
provides an automatic personal log-in to the survey.• Respondent properties• Respondent categories (only categories connected to the survey)
Confirming Your Changes While working you can save your changes by pressing Save. When you are finished, click the Preview button to see how the survey will appear to the respondents before you confirm the settings. Then click Confirm. A message will appear stating that it will not be possible to change the settings after you have confirmed. Nor will it be possible to edit the survey questions. Click on OK to continue.
Two pages, Create and Import, now appear and you can continue working with the paper survey on them. If you click the Prepare tab, you will still have access to and be able to edit the instructional text but the other settings can no longer be changed.
Create
Creating PDF FilesOn the Create page, all the respondents that are connected to the survey are listed. Here you can print the survey for those respondents who are to answer it on paper. Mark the check box next to those respondents, or mark the check box in the header row to select all. The check box next to respondents who have already answered is not possible to mark.
If it is a public survey, there are no respondents connected to it. Instead you just specify the number of paper surveys to print.
Then click on Create PDF. A PDF file with the selected respondents' surveys, or the specified number of surveys if it is a public survey, is created. The first page displays a list of all those respondents, and this is followed by one set of pages for each respondent. The first page (or pages, if required) is a cover page which contains the respondent's name, the name of the survey and an introductory text, as well as instructions on how to fill out the paper survey. This is then followed by a number of pages containing the actual
© Artisan Global Media

Manual 131
survey questions. Note that you, in the Setup tab, can decide that the cover page is not to be printed, and that the first survey question will be placed directly after the instruction text on the cover page.
At the top of each survey page there is a bar code containing information about the survey, respondent, page number and language. Only questions with set answer options will be analyzed automatically when you scan the paper survey. In the print survey, these types of questions will be presented with a check box for each answer. Respondents select answer options by drawing crosses in the boxes. If they wish to change their answer later, they need to fill in the whole box. This is then interpreted as that option not being selected.
If the setting Include all question types. (The question types that are possible to scan, eg. have set answer options, are always included.) has been selected on the Setup page, other types of questions will also be available for answering in the paper survey. These types of questions will be scanned and saved as images and must then be registered in the survey manually.
Printing Surveys Open the PDF file in an appropriate program, for instance Adobe Reader, and print it. Black and white laser print is recommended.
Import
Scanning Surveys When the respondents have filled out the survey you need to scan the papers and save the scanned images as a PDF file. The recommended scanner settings are 300 dpi and black and white.
When you are scanning the papers, it does not matter what order the pages are in, as each page contains a bar code with information on the respondent and page number. Nor does it matter if the paper is turned with the header in the wrong direction in the scanner. The program will then turn the image when analyzing it.
Importing Surveys The Import page provides you with the Upload file button. Click this and then
the button. Select your PDF file (or files) and click OK. The files are uploaded and listed under Files and are then given the status New. Mark the check boxes next to the files and click on Parse files. In the right part of the window, information on the result of the analysis is displayed, e.g. Valid - Found Page 1, Could not read the barcode, Error parsing questions, please see debug log for more information, etc. If you click the link Debug log, more detailed, technical information is displayed.
When the analysis is complete, the file status will be changed to Parsed, and the respondents that were found are listed under Scanned respondents. If the survey is anonymous, the word Hidden is displayed under Name and E-mail address. In a public survey, the respondents are called Respondent #1, Respondent #2, etc.
© Artisan Global Media

Manual 132
For each respondent, the following status icons are displayed:
View errors
No errors - pending submission
Submitted
The icon, is thus displayed next to the name of those respondents who have submitted a survey where at least one error has been detected. The following are considered errors:
• Compulsory questions have not been answered • The respondent has selected more than one option for a single-
choice question. • One or more pages are missing
Click on the icon to display the errors that have been found.
To correct the errors, click the button on the far right to open the survey. Click on Errors on the top left to display the errors. For each of the scanned pages there is a button (Page 1, Page 2 and so on). Click on a page to see how the scanned page looks, and to see what the respondent has answered. Correct the errors directly in the survey and click the Send button. The
respondent's status will change to .
Respondents who have submitted surveys where no errors have been
detected are given the symbol. You can submit these surveys immediately: Mark the check box next to the respondent's name and click on Send.
If you marked the check box Include all question types. (The question types that are possible to scan, eg. have set answer options, are always included.) when you created the survey, space was left in the paper survey for answering text, date and numeric questions. The answers that the respondent provided to these questions cannot be interpreted by the program, and thus need to be entered manually. This can be done in the
same way as when you correct errors, ie. click on to open the survey, then click on the button for the page where the error is found, for instance Page 1. View the scanned image of the answer and enter the answer in the survey. Click on Send when all answers have been entered.
A quicker way to enter text answers is to use the menu Survey > Data Collection > Text Answers. See this section for more information.
Text AnswersThis menu is available if the survey contains at least one text question which has been answered. You can here edit any inappropriate text answers.
If you have the plug-in SR-Advanced Survey, you can also use this menu to enter text answers given in paper surveys.
In the drop down list at the top of the page, you select the question whose answer you want to edit. You can edit answers given on the question types
© Artisan Global Media

Manual 133
Text Field and Text Memo, and answers given on questions that have blank options (If other, please specify) and comment fields. In the drop down list, the questions are listed with the question title, and below the question title you click Answers if it is a text question or a blank option, or Comments if it is a comment field.
The text answers of the question you selected are listed. To the right of each answer, you find three buttons:
• View answer - A window opens and you can see all the answers from the respondent who has given this particular answer. You can also save the answered survey as a PDF file.
• The respective symbol shows if the answer is verified or not. If you click the grey button, the symbol is changed to the green version. Also, the answer row turns to a green back ground colour. By doing this, you indicate that you have read the answer and verified it.
• Edit Answer Text - In the window that opens, the answer given by the respondent is displayed in the left part, under Original Text. In the right part of the window, under Edited Text, you can edit the answer. When you are done, you click one of the following buttons:
• Save and verify (the symbol will be displayed)
• Save (the symbol will be displayed).
Any text answers given on paper surveys, is listed with a scanned image of
the text area. If you click the button, the image is shown under Original Text, and you can enter the answer under Edited Text.
In the list, answers which have been edited are shown with a yellow background. If you click the answer, the field is expanded and its original text is displayed. Answers which have been verified without being edited, are shown with a green background.
Above the list, you can use three check boxes to filter the list:
• New: Show answers which have neither been edited nor verified• Edited: Show answers which have been edited• Verified: Show answers which have been verified
When you have created a report, you can under Reports > Data Set decide to show the edited text answers, or the original ones. See this section for more information.
Export On this page, you export the raw data (from the survey) for further processing in other programs. NB. There is a difference between this Export function and the Export menu in the Reports section. On that page you export processed data, whereas on this page you export raw data.
Regarding anonymous respondent surveys, the answers are presented in a random order. The answer ID is changed to 0 for all respondents.
© Artisan Global Media

Manual 134
1. Under Export, specify a File type for the export file:
• Excel 97-2003 (.xls)
• Excel 2007 (.xlsx)
• Text (the drop down list lets you choose a field delimiter: tab, comma, semicolon or space.
2. Next, select the Data you want to export:
• Questions and answer options
• Answers
Choose between Answer values and Answers in plain text
• Respondent data
Export of respondent data is possible only for respondent surveys. For anonymous respondent surveys, the only respondent data that can be exported are the respondent categories.
Answers to the question type Open Matrix – Time (only available for those who have the SR-Advanced Survey plug-in) will be exported as number of minutes. If the answer “01:30” has been given, the value in the export file will be “90”.
If you choose to export respondent data, the lists under Respondent details, Respondent properties and Respondent categories give you numerous types of data that can be included in the export file.
Respondent details:
• Respondent ID
• Display name
• First name
• Last name
• Organization
• E-mail address
• Postal address
• Zip code
• Country
• Telephone number
• Cell phone number
• Language
Respondent properties:
All the Respondent properties can be exported.
Respondent categories:
All the Respondent categories that were connected to the survey in its Basic information can be exported.
© Artisan Global Media

Manual 135
Closing Surveys When a sufficient number of responses have been received, it is time to close your survey. In the Basic information it is possible to select for the survey to be closed automatically when the publication period ends. However, if you choose not to activate this setting, you will instead need to close the survey manually via this page.
On this page, information is displayed about the survey and its status under the headings Survey construction, Data collection and Reports. Before you decide whether it is time to close the survey, you may want to study the information under Status - Data Collection.
Information:
• Survey name • Category • Survey type • Theme • Published • Survey URL
Survey construction status:
• Number of questions • Number of pages • Construction is finished - Yes or No
Data collection status:
• Number of respondents • Number of responses • Response rate - displayed as a percentage
Report status:
• Number of reports
If you do want to close the survey, click the Close survey button and confirm your choice by clicking OK.
Linking to public surveysIf you want to publish a link to a public survey on your web site, you should keep in mind that so-called third-party cookies in some cases can prevent the survey from opening. This can happen if the survey is opened as part of a web page, so to avoid this, construct the link so that the survey opens in a new window.
It is possible to let the survey open in the same window, if one of the following criteria are met:
• The public survey has only one page• The survey’s URL has the same domain as the web site
© Artisan Global Media

Manual 136
ReportsWhen the survey is closed you compile the result in a report. The application contains different options for how such a report could look and what function it could have.
ReportA report could contain results from one or several surveys. You build the report of charts, tables and combinations of these (hybrid elements). You can also add explicating text elements.
If you use SR-Advandced Report you have access to a compare data set to facilitate the comparison among the results from different surveys and the totalled result.
Aggregate Report (SR-Advanced Report)Another way to compare results between surveys is to use aggregate reports. By creating an aggregate report you can present the result from several surveys in the same report. The results are shown in a table and could be grouped in the way you want, for instance by survey category, respondent category or time period.
Example: We have two surveys containing the question “What did you think of the course content?” You choose to present the result in an aggregate report that shows the average for the question. The rows in the table show a grouping by respondent category (“Business” and “Economic”), while the columns are grouped by respondent category (“Master” and “Non-master”).
Hierarchy reportA hierarchy report is one more tool for making comparisons among different groupings of respondents. This report filters the data in different levels on respondent category. Selection lists are shown topmost in the finished report, used by the viewer to control the filtering and to change focus from one grouping to another.
For example, you may have analysed a company divided into departments and groups. Using the selection lists in the introduction of the report, the
© Artisan Global Media
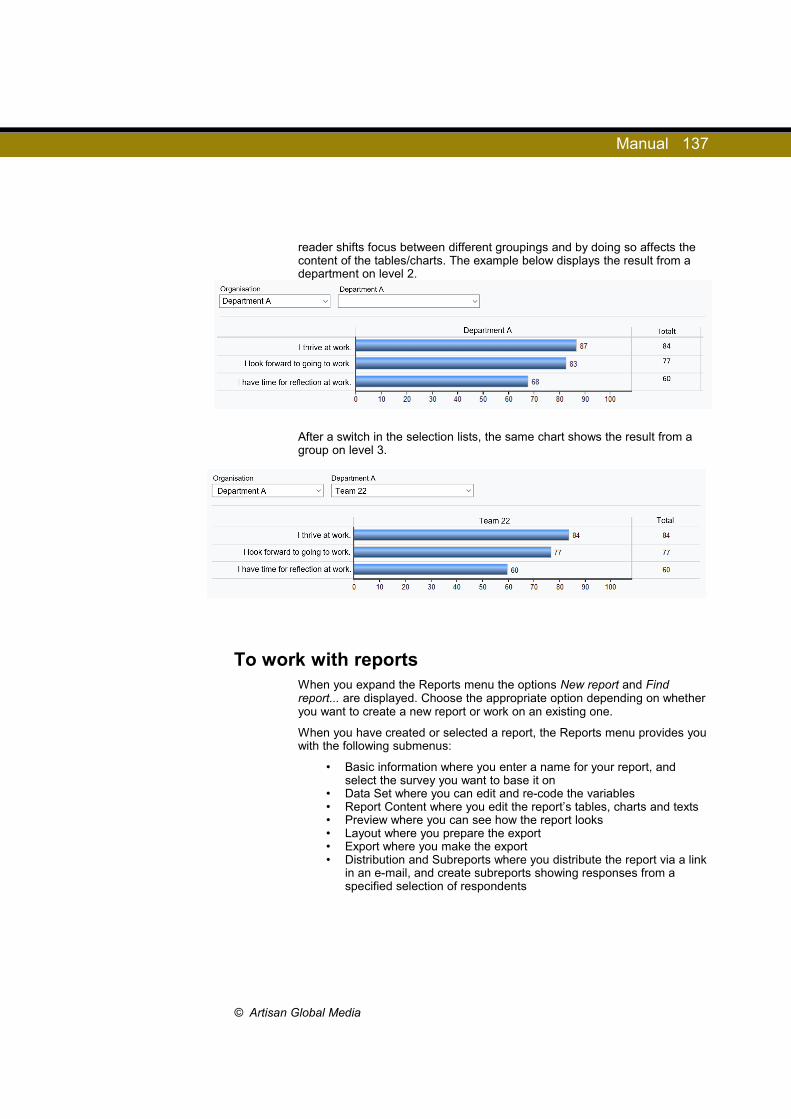
Manual 137
reader shifts focus between different groupings and by doing so affects the content of the tables/charts. The example below displays the result from a department on level 2.
After a switch in the selection lists, the same chart shows the result from a group on level 3.
To work with reportsWhen you expand the Reports menu the options New report and Find report... are displayed. Choose the appropriate option depending on whether you want to create a new report or work on an existing one.
When you have created or selected a report, the Reports menu provides you with the following submenus:
• Basic information where you enter a name for your report, and select the survey you want to base it on
• Data Set where you can edit and re-code the variables• Report Content where you edit the report’s tables, charts and texts• Preview where you can see how the report looks• Layout where you prepare the export• Export where you make the export• Distribution and Subreports where you distribute the report via a link
in an e-mail, and create subreports showing responses from a specified selection of respondents
© Artisan Global Media

Manual 138
New Report The information you enter when creating a new report can later be edited in its Basic information.
1. Under the heading Information, you start by entering a Report name.
2. Choose the Survey you want to base your report on. 3. If the survey you chose is multilingual, select which survey
Language you want to use in the report. 4. By marking the check box Auto-generate report content, the report
is created with tables, charts and texts according to the report template selected below. If you unmark the check box, you can instead generate the report from the Data set menu, which can be useful if you first want to process the variables, or maybe omit a question or two. See Data set for more information.
5. Select the Template you want to use for the report. The report's elements (tables, charts and text) are generated according to the settings in the template.
6. Choose a Theme for the report. The theme determines the look of the report, e.g. in terms of the font format in the tables and colours in the charts.
7. The report will get a link which you can publish under Reports > Distribution and Subreports. The program generates the link address automatically, but if you want to you can customise the last part of the address, by entering the desired text in the field Custom URL.
8. Specify whether or not a header/footer is to be displayed on each page in the report when it is exported. In the drop down lists Header and Footer under the heading Design, you can choose among the templates for headers and footers which have been created under Templates > Report Design. In the drop down list, each template is displayed with an ID to the left, and a preview of its layout. You can also select the option None, if you do not wish to display a header/footer. When you have selected a header or footer, the tab Header/Footer becomes available. Under this tab, you can customise the header/footer you have selected. See this section for more information. If you have customised a header or a footer under the Header/Footer tab, it is displayed in the drop down list with the
symbol * instead of an ID. The symbol indicates that it is a customised header or footer. Note that the program only saves the latest customised header/footer. If you select another header/footer, and customise it, the previous one disappears from the drop down list.
9. Click on Create Report.
© Artisan Global Media

Manual 139
Organisation AccessIf you have created organisations under Administration > Organisations you can under the heading Organisation Access decide which organisations are to have access to the report, by marking the check box next to the desired organisations. This access, you can also assign later under Reports > Basic information. Please refer to this section for more information.
Report ReadersIn the plug-in SR-Advanced Report, a user can be given the user role Report reader. The only part of the program that is accessible for report reader, is the reports. Under Distribution and subreports you connect the report readers who should have access to the report. Already when you create the report, you can also give report readers additional rights concerning the report and the survey it is based on. These rights, you can also assign later under Reports > Basic information. Please refer to this section for more information.
New Aggregate ReportIn SR-Advanced Report, you have the possibility to create so-called Aggregate reports. See this section for more information on how you can use aggregate reports to compare results from several surveys.
1. Click New Aggregate Report in the Reports menu.2. Enter a Report name.3. Choose a Theme for the report. The theme determines the look of
the report, e.g. in terms of the font format and the colours.4. Click the Create report button.
The information you enter when creating a new report can later be edited in its Basic information.
Finding Reports When you click on Find Report..., a pop-up window opens where the 50 newest reports are listed. Click the Search button to list all reports, except for those that are based on archived surveys. Mark the check box at Include surveys from the archive if you want to include those too. The reports are listed using the following headings:
• Report name • Survey (which survey the report is based on) • Survey category • Owner (the user that created the report) • Created (the date when the report was created)
You can click on any of these headings to sort the list: alphabetically, ascending or descending, according to each heading.
If there is a large number of reports, you can use the search field at the top to find a specific report. Enter a search term in the field and click on Search.
© Artisan Global Media

Manual 140
You can use one of the following as your search term: the report name, the survey, survey category or owner.
There is also an advanced search mode that you access by clicking
the button, next to the Search button. In that mode, you can search for report name, survey name (the survey the report is based on), report type (reports or aggregate reports, the latter in SR-Advanced Report), which predefined report (if any) the report is based on, period within which the report was created, survey category, report language and owner (the user that created the report). Make your selections and click the Search button.
Select the report you want to work on by clicking on it.
Properties
InformationHere you can see, and to some extent edit, the information you entered when you created the report. See New Report for information on how to create a report.
The editable items are:
• Report name
• Template - the template used in the report. The report elements (tables, charts and texts) are generated according to the settings in the template. If you change to a new template, the report will be regenerated automatically when you click Save. Note that any changes made in the Report Content menu then will be overwritten.
• Theme - the theme determines the appearance of the report, in terms of font format in the tables, and colours in the charts.
• Custom URL - when the report is created, it gets a link which you can publish under Reports > Distribution and Subreports. The program generates the link address automatically, but if you want to you can customise the last part of the address, by entering the desired text in the field Custom URL.
• Allow filtering of the main report - The Yes option makes it possible for the report reader to analyse the result filtered on how the respondents answered one or several questions in the survey. Also the respondent categories connected to the survey can be used to filter the result.
The icon for filtering will be at the top, in the left corner of the page when the report reader opens the report. After clicking the icon, a window opens where the reader sees the answer alternatives from all questions in the survey, as well as the respondent categories used in the survey. In the window the reader arrange the filter to make the presentation contain respondents that have answered in a certain way and belong to a certain respondent
© Artisan Global Media

Manual 141
category. This gives the reader a great possibility to analyse the material without having the report creator to administrate subreports and such.
In addition, you see information about:
• Which survey the report is based on
• The language(s) used in the report
LimitsEnter how many answers are required in order to display the result of one question. The number you enter will be used as a general setting for the all the charts and tables in the report and can be adjusted for a specific element.
When you group the respondents according a respondent category or depending on how the respondents have answered another question, you are guaranteed from revealing the result from the groups that are too small.
DesignHeader/Footer - specify whether or not a header/footer is to be displayed on each page in the report when it is exported. In the drop down lists Header and Footer under the heading Design, you can choose among the templates for headers and footers which have been created under Templates > Report Design. In the drop down list, each template is displayed with an ID to the left, and a preview of its layout. You can also select the option None, if you do not wish to display a header/footer. When you have selected a header or footer, the tab Header/Footer becomes available. Under this tab, you can customise the header/footer you have selected. See section Basic Information > Header/Footer. If you have customised a header or a footer under the Header/Footer tab, it is displayed in the drop down list with the symbol * instead of an ID.
The symbol indicates that it is a customised header or footer. Note that the program only saves the latest customised header/footer. If you select another header/footer, and customise it, the previous one disappears from the drop down list.
Click the Save button if you want to save your changes.
Organisation AccessIf you have created organisations under Administration > Organisations you can under the heading Organisation Access decide which organisations are to have access to the report, by marking the check box next to the desired organisations. The organisation you belong to (or, if you belong to several organisations, the one which is selected in the organisation drop down list) is already marked. To be able to give an organisation access to reports, you must belong to this organisation yourself.
If you have a hierarchical structure of organisations, any parent organisations to selected organisations will automatically be selected. The symbol to the right of an organisation indicates that the organisation has access to the report, while organisations without access have the symbol.
© Artisan Global Media

Manual 142
To have access to the report, users in the connected organisations must (through their group) have the right Report Access > All Reports.
Status• Owner - the person who created the report
• Created - the date when the report was created
• Last updated - the date when the report was last updated
Report ReadersIn the plug-in SR-Advanced Report, a user can be given the user role Report reader. The only part of the program that is accessible for report readers, is the reports. Under Distribution and subreports you connect the report readers who should have access to the report and any subreports that have been created. Please refer to Reports > Distribution and Subreports for more information. Under Basic Information, you can also give report readers additional rights concerning the report and the survey it is based on. The following rights can be assigned:
• See basic information, like response rate, for unpublished reports - This means that the report readers can see the response rate of reports they are connected to, even if the report is not yet published. However, they cannot see the report itself until it is published.
• See and export respondents connected to the main survey - If you activate this setting, the report readers can also see and export respondents connected to the survey the report is based on. When you have activated the setting, you select which respondent they should have the right to see:
• All respondents - all report readers can see and export information about all respondents connected to the main survey.
• Respondents matched by subreport selections - In each report/subreport, you can make selections for which respondents' answers a report reader can see (e.g. a certain sub category of a respondent category). This option means that the report readers will only see the respondents matching these selections.
• Respondents matching the report readers profile filter - In the user administration you can connect each report reader to the sub categories of the different respondent categories. This option means that a report reader will only see respondents matching the sub categories that he/she is connected to.
• May answer and submit unsubmitted surveys - The setting gives the report reader right to answer the surveys of the respondents he/she has the right to see.
© Artisan Global Media
Manual 143
Header/Footer Under Reports > Basic information > Properties, you select whether a page header or footer is to be displayed at the top and bottom of each page in the report when it is exported. You can, in the drop down lists Header and Footer, choose from the templates for headers and footers which have been created under Templates > Report Design. The tab Header/Footer becomes available if you have selected a template in any of the drop down lists Header and Footer. The tab is not available if the option None is selected in both of the drop down lists.
Under the tab Header/Footer, you can make your own changes to the layout of the selected header/footer.
Editing Headers/FootersClick on either Edit header or Edit footer, depending on which of the two you want to edit.
You edit the header/footer in an editor where you can write and format text, and insert images and links. See the section Survey > Survey Construction > Basic Information > Introductory text for information on how to insert and align images, and how to link to files and to web and e-mail addresses.
There are also buttons for inserting page numbers and total number of pages.
Page number
Total number of pages
Click on Save when you are finished. A preview of the header/footer is then displayed.
Data Set When you create a report, a data set is created where all the questions from the survey are converted into so-called variables. Other variables included in the data set are any respondent categories connected to the survey, Respondent languages (if the survey is multilingual, this variable is found under the heading Multilingual) and Date and Time of day when the respondent answered (under the heading Answer Date).
If you (before you create the report) activate the setting Allow 'Individual answers' variable in the report dataset, under Survey > Survey Construction > Basic Information > Properties > Access, the heading Individual answers will be included in the data set. Under this heading, you find the variable Respondents (if the report is based on a non-anonymous respondent survey) and the variable Anonymized. These variables can be used to display each individual respondent's answers separately. In the report, you can for example use the variable as a background series on a question, and thereby create a contingency table where the answers are grouped per respondent. You can also use the variable as a selection in a sub-report, and thereby create a report containing an individual respondent's answers. The variable
© Artisan Global Media

Manual 144
Respondents presents the respondents with their first name and last name, while the respondents in the Anonymized variable are represented by Answer #1, Answer #2, etc.
Before you start editing your report, you can process the variables here. You can, for instance, change the wording of the questions or answer options, or merge several answer options into one.
When you click on Data set, all the questions in the survey are displayed in a tree structure. Click on the plus sign next to a question to expand it. If you expand a matrix question, all of its subquestions will appear. They, too, can be expanded. It is also possible to click Expand all to expand all the questions at once. Below each question, a list of its variables is displayed.
The actual question is displayed in blue text and has a symbol to the left
of it, except if it is a text question. Text questions instead have an symbol next to them. Interval questions (either numeric or date/time questions) are presented as two variables, one for the "from" value and one for the "to" value. Matrix questions contain one variable for each subquestion, and one variable summing up all the subquestions of the matrix.
If a question contains a blank answer option such as "If other, please
specify", this will appear as a separate variable with the symbol before it. The same applies if the question includes a comment field. The reason why the blank answer options and comments appear as separate variables is that they contain text that the respondents have written themselves. It is possible to present them in a separate table in the report.
If you click on a variable it will be displayed under Information in the right-hand part of the window. The check box Include the variable when generating the report determines whether the variable will be included when you click on the Generate report button, see the section on Generating reports below for more information. The summation variable in a matrix question will not be included as default, and neither will the variables for respondent categories, Respondent languages, Date and Time of day. Those variables that you have chosen to not include in the report are displayed in grey in the tree structure. The numbers in brackets indicate how many of a question's variables are included. Next to a matrix question with four questions, the numbers will be (4/5) if the four subquestions have been included, but not the summation variable.
Here you will also find the following buttons:
Edit variable
Copy variable
Recode variable
Find out more about these functions below.
If the survey which the report is based on contains at least one text question, it is possible, under Survey > Data Collection > Text Answers, to edit the answers given on the text questions of the survey. This can be useful if the answers contain inappropriate text. If the text answers has been edited on
© Artisan Global Media

Manual 145
the survey, you have access to the check box Use edited answer texts. Mark the check box if you want the edited answers to be presented in the report. Leave the check box unmarked if you want to present the original answers instead.
Editing Variables
By clicking on a variable and then on the button, you open the pop-up window Edit variable where you can change the wording of the question title as well as the answer options. Make the changes directly in the fields provided and confirm by clicking OK.
If you wish to change the formatting of the question title or an answer option,
click on the icon.
Settings for Numeric Questions You can choose various settings for how the numeric values are to be presented: how many intervals are to be displayed, which is to be the minimum value displayed for the lowest interval and which is to be the maximum value displayed for the highest interval, as well as which labels (names) the intervals are to be given.
If you do not edit the default settings, the number of intervals displayed in the report will be 10. Which minimum and maximum values the program will use depend on whether minimum or maximum values for the answers were specified when the survey was created. The Slider and Interval slider question types always entail the use of limits.
• Questions where limits were specified during the survey construction: The program will use the specified limits.
• Question where limits were not specified during the survey construction: The survey will suggest limits based on the lowest and highest answers provided by the respondents.
An example: Respondents have given answers ranging from 8 to 94. If no limits were specified during the survey construction, the lowest interval will be 7-15 and the highest 88-96. As you can see, the program covers all the answers using 10 intervals of an equal size. If instead the limits had been set to 1 and 100, the ten intervals would range from 1-10 to 91-100.
Follow these steps to customise the settings:
1. Make sure that the check box at Automatic in the Limits section is not checked.
2. Specify the values of your choice at Min (the minimum value, eg. where the interval starts) and Max (the maximum value, eg. where the interval finishes).
3. Select the number of Intervals you wish to display.4. If you have specified Min and Max values and it is expected that
some answers will fall outside of these limits, you can check the box at Include values lower than the minimum and/or Include values greater than the maximum. Two extra intervals will then be created to cover those answers.
5. Under Labels, make sure that the check box next to Automatic is
© Artisan Global Media
Manual 146
checked, then click on Create labels.6. New intervals will be created and presented in the bottom part of the
window. By unmarking the checkbox next to Automatic, you can edit the values delimiting the intervals manually. You can also edit the labels (names).
7. Click on OK to save your changes.
Settings for Calendar Questions You can select how the answers to calendar questions are to be presented: how many intervals are to be displayed, at what date/time the lowest interval is to start (Min value) and at what date/time the highest interval is to stop (Max value). You can also specify how the intervals are to be labelled.
If you do not make any changes to the default settings, the number of intervals displayed in the report will be ten. The min and max values displayed in the chart will be the lowest (earliest) and highest (latest) values provided by the respondents in their answers.
Follow these steps to customise the settings:
1. Make sure the check box next to Automatic in the Limits section is not checked.
2. Specify the values of your choice at Min (the minimum value, eg. the date/time at which the interval starts) and Max (the maximum value, eg. the date/time at which the interval finishes).
3. Select the number of Intervals you wish to display.4. If you have specified Min and Max values and it is expected that
some answers will fall outside of these limits, you can check the box at Include values lower than the minimum and/or Include values greater than the maximum. Two extra intervals will then be created to cover those answers.
5. Under Labels, make sure that the check box next to Automatic is checked, then click on the Create labels button.
6. New intervals will be created and presented in the bottom part of the window. By unmarking the checkbox next to Automatic again, you can edit the values delimiting the intervals manually. You can also edit their labels (names), for instance to change "01/01/2010 -31/12/ 2010" to just "2010".
7. Click on OK to save your changes.
Copying VariablesYou are able to copy a variable. For those who use the plug-in SR-Advanced Report, compute variables and analyse functions can be copied as well. In this way you can change the variable in different ways without messing up the original variable.
1. Search and click the wanted variable/analyse function in the tree structure of the data set.
2. under the heading Information on the right side of the page.
© Artisan Global Media

Manual 147
3. In the window Copy variable (Analyse function) you have the possibility to make the same changes regarding the copy as usual editing.
4. The copied variable is found underneath the original in the data set. The copied analyse function is found in the map Analyse functions bottommost in the tree structure of the data set.
Recoding Variables Variables can be recoded in various ways depending on the type of question they stem from. All variables except for text variables can be recoded.
• Questions with set answer options (single-choice, multiple-choice, matrix) - the answer options can be recoded.
• Numeric questions - labels created with numeric intervals can be recoded.
• Calendar questions - labels created with date intervals can be recoded.
The recoding can for instance be done to merge several answer options or intervals into one, or to omit certain answer options or intervals.
An example: A question of the Rating type has let respondents rate an object by selecting a number between 1 and 9. If you then want the report to display only negative attitudes (1-3) and positive attitudes (7-9) you can recode the data. When processing it, a new label is created and named "Negative", where the grades 1, 2 and 3 are grouped, while 7, 8 and 9 are grouped under a new label titled "Positive". 4, 5 and 6 receive no new label, and are therefore omitted.
To recode the data, click on a variable and then on the button to open the pop-up window named Recode variable...
The Title field then lets you give the recoded variable a descriptive name. The program will propose the variable's original name with the word "Recoded" before it be used.
Under Old labels you can see the variable's different answer options (if it is a question with given answer options) or intervals (if it is a numeric or calendar question). You recode a variable by dragging and dropping the old labels on the new labels that you create in the right-hand part of the window.
Under New Labels, enter the new label's name in the Name field. Click on
if you want to format the text. Drag and drop the original labels of your choice in the field below the label name. In the example shown below, the answer options "Strongly disagree" and "Disagree" have been merged to form the new label "Disagree".
© Artisan Global Media
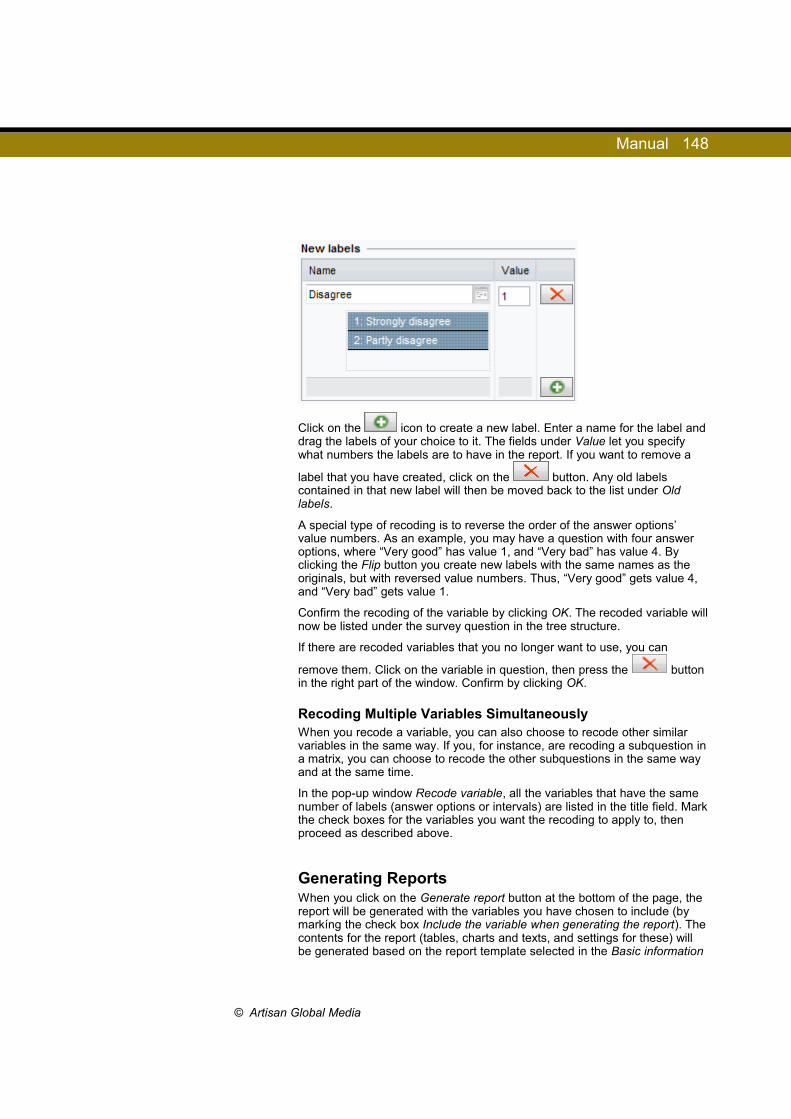
Manual 148
Click on the icon to create a new label. Enter a name for the label and drag the labels of your choice to it. The fields under Value let you specify what numbers the labels are to have in the report. If you want to remove a
label that you have created, click on the button. Any old labels contained in that new label will then be moved back to the list under Old labels.
A special type of recoding is to reverse the order of the answer options’ value numbers. As an example, you may have a question with four answer options, where “Very good” has value 1, and “Very bad” has value 4. By clicking the Flip button you create new labels with the same names as the originals, but with reversed value numbers. Thus, “Very good” gets value 4, and “Very bad” gets value 1.
Confirm the recoding of the variable by clicking OK. The recoded variable will now be listed under the survey question in the tree structure.
If there are recoded variables that you no longer want to use, you can
remove them. Click on the variable in question, then press the button in the right part of the window. Confirm by clicking OK.
Recoding Multiple Variables Simultaneously When you recode a variable, you can also choose to recode other similar variables in the same way. If you, for instance, are recoding a subquestion in a matrix, you can choose to recode the other subquestions in the same way and at the same time.
In the pop-up window Recode variable, all the variables that have the same number of labels (answer options or intervals) are listed in the title field. Mark the check boxes for the variables you want the recoding to apply to, then proceed as described above.
Generating ReportsWhen you click on the Generate report button at the bottom of the page, the report will be generated with the variables you have chosen to include (by markíng the check box Include the variable when generating the report). The contents for the report (tables, charts and texts, and settings for these) will be generated based on the report template selected in the Basic information
© Artisan Global Media
Manual 149
menu. Note that if you have generated this report content earlier, and then made changes in the Report Content menu, the changes will be overwritten with the content of the report template.
ExportIf you click on Export, you can export the data set to Excel. In the Excel file, one tab will display the data set's variables and answer options, and another tab will display the answers that the respondents have provided.
Note the difference between this Export and the export that is done under Survey > Data collection > Export. On that page, the survey's raw data with the exact variables that were in the actual survey are exported. On this page on the other hand, (any) recoded variables will also be included.
Answers to the question type Open Matrix – Time (only available for those who have the SR-Advanced Survey plug-in) will be exported as number of minutes. If the answer “01:30” has been given, the value in the export file will be “90”.
Presenting variables from other surveysThe plug-in SR-Advanced Report makes it possible to add data sets from other surveys, and to present the questions of these surveys in the report. This is useful if you want to compare the result of a question with the result of the corresponding question in an earlier survey.
Add Data SetClick the Add Data Set button. A pop-up window opens where you click on a survey to add its dataset. When the data set has been added, it is displayed as a new tab on top of the page. Click the tab to show the data set, and to be able to edit and re-code its variables. It is now possible to add the variables of the data set as series when you are editing a table or a chart in the Reports > Report Content menu. Here as well, you will find the data sets as different tabs (in the Add Series window).
Delete Data Set
To delete a data set you click on its tab, and then on the icon in the tab. Confirm with OK. NB: If variables from the data set have been added as series in the report, they will no longer be displayed.
Comparing SurveysIn the plug-in SR-Advanced Report, you have the possibility to compare the results from different surveys. If you, for example, carry out a survey every year, you can compare the results from the different years in the same report.
© Artisan Global Media

Manual 150
Creating a Compare Data setTo be able to compare surveys, you start by merging the surveys' data sets to a Compare data set:
1. Create a report based on a "main survey" for the comparison.2. Under Reports > Data Set, you click the Add Data Set button, and
then on a survey whose data set you want to add. Repeat the procedure if you want to add more data sets. Each data set is represented by a tab in the top of the window.
3. You can now create a Compare data set where all the data sets are combined. Make sure that the main survey's data set is selected (the tab to the far left) and click the Compare Manager button. A window is opened where you select which variables from the main survey you want to include in the comparison. Make sure that the check boxes next to the variables you want to include are marked, and click OK.
4. In the Compare Manager window, the main survey's data set is shown to the left, and the Compare data set, with the variables you just selected, to the right. Click OK to close the window. The Compare data set is created, and displayed as a new tab, Compare, to the far right.
5. Click the tab of the next data set to be included in the comparison, and then on the Compare Manager button. Click the Automatic... button to let the program perform an automatic matching of variables with the same name, in the selected data set (to the left) and the Compare data set (to the right).
6. If you expand the data sets by clicking the icon, the icon is displayed next to each variable that has been matched. Click the icon to see which variable in the other data set it has been matched with. If a question had a different wording in the two surveys, its variables will not be automatically matched. However, you can match them manually by dragging a variable from the data set to the left to the corresponding variable in the Compare data set. If you instead drag the variable to the field with a plus icon at the bottom, you add it as a new variable in the Compare data set. You can also do this by clicking the plus icon, marking the check box next to the variable and click OK.
7. Next to the variables that have been matched, but where the matching of the labels was not complete, the icon is displayed. Expand the variable in the Compare data set to check the matching. The symbol is displayed next to labels that have been matched, while labels that have not been matched have one of the following symbols:
- The label I don't know exists in the Compare data set, but not in the data set to the left
- The label I don't know exists in the data set to the left, but not in the Compare data set
If a label had a different wording in the two surveys, it will not be
automatically matched. By clicking the button you open a window where you can match the labels manually by dragging them from Unmapped labels to the corresponding label under Compare
© Artisan Global Media

Manual 151
Variable Labels. If you instead drag the label to the field with a plus icon at the bottom, you add it as a new label in the Compare data set. You can also remove a label from the Compare data set by
clicking the button. Note that any labels from other data sets, matched with this label, then will become unmatched. Click OK to confirm the changes.
8. If you have added more data sets to be included in the comparison, you repeat step 5 and, if necessary, also steps 6 and 7.
Presenting Comparisons in the ReportWhen you have created a Compare data set, as described above, you can add its variables to the report, and use a certain background series to present the answers from the different data sets separately.
If you want all questions in the report to be presented as a comparison between the surveys, you follow these steps:
1. Click the Compare tab to go to the Compare data set2. Click the Generate Report Content button. Confirm by clicking OK.3. Go to the Report Content menu. The report is currently showing the
aggregated answers from all the included surveys.4. To compare the different surveys, you use a background series to
present the answers from the included data sets separately. Click the Manage Background Series button, and then the Compare tab. Expand Background Variables and click the radio button next to Background Variable: Data set. Click OK.
If you want only certain questions in the report to be presented as a comparison, you follow these steps instead:
1. Generate the report based on the main survey. If you did not do that when the report was created, you can do it by clicking the Generate Report Content button from the survey's data set.
2. Go to the Report Content menu. Add a new block on a question where you want to make a comparison between the surveys, and add a table or a chart in the block.
3. In the edit mode of the table or the chart, you click the Add... button under Series, and then the Compare tab to show the Compare data set. Mark the check box next to the desired variable and click OK.
4. Click the Add... button under Background Series, and then the Compare tab to show the Compare data set. Expand Background Variables and mark the check box next to Background Variable: Data set. Click OK.
In the Templates > Report Templates > Edit Report Templates menu, you can define a template for how variables from the Compare data set should be presented. The settings are made under SR-Advanced Report > Compare. Please refer to the Edit Report Templates section for more information. The table type Change is especially suited for comparison between different surveys. Please see the Reports > Report Content section for information about this table type.
© Artisan Global Media
Manual 152
Computed VariablesIn the plug-in SR-Advanced Report, there is a function to create computed variables. This function lets you make mathematical and statistical calculations of the variables, and thus create new variables. You can for example create a new variable that shows the summation of a number of variables.
Please note that the calculations in a computed variable is made on respondent level. Thus the program returns a value per respondent for the computed variable. This means that is not recommended to use computed variables if you want to calculate a mean value for a population of several respondents. In that case, the program will first calculate a mean value per respondent, and after that a mean value of each respondent's mean value. Since this may result in a rounding error, it is recommended that you for this purpose create a so-called analyse function instead. Please refer to the Analyse function section below.
Create computed variableClick the New compute variable button. In the window that opens, you enter a Title for the variable. The calculation to be made for the variable, you create in the field Expression. The variables to be included in the expression are added from the tree structure on the left side of the window. Expand the question containing the variable, and double click the variable. The variables are named var1, var2 etc. Variables already inserted in the expression are displayed in blue in the tree structure. If the expression is correctly written, Status: OK is displayed in the field below the expression.
When you create the expression, you can add functions from a list. The following functions are available:
• abs - absolute value, converting negative numbers into positive, e.g. "-5" will be "5"
• ceiling - rounds up to the nearest integer, e.g. "5.25" will be "6"• exclude - excludes answers given on a certain answer value• floor - rounds down to the nearest integer, e.g. "5.75" will be "5"• ln - logarithm with the base e• log - logarithm with the base 10• max - maximum value• mean - mean value• sum - summation• min - minimum value• rnd - randomized value• round - rounded value• sqrt - square root
Double click a function to add it to the expression. The function is inserted with its name, eg. sum for summation, followed by two parentheses (). Place the cursor inside the parentheses, and add desired variables by double clicking them. The functions sum, mean, max and min calculate the value of multiple variables (or numerical values), which you separate by commas. All other functions calculate the value of only one variable (or numeric value).
You can also add numbers and operators to the expression by clicking the buttons in the calculator. The following buttons are available:
• Digits 0 to 9, and decimal point• Addition, subtraction, multiplication and division
© Artisan Global Media

Manual 153
• Exponentiation: ** - e.g. "5 raised to the exponent 2" is written 5**2• Pi• Parentheses: ()• Greater than: >, less than: <• Greater than or equal to: >=, less than or equal to: <=• Equal to: ==• Is unequal to: !=• And: &&• Or: ||
Finish the construction of the computed variable by clicking OK. It can now be found at the bottom of the tree structure, under Computed variables.
Example:
This example shows how to write the expression if you want the computed variable to show the summation of the three variables var2, var6 and var10:
sum(var2,var6,var10)
The advantage of writing the expression in the above way is that the variables with missing values are ignored. For example, if a respondent answered to var2 and var6, but not to var10, this respondent's mean value will be calculated on only var2 and var6.
The expression can also be written like this:
var2+var6+var10
In this case, any missing values will be handled in a different way. In the example with the respondent who had a missing value on var10, this will mean that the respondent gets a missing value also on the computed variable itself. Thus, this respondent's answers to var2 and var6 will not be included in the calculation.
When it comes to missing values, you have also the possibility to decide what value to use in cases where a respondent has not answered a question included in a computed variable. You decide this by clicking that question's variable (NB: not the computed variable itself) in the data set tree structure, and in the right part of the window enter a desired value in the field Missing value.
Edit Computed VariableTo edit a computed variable you click it in the data set tree structure, where
you find it under Computed Variables. Then click the button to open a window where you can edit the Titel and the Expression of the variable.
Present the frequency of a computed variableIf you want to present the result of a computed variable in a frequency table or a frequency chart, you can choose various settings for how the values are to be presented: how many intervals are to be displayed, which is to be the minimum value displayed for the lowest interval and which is to be the maximum value displayed for the highest interval, as well as which labels (names) the intervals are to be given. Please refer to Editing variables > Settings for numeric questions above for more information.
© Artisan Global Media

Manual 154
Analyse functionsAs described above, the calculation in a computed variable is made on respondent level. If you want to make a calculation, of for example the mean value, based on the answers from a population of respondents, you create an analyse function instead.
Analyse functions can be used for different purposes, for example to calculate an index where the mean value is converted to a value between 0 and 100, or to calculate how many percent of the respondents have given a "positive" answer, e.g. 4 or 5 on a five-grade scale. Read more about specific ways of using analyse functions below.
Analyse functions return a value which is presented, under the Report Content menu, in a certain type of table or chart, named Analyse Function.
Creating analyse functionsClick the Add Analyse Function... button. In the window that opens, you enter a Title. The calculation to be made, you create in the field Expression. The variable(s) to be included in the expression are added from the tree structure on the left side of the window. Expand the question containing the variable, and double click the variable. The variables are named var1, var2 etc. Variables already inserted in the expression are displayed in blue in the tree structure. If the expression is correctly written, Status: OK is displayed in the field below the expression.
When you create the expression, you can add functions from a list. The following functions are available:
• remap - converts a value to another value, used for example to create an index, see the Index section below
• flip - use this function to reverse the order of the answer options’ value numbers, see an example in the Index section below
• correl - used in order to calculate correlation, i.e. the relationship between two variables, read more in the Correlation section below
• chisquare - used in order to perform a chi-squared test, i.e. examining whether or not the distribution corresponds to the expected, read more in the Chi-squared section below
• count - counts the number of answers given for a question, used to calculate percentage of "positive" answers
• respcnt - counts the number of respondents who answered a question; on a single-choice question, count and respcnt will return the same number, but on a multiple-choice question one respondent (respcnt = 1) can give two answers (count = 2)
• skewness - used in order to examine whether or not the distribution is non-symmetrical, read more in the Skewness section below
• abs - absolute value, converting negative numbers into positive, e.g. "-5" will be "5"
• ceiling - rounds up to the nearest integer, e.g. "5.25" will be "6"• exclude - excludes answers given for a certain answer value• excludetop - excludes a specified number of the highest answers• excludebottom - excludes a specified number of the lowest answers• floor - rounds down to the nearest integer, e.g. "5.75" will be "5"• ln - logarithm with the base e• log - logarithm with the base 10• max - maximum value• mean - mean value
© Artisan Global Media

Manual 155
• sum - summation• min - minimum value• rnd - randomized value• round - rounded value• sqrt - square root
Double click a function to add it to the expression. The function is inserted with its name, eg. mean for mean value, followed by two parentheses (). Place the cursor inside the parentheses, and add desired variables by double clicking them. In functions which includes several variables, (or numerical values), the variables are delimited by commas
You can also add numbers and operators to the expression by clicking the buttons in the calculator. The following buttons are available:
• Digits 0 to 9, and decimal point• Addition, subtraction, multiplication and division• Exponentiation: ** - e.g. "5 raised to the exponent 2" is written 5**2• Pi• Parentheses: ()• Greater than: >, less than: <• Greater than or equal to: >=, less than or equal to: <=• Equal to: ==• Is unequal to: !=• And: &&• Or: ||
By clicking the Test button, you see the value the function will return. Finish the construction of the analyse function by clicking OK. It can now be found at the bottom of the tree structure, under Analyse Functions.
Examples of how to use analyse functions
Mean valueIf you want to calculate the mean value of the variables var2, var6 and var10, the expression shall be written like this:
mean(var2,var6,var10)
If you want to calculate the mean value of variables containing an "I don't know" answer option, or another answer option which shall not affect the mean value, you can use the exclude function to exclude this answer option from the calculation. You do this by specifying the value of the answer option to be excluded. Below you find an example of how to write the expression if the answer option with value 0 shall be excluded from the variables var2, var6 and var10.
mean(exclude(var2,0),exclude(var6,0),exclude(var10,0))
© Artisan Global Media
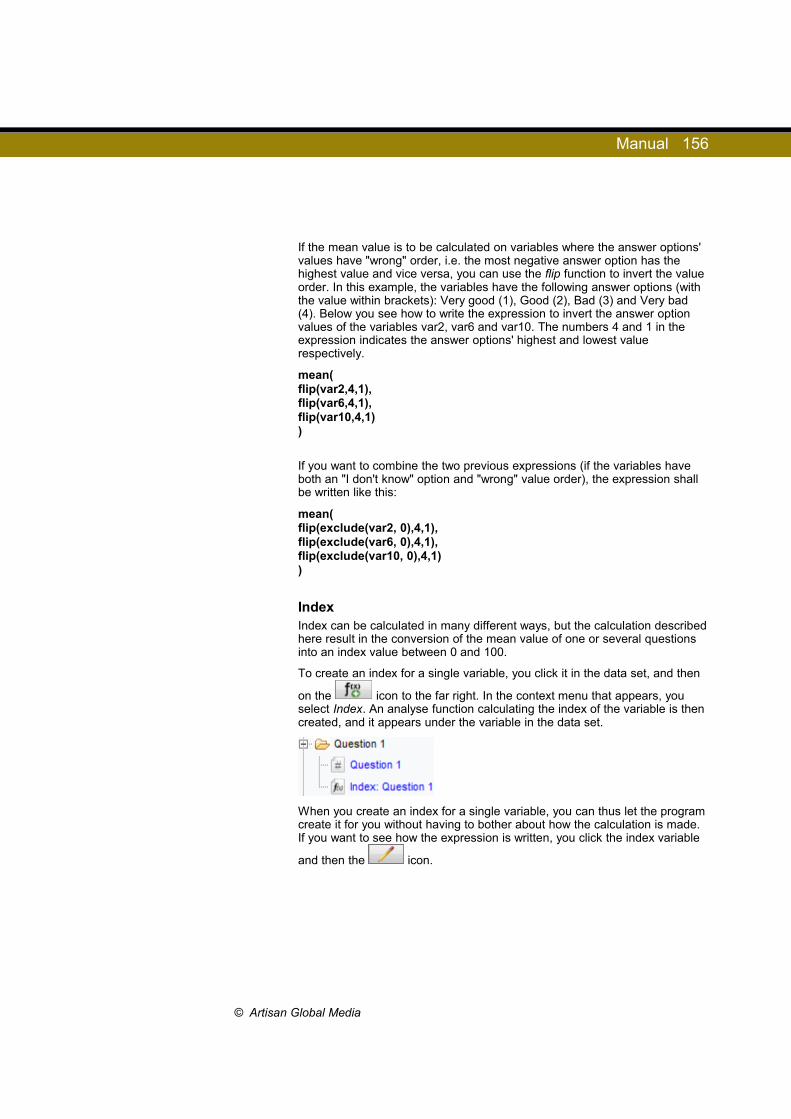
Manual 156
If the mean value is to be calculated on variables where the answer options' values have "wrong" order, i.e. the most negative answer option has the highest value and vice versa, you can use the flip function to invert the value order. In this example, the variables have the following answer options (with the value within brackets): Very good (1), Good (2), Bad (3) and Very bad (4). Below you see how to write the expression to invert the answer option values of the variables var2, var6 and var10. The numbers 4 and 1 in the expression indicates the answer options' highest and lowest value respectively.
mean(flip(var2,4,1),flip(var6,4,1),flip(var10,4,1))
If you want to combine the two previous expressions (if the variables have both an "I don't know" option and "wrong" value order), the expression shall be written like this:
mean(flip(exclude(var2, 0),4,1),flip(exclude(var6, 0),4,1),flip(exclude(var10, 0),4,1))
IndexIndex can be calculated in many different ways, but the calculation described here result in the conversion of the mean value of one or several questions into an index value between 0 and 100.
To create an index for a single variable, you click it in the data set, and then
on the icon to the far right. In the context menu that appears, you select Index. An analyse function calculating the index of the variable is then created, and it appears under the variable in the data set.
When you create an index for a single variable, you can thus let the program create it for you without having to bother about how the calculation is made. If you want to see how the expression is written, you click the index variable
and then the icon.
© Artisan Global Media

Manual 157
As an example, the expression can be written like this:
remap(mean(var2), 1,4,0,100)
To start with, the function above calculates the mean value, mean, of the variable var2. The next thing is that the function converts, remap, this mean value to an index value between 0 and 100. The last part of the expression specifies that the original variable's answer options have 1 and 4 as its lowest and highest value respectively, and that the converted value must equal a minimum of 0 and a maximum or 100.
The Mean value section describes how the exclude function is used to exclude an "I don't know" option so that it will not affect the calculation of the
mean value. If you create an index for a single variable via the icon, the program automatically adds exclude to the expression, if the variable has an answer option with value 0. The expression will the look like this:
remap(mean(exclude(var2,0)), 1,4,0,100)
If you want to create an index based on several variables, you click the Add Analyse Function... button, and create the analyse function in the usual way. In the Mean value section, you find several examples of how to write the mean value expression, depending on the characteristics of the variables involved. Since the calculation of the index is based on a mean value which is converted to a value between 0 and 100, we can use the same expressions as in the mean value examples, but add the remap function to them.
If you want to calculate an index for the variables var2, var6 and var10 (whose answer options have the values 1-4), you write the expression like this:
remap(mean(var2,var6,var10), 1,4,0,100)
If you want to create an index for variables containing an "I don't know" answer option, or another answer option which shall not affect the index, you can use the exclude function to exclude this answer option from the calculation. You do this by specifying the value of the answer option to be excluded. Below you find an example of how to write the expression if the answer option with value 0 shall be excluded from the variables var2, var6 and var10.
remap(mean(exclude(var2,0),exclude(var6,0),exclude(var10,0)), 1,4,0,100)
© Artisan Global Media

Manual 158
If the index is to be calculated on variables where the answer options' values have "wrong" order, i.e. the most negative answer option has the highest value and vice versa, you can use the flip function to invert the value order. In this example, the variables have the following answer options (with the value within brackets): Very good (1), Good (2), Bad (3) and Very bad (4). Below you see how to write the expression to invert the answer option values of the variables var2, var6 and var10. The numbers 4 and 1 in the expression indicates the answer options' highest and lowest value respectively.
remap(mean(flip(var2,4,1),flip(var6,4,1),flip(var10,4,1)), 1,4,0,100)
If you want to combine the two previous expressions (if the variables have both an "I don't know" option and "wrong" value order), the expression shall be written like this:
remap(mean(flip(exclude(var2, 0),4,1),flip(exclude(var6, 0),4,1),flip(exclude(var10, 0),4,1)), 1,4,0,100)
Calculate percentage of positive answersThe count function can be used to calculate the percentage of answers given for one or more answer options, in relation to all answers given for the variable.
Example: You have carried out a survey where the respondents were answering questions whose answer options had the values 1-5. When analysing the result, you want to know the percentage who chose the answer options with the values 4 or 5. You then create an analyse function whose expression is written like this for a single variable (in the example the variable var2):
count(var2,4,5)/count(var2)*100
Thus, the numbers 4 and 5 in the expression indicates which answer option values to be counted.
If the calculation is to include several variables (in the example the variables var2, var6 and var10), the expression is written like this:
(count(var2,4,5)+count(var6,4,5)+count(var10,4,5))/(count(var2)+count(var6)+count(var10))*100
© Artisan Global Media
Manual 159
Quick FunctionsWhen you click a variable in the dataset, a number of icons appear to the far
right. One of them is the icon. If you click this icon, you can select among the following quick functions:
• Index• Chi-squared• Skewness• Correlation...
If you select one of these functions, an analyse function, including the variable you clicked on, is automatically created. The analyse function is listed under the original variable in the data set.
Above you can read more about index. Below the other quick functions are briefly described.
Chi-squared
Used in order to measure whether or not the distribution corresponds to the expected. In the expression, each answer option's expected percentage of the answers are specified.
Example: For a variable (var1) with the answer options 1-5, the following distribution was expected:
1: 8%2: 23%3: 38%4: 24%5: 7%
In this case, the expression is written like this:
chisquare(var1,8,23,38,24,7)
If the actual distribution corresponds exactly to the expected, the function will return the value 0. The higher value, the more the actual distribution differs from the expected.
Skewness
Used in order to measure whether or not the distribution is asymmetric, i.e. if the main part of the answers is concentrated to the left (positive skewness) or to the right (negative skewness), when displayed in a column chart.
© Artisan Global Media
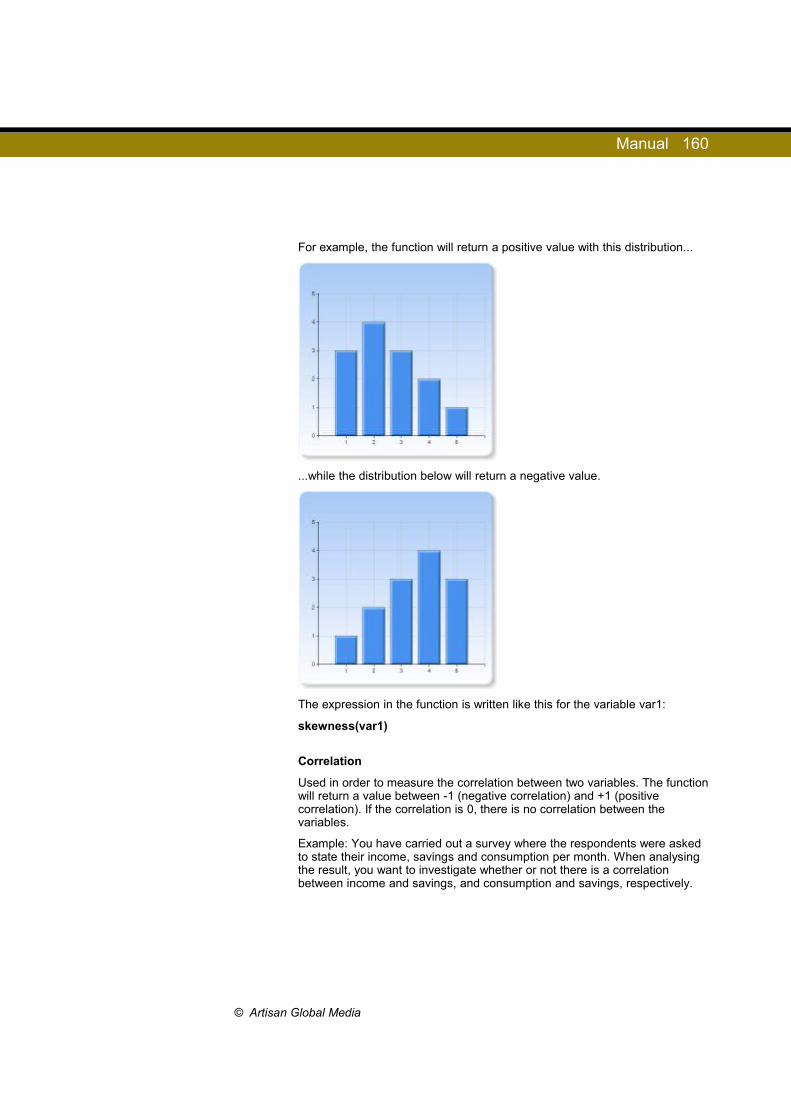
Manual 160
For example, the function will return a positive value with this distribution...
...while the distribution below will return a negative value.
The expression in the function is written like this for the variable var1:
skewness(var1)
Correlation
Used in order to measure the correlation between two variables. The function will return a value between -1 (negative correlation) and +1 (positive correlation). If the correlation is 0, there is no correlation between the variables.
Example: You have carried out a survey where the respondents were asked to state their income, savings and consumption per month. When analysing the result, you want to investigate whether or not there is a correlation between income and savings, and consumption and savings, respectively.
© Artisan Global Media

Manual 161
To compare the variable Income (var1) to the variable Savings (var2), the expression is written like this:
correl(var1,var2)
In this example, the function returned a positive value. Thus, it was possible to say that there was a positive correlation between income and savings, i.e. the higher the income, the higher the savings.
However, the function returned a negative value when the variable Consumption was compared to the variable Savings. Thus, there was a negative correlation, i.e. the higher the consumption, the lower the savings.
Text AnalysisThose who have the plug-in SR-Advanced Report have the possibility to create text analysis variables. In the report, a text analysis variable shows the frequency of words, or categories of words, in the answers given to text variables, i.e. text questions, blank options and comments.
Create Text Analysis Variable1. In the data set tree structure, you expand the question containing
the text variable2. Click the text variable to select it
3. Click the icon in the right part of the window to open the pop-up window Text Analysis
4. Type a Title under the Basic Information tab5. Click OK. Before doing that, you can edit the variable, please refer
to Edit Text Analysis Variable below.
Edit Text Analysis Variable1. In the data set tree structure, you expand the question containing
the text variable2. Click the text variable to select it
3. Click the icon in the right part of the window to open the pop-up window Text Analysis
4. Edit the variable, using the five tabs described below5. Click OK
Basic InformationEnter a Title for the variable. Select next to Return whether the variable will show the frequency of Words or Categories. In the Max Results field, you enter the maximal number of words/categories to present the frequency of. Another way to limit the maximum number of words/categories to show is to enter a desired number in the Min Count field. Words/categories appearing fewer times will not be shown in the report.
In the drop down lists in the right part of the window, you can import so-called category lists, conversion lists and exclusion lists. Please refer to the sections Categories, Conversions, Exclusions and Lists below.
© Artisan Global Media

Manual 162
WordsUnder this tab, all the words that the respondents have written in their answers are presented, and also how many times each word appears (Count). If you have created categories, you can see in the right column if the word belongs to a category, and if so, what category. Read more in the section Categories below. In the column to the far left, the word is symbolized by a grey or a coloured square. The colours have the following meanings:
Conversion - a rule has been created that convert several words to this collective term. Click the word to see, in the right part of the window, which words are included. Read more in the section Conversions below.
Word that has been converted - this word is part of a conversion, and appears in the list only if the check box Show conversion parts has been marked. Click the word to see, in the right part of the window, which conversion it is part of.
Word that has been excluded - a rule has been created that excludes this word, i.e. prevents it from appearing in the result. This word appears in the list only if the check box Show exclusions has been marked. Read more in the section Exclusions below.
You can sort the list, e.g. in alphabetical order or by count, by clicking any of the column headings. In the list, 100 words are displayed in each page. To toggle between the pages, use the buttons at the bottom of the page.
There are different ways to toggle between the pages:
• Click the desired page number
• Move one page back or forward using the and buttons
• Go to the first or last page using the and buttons
CategoriesInstead of presenting the frequency of individual words, you can choose to present the frequency of categories of words. This choice is made under the Basic Information tab.
You can create the categories while editing the text analysis variable, but you can also import a so-called category list, to the variable. A category list contains a number of categories that have been defined and saved in order to be used generally in the program. Read more about on how to create and import category lists in the Lists section below.
© Artisan Global Media

Manual 163
Creating CategoriesThere are two ways to create categories: under the Words tab and under the Categories tab.
Alternative 1 - to create a category under the Words tab:
1. In the list, select the words that shall belong to the category by clicking them. In the right part of the window, you can see which words you have selected.
2. Enter a name for the category in the Category field3. Click the Create Rule button below the Category field
Alternative 2 - to create a category under the Categories tab:
1. Enter a name for the category in the Category field2. In the field below, define which words to be included in the category
by entering a Regular expression. Below you find some examples.3. Click the Create button
Example: You want the words "London", "Birmingham" and "Manchester" to belong to the category "English Cities". The regular expression shall then be written like this:
^(london|birmingham|manchester)$
The expression begins with the ^ character and ends with the $ character. Within the parentheses you write the words, separated by a vertical bar (the | character). The expression is not case sensitive, i.e. it matches words regardless of whether they contain upper-case or lower-case letters. You find more examples of how to write an expression under the Regular expressions heading below.
Editing and Deleting CategoriesThe categories that have been created can be edited under the Categories tab. In the left-hand list, you click the category to edit. Make the desired changes in the Regular expressions field and click the Update button.
In the example above, we can add more cities by typing them within the parentheses, separated by vertical bars:
^(london|birmingham|manchester|liverpool|newcastle|nottingham)$
You find more examples of how to write an expression under the Regular expressions heading below.
You can also add more words to an existing category under the Words tab:
1. In the list, select the words that should be added to the category by clicking them. In the right part of the window, you can see which words you have selected.
2. Enter the existing category's name in the Category field3. Click the Create Rule button below the Category field
To delete a category, select it in the left-hand list and click the Delete button.
© Artisan Global Media
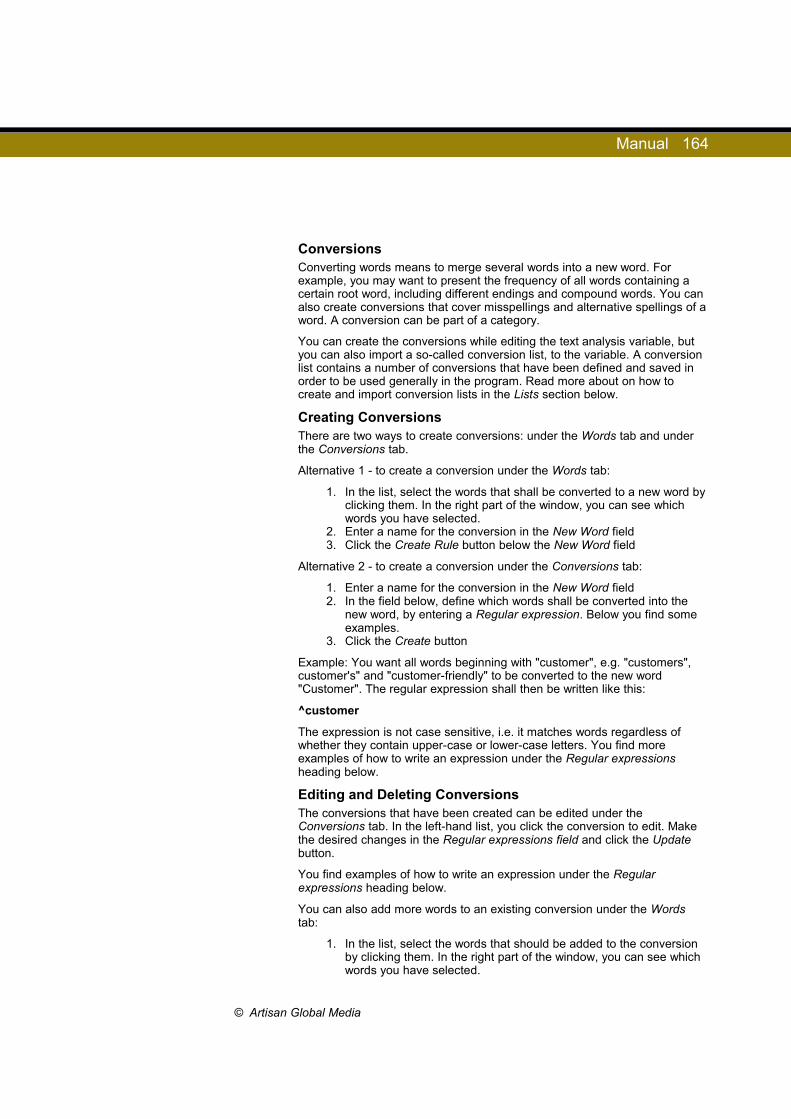
Manual 164
ConversionsConverting words means to merge several words into a new word. For example, you may want to present the frequency of all words containing a certain root word, including different endings and compound words. You can also create conversions that cover misspellings and alternative spellings of a word. A conversion can be part of a category.
You can create the conversions while editing the text analysis variable, but you can also import a so-called conversion list, to the variable. A conversion list contains a number of conversions that have been defined and saved in order to be used generally in the program. Read more about on how to create and import conversion lists in the Lists section below.
Creating ConversionsThere are two ways to create conversions: under the Words tab and under the Conversions tab.
Alternative 1 - to create a conversion under the Words tab:
1. In the list, select the words that shall be converted to a new word by clicking them. In the right part of the window, you can see which words you have selected.
2. Enter a name for the conversion in the New Word field3. Click the Create Rule button below the New Word field
Alternative 2 - to create a conversion under the Conversions tab:
1. Enter a name for the conversion in the New Word field2. In the field below, define which words shall be converted into the
new word, by entering a Regular expression. Below you find some examples.
3. Click the Create button
Example: You want all words beginning with "customer", e.g. "customers", customer's" and "customer-friendly" to be converted to the new word "Customer". The regular expression shall then be written like this:
^customer
The expression is not case sensitive, i.e. it matches words regardless of whether they contain upper-case or lower-case letters. You find more examples of how to write an expression under the Regular expressions heading below.
Editing and Deleting ConversionsThe conversions that have been created can be edited under the Conversions tab. In the left-hand list, you click the conversion to edit. Make the desired changes in the Regular expressions field and click the Update button.
You find examples of how to write an expression under the Regular expressions heading below.
You can also add more words to an existing conversion under the Words tab:
1. In the list, select the words that should be added to the conversion by clicking them. In the right part of the window, you can see which words you have selected.
© Artisan Global Media
Manual 165
2. Enter the existing conversion's name in the New Word field3. Click the Create Rule button below the New Word field
To delete a conversion, select it in the left-hand list and click the Delete button.
ExclusionsIf you choose, under the Basic Information tab, to present the frequency of words (instead of categories), you are probably not interested in seeing the frequency of common words like "the", "of" and "to". By creating Exclusions, you can make sure that such words are hidden.
You can create the exclusions while editing the text analysis variable, but you can also import a so-called exclusion list, to the variable. An exclusion list contains a number of exclusions that have been defined and saved in order to be used generally in the program. Read more about on how to create and import exclusion lists in the Lists section below.
Creating ExclusionsThere are two ways to create exclusions: under the Words tab and under the Exclusions tab.
Alternative 1 - to create an exclusion under the Words tab:
1. It is recommended that you sort the list by frequency. Click the Count heading to have the most common word at the top of the list.
2. In the list, select the words to be excluded by clicking them. In the right part of the window, you can see which words you have selected.
3. Click the Create Rule button below the Exclusion heading
Alternative 2 - to create an exclusion under the Exclusions tab:
1. In the field to the right, define which words shall be excluded by entering a Regular expression. Below you find some examples.
2. Click the Create button
Example: You want the words "the", "of", "to", "and", "a", "in", "is", "it", "you" and "that" to be excluded. The regular expression shall then be written like this:
^(the|of|to|and|a|in|is|it|you|that)$
The expression begins with the ^ character and ends with the $ character. Within the parentheses you write the words, separated by a vertical bar (the | character). The expression is not case sensitive, i.e. it matches words regardless of whether they contain upper-case or lower-case letters. You find more examples of how to write an expression under the Regular expressions heading below.
Editing and Deleting ExclusionsThe exclusions that have been created can be edited under the Exclusions tab. In the left-hand list, you click the exclusion to edit. Make the desired changes in the Regular expressions field and click the Update button.
You find examples of how to write an expression under the Regular expressions heading below.
© Artisan Global Media

Manual 166
You can also add more words to an existing exclusion under the Words tab:
1. In the list, select the words to be added to the exclusion by clicking them. In the right part of the window, you can see which words you have selected.
2. Click the Create Rule button below the Exclusion heading
To delete an exclusion, select it in the left-hand list and click the Delete button.
ListsIf you often make the same categorizations, conversions and exclusions in your text analyses, you can create lists that can be imported and applied each time you edit a text analysis variable. You can create category lists, conversion lists and exclusion lists, and let each list contain one or more definitions of the categorization, conversion or exclusion to be done.
Creating and Editing ListThe lists can be created and edited under Administration > Text Analysis where you find tabs for Category Lists, Conversion Lists and Exclusion Lists. Please refer to these sections for more information.
While editing a text analysis variable, you can also save the definitions you have made for the variable, as a list. Under the tabs Categories, Conversions and Exclusions, you find the button Save list, that you click after entering a Name in the field above. The list is saved and can now be imported to other text analysis variables. You can also edit it under Administration > Text Analysis.
Import ListWhile editing a text analysis variable, you can import the created lists and apply them on the variable in question. Under the Basic Information tab, you find a drop down list under each of the headings Category List, Conversion List and Exclusion List. The lists can also be imported under the three tabs Categories (category lists), Conversions (conversion lists) and Exclusions (exclusion lists). Select the desired list in the drop down list, and click the Import List button.
The lists' definitions are now imported, and can be found under the corresponding tab where you can edit them or delete them.
Regular ExpressionsAbove you find a description on how to create categories, conversions and exclusions. This is easiest done under the Words tab, but if you want to make more advanced definitions you can go to the corresponding tab and write a so-called regular expression. In a regular expression, different characters are used to search for words and phrases in a text. Below you find (in bold) some examples of how to write regular expressions.
red - matches all words containing "red", e.g. "red", "redirect", "offered" and "credentials"
The ^ character marks the beginning of the word:^red - matches all words beginning with "red", e.g. "red" and "redirect"
© Artisan Global Media

Manual 167
The $ character marks the ending of the word:red$ - matches all words ending with "red", e.g. "red" and "offered"
The ^ and $ characters can be combined to match whole words:^red$ - matches the exact word "red"
The | character is used to separate two options:red|green- matches all words containing "red" or "green", e.g. "red", "credentials", "green" and "evergreens"
Parentheses ( ) are used to group options to be combined with other characters:^(red|green) - matches all words beginning with "red" or "green", e.g. "red", "redirect", "green" and" "greenest"(red|green)$ - matches all words ending with "red" or "green", e.g. "offered" and "evergreen"^(red|green)$ - matches the exact words "red" and "green"
Parentheses can also be used inside a word to allow two alternative spellings:^cent(er|re)$ - matches the exact words "center" and "centre"
Search for an exact phrase by surrounding it with the ^ and $ characters:^good quality$ - matches the exact phrase "good quality"
Hierarchy variablesA hierarchy variable is used in hierarchy reports where it controls how the respondents' data is filtered in different levels. Through this variable the viewer can make comparisons between different groups of respondents. The viewer regulates the filter using the selection lists in the introduction of the report.
A hierarchy variable is built according to three principles:
• It can be built consisting of the respondent categories connected to the survey. For example if you use the respondent categories age (younger, middle, older), and gender (man, woman), you can form a hierarchy variable with the order age - gender. Consequently the reader can use the selection lists to get the results from younger women at one moment, just to switch and display the result of middle aged men. The reader could also compare the result from the younger women to the result of all women regardless of age, or the aggregated result from all respondents.
If we switch the order in the hierarchy variable to gender - age, the reader can compare the result from all younger women to all women regardless of age, or the aggregated result from all respondents.
• A hierarchy variable can consist of one single respondent category which, in turn, consists of sub-categories in different levels. The hierarchy variable is in that case automatically created under the data set when such respondent category is connected to the survey. For example, the category Professions can initially be divided into profession areas. There after the profession areas can be divided into smaller profession groups etc.
© Artisan Global Media
Manual 168
• A third alternative is to combine one or several respondent categories (also sub-categories) with variables (answers) from the data set. An example of such a hierarchy variable is organisation 1 - organisation 2 - gender or organisation level 1 - organisation level 2 - profession category.
Creating a hierarchy variable1. Click the button Add... in the lower left corner, and select the option
Add hierarchy variable in the menu. There is no limit regarding how many hierarchy variables you can use in a report. Every hierarchy variable could generate a new set of selection lists in the beginning of the report, depending on how you use it.
2. Name the hierarchy variable.3. Mark the checkbox Apply all filters on the hierarchy selection lists in
the report if you want the access to the survey respondent data to be limited by sub-report filter and the respondent filter of the report reader.
4. under the tab Variables, you add as many levels as you wish. For each level you select a variable, a respondent category or a sub-category from the data set of the report. Read more about how to edit the separate level in the following section, Editing a hierarchy variable.
Editing a hierarchy variable
1. Click the pen icon to the right of the hierarchy variable name beneath the data set of the report.
2. Mark the checkbox Apply all filters on the hierarchy selection lists in the report if you want the access to the survey respondent data to be limited by sub-report filters and the respondent filter of the report reader.
3. under the tab Variables, you add as many levels as you wish. For each level you select a variable, a respondent category or a sub-category from the data set of the report.
4. To edit a separate level:
1. for the level in the hierarchy you would like to edit. This gives you access to two tabs; Properties and DataSet Links.
2. Under Properties you enter how many respondent answers that are required within the respondent category to show data. This applies to each group recounted in the label list below.
© Artisan Global Media

Manual 169
3. If you have more than one data set in the report, click the tab DataSet Links. The respondent categories/variables you use in your hierarchy variable needs to be connected to their counterpart in the other data sets.
If you only have one data set in the report, skip step 4.4 to 4.8 and read further at step 4.9.
4. Under the heading for intended data set, click the pen icon
to the right of the text No match for this variable or to the right of the present links/ present variable.
5. The top tab shows which defined links between respondent categories that are available. Mark the ones you want to use for this particular level in your hierarchy variable, if you want to any. If you enter more than one definition, their links are added up to a unified definition. The definition of links is made under Administration > Respondents > Respondent Attributes > Respondent category links.
6. If you want match the level to a variable or a single respondent category instead, you choose the bottom tab Variable.
7. Select the wanted variable (a respondent category or answer) from the intended data set.
8. Note that if the report contains three or more data sets, you enter defined links/matches under every data set heading.
9. If you want to edit more levels, click Back.
, as you can see on respective level in your hierarchy variable, works as a shortcut to the tab, DataSet Links.
5. You can change the order of the levels in your hierarchy variable by pressing and holding the left mouse button in the same time as you drag a level to its new position.
6. Using the icon you can delete levels in your hierarchy variable.
7. Under the tab Preview, you can test how the selection list will work in the report and how the report reader filters the respondent data by using the lists.
8. End the editing of the hierarchy variable by clicking OK.
© Artisan Global Media
Manual 170
Delete a hierarcy variable
1. to the right of the hierarchy variable name under the data set of the report.
Report ContentWhen you create a report you select a report template that determines how the report will be presented. This menu lets you adjust the content according to your needs and wishes.
The report content is made up of the following components:
• Report item - keeps text, charts and tables that illustrate a certain question or area togetherIf you would like to dispose the report in another way is easily done by reordering the report items (see below). At the report generation, one report item is automatically created for each survey question. You are also able to create report items manually.
• Section - marks if the text/table/chart takes up the entire width or half the width of the report itemBy splitting a section in two columns it is possible to present two elements (objects) next to each other.
represents an empty section that can be converted to text/a table/a chart.
• Element - a generic term for charts, tables, hybrid elements or textEvery section can be converted to one of these.
Report ItemsWhen the report is generated, a report item for each question is created at the same time.
At the top of the first page in the report, a report item with the survey name as heading will be inserted. The report item also contains information about the Number of respondents, Number of responses and Response rate. All the content is placed in a text element and can be edited, see Editing text elements below.
Adding Report ItemsIf necessary, you can add additional report items. This can be done in two ways:
Alternative 1: Create a new, empty report item
1. Search the report item that you to want place the new item over or under.
© Artisan Global Media
Manual 171
2. The buttons and to the right of the chosen report item mean that you add a report item above respective below the existing report item. Click one of the buttons.
3. When a new report item has been created it contains a single empty section. See Adding sections if you would like to have more than one element in the report item. See Inserting elements for converting the section to text/a table/a chart.
Alternative 2: Create a new report item by selecting a variable from the data set of the report
When you create a report, a data set is formed at the same time. The answers to a question in the survey are gathered as a variable in this data set. Other variables included in the data set are for example any respondent categories connected to the survey, and respondent language (if the survey is multilingual).
1. Click the button Add additional items... in the lower right corner of the page. A pop-up window opens.
2. In the left part of the window, under the heading Available Items, you mark the check box next to the question you would like to insert. If you would like to insert a variable which is not a question, you mark the check box next to its heading, e.g. Respondent Categories.
3. In the right part of the window, under the heading Selected Items, you make sure that the check box next to the desired variable is marked. If you have marked a matrix question under Available Items, you expand the subquestions under Selected Items to view their variables and decide which to include. Matrix questions also contains a variable where all answers from all subquestions in the matrix are included.
4. Click OK. The report item is created with the content which is defined in the report template, and is inserted at the bottom of the report.
Copying Report ItemsThe report items can be copied, which can be useful if you want to present a question in two different ways and under different headings.
1. Click the button to the right of the report item you would like to copy.
and is used to cancel the copying.
Two paste buttons, and are shown next to each report item.
2. Select the report item underneath/above which you like to paste your copy.
© Artisan Global Media
Manual 172
3. Click in order to paste the copy above the selected report item.
Click in order to paste the copy under the selected report item.
An identical copy of the original report item is inserted.
Reordering Report ItemsIf necessary, you can move the report items and present them in a different order.
1. Click the Reorder button in the lower left corner of the page. The different report items are shown as large icons.
2. When you draw the normal cursor over a report item it turns into a move cursor alternatively a hand cursor. Press down the left mouse button and drag the report item into its new place.
3. Click the Reorder button again to go back to the normal mode.
Removing Report Items
1. Click on in order to remove the report item. Confirm your choice by clicking OK.
Sections
Adding SectionsIn order to be able to insert a new element (a chart, table, hybrid, or text) you first need to add a new section.
1. Click on an existing empty section, or an existing element, and select Add new above or Add new below in the menu that appears. A new section is inserted.
represents the empty section.
Splitting in two ColumnsIf you want two elements, for instance a table and a chart, to appear side by side in the report, you can divide a section into two columns.
1. Click an empty section and select Split in two columns in the menu that appears. The section is now comprised of two parts where elements can be inserted.
2. If you change your mind and would like to have one column again, you click the section and select Merge columns.
© Artisan Global Media

Manual 173
Reordering SectionsIf necessary, you can move the sections within the report item, and present them in a different order.
1. Click the button in the right part of the report item. All sections inside the report item are marked with a blue upper border.
2. When you draw the cursor over the blue upper border of a section the normal cursor turns into a move cursor alternatively a hand cursor. Press down the left mouse button and drag the section upwards or downwards into its new place.
3. Click the button again to go back to the normal mode.
Removing SectionsIt is only possible to remove empty sections. If an element has been inserted into the section, you first need to remove it, see Removing elements below.
1. and select Remove. Confirm by clicking OK.
ElementsElement is an umbrella term for tables, charts, hybrids, and text. The tables and charts let you present the results, whereas the text elements are used for commenting on and explaining the result.
Inserting ElementsIn order to insert a new element (a table, chart, hybrid, or text) you need to start from a section. (See Adding sections above, if needed.)
1. and select Add text item, Add table item, Add chart item, or Add hybrid element from the shown menu. You will automatically get to the edit mode for this element, see Editing Elements below.
Editing ElementsYou can read about editing under:
• Report Content > Editing tables
• Report Content > Editing charts
• Report Content > Editing hybrid elements
For Text elements the edit mode consists of an editor where you can write and format text as well as insert images and links. Click on Save when you have finished.
© Artisan Global Media
Manual 174
Removing Elements1. Click the element and select Remove in the shown menu. Confirm
by clicking OK.
Editing TablesWhen you are in edit mode, the interface is divided into: Settings, Limits, Series, Background series, Filter series and Preview.
Under Settings you can enter a Title, if you want one to be displayed above the table. You can also open an interface that lets you format the title by
clicking on the icon. The Type drop down list then lets you select which type of table you wish to use. See the sections on Frequency tables, Statistical tables, Data tables and Change below for more information on the different types of tables and their settings.
Under Limits you enter how many answers are required in order to show the variable (the result of a question) in this table. It gives you the possibility to differ from the report default.
Series and Background series let you select which question or questions are to be presented in the table, and Filter series lets you select which respondents' answers will be displayed. See Series, Background series and Filter series below for more information.
Under Preview you get an instant preview of the changes you make.
Click on Save to confirm the changes or Cancel if you wish to discard them and return to the overview mode.
Frequency TablesIf you wish to create a frequency table, select Frequency in the Type drop down list under Settings. The following results can be displayed in the frequency table:
• Number of responses
• Distribution (%)
• Cumulated number of responses
• Cumulated distribution (%)
Select which results are to be displayed in the table by ticking the corresponding check boxes in the Fields section.
Summation mode lets you select the settings that apply to cross tabulations where the Distribution or Cumulated distribution is presented. The cross tabulation displays the sum of each row and column, as well as the sum total in the bottom right corner. The setting determines where the distribution sum is to be displayed as 100 %; in the sum for each Column, Row or the Total. In order to make a cross tabulation you need to add a background series, see Series below. Below you will also find information on how to display a summation column to the right of the cross tabulation.
Specify the Number of decimal digits used in the table.
© Artisan Global Media

Manual 175
Statistical TablesTo create a statistical table, select Statistical in the Type drop down list under Settings. The following results can be displayed in a statistical table:
• Min
• Max
• Mean
• Median
• Lower quartile
• Upper quartile
• Standard deviation
• Coefficient of variation
Select which results are to be displayed in the table by clicking the corresponding check boxes in the Fields section.
Specify the Number of decimal digits used in the table.
Data TablesThis type of table is suitable for presenting variables where the respondent has given textual answers, for instance to Text field questions, blank answer options ("If other, please specify") or for comments. Select Data in Type the drop down list under Settings to create a list of this kind.
You can specify how many answers are to be displayed in the report. If the number you select is lower than the total number of answers available, the number of displayed answers compared with the total number of available answers will be displayed below the table.
Change TablesIn SR-Advanced Report, you can also select the table type Change. This table type is used to show how the result of a question has changed from one survey to another. The table type requires at least one series and one background series. Please see the section Reports > Dataset on how to create and set up so-called Compare data set, where two or more surveys with corresponding questions are linked together. This needs to be done before you create a change table.
A change table is only displaying changes in the arithmetical mean value. This means if you compare questions without sub questions in a report e.g. Single-Choice or Multiple-Choice questions, only the arithmetical means of the cumulated answers will be compared and you will get a table similar to the following.
© Artisan Global Media
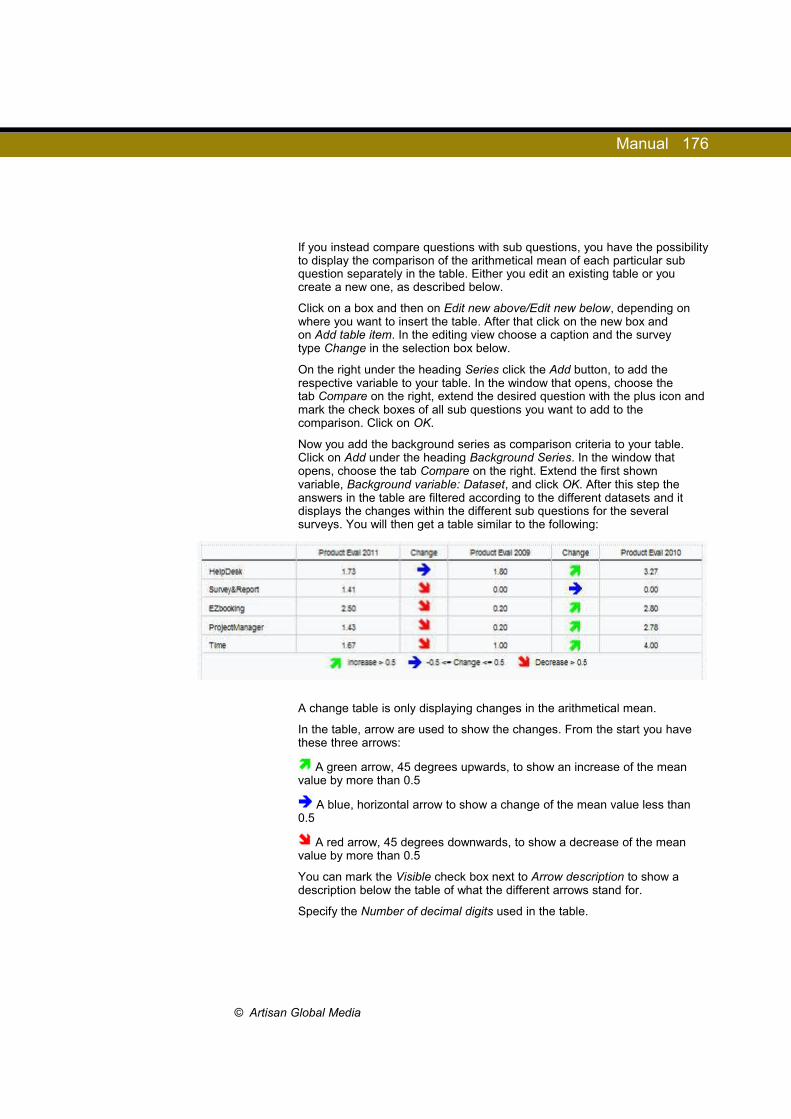
Manual 176
If you instead compare questions with sub questions, you have the possibility to display the comparison of the arithmetical mean of each particular sub question separately in the table. Either you edit an existing table or you create a new one, as described below.
Click on a box and then on Edit new above/Edit new below, depending on where you want to insert the table. After that click on the new box and on Add table item. In the editing view choose a caption and the survey type Change in the selection box below.
On the right under the heading Series click the Add button, to add the respective variable to your table. In the window that opens, choose the tab Compare on the right, extend the desired question with the plus icon and mark the check boxes of all sub questions you want to add to the comparison. Click on OK.
Now you add the background series as comparison criteria to your table. Click on Add under the heading Background Series. In the window that opens, choose the tab Compare on the right. Extend the first shown variable, Background variable: Dataset, and click OK. After this step the answers in the table are filtered according to the different datasets and it displays the changes within the different sub questions for the several surveys. You will then get a table similar to the following:
A change table is only displaying changes in the arithmetical mean.
In the table, arrow are used to show the changes. From the start you have these three arrows:
A green arrow, 45 degrees upwards, to show an increase of the mean value by more than 0.5
A blue, horizontal arrow to show a change of the mean value less than 0.5
A red arrow, 45 degrees downwards, to show a decrease of the mean value by more than 0.5
You can mark the Visible check box next to Arrow description to show a description below the table of what the different arrows stand for.
Specify the Number of decimal digits used in the table.
© Artisan Global Media

Manual 177
Editing ArrowsYou can edit the colour and angle of the arrows, and decide if they should be used to show an increase, a decrease or a change within a given range.
Select a colour by clicking the coloured square, or by entering the colour code.
Enter a value for the angle of the arrow. The value 0 gives a horizontal arrow, a positive value gives an arrow pointing upwards and a negative value gives an arrow pointing downwards. For example, the value -90 gives a vertical arrow pointing downwards.
In the Type selection list, you select if the arrow should display an increase, a decrease or a change within a range. In the field below, specify the conditions for when the arrow should be displayed. For increases and decreases, enter a value that the increase/decrease should exceed. If Range is selected, enter a range that the change should be within. Ensure that there are no “gaps”, i.e. that there are no values not covered by the conditions. If this is the case, the value itself will be displayed in the table instead of an arrow.
Adding and Removing ArrowsIf you want to have more arrows, e.g. to show increases or decreases of different degrees, you click the Add arrow button. When you have added the arrow, it can be edited as described above.
To remove an arrow, you click the button.
SeriesWhen you create a report, a data set is created where the questions from the survey are converted into so-called variables. A survey question can comprise several variables.
• The question itself
• A blank answer option
• Comments, if a comment field was included in the question.
The variables can be processed in several different ways, see the Data set section for more information. When a variable is presented visually in a report it is called a series.
When the report was created, each survey question comprised a report item, and the variables of the question were inserted to the elements in the report items. They are listed under Series and are named Series 1, Series 2 and so
on. If the check box is ticked, the series is active and displayed in the table.
© Artisan Global Media
Manual 178
Settings for Series
When you click the arrow the series is expanded and the following headings are displayed:
Source - the question that is the series' source. By clicking on you open the pop-up window Edit variable where you can change the wording of the question title as well as its answer options. Make the changes directly in the fields provided and confirm by clicking OK.
Title - here you can edit the title that is displayed in the top left corner of the
table. Click on to format the text.
Labels
• Tick the check box next to the answer options you wish to display in the table. Tick the check box at Select All to mark/unmark all check boxes.
• In addition you are able to use the labels (Not-answered) and (Answered). These labels are the complement of each other and aggregated correspond to the number of respondents who have answered the survey.
• The label (Not-answered) refers to the respondents who have answered the survey but have left this certain question unanswered.
• The label (Answered) refers to the respondents who have answered the question. The difference between the label (Answered) and the row Total is that the later only add up the result of the answer alternatives displayed in the table.
Adding SeriesIf you wish to present more questions in connection with the table you click the Add... button. This will open a window that displays all the survey questions in a tree structure. Click on the plus icon next to a question to expand it. If you expand a matrix question, all of its subquestions will be displayed. The subquestions can also be expanded. Further down, a list of any respondent categories that have been connected to the survey is displayed and, if the survey is multilingual, also the
variable Multilingual > Respondent languages. You can click on to expand the entire tree structure. All of a question's variables are displayed under each question. Mark the check box next to the variable you wish to add. At the bottom left of the page, you also select whether the variables are to be added to all elements in the Report item or just to the Current element. Click OK. The new series will be displayed in the list and in a new table that is displayed below the existing one in the preview. Each series is thus presented in a separate table.
© Artisan Global Media

Manual 179
Background SeriesIt is possible to cross tabulate a question with a different question in a cross table. You add the cross tabulation question under background series in a process that works the same way as was described in Adding series above. When you have added a series, it is displayed in the list, and the table under Preview is updated and now displays a cross table.
General Background SeriesWhen you click on Report content, a page is displayed with an overview of the content as well as the Manage background series button. Click this button to add a general background series that will then be used for all questions. This means you do not have to add it for each individual report item.
In the window that opens, all the survey's questions are displayed in a tree structure. Click on the plus sign next to a question to expand it. If you expand a matrix question, all its subquestions will be displayed. The subquestions can also be expanded. Further down you will find a list of any respondent categories that have been connected to the survey and, if the survey is multilingual, also the variable Multilingual > Respondent languages. You can
click on to expand the entire tree. Under each question and respondent category, all its respective variables are displayed. Mark the check box next to the variable you wish to use as a general background series in the report. It will then be added as a background series in all the tables and charts in the report, and it will be marked as active.
If you no longer wish to use the general background series, click on Manage background series again and select No general background series. The background series will then be deactivated for all tables and charts.
Settings for Background Series
Source - the question that is the series' source. By clicking on you open the pop-up window Edit variable where you can change the wording of the question title and the answer options. Make the changes directly in the fields provided and confirm by clicking OK.
Title - here you can edit the title that will be displayed as a heading for the
columns in the cross table. Click on to format the text.
Labels
• Tick the check box next to the answer options you wish to display as columns in the cross table. Tick the check box at Select All to mark/unmark all check boxes.
© Artisan Global Media

Manual 180
• In addition you are able to use the labels (Not-answered) and (Answered). These labels are the complement of each other and aggregated correspond to the number of respondents who have answered the survey.
• The label (Empty) means that you can let the respondents that have left a certain question unanswered form a group which you can study when it comes to another question.
• The label (Total) refers to the group of respondents that has answered a certain question. This group could also be studied separately when it comes to another question.
Settings - by ticking the check box next to Include summation column you add a column with the heading Total on the far right in the cross table. It adds up all columns to the left.
© Artisan Global Media

Manual 181
Filter SeriesThe Distribution and subreports menu lets you create so-called subreports, e.g. reports that only display the answers from selected respondents. A subreport filters the entire report with all its questions, but you can also use series to filter individual tables and charts. If you, for instance only want to display answers from females, you can use the Sex variable as a filter series.
You add the variables you want to use for filtering under Filter series. Follow the instructions under Adding series, above, to do this.
Settings for Filter Series
Source - by clicking you open the Edit variable pop-up window which lets you change the wording of the question title and its answer options. Make the changes directly in the field provided and confirm with OK.
Title - this field is not used for Filter series.
Labels
• Select what you want to display by marking the check boxes for the options of your choice. Tick the check box at Select All to mark/unmark all check boxes. If you, for instance, only want to display answers from women, you unmark the check box at Male and leave the check box at Female as it is.
• In addition you are able to use the labels (Not-answered) and (Answered). These labels are the complement of each other and aggregated correspond to the number of respondents who have answered the survey.
• The label (Not-answered) means that you can let the respondents that have left a certain question unanswered be filtered out from the result of another question.
• The label (Answered) means that you can let the respondents that have answered a certain question be filtered out from the result of another question.
Editing chartsThe chart edit mode provides you with an interface that has been divided into the following sections: Chart settings, Limits, Axes, Series, Background series, Filter series and Preview.
Under Series and Background series you determine which question or questions are to be presented in the chart, and under Filter series you specify which respondents' answers are to be displayed. See the sections on Series, Background series and Filter series below for more information.
Under Preview at the bottom of the page you get an instant preview of any changes you make.
Click on Save to confirm the changes, or Cancel if you wish to discard them and return to overview mode without saving.
© Artisan Global Media
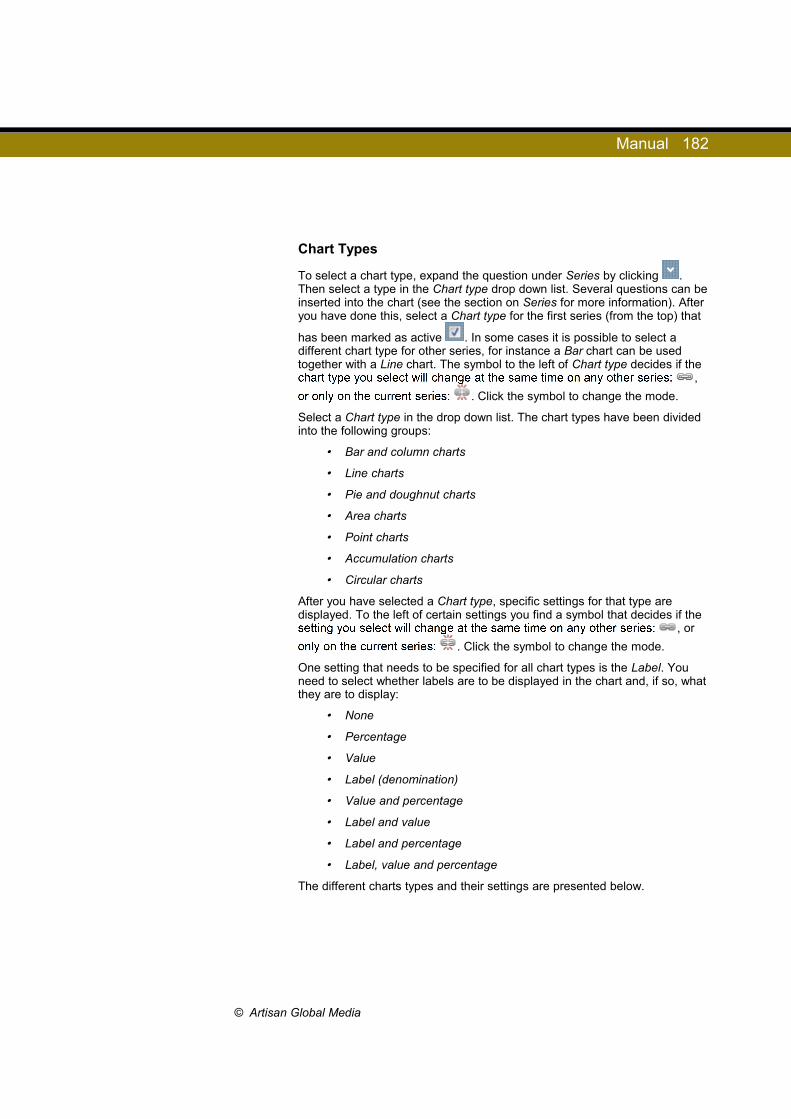
Manual 182
Chart Types
To select a chart type, expand the question under Series by clicking . Then select a type in the Chart type drop down list. Several questions can be inserted into the chart (see the section on Series for more information). After you have done this, select a Chart type for the first series (from the top) that
has been marked as active . In some cases it is possible to select a different chart type for other series, for instance a Bar chart can be used together with a Line chart. The symbol to the left of Chart type decides if the
,
. Click the symbol to change the mode.
Select a Chart type in the drop down list. The chart types have been divided into the following groups:
• Bar and column charts
• Line charts
• Pie and doughnut charts
• Area charts
• Point charts
• Accumulation charts
• Circular charts
After you have selected a Chart type, specific settings for that type are displayed. To the left of certain settings you find a symbol that decides if the
, or
. Click the symbol to change the mode.
One setting that needs to be specified for all chart types is the Label. You need to select whether labels are to be displayed in the chart and, if so, what they are to display:
• None
• Percentage
• Value
• Label (denomination)
• Value and percentage
• Label and value
• Label and percentage
• Label, value and percentage
The different charts types and their settings are presented below.
© Artisan Global Media
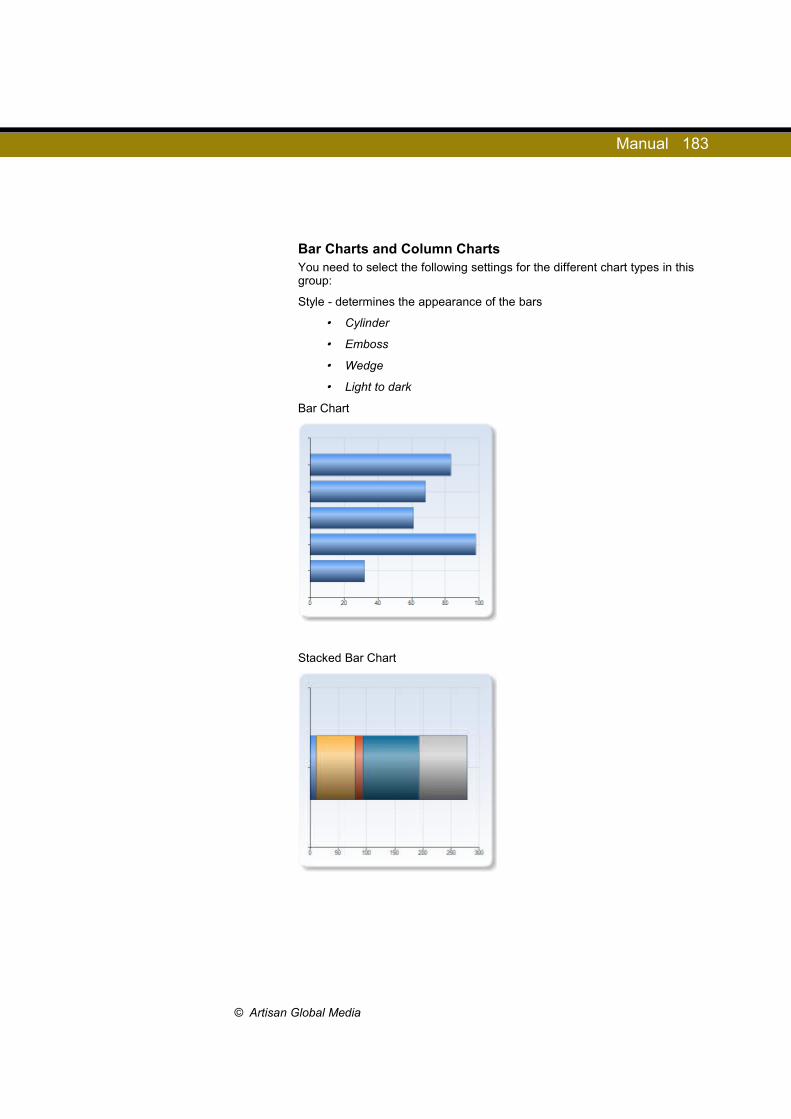
Manual 183
Bar Charts and Column ChartsYou need to select the following settings for the different chart types in this group:
Style - determines the appearance of the bars
• Cylinder
• Emboss
• Wedge
• Light to dark
Bar Chart
Stacked Bar Chart
© Artisan Global Media

Manual 184
Stacked Bar Chart 100%
Column Chart
Stacked Column Chart
© Artisan Global Media
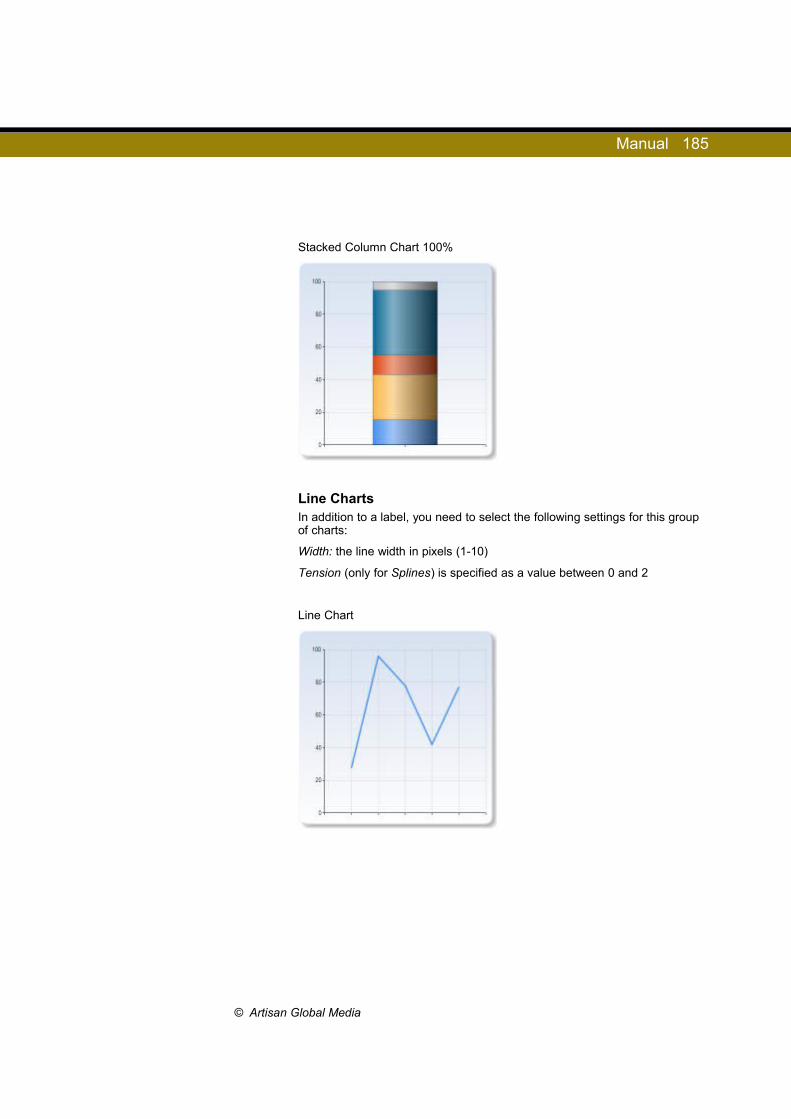
Manual 185
Stacked Column Chart 100%
Line ChartsIn addition to a label, you need to select the following settings for this group of charts:
Width: the line width in pixels (1-10)
Tension (only for Splines) is specified as a value between 0 and 2
Line Chart
© Artisan Global Media
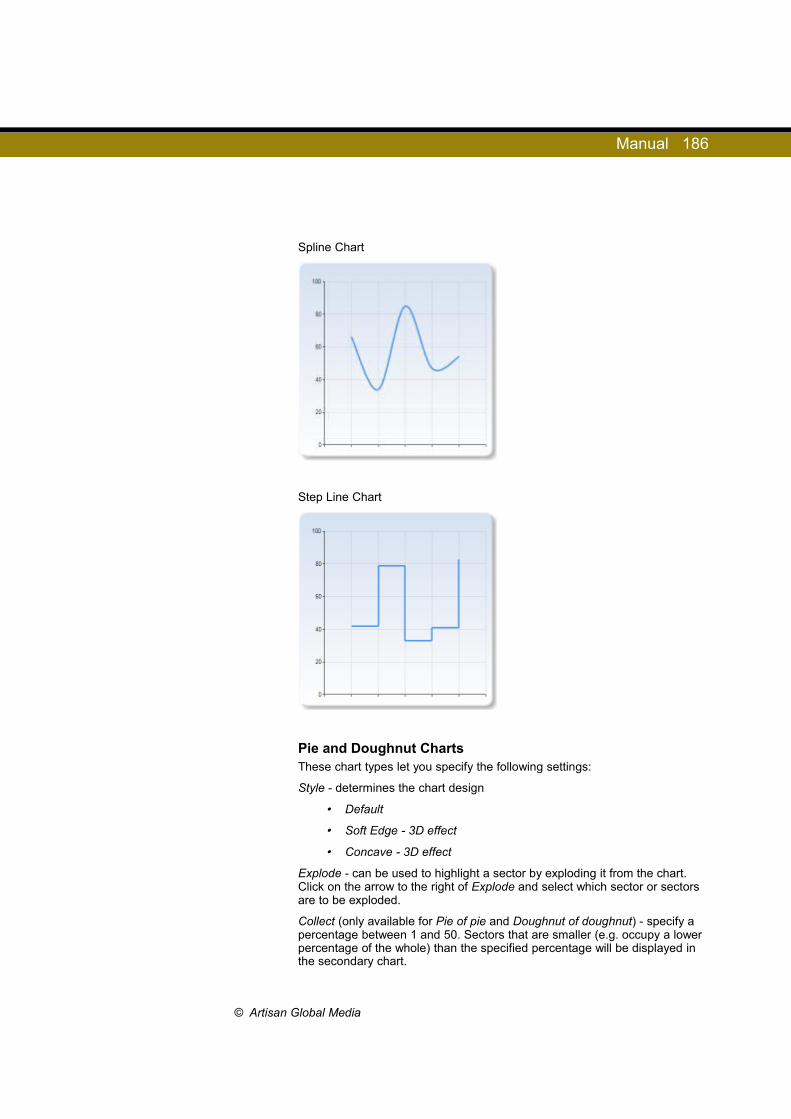
Manual 186
Spline Chart
Step Line Chart
Pie and Doughnut ChartsThese chart types let you specify the following settings:
Style - determines the chart design
• Default
• Soft Edge - 3D effect
• Concave - 3D effect
Explode - can be used to highlight a sector by exploding it from the chart. Click on the arrow to the right of Explode and select which sector or sectors are to be exploded.
Collect (only available for Pie of pie and Doughnut of doughnut) - specify a percentage between 1 and 50. Sectors that are smaller (e.g. occupy a lower percentage of the whole) than the specified percentage will be displayed in the secondary chart.
© Artisan Global Media

Manual 187
Label style - If you have specified that labels are to be displayed, you also need to determine where the labels are to be placed.
• Inside - inside the sector
• Outside - outside the sector
Pie Chart
Pie of Pie Chart
© Artisan Global Media

Manual 188
Doughnut Chart
Doughnut of Doughnut Chart
© Artisan Global Media

Manual 189
Area ChartsFor this group, there is only one specific setting and it only applies to Spline area charts:
Tension is specified as a value between 0 and 2.
Area Chart
Stacked Area Chart
© Artisan Global Media
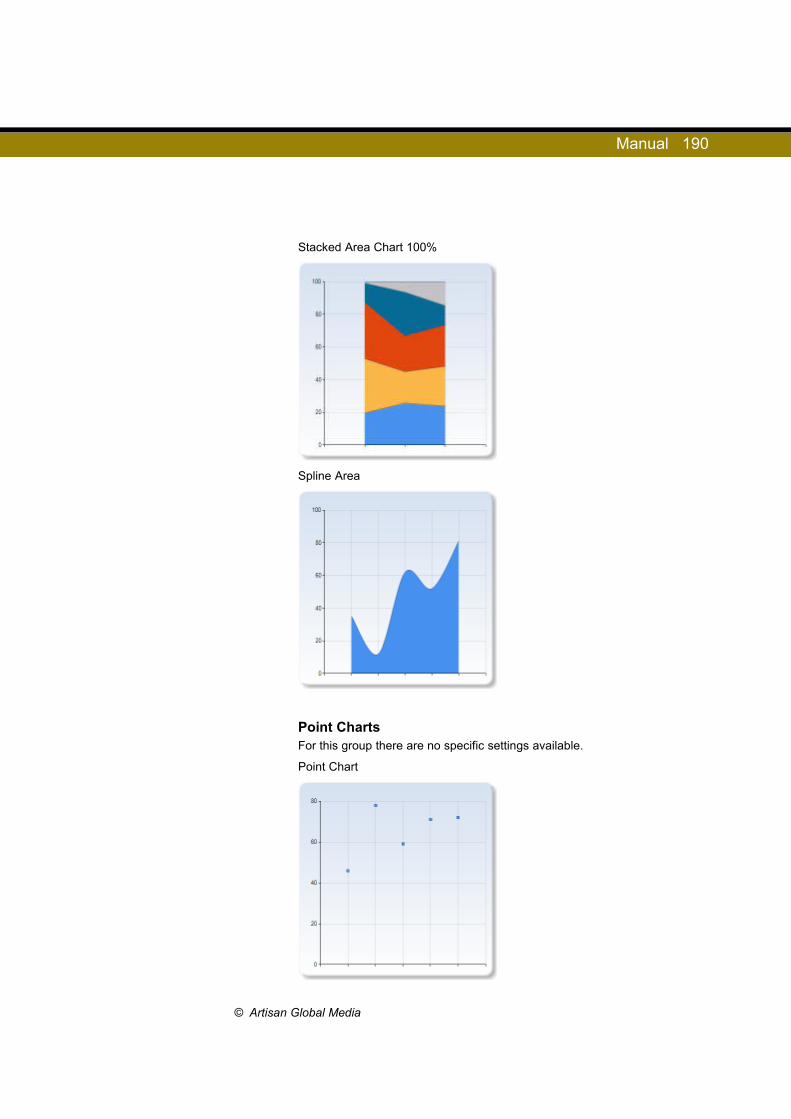
Manual 190
Stacked Area Chart 100%
Spline Area
Point ChartsFor this group there are no specific settings available.
Point Chart
© Artisan Global Media

Manual 191
Bubble Chart
AccumulationThere are no specific settings available for this group.
Pyramid Chart
Funnel Chart
© Artisan Global Media
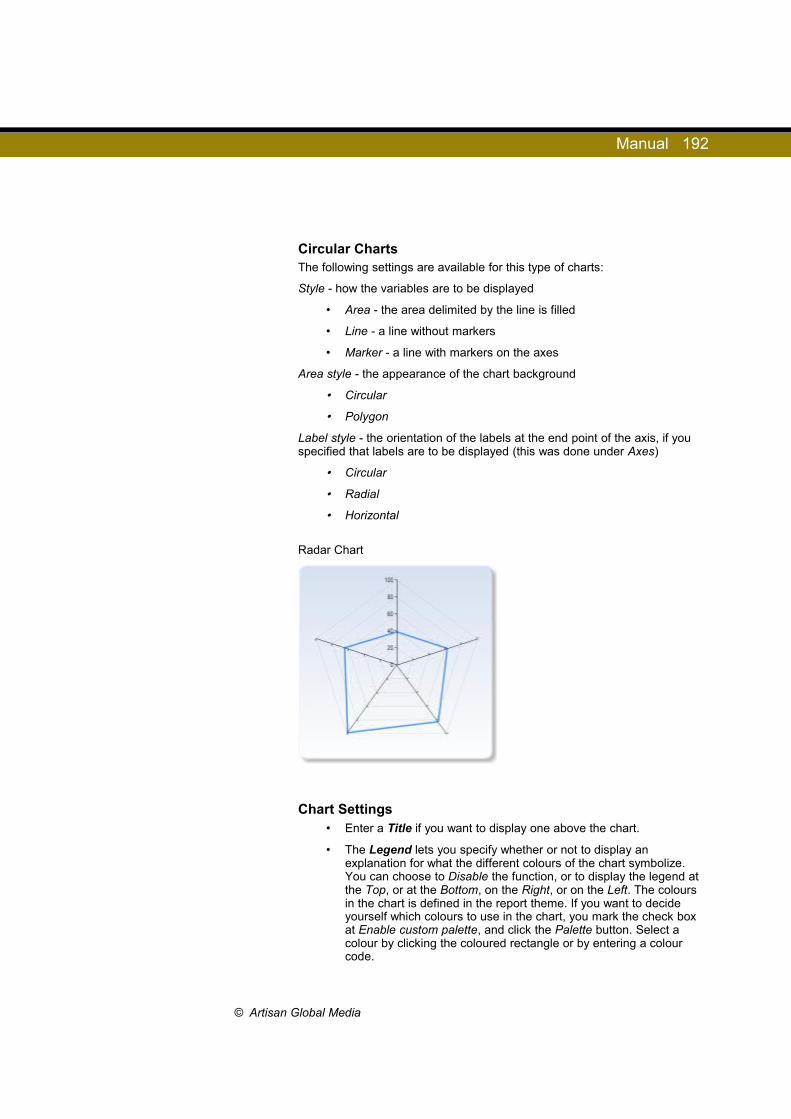
Manual 192
Circular ChartsThe following settings are available for this type of charts:
Style - how the variables are to be displayed
• Area - the area delimited by the line is filled
• Line - a line without markers
• Marker - a line with markers on the axes
Area style - the appearance of the chart background
• Circular
• Polygon
Label style - the orientation of the labels at the end point of the axis, if you specified that labels are to be displayed (this was done under Axes)
• Circular
• Radial
• Horizontal
Radar Chart
Chart Settings• Enter a Title if you want to display one above the chart.
• The Legend lets you specify whether or not to display an explanation for what the different colours of the chart symbolize. You can choose to Disable the function, or to display the legend at the Top, or at the Bottom, on the Right, or on the Left. The colours in the chart is defined in the report theme. If you want to decide yourself which colours to use in the chart, you mark the check box at Enable custom palette, and click the Palette button. Select a colour by clicking the coloured rectangle or by entering a colour code.
© Artisan Global Media
Manual 193
Click the button if you want to reset the palette to its original colours.
• By ticking the check box Allow automatic layout improvements you ascertain that the program automatically makes certain changes to improve the layout of the chart. The changes can for instance be: moving the Legend to a more suitable place, converting large numbers into thousands or shortening long labels.
• Type lets you select what to display in the chart: Frequency (number of responses) or Mean. Here you can also select the specific chart type Positioning Map (see below).
• The Percentage Mode setting applies to charts that contain a background series, and where you have chosen to show Percentage as labels in the chart. The setting determines on which level the summation of the percentage values should be 100%: Columns, Rows or Total.
• Specify the Number of decimal digits used for the labels of the chart.
• If you select Reversed at Data Order, the answer options will be displayed in reverse order.
• By marking the Switched check box next to Rows/Cols, you move data from the X-axis to the Y-axis, and vice versa. This is useful in charts where you have a primary series and a background series. You can then switch places of the series and display the background series, instead of the primary series, on the X-axis. In charts where you have only a primary series, you can mark the check box if you want to display the question's answer options with different colours.
• This setting only makes a difference in the chart types Pie and Doughnut. The colours for different answer options are assigned to labels shown in the chart accordingly to the palette used in the report theme. The labels that do not have any result, i.e. no one has selected that answer option, are skipped at the colour allocation. This could mean that when comparing two charts, the same label is represented by different colours in the two charts, which is delusive. By marking Yes at Show empty labels in the legend, you avoid this situation. All labels, even those with the result 0, will exist in the legend and will be represented by the same colour in both charts.
• By adjusting the value specified at Aspect you can change the proportions of the chart height and width. The available value span is 0.2 - 4, where 1 means that the height and width are the same. The chart width depends on the section in which it is located, and thus takes up either the entire width of the report, or half the width of the report.
• Mark the check box at 3D to display the chart in a 3D format.
© Artisan Global Media
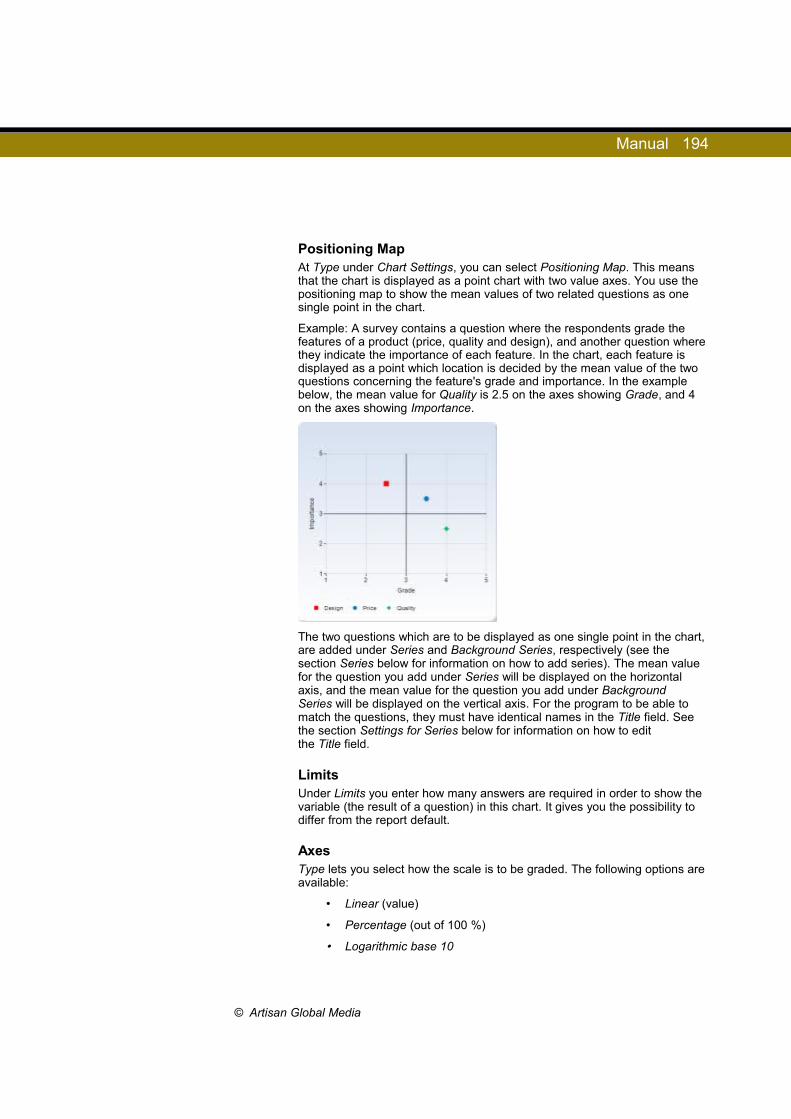
Manual 194
Positioning MapAt Type under Chart Settings, you can select Positioning Map. This means that the chart is displayed as a point chart with two value axes. You use the positioning map to show the mean values of two related questions as one single point in the chart.
Example: A survey contains a question where the respondents grade the features of a product (price, quality and design), and another question where they indicate the importance of each feature. In the chart, each feature is displayed as a point which location is decided by the mean value of the two questions concerning the feature's grade and importance. In the example below, the mean value for Quality is 2.5 on the axes showing Grade, and 4 on the axes showing Importance.
The two questions which are to be displayed as one single point in the chart, are added under Series and Background Series, respectively (see the section Series below for information on how to add series). The mean value for the question you add under Series will be displayed on the horizontal axis, and the mean value for the question you add under Background Series will be displayed on the vertical axis. For the program to be able to match the questions, they must have identical names in the Title field. See the section Settings for Series below for information on how to edit the Title field.
LimitsUnder Limits you enter how many answers are required in order to show the variable (the result of a question) in this chart. It gives you the possibility to differ from the report default.
AxesType lets you select how the scale is to be graded. The following options are available:
• Linear (value)
• Percentage (out of 100 %)
• Logarithmic base 10
© Artisan Global Media

Manual 195
• Logarithmic base 2
• Logarithmic base e
If you tick the check box Automatic at Scale, the grades of the scale will automatically be adjusted to include the highest value. If you do not tick the check box you need to specify the minimum and maximum values as well as the steps under Min, Max and Step.
If the setting Adjust automatically at Font size is activated, the font size of the labels may be decreased automatically. If you want the labels to retain its full font size, you unmark this check box, and if necessary also the check box Allow automatic layout improvements under Chart Settings.
X-Axis:
• Display labels
• Reverse axis - the X-axis is written downwards, the Y-axis goes to the upper side of the chart
• Show advanced settings
• Title - explicating text along the X-axis
• Labels:
• Stagger - every second label is drawn to the left in order to increase the readability
• Truncate - the labels may be truncated
• Next to the axis - concerns the chart type Positioning mapThe labels of the horizontal axis are as default displayed below the chart. By marking the check box, the labels are displayed next to the horizontal axis instead.
• Font size - using the slider you can adjust the font size of the label from 10 % to 200 % compared to the default size
• Angle - if you have not marked the option Stagger you can angle the labelsUsing the slider, you set how many degrees to the right the labels should decline. A negative amount means that the labels declines to the left.
© Artisan Global Media

Manual 196
Y-Axis:
• Display labels
• Allow Scale Breaks - cuts the middle part of the scale in order to improve the readability in charts with a large difference between high and low values (see the picture below)
• Reverse axis - the Y-axis is written from the left to the right, the X-axis goes to the right side of the chart
• Show advanced settings
• Title - explicating text along the Y-axis
• Labels:
• Stagger - every second label is drawn downwards in order to increase the readability
• Truncate - the labels may be truncated
• Next to the axis - concerns the chart type Positioning mapThe labels of the horizontal axis are as default displayed below the chart. By marking the check box, the labels are displayed next to the horizontal axis instead.
• Font size - using the slider you can adjust the font size of the label from 10 % to 200 % compared to the default size
• Angle - if you have not marked the option Stagger you can angle the labelsUsing the slider, you set how many degrees to the right the labels should decline. A negative amount means that the labels declines to the left.
© Artisan Global Media

Manual 197
SeriesWhen you create a report, a data set is created where the questions from the survey are converted into so-called Variables. A survey question can comprise several variables.
• The question itself
• A blank answer option (e.g. "If other, please specify") if the question contains one
• Comments, if a comment field was included in the question.
The variables can also be processed and recoded in several different ways, see the Data set section for more information. When a variable is presented visually in a report it is called a series.
When the report was created, each survey question comprised a report item, and the variables of the question were inserted to the elements in the report items. They are listed under Series and are named Series 1, Series 2 and so
on. If the check box is ticked, the series is active and displayed in the chart.
Settings for Series
When you click the arrow the series is expanded and the following headings are displayed:
Source - the question that is the source of the series. By clicking on you open the pop-up window Edit variable where you can change the wording of the question title as well as its answer options. Make the changes directly in the fields provided and confirm your changes by clicking OK.
Title - here you can edit the title that is displayed as the name of the series in
the legend. Click on to format the text.
The settings concerning each chart type are described in detail under Chart types, above.
Labels
• Tick the check box next to the answer options you wish to display in the chart. Tick the check box at Select All to mark/unmark all check boxes.
• In addition you are able to use the labels (Not-answered) and (Answered). These labels are the complement of each other and aggregated correspond to the number of respondents who have answered the survey.
• The label (Not-answered) refers to the respondents who have answered the survey but have left this certain question unanswered.
• The label (Answered) refers to the respondents who have answered the question, regardless of which alternative they have selected.
© Artisan Global Media

Manual 198
Adding SeriesIf you wish to present more questions in the chart you click the Add... button. This will open a window that displays all the survey questions in a tree structure. Click on the plus icon next to a question to expand it. If you expand a matrix question, all of its subquestions will be displayed. These can also be expanded. Further down, a list of any respondent categories that have been connected to the survey is displayed and, if the survey is multilingual, also
the variable Multilingual > Respondent languages. You can also click on to expand the entire tree at once.
All the variables for each question are displayed below each question title. Mark the check box next to the variable you wish to add. Then, at the bottom left of the page, select whether the variable is to be added to all elements in the Report item or just to the Current element. Click OK. The new series will be displayed in the list and the chart will be updated to include the new series.
You can expand the new series by clicking . You can then select various different settings for it. The chart type is usually determined by the first series
(from the top) that has been marked as active, . Sometimes it is possible to select another chart type for other series, for instance a column chart can be combined with a line chart.
Background SeriesIt is possible to cross tabulate a question with another question and display the results in a chart. You add the question you want to use for your cross tabulation under Background series. This is done in the same way as described under Adding series above. When you have added a series, it is displayed in the list, and the chart under Preview is updated. The new chart may look like the image below.
© Artisan Global Media
Manual 199
General Background SeriesWhen you click on Report content, a page is displayed with an overview of the content as well as the Manage background series button. Click this button to add a general background series that will then be used for all questions. This means you do not have to add it for each individual report item.
In the window that opens, all the survey's questions are displayed in a tree structure. Click on the plus sign next to a question to expand it. If you expand a matrix question, all its subquestions will be displayed. The subquestions can also be expanded. Further down you will find a list of any respondent categories that have been connected to the survey and, if the survey is multilingual, also the variable Multilingual > Respondent languages. You can
also click on to expand the entire tree. Under each question and respondent category, all its respective variables are displayed. Mark the check box next to the variable you wish to use as a general background series in the report. It will then be added as a background series in all the tables and charts in the report, and it will be marked as active.
If you no longer wish to use the general background series, click on Manage background series again and select No general background series. The background series will then be deactivated for all tables and charts.
Settings for Background Series
Source - the question that is the series' source. By clicking on you open the pop-up window Edit variable where you can change the wording of the question title and the answer options. Make the changes directly in the fields provided and confirm by clicking OK.
Title - this field is not used for Background series.
Labels
• Tick the check box at the answer options you wish to display in the chart. Tick the check box at Select All to mark/unmark all check boxes.
• In addition you are able to use the labels (Not-answered) and (Answered). These labels are the complement of each other and aggregated correspond to the number of respondents who have answered the survey.
• The label (Not-answered) means that you can let the respondents that have left a certain question unanswered form a group which you can study when it comes to another question.
• The label (Answered) refers to the group of respondents that have answered a certain question. This group could also be studied separately when it comes to another question. The example in the next page displays the results of the female respective the male to compare with the total result regardless of gender.
© Artisan Global Media

Manual 200
Filter SeriesThe Distribution and subreports menu lets you create so-called subreports, e.g. reports that only display the answers from selected respondents. A subreport filters the entire report with all its questions, but you can also use series to filter individual tables and charts. If you, for instance only want to display answers from females, you can use the Sex variable as a filter series.
You add the variables you want to use for filtering under Filter series. Follow the instructions under Adding series, above, to do this.
Settings for Filter Series
Source - by clicking you open the Edit variable pop-up window which lets you change the wording of the question title and its answer options. Make the changes directly in the field provided and confirm by clicking OK.
Title - this field is not used for Filter series.
© Artisan Global Media
Manual 201
Labels
• Mark the selection you wish to use by ticking the appropriate check boxes. Tick the check box at Select All to mark/unmark all check boxes. If you, for instance, only want to display women's answers, you unmark the check box at Male and leave the check box at Female as it is.
• In addition you are able to use the labels (Empty) and (Total). These labels are the complement of each other and aggregated correspond to the number of respondents who have answered the survey.
• The label (Not-answered) means that respondents who have left a certain question unanswered can be filtered out from the result of another question.
• The label (Answered) means that you can let the respondents that have answered a certain question be filtered out from the result of another question.
Editing Hybrid ElementsThe page for editing hybrid elements is divided into four areas; Settings, Properties, Preview and a fourth area where you build the element structure in rows and columns.
Settings for the hybrid element
1. Write the title of this hybrid element. Use the editor if you would like to format the title. (optional)
2. The different elements of a report do not have to use the same hierarchy variable.
Click the pen icon and choose which one of the hierarchy variables in the data set you would like to use for this particular element. Sometimes a hybrid element is used merely to present a combination of table and chart. If that is the case you do not have to choose any hierarchy variable at all.
3. Using the radio buttons at Position in hierarchy, you are able to lock the hybrid element into a fixed position. In that case, select the option Predefined selection below. The element will accordingly not follow the selection in the selection lists, made by the report reader.
The Structure of the Hybrid ElementInitially the report element consists of two columns and one row. The left column is intended for explanatory texts. In the right column you present data, either in table or chart form.
Using the icons , you add as many rows and columns you wish, in the structure.
© Artisan Global Media
Manual 202
Editing a Column in the Hybrid Element
1. Click the pen icon or the column head itself in order to edit the column.
2. In the right part of the window, under the heading Properties, you are able to decide both the content and the feature.
Enter for all column types:
• Column Title - a heading or text which will be written atop of the column
• Column Type - Select if the column is to be used as a Chart (bar chart), Table, Text, or Title. The difference between the type Text and Title is the placement of the text in the cell. Text means that the texts are written bottommost, to the left in the cell while Title means that the texts are written centred, to the right.
• Column Width - Set as a number between 0 and 100 in relation to the width of other columns. For example, the column width 10 for column A and 10 for column B give the same result as the column width 20 for column A and 20 for column B.
• Format - Set if you want texts to be written in bold type and if word wrapping is allowed.
Chart or table type columns
1. Set what kind of data the column is to contain; Frequency, Calculations, or Analysis.
• Frequency shows how the answers to a certain question allocates among the different options. You can choose to show the number of answers directly or converted into percent. The percent alternative is calculated as the number of answers for the specific option compared to the number of answers for all options put together.
• Calculations: You can present the sum, mean, standard deviation, confidence interval, or coefficient of variation calculated for a specific question.
• Analysis: In the data set you can perform other calculations than them mentioned under Calculations. If you want to present that kind of calculations, you choose Analyse Function. Read more about analyse functions on the page Data Set.
2. The checkbox Apply all report filters is premarked. If the column is to contain answers from respondents that normally are sieved away by the subreport or the respondent filter of the report reader, you can make an exception from all filters for this column. For example, if a report reader is allowed to see results from department A and department B in the same time as you would like to show the result of the entire company, Total will show the sum of department A and B when the checkbox is marked. First when you take the marking away, Total will show the entire company as you planned.
© Artisan Global Media
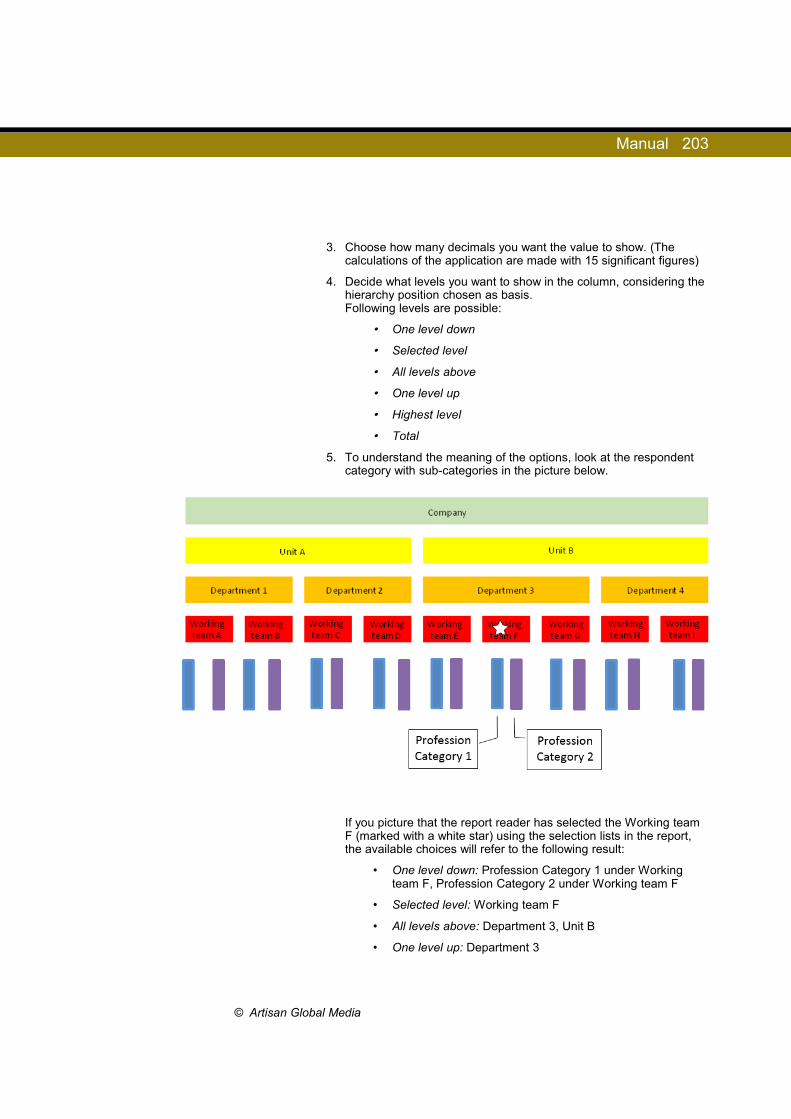
Manual 203
3. Choose how many decimals you want the value to show. (The calculations of the application are made with 15 significant figures)
4. Decide what levels you want to show in the column, considering the hierarchy position chosen as basis. Following levels are possible:
• One level down
• Selected level
• All levels above
• One level up
• Highest level
• Total
5. To understand the meaning of the options, look at the respondent category with sub-categories in the picture below.
If you picture that the report reader has selected the Working team F (marked with a white star) using the selection lists in the report, the available choices will refer to the following result:
• One level down: Profession Category 1 under Working team F, Profession Category 2 under Working team F
• Selected level: Working team F
• All levels above: Department 3, Unit B
• One level up: Department 3
© Artisan Global Media
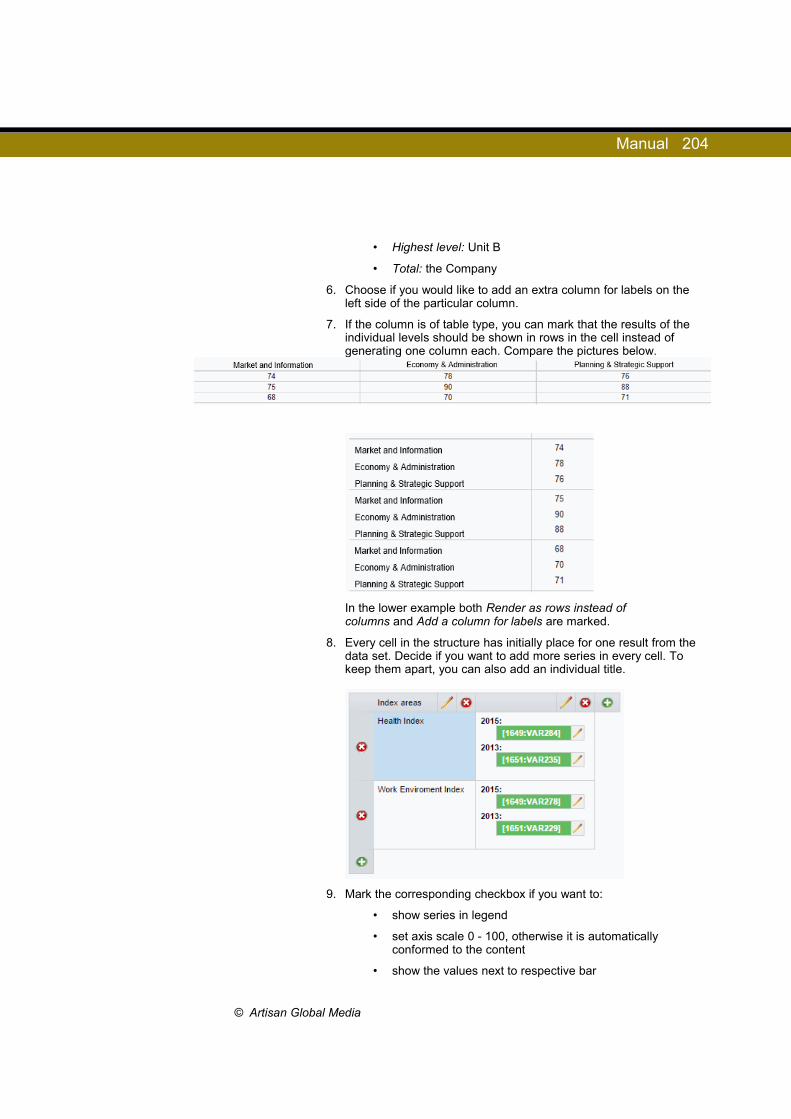
Manual 204
• Highest level: Unit B
• Total: the Company
6. Choose if you would like to add an extra column for labels on the left side of the particular column.
7. If the column is of table type, you can mark that the results of the individual levels should be shown in rows in the cell instead of generating one column each. Compare the pictures below.
In the lower example both Render as rows instead of columns and Add a column for labels are marked.
8. Every cell in the structure has initially place for one result from the data set. Decide if you want to add more series in every cell. To keep them apart, you can also add an individual title.
9. Mark the corresponding checkbox if you want to:
• show series in legend
• set axis scale 0 - 100, otherwise it is automatically conformed to the content
• show the values next to respective bar
© Artisan Global Media
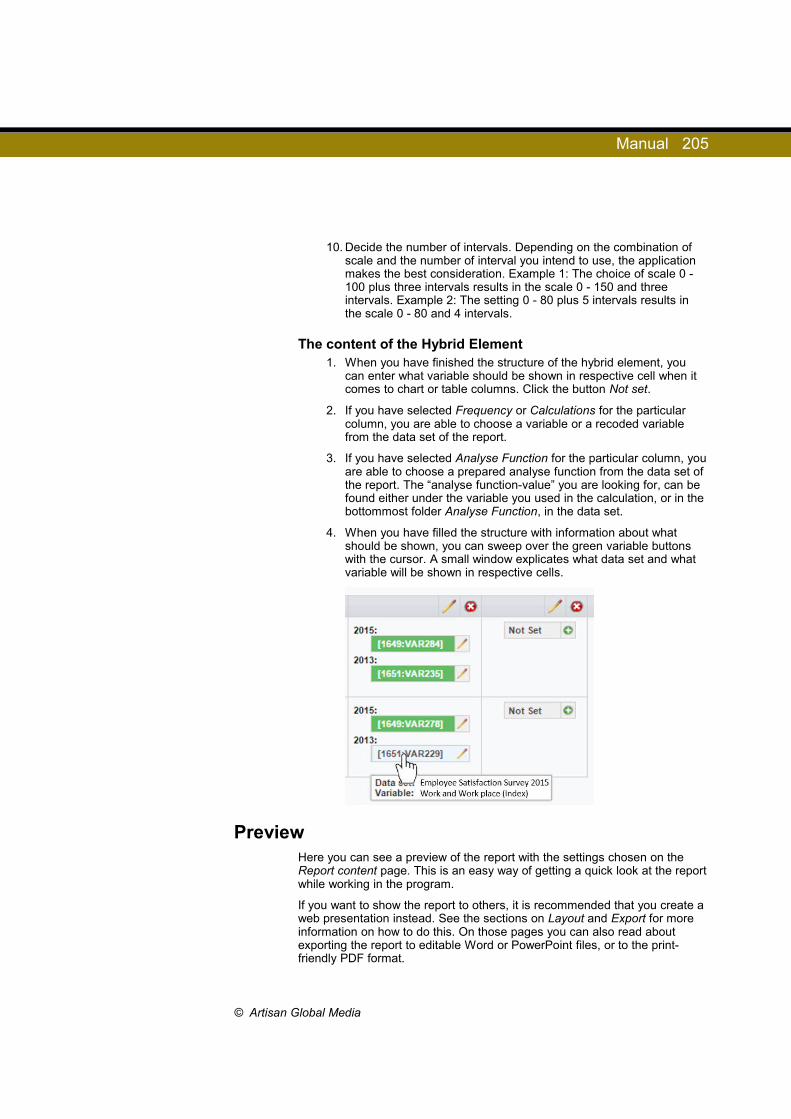
Manual 205
10. Decide the number of intervals. Depending on the combination of scale and the number of interval you intend to use, the application makes the best consideration. Example 1: The choice of scale 0 - 100 plus three intervals results in the scale 0 - 150 and three intervals. Example 2: The setting 0 - 80 plus 5 intervals results in the scale 0 - 80 and 4 intervals.
The content of the Hybrid Element1. When you have finished the structure of the hybrid element, you
can enter what variable should be shown in respective cell when it comes to chart or table columns. Click the button Not set.
2. If you have selected Frequency or Calculations for the particular column, you are able to choose a variable or a recoded variable from the data set of the report.
3. If you have selected Analyse Function for the particular column, you are able to choose a prepared analyse function from the data set of the report. The “analyse function-value” you are looking for, can be found either under the variable you used in the calculation, or in the bottommost folder Analyse Function, in the data set.
4. When you have filled the structure with information about what should be shown, you can sweep over the green variable buttons with the cursor. A small window explicates what data set and what variable will be shown in respective cells.
Preview Here you can see a preview of the report with the settings chosen on the Report content page. This is an easy way of getting a quick look at the report while working in the program.
If you want to show the report to others, it is recommended that you create a web presentation instead. See the sections on Layout and Export for more information on how to do this. On those pages you can also read about exporting the report to editable Word or PowerPoint files, or to the print-friendly PDF format.
© Artisan Global Media

Manual 206
Layout When you are to export the report, you first create a suitable design on the Layout page. You then open the Export menu where you can export the report, but also save the export definitions needed in order to make it possible to authorize others to export the report (This is done on the Distribution and subreports page).
It is possible to use a single layout and still export the report to multiple file formats, such as PDF and Word. If need be, you can also create multiple layouts that you export to the same file formats, for instance two exports to PDF, one with a header, and one without.
Creating Layouts The first time you click on Layout, the pop-up window New Layout appears. If you have previously created a layout , you can click on the New Layout button to create additional layouts. In the pop-up window, you create a new layout as follows:
1. Give the layout a Name. 2. Select a Format: Paper A4 is suitable for export to PDF or Word, or
any of the formats Screen (4:3), Screen (16:9) or Screen (16:10) which are useful for export to PowerPoint or Web presentations.
3. Select an Orientation: Portrait (mostly used for PDFs and Word) or Landscape (the common choice for PowerPoint and Web Presentations).
4. Select a Theme for your layout. See the Edit theme page under Templates > Report themes for information on how themes are created.
5. Specify whether you want to leave some Margins and how wide they then should be. You choose from the following options: None, Normal, Narrow, Moderate, Wide.
6. Finally, select whether or not a Page header and Footer are to be included. You can choose None, Default (as defined under Administration > Settings > Reports > Header/Footer) or Custom (as defined for the report in question under Reports > Basic Information > Header/Footer).
7. Under the Example heading in the right part of the window, you can see how the changes you make regarding the Format, Orientation, Margins, Header and Footer affect the layout. Click OK to save the new layout.
Editing or Removing LayoutsTo change the settings you specified when creating the layout, click on Edit layout. Click on the Remove button if you want to remove the layout.
Editing Content In the Layout drop down list at the top of the page you find all the layouts you have created. Select the layout you want to use for your content, ie. tables, charts and texts, according to the settings selected under Report content.
The quickest way to insert the report content is to click on the Auto-generate button. If there is any existing content in the report, it will be replaced, but you will receive a warning first. Confirm with OK to insert the
© Artisan Global Media

Manual 207
new content. On each page as many (whole) report items as can fit are inserted. Page breaks within a report item will only be inserted if it does not fit on a single page.
As described on the Report content page, report items consist of different sections with one or two columns, which in turn can contain tables, charts and text. When you edit the content here under Layout, you can move the sections by dragging and dropping them in a new location, either within the same page or on another page.
You can also specify settings for sections by clicking on them with the left mouse button. In the menu that opens, there are three choices that allows you to:
• Remove the section• Change the size of the chart that appears in the section. Place the
cursor over Resize and move the slider to change the value. Charts are automatically inserted at 100% but you can change it to as low as 50% to be able to fit more report items on one page. Charts are always resized with fixed proportions.
• Change the margin underneath the section. Place the cursor over Margins and move the slider to change the value.
Instead of auto-generating content, you can insert sections manually, one by one.
1. Click on an empty space on the page where you want to insert the section. You can see that the page is selected when it is highlighted with a blue border.
2. The left column displays all report sections. Click on the sections you want to insert.
3. The section is inserted on the selected page. If there are existing sections on the page, the new section will be inserted at the bottom.
To create a new page after the last page, click on . There are also
buttons for creating new pages above or below an existing page. You find those on the right side of the page.
If you want to remove a page, and any content on it, click on the button.
When you have finished editing the contents, click on Save. You can now move on to the Export menu. Please refer to this section for information about exporting your reports.
© Artisan Global Media
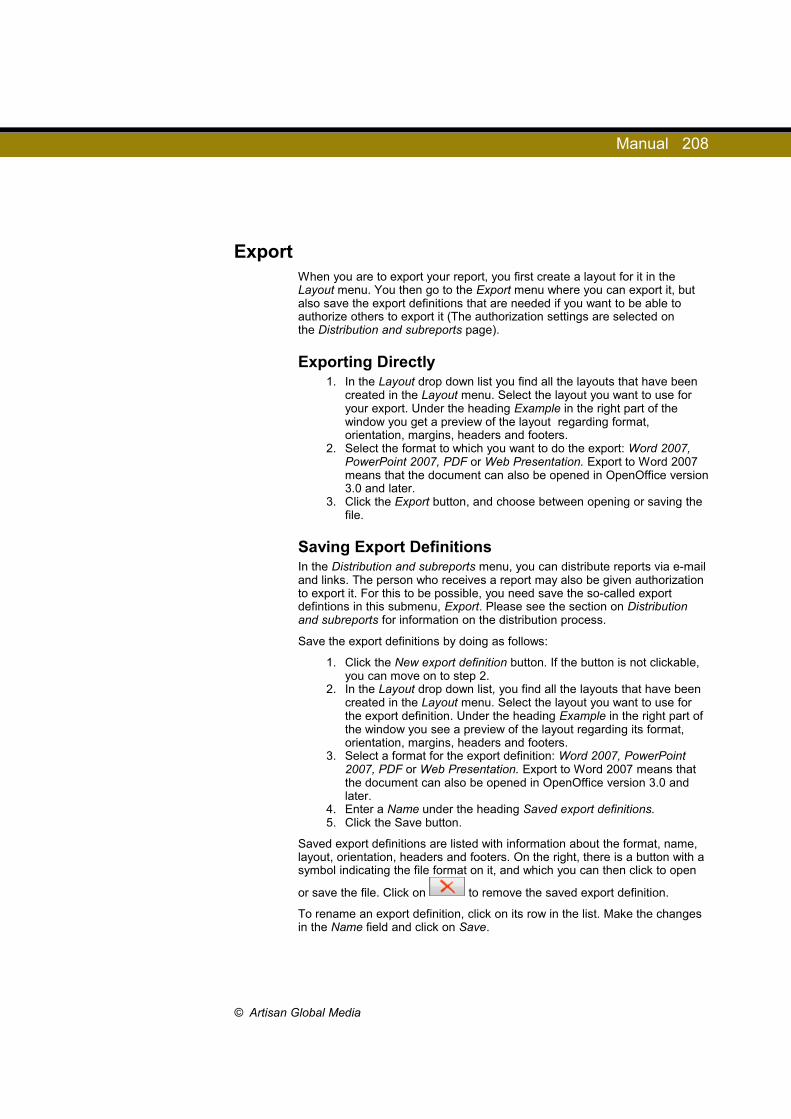
Manual 208
Export When you are to export your report, you first create a layout for it in the Layout menu. You then go to the Export menu where you can export it, but also save the export definitions that are needed if you want to be able to authorize others to export it (The authorization settings are selected on the Distribution and subreports page).
Exporting Directly 1. In the Layout drop down list you find all the layouts that have been
created in the Layout menu. Select the layout you want to use for your export. Under the heading Example in the right part of the window you get a preview of the layout regarding format, orientation, margins, headers and footers.
2. Select the format to which you want to do the export: Word 2007, PowerPoint 2007, PDF or Web Presentation. Export to Word 2007 means that the document can also be opened in OpenOffice version 3.0 and later.
3. Click the Export button, and choose between opening or saving the file.
Saving Export DefinitionsIn the Distribution and subreports menu, you can distribute reports via e-mail and links. The person who receives a report may also be given authorization to export it. For this to be possible, you need save the so-called export defintions in this submenu, Export. Please see the section on Distribution and subreports for information on the distribution process.
Save the export definitions by doing as follows:
1. Click the New export definition button. If the button is not clickable, you can move on to step 2.
2. In the Layout drop down list, you find all the layouts that have been created in the Layout menu. Select the layout you want to use for the export definition. Under the heading Example in the right part of the window you see a preview of the layout regarding its format, orientation, margins, headers and footers.
3. Select a format for the export definition: Word 2007, PowerPoint 2007, PDF or Web Presentation. Export to Word 2007 means that the document can also be opened in OpenOffice version 3.0 and later.
4. Enter a Name under the heading Saved export definitions. 5. Click the Save button.
Saved export definitions are listed with information about the format, name, layout, orientation, headers and footers. On the right, there is a button with a symbol indicating the file format on it, and which you can then click to open
or save the file. Click on to remove the saved export definition.
To rename an export definition, click on its row in the list. Make the changes in the Name field and click on Save.
© Artisan Global Media

Manual 209
Distribution and Subreports The Distribution and subreports menu lets you make reports available for others via a link that you can send out to the people you want to see the report. The report will be available for the time you specify at Published.
Here you can also create so-called subreports, ie. reports showing responses from a selection of respondents. The subreports can be made available via a link in the same way as the main reports.
Dashboard View When you click on Distribution and subreports in the left-hand menu, a dashboard will appear displaying the main report at the top of the page. The main report is the report that shows all the respondents' answers. Below the main report, you find any subreports you may have created, and you are also able to create new ones. Read more about subreports below.
Each report is symbolized by a "box" in the overview. The box displays the following information:
• Report name• Published - the period when the report is available via the link. Read
below about how to choose settings regarding publication times and access.
• URL - the link that leads to the report • Selection lists - only for the subreports, see below
On the far right in the box, a number of icons and buttons are displayed. The symbols indicate whether the report is published and/or password protected. Two of the buttons are only available for subreports.
The report is published
The report is password protected
The report is password protected and the link provides access to additional reports
Select a publication period and settings regarding access
Distribute the report via e-mail
Edit subreport
Remove subreport
Publication Period and Access Settings for the publication period and access are selected in the same way
for both the main report and the subreports. Click on the button in the report's box to open the settings menu.
Under Published, you enter times at From and To, thus specifying the period during which the report will be published. Dates can be selected via the
© Artisan Global Media
Manual 210
calendar icon, or entered manually. The date format depends on which language version you are using. For English the date format is DD-MM-YYYY. Specific times can be entered manually, or selected using the arrow buttons after placing the cursor in the hour and minute fields. The current date and time is already pre-filled at From. If the To field is left blank the report will be published until you do select a To date.
At Password required, under Access, you select whether the report is to be password protected or not. If you choose Yes, use this password, you need to specify a password in the field below.
Under Reports > Export you can save so-called export definitions. Previously saved export definitions are displayed under Enable export. By marking an export definition here, you make it available for use for those who receive the report when it is distributed. They can then click an icon to export the report. Under the heading Dataset (Excel), you can mark the check box next to the report name, if you also want to make it possible to export the report's raw
data to Excel through the icon. The Excel file will contain the variables you have decided to include under Report Content.
By selecting a number of reports under Provide access to, you can specify that the person clicking the link to the report will also be granted access to see those reports. You can then determine whether the person who accesses a subreport should also have access to the main report, or to any other subreport.
Those who have the plug-in SR-Advanced Report can also connect so-called Report readers to the report. Please refer to the Report reader section below for more information.
Distributing Reports via E-mailWhen you have created a report, you can distribute it via e-mail. Click on the
icon to access the e-mail manager.
Creating New Mailings1. Click on New e-mail. If it already says New mailing at the top of the
window, proceed to step 2.2. Make sure that at least one e-mail account has been added under
Administration > E-mails and mailings > E-mail accounts, otherwise no mailings can be distributed. If multiple e-mail accounts have been added, you select From which account it is to be sent out.
3. At Send to, select who is to receive the mailing: All, Respondents only, Survey Readers only or Other contacts. If you select Other contacts, you need to enter the e-mail addresses for the recipients
under To, CC and BCC. Next to each field is a icon which you click on to retrieve addresses for recipients among the program users who have specified e-mail addresses.
4. Specify a Subject.
© Artisan Global Media

Manual 211
5. Type in and format the message text in the editor under Message. Here, you will also find buttons for inserting the Report title (the name of the main report), the Subreport title, The URL (Don't forget this!), and the Password (if the report is password protected).
6. Click on Send. If you want to save the mailing as a draft and send it later, click on Save instead. The mailing will then be listed in the E-mail history.
E-mail HistoryUnder E-mail history you find information about all the existing mailings. They are listed with their send dates and times, as well as their subject lines. Click on a mailing to view it. You can use an existing mailing and edit it, and for instance add new recipients, then resend it by clicking on Send. The new mailing will be listed in the E-mail history.
Public Report ViewWhen you click the report link, a page will open where you can view and print the report. At the top of the page, or on the left side, you find a toolbar. You determine where it is to be placed by clicking the button. The toolbar
always contains the icon which is used to print the report. Depending on which settings the report creator selected, the following buttons may be available:
This button is displayed if the report is a so-called subreport, eg. a report that only displays the responses from a selected number of respondents. The button is also displayed if the report you have accessed is a main report, eg. a report that contains all the respondents' answers, and it also gives you access to at least one subreport. You click the button to select what you want the report to display. The window that opens is divided in two: the left half lets you select which report and which selection list you wish to display. If the link gives you access to the main report, you can select it at the top to view all the respondents' answers. The subreports are displayed as headings in the list, and under each heading the selection lists that have been created for that subreport are displayed. When you mark a selection list, those variables that are used for selecting the respondents are listed in the right half of the window. By marking the check boxes for the respective variables' options, you determine which respondents' answers are to be displayed in the report. If the check box for an option is marked and highlighted in gray, it must be included and cannot be removed.
The icons below are displayed if an export definition for the current file format has been saved under Reports > Export, and if this export definition has been marked under the heading Enable Export, see the section Publication Period and Access above. These icons are used to export the report to the corresponding file format. If a subreport is exported, the file will
contain the selection you have made by clicking the button. The file will have an introductory page, showing the selection it contains.
© Artisan Global Media

Manual 212
This lets you export the report to Word 2007. The exported document can also be opened in OpenOffice version 3.0 or later.
This lets you export the report to PowerPoint 2007.
This button lets you export the report in a PDF format.
This opens the report as a web presentation.
If there are multiple export definitions for a file format, a small arrow will be displayed in the button. Click on it and select one of the export options that are then displayed.
Export the report's raw data to Excel.
Subreports A subreport displays the answers from a selected group of respondents. You can use a number of survey questions or respondent categories for the selection. For example, if you have used Sex either as a question in the survey, or as a respondent category, you can create one subreport with all the men's responses, and another subreport with all the women's responses.
In subreports, you can also enable a function that lets the person viewing the report choose which selection it is to display.
Creating Subreports
Click the button to create a new subreport. This takes you to the edit mode where you start by entering a name for the subreport.
The next step is to select which variables are to be used for the selection. Click on Add variable to open the survey data sets. The data set displays the questions in the survey as well as the respondent categories in a tree structure. Click on the plus sign next to the question you want to use as a selection variable if you want to expand it. If you want to use a respondent category you first expand Respondent categories at the bottom of the page
and then click on a specific category. You can also click on to expand all questions and respondent categories. Under each question, its variables are displayed. If you have recoded a variable in the Data set menu, this recoded variable will also be displayed and available for selection. Mark the check boxes next to the variables you want to include and click OK.
When you create the subreport, a so-called Selection list is created at the same time. This is called Default and it is displayed in a grid together with the variable(s) you have added. The selection list is symbolized by a vertical column where you can specify which status the variables' options are to have in the report, i.e. which selections are to be possible. To view a variable's options, click the down arrow which can be found on the right side of the
© Artisan Global Media

Manual 213
variable's row. Among the options, you also find the [Not indicated] option which corresponds to the respondents who have not answered (if the variable is a question) or who have no specified category (if the variable is a respondent category). You specify the status by clicking the rectangle that represents the variable or one of its options. The symbol in the rectangle then changes. The different symbols have the following meanings:
The variable/option will be available for selection
The variable/option will automatically be selected, and cannot be removed
The variable/option will not be available for selection
The answer options for this variable have different statuses
The answer options have different statuses, and one option has the
status
In the example below, the variable Department has been added. All its
options have the symbol, which means that the person viewing the report will be able to select which department(s) to display in the report.
If you want to add one more selection list, in addition to the Default selection list, you click the button Add selection list. Enter a name for the selection list describing which selection it allows, for example, "Only show female respondents" or "Select males/females". Click OK. The new selection list is displayed as a column in the grid, and you can specify which selections are to be possible, as described above.
© Artisan Global Media

Manual 214
In the example below, three variables and two selection lists were added.
The selection list Select males/females will enable the person viewing the report to make a selection based on the Gender variable. It is thus possible to display only the men's answers, only the women's answers, or both men's
and women's answers. Other variables have the symbol, which means that they will automatically be selected, and that it is not possible to deselect them.
In the selection list, Only display Production Dublin, the person viewing the report will not be able to make any selections of their own. Instead, a single sample, the production department at the Dublin office, will be displayed.
Editing Subreports
On the overview page, click the button in the subreport's box to enter edit mode. There you have access to the same settings as on the page where you created the subreport, ie. you can rename the report, and add variables and selection lists.
© Artisan Global Media

Manual 215
You can remove variables you do not need by clicking on and confirming with OK.
Selection lists can also be removed, just press the button. To rename
the selection list, click on .
Report ReadersIn the plug-in SR-Advanced Report, there is the possibility to use the user role Report reader. A report reader is a user who only have access to the reports menu in the program, and in that menu only the published reports that he/she has been connected to.
By clicking the button next to a report, you can connect the desired report readers to the report. Click the Add... button under the heading Report Readers, mark the check box next to the report readers you want to connect to the report, and click OK.
Report readers who are connected to the main report will automatically see all respondents' answers in that report. If you connect a report reader to a sub report, you may select which respondents' answers he/she will have the right to see. When you have added a report reader , you click his/her name in the list. In the right part of the window, the variables used as selections in the subreport are displayed in a grid. For each variable in the grid, there is a column where you specify which status the variable's options are to have in the report, i.e. which selections the report reader will have the possibility to make. Please refer to the Creating Subreports heading above for information on the selection settings.
In a report reader's user profile, you can make default settings for which respondent categories/sub categories he/she will have the right to see in the reports. If a respondent category is used as selection in the sub report, each report reader's default setting for that category will be pre-selected, but you can change the settings individually for each report.
To delete a report reader's connection to the report, select him/her in the list and click the Remove button.
When the report is published it will become accessible via the report link, and also for report readers logging in to the program. By marking the check box The report is accessible only for report readers, not public accessible via the report link, you block the possibility to access the report via the link.
© Artisan Global Media
Manual 216
Logging in as a report readerWhen you log in to the program as a report reader, you can see the reports, and the information, you have been assigned. The option Find report... is selected in the menu, and a list of the reports you are entitled to see is displayed, except those which are based on archived surveys. Mark the check box Include reports from archived surveys if you want to display those as well. The reports are listed with the following headings:
• Report name (the main report)• Sub reports
You can click on the heading Report name to sort the list in ascending or descending alphabetical order. If there are a large number of reports, you can use the search field at the top of the page to find a certain report. Enter the desired search argument in the field, and click the Search button. You can use a full or a partial report name or sub report name as a search argument.
When you click on a report in the list, you see basic information about the reports (main report and/or sub reports) you have the right to see:
• Expected number of responses• Number of responses• Response rate
Click the icon next to a report to show it. If a report has several sub reports that you are assigned to, you can select the desired sub report in the selection list in the menu, and then click Show Report.
If you also have access to respondent information, you find the icon next to the main report. Click this icon, or Respondents in the menu, to go to the respondent list where you can see respondents connected to the main survey, and also export the respondent list.
When you choose to show the report, a page will open where you can view and print the report. At the top of the page, or on the left side, you find a toolbar. You determine where it is to be placed by clicking the button. The
toolbar always contains the icon which is used to print the report. Depending on which settings the report creator selected, the following buttons may be available:
This button is displayed if the report is a so-called subreport, i.e. a report that only displays the responses from a selected number of respondents. You click the button to select what you want the report to display. The window that opens is divided in two. In the left half of the window, you find from the start only one selection list, Default, which is selected. In the right half, the variables used as selections in the sub report are displayed. By marking the check boxes for the respective variables' options, you determine which respondents' answers are to be displayed in the report. If the check box for an option is marked and highlighted in gray, it must be included and cannot be removed. Click OK to show the report with the new selection. You can also save your own selection lists. Make sure that the desired check boxes are marked, enter a name for the selection list
© Artisan Global Media
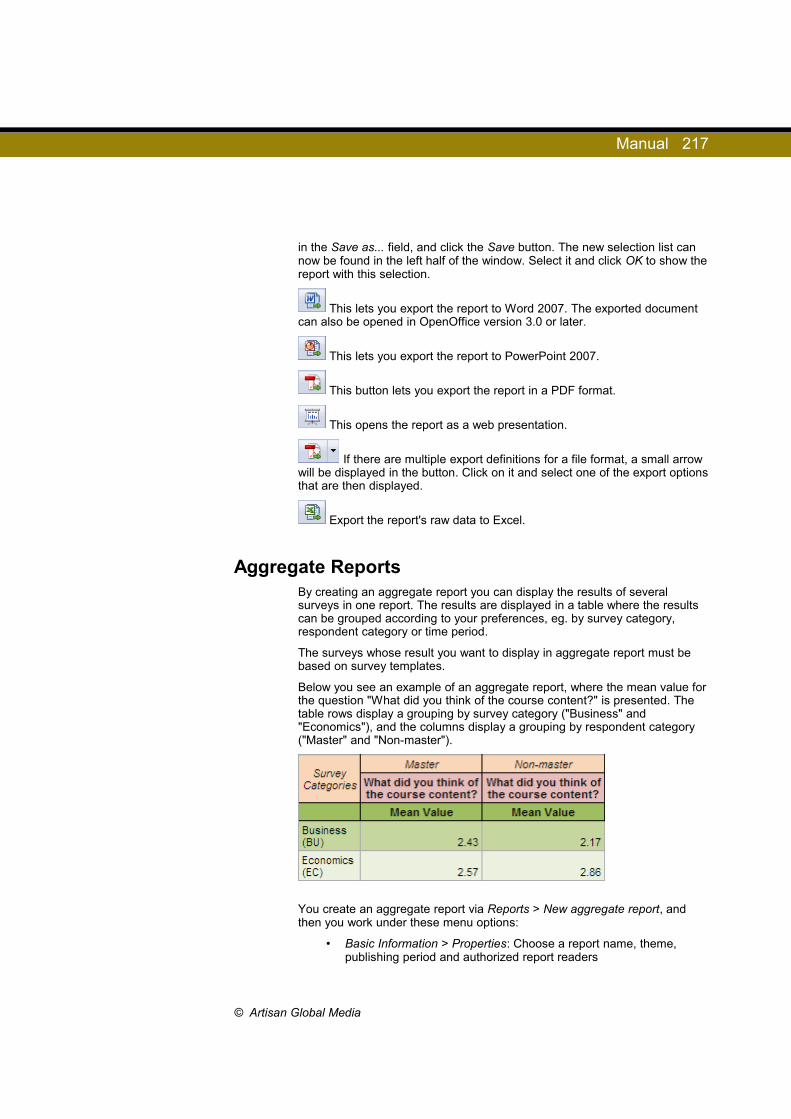
Manual 217
in the Save as... field, and click the Save button. The new selection list can now be found in the left half of the window. Select it and click OK to show the report with this selection.
This lets you export the report to Word 2007. The exported document can also be opened in OpenOffice version 3.0 or later.
This lets you export the report to PowerPoint 2007.
This button lets you export the report in a PDF format.
This opens the report as a web presentation.
If there are multiple export definitions for a file format, a small arrow will be displayed in the button. Click on it and select one of the export options that are then displayed.
Export the report's raw data to Excel.
Aggregate ReportsBy creating an aggregate report you can display the results of several surveys in one report. The results are displayed in a table where the results can be grouped according to your preferences, eg. by survey category, respondent category or time period.
The surveys whose result you want to display in aggregate report must be based on survey templates.
Below you see an example of an aggregate report, where the mean value for the question "What did you think of the course content?" is presented. The table rows display a grouping by survey category ("Business" and "Economics"), and the columns display a grouping by respondent category ("Master" and "Non-master").
You create an aggregate report via Reports > New aggregate report, and then you work under these menu options:
• Basic Information > Properties: Choose a report name, theme, publishing period and authorized report readers
© Artisan Global Media

Manual 218
• Basic Information > Surveys: Choose the criteria to be considered for the survey selection
• Basic Information > Selection: Define selection parameters report readers shall have access to
• Report Content: Define the content of the report• Preview: Show the report and make an export to Excel
Basic Information
PropertiesWhen you created the report, you entered a report name and selected a report theme. Under Basic information > Properties you can edit the name and change theme if you want to.
Here you can also connect report readers to the report. The connected report readers will see the report when they log in to the program, during the period it is published.
You enter the start and end dates for the publication period, either by entering the dates manually via the keyboard, or by selecting the dates in the calendar. When you are using the English version of the program, dates are entered in the following format: DD-MM-YYYY. You must enter a From date for the report to be published. If you leave the To date blank, the report will be published until further notice.
In the Report Content, you can make settings for which answers the report readers are allowed to see in the report. See this section for more information.
SurveysIn the tab Surveys you can choose which surveys shall be included in your aggregate report. You can base your choice upon the following criteria:
• Individual surveys• Surveys that have answers given within a certain period• Surveys that were published within a certain period• Surveys with respondents connected to certain respondent
categories• Surveys connected to certain survey categories• Surveys based on certain survey templates
Please note that the surveys whose result you want to display in aggregate report must be based on survey templates.
Adding criteria
Click the button to add the first criterion. In the pop-up window Add criteria..., you select which criterion to use in the drop down list Criteria. Below you find information on how to use the different criteria.
© Artisan Global Media

Manual 219
Surveys
Use this criterion to select individual surveys to include or exclude in the report.
1. Select Surveys in the drop down list Criteria.2. In the drop down list below, you decide if you want to Include or
Exclude the surveys you select.3. Under the heading Surveys, click the Search button to list all
surveys. You can also filter the search by selecting survey categories connected to the survey, or by entering a search text matching the survey name, before clicking the Search button.
4. Mark the check box next to the surveys you want to select. By marking/unmarking the check box in the title row, you mark/unmark all the surveys' check boxes at once.
5. Click OK.
Answers
Use this criterion to include surveys that have answers given within a certain period. Please note that all answers from the surveys matching this criteria will be included in the report, not only the answers given within the stated period. However, under the Selection tab you have the possibility to decide that you want to include answers from a certain period.
1. Select Answers in the drop down list Criteria.2. Under the heading Answers, enter the start and end dates for the
period, either by entering the dates manually via the keyboard, or by selecting the dates in the calendar. When you are using the English version of the program, dates are entered in the following format: DD-MM-YYYY. You can enter only a start date or an end date if you want the period to be unlimited at the start or at the end.
3. Click OK.
Published
Use this criterion to include surveys that were published within a certain period.
1. Select Published in the drop down list Criteria.2. Under the heading Published, enter the start and end dates for the
period, either by entering the dates manually via the keyboard, or by selecting the dates in the calendar. When you are using the English version of the program, dates are entered in the following format: DD-MM-YYYY. You can enter only a start date or an end date if you want the period to be unlimited at the start or at the end.
3. Click OK.
Respondent Categories
Use this criterion to include or exclude surveys with certain respondent categories connected to them, and with respondents connected to these respondent categories.
1. Select Respondent Categories in the drop down list Criteria.
2. In the drop down list below you select one of these options:
all of (include) - Include surveys with respondents that are connected to all of the following categories
© Artisan Global Media

Manual 220
is either (include) - Include surveys with respondents that are connected to at least onw of the following categories
all of (exclude) - Exclude surveys with respondents that are connected to all of the following categories
is either (exclude) - Exclude surveys with respondents that are connected to at least one of the following categories
3. Under the heading Respondent Categories, click to expand a category you want to use as a criterion, and mark the check box next to the sub categories you want to select. You can also mark the check box next to Select all to select all sub categories. If you have hierarchic respondent categories in several levels, all sub categories in any levels below Select all will be selected.
4. Click OK.
Survey Categories
Use this criterion to include or exclude surveys connected to certain survey categories.
1. Select Survey Categories in the drop down list Criteria.
2. In the drop down list below you select one of these options:
all of (include) - Include surveys that are connected to all of the following categories
is either (include) - Include surveys that are connected to at least onw of the following categories
all of (exclude) - Exclude surveys that are connected to all of the following categories
is either (exclude) - Exclude surveys that are connected to at least one of the following categories
3. Mark the check box next to the categories you want to select. If a category have sub categories, click to expand it and mark the check box next to the sub categories you want to select. You can also mark the check box next to Select all to select all sub categories. All sub categories in any levels below Select all will be selected.
4. Click OK.
Survey Templates
Use this criterion to include or exclude surveys based on certain survey templates.
1. Select Survey Templates in the drop down list Criteria.2. In the drop down list below, you decide if you want to Include or
Exclude the survey templates you select.3. Under the heading Survey Templates, click the Search button to list
all survey templates. You can also filter the search by selecting survey categories connected to the survey template, or by entering a search text matching the survey template name, before clicking the Search button.
© Artisan Global Media
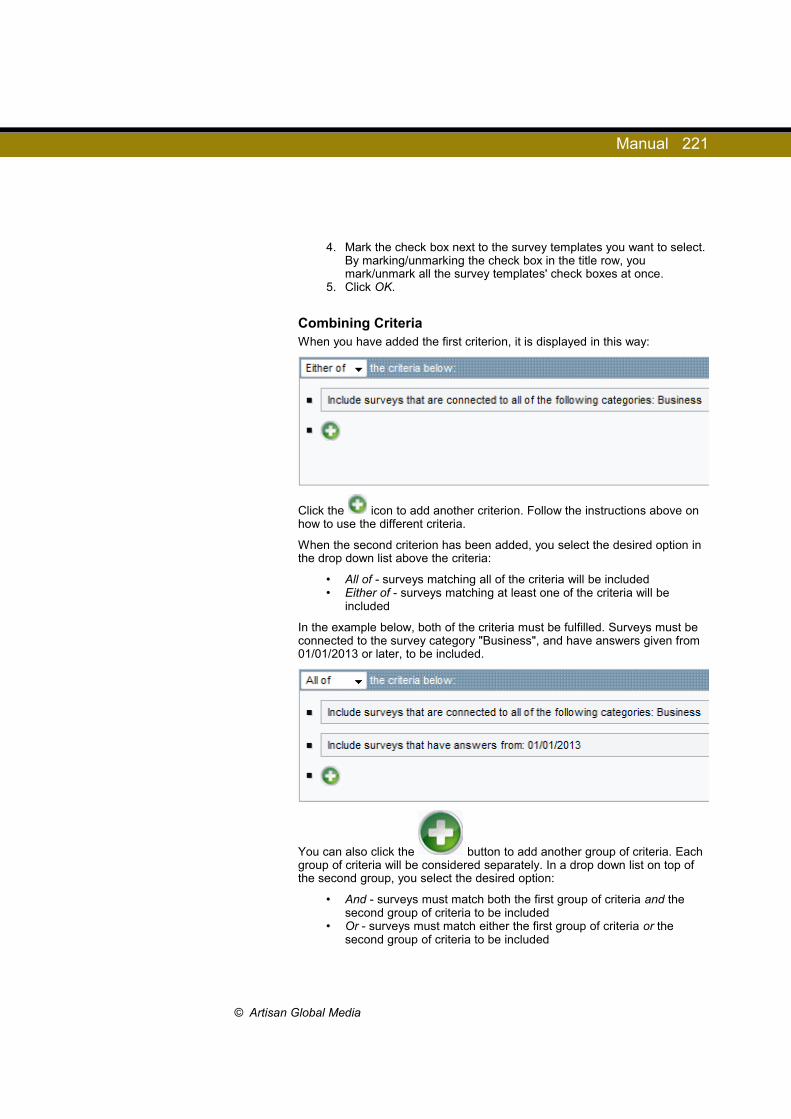
Manual 221
4. Mark the check box next to the survey templates you want to select. By marking/unmarking the check box in the title row, you mark/unmark all the survey templates' check boxes at once.
5. Click OK.
Combining CriteriaWhen you have added the first criterion, it is displayed in this way:
Click the icon to add another criterion. Follow the instructions above on how to use the different criteria.
When the second criterion has been added, you select the desired option in the drop down list above the criteria:
• All of - surveys matching all of the criteria will be included• Either of - surveys matching at least one of the criteria will be
included
In the example below, both of the criteria must be fulfilled. Surveys must be connected to the survey category "Business", and have answers given from 01/01/2013 or later, to be included.
You can also click the button to add another group of criteria. Each group of criteria will be considered separately. In a drop down list on top of the second group, you select the desired option:
• And - surveys must match both the first group of criteria and the second group of criteria to be included
• Or - surveys must match either the first group of criteria or the second group of criteria to be included
© Artisan Global Media
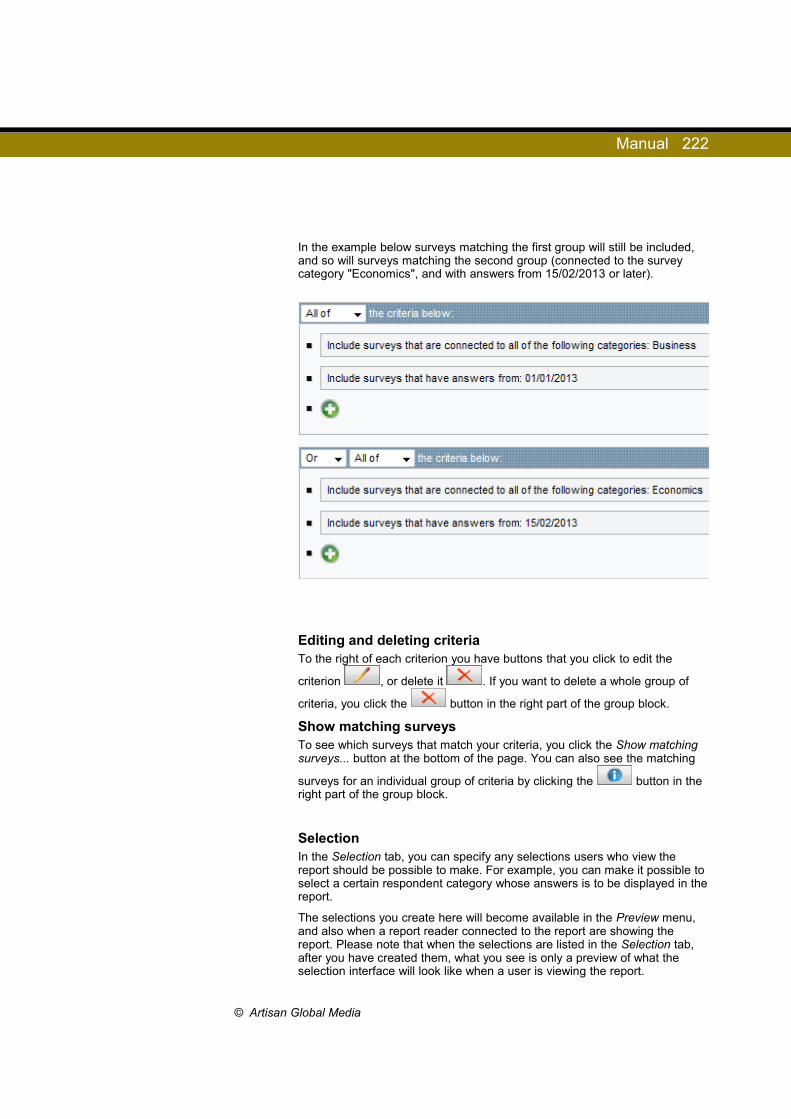
Manual 222
In the example below surveys matching the first group will still be included, and so will surveys matching the second group (connected to the survey category "Economics", and with answers from 15/02/2013 or later).
Editing and deleting criteriaTo the right of each criterion you have buttons that you click to edit the
criterion , or delete it . If you want to delete a whole group of
criteria, you click the button in the right part of the group block.
Show matching surveysTo see which surveys that match your criteria, you click the Show matching surveys... button at the bottom of the page. You can also see the matching
surveys for an individual group of criteria by clicking the button in the right part of the group block.
SelectionIn the Selection tab, you can specify any selections users who view the report should be possible to make. For example, you can make it possible to select a certain respondent category whose answers is to be displayed in the report.
The selections you create here will become available in the Preview menu, and also when a report reader connected to the report are showing the report. Please note that when the selections are listed in the Selection tab, after you have created them, what you see is only a preview of what the selection interface will look like when a user is viewing the report.
© Artisan Global Media

Manual 223
Creating selection
Click the icon to add a selection. In the drop down list Selection, you can choose from the following options:
• Survey - selection of which survey(s) to display• Answers - selection of answers given within a certain period• Published - selection of surveys published within a certain period• Respondent Category - selection of answers from a certain
respondent category• Survey Category - selection of surveys belonging to a certain survey
category
The different selection criteria is described in detail below.
Survey
Use this selection to make it possible to select one or more surveys to display in the report. It will be possible to select among all the surveys you have chosen to include in the report, in the Surveys tab. When viewing the report (in the Preview menu or as a report reader) the selection will appear as a search field where you can enter a whole or partial survey name, before clicking the Search button.
When you create or edit this selection, you find the following settings:
Choose Single selection if only one survey at a time should be possible to select, or choose Multi selection if you want to allow selection of multiple surveys. In the latter case, you can put restrictions on how many surveys (Min and Max) should be possible to select.
By marking the Compulsory check box, you force the user to make a selection before he/she can view the report.
Answers
This selection makes it possible to filter the report so that only answers given within a certain period are shown. When viewing the report (in the Preview menu or as a report reader) the selection will appear as two date pickers, where you can select the start and end of the period to show in the report.
When you create or edit this selection, you find the following settings:
If you want to put restrictions on which dates can be selected as start and end of the period, you can enter a From date and a To date under Date restrictions. By selecting the Hidden check box, the period you have specified here will be automatically applied, and the users will not be able to select their own period.
Under Date selection mode, you select Day, Week, Month or Year. What you choose here will determine what the user will be able to select when he/she clicks the calendar symbol in the date picker. For example, if you select Month, the user will be able to click on a month, and the appropriate date in that month will be automatically selected (the first day of the month if the start of the period is being specified, or the last day of the month if the end of the period is being specified).
© Artisan Global Media

Manual 224
Published
Use this selection to make it possible to let the report show only surveys which were published during a certain period. The report will of course only show surveys you have chosen to include in the report, in the Surveys tab. When viewing the report (in the Preview menu or as a report reader) the selection will appear as two date pickers, where you can select the start and end of the period to show in the report.
When you create or edit this selection, you find the following settings:
If you want to put restrictions on which dates can be selected as start and end of the period, you can enter a From date and a To date under Date restrictions.
Under Date selection mode, you select Day, Week, Month or Year. What you choose here will determine what the user will be able to select when he/she clicks the calendar symbol in the date picker. For example, if you select Month, the user will be able to click on a month, and the appropriate date in that month will be automatically selected (the first day of the month if the start of the period is being specified, or the last day of the month if the end of the period is being specified).
Respondent Category
This selection makes it possible to filter the report so that only answers from a certain respondent category are shown. When viewing the report (in the Preview menu or as a report reader) the selection will appear as a drop down list where the user can select one or more of this respondent category's sub categories.
When you create or edit this selection, you find the following settings:
Choose Single selection if only one sub category at a time should be possible to select, or choose Multi selection if you want to allow selection of multiple sub categories. In the latter case, you can put restrictions on how many sub categories (Min and Max) should be possible to select.
By marking the Compulsory check box, you force the user to make a selection before he/she can view the report.
Under the heading Respondent Category you start by selecting (in the drop down list) the respondent category you want to use as a selection. If you have hierarchical respondent categories (with sub categories in several levels), you can select any level which have sub categories. Then mark the check boxes next to the sub categories you want the users to be able to choose among. Please note that report readers viewing the report will not be able to select other respondent categories than those they have in their respondent filter. By selecting the Hidden check box, the selection you have made will be automatically applied, and the users will not be able to make their own selection of categories.
Survey Category
Use this selection to make it possible to let the report show only surveys which belong to a certain survey category. The report will of course only show surveys you have chosen to include in the report, in the Surveys tab. When viewing the report (in the Preview menu or as a report reader) the selection will appear as a drop down list where the user can select one or more of this survey category's sub categories.
© Artisan Global Media

Manual 225
When you create or edit this selection, you find the following settings:
Choose Single selection if only one sub category at a time should be possible to select, or choose Multi selection if you want to allow selection of multiple sub categories. In the latter case, you can put restrictions on how many sub categories (Min and Max) should be possible to select.
By marking the Compulsory check box, you force the user to make a selection before he/she can view the report.
Under the heading Survey Category you start by selecting (in the drop down list) the survey category you want to use as a selection. Only survey categories which have sub categories can be used. If you have survey categories with sub categories in several levels, you can select any level which have sub categories. Then mark the check boxes next to the sub categories you want the users to be able to choose among.
Editing, deleting and rearranging selectionsWhen you have added a selection it is displayed on the page in the Selection tab. What you see in this overview is only a preview of what the selection interface will look like when a user is viewing the report. Any restrictions on what selection should be possible to make in the report, you specify when you create or edit the selection.
To edit a selection you click the icon to the right of the selection. See information on how editing is made under Creating selection above.
Click the icon to delete the selection. Confirm by clicking OK.
If you want to, you can change the order in which the selections are displayed. When you hover the cursor over a selection heading, it will turn into a move cursor. Press the left mouse button, and drag the selection to its new location.
Report ContentAn aggregate report consists of one or more tables, where you can group the result row wise and column wise according to your preferences, e.g. by survey category, respondent category or time period. Under Report Content, you create and edit these tables. You can also add text items, such as headings, to the report.
Adding tables and text itemsWhen you create an aggregate report, a table is automatically created under the Report Content menu. If you want to add more tables, or text items, you click on the existing table and select Add new above or Add new below. A new section is then inserted and will be symbolized by the image below.
Then click on the empty section and select Add text item or Add table.
© Artisan Global Media
Manual 226
Editing tablesTo edit a table you click on it and select Edit...
In the edit mode you can decide which data to display in the report, under Column data, and how to group these data row wise and column wise, under Row groups and Column groups respectively. In addition, you have the possibility to define which answers should be shown to the report readers, by choosing the desired setting under Answering filter, and if the summaries should be filtered, by choosing the desired setting under Summary filtering.
While editing a table, you can preview the results by clicking the Preview button in the lower left corner, without having to save the changes.
Row groups and Column groupsUnder these headings you decide how the result should be grouped row wise and column wise: by Surveys, Answers, Respondent category, Survey category or Survey users.
Click the Add... button to add a group, or click the icon to edit an existing group, and select the desired grouping criterion in the drop down list Group by. Below you find information on the different grouping criteria. To remove a group, click the Remove button.
Group by Surveys
Each survey included in the report will constitute a row or a column. Mark the check box Include summary to display a summary row/column, showing the total for all surveys.
Group by Answers
The result will be grouped according to when the answer was given: by day, week, month or year. Select the interval of your choice at Grouping. Mark the check box Include summary to display a summary row/column, showing the total for all answers.
Group by Respondent category
Under the heading Respondent Category you start by selecting (in the drop down list) the respondent category you want to use as grouping criterion. If you have hierarchical respondent categories (with sub categories in several levels), you can select any level which have sub categories. Then mark the check boxes next to the sub categories whose result you want to display as rows/columns. Mark the check box Include summary to display a summary row/column, showing the total of the respondent category. Below you decide if the summary should include All categories or Only the categories selected below. If the respondent category has sub categories in several levels, a summary row/column for each level will be displayed. Mark the check box Add a row/column for answers from respondents that have no value for the selected category, if you want to include answers given by respondents who do not have a category value.
After you have created the group, you can expand it by clicking the arrow. You then get access to the following settings:
• Show title category - the top level of the respondent category will be displayed as a title row/column
• Exclude categories without answers (selected as default) - no empty rows/columns will be displayed
© Artisan Global Media
Manual 227
• Apply selection filters - If you, under Basic Information > Selection, have made it possible for report readers (before viewing the report) to select among the sub categories of the respondent category you use as grouping, the setting Apply selection filters means that only the sub category the user selects will be displayed as a row/column, and that all other sub categories will be hidden.
• Filter population - if you choose to display response rate in the table, this setting decides if the response rate is calculated on all respondents (the check box unmarked) or only on the respondents in the respondent category concerned (the check box marked).
• Include summary - see above
Group by Survey category
Under the heading Survey Category you start by selecting (in the drop down list) the survey category you want to use as grouping criterion. Only survey categories which have sub categories can be used. If you have survey categories with sub categories in several levels, you can select any level which have sub categories. Then mark the check boxes next to the sub categories for which you want to display the result as rows/columns. Mark the check box Include summary to display a summary row/column, showing the total of the survey category as a whole. If the survey category has sub categories in several levels, a summary row/column for each level will be displayed.
After you have created the group, you can expand it by clicking the arrow. You then get access to the following settings:
• Show title category - the top level of the survey category will be displayed as a title row/column
• Exclude categories without answers (selected as default) - no empty rows/columns will be displayed
• Apply selection filters - If you, under Basic Information > Selection, have made it possible for report readers (before viewing the report) to select among the sub categories of the survey category you use as grouping, the setting Apply selection filters means that only the sub category the user selects will be displayed as a row/column, and that all other sub categories will be hidden.
• Include summary - see above
Group by Survey user
Select in what cases you would like to view a summary of the row or column results. You have the following options:
• Never show
• Show if groupings > 1, i. e. if the number of rows, or columns, is larger than one.
• Always show
Also decide whether the report should Include inactive users.
The settings above can be changed later by clicking .
© Artisan Global Media

Manual 228
Column dataThis is where you decide what to display in the table, for example the mean value of a question, the answer count and response rate of a survey, or links to a predefined report or to the individual respondents answers.
Click the Add... button to add data or click the icon to edit existing data. Then select what data to display. Below you find information on the different alternatives. To remove data, click the Remove button.
Question
Select Question in the drop down list Data. Select the survey template which contains the question, and then select the question. In the drop down list Type, select Frequency, Answer value or Mean value, depending on what you want to display. See more information on these options below. At the bottom of the window, the answer options of the question is displayed. If you want to exclude any of them, unmark the check box next to it.
• Frequency - Select this option to display the Number of Responses and/or Distribution (%) for the answer options of the question. Mark the check box next to Include summary to display a summary column.
If you want to you can let the answer options be represented by different colours. After you have added the data, you expand it by
clicking the arrow. Then click the icon at Colour and select a Font colour and/or a Background colour by clicking the coloured rectangle or by entering a colour code. Below you see an example of a question which is presented with number of responses, distribution, summary column and background colours for the answer options.
• Answer value - Select this option if you want to present the number of the responses for the answer options, in the way shown in the example below. You can let the answer options be represented by different colours, as described under Frequency above.
• Mean value - Select this option if you want to display the mean value of the question.
© Artisan Global Media

Manual 229
Answer count
Select Answer count in the drop down list Data if you want to display the Answer count and/or the Response rate. See the example below.
Link to predefined report
In the aggregate report table, you can insert links to reports for the surveys whose result is displayed in the table. For this to be possible, the following conditions must be met:
• A so-called predefined report must be created to the survey template the survey is based on. See the section Templates > Survey Templates > Predefined reports for more information.
• A report must be created on the survey, based on the predefined report
• The link to the report must be published, under Reports > Distribution and Subreports
Select Link to predefined report in the drop down list Data. Then select the predefined report of your choice.
Decide which answers you want to display in the report:
• Include all answers when viewing the report - the report will include all answers given on the survey. Please note that all answers will be included in the report, even if you have set restrictions under Answer filtering, see this section below.
• Apply group filters when viewing the report - the report will only show the answers which corresponds to the cell in the table where the link icon is displayed.
Example: The example below shows a table where the result of the survey SB02 is displayed, grouped (column wise) by the respondent category Gender. The table displays the answer count (the Answers column) and links to a predefined report by the name of SB (the Report column). In the image, a report link icon is highlighted in the column Men. If the setting Apply group filters when viewing the report is selected, this report link will lead to a report showing only the five answers given by men. If instead the setting Include all answers when viewing the report is selected, the report will show the eleven answers given by men and women.
Hover the cursor over an icon to see the name of the report it links to as a tooltip.
Mark the check box Open as PDF file if you want the report to be opened as a PDF file. If you leave the check box unmarked, the report will open as a web page.
© Artisan Global Media
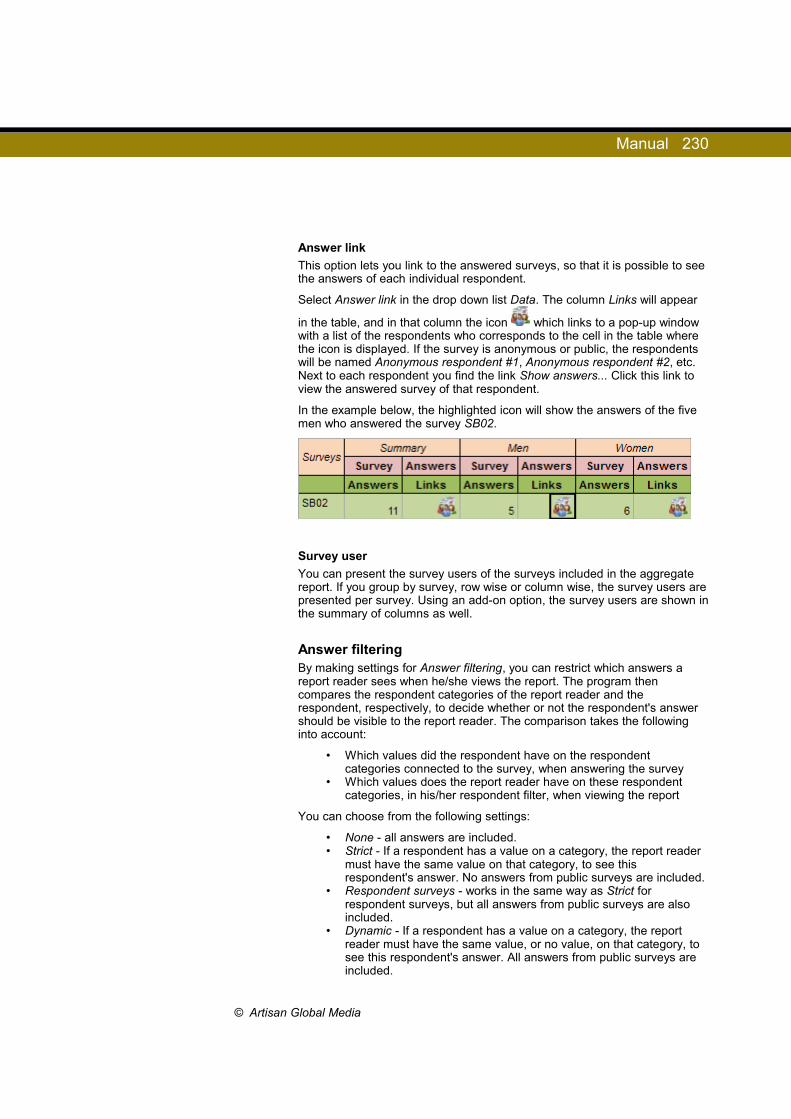
Manual 230
Answer link
This option lets you link to the answered surveys, so that it is possible to see the answers of each individual respondent.
Select Answer link in the drop down list Data. The column Links will appear
in the table, and in that column the icon which links to a pop-up window with a list of the respondents who corresponds to the cell in the table where the icon is displayed. If the survey is anonymous or public, the respondents will be named Anonymous respondent #1, Anonymous respondent #2, etc. Next to each respondent you find the link Show answers... Click this link to view the answered survey of that respondent.
In the example below, the highlighted icon will show the answers of the five men who answered the survey SB02.
Survey user
You can present the survey users of the surveys included in the aggregate report. If you group by survey, row wise or column wise, the survey users are presented per survey. Using an add-on option, the survey users are shown in the summary of columns as well.
Answer filteringBy making settings for Answer filtering, you can restrict which answers a report reader sees when he/she views the report. The program then compares the respondent categories of the report reader and the respondent, respectively, to decide whether or not the respondent's answer should be visible to the report reader. The comparison takes the following into account:
• Which values did the respondent have on the respondent categories connected to the survey, when answering the survey
• Which values does the report reader have on these respondent categories, in his/her respondent filter, when viewing the report
You can choose from the following settings:
• None - all answers are included.• Strict - If a respondent has a value on a category, the report reader
must have the same value on that category, to see this respondent's answer. No answers from public surveys are included.
• Respondent surveys - works in the same way as Strict for respondent surveys, but all answers from public surveys are also included.
• Dynamic - If a respondent has a value on a category, the report reader must have the same value, or no value, on that category, to see this respondent's answer. All answers from public surveys are included.
© Artisan Global Media
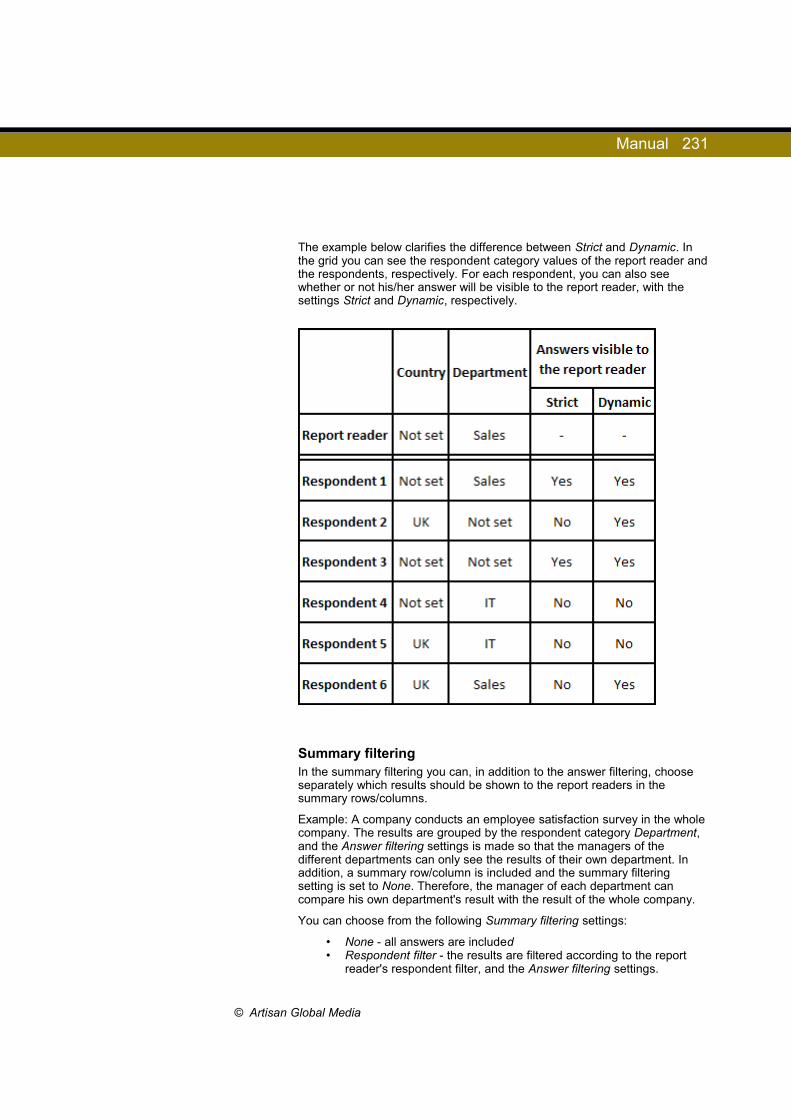
Manual 231
The example below clarifies the difference between Strict and Dynamic. In the grid you can see the respondent category values of the report reader and the respondents, respectively. For each respondent, you can also see whether or not his/her answer will be visible to the report reader, with the settings Strict and Dynamic, respectively.
Summary filteringIn the summary filtering you can, in addition to the answer filtering, choose separately which results should be shown to the report readers in the summary rows/columns.
Example: A company conducts an employee satisfaction survey in the whole company. The results are grouped by the respondent category Department, and the Answer filtering settings is made so that the managers of the different departments can only see the results of their own department. In addition, a summary row/column is included and the summary filtering setting is set to None. Therefore, the manager of each department can compare his own department's result with the result of the whole company.
You can choose from the following Summary filtering settings:
• None - all answers are included• Respondent filter - the results are filtered according to the report
reader's respondent filter, and the Answer filtering settings.
© Artisan Global Media
Manual 232
• Report selection - the results are filtered according to which report selection has been made before viewing the report. Which report selections are possible to make is decided under Basic Information > Selection.
• Full - A combination of the two settings above. The results are filtered according to both the respondent filter and the report selection.
Editing text itemsIf you want to add text, such as headings, to the report, you can add a text items, see Adding tables and text items above. To edit a text item you click on it and select Edit... The text items are edited in an editor where you can write and format text as well as insert images and links. Click on Save when you have finished.
Removing tables and text itemsIf you wish to remove a table or a text item, click on it and select Remove. Confirm by clicking OK.
PreviewUse this menu to view the report, and to get a preview of what the report will look like when the report readers are viewing it. From here, you can also print the report or export it to Excel.
If you have created any report selections, under Basic Information > Selection, you have the possibility to make a selection before clicking the Show report button. It can also be compulsory to make a selection. After you have clicked Show report, you can go back to the selection view by clicking the Change selection button.
Click the Print button to print the report. By clicking the Save as Excel button, you export the report to Excel. Each table in the report will constitute a separate worksheet in the Excel file.
© Artisan Global Media

Manual 233
Templates
Survey Templates One way of creating a new survey is to base it on a survey template, see New survey. After the survey has been created, you can also add more survey templates, with associated questions, to the survey. The Survey templates menu lets you create and edit these templates.
A survey template is created in the same way as a survey. You enter the basic information, create questions and specify a survey design.
Under Survey templates, you can also create so-called predefined reports. You decide which of the survey template's questions to include in the report, and how to present them. These predefined reports can then be easily created on surveys using the survey template.
The function Automation means that the application automatically can create and publish reports for a survey created from a certain survey template. Besides choosing how many days after the survey closure the reports are to be created and published, you can also choose which messages are to be sent to people concerned.
Creating New Survey Templates1. Click on New survey template under Survey templates in the main
menu. 2. Enter a template name. 3. Add other information about the survey on the same page. It is also
possible to do this at a later date, see Basic information . 4. Click on Create template.
Copying a Survey Template You can also create a survey template by copying an existing survey template.
1. Click on Copy template under Survey templates in the main menu. 2. A pop-up window appears. Click on the survey template you wish to
copy. You can click on the icon on the right side of the row to preview a survey template.
3. Enter a template name. The program will suggest a name based on that of the original template.
4. You can choose to enter the other information on the page either now or at a later date. See Basic Information.
5. Click the Create template button.
Finding Templates When you click Find template in the menu, a pop-up window opens where you see all survey templates you have the right to administer. Click on a template to edit it.
To search for a survey template, enter a whole or partial survey template name in the search field and click the Search button. You can also sort the list by clicking the desired heading.
© Artisan Global Media

Manual 234
Basic Information Here you edit the survey template's Properties , Introductory text, Header/Footer and Thank you message. The tab Properties is divided into the sub-tabs Basic Information, Settings, Layout, Access, Publishing and in some cases Automation. See the corresponding sections under Survey > Survey construction for more information.
SettingsUnder the heading Template settings in the Settings tab, you can select a Preferred position for the template and its associated questions, in the case where several templates are connected to the same survey. You can decide that the template should be placed at the Top or Bottom of the survey, or let it have a Free position. If several templates with the same position setting are connected to the survey, you will be able to choose their mutual order.
The setting The questions of the survey template are locked means that the questions from the survey templates cannot be edited or removed in surveys using the survey template. However, new questions can be added.
The setting Allow inserted questions between template questions activates the buttons for adding a new question above or below an existing question when you edit the separate survey. The questions of the template do not have to follow in a coherent section.
The setting Lock the questions in this template for editing under Survey Templates > Questions, once it has been used in a survey means that the questions in the survey template itself cannot be edited or removed. Nor is it possible to add new questions.
AccessUnder the tab Access and the heading Users that will be connected to the survey, you can add users and groups which are to be automatically added as authorized users on surveys created based on the survey template.
If you have created organisations under Administration > Organisations, you can under the tab Access and the heading Organisation Access also decide which organisations are to have access to the survey template.
Select the desired organisations by marking the check box next to them. The organisation you belong to (or, if you belong to several organisations, the one which is selected in the organisation drop down list) is already marked. To be able to give an organisation access to a survey template, you must belong to this organisation yourself.
If you have a hierarchical structure of organisations, any sub-organisations to selected organisations will automatically be selected. However, any parent organisations will not be automatically selected. The check box next to an organisation indicates that the organisation itself is not selected, but that it has sub-organisations which are selected. If you want the parent organisations to have access to the survey template, mark the check box Make template accessible to parent organisations.
The symbol to the right of an organisation indicates that the organisation has access to the survey template, while organisations without access have the symbol.
Finally, click the Save button.
© Artisan Global Media

Manual 235
AutomationThe tab Automation is only shown if the function Automation is activated under Administration > Settings > Surveys > Automation.
The function Automation means that the application automatically could create and publish reports for a survey created from a specific survey template. Besides choosing how many days after survey closure the reports are to be created and published, you can also choose which messages are to be sent to people concerned.
1. Decide if you want the automation function enabled for surveys based on this template. In that case, draw the switch button Automation to the right (the function is enabled).
2. Mark the check box if you want to lock the automation settings on surveys based on this template. These settings accordingly become coercive and cannot be adjusted for the separate survey.
3. Choose which system templates are to be used for:
• Survey was closed notification
• Reports created notification
• Reports published notification
4. Enter how many days after the survey closure the reports are to be created and published.
5. The table contains the predefined reports connected to this survey template. Read more about Predefined Reports.
6. Enter which of the predefined reports the automation should apply to.
For each report:
• Enter whether the users' questions should be included in the report.
• Define if the survey owner and/or the users should get a report created notification.
• Enter if you want the report to be published or not.
• Enter if the report published notification should be sent to the respondents of the survey.
Questions Under this menu you create the questions that are to be contained in the survey template. See the section on Questions in the Survey menu for more information.
If the setting Lock the questions in this template once it has been used in a survey has been activated, and if the template has been used in at least one survey, the questions of the survey template cannot be edited or removed.
This is indicated by the icon next to each question. Nor is it then possible to add new questions.
© Artisan Global Media
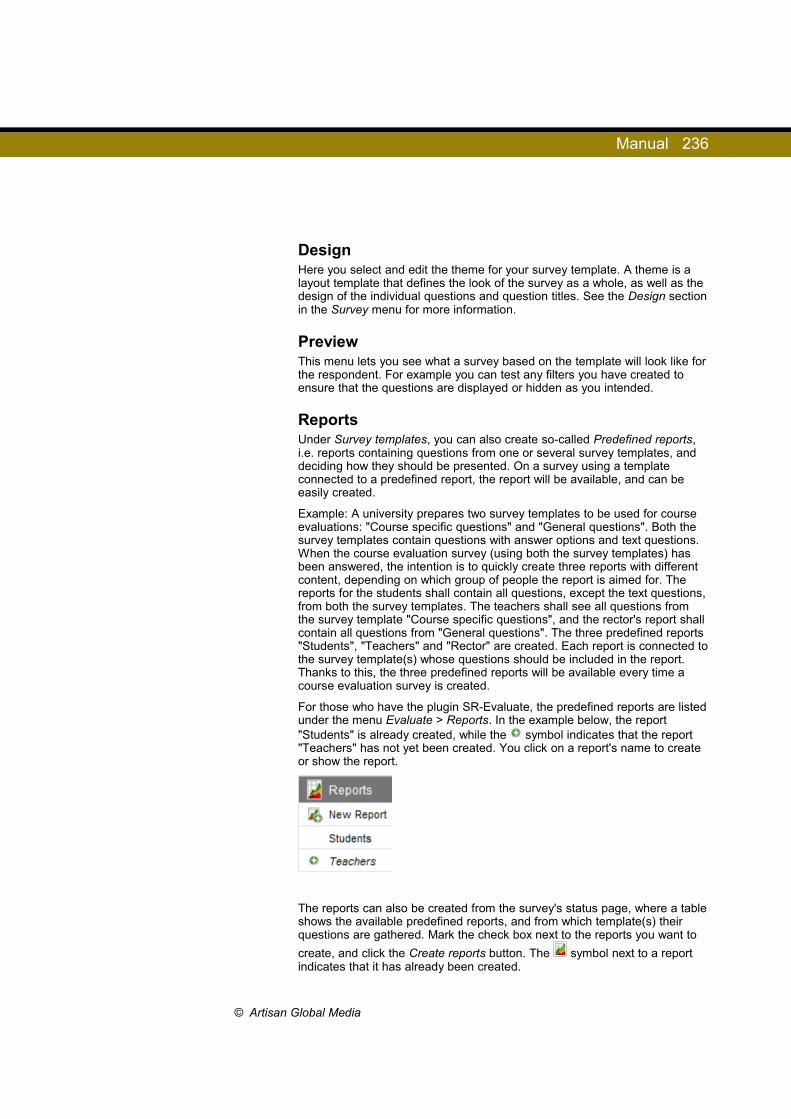
Manual 236
Design Here you select and edit the theme for your survey template. A theme is a layout template that defines the look of the survey as a whole, as well as the design of the individual questions and question titles. See the Design section in the Survey menu for more information.
Preview This menu lets you see what a survey based on the template will look like for the respondent. For example you can test any filters you have created to ensure that the questions are displayed or hidden as you intended.
ReportsUnder Survey templates, you can also create so-called Predefined reports, i.e. reports containing questions from one or several survey templates, and deciding how they should be presented. On a survey using a template connected to a predefined report, the report will be available, and can be easily created.
Example: A university prepares two survey templates to be used for course evaluations: "Course specific questions" and "General questions". Both the survey templates contain questions with answer options and text questions. When the course evaluation survey (using both the survey templates) has been answered, the intention is to quickly create three reports with different content, depending on which group of people the report is aimed for. The reports for the students shall contain all questions, except the text questions, from both the survey templates. The teachers shall see all questions from the survey template "Course specific questions", and the rector's report shall contain all questions from "General questions". The three predefined reports "Students", "Teachers" and "Rector" are created. Each report is connected to the survey template(s) whose questions should be included in the report. Thanks to this, the three predefined reports will be available every time a course evaluation survey is created.
For those who have the plugin SR-Evaluate, the predefined reports are listed under the menu Evaluate > Reports. In the example below, the report "Students" is already created, while the symbol indicates that the report "Teachers" has not yet been created. You click on a report's name to create or show the report.
The reports can also be created from the survey's status page, where a table shows the available predefined reports, and from which template(s) their questions are gathered. Mark the check box next to the reports you want to
create, and click the Create reports button. The symbol next to a report indicates that it has already been created.
© Artisan Global Media
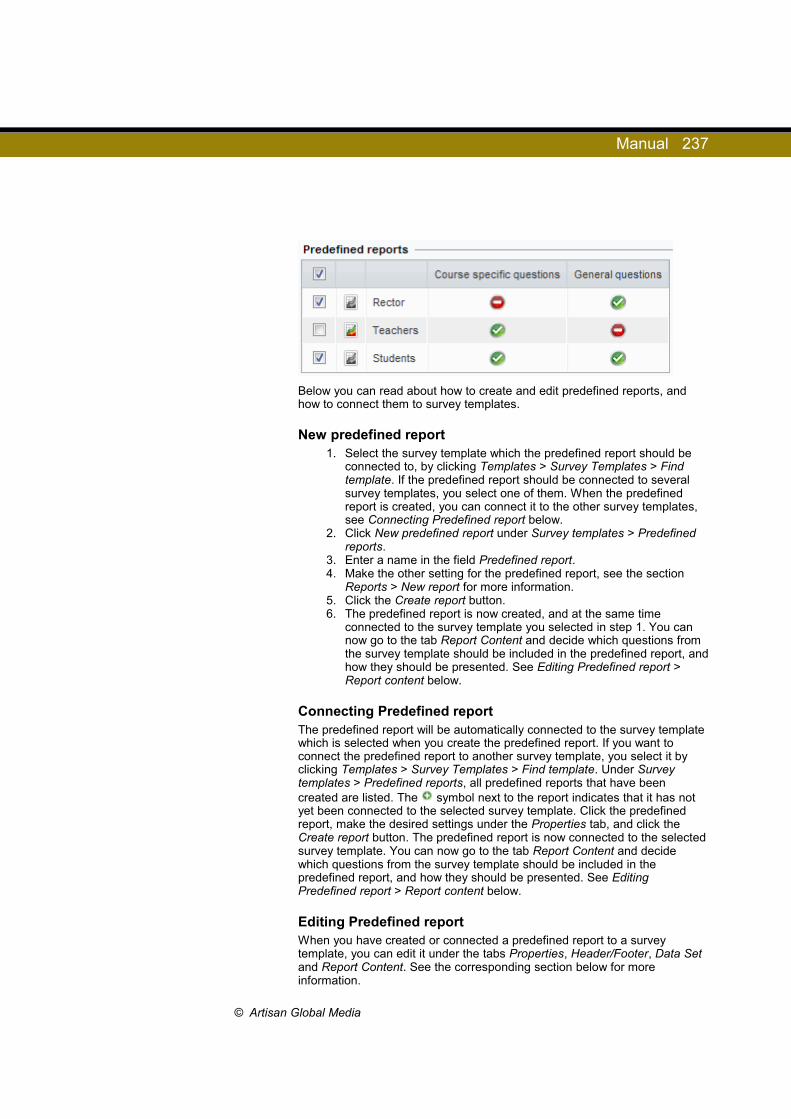
Manual 237
Below you can read about how to create and edit predefined reports, and how to connect them to survey templates.
New predefined report1. Select the survey template which the predefined report should be
connected to, by clicking Templates > Survey Templates > Find template. If the predefined report should be connected to several survey templates, you select one of them. When the predefined report is created, you can connect it to the other survey templates, see Connecting Predefined report below.
2. Click New predefined report under Survey templates > Predefined reports.
3. Enter a name in the field Predefined report.4. Make the other setting for the predefined report, see the section
Reports > New report for more information.5. Click the Create report button.6. The predefined report is now created, and at the same time
connected to the survey template you selected in step 1. You can now go to the tab Report Content and decide which questions from the survey template should be included in the predefined report, and how they should be presented. See Editing Predefined report > Report content below.
Connecting Predefined reportThe predefined report will be automatically connected to the survey template which is selected when you create the predefined report. If you want to connect the predefined report to another survey template, you select it by clicking Templates > Survey Templates > Find template. Under Survey templates > Predefined reports, all predefined reports that have been created are listed. The symbol next to the report indicates that it has not yet been connected to the selected survey template. Click the predefined report, make the desired settings under the Properties tab, and click the Create report button. The predefined report is now connected to the selected survey template. You can now go to the tab Report Content and decide which questions from the survey template should be included in the predefined report, and how they should be presented. See Editing Predefined report > Report content below.
Editing Predefined reportWhen you have created or connected a predefined report to a survey template, you can edit it under the tabs Properties, Header/Footer, Data Set and Report Content. See the corresponding section below for more information.
© Artisan Global Media
Manual 238
PropertiesHere you can see, and to some extent edit, the information you entered when you created the report. See the section Reports > Basic information > Properties for more information.
Header/FooterOn the Properties tab, you can specify whether headers and footers are to appear at the top and the bottom of each page in the report. If you select Custom at Type, you can customise the content and design in the Header/Footer tab. See the section Reports > Basic information > Header/Footer for more information.
Please note that a predefined report can be connected to more than one survey template, and that the predefined report can have different settings concerning header/footer on the different survey templates. If a survey is using several survey templates, and if these templates have different settings concerning header/footer, the settings for the survey template which is placed first in the survey (at the top of the list under Construction > Templates) will apply.
Data SetWhen you create or connect a predefined report to a survey template, a data set is created where all the questions from the survey template are converted into so-called variables. Before you start editing your report, you can process the variables here. See the section Reports > Data Set for more information.
If you add or remove questions in the survey template, these questions will not be automatically added/removed in the report. To update the report, you must rebuild the data set, so it corresponds to the questions of the survey template. Click the Rebuild data set button and confirm with OK. Note that any changes made in the Report Content menu will be overwritten. This means that you must go to the Report Content menu and once again decide which questions should be included, and how they should be presented. This affects predefined reports which are created after the change was made, but not reports already created.
You can add and remove answer options to the questions of the survey template, without having to rebuild the data set. However, if the questions are included in so-called computed variables (in SR-Advanced Report), you must rebuild the data set so that the computed variables are calculated correctly.
Report ContentHere you decide which questions from the survey template should be included in the predefined report, and how they should be presented. When creating or connecting a predefined report to the survey template, you select a report template to base the report on, in the Properties tab. This means that tables, charts and text elements are generated under Report Content for all questions in the survey template, based on the selected report template's settings. You can then edit the report content if necessary. Below you find a short description on how to remove questions, tables and charts. See Reports > Report Content for a detailed description on how to edit the content.
© Artisan Global Media

Manual 239
Removing question
Each question is presented in a so-called report item. Click the button to remove the report item (the question). Confirm by clicking OK.
Removing table/chart
Click the table/chart and select Remove. Confirm by clicking OK. You can then remove the section which the table/chart was placed in. Click the empty
section where the icon is displayed, and select Remove. Confirm by clicking OK.
Question Templates To facilitate the construction of new surveys, you can create question templates. For instance, if your surveys often contain the same set of answer options, you can create a question template that contains these answer options. This way you do not have to enter them all each time, and you can make sure that you don't ever forget any of them.
Editing Question Templates The Edit question templates page lets you both create and edit question templates. Each individual question type requires a custom question template or templates. The list on the left displays the different question types in a tree structure with the main branches Standard questions, Advanced questions (available only for those who have the Advanced Survey plug-in), and Informational texts. Expand the headings to display a list of subheadings under which the question types are grouped, eg. Single-choice, Multiple-choice, Matrix and so on. Click on a subheading to expand it and view the different types of questions.
You can expand the entire tree by clicking on above the list, or click on
to minimize it. If you click on a question type, any question templates that have been created for that type will appear in the right part of the window. You are then also able to create new ones.
You create question templates in the same way that you create questions for a survey. See the sections on Overview and Edit mode under Questions for more information.
If you use Organisations, you can under the tab Access decide which organisations are to have access to each question template. See this section for more information.
© Artisan Global Media
Manual 240
Translating Question Templates
By clicking the icon next to a question type, you can translate that question type’s templates into the languages that have been activated in the program.
The translation interface is divided into two sections. The left half is where you see the original text: just select which language to translate from (your source language). The right half is where you select which language to translate the text into. Every question and every answer option has its own line with a field where you type in the translation. To the right of the field is a
button which you click on if you want to format the text.
When translating, you can get some help by pressing the button. It gives you an automatic translation of the text and can be found between the two language fields (it then translates the entire text) as well as on each row (it then translates the text on that row). Since the translation is automated, it is advisable that you check that the proposed translation is accurate. Also, for the translation to work, a connection to a translation service must be set up in the Administration. Please refer to the Administration > Languages and Translations > Settings > Translation script section for more information on how to do this.
Previewing Question Templates On this page you get a preview of all the question templates that have been created for all question types.
AccessIf you have created organisations under Administration > Organisations, the
tab Access is available when you click the button to edit a question template. You can under this tab decide which organisations are to have access to the question template.
Select the desired organisations by marking the check box next to them. The organisation you belong to (or, if you belong to several organisations, the one which is selected in the organisation drop down list) is already marked. To be able to give an organisation access to a question template, you must belong to this organisation yourself.
If you have a hierarchical structure of organisations, any sub-organisations to selected organisations will automatically be selected. However, any parent organisations will not be automatically selected. The check box next to an organisation indicates that the organisation itself is not selected, but that it has sub-organisations which are selected. If you want the parent organisations to have access to the question template, mark the check box Make question template accessible to parent organisations.
The symbol to the right of an organisation indicates that the organisation has access to the question template, while organisations without access have the symbol.
Finally, click the Save button.
© Artisan Global Media
Manual 241
Report Templates
Editing Report Templates When you create a new report, you select a report template to use as a basis for it. The report template determines how the report's elements (tables, charts and text) are presented in the report. On this page you create and edit the report templates that are to be available for use.
You select the report template to edit, in the drop down list at the top of the page. From the start, there is only one report template called Default, but you can create more if necessary, see Creating New Report Templates below.
You create a new report template by defining how each question type (radio buttons, check boxes, etc.), and other variables, are to be presented. This is done in so-called item templates. From the start there is only one item template, called Default, for each question type, but you can create more if you need to present the question types in various ways, for instance with different types of charts, in different report templates. When you then save the report template, you select an item template for each question type.
Saving Changes to Report Templates1. Choose a report template in the drop down list at the top of the
page.
2. Expand all question types by clicking the button.3. Make your desired changes in the item templates, see Editing Item
Templates below.4. For each question type, mark the radio button next to the item
template you want to use.5. Click on Save.
Creating New Report Templates
1. Expand all question types by clicking on .2. Create new item templates if you need to, or edit existing templates,
see Editing Item Templates below.3. For each question type, mark the radio button next to the item
template you want to use.4. Click the Save as... button.5. Give the report template a name and click OK.
Deleting and Renaming Report TemplatesChoose a report template in the drop down list at the top of the page. To the right of the drop down list there are two buttons. Rename the template by
clicking the button. Type the new name and click OK. If you want to
remove the template, click the button and confirm by clicking OK.
© Artisan Global Media

Manual 242
Editing Item Templates All the different question types are displayed in a tree structure in the left part of the window. There you also find the headings Respondent Categories, Multilingual, Answer Date and SR-Advanced Report (if you have this plug-in). The question types are grouped under the headings Standard questions and Advanced questions (the latter is only available to those who have the SR-Advanced Survey plug-in) and subheadings such as Single-choice, Multiple-choice etc. Click the plus sign to expand a heading or a question type, or
click on the button to expand all question types.
Under every question type there is from the start an item template named Default. There you also find the option Use general, which you select if you want the question type to be presented in the way defined under the heading General. You find this heading in the tree structure, directly under Standard Questions and (if you have SR-Advanced Survey) Advanced Questions. Defining a general item template makes it easy to present all (or most of) the question types in the same way.
For every question type, there are also buttons used to create alternative ways of presenting the question type:
Create a new, empty item template
Create a copy of an existing item template
See Creating New Item Templates and Copying Item Templates below for more information.
Click on the item template to edit it. The edit mode view is similar to the overview found on the Reports > Report content page.
The item template is made up of the following components:
• Sections - areas containing various elements. A container can occupy the whole or half the width of the report.
• Elements - charts, tables and text
Sections
Adding Sections
To insert a new element (chart, table or text), you must first add a new section. Click on an existing empty section, or on an existing element, and select Add new above or Add new below in the menu that appears. An
empty section will be inserted, and is symbolized by this image .
Splitting Sections in Half
If you want to place two elements, for instance a table and a chart, next to each other in the report, you can split a section into two columns. Click on an empty section and select Split to two columns, the section now consists of two halves in which elements can be inserted. If you change your mind and want to have only one column again, you click on the section and select Merge columns.
© Artisan Global Media
Manual 243
Removing Sections
Only empty sections can be removed. If there are any elements in the section you wish to remove, you need to first remove the elements, see Removing elements below. Then click on the empty section and select Remove. Confirm with OK.
Elements Elements is a generic term for tables, charts and text. Charts and tables let you present your results, while the text elements are used to comment or clarify them.
Inserting Elements
To insert a new element (table, chart or text), you must first add a section, see Adding sections above. Click on an empty section, and select Add text item, Add table item or Add chart item. The element is added and the edit page for it is opened automatically.
Editing Elements
Click on an element and choose Edit ... to enter the edit mode for it. See the section on Reports > Report content for detailed information about editing tables, charts and text elements.
When you edit a text element that is to contain a question title or variable title, the editor provides you with buttons for inserting the Question title (the question title as specified in the survey), the Question number and Variable title (the variable's title in the data set).
In text elements, you can also insert Subquestion title. In SR-Advanced Report there are a number of matrix question types where you need to insert both {Subquestion title} and {Variable title} to display correct headlines in the report. These question types are:
• Matrix - Side by Side• Matrix open - Numeric• Matrix open -String• Matrix open - Date• Matrix open - Time
Removing Items
To remove an item, click on it and select Remove. Confirm your selection with OK.
Variable Settings
In the top right corner of each section is the button. When you click on it you can alter the settings regarding which variable types the section is to be displayed for. The selected setting is then symbolized by one of the following icons which can be found in the top left corner in the section:
• Any - the section is displayed for all variable types
• Numeric - the section is displayed for all question types that can have a numeric value, ie. questions with set answer options, numeric questions, and calendar questions.
© Artisan Global Media
Manual 244
• String - the section is displayed for those question types that only contain text, ie. Text boxes and Text areas.
Choose a suitable setting for the different sections. The section with the question title probably needs to be displayed for all variables whereas sections with frequency tables, statistical tables or charts are only relevant for numeric variables, and sections with data tables are used to present text variables.
On the Settings page you also find two check boxes that affect the presentation of question types that have multiple variables, for instance Matrices. These settings also result in certain symbols appearing in the sections' upper left corners.
• Repeat for all variables - one section is displayed for each variable (for question types with multiple variables). When a matrix question with five subquestions are presented, five sections will appear: one for each subquestion.
• Only active for multiple variables - The section will only be displayed if the question has several variables.
The five sections in the Item template named Default, have the following default settings:
• Text element for the question title
• Text element for the variable title
• Frequency table and chart (sectionwith two columns)
• Statistical Table
• Data table
The section with the variable title thus has the symbol which means that it will only be displayed for questions with multiple variables. For matrix questions, all subquestions will therefore receive the subquestion's title as their heading.
Enabling all SeriesWhen you enter the edit mode for a table or a chart, you will find the check box Enable all series under the Settings for series. Check this if you want all the variables (for question types with multiple variables, for example Matrices) to appear together in the table or chart. If, on the other hand, you would like to present the variables separately you leave the box unchecked and instead make sure that the setting Repeat for all variables is selected for the section. Then, as mentioned above, the section will be repeated for each variable.
Creating New Item Templates1. Expand the question type.
2. Click the button.3. Give the new template a name and click OK. It is advisable that the
name is descriptive, for instance, "Only frequency tables and bar charts".
© Artisan Global Media
Manual 245
4. The item template is now displayed under the specific question type, and you can start editing it immediately, see Editing item templates above.
Copying Item Templates1. Click on the item template you want to make a copy of, so that its
content is displayed in the right part of the window.2. Expand the question type where you want to create the copy.
3. Click the button.4. Give the new template a name and click OK. It is advisable that the
name is descriptive, for instance, "Only frequency tables and bar charts".
5. The item template is now displayed under the specific question type, and you can edit it if necessary, see Editing item templates above.
Deleting and Renaming Item TemplatesTo the right of each item template, there are two buttons. Rename the item
template by clicking the button. Type the new name and click OK. If
you want to remove the item template, click the button and confirm by clicking OK.
Survey Design
Survey ThemesA theme is a design template that defines the appearance of the survey as a whole, as well as the individidual questions and question titles. The Survey themes menu lets you create all the survey themes that are to be available for selection when choosing a theme for a new survey.
If you use Organisations, you can under the tab Access decide which organisations are to have access to each survey theme. See this section below for more information.
Editing Themes Choose the Theme you want to edit in the drop down list at the top of the page. From the start there is only one theme named Default theme. See information below on how to create new themes.
The drop down list Preview lets you select a survey which will then be displayed on the page as a sample. When editing the theme you then see, directly in the survey, a preview of the changes as they will appear in a survey.
© Artisan Global Media
Manual 246
To edit the theme, use the toolbox on the right side of the window. The different settings are grouped under three tabs: Survey, Question and Question Title. See the Design section in the Survey Construction menu for further details on the different functions.
Confirm your changes by clicking Save.
Creating New Themes You create a new theme by saving a copy of an existing theme.
1. Choose the Theme you want to base your new theme on in the drop down list at the top of the page.
2. Click the Save as... button. 3. Give the new theme a name and click OK.
The new theme has now been selected in the drop down list Theme and can be edited. For more information on this, please see above.
Removing ThemesOnly themes that are not used on any survey can be removed.
1. Choose the theme you wish to remove in the drop down list Theme at the top of the page.
2. Click the Remove button and confirm your selection by clicking OK.
Renaming Themes1. Choose the Theme you wish to rename in the drop down list at the
top of the page.
2. Click on the button to the right of the Theme drop down list. 3. Enter the new name in all languages and click OK.
Access
Owner and Authorized UsersUnder the tab Access, you decide who are to have access to the theme, when administering surveys. If no users or groups have been added under Authorized Users, the theme will be available for everyone. Follow these steps to add authorized users:
1. Click the Add... button2. Mark the check box next to the desired users or groups3. Click OK
If you want to remove a user or group from the list of authorized users, you mark its check box and click Remove.
In the Owner drop down list, the user who created the theme is pre-selected. Super administrators have the right to select another user (who has the right to administer survey themes) as owner. The owner has always the right to use the theme, even without being added as an authorized user.
© Artisan Global Media
Manual 247
Organisation AccessIf you have created organisations under Administration > Organisations, you can under the heading Organisation Access decide which organisations are to have access to the theme you are editing.
Select the desired organisations by marking the check box next to them. The organisation you belong to (or, if you belong to several organisations, the one which is selected in the organisation drop down list) is already marked. To be able to give an organisation access to a theme, you must belong to this organisation yourself.
If you have a hierarchical structure of organisations, any sub-organisations to selected organisations will automatically be selected. However, any parent organisations will not be automatically selected. The check box next to an organisation indicates that the organisation itself is not selected, but that it has sub-organisations which are selected. If you want the parent organisations to have access to the theme, mark the check box Make theme accessible to parent organisations.
The symbol to the right of an organisation indicates that the organisation has access to the theme, while organisations without access have the symbol.
Finally, click the Save button.
Note that if you want to give users access to the theme through their organisations, you shall not add any users or groups under Authorized Users (as described above). If you add authorized users, only these users will have access to the theme, and it is also required that their organisations are selected under Organisation Access.
Header
EditWhen you administer a survey, you can choose that a header should be displayed on each page in the survey. Under this menu, you create the headers which are to be available for selection under Survey > Survey Construction > Basic Information > Properties > Layout.
If you use Organisations, you can under the tab Access decide which organisations are to have access to each header. See this section for more information.
Creating new header1. Click the Create new button.2. Design the header in the editor. You can write and format text, and
insert images and links. See the section Survey > Survey Construction > Basic Information > Introductory text for information on how to insert and align images, and how to link to files and to web and e-mail addresses.
3. Click Save.
© Artisan Global Media

Manual 248
The header is automatically created in all active survey languages in the system. If you want a different header in one of the languages, you select this language in the drop down list above the editor, make your changes, and
click Save. By clicking the button next to the drop down list, you decide that the header for the selected language shall be used for all languages.
Creating a copy of a header1. Select the header you want to copy, in the drop down list at the top
of the page.2. Click the Clone button.3. Select a language in the drop down list above the editor.4. Make the desired changes.5. Click Save.
If you want the changes you made to be applied to all languages, click
the button. If not, repeat steps 3-5 above for the other languages.
Editing header1. Select the header you want to edit, in the drop down list at the top of
the page.2. Select a language in the drop down list above the editor.3. Make the desired changes.4. Click Save.
If you want the changes you made to be applied to all languages, click
the button. If not, repeat steps 2-4 above for the other languages.
Deleting header1. Select the header you want to delete, in the drop down list at the top
of the page.2. Click the Remove button.3. Confirm by clicking OK.
If you delete a header, the header will at the same time be removed from any surveys where it is used. On these surveys, the Header setting will be None.
AccessIf you have created organisations under Administration > Organisations, you can under the tab Access decide which organisations are to have access to the header which is selected in the drop down list at the top of the page.
Select the desired organisations by marking the check box next to them. The organisation you belong to (or, if you belong to several organisations, the one which is selected in the organisation drop down list) is already marked. To be able to give an organisation access to a header, you must belong to this organisation yourself.
If you have a hierarchical structure of organisations, any sub-organisations to selected organisations will automatically be selected. However, any parent organisations will not be automatically selected. The check box next to an organisation indicates that the organisation itself is not selected, but that it
© Artisan Global Media
Manual 249
has sub-organisations which are selected. If you want the parent organisations to have access to the header, mark the check box Make this accessible to parent organisations.
The symbol to the right of an organisation indicates that the organisation has access to the header, while organisations without access have the symbol.
Finally, click the Save button.
Footer
EditWhen you administer a survey, you can choose that a footer should be displayed on each page in the survey. Under this menu, you create the footers which are to be available for selection under Survey > Survey Construction > Basic Information > Properties > Layout.
If you use Organisations, you can under the tab Access decide which organisations are to have access to each footer. See this section for more information.
Creating new footer1. Click the Create new button.2. Design the footer in the editor. You can write and format text, and
insert images and links. See the section Survey > Survey Construction > Basic Information > Introductory text for information on how to insert and align images, and how to link to files and to web and e-mail addresses.
3. Click Save.
The footer is automatically created in all active survey languages in the system. If you want a different footer in one of the languages, you select this language in the drop down list above the editor, make your changes, and
click Save. By clicking the button next to the drop down list, you decide that the footer for the selected language shall be used for all languages.
Creating a copy of a footer1. Select the footer you want to copy, in the drop down list at the top of
the page.2. Click the Clone button.3. Select a language in the drop down list above the editor.4. Make the desired changes.5. Click Save.
If you want the changes you made to be applied to all languages, click
the button. If not, repeat steps 3-5 above for the other languages.
© Artisan Global Media

Manual 250
Editing footer1. Select the footer you want to edit, in the drop down list at the top of
the page.2. Select a language in the drop down list above the editor.3. Make the desired changes.4. Click Save.
If you want the changes you made to be applied to all languages, click
the button. If not, repeat steps 2-4 above for the other languages.
Deleting footer1. Select the footer you want to delete, in the drop down list at the top
of the page.2. Click the Remove button.3. Confirm by clicking OK.
If you delete a footer, the footer will at the same time be removed from any surveys where it is used. On these surveys, the Footer setting will be None.
AccessIf you have created organisations under Administration > Organisations, you can under the tab Access decide which organisations are to have access to the footer which is selected in the drop down list at the top of the page.
Select the desired organisations by marking the check box next to them. The organisation you belong to (or, if you belong to several organisations, the one which is selected in the organisation drop down list) is already marked. To be able to give an organisation access to a footer, you must belong to this organisation yourself.
If you have a hierarchical structure of organisations, any sub-organisations to selected organisations will automatically be selected. However, any parent organisations will not be automatically selected. The check box next to an organisation indicates that the organisation itself is not selected, but that it has sub-organisations which are selected. If you want the parent organisations to have access to the footer, mark the check box Make this accessible to parent organisations.
The symbol to the right of an organisation indicates that the organisation has access to the footer, while organisations without access have the symbol.
Finally, click the Save button.
© Artisan Global Media
Manual 251
Thank you message
EditWhen you administer a survey, you can choose that a thank you message should be displayed after the respondent has submitted the survey. Under this menu, you create the thank you messages which are to be available for selection under Survey > Survey Construction > Basic Information > Properties > Layout.
If you use Organisations, you can under the tab Access decide which organisations are to have access to each thank you message. See this section for more information.
Creating new thank you message1. Click the Create new button.2. Design the thank you message in the editor. You can write and
format text, and insert images and links. See the section Survey > Survey Construction > Basic Information > Introductory text for information on how to insert and align images, and how to link to files and to web and e-mail addresses.
3. Click Save.
The thank you message is automatically created in all active survey languages in the system. If you want a different thank you message in one of the languages, you select this language in the drop down list above the
editor, make your changes, and click Save. By clicking the button next to the drop down list, you decide that the thank you message for the selected language shall be used for all languages.
Creating a copy of a thank you message1. Select the thank you message you want to copy, in the drop down
list at the top of the page.2. Click the Clone button.3. Select a language in the drop down list above the editor.4. Make the desired changes.5. Click Save.
If you want the changes you made to be applied to all languages, click
the button. If not, repeat steps 3-5 above for the other languages.
Editing thank you message1. Select the thank you message you want to edit, in the drop down list
at the top of the page.2. Select a language in the drop down list above the editor.3. Make the desired changes.4. Click Save.
If you want the changes you made to be applied to all languages, click
the button. If not, repeat steps 2-4 above for the other languages.
© Artisan Global Media
Manual 252
Deleting thank you message1. Select the thank you message you want to delete, in the drop down
list at the top of the page.2. Click the Remove button.3. Confirm by clicking OK.
If you delete a thank you message, the thank you message will at the same time be removed from any surveys where it is used. On these surveys, the Thank you message setting will be Simple.
AccessIf you have created organisations under Administration > Organisations, you can under the tab Access decide which organisations are to have access to the thank you message which is selected in the drop down list at the top of the page.
Select the desired organisations by marking the check box next to them. The organisation you belong to (or, if you belong to several organisations, the one which is selected in the organisation drop down list) is already marked. To be able to give an organisation access to a thank you message, you must belong to this organisation yourself.
If you have a hierarchical structure of organisations, any sub-organisations to selected organisations will automatically be selected. However, any parent organisations will not be automatically selected. The check box next to an organisation indicates that the organisation itself is not selected, but that it has sub-organisations which are selected. If you want the parent organisations to have access to the thank you message, mark the check box Make this accessible to parent organisations.
The symbol to the right of an organisation indicates that the organisation has access to the thank you message, while organisations without access have the symbol.
Finally, click the Save button.
Report Design
Report ThemesThe report themes determine the look of the report in terms of the formatting of the text in question titles and tables, and the colours in the charts. On this page, you can create and edit different report themes. Later, you select which theme you want to use every time you create a report.
Editing Themes The Theme drop down list at the top lets you choose which theme you want to edit. From the start only one theme is available, the Default theme. See below for information on how to create new themes.
To make changes to the chosen theme, use the toolbar in the right part of the window. The settings under the tab Design are grouped under various
© Artisan Global Media

Manual 253
headings, see below. Click on the button to the right of the heading to display the settings. The Preview page then lets you see the effects of your changes. When you have finished editing, click on Save.
Settings for the Entire Report Under the Report heading, you select the overall settings for the report. However, the settings for the chart texts are made separately.
Fonts - choose from Arial, Comic Sans MS, Courier new, Georgia, Helvetica, Impact, Lucida Sans, Tahoma, Times new roman and Verdana
Text size - enter the size (as a percentage) for the contents of tables, and for the question titles
Text colour - select a general text colour by clicking on the coloured rectangle, or by entering a colour code directly in the field provided. You can later choose to use other text colours for specific parts of the tables, see below.
Settings for TablesSome settings can be made for specific parts of the tables. You find them under these headings:
• Table: Header row - the row in the table that shows headings such as the Number of responses and the Mean value
• Table: Rows - the rows in the table that contain actual data. To improve readability, you can for instance let every other row be of a different colour by specifying certain settings under Alternating colours
• Table: Summation row - the row at the bottom of the table that shows the table summations
• Contingency table: Header - the question heading for the background variable in a contingency table
• Contingency table: Answer options - the answer options for the background variable in a contingency table
You can choose the following settings:
Background colour - select a colour by clicking on the coloured rectangle, or by specifying a colour code.
Text colour - select a text colour by clicking on the coloured rectangle, or by entering a colour code.
Style - choose Bold, Italic and/or Underline
Chart Under the heading Chart, you can specify which colours are to be used, both for the actual chart and for the background. You can also decide which font to use for the charts.
Font - choose which font is to be used for the chart texts, i.e.the text in the legend and next to the axis.
Palette - choose the palette you want to use for the chart, for instance for the bars in a bar chart or for the sectors in a pie chart. Choose from a number of standard palettes, or create your own, see the section on Create Custom Palette.
© Artisan Global Media
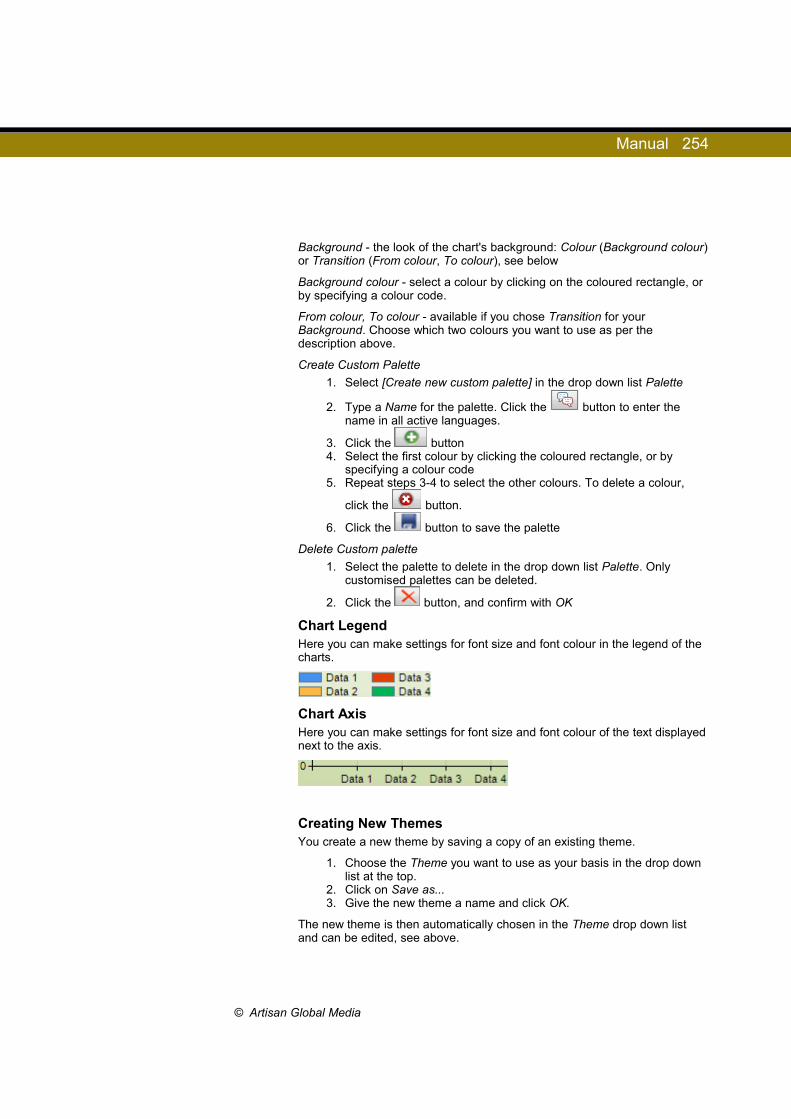
Manual 254
Background - the look of the chart's background: Colour (Background colour) or Transition (From colour, To colour), see below
Background colour - select a colour by clicking on the coloured rectangle, or by specifying a colour code.
From colour, To colour - available if you chose Transition for your Background. Choose which two colours you want to use as per the description above.
Create Custom Palette
1. Select [Create new custom palette] in the drop down list Palette
2. Type a Name for the palette. Click the button to enter the name in all active languages.
3. Click the button4. Select the first colour by clicking the coloured rectangle, or by
specifying a colour code5. Repeat steps 3-4 to select the other colours. To delete a colour,
click the button.
6. Click the button to save the palette
Delete Custom palette
1. Select the palette to delete in the drop down list Palette. Only customised palettes can be deleted.
2. Click the button, and confirm with OK
Chart LegendHere you can make settings for font size and font colour in the legend of the charts.
Chart AxisHere you can make settings for font size and font colour of the text displayed next to the axis.
Creating New Themes You create a new theme by saving a copy of an existing theme.
1. Choose the Theme you want to use as your basis in the drop down list at the top.
2. Click on Save as... 3. Give the new theme a name and click OK.
The new theme is then automatically chosen in the Theme drop down list and can be edited, see above.
© Artisan Global Media

Manual 255
Removing Themes 1. Choose the Theme you want to remove in the drop down list at the
top. 2. Click on the Remove button and confirm your selection by pressing
OK.
AccessIf you have created organisations under Administration > Organisations, you can under the tab Access decide which organisations are to have access to the theme you are editing.
Select the desired organisations by marking the check box next to them. The organisation you belong to (or, if you belong to several organisations, the one which is selected in the organisation drop down list) is already marked. To be able to give an organisation access to a theme, you must belong to this organisation yourself.
If you have a hierarchical structure of organisations, any sub-organisations to selected organisations will automatically be selected. However, any parent organisations will not be automatically selected. The check box next to an organisation indicates that the organisation itself is not selected, but that it has sub-organisations which are selected. If you want the parent organisations to have access to the theme, mark the check box Make theme accessible to parent organisations.
The symbol to the right of an organisation indicates that the organisation has access to the theme, while organisations without access have the symbol.
Finally, click the Save button.
Header
EditWhen you administer a report, you can choose that a header should be displayed on each page in the report when it is exported. Under this menu, you create the headers which are to be available for selection under Reports > Basic Information.
If you use Organisations, you can under the tab Access decide which organisations are to have access to each header. See this section for more information.
Creating new header1. Click the Create new button.2. Design the header in the editor. You can write and format text, and
insert images and links. See the section Survey > Survey Construction > Basic Information > Introductory text for information on how to insert and align images, and how to link to files and to web and e-mail addresses.
3. Click Save.
© Artisan Global Media
Manual 256
The header is automatically created in all active survey languages in the system. If you want a different header in one of the languages, you select this language in the drop down list above the editor, make your changes, and
click Save. By clicking the button next to the drop down list, you decide that the header for the selected language shall be used for all languages.
Creating a copy of a header1. Select the header you want to copy, in the drop down list at the top
of the page.2. Click the Clone button.3. Select a language in the drop down list above the editor.4. Make the desired changes.5. Click Save.
If you want the changes you made to be applied to all languages, click
the button. If not, repeat steps 3-5 above for the other languages.
Editing header1. Select the header you want to edit, in the drop down list at the top of
the page.2. Select a language in the drop down list above the editor.3. Make the desired changes.4. Click Save.
If you want the changes you made to be applied to all languages, click
the button. If not, repeat steps 2-4 above for the other languages.
Deleting header1. Select the header you want to delete, in the drop down list at the top
of the page.2. Click the Remove button.3. Confirm by clicking OK.
If you delete a header, the header will at the same time be removed from any reports where it is used. On these reports, the Header setting will be None.
AccessIf you have created organisations under Administration > Organisations, you can under the tab Access decide which organisations are to have access to the header which is selected in the drop down list at the top of the page.
Select the desired organisations by marking the check box next to them. The organisation you belong to (or, if you belong to several organisations, the one which is selected in the organisation drop down list) is already marked. To be able to give an organisation access to a header, you must belong to this organisation yourself.
If you have a hierarchical structure of organisations, any sub-organisations to selected organisations will automatically be selected. However, any parent organisations will not be automatically selected. The check box next to an organisation indicates that the organisation itself is not selected, but that it has sub-organisations which are selected. If you want the parent organisations to have access to the header, mark the check box Make this
© Artisan Global Media

Manual 257
accessible to parent organisations.
The symbol to the right of an organisation indicates that the organisation has access to the header, while organisations without access have the symbol.
Finally, click the Save button.
Footer
EditWhen you administer a report, you can choose that a footer should be displayed on each page in the report when it is exported. Under this menu, you create the footers which are to be available for selection under Reports > Basic Information.
If you use Organisations, you can under the tab Access decide which organisations are to have access to each footer. See this section for more information.
Creating new footer1. Click the Create new button.2. Design the footer in the editor. You can write and format text, and
insert images and links. See the section Survey > Survey Construction > Basic Information > Introductory text for information on how to insert and align images, and how to link to files and to web and e-mail addresses.
3. Click Save.
The footer is automatically created in all active survey languages in the system. If you want a different footer in one of the languages, you select this language in the drop down list above the editor, make your changes, and
click Save. By clicking the button next to the drop down list, you decide that the footer for the selected language shall be used for all languages.
Creating a copy of a footer1. Select the footer you want to copy, in the drop down list at the top of
the page.2. Click the Clone button.3. Select a language in the drop down list above the editor.4. Make the desired changes.5. Click Save.
If you want the changes you made to be applied to all languages, click
the button. If not, repeat steps 3-5 above for the other languages.
Editing footer1. Select the footer you want to edit, in the drop down list at the top of
the page.2. Select a language in the drop down list above the editor.3. Make the desired changes.4. Click Save.
© Artisan Global Media

Manual 258
If you want the changes you made to be applied to all languages, click
the button. If not, repeat steps 2-4 above for the other languages.
Deleting footer1. Select the footer you want to delete, in the drop down list at the top
of the page.2. Click the Remove button.3. Confirm by clicking OK.
If you delete a footer, the footer will at the same time be removed from any reports where it is used. On these reports, the Footer setting will be None.
AccessIf you have created organisations under Administration > Organisations, you can under the tab Access decide which organisations are to have access to the footer which is selected in the drop down list at the top of the page.
Select the desired organisations by marking the check box next to them. The organisation you belong to (or, if you belong to several organisations, the one which is selected in the organisation drop down list) is already marked. To be able to give an organisation access to a footer, you must belong to this organisation yourself.
If you have a hierarchical structure of organisations, any sub-organisations to selected organisations will automatically be selected. However, any parent organisations will not be automatically selected. The check box next to an organisation indicates that the organisation itself is not selected, but that it has sub-organisations which are selected. If you want the parent organisations to have access to the footer, mark the check box Make this accessible to parent organisations.
The symbol to the right of an organisation indicates that the organisation has access to the footer, while organisations without access have the symbol.
Finally, click the Save button.
© Artisan Global Media

Manual 259
Public Design
Header
EditIn those cases where the respondent does not access the survey via a direct link, he or she will instead arrive at a log-in page where a username and password needs to be used. From this page, the respondent may also go to a portal page that has links to all the surveys that he or she has been linked to, if this possibility has been activated under Administration > Settings > Surveys > General Settings.
You can create a custom design for this header for all the languages that are active in the program. First select the language version you want to edit the header for, in the drop down list above the editor.
The editor that appears then lets you enter and format text and insert links and images. See the section Survey > Survey Construction > Basic Information > Introductory text for information on how to insert and align images, and how to link to files and to web and e-mail addresses.
Finally, click the Save button.
© Artisan Global Media

Manual 260
Administration
Users
Users Here you manage the accounts for all the people who are to log in and work in the program, either with surveys or with reports. The Users interface is divided into the tabs List, Edit and From a File. If you have the plug-in SR-LDAP, you have also access to the tab Via LDAP.
List The List tab displays a list of all existing users. You can search for a user by typing in a search term in the field at the top of the page, and then clicking the Search button. You can use a full or a partial first name, last name, display name or user name. All users matching your search query will then be listed.
Sort the list according to different criteria by clicking the column heading of your choice. You can also filter the list by clicking the icon in the heading of the desired column, and enter the text you want to filter by in the text field. The icon indicates that the column is already filtered. If you want to remove the filtering, you click the icon, hover the cursor over the text field, and click in the upper right corner of the field.
Adding Users Click the Add user button. You are then transferred to the Edit tab where you can enter the new user's personal details, and assign group and organisation membership. See the Edit section for more information.
Editing UsersClick on one of the users in the list to to enter edit mode for that user. See the Edit section for more information.
Removing or anonymising users Search and mark one or several users in the match list. After clicking the button Remove, in the lower right corner, you can choose one of the following options:
• Inactivate: The user will disappear from the user administration and from all user listings in the application. However, the user’s name will still be visible on surveys, survey templates and reports the user is connected to, for example as an owner to a survey.
• Remove: The user will be removed completely. On surveys, survey templates and reports the user was connected to, “---” will be displayed instead of the name. The activity history will be removed as well.
Users can also be inactivated or removed from the register under the menu Personal data > Users.
© Artisan Global Media

Manual 261
Editing Users
User detailsWhen you click on a user in the List you will be transferred to the Edit tab which will then be given the selected user's name as its temporary heading.
In the User Information section you edit the respondent's personal details regarding:
• Display name
• First name
• Last name
• Street address
• Zip code
• City
• Country
• Telephone number
• Cell phone number
• Fax
• E-mail address
Under Active surveys, you can choose to limit the number of active surveys that a user is connected to by typing a number in the field Limit to [a specified number of] surveys. This means that once the user is connected to the number of (active) surveys you specified, he or she can no longer create new surveys. If you do not wish to restrict the numbers, select No limit.
Organisation Membership
If you have created organisations under Administration > Organisations, you decide at Organisation which organisation(s) the user is to belong to.
Through his/her organisation, the user will get access to:
• Using the templates which are connected to the organisation
• Viewing the respondents which are connected to the organisation, and connecting them to surveys
• Administering the surveys which are connected to the organisation (requires that the user through his/her group has the right Survey Access > All Surveys)
• Administering the reports which are connected to the organisation (requires that the user through his/her group has the right Report Access > All Reports)
Mark the check box next to the organisation(s) the user shall be member of. At least one organisation must be selected. If you have a hierarchical structure of organisations, any sub-organisations to selected organisations will automatically be selected.
© Artisan Global Media

Manual 262
By marking the symbol to the right, you can state which of the organisations should be used at the log-in in those cases when the user is a member of several organisations.
A drop down list with the symbol is displayed in upper right corner of the application window for users connected to two or more organisations. After logging in, the organisation according to the setting above will be selected. The user can select another organisation to work with from the selection list, and will then see only surveys, reports, templates and respondents connected to the current organisation.
Organisation membership can also be specified directly in the import file, if you choose to import the users from a file. Please refer to the section From a file for more information.
SettingsUnder Settings you can see the person's Username, but this can not be changed. If you click the Change password button you can enter a new password, and you then also need to confirm it. Click Save to carry out your selected changes.
You cannot change your own password here. Instead, click on your name in the top right corner, above the program workspace. Select Change password in the menu that then opens and enter the new information in the pop-up window that appears. If you click on My profile, a pop-up window appears where you can change your first and last name, display name and e-mail address. In this menu, you can also change the program language and log out of the program.
Group Membership
At Groups, you mark the check box next to the group(s) the user is to belong to. Using groups is a way to assign rights to users. For each group, you can state which rights the group's members are to have, for example which menus in the program, and which functions, they shall have access to.
When you start using the program, there are as default the groups Administrators, Users, Interviewers (if you have the plug-in SR-Advanced Survey) and Report Readers (if you have the plug-in SR-Advanced Report). In the section Administration > Users > Groups, you can read about how to create new groups, and which rights you can assign to a group.
Group membership can also be specified directly in the import file, if you choose to import the users from a file. Please refer to the section From a file for more information.
By marking the check box Super Administrator, you make sure that the user's group membership only decides which menus the user will have access to. When it comes to functions, a super administrator will have unlimited rights.
There must always be at least one super administrator in the system.
© Artisan Global Media

Manual 263
SR-Evaluate
If you use the plug-in SR-Evaluate, you can decide on user level if the tab Evaluate should be visible in the left side menu or not.
Respondent FilterIf you have the plug-in SR-Advanced Report, you have when you edit users with one of the roles User, Report Reader or Interviewer access to the button Edit respondent filter. When you click this button, you can connect the user to the respondent categories/subcategories that have been created in the program. Depending on which group the user belongs to, this connection gives different rights concerning the respondents belonging to these categories:
• User - when administering a survey, the user will only be able to see and connect the respondents belonging to the categories he/she is connected to.
• Report Reader - In subreports, respondent categories can be used as selection to decide which respondent's answers each report reader is allowed to see. When the report reader is connected to a subreport where a respondent category is used as selection, the subcategories the report reader is connected to will be pre-selected (but possible to change) in the selection.
• Interviewer - when the interviewer is connected to a survey, he/she will only be able to answer the survey on behalf of the respondents belonging to the categories he/she is connected to.
Editing a respondent filter
1. Click the Edit respondent filter button.
2. Click on a respondent category in the list to the left.
3. In the list to the right, mark the check box next to the sub categories you want to connect the report reader to.
4. Repeat step 2-3 for the other respondent categories. In the list to the left you can for each respondent category see the number of selected sub categories, e.g. (1/4) if one of a total of four sub categories has been selected. Respondent categories with at least one selected sub category are displayed in bold. Note that for respondent categories where no subcategories have been selected, all subcategories will be regarded as selected.
5. Confirm by clicking OK
6. Click the Save button
Respondent filters can also be specified directly in the import file, if you choose to import the users from a file. Please refer to the section From a file for more information.
© Artisan Global Media

Manual 264
Removing or anonymising the user After clicking the button Remove, in the lower right corner, you can choose one of the following options:
• Inactivate: The user will disappear from the user administration and from all user listings in the application. However, the user’s name will still be visible on surveys, survey templates and reports the user is connected to, for example as an owner to a survey.
• Remove: The user will be removed completely. On surveys, survey templates and reports the user was connected to, “---” will be displayed instead of the name. The activity history will be removed as well.
Log in as...If you have the role Super Administrator, you can use the button Log in as... in order to test how the role for the current user works. When you want to return to your own user role, you have to log out and log in as yourself.
From a FileYou can add several users at the same time, by importing them from a file. For the import to work, the import file must be based on the template available in the program.
Click the link UserImport.xlsx next to Template and open the template file. The order of the column headings may not be changed.
Type or paste the user's details into the file. The only required field is Username (column A).
In column D, with the heading Groups, you specify which group(s) the user is to belong to. Using groups is a way to assign rights to users. For each group, you can state which rights the group's members are to have, for example which menus in the program they shall have access to.
After clicking in the cell, you can use the arrow button to choose among the valid values:
If the field Groups (column D) is left blank, or if an invalid value has been specified, the user will be imported to the Group Users. In cells with an invalid value, a symbol will be displayed:
© Artisan Global Media

Manual 265
A user in Survey&Report can at the same time belong to several groups. In the example below, the details of the user Mary is entered in row 2, including the group Interviewers. By leaving the field Username blank in row 3, or by entering the same user name as in the row above, you tell that this row is also reserved for the same user, and you can there enter the group Report readers. Please note that all the other user details (column A-M) for Mary is specified in row 2.
In column N, with the heading Organisation, you specify which organisation(s) the user is to belong to. This is applicable only if you have created organisations under Administration > Organisations. Through his/her organisation, the user will get access to the templates, surveys, reports and respondents which are connected to the organisation.
After clicking in the cell, you can use the arrow button to choose among the valid values:
If the field Organisation (column N) is left blank, or if an invalid value has been specified, the user will be imported to the Main Organisation.
To specify an organisation on a lower level in the organisation structure, you use the > character to separate the levels. In the example below, the organisation IT is located directly under Main Organisation, and the organisation Support is a child organisation to IT. The image shows the correct way of specifying Main Organisation, IT and Support, respectively.
You can connect a user to several organisations. In the image below, you see the same user as in the example above, but with the columns B-M hidden. Since the field Username was left blank on row 3, this row is reserved for the user Mary. In the example, she is connected to the two organisations Support and Development, which are both sub-organisations to the organisation IT. The organisation Support will be the user's primary organisation, since it is specified in the user's first row.
© Artisan Global Media

Manual 266
In each column heading, you can click on an arrow button to open a shortcut menu with sorting and filtering options. You can filter the list, for example to find a user or to hide any blank rows. The sorting function may not be used if there are users whose details are placed in two rows, since the lines will then be sorted incorrectly.
If you have the plug-in SR-Advanced Report, you can in the import file also connect the user to the respondent categories/subcategories that have been created in the program. Depending on which group the user belongs to, this connection gives different rights concerning the respondents belonging to these categories. Read more about this function, Respondent filter, in the Edit section.
The respondent categories can be found in the column O and onwards. Just as in the columns Groups and Organisation, you can click in a cell and then use the arrow button to choose among the valid values:
You can connect a user to several subcategories. In the image below, you see the same user as in the example above, but with the columns B-N hidden. Since the field Username was left blank on row 3, this row is reserved for the user Mary. In the example, she is connected to the two subcategories Finance and Sales in the respondent category Department.
When you have prepared the import file and saved it, you click the button and browse for the file. Click the Upload file button and then OK.
Under Users to import, the users in the file are listed with First name, Last name, E-mail address, Username and Groups. New users are listed with
the symbol. If the user name already exists in the system, the symbol is displayed next to the user. If you choose to import an existing user, the user's details, including group and organisation membership, will be overwritten by the details in the file.
By clicking the button next to a user, you open the Edit respondent filter window where you can check any connections to respondent categories/subcategories that have been prepared in the import file, and make changes if necessary. See the section Respondent filter for more information on how to edit respondent filters.
© Artisan Global Media
Manual 267
Make sure the check box is marked next to the users you want to import. By marking/unmarking the check box in the header row you select/deselect all the respondents' check boxes at once. Click on Import selected users. The users will then be imported to the program.
From LDAP This option is only available for those who have the SR-LDAP plug-in. The function makes possible the import of users from a directory service. In order for the import to work, the necessary settings must have been selected under Administration > LDAP. Please refer to this section for more information on how the setup is done.
When an LDAP source has been configured, you can follow these steps to import new users:
1. Select an LDAP source in the drop down list at the top.
2. Under Search, one or more search fields are displayed, depending on the settings that were chosen for the LDAP. Enter the search terms of your choice in the search fields. The * character can be used as a wildcard to represent zero, one or more characters.
3. Depending on how the settings were configured, the drop down lists named Use grouping and Group by may be displayed. Select a grouping type in the Use grouping drop down list, then mark the check boxes for the options you wish to use in the Group by drop down list.
4. Click the Search button.
5. Those users that match your search are then listed on the page together with one of the following icons:
(The user is not yet in the program database)
(The user is already in the program database).
6. Mark the check boxes next to the users you want to import. By marking/unmarking the check box in the header row you mark/unmark all users' check boxes at once.
7. Click on Import selected users.
8. A pop-up window opens where you mark, under Groups, which group(s) the imported users shall belong to. Using groups is a way to assign rights to users. For each group, you can state which rights the group's members are to have, for example which menus in the program they shall have access to. If you import users who are already in the database, you have the possibility to decide that their current group membership shall be replaced with the settings you specify here, by marking the check box Apply on update.
9. Under the heading Organisation Access, you mark the check box next to the organisation(s) the imported users shall belong to. This is applicable only if you have created organisations under Administration > Organisations. Through his/her organisation, the user will get access to the templates, surveys, reports and respondents which are connected to the organisation.
© Artisan Global Media

Manual 268
If you import users who are already in the database, you have the possibility to decide that their current organisation membership shall be replaced with the settings you specify here, by marking the check box Apply on update.
If the LDAP import has a defined organisation mapping depending on LDAP attribute values, you have access to the check box Keep LDAP-defined organisation if available. Mark this check box if you want the organisation membership of the users you import to be decided by their LDAP attribute value. However, a user who does not have a value on the organisation attribute, will be connected to the organisation(s) specified in the pop-up window.
10. Click OK.
Groups In Survey&Report, you assign rights to users by connecting them to one or more groups. For each group, you can specify which rights the group's members are to have, for example which menus in the program they shall have access to.
Under the tab Groups, you administer these user groups, and decide which rights each group shall have.
Groups can also be connected to surveys, and thereby the group's members get the right to administer the survey.
List On the List page you find information about all the existing groups. The groups at the top are so-called system groups, i.e. they are there from the start when the program is installed. The system groups are:
• Administrators • Users • Interviewers – (only available for those who have the SR-Advanced
Survey plug-in)• Report Readers (only available for those who have the SR-
Advanced Report plug-in)
The system groups have the symbol, while any groups you have created
yourself have the symbol.
Adding Groups Click on Add group. You are then automatically transferred to the Edit tab where you enter a name and description for the new group, and specify the user rights that are to apply to all members of the group. Here you can also connect users to the group. See the Edit section for more information.
Editing Groups Click on a group in the list to enter the edit mode for the group. See the Edit section for more information.
© Artisan Global Media
Manual 269
Removing Groups Mark the check box at the group(s) you want to remove. If you mark/unmark the check box in the header row you mark/unmark all groups at once. Click on Delete group(s) and confirm with OK.
NB. System groups cannot be removed.
PropertiesIn the Properties, you can edit the group name and any descriptive text that may have been entered there.
Click the button if multiple languages are active in the program, and you want to translate the name or description. By clicking the button you open a translation window. In the left part of the window, select the language you want to translate from (your source language), and in the right part, the language you want to translate into.
Click the button which you can find between the language fields to make an automatic translation. It is advisable that you check that the proposed translation is correct. Also, for the automatic translation to work, access to a translation service must be set up in the Administration. See the section on Languages and translations for more information about this. Last, save your translation by clicking OK.
Maximum number of respondents per survey - If the function Limit amount of respondents per survey is enabled in the system, you can deviate from the general setting on system level concerning the users in this group. If a user should be a part of more than one user group, the highest limit is applied.
Message to display when user tries to exceed the limit - Design the message that the respondent will receive in the same moment as he/she tries to add more respondents to the survey than allowed. Using the editor you can, for example, add images and links. The message can be translated into other languages.
UsersUnder the heading Users, the users who are already connected to the group are listed with first name, last name and user name. Sort the list according to different criteria by clicking the column heading of your choice. You can also filter the list by clicking the icon in the heading of the desired column, and enter the text you want to filter by in the text field. The icon indicates that the column is already filtered. If you want to remove the filtering, you click the icon, hover the cursor over the text field, and click in the upper right corner of the field.
Here you can also add users to the group by clicking the Add... button, or remove users from the group by clicking the Remove button.
© Artisan Global Media
Manual 270
User RightsUnder the heading User rights, you can assign user rights on group level. All users who belong to the group will be given these rights automatically. The rights are sorted under one tab per section.
• Surveys
• Available question types
• Reports
• Templates
• Administration
• Personal data
• API user rights
• Report Readers
• Interviewers
• Evaluate
For each menu/function you specify which of the following settings that will apply to the group:
• None: the group has not access to the menu/function
• View: the group has access to viewing the menu/function
• Modify: the group has access to modifying the menu/function
• Deny: the group's members have not access to the menu/function, even if they belong to other groups which have access to it
If a user belongs to several groups with different settings for a menu/function, the setting with the highest priority will apply, according to this priority order:
1. Deny
2. Modify
3. View
4. None
Example 1: A user belongs to two groups. One of the groups has the setting None for a menu/function, and the other one has the setting Modify. Since the setting Modify has the highest priority, the user will have access to modifying the menu/function.
Example 2: A user belongs to two groups. One of the groups has the setting Deny for a menu/function, and the other one has the setting Modify. Since the setting Deny has the highest priority, the user will not have access to the menu/function.
A user's total rights is the sum of the rights assigned to all the groups he/she belongs to. You can give the system group Users the rights you want all users to have as their basic rights, and let all users belong to this group. In addition, you can create your own groups to give selected users access to specific menus/functions. In these groups' user right settings, you select the
© Artisan Global Media

Manual 271
setting Modify for the menus/functions you want to give the group members access to. For the other menus/functions, you can select the setting None, since the users already have the basic rights as members of the system group Users. In that way, you can use the groups you create yourself to assign extra rights to certain users, in addition to the rights they have as members of the group Users.
Related rightsBetween certain user rights there is a relationship which means that a user, to get access to a certain menu/function, must have one or more other rights. Example: For a user to have access to creating questions on a survey, he/she must belong to a group that have the setting Modify on the Questions menu. In addition, the user must also, through his/her groups, have the setting View on the Survey menu and on the Construction menu, since the Questions menu is located under these menus.
Since users can get their rights from several groups, the settings for an individual group are made independently from one another. This means that the fact that you choose a setting for a certain menu/function, does not automatically affect the setting for any other menu/function. For that reason, remember to give the group you are editing all necessary rights, for example rights to any parent menus.
Under the headings below you can, among other things, read more about the rights which are related to other rights.
Surveys
Survey Menu
You give the group access to the Survey menu, and its various sub-menus. You give fundamental right to the menu by selecting the setting View on Survey Menu, and on the sub-menus Survey Construction and/or Data Collection. Thereafter you specify which parts of these sub-menus the user group should have reading or editing rights in.
Detailed settings:
• Under the setting Survey Construction > Questions you can assign the right to use a different theme on question level.
• Under settings for Survey Construction > Design you assign the right to save settings for Theme and Questions when the user work in the window Customise theme with a specific survey.
• Settings for Respondents decide how users in this group can add new respondents to a survey; from the respondent database, another survey, an Email list, a file, via LDAP and/or one respondent at a time using the button New respondent.
N.B. For users to have access to creating surveys, they must, through their groups, have the setting Modify on both Create new surveys and on Basic Information.
© Artisan Global Media

Manual 272
Other Survey Rights
Survey Access:
• You decide if the group is to have access to Assigned surveys (the surveys the users have been connected to as authorized users) or All surveys. If you have created organisations under Administration > Organisations, users who through their group have the right All surveys, will only see the surveys connected to their organisation(s).
Respondent Management (For users to have access to these functions, they must, through their groups, have access to the Respondents menu.):
• Select columns in respondent list - The user gets access to
the button where he/she can select which columns to show in the respondent list.
• The right Quick edit respondents gives access to the button Start quick edit which lets you edit the respondent information directly in the respondent list. and LDAP import (the right to import respondents via LDAP, in the plug-in SR-LDAP). For users to have access to these functions, they must, through their groups, have access to the Respondents menu.
Survey Administration:
• Add authorised users regardless of organisation
• Increase the respondent limit up to the personal maximum, on survey level - If the function Limit number of respondents per survey is enabled in the system, a user can circumvent the limitation by making another user, with a higher respondent limit, an authorised user of the survey. The new user then has two possibilities to help out:
• Alternative 1: The new user adds the missing respondents in the survey since this user is granted a higher number of respondents.
• Alternative 2: With the right Increase the respondent limit up to the individual maximum the new user can go to the page Survey > Properties > Access instead and increase the respondent limitation for this specific survey. The difference from alternative 1 is that the new user with a higher respondent limit leaves the adding of the last respondents to the survey owner.
• Ignore respondent limits - A user with this right is excluded from the settings to limit the number of respondents per survey, both on system level and user group level. Since such a user does not have limit to consider, he or she can add an unlimited number of respondents to the surveys which he/she is made an authorised user of. (Compare with alternative 1 above.) Similarly, he/she does not have a ceiling and is, in this way, able to write a new respondent limit as high as he/she like. (Compare to alternative 2 above.)
© Artisan Global Media

Manual 273
Available question typesThe settings under this tab allow the administrator to control access to different question types for the user groups. These settings work in combination with the settings under Administration > Settings > Survey > Question types where you make a basic setting for all users in the system. Via the setting on this page, you make adjustments for the current user group by adding extra question types (View) or removing question types (Deny) in comparison with the default setting.
Reports
Reports Menu
On this page you give the group access to the Reports menu, and its various sub-menus. You give fundamental right to the menu by selecting the setting View on Reports Menu.
N.B. For users to have access to creating reports, they must, through their groups, have the setting Modify on both Create new reports and on Basic Information.
Report Access
Under this heading, you decide if the group is to have access to Assigned reports (the reports based on surveys the users have been connected to as authorized users) or All reports. If you have created organisations under Administration > Organisations, users who through their group have the right All reports, will only see the reports connected to their organisation(s).
Templates
Templates Menu
You can give the group access to the Templates menu, and its various sub-menus. You give fundamental right to the menu by selecting the setting View on Templates Menu, and on the sub-menus Survey Templates, Survey Design, Report Design and/or Public Design.
Detailed settings:
• Survey Templates: The settings decide if you are allowed to add your own templates, and/or use existing templates, as well as editing existing templates.
• Survey design: The right to edit Survey theme is assigned separately from the right to edit the other three parts; Header, Footer and Thank you massage.
• Report design: The right to edit Report theme is assigned separately from the right to edit Header and Footer.
Edit theme with style sheet editor (CSS)
is shown for those who have the right to edit the general theme of surveys, as well as for those who can customise the theme on survey level. This gives extra possibilities to affect the appearance of the survey.
© Artisan Global Media
Manual 274
Administration
Administration Menu
You can give the group access to the Administration menu, and its various sub-menus. You give fundamental right to the menu by selecting the setting View on Administration Menu.
Detailed settings:
• Settings for Respondents determine how users in the group can add new respondents to the respondent database; from an import file, and/or manually via the button New respondent.
• The menu Emails and Mailings can contain either one, two or three areas depending on what the users in the group should be able to edit; Mailing templates, Mailing schedule, and E-mail accounts.
Administration Access
• At File manager, you select the setting View if the group is to have access to the menu Administration > File Manager.
By clicking the and buttons you can reach the file manager from various interfaces in the program. If you want to give the group access to the file manager through these buttons, it is sufficient to give access to My files and/or Public files. The setting My files gives each user access to a personal folder, which only the user himself/herself (and super administrators) have access to. If the user shall be able to upload new files in this folder, he/she needs the setting Modify. The Public files folder is mutual for all users. If the user shall be able to insert files from this folder, he/she needs the setting View.
• At LDAP import (only with the plug-in SR-LDAP), you decide if the group should be able to import users and respondents through LDAP under the Administration menu.
Personal data• Personal Data Report: The user can search for a name, username,
or an Email address in the system and generate a report on how it is used.
• Settings: In this page you set which consent forms you use in different situations.
• Consent - Survey: The editing of the consent form the respondent approves before answering the survey. The user also has the right to edit the information text for denied consent. (The content of these forms can then be edited at the survey level.)
• Consent - Add Respondent: The editing of the consent form that the user approves before respondents are added to the survey.
• Consent - User: The editing of the consent form that the user approves before the user identity is created in SR. (Applies to Windows Authentication or SAML)
• Consent - Add user: The editing of the consent form that an administrator approves before entering new users into SR.
© Artisan Global Media

Manual 275
API User rightsSurvey & Report has an application programming interface (API) that can be used if the user has been assigned this right.
By typing the extension /services/api.svc/help after your URL address, you can read more about the requests that can be used.
Report ReadersThe rights under this heading are intended primarily for the system group Report Readers (only in the plug-in SR-Advanced Report). As default, this group has the setting View at Report Reader Menu, which gives the users the right to see the reports they have been connected to, as report readers. On each report, they can also be given the right to see the respondents connected to the survey which the report is based on, and also the right to answer the survey on these respondents' behalf.
At Respondent Answers, you specify the group's right to see and edit already submitted answers. This right only applies to reports where the report readers have been given the right to answer the survey on the respondents' behalf.
This menu should not be combined with the Reports Menu since the Report Reader Menu automatically activates limitations in the report management.
InterviewersThe rights under this heading are intended primarily for the system group Interviewers (only in the plug-in SR-Advanced Survey). As default, this group has the setting View at Interviewer Menu, which gives the users the right to answer the survey on the respondents' behalf, on the surveys they have been connected to as authorized users.
At Respondent Answers, you specify the group's right to see and edit already submitted answers.
This menu should not be combined with the Survey Menu since the Interviewer Menu automatically activates limitations in the survey management.
EvaluateHere you give the group access to the Evaluate menu (only in the plug-in SR-Evaluate), and its various sub-menus. Using the Evaluate menu is an alternative to work under the ordinary menus Survey and Reports.
Since the Evaluate menu contains the same menu options as the menus Survey and Reports, any changes of the rights under Survey Menu and Reports Menu will automatically be made also under Evaluate Menu, and vice versa. This applies to the menu options under Evaluate Menu which are indicated by the symbol.
Deleting GroupsIf you want to remove the group you are editing, click on Delete Group and confirm by clicking OK.
© Artisan Global Media

Manual 276
Respondents
Respondents Here you manage the respondents that have been imported to the respondent database, either via this menu, Administration, or directly into a survey.
You have the possibility to search for respondents and show them in a list, see Searching for Respondents below. If you click the Search button without entering any search argument, all respondents in the respondent database will be listed. However, it is possible to limit the maximum number of respondents in the search result, under Administration > Respondents > Settings > Other settings.
The respondents are listed with the headings the administrator has selected to be shown as default. This is defined per user group under Administration >
Respondents > Settings > Group specific settings. If you click the button, you can decide for yourself which columns to display, by marking the check box next to the desired columns.
Sort the list according to different criteria by clicking the column heading of your choice. You can also filter the list by clicking the icon in the heading of the desired column, and enter the text you want to filter by in the text field. If you, for example, filter the E-mail address column by the text @artologik.com, only the respondents with e-mail addresses matching this text will be displayed. The icon indicates that the column is already filtered. If you want to remove the filtering, you click the icon, hover the cursor over the text field, and click in the upper right corner of the field.
Click the icon to the far right on the respondent's row to edit the respondent. See the Editing Respondents section for more information.
The list of respondents is divided into several pages. Toggle between the pages by clicking the buttons at the bottom of the page.
There are different ways to toggle between the pages:
• Click the desired page number
• Go one page backwards or forwards by clicking the and icon respectively
• Go to the first or last page by clicking the and icon respectively
© Artisan Global Media
Manual 277
Searching for Respondents It is possible to search for respondents in two different search modes:
• Simple search - a single search field is displayed at the top of the page. You can enter and search for: - First name - Last name - Organisation - E-mail address- Street address - Zip code - City - Country - Phone number- Cell phone number
• Extended search mode - a complete search form is provided and you can use all the fields in the respondent details in your search: - ID - First name - Last name - Organisation - E-mail address- Street address - Zip code - City - Country - Phone number- Cell phone number- Language - LDAP source (only with the SR-LDAP plug-in) - Respondent owner (only available if the function has been activated under Administration > Settings > Surveys > General settings)- Respondents who have edited their personal data- Respondent categories- Respondent properties
Go to the advanced search by clicking the button next to the Search button.
In the text fields you can enter both partial and complete search terms or words. A search for, for instance, John provides you with hits for both John and Johnson.
Editing Respondents
To edit a respondent, click the button on the far right on the respondent's row. See the Edit respondent section for information on editing respondents. See also Quick Editing below.
© Artisan Global Media

Manual 278
Quick EditingThe Quick edit feature allows you to edit the respondent by clicking on various fields directly in the list. To view more columns in the list, and thus be
able to edit them, click the button and mark the check box next to the columns you want to view.
1. Click on the Start quick edit button. The icon will be displayed in any field in the list that can be edited.
2. Click on the field you want to edit and make your desired changes. 3. Use the Tab key (forward) and Shift + Tab (backward) to move
quickly between the fields. Use the Enter key (down) and Shift + Enter (up) to edit the fields on a column-by-column basis. The changes are saved automatically when you leave the field.
4. Click on the Exit quick edit mode to return to the normal page mode.
Removing Respondents1. Mark the check box next to the respondent(s) you wish to remove
from the database. By marking/unmarking the check box in the header row you mark/unmark all the respondents at once.
2. Click on the Remove button.
3. Confirm your choice by pressing OK.
Adding Respondents When you work with a survey under Data Collection, you can import respondents directly to your survey. Here in the administration you can import respondents to the built-in respondent database, without linking them to a specific survey. The respondents you have imported, you can then connect to surveys via Add respondents... > From the respondent database in the Data Collection > Respondents menu.
Click the Add Respondents... button. In the pop-up window that opens, you can add respondents via three different ways:
• The button New respondent• The tab From a file - import respondents via an import file• The tab Via LDAP - import respondents via a directory service. This
requires the SR-LDAP plug-in.
See the corresponding section for more information.
New respondentUse this method to add individual respondents to the respondent database. If you need to add a large number of new respondents, you use one of the other methods instead.
1. Click the New respondent button.
2. Enter the respondent's personal data. At least one of the fields First Name, Last Name or E-mail Address must be entered.
3. Enter the appropriate values for the respondent categories and respondent properties of your choice.
© Artisan Global Media

Manual 279
4. Select what type of respondent the log-in applies to:
• Respondent - Every respondent submits one answered survey each
• Multi Respondent - this alternative fits following situations:
• One respondent is supposed to answer the same survey on different occasions
• The Log-in is used by several people who send in an answer each
5. If the Multi Respondent alternative is chosen, you also enter the maximum number of survey answers that can be submitted per survey. (If you import respondents from a file, you only enter the maximum number. Those who are not of the type multi respondent should have 1 as maximum.)
The connections of the multi-respondent to respondent categories and properties follow all submitted answers. This makes it possible to filter the respondent data later on.
A multi-respondent cannot save the survey in order to continue later. The entire survey must be answered on the same occasion.
6. Under the heading Log-in Details, click the Manage log-in button to specify a username and password for the respondent. See the section on Managing Login Details under Editing Respondents for more information. It is possible to skip this step, the respondent will then be assigned an automatic username and password generated by the program.
7. Click Save. The respondent is now saved in the respondent database.
8. If you have created organisations under Administration > Organisations, you can under the heading Organisation Access decide which organisations are to have access to the respondent, by marking the check box next to the desired organisations. The organisation you belong to (or, if you belong to several organisations, the one which is selected in the organisation drop down list) is already marked. To be able to give an organisation access to respondents, you must belong to this organisation yourself.
If you have a hierarchical structure of organisations, any parent organisations to selected organisations will automatically be selected. The symbol to the right of an organisation indicates that the organisation has access to the respondent, while organisations without access have the symbol.
© Artisan Global Media

Manual 280
From a File This is a convenient way to quickly import new respondents to the respondent database. The import is done via a file in one of the following formats:
• Text (.txt) • Text (.tab) • Text (.csv) • Excel (.xls) • Excel (.xlsx)
Under Sample files, you will find the following sample files:
• import.txt• import.tab• import.csv• import.xls• import.xls (include categories and language codes) - contains
information about valid values for respondent categories and languages
• import.xlsx (with multi category support) - note that this file has specific characteristics, described in the section Multiple-choice of subcategories below
The files contain a header with the available fields in the respondent details, as well as the respondent categories that are active in the program.
If you wish, you can use one of the sample files when creating your own import file. Just delete the names that are already in the file and add your own respondents' details instead. Remember to leave the first row as is, as it will be considered a header row by the program. Also, leave the headings' names unchanged, as the program will then be able to automatically match the columns with the corresponding fields in the program.
Naturally, it is also possible to create your own import file without using one of the sample files. For instance, you may have a record (such as a member list) of all your respondents which you can then export to an Excel file. In that case, the file will still need to be structured so that the first row is left for all the headings. You decide yourself which columns you want to have in the import file. However, you must make sure that the import file contains columns corresponding to the fields which the administrator has defined as key fields. The key fields make a respondent unique, i.e. two respondents cannot have identical values in these fields. For that reason, the import file must contain columns which can be matched with the key fields. It does not matter in which order the columns are arranged.
During the import, you will be able to manually match the columns in the import file with the corresponding fields in the program. If you want the matching to be made automatically, you make sure that the column headings in the import file have exactly the same name as the corresponding fields in the program. For example, a column with the heading E-mail address will be matched with the field E-mail address, while a column with the heading Email will not be automatically matched.
© Artisan Global Media

Manual 281
Respondent Categories
Information about which respondent categories a respondent should belong to, can also be specified in the import file. For a respondent category, multiple-choice can be allowed, i.e. a respondent can be connected to more than one of its subcategories. It is also possible to create respondent categories with subcategories in several levels in a hierarchical structure.
If you only have respondent categories with single-choice, and with subcategories in only one level, you can create your own import file, or base it on one of the first five sample files, as described above.
If you, on the other hand, want to import respondents and connect them to more than one of a respondent category's subcategories (respondent categories with multiple-choice, and/or respondent categories with subcategories in several levels), you must use the last sample file, import.xlsx (with multi category support). See the section Multiple-choice of subcategories below.
Multiple-choice of subcategories
Click the link Import.xlsx (with multi category support) under Sample files and open the file. Note that the order of the column headings may not be changed when you use this file for the import.
Type or paste the respondents' details into the file. For each respondent, it is required to fill in at least one of the fields First name, Last name or E-mail address.
The respondent categories can be found in column O and onwards. After clicking in a cell, you can use the arrow button to choose among the valid values:
In cells with an invalid value, a symbol will be displayed:
If a respondent category has subcategories in several levels, each level has its own column. In the example below, the respondent category Department has subcategories in two levels. On the first level, the subcategory Sales has been selected, and on the second level the subcategory Brittish market.
If multiple-choice is allowed for the respondent category, you can in the file connect a respondent to more than one of its subcategories. In the example below, the details of the respondent Mary is entered in row 2 (the columns F-N are hidden). By leaving the five key fields First name, Last name, Organization, E-mail address and Language blank in row 3, or by entering identical details in the key fields as in the row above, you reserve also this
© Artisan Global Media
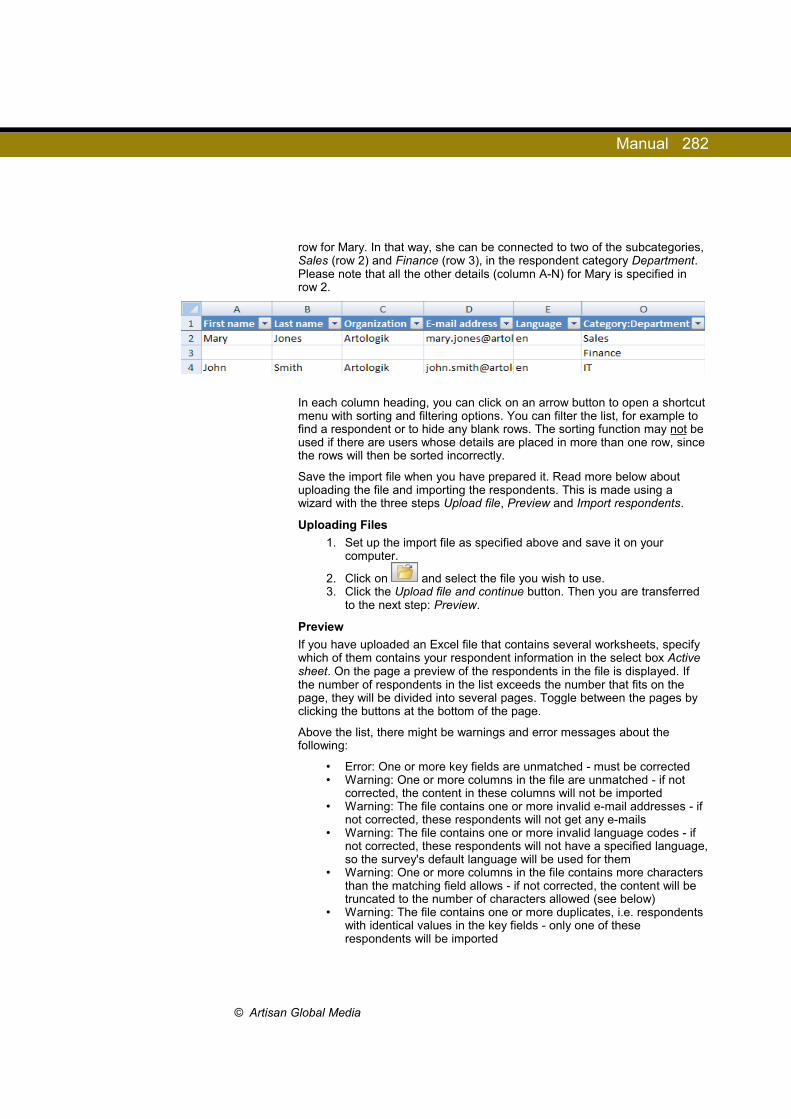
Manual 282
row for Mary. In that way, she can be connected to two of the subcategories, Sales (row 2) and Finance (row 3), in the respondent category Department. Please note that all the other details (column A-N) for Mary is specified in row 2.
In each column heading, you can click on an arrow button to open a shortcut menu with sorting and filtering options. You can filter the list, for example to find a respondent or to hide any blank rows. The sorting function may not be used if there are users whose details are placed in more than one row, since the rows will then be sorted incorrectly.
Save the import file when you have prepared it. Read more below about uploading the file and importing the respondents. This is made using a wizard with the three steps Upload file, Preview and Import respondents.
Uploading Files
1. Set up the import file as specified above and save it on your computer.
2. Click on and select the file you wish to use. 3. Click the Upload file and continue button. Then you are transferred
to the next step: Preview.
Preview
If you have uploaded an Excel file that contains several worksheets, specify which of them contains your respondent information in the select box Active sheet. On the page a preview of the respondents in the file is displayed. If the number of respondents in the list exceeds the number that fits on the page, they will be divided into several pages. Toggle between the pages by clicking the buttons at the bottom of the page.
Above the list, there might be warnings and error messages about the following:
• Error: One or more key fields are unmatched - must be corrected• Warning: One or more columns in the file are unmatched - if not
corrected, the content in these columns will not be imported• Warning: The file contains one or more invalid e-mail addresses - if
not corrected, these respondents will not get any e-mails• Warning: The file contains one or more invalid language codes - if
not corrected, these respondents will not have a specified language, so the survey's default language will be used for them
• Warning: One or more columns in the file contains more characters than the matching field allows - if not corrected, the content will be truncated to the number of characters allowed (see below)
• Warning: The file contains one or more duplicates, i.e. respondents with identical values in the key fields - only one of these respondents will be imported
© Artisan Global Media
Manual 283
The error message about unmatched key fields must be corrected by clicking the Match fields for import button, before you can click the Next button and proceed. The key fields make a respondent unique, i.e. two respondents cannot have identical values in these fields. See the section Matching Fields for Import below, for information on how to match the fields.
The warnings inform you about things that should be corrected before proceeding. However, it is possible to ignore the warnings and proceed by clicking the Next button.
Regarding the number of characters allowed, the fields have the following limitations on the number of characters they may contain:
• 16 characters - Zip code• 64 characters - User name, Password, Phone number and Cell
phone number• 128 characters - E-mail address, City, Country and Domain• 255 characters - First name, Last name, Organisation and Street
address
If the content of a field in the import file is too long, the value will be truncated to the number of characters allowed.
In the column to the far left, the icon is displayed next to the respondents who have invalid values. The icon is also displayed next to the invalid value. Next to respondents who are duplicates, and for that reason will not be imported, the icon is displayed. By clicking the icon in the heading of the far left column, you can filter the list and display only the respondents who need to be corrected. Select among these options:
• Show valid• Show invalid• Show duplicates
To edit an invalid value, you click on the respondent's row. The icon is then displayed in all fields. Click the icon in the field you want to edit, and enter the new value. To exclude a respondent who you do not want to import,
click the respondent's row and then the icon in the column to the far left. The respondent is then displayed in grey strikethrough text. You can include
the respondent again by clicking the icon.
Click the Next button to proceed to the last step: Import respondents. If you use organisations, there will be an extra step in the wizard where you decide which organisations are to have access to the respondents, see the section Organisation Access below.
Matching Fields for Import
If necessary, you can click on the Match fields for import button to make sure that the columns in the file are matched with the corresponding fields in the program. If the columns in the import file have exactly the same name as the corresponding fields in the program, a correct matching will be made automatically. For example, a column with the heading E-mail address will be matched with the field E-mail address, while a column with the heading Email will not be automatically matched.
Under Column names (from file) the column headers from the import file are displayed, together with the field in the program which the column currently
© Artisan Global Media

Manual 284
is matched with. The letter C in the left part of the field indicates that the field is a respondent category, while respondent properties is symbolized by the letter P. Certain fields have a key symbol. These are the key fields, which means that two respondents cannot have identical values in all these fields. The key fields must always be matched with a column in the file, before the import can be completed.
If a field is matched with the wrong column heading, you do like this to achieve a correct matching:
1. Hover the mouse over the field you wish to move, the cursor then turns into a move cursor.
2. Drag the field to the correct column heading, and drop it there. The field that was previously matched with the column, is replaced and moved to the column Available fields for matching. This column displays all fields which are currently not matched with a column in the import file.
To easily discover any not matched columns, you can mark the check box Hide matched columns.
Confirm the matching by clicking OK.
Organisation Access
This step is available only if you have created organisations under Administration > Organisations. Then you can here decide which organisations are to have access to the respondents, by marking the check box next to the desired organisations. The organisation you belong to (or, if you belong to several organisations, the one which is selected in the organisation drop down list) is already marked. To be able to give an organisation access to respondents, you must belong to this organisation yourself.
If you have a hierarchical structure of organisations, any parent organisations to selected organisations will automatically be selected. The symbol to the right of an organisation indicates that the organisation has access to the respondents, while organisations without access have the symbol.
Import
In the final step in the wizard it is time to import the respondents.
In the list of respondents, make sure the check boxes are marked next to the respondents you wish to import. By marking/unmarking the check box in the title row you mark/unmark all the respondents' check boxes at once.
The icon next to a respondent indicates that there is a respondent in the database whose details in the key fields are identical. If you continue the import of this respondent, the existing respondent's details will be updated, using the data from the import file. Only fields which are matched to a column in the import file will be updated. A respondent's log-in details (username and password) will not be updated if the person is connected to an active survey, or if he or she was imported via LDAP (using the SR-LDAP plug-in).
Click the Add button. The respondents are now imported to the respondent database.
If you want to you can let the program make a random selection from the
© Artisan Global Media
Manual 285
respondents in the import file. Click the button next to the Add button, and select one of the options that results in a random selection. See the section Random selection of respondents under Data Collection > Respondents > Add respondents > From the respondent database for more information.
Via LDAP This option requires the SR-LDAP plug-in. The plug-in makes it possible to import respondents via a directory service. For the import to work, the necessary settings must have been chosen under Administration > LDAP. Please refer to this section for information on how this is done.
After you have set up an LDAP source, do the following to import respondents via LDAP:
1. Select an LDAP source in the drop down list at the top of the page.2. Under the heading Search, you find one or more search fields.
Which search fields are available, and which attributes in the directory service you can search for, is decided under Administration > LDAP. Enter a search argument. Use the * character as a wildcard. Click the Search button.
3. The users matching your search are listed. The users have one of the following symbols:
(is not yet in the respondent database)
(is already in the respondent database)4. Mark the check box next to the respondent or respondents you wish
to import. By marking/unmarking the check box in the title row, you mark/unmark all the respondents' check boxes at once.
5. Click on Import selected respondents. The respondents are now imported to the respondent database.
If you have created organisations under Administration > Organisations, the pop-up window Organisation Access opens when you click Import selected respondents. There you can decide which organisations are to have access to the respondents, by marking the check box next to the desired organisations. The organisation you belong to (or, if you belong to several organisations, the one which is selected in the organisation drop down list) is already marked. To be able to give an organisation access to respondents, you must belong to this organisation yourself.
If you have a hierarchical structure of organisations, any parent organisations to selected organisations will automatically be selected. The symbol to the right of an organisation indicates that the organisation has access to the respondents, while organisations without access have the symbol.
© Artisan Global Media
Manual 286
Editing Respondents
When you click the icon to the right of the respondent's row in the respondent list, a pop-up window opens where you can edit the respondent's personal data. In the pop-up window, you also find the tab Surveys where you can see which surveys the respondent is connected to, and the tab Message History where you find a list of all the e-mails that have been sent to the respondent.
Under the the tab Respondent details you can edit the respondent's personal data.
• ID - is assigned automatically by the program
• Display name - will automatically be Last name, First name
• First name
• Last name
• Organisation
• E-mail address
• Street address
• Zip code
• City
• Country
• Phone number
• Cell phone number
• LDAP address - if the respondent was imported via LDAP. Only available with the SR-LDAP plug-in.
• Language - choose between all active respondent languages
• Repondent type - choose between respondent and multi respondent. Read more about multi-respondent in the section Respondents > Add Respondents.
• Respondent owner (if the setting has been activated on the General settings page under Administration > Settings > Surveys) - which program user is responsible for the respondent. If the The respondent is hidden check box is marked, he or she will only be visible to the Respondent owner and the system administrators.
The respondent categories that were created by the administrator are displayed and can be edited under Categories. Respondent categories are used to enter known background facts about respondents and can then be used in the Reports section for doing cross tabulations and for filtering and sorting data.
For each respondent category, you can select the desired subcategory in a selection list. If the respondent category has subcategories in several levels, a plus sign is displayed under the selection list, with a dotted line starting from the bottom of the selection list.
© Artisan Global Media
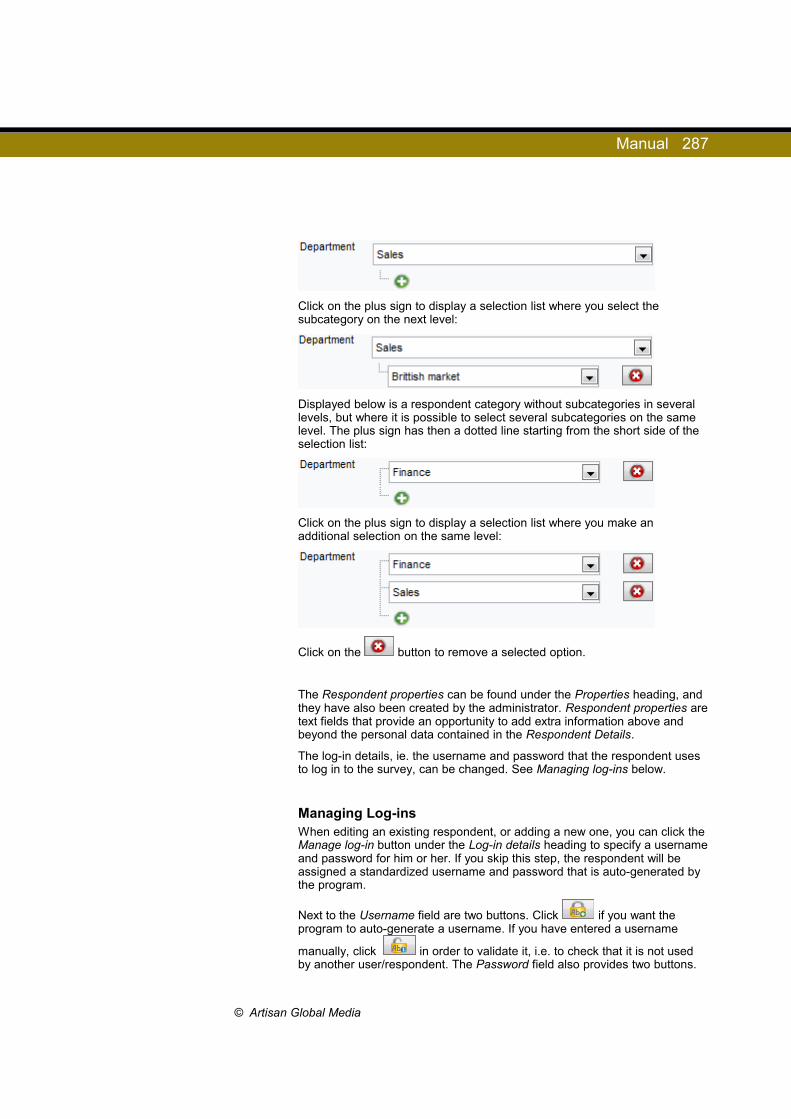
Manual 287
Click on the plus sign to display a selection list where you select the subcategory on the next level:
Displayed below is a respondent category without subcategories in several levels, but where it is possible to select several subcategories on the same level. The plus sign has then a dotted line starting from the short side of the selection list:
Click on the plus sign to display a selection list where you make an additional selection on the same level:
Click on the button to remove a selected option.
The Respondent properties can be found under the Properties heading, and they have also been created by the administrator. Respondent properties are text fields that provide an opportunity to add extra information above and beyond the personal data contained in the Respondent Details.
The log-in details, ie. the username and password that the respondent uses to log in to the survey, can be changed. See Managing log-ins below.
Managing Log-ins When editing an existing respondent, or adding a new one, you can click the Manage log-in button under the Log-in details heading to specify a username and password for him or her. If you skip this step, the respondent will be assigned a standardized username and password that is auto-generated by the program.
Next to the Username field are two buttons. Click if you want the program to auto-generate a username. If you have entered a username
manually, click in order to validate it, i.e. to check that it is not used by another user/respondent. The Password field also provides two buttons.
© Artisan Global Media

Manual 288
Click to auto-generate a password. You can also enter your own
password. The button displays the password using normal characters, which is useful if you do not want to distribute the log-in details via an automated e-mail from the program.
The Domain field is available for those who have the SR-LDAP plug-in. The field is then automatically filled out when a respondent is imported via LDAP.
Respondent AttributesHere you manage all the general Respondent properties and Respondent categories that are to be available for use in the program. The survey-specific respondent categories are managed on a separate tab.
Respondent PropertiesWhen you add a respondent, you can enter information in a number of set fields such as City and Phone number. When you then want to search for a respondent, you can use these fields for your search terms. You can also choose which fields to display in the results, and to sort the list by them.
If you wish to record additional information about the respondents you can create new fields in the respondent details by adding respondent properties. These respondent properties are text fields that can be used in the same way as the other fields, ie. to search for or to sort the respondents.
NB: The respondent properties cannot be used as background variables in the reports section. For this purpose you need to use Respondent categories. Please see this section for more information.
Creating Respondent Properties1. Click on Add property... 2. Enter a name for the property in all the languages that are active in
the program. 3. Save.
Renaming Respondent Properties1. Click on the name of the respondent property you want to change. 2. Change the name in the (active) languages of your choice. 3. Save.
Changing the Order of The Presentation The respondent details display the respondent properties as text fields under Properties. They are presented in the same order that they appear here in the administration. To change the order of presentation place the cursor over
the symbol at one of the respondent properties, drag it to its new location and drop it there. Confirm the new location by clicking on Save sort order.
Removing Respondent Properties
1. Click on the button. 2. Confirm you selection by pressing OK.
© Artisan Global Media

Manual 289
Respondent CategoriesIt might be the case that you have background information about your respondents that you want to use as background variables in the reports section. To avoid having to ask for such, already known, information in the surveys, you can create respondent categories, with suitable subcategories. You can for instance create a respondent category such as Gender with the two subcategories Male and Female. You then need to enter the correct value for each respondent category in each respondent's personal details.
When creating a new survey, you need to specify which respondent categories you want to include. This is done in the the Basic information. In the reports section, respondent categories can then be presented and used in the same way as if they were questions in the survey, eg. to cross tabulate questions or create reports.
You can build a hierarchical structure of respondent categories, with unlimited number of levels. You can also allow multiple-choice for a respondent category, i.e. make it possible to connect a respondent to several subcategories.
Creating Respondent CategoriesWhen you go to the Categories tab, you have a column to the left with any respondent categories already created. At the top you find a number of buttons.
1. Click the button.2. Enter a name for the category in all the languages that are active in
the program. Click Save and close.3. Click on the new category. A second column is displayed to the right
of the first one.4. Click the button above the second column to create the first
subcategory. 5. Enter a name (in all languages) and click Save. 6. Repeat step 5 to create the other subcategories.Click Save and
close. The subcategories are displayed in the second column.7. If you want to create an additional level of subcategories, you click a
category in the second column, and then the button above the third column. In that way you can build a hierarchical structure with the desired number of levels. Each level is symbolized by a new column.
Renaming Categories and Subcategories 1. Click on the respondent category or subcategory you want to
rename.
2. Click the button above the column.3. Change the name (in any active language). 4. Save and close.
Single-choice or multiple-choiceYou can allow multiple-choice for a respondent category, i.e. make it possible to connect a respondent to several subcategories. If the respondent category has subcategories in several levels, multiple-choice will be possible in all levels.
© Artisan Global Media
Manual 290
In the column to the far left, a symbol next to the category name indicates if single-choice or multiple-choice is allowed for the respondent category:
Single-choice (default when a new category is created)
Multiple-choice
When you click on a respondent category, you can change this setting by clicking one of these buttons above the column:
Allow multiple-choice
Only single-choice
Changing the Presentation OrderYou control the order in which the respondent categories/subcategories are displayed in the program, for example in the window where you choose to link them to a survey. To change the presentation order, place the cursor over a respondent category, drag it to its new location and drop it there. Confirm the new order by clicking Save.
Removing/Deactivating Respondent CategoriesOnly respondent categories/subcategories that are not used on any survey can be removed. A respondent category that is connected to a survey appears in bold text in the list. Such a category cannot be removed, but it can be deactivated. This means that in the future it will not be possible to link the category to surveys or respondents.
Click on the category and then on the button above the column, to remove/deactivate the category. Confirm with OK.
Activate Respondent CategoriesIt is possible to reactivate respondent categories or subcategories that have been deactivated. Click on the Display inactive button to see all the categories that have been deactivated, (they are displayed in grey, italic text). To reactivate a respondent category, click on the category and then on
the button above the column.
Survey-Specific Categories In the section Administration > Respondents > Respondent attributes > Categories, you can read about how repondent categories are created and used. In addition to the general respondent categories that you create on that page, you can also create so-called survey-specific categories. These categories are created and used for a specific survey, but the user that created the survey-specific category is then able to use it on other surveys he or she may create or be connected to. It is, however, not visible to other users.
The tab, Survey-specific categories, lets you edit and remove/inactivate these categories. This is done in the same way as for the general respondent categories. Please refer to the section Administration > Respondents > Respondent attributes > Categories for more information.
© Artisan Global Media

Manual 291
Respondent category linksYou use links between respondent categories if the report is based on two or more surveys where the respondent categories and possible sub-categories are not the same. Hence you need to indicate which respondent categories and sub-categories correspond to each other, concerning respective survey.
This match is then used by the selection lists in hierarchy reports. Example: You made an employee satisfaction survey two years ago and you have done the same survey now. The difference is that the organisation is changed. In this case the application needs instructions regarding how the different parts in the existing organisation correspond to the different parts in the former organisation.
The defined respondent category links are presented in a list.On the row of each definition you can find three icons:
A small window shows the respondent categories that the links apply to when you sweep cursor over the icon.
Click this icon if you want to change matches or delete them.
Click this icon if you want to delete this definition of links.
Creating or editing a respondent category link1. Click Create category link ... in the lower, right corner of the page if
you want to create a new category link.
2. Using the selection lists in the newly opened window, you choose which two categories you want to match. Click OK.
3. Title your defined links and go to step 6.
4. in order to edit an existing category link.
5. You can see the structure of the two respondent categories in a window each.
6. in front of respective sub-category, you can expand, or minimize the different levels in the three of sub-categories.
7. If there are many sub-categories it might pay off to use the search box above respective tree. As you write the name of the sub-category, the matches gets fewer and fewer and it is a lot easier to find the right sub-level.
8. If a sub-category in the hierarchy tree (to the left or right) has a stated match, the sub-category is marked by a green tic.
9. If the window contains wrong respondent categories, you can change one or both respondent categories by clicking the button Change categories... in the lower, left corner of the window. You will then return to step 2.
10. Click OK to save when you are finished editing the category links and want to quit the window.
© Artisan Global Media
Manual 292
Add a link
When you choose which sub-categories from respective respondent category that are matching, it does not matter in which order you work; if you start from the left tree and mark matches in the right one or the other way around.
1. Click to the left of, or on the sub-category itself, in either tree. The sub-category will be marked by a green field.
2. to the right of the green field, if you want to make a search in the other tree.
to the right of the search field (above the other tree) in order to end the search.
3. as you approach the cursor) for the corresponding sub-category in the other tree to enter the match. Both of the matched sub-categories are now marked with a green tic.
Please notice that two or more sub-categories in one of the respondent categories can be matched to the same sub-category in the other respondent category. For example, if the respondent category is a company, one of the company departments could have been divided in two separate departments by next survey. Another scenario could be that two departments have been merged.
Checking or deleting a link
1. Click a sub-category with a green tic. It is then marked with a green field.
2. to the right of the green field to see the corresponding sub-categories in the other tree, according to existing match.
3. The corresponding sub-categories in the other tree are also marked with green fields.
Click the icon next to the link or links you want to delete.
© Artisan Global Media
Manual 293
Settings
Group-specific SettingsOn this page you specify, per user group, the default settings for which fields are to be displayed in the respondent list, and whether the quick edit option is to be allowed. First select which user group you want to make the settings for, in the drop down list.
Below, the different fields in the respondent details are listed under the headings Basic information, Properties and Categories. Mark the fields you want to display in the respondent list. The setting you choose thus determines the default settings. However, the users will be able to decide for themselves which fields to display in the respondent list, by clicking
the button.
The right column, Allow quick edit, lets you determine which of the fields are to be editable via the Quick edit function in the respondent list. If you have activated the Respondent owner function it is only the user who is owner of a respondent who can edit that respondent, but by marking the check box The users in the selected group can modify the information of all respondents, according to the selections made in the column 'Allow quick edit', you can allow anyone in the selected user group to edit the selected fields via the quick edit function, even respondents they are not owner of.
Other Settings
Respondent Key FieldsHere you decide which fields in the respondent profile are to be considered as key fields. The key fields make a respondent unique, i.e. two respondents cannot have identical values in these fields. The following fields can be used as key fields:
• First name• Last name• Organisation• E-mail address• Language
Make sure the check box is marked next to the desired fields, and click Save.
If you have used the program for a while, and then change the key fields setting, you may find that some existing respondents (after the change) will have identical values in the fields which are defined as key fields. You will then get a warning, telling you to merge the respondents under the tab Manage respondents.
Other SettingsIf there are a large number of respondents in the respondent database, it can take a long time for the respondent list to be displayed, when a search is made. For that reason, you have the possibility to enter a maximum number of respondents to show in the search result. As default the limitation is set to 10000 respondents. If you want the whole search result to be displayed, you enter the value 0.
© Artisan Global Media

Manual 294
A user who is connecting respondents to a survey, can decide if the respondents are to be added to the general database (the check box Add as survey-specific respondents is left unmarked), or added as survey-specific respondents (the check box is marked). At Import respondents, you decide which setting is to be pre-selected when respondents are added:
• As survey-specific: The check box will be marked as default• To the respondent database: The check box will be unmarked as
default
At Default 'Add respondents' tab, you decide which of the tabs to be pre-selected when the window Add respondents is opened.
Manage respondents
Delete respondentsUnder this tab you can delete respondents who are not connected to any survey.
Click the button List respondents not connected to any survey. If you want to delete all respondents in the list, click the Delete all button.
You can also delete selected respondents. Make sure that the check box is marked next to the respondents you want to delete, and click the Delete selected button. By marking/unmarking the check box in the title row you mark/unmark all the respondents' check boxes at once.
Manage DuplicatesUnder Administration > Respondents > Settings > Other settings, you can decide which fields in the respondent profile are to be considered as key fields. The key fields make a respondent unique, i.e. two respondents cannot have identical values in these fields.
If you have used the program for a while, and then change the key fields setting, you may find that some existing respondents (after the change) will have identical values in the fields which is defined as key fields.
Example: Earlier you used the fields First name, Last name, Organisation and E-mail address as key fields. It could then happen that a person was added several times with identical first name, last name and e-mail address, but with different values in the Organisation field, and for that reason was saved as several different respondents in the respondent database. To avoid this from happening in the future, you change the setting so only First name, Last name and E-mail address are used as key fields. However, after the change you should also go to the Manage duplicates tab and merge the duplicates, i.e. the respondents you have added earlier with identical first name, last name and e-mail address.
To merge duplicates, you click the List duplicates button. Each row in the list contains two or more duplicates which can be merged into one respondent. In the Respondent ID column, you see each duplicates ID. You can merge
the duplicates for one respondent at a time by clicking the button to the far right. If you want to merge the duplicates for several respondents at the
© Artisan Global Media

Manual 295
same time, you mark the check box to the left of the desired rows, and click the Auto-merge selected button.
When you click the button on a row, an interface is displayed where you merge the duplicates of that row into one respondent. In the columns to the left, you see each duplicate's details. In the second column from the right, you find the Auto-merged column which displays the details the program suggests for the merged respondent. If you want to use one of the duplicate's details, mark the radio button next to the ID in the desired column heading. You can also combine details from the different duplicates by clicking the fields containing the desired details. The fields you have selected are highlighted in blue. In the column Resulting respondent to the far right, you see the details the merged respondent will get. In this column, you can also edit certain fields by clicking the icon, and enter the new value. Finally, click the Merge respondents button, to finalize the merging.
The merging cannot be made in the following cases:
• The duplicates are connected to the same survey• A duplicate has received an e-mail on an active survey, but has not
submitted the survey
E-mails and Mailings
Templates Here you create templates for all the mailings that are created under Data collection > Mailings and sent out either via E-mail or via Paper Mail .
E-mails It is possible to create a number of different kinds of mailings to be sent out from each survey. Here you create templates to be used for the different types. A template can contain a subject line, a message body and relevant attachments. Everyone who later creates a mailing for a survey can then use the template as a starting point, but can edit the content according to their particular needs.
Creating Templates First choose which Type of mailing the template is to apply to:
• The first mailing - will be sent to all respondents. If you add more respondents after this mailing has been sent out, it will be sent to them automatically upon being connected to the survey.
• Reminder - the mailing will be sent to all the respondents that, at the time of the mailing, have not yet submitted the survey. Only available for respondent surveys.
• All respondents - the mailing is sent to all respondents that, at the time of the distribution of the mailing, are connected to the survey.
• Respondents who have submitted the survey - the mailing is sent to all respondents at the time of mailing have responded to the survey. Only available for respondent surveys. Can for instance be used thanking respondents for their participation.
© Artisan Global Media
Manual 296
Choose which Language the template is to apply to. If you want to translate an existing template you can use the translation interface which can be
accessed by clicking the button next to the Topic and/or Message headlines. Please refer to the section on Translating Templates below.
Enter the text you want to appear in the message subject line at Topic.
If you want to attach a file to the template, click on the icon next to Attachments and retrieve the file from the Image and document library. See the section on the Image and document library for more information on
how to upload and insert files. To remove an attachment, click on the icon.
Under Body you find an editor where you type in the template message text. You can combine text you type in yourself with data that is retrieved from the current survey or individual respondent.
The following survey data can be inserted:
• The survey URL - a link to a public survey or to the log-in page for a respondent survey
• Survey Name • Start Date and End Date - the survey publishing period
The following respondent details can be inserted:
• The survey URL with a log-in - a link to a respondent survey containing an automatic log-in for each respondent.
• First name and surname - to make the message more personal. • Username and Password - to allow the respondent to sign in via the
survey's log-in page. • E-mail - the respondent's e-mail address.
Inline data is symbolized by the image of the editor icons. Both the inline data as text you have written yourself can be selected, formatted and editor with formatting buttons. In the editor are also buttons for inserting images and links.
When you are finished with the message, click the Save button.
Translating TemplatesTo facilitate the distribution of multilingual surveys, you can prepare templates for all languages that are marked as active in Languages and translations > Settings > Survey language. For each language and mailing type you can create a template with locale-specific subject line, message text and attachments.
First create a template for one of the languages, see Creating templates above. When you want to create a template for additional languages, you
can use the button which can be found next to both Subject and Message. You'll get a window with an interface to translate the subject line and message body. In the left half of the window, select the language you want to translate from (source language), and in the right the language you want to translate.
As a help when you are translating key languages between the fields.
© Artisan Global Media

Manual 297
If you use this when you translate the message body will survey and respondentdata inserted in the source language message that also included in the translated message. In the case of text you have written yourself, you should of course check that the proposed translation is correct. For the translation to work, access to a translation service added up. See section Languages and translations for more details.
Save the translation by clicking OK.
Paper Mail On the Mailings page under Data Collection you can print messages that are to be sent via paper mail to the respondents. Here you create the template that will be used as the basis for all these letters. When printing messages from the survey you then use the template as a basis but it is still possible to edit the content.
Creating Templates Start by selecting which Language version you wish to make a template for.
The content of the letter is added in an editor where you can combine text that you type in yourself with data that is retrieved from both the survey and the respondent it is sent out to.
The follwoing survey data can be inserted:
• The survey address - a link to a public survey or to the respondent survey's log-in page
• The survey name • The start date and end Date - the survey's publishing period
The following respondent data can be inserted:
• The survey address with a log-in - a unique link to a respondent survey containing an automatic log-in for the respondent
• First name and last name - to personalize the message• Username and Password - to make it possible for the respondent to
log in via the survey log-in page• E-mail address - the respondent's e-mail address
In the editor, all inserted data is symbolized by image icons. Both the inserted data and the text you have written yourself can be selected and formatted by using the editor's formatting buttons. In the editor there are also buttons for inserting images and links.
When you are finished, click on Save.
System templates When you use the automated function of the application, you can also add messages to be sent at different occasions during the process. Such messages can be sent to the following:
• the owner (possibly also the user) of the survey with information about the survey closure
• the respondent, confirming the reception of his/her answers
© Artisan Global Media

Manual 298
• the owner and/or the user of the survey with information about the report being created
• the owner and/or the user of the survey with information about the report being published
The tab System Templates work as an archive for these different messages. You create and manage them on this page in order to decide which templates to use at the creation of respective survey template or survey.
Creating a new Survey Template1. Under the heading Template Types you choose at what occasion
the message is to be used.
2. to add a new template.
3. you can add the name of the certain survey, the recipient's first and last name as well as survey category to the subject line.
4. Design the message in the major editor. Use the tags from the tool menu in order to enter the adress, name, start and end date of the certain survey.
5. Click the tab Access in order to mark which application organisations should have access to the template.
6. Click Save. If you do not wish to make any changes, click Back.
Editing a Survey Template1. The templates are sorted under tabs depending on the occasion
they are used. Click the intended tab.
2. To the right you find a list of the templates sorted under this tab. Click the template you want to edit.
3. Read more about templates in the section Creating a new Survey Template step 3 - 6.
Deleting a Survey Template1. The templates are sorted under tabs depending on the occasion
they are used. Click the intended tab.
2. To the right you find a list of the templates sorted under this tab. Click the template you want to delete.
3. Click the button Delete in the lower right corner of the page.
© Artisan Global Media
Manual 299
Mailing ScheduleIf a mailing schedule is prepared under this menu, the mailings of the schedule will be automatically created when a survey is created. The mailings will be displayed under Data Collection > Mailings > E-mail > List, but they will not be sent until they are confirmed.
Creating New MailingsClick the New e-mail button at the bottom of the List page.
Choose from the following e-mail types:
• First mailing: Will be sent to all respondents. If you add more respondents after sending this, they will receive the message automatically.
• Reminder: Will be sent to all respondents who have not yet submitted the survey. Only available for respondent surveys.
• All respondents: Will be sent to all respondents.• Respondents who have submitted the survey: Will be sent to all
respondents that have submitted the survey. Can for instance be used for a "Thank you" message. Only available for respondent surveys.
Select the appropriate settings for the new mailing and click Save. See the section on Editing mailings below for more information.
ListUnder the tab List, you see any mailings already created. They are listed with the following headings:
• Status: The symbol indicates that a Send date is specified.
The symbol indicates that the Send date is missing.• E-mail type• Date: The number of days after a survey is published, and at which
time, the mailing will be sent.• Subject
In the far right column, you can click the button to create a copy of the mailing.
Editing MailingsWhen you create a new mailing, or click an existing one under the List tab, you are transferred to the next tab where you can edit the mailing.
The settings you make for a mailing when you administer a mailing schedule, are (with one exception) the same that you make for a mailing on a survey. See Data Collection > Mailings > E-mail > Edit mailing for more information. The only thing that differs is the setting for Send date, which is here based on the survey's publishing date. In the field at Send date, you enter how many days after the survey is published the mailing will be sent. If you want the mailing to be sent the same day the survey is published, enter 0.
© Artisan Global Media
Manual 300
E-mail Accounts This is where you set up the e-mail function that sends out the messages from Survey&Report, and receives all incoming mail. You can create multiple accounts and decide which account you want to use every time you create a new mailing.
In the drop down list at the top of the page you can select an existing account or choose to create a new one.
1. Under Settings for sending e-mails you give the e-mail account a name (Account name).
2. Enter a Sender Name. This will be displayed as the sender name in all of the messages, however the sender name can be edited for each mailing.
3. Then enter the Sender Address that will be displayed as the sender address for all outgoing messages. This can also be edited for each mailing.
4. In the Reply address field, enter which address any answers to the message are to be sent to. If you do not enter a new address in this field, all replies will be sent to the Sender address (see step 2). The reply address can also be edited for each mailing.
5. Server lets you specify which SMTP server outbound mail will go through, which Port to use, as well as a Username and Password if these are required by the SMTP server. You also have the possibility to encrypt the communication between the program and the mail server with SSL/TLS when e-mails are sent.
6. Enter, under Settings for receiving e-mails, the settings for the e-mail account you have specified as sender address. This is necessary for the program to be able to receive messages about undeliverable e-mails. Start by entering the type of Protocol: IMAP or POP3, used by the incoming mail server.
7. You also need to specify which POP server or IMAP server will be used for incoming e-mails, which Port should be used, as well as a Username and Password for this server. SSL/TLS lets you specify how the mail server has been configured to handle the encryption used when receiving incoming e-mails. If you are not sure, you can always use Auto. You can also check the box at Strict verification under Certificate, if that should be required by the server.
8. By marking the check box Delete received e-mails you ascertain that messages are removed from the mail server once they have been imported to Survey&Report.
9. Click on Save.
Incoming E-mailsOn the Incoming e-mails tab you can see all the e-mails that have been sent to the e-mail accounts that have been set up in the program. Select the e-mail account you wish to check in the drop down list above the list.
If a respondent replies to an e-mail that has been distributed by the program, the reply will appear under Incoming e-mails, unless a different reply-to address was specified in the e-mail account settings. Regarding "bounces", ie. messages that have failed to be delivered, the default settings specify that only the messages that the program could not connect to a specific survey will be visible. By marking the check box Display undeliverable e-mails that are already displayed on a survey level, you can also view the
© Artisan Global Media
Manual 301
"bounces" that the program has linked to a specific survey (this is displayed in a lighter colour). These are also displayed as errors in the surveys in question on the List page under Data collection > Mailings > E-mail. Go to this page to correct any incorrect recipient addresses etc.
Click on the Update button to see the changes that have occurred since you opened the page.
Removing Mailings Mark the check box next to the mailing or mailings you wish to remove. By marking/unmarking the check box in the header row you mark/unmark all mailings at once. Click on Remove.
Settings This is where you choose settings regarding surveys, reports and the application as a whole.
SurveyThis interface is divided into three tabs: General settings, Categories and Header/Footer.
General Settings
Sample Survey Select which survey that is to be used as a sample survey in the program. The sample survey is, for instance, the default selection to Preview when you are editing a theme under Templates > Survey themes.
Settings• Automatically close the survey when the publish period has expired
- This setting is made for each survey under Survey > Survey Construction > Basic Information > Properties. On this page you decide if the check box should be marked from the start or not, when a new survey is created.
• Make respondent surveys anonymous as default. By marking this check box, every newly created survey will initially be of the type anonymous respondent survey. Under Survey > Construction > Basic Information > Properties you can adjust if it should be something else; a non-anonymous respondent survey or a public survey.
• Enable survey level exceptions from the restrictions which apply to anonymous surveys. Read more about strict anonymity under Properties > Basic Information.
• Minimum response count to view results - This setting lets you decide how many respondents who must have submitted their answers before it is possible to create a report based on the survey, and to export the answers from Survey > Data Collection > Export. You enter a default value for each survey type: anonymous respondent survey, respondent survey and public survey. On the Survey > Survey Construction > Finish Construction page, the
© Artisan Global Media

Manual 302
default value for the type will be suggested as default but can be changed. After finishing the construction, the setting for the survey can be changed only by administrators, in the Survey > Data Collection > Settings page.
• Limit amount of respondents per survey - If you want to avoid mass mailings from your system, you can activate the function that limits the number of respondents per survey. The actual limitation will be a result of the system setting on this page, Maximum number of respondents per survey, but also of the limit defined for the survey users on user group level. Users with specific rights can increase the limit concerning a specific survey. Read more about these rights under Administration > Users > Groups > Edit.
• Maximum number of respondents per survey - The setting is used if you practise respondent limitation (see above) and the users of a survey do not have any limit stated at user group level.
• Anonymisation warning - When the user logs into the system, a warning appears in the top menu with information about the number of surveys that have passed the limit of how long a closed survey may contain non-anonymous respondents. The number refers to surveys where the user has read permission.
• Number of days elapsed since closed, before warning is shown
• Number of days the warning will be postponed for - If the survey has been marked with the attention icon, the user can extend the period that the survey may be closed without the respondents being anonymised. Thereafter, the survey is re-marked with the attention icon.
MobileThe application automatically creates a survey version adapted to mobile devices. Respondents using a mobile device when answering the survey will get this version as default. If you want to change which version they will get as default, you make that change under the heading Mobile. Using the checkbox Allow switching between desktop and mobile view you decide if the respondent may alter between the two versions when answering. The settings on this page applies to surveys in general but can be adjusted for each specific survey.
Export SettingsEnter the value that will be used for exporting data if the answer is missing. You can use different values concerning missing answers to questions respective sub-questions.
Respondent’s Log-in PageIn those cases where the respondent does not access the survey via a direct link, he or she will instead use a log-in page where a username and password must be entered to log in to the survey. From that page, the respondent can also log in to a portal where links to other active surveys can be found. Under Respondent’s Log-in Page, you decide which surveys to be displayed in the portal, Public surveys and/or Respondent surveys. As for respondent surveys, the respondent can of course view only the surveys that he or she has been connected to.
© Artisan Global Media
Manual 303
Other Settings• Activate the respondent owners setting – If this function is activated,
you can on each respondent select a Respondent owner and also make the respondent hidden for others than this owner. This can be useful if you handle respondents with confidential personal data that should be visible only for a responsible person. Administrators have always the right to see all respondents.
• The users connected to a survey are authorised to edit respondents’ answers for that survey - The setting gives the right to add or edit answers in already submitted surveys.
• Allow filtering of the main report - If you mark the Yes option, the functionality will be available for separate reports.
• Automatically publish new reports - The setting means that you do not have to spend time on publishing every single report. In the same moment as a report is created, it is also accessible through the report link.
• User passwords - You can choose to have regular changes of passwords. In that case, state how often they should occur.
• Interviewers may manage responses – The setting concerns the right for users with the Interviewer role to view and edit the respondents’ answers in already submitted surveys. Select one of these three options:
• Not at all
• Only view
• Edit and view
Categories When creating a new survey you specify which category it belongs to. The division into categories can be useful for instance when you want to search for a survey, as the list in the Find survey window can be sorted by category. If you want to, you can build a hierarchical structure of survey categories, with unlimited number of levels. Survey categories are created here on the Categories page.
Creating CategoriesWhen you go to the Categories tab, you have a column to the left with any survey categories already created. At the top you find a number of buttons.
1. Click the button.2. Enter a name for the category in all the languages that are active in
the program. Click Save and close.3. If you want to create subcategories to the survey category, you click
on the new category. A second column is displayed to the right of the first one.
4. Click the button above the second column to create the first subcategory.
5. Enter a name (in all languages) and click Save.6. Repeat step 5 to create the other subcategories.Click Save and
close. The subcategories are displayed in the second column.
© Artisan Global Media

Manual 304
7. If you want to create an additional level of subcategories, you click a category in the second column, and then the button above the third column. In that way you can build a hierarchical structure with the desired number of levels. Each level is symbolized by a new column.
Renaming Categories1. Click on the survey category or subcategory you want to rename.
2. Click the button above the column.3. Change the name (in any active language).4. Save and close.
Removing/deactivating CategoriesOnly categories that are not used on any survey can be removed. A category that is connected to a survey appears in bold text and cannot be removed, but it can be deactivated. This means that in the future it will not be possible to select as category on surveys.
Click on the category and then the button above the column to remove/deactivate the category. Confirm with OK.
Activate CategoriesIt is possible to reactivate categories that have been deactivated. Click on Display inactive to see all the categories that have been deactivated. To
reactivate a category, click on the category and then the button above the column.
AutomationThe function Automation means that the application automatically could create and publish reports for a survey created from a specific survey template. Besides choosing how many days after survey closure the reports are to be created and published, you can also choose which messages are to be sent to people concerned.
If you want to use the automation in the application, the function is activated on this page.
1. Decide if you want the automation to be disposable in the application by drawing the switch button Automation task to the right (enabled) or to the left (disabled)
2. State at what hour the task should be run.3. Enter what E-mail account the messages should be sent from.
4. If you have made any changes in the automation settings and do not want to wait for the execution until the next occasion according to entered hour, you can use the button Run Task in the lower left corner.
© Artisan Global Media

Manual 305
Data clean-upThe function Data clean-up means that you can let the system erase all surveys that have been archived a certain time automatically. On the same time as the survey is taken away, the reports based on the survey, survey specific respondents as well as the respondents only connected to this survey also disappear.
1. Enable this automatic clearance of the archive by drawing the switch button Clean-up task to the right.
2. State at what hour the task should be run.
3. State how many days the survey must have been archived to be cleared out in the automatic data clean-up.
Application
Using this menu you make settings regarding how the main menu and the working area are presented in the application.
Under Layout, the placement of the main menu and the format of the working area are defined.
Under Menu links you can:
• add your own links under Administration and Help in the main menu
• add links under new tabs in the main menu
LayoutThis page you lets you choose settings relating to how the main menu and workspace is presented in the program. You can let the settings be applied for only your account or for all users' accounts. The same settings can thus be selected under these two headers:
• My settings - only applied for you
• Settings for the entire system - applied for all users
The settings you choose are the following:
• Menu - specify whether the main menu is to be displayed on the Left or Right
• Page - specify whether the workspace is to be adjusted to the screen (Fill) or have a Fixed width
Menu linksA smooth way to give the users of the system access to important information is to add links to pages of your choice in the main menu.
Either you add the links under the existing sub-menus Administration or Help, or you name your own sub-menus where you sort the links.
© Artisan Global Media
Manual 306
Creating a new menuIf you want to place your links under a new menu you create it accordingly to the following:
1. Go to the page Administration > Settings > Application > Menu links.
2. Click the button Add new menu in the lowest part of the page.
3. Under the heading New menu you name the menu.
4. Via the icon you can name the menu in different languages.
5. Click the save-icon in order to save the menu.
6. You will now see the new menu among the other menus in the list under the heading Menu. You can also see it as a new tab in the main menu to the left.
Editing a menuVia the page Administration > Settings > Application > Menu links you can edit links to your own information pages. In the list under the heading Menu you click on the menu which links you would like to edit. To the right you can now see a list of existing menu links added to the selected menu.
Creating a menu link
1. in the list or by clicking Add new menu link in the lowest right corner of the page. A window for editing the menu link is shown in the right part of the page.
2. Enter the following information:
• Title - formulate the text in the link
Using the icon you can translate the text to the other languages of the system.
• Type - enter how the linked page should be opened
• Normal - open inside the present window
• Open in new window
• Popup
• Link - enter the address of the page
3. Click Save in the lower right corner of the page. If you do not want to save, you click Back in order to return to the list of existing menu links in the specific menu.
© Artisan Global Media
Manual 307
Editing a menu link
1. Click the menu link you would like to change. A window for editing the menu link is shown in the right part of the page.
2. Make the wanted changes regarding:
• Title - formulate the text in the link
• Type - Enter how the linked page should be opened
• Normal - open inside the present window
• Open in new window
• Popup
• Link - enter the address of the page
3. Click Save in the lower right corner of the page. If you do not want to save, you click Back in order to return to the list of existing menu links in the specific menu.
Deleting a menu link
1. Click the menu link you would like to delete. A window for editing/deleting the menu link is shown in the right part of the page.
2. Click the button Delete in the lower right corner of the page.
Deleting a menuVia the page Administration > Settings > Application > Menu links you are able to delete your own menus from the main menu. However, Administration and Help are not possible to delete. That is why they are marked with a padlock.
1. In the list under the heading Menu you click on the menu that you would like to delete. In the right part of the page the menu links are listed under the name of the menu.
2. Click the icon to the right of the menu name in order to delete the menu.
SSL This tab only appears if you have the SR-SSL plug-in, a plug-in intended for those who have a rental license for Survey&Report. Here you can specify that those who access the program are required to do so via a so-called https connection. When an https connection is used, the transmission between your web server and the browser is encrypted using SSL (Security Sockets Layer) technology. This may be appropriate if, for instance, your surveys contain confidential information or if you handle sensitive personal details. The setting can be selected both for the administration interface and for the public website where respondents answer surveys.
If you have the program installed on your own web server, you do not need the plug-in SR-SSL to enable an https connection.
© Artisan Global Media
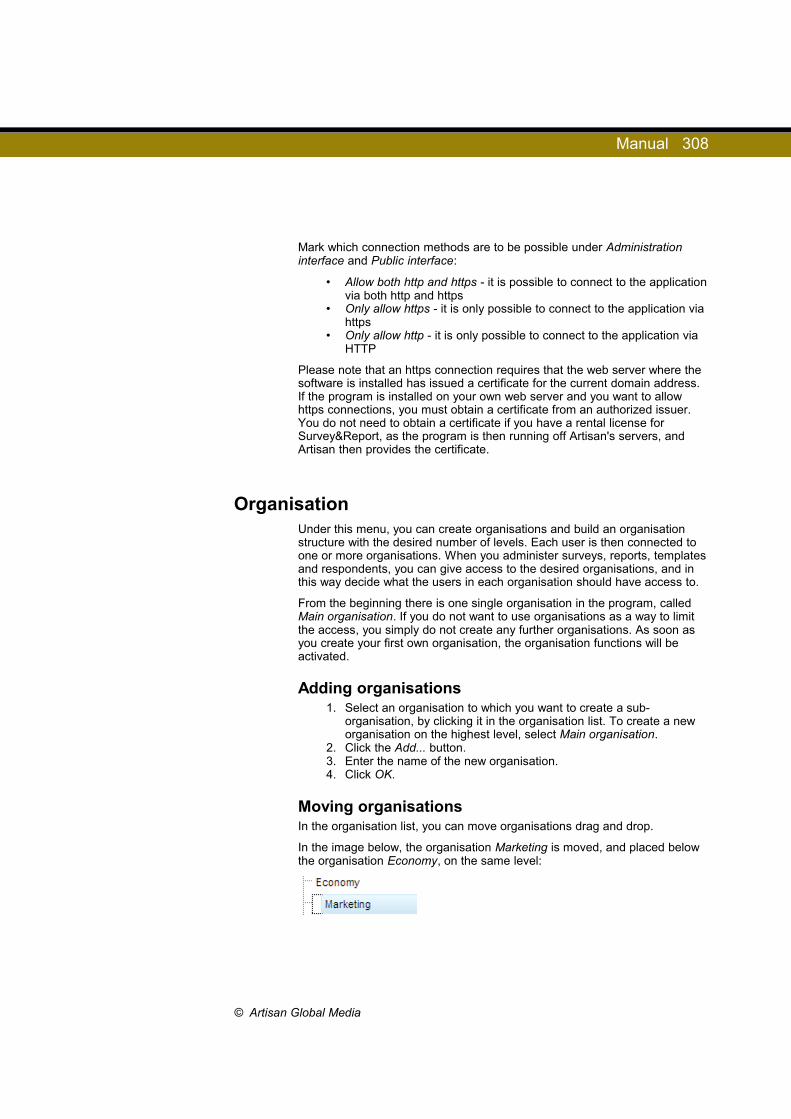
Manual 308
Mark which connection methods are to be possible under Administration interface and Public interface:
• Allow both http and https - it is possible to connect to the application via both http and https
• Only allow https - it is only possible to connect to the application via https
• Only allow http - it is only possible to connect to the application via HTTP
Please note that an https connection requires that the web server where the software is installed has issued a certificate for the current domain address. If the program is installed on your own web server and you want to allow https connections, you must obtain a certificate from an authorized issuer. You do not need to obtain a certificate if you have a rental license for Survey&Report, as the program is then running off Artisan's servers, and Artisan then provides the certificate.
OrganisationUnder this menu, you can create organisations and build an organisation structure with the desired number of levels. Each user is then connected to one or more organisations. When you administer surveys, reports, templates and respondents, you can give access to the desired organisations, and in this way decide what the users in each organisation should have access to.
From the beginning there is one single organisation in the program, called Main organisation. If you do not want to use organisations as a way to limit the access, you simply do not create any further organisations. As soon as you create your first own organisation, the organisation functions will be activated.
Adding organisations1. Select an organisation to which you want to create a sub-
organisation, by clicking it in the organisation list. To create a new organisation on the highest level, select Main organisation.
2. Click the Add... button.3. Enter the name of the new organisation.4. Click OK.
Moving organisationsIn the organisation list, you can move organisations drag and drop.
In the image below, the organisation Marketing is moved, and placed below the organisation Economy, on the same level:
© Artisan Global Media

Manual 309
In the image below, the organisation Marketing is moved, and placed as a sub-organisation to the organisation Economy:
Note: When an organisation is moved and placed as a sub-organisation to another organisation, it affects the involved organisations' access to surveys, reports, templates and respondents. The organisation which is placed as a sub-organisation will get access to the templates which its new parent organisation has access to. The parent organisation will get access to the surveys, reports and respondents which its new sub-organisation has access to.
Deleting organisations1. Select the organisation you want to delete, by clicking it in the
organisation list.2. Click the Remove button.3. A dialog box opens, where you select to which organisation the
removed organisation's connections shall be moved. This concerns users, templates, surveys, reports and respondents connected to the organisation which is being removed. If no organisation is selected, the connections will be moved to Main organisation.
4. Confirm by clicking Yes.
Organisation informationUnder the heading Organisation information, the name of the organisation which is selected in the organisation list to the left, is displayed. By clicking
the button, you can translate the name in all active program languages. Enter the desired name next to each language, and click Save.
If you have the plug-in SR-LDAP you can, in the field External ID, enter the name the organisation has in the directory service from which the import is made, i.e. the value the organisation has in the attribute in the directory service which is matched with the field Organisation in the program. You do not need to fill this field if the attribute value is identical with the name you want for the organisation in the program.
Surveys, users and respondentsAt the bottom of the page, the tabs Surveys, Users and Respondents are displayed. Select an organisation in the organisation list, and then use the tabs to see which users who belongs to the organisation, and which surveys and respondents the organisation has access to. Under each tab, there is a search field and a Search button. Enter the desired search argument, or leave the field blank to list all, and click the Search button.
Sort the list according to different criteria by clicking the column heading of your choice. You can also filter the list by clicking the icon in the heading of the desired column, and enter the text you want to filter by in the text field. The icon indicates that the column is already filtered. If you want to remove the filtering, you click the icon, hover the cursor over the text field, and click in the upper right corner of the field.
© Artisan Global Media
Manual 310
About organisations in general
Connecting users to organisationsWhen you edit an existing user, or add a new one, under Administration > Users, you select which organisation(s) the user shall belong to. See Administration > Users > Editing Users for more information.
Users belonging to several organisationsIf you choose that a user shall belong to several organisations, you must also select which of them is to be the primary organisation.
Users connected to two or more organisations have, in the top right corner,
access to a drop down list with the symbol. After logging in, the user's primary organisation will be selected in the drop down list. The user can in the drop down list select another organisation to work with, and will then see only surveys, reports, templates and respondents connected to the selected organisation.
In interfaces where header, footer and thank you message are selected, the user will first see the templates which the selected organisation has access to. By clicking Show all, the user can see and select among all templates which his/her organisations have access to.
If the user has access to administering a survey using a template for header/footer/thank you message which the user does not have access to, this template will be displayed in grey in the drop down list. If the user selects another template, and save, the previous template will disappear from the drop down list.
Set organisation accessOrganisation access can be set in the following parts of the program. See the corresponding section for more information.
• Surveys: Survey > Survey Construction > Basic Information > Properties > Access
• Reports: Reports > Basic Information > Properties• Survey templates: Templates > Survey Templates > Survey
Construction > Basic Information > Properties > Access• Question templates: Templates > Question Templates > Find the
question template by clicking its question type > Click on to edit the question template > Click the tab Access
• Survey themes: Templates > Survey Design > Theme > the tab Access
• Headers for surveys: Templates > Survey Design > Header > Access
• Footers for surveys: Templates > Survey Design > Footer > Access• Thank you messages: Templates > Survey Design > Thank you
message > Access• Report themes: Templates > Report Design > Theme > the tab
Access• Headers for reports: Templates > Report Design > Header >
Access• Footers for reports: Templates > Report Design > Footer > Access
© Artisan Global Media
Manual 311
• Respondents:- Survey > Data Collection > Respondents > Add Respondents > New Respondent- Survey > Data Collection > Respondents > Add Respondents > From a File- Survey > Data Collection > Respondents > Add Respondents > Via LDAP- Administration > Respondents > Add Respondents > New Respondent- Administration > Respondents > Add Respondents > From a file- Administration > Respondents > Add Respondents > Via LDAP
Languages and Translations Here you specify which program and survey languages will be active in the application. You also specify which translation service you wish to use, and translate the survey texts and help texts for the survey languages you activated.
Settings
Application Languages The Survey&Report application texts are available in five languages: English, French, Spanish, Swedish and German. On the Application languages tab, you mark the check box next to the languages you wish to be active in the program, and thus available for selection at log-in.
Survey Languages When a survey is created it can be made multilingual. You then select which languages the survey will be available in and can thus translate the questions, answer options, e-mail messages etc. On this page you specify what languages should be available for selection as survey languages.
Enabling Languages In the list, mark the check box next to the languages you wish to enable. The selected languages will now be available for selection when a new multilingual survey is created.
Click the Add language button to add additional languages. Select your preferred language in the drop down list and click on OK. The selected language will then be added to the list and marked as active.
For the languages that you intend to use in your multilangual surveys, you also need to translate the Survey texts and Help texts, see these sections for more information.
Disabling and Removing LanguagesYou can disable a language by unmarking its check box. The language will no longer be available for use when a new multilingual survey is created. The language will however continue to be active in any on-going surveys where the language has been selected.
© Artisan Global Media

Manual 312
Click the button to remove the language from the list. It is only possible to remove the language if it is not being used in any survey.
Translation ScriptsWhen you create a multilingual survey, you get access to a number of interfaces where you translate questions, answer options, e-mails and so on.
These interfaces also contain the button, which you click to get an automatic translation. In order for this translation service to work you need to add a script that the service then uses.
You select which translation service you wish to use, from those that are available on the market.
Translation
Survey Texts On the Survey languages page you select which languages are to be available for use in multilingual surveys. By using multilingual surveys, you enable each respondent to receive the survey in their preferred language. Questions, answer options, e-mail messages and so on are translated into different languages on each survey page, but other text that appears in the survey, eg headlines and information, is translated here on the Survey texts page. The survey texts are already available in English, French, Spanish, Swedish and German, but for any other languages you enable, you will need to translate these texts.
The translation interface is divided into two sections. The left section lets you select a language and then displays the available text in that language, while the right section lets you specify which language you are translating the text into as well as type in the actual translation. Each word/phrase has its own line with a field where you type in the translation.
Quick help when translating is provided by the button. This button gives you an automatic translation of the text and can be found between the two language fields (it then translates the entire text) as well as on each row (it then translates the text on that row). Since the translation is automated, it is advisable that you check that the proposed translation is accurate. For the translation to work, a connection to a translation service must be set up. Please refer to the Translation script section for more information
If the details of a respondent calls for a language that is not used in the survey, or if the survey has not been translated into that language, he or she will receive the survey in its default language (which is specified in its Basic information).
© Artisan Global Media
Manual 313
Survey Helptexts
When the respondent fills out survey, he or she can click on the button to display a helptext that provides general information about how to answer it. This help text is available in English, French, Spanish, Swedish and German, but if you activate any other languages for your survey, you need to translate the text into that language.
Editing Helptexts To edit the existing helptext, for instance to add any further information, first select a language in the drop down list at the top of the page. Make any changes you wish in the editor that appears, then save.
Translating Helptexts If you want translate the help text into a new language, click the Translate button. A window with a translation interface will then appear. The left half of the window lets you select the language you want to translate from (the source language), and in the right half you select the language you want to translate the text into. Translate the text in the editor, and click OK.
The automatic translation button, , can be used to provide quick help when translating texts and can be found between the two language fields. If you use this button when translating the helptext, any images that have been incorporated into the original helptext will be inserted into the translated help text. It is of course advisable that you check that the proposed translation is correct. For the automatic translation to function, a connection to a translation service must be set up in the administration. See Translation scripts for more information.
Report Texts On the Survey languages page under Administration > Languages and translations > Settings you select which languages are to be available for use in multilingual surveys. If you make your surveys multilingual, each respondent will receive the survey in their preferred language. When you create reports based on multilingual surveys, you can also choose which of the languages used on the survey will be used in each report. The survey questions and answer options will then be presented in this language, as will other texts in the report, ie. headings such as Number of responses, Mean and Total, here referred to as Report texts.
In the program, the report texts are already available in English, French, German, Spanish and Swedish, but if you want to use other languages you may have activated, you will need to translate the report texts if you want to display them in those languages. If the report texts are missing for the selected language, they will instead be displayed in the language that was selected as default.
The translation interface is divided into two halves. The one on the left lets you select which language to translate from (your source language), and the one on the right lets you specify which language you are translating into. Each word/phrase has its own row with a field where you type in the translation.
© Artisan Global Media

Manual 314
Quick help with the translation is provided by the buttons. You find them between the two language fields in each row (they then translate the current word/phrase), and between the language drop down lists at the top (they then translate all the text in all rows with a single click). It is advisable that you check that the proposed translation is correct. Also, for the translation to work, access to a translation service must be set up in the administration. See the Translation scripts section under Administration > Languages and translations > Settings for more information on how this is done.
Report HelptextsReports can be published via links which can also be distributed via e-mail from the program. If a person clicks the link and thus views the report, he or
she can click the button to view a helptext with information regarding printing and exporting options for the report, as well as various types of options regarding the selections for so-called subreports.
Help texts of this type are already available in the program in English, French, Spanish, Swedish and German. If you activate any other languages, you will need to translate the helptext into that language.
Editing the HelptextsTo edit the existing helptext, for instance to add extra information, first choose a language in the drop down list at the top. Then use the editor and change the text as much as you find necessary. Finish by clicking Save.
Translating the Helptexts If you want to translate the helptext into a new language, click on the Translate button. A window will then appear, displaying a translation interface which is divided into two sections. In the left half of the window, select the language you want to translate from (your source language), and in the right part you select the language you want to translate into. Type in the translation in the editor, and click OK.
Quick help with the translation is provided by the buttons. You find them between the two language fields in each row (they then translate the current word/phrase), and between the language drop down lists at the top (they then translate all the text in all rows with a single click). It is advisable that you check that the proposed translation is correct. Also, for the translation to work, access to a translation service must be set up in the administration. See the Translation script section under Administration > Languages and translations > Settings for more information on how this is done.
© Artisan Global Media
Manual 315
Image and Document LibrariesMany parts of the program lets you insert images when working in it. You can, for instance, add an image to a question, or insert your organization's logo in the introductory text or page header. You also have the option of using other types of files such as movies, audio files, or documents in both your surveys and reports. Images are stored in the Image library , while other file types are saved in the Document library. The files are then available for use by anyone working in the program.
You can access the libraries via the respective buttons in those interfaces where images and other files can be used. You press this button, , to
access the Image library , opens the Document library.
The Administration menu lets you administrate both libraries via the Image and document library page. There you see all files in both libraries at once.
My Files and Public FilesWhen you open either the image library or document library, you find in the left column the folders you have access to: My Files and/or Public Files. My Files is a folder which only you yourself (and super administrators) have access to, while the Public Files folder is common to all users. Your access to these folders, and your rights for each folder, is decided by which group(s) you belong to. For example, you may have the right to upload new files to the My Files folder, while you in the Public Files folder only have the right to use already existing files.
As a super administrator, you have access to all users' My Files folder. You find them as subfolders to the Users folder.
Searching for and Listing Files Click on a folder to view its contents. The files are listed with their names,
sizes in pixels (if they are images) and file sizes. Click the button to
view the files as icons or to return to the list mode.
You can also search for a file by clicking the button. Enter a complete
or partial file name in the search field and click on the button to the right of the field. All the items matching your search term then appear in a list.
Inserting Files 1. Go to the desired library from the interface where you want to insert
a file. Click for the Document library.
2. Click on the folder containing the file you want to insert, or search for it as per the above description.
3. Select the file by clicking on its name in the list, so that its row is highlighted in a contrasting colour.
4. Click on the Insert button.
© Artisan Global Media
Manual 316
You will not find the button Insert if you go to the library from Administration > File manager. This interface is used only to administer the library.
Properties When you insert a file, you can also choose to activate some additional features for it. You can for instance define:
• A Title text for your image (which is displayed when the cursor is hovering above it)
• An Alt text (displayed instead of the image, in case graphics are turned off in the browser)
• How a link to a PDF is to be opened (In the same window or in a new window)
• The size of the window for your multimedia player
When you have selected a file, you can find its properties under the HTML tab in the right part of the window. Enter the properties of your choice and click on Insert.
Creating FoldersTo make it easy to find files you can organize them in folders. If you prefer, you can build a structure with folders and subfolders on multiple levels
1. Decide on where you want to create a new folder, by clicking the folder in which the new folder is to be placed.
2. Click on the button.3. Give the folder a name and click OK.
Uploading Files1. Click on the folder you want to to place your new file in.
2. Click on the button.
3. Click on to browse your files. Select a file and click on Upload.
4. Click the button.5. Enter a name under which to store the file (the original file name is
the default suggestion), and click OK.
Moving and Copying FilesFiles can be moved or copied between all the folders you create. Before you move a file, make sure that it is not in use on any published survey. If the file is moved, it will no longer be displayed on the survey.
1. Mark the check box next to the file(s) you want to move or copy.
2. Click on if you want to move the file or on if you want to copy it.
3. Click on the folder you want to move or copy the file to.
4. Click the button to paste the file.
© Artisan Global Media

Manual 317
Renaming FilesBefore you rename a file, make sure that it is not in use on any published survey. If the file is renamed, it will no longer be displayed on the survey.
1. Select a file by clicking on its name in the list. The row will then be highlighted using a contrasting colour. Don’t mark the checkbox of any other file.
2. Click on the button.3. Enter a new name and click on OK.
Replacing FilesIt is possible to replace one file with another in both the document and image libraries. This means that when a file is replaced in the library, the new "version" also replaces the file in all the different places where it has been inserted. For instance, you may have inserted a logo in the page header on a number of surveys, and you now want to use another version of the logo. You then just need to replace the old logo with your new version in the library.
1. Select the file you want to replace by clicking on its name in the list, so that its row is highlighted in a contrasting colour. Don’t mark the checkbox of any other file.
2. Click the button.3. The file is displayed as a thumbnail and with its file path under File
to replace. If you have copied the file, the path to all copies of it will be displayed with a check box for each copy. Make sure the box is checked for all the copies you wish to replace.
4. Click on the file you wish to use as your replacement so that its row is highlighted using a contrasting colour. The file is then displayed as a thumbnail under Replacement file.
5. Click the button to replace the file.
Removing Files and Folders Before you remove a file, make sure it is not in use on any published survey.
1. Mark the check box next to the file(s)/folder(s) you want to remove.
2. Click on .3. Confirm the deletion by pressing OK.
© Artisan Global Media
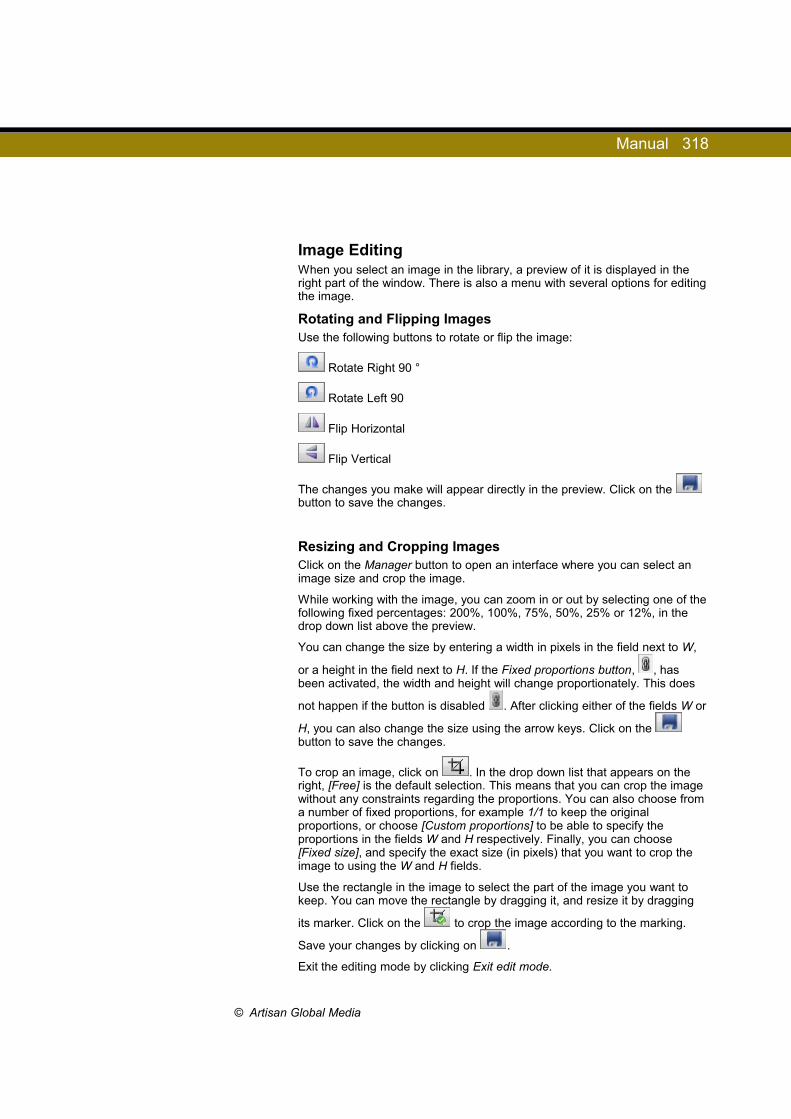
Manual 318
Image Editing When you select an image in the library, a preview of it is displayed in the right part of the window. There is also a menu with several options for editing the image.
Rotating and Flipping ImagesUse the following buttons to rotate or flip the image:
Rotate Right 90 °
Rotate Left 90
Flip Horizontal
Flip Vertical
The changes you make will appear directly in the preview. Click on the button to save the changes.
Resizing and Cropping ImagesClick on the Manager button to open an interface where you can select an image size and crop the image.
While working with the image, you can zoom in or out by selecting one of the following fixed percentages: 200%, 100%, 75%, 50%, 25% or 12%, in the drop down list above the preview.
You can change the size by entering a width in pixels in the field next to W,
or a height in the field next to H. If the Fixed proportions button, , has been activated, the width and height will change proportionately. This does
not happen if the button is disabled . After clicking either of the fields W or
H, you can also change the size using the arrow keys. Click on the button to save the changes.
To crop an image, click on . In the drop down list that appears on the right, [Free] is the default selection. This means that you can crop the image without any constraints regarding the proportions. You can also choose from a number of fixed proportions, for example 1/1 to keep the original proportions, or choose [Custom proportions] to be able to specify the proportions in the fields W and H respectively. Finally, you can choose [Fixed size], and specify the exact size (in pixels) that you want to crop the image to using the W and H fields.
Use the rectangle in the image to select the part of the image you want to keep. You can move the rectangle by dragging it, and resize it by dragging
its marker. Click on the to crop the image according to the marking.
Save your changes by clicking on .
Exit the editing mode by clicking Exit edit mode.
© Artisan Global Media

Manual 319
Metadata Above the preview in the right part of the window is the Meta tab. Click on it to view information about the image:
• Modified date • Image format (size in pixels) • Size (file size) • Created date
For jpg files, there are fields where you can enter the following information:
• Photo date • Topic • Title • Comment • Camera, make • Camera, model • Keywords
Save the information you have entered by clicking on Save metadata.
Text AnalysisThose who have the plug-in SR-Advanced Report have the possibility to create text analysis variables. In the report, a text analysis variable shows the frequency of words, or categories of words, in the answers given to text variables, i.e. text questions, blank options and comments.
The text analysis variables are created under Reports > Data Set. Please refer to this section for detailed information. When you create and edit text analysis variables, you will come across these terms:
• Categories - Instead of presenting the frequency of individual words, you can choose to present the frequency of categories of words.
• Conversions - Converting words means to merge several words into a new word. For example, you may want to present the frequency of all words containing a certain root word, including different endings and compound words.
• Exclusions - If you choose to present the frequency of words (instead of categories), you are probably not interested in seeing the frequency of common words like "the", "of" and "to". By creating exclusions, you can make sure that such words are hidden.
Categories, conversions and exclusions can be defined for each individual text analysis variable. If you often make the same categorizations, conversions and exclusions in your text analyses, you can create lists that can be imported and applied each time you edit a text analysis variable. You can create category lists, conversion lists and exclusion lists, and let each list contain one or more definitions of the categorization, conversion or exclusion to be done.
These lists are created and edited here under Administration > Text Analysis where you find tabs for Category Lists, Conversion Lists and Exclusion Lists. Please refer to these sections for more information.
© Artisan Global Media
Manual 320
Category Lists
Create New List1. Click the New List button2. Enter a Name for the list3. Enter a name for the first category in the Category field4. In the field below, define which words to be included in the category
by entering a Regular expression. Please refer to the section Administration > Text Analysis > Regular Expressions for more information.
5. Click the Create button6. Repeat steps 3-5 to define more categories7. Click OK
Editing and Deleting ListThe lists that have been created are listed with its name and the number of
rules (definitions) it contains. Click the icon next to a list to edit it, or the
icon to delete it. If you choose to edit it, a window opens where you can change the name of the list, and edit the categories that have been defined. Click a category in the left-hand list to change its name in the Category field, and its definition in the Regular Expression field. See the section Administration > Text Analysis > Regular Expressions for more information. Click the Update button to confirm the changes, or the Delete button to delete the category. Click OK.
Conversion Lists
Create New List1. Click the New List button2. Enter a Name for the list3. Enter a name for the first conversion in the New Word field4. In the field below, define which words shall be converted into the
new word, by entering a Regular expression. Please refer to the section Administration > Text Analysis > Regular Expressions for more information.
5. Click the Create button6. Repeat steps 3-5 to define more conversions7. Click OK
Editing and Deleting ListThe lists that have been created are listed with its name and the number of
rules (definitions) it contains. Click the icon next to a list to edit it, or the
icon to delete it. If you choose to edit it, a window opens where you can change the name of the list, and edit the conversions that have been defined. Click a conversion in the left-hand list to change its name in the New Word field, and its definition in the Regular Expression field. See the
© Artisan Global Media

Manual 321
section Administration > Text Analysis > Regular Expressions for more information. Click the Update button to confirm the changes, or the Delete button to delete the conversion. Click OK.
Exclusions Lists
Create New Exclusion1. Click the New List button2. Enter a Name for the list3. In the field to the right, define which words shall be excluded by
entering a Regular expression. Please refer to the section Administration > Text Analysis > Regular Expressions for more information.
4. Click the Create button5. Click OK
Editing and Deleting ListThe lists that have been created are listed with its name and the number of
rules (definitions) it contains. Click the icon next to a list to edit it, or the
icon to delete it. If you choose to edit it, a window opens where you can change the name of the list, and edit the exclusions that have been defined. Click an exclusion in the left-hand list to change its definition in the Regular Expression field. See the section Administration > Text Analysis > Regular Expressions for more information. Click the Update button to confirm the changes, or the Delete button to delete the exclusion. Click OK.
Regular ExpressionsIn a regular expression, different characters are used to search for words and phrases in a text. Below you find (in bold) some examples of how to write regular expressions.
• Example: red - matches all words containig "red", e.g. "red", "redirect", "offered" and "credentials"
• The ^ character marks the beginning of the word.Example: ^red - matches all words beginning with "red", e.g. "red" and "redirect"
• The $ character marks the ending of the word.Example: red$ - matches all words ending with "red", e.g. "red" and "offered"
• The ^ and $ characters can be combined to match whole words.Example: ^red$ - matches the exact word "red"
• The | character is used to separate to options.Example: red|green- matches all words containing "red" or "green", e.g. "red", "credentials", "green" and "evergreens"
© Artisan Global Media
Manual 322
• Parentheses ( ) are used to group options to be combined with other characters.
Example:
• ^(red|green) - matches all words beginning with "red" or "green", e.g. "red", "redirect", "green" and" "greenest"
• (red|green)$ - matches all words ending with "red" or "green", e.g. "offered" and "evergreen"
• ^(red|green)$ - matches the exact words "red" and "green
• Parentheses can also be used inside a word to allow two alternative spellings.Example: ^cent(er|re)$ - matches the exact words "center" and "centre"
Paper Surveys The SR-Advanced Survey plug-in contains a function for printing paper surveys that can then be scanned and analyzed by the program. The Administration > Paper survey page lets you edit the template for the instructional text that is to help the respondents completing the survey on paper to mark their answers correctly.
The program provides you with a suggestion for an instructional text that contains pictures of answers that have been marked correctly and incorrectly, respectively. If you want to edit the text or add some information you can do that in the editor on the page. It lets you, among other things, write and format text and insert images and links in the text.
When you later prepare the printing of the paper survey on the Paper survey page under Survey > Data collection, the content in the template will be prefilled on the Prepare page. However, you can edit the information if you want a custom instructional text for a particular survey.
LDAP LDAP, Lightweight Directory Access Protocol, is a service that simplifies user administration as it quickly retrieves the necessary information from a directory server. The SR-LDAP plug-in allows for the import of both respondents and users via LDAP.
For the import to function, it is necessary that the LDAP source is set up correctly. The set-up is done on this page and the task does require knowledge of the organization's directory service in terms of its directory structure, server and LDAP syntax.
It is possible to create multiple LDAP connections.
© Artisan Global Media

Manual 323
Creating and Editing LDAP ConnectionsIn the drop down list at the top, select Create new if you wish to create a new LDAP connection, or click on the name of an existing LDAP connection if you want to edit it. If you are using Microsoft Active Directory as your directory service, select this in the Template drop down list, then click on Load Template. Some fields will then be filled out with information according to Microsoft Active Directory standards. If you are using a different type of directory service, you select the Blank template. The fields then need to be filled out manually.
Fill out the appropriate fields, see the description below. At the bottom of the page you will then find two buttons: one lets you Save the settings, and the other lets you Remove the LDAP-connection.
Connection LDAP name - the name of the current data source
Domain
Server - the server's IP address or its DNS name: LDAP://[IP number] or LDAP://[server name]
Path - to the LDAP directory
User - the username that is to be used to access the LDAP directory
Page size
Password
Flags - describe the properties of the LDAP connection
• Read-only - indicates that the LDAP protocol is only used for read-only access to the LDAP directory
• Anonymous - indicates that the connection is created through anonymous authentication which ,for instance, is not supported by Active Directory
• Secure - indicates whether or not you are using a secure connection via TLS (Transport Layer Security)
• Encrypted (SSL) - indicates whether or not the connection is encrypted using SSL (Secure Socket Layers) and port 636 which is an alternative to a secure connection via TLS
• Signed - indicates that signed "packages" are used to verify that the content has not been changed
Settings The settings are mainly for the program logic and its ability to interpret and manage the data contained in the LDAP source
Member field - the member field can be found in a group and identifies the members that are part of this group
Member of field - indicates what groups the user belongs to
Domain key - indicates the abbreviation used to define the domain. In the case of Microsoft Active Directory the abbreviation is usually: DC
© Artisan Global Media
Manual 324
Groups These are settings related to the identification and filtering of groups within the directory service. Usually, an individual belongs to several groups (Member of). The use of groups can be facilitated by restricting the number of groups available to a manageable number of units, for instance the company departments and so on.
Path - to the group library
Name - indicates the abbreviation used to store the group name, which in the case of Microsoft Active Directory is usually: CN
Group filter - a code used to filter out unnecessary groups written in a valid LDAP syntax. Remember that the code must not contain line breaks. The template for Microsoft Active Directory contains code designed to present visible group objects. The default code can be expanded for instance only to present groups with certain names.
Users Parameters used to locate, identify, select and translate user-related information from the LDAP source.
Path - to the group library
User filters - code that is used to filter out any invalid users
Username - specifies the term used for storing usernames
Display name - specifies the term used for storing display names (first names and last names)
First name - specifies the term used for storing first names
Last name - specifies the term used for storing last names
E-mail - specifies the term used for storing e-mail addresses
Plug-ins For Survey&Report there are five available plug-ins: SR-Advanced Survey, SR-Advanced Report, SR-LDAP, SR-SSL and SR-Evaluate. If you decide to either rent or purchase a plug-in, you will receive a license key for it. Click on
the button to access the input field where you enter the license key. Confirm with OK.
© Artisan Global Media

Manual 325
StatisticsUnder this menu you can see statistics for which users have logged in to the program, how many surveys which have been active and how many answers were given on these surveys. The interface is divided into the two tabs User activity and Survey activity. Under both tabs, you start by selecting the Period to display statistics for.
User activityUnder the tab User activity, a combined column and line chart is displayed showing statistics per day for the selected period. The columns display the number of log-ins while the lines show the number of active surveys. The chart has two y-axes. The number of log-ins is read on the left axis and the number of active surveys is read on the right.
At Users: Display, you leave the check box marked to let the chart show statistics for log-ins. Then you select one of these options:
• Overview: The total number of log-ins per day is displayed as columns, without a grouping per user
• Top 5 users: The chart is displayed with stacked columns with different colours for the five users who have the highest number of log-ins during the period, and one colour for Other
• All users: The chart is displayed with stacked columns with different colours for all users who have logged into the program during the period
At Surveys: Display, you leave the check box marked to let the chart show statistics for active surveys. Then you select one of these options:
• Overview: The total number of active surveys per day is displayed as one single line
• Top 5 users: One line for the five owners (owner = the user who created the survey) who have had the highest number of active surveys during the period, and one line for Other
• All users: One line for the each owner who have had an active survey during the period
Survey activityUnder the tab Survey activity, a combined column and line chart is displayed showing statistics per day for the selected period. The columns display the number of survey answers while the lines show the number of active surveys. The chart has two y-axes. The number of survey answers is read on the left axis and the number of active surveys is read on the right.
At Answers: Display, you leave the check box marked to let the chart show statistics for survey answers. Then you select one of these options:
• Overview: The total number of survey answers per day is displayed as columns, without a grouping per survey
• Top 5 users: The chart is displayed with stacked columns with different colours for the five surveys which have the highest number of answers given during the period, and one colour for Other
• All users: The chart is displayed with stacked columns with different colours for all surveys which have answers given during the period
© Artisan Global Media
Manual 326
At Surveys: Display, you leave the check box marked to let the chart show statistics for active surveys. This is the same statistics as the one you find under the User activity tab. Then you select one of these options:
• Overview: The total number of active surveys per day is displayed as one single line
• Top 5 users: One line for the five owners (owner = the user who created the survey) who have had the highest number of active surveys during the period, and one line for Other
• All users: One line for each owner who has had an active survey during the period
© Artisan Global Media
Manual 327
Personal data
Personal data reportUse the search field to see what personal data is stored in the system and how these are used. You can search on the entire or parts of name etc. but you cannot make a search on a blank field.
Information on usersYou can search for users in the system and export their personal data. In the search box at the top, type the entire or part of a search argument and click the Search button. The search will be made in the following fields:
• Display Name
• First name
• Last name
• Street address
• ZIP code
• City
• Country
• Phone number
• Cell phone number
• Fax
• User name
All users matching your search are displayed under the heading Users.
Report1. Tick the checkbox next to the desired user(s).
2. Decide which information you want to include in the report:- Created surveys- Assigned questionnaires- Reports- User activity
3. Click the Generate button.
4. To export the information, click the PDF button at the bottom of the page. If several users are displayed in the report, one PDF file for each user will be created.
Content of the report:
• User details together with the date and time the user was created
© Artisan Global Media
Manual 328
• Your surveys (surveys created by the user)
• Your survey templates (survey templates created by the user)
• Your assigned surveys (surveys the user has been connected to as authorised user)
• Your assigned survey templates (survey templates the user is connected to under Users that will beconnected to the survey)
• Your reports (reports and predefined reports created by the user)
• Your assigned reports (reports the user is connected to as report reader)
• Your activity: The activities of the user where the events are grouped by date and session.
The following information is listed under the heading above:
• Surveys:
• Survey ID
• Survey name
• Status
• Category
• Survey Type (Respondent or Public)
• Theme
• Publication period
• Survey URL(s)
• Number of questions
• Number of pages
• Construction is finished (Yes or No)
• Number of survey readers
• Number of respondents
• Number of responses
• Response rate
• Number of report
• Survey templates:
• Survey ID
• Survey name
• Category
• Survey type (Template)
• Theme
• Number of questions
© Artisan Global Media
Manual 329
• Number of pages
• Number of (predefined) reports
• Reports:
• Report ID
• Report name
• Created (date)
• Language
• Survey
• URL
Removing or anonymising usersSearch and mark one or several users in the match list. After clicking the button Remove, in the lower right corner, you can choose one of the following options:
• Inactivate: The user will disappear from the user administration and from all user listings in the application. However, the user’s name will still be visible on surveys, survey templates and reports the user is connected to, for example as an owner to a survey.
• Remove: The user will be removed completely. On surveys, survey templates and reports the user was connected to, “---” will be displayed instead of the name. cted to, “---” will be displayed instead of the name. The history of activity will be removed as well.
Users can also be inactivated or removed from the register under the menu Administration > Users.
Information on respondentsYou can search for respondents in the system and export their personal data. In the search box at the top, type the entire or part of a search argument and click the Search button. The search will be made in the following fields:
• First name
• Last name
• Organisation
• User name
• Respondent properties
• Respondent categories
All respondents matching your search are displayed under the heading Respondents.
© Artisan Global Media
Manual 330
Report1. Mark the checkbox next to the desired respondent(s).
2. Decide which information you want to include in the report:- Answer information (whether the respondent has answered to a survey or not)- Submitted answers
3. Click the Generate report button.
4. To export the information, click the PDF button at the bottom of the page. If several respondents are displayed in the report, one PDF file for each respondent will be created.
Content of the report:
• Respondent details (If the respondent is a database respondent, the date he/she wascreated is displayed.)
• Surveys
• Survey ID
• Survey name
• Publication period
• Survey URL(s)
• Status (whether the respondent has answered to a survey or not)
• Answers (the submitted answers)
Removing or anonymising respondentsSearch and mark one or several users in the match list. After clicking the button Remove, in the lower right corner, you can choose one of the following options:
• Anonymise: The respondents and their answers will be kept in the system, but their names and all other respondent data, except for data on respondent category, will be cleared. Database respondents will no longer be visible in the Administration > Respondents menu, or when connecting respondents to a survey using the From respondent database tab.
• Remove: The respondents and all their respondent data will be removed completely from the system.Please note that their answers will also be removed, irrespective of the status of the surveys they are connected to. Thus, this option will affect the result of these surveys and their response rate. Only answers given to anonymous surveys will be kept.
Respondents can also be anonymised on survey level.
Database respondents not connected to any surveys can be removed from the respondent database using the menu Administration > Respondents > Manage respondents > Delete respondents.
© Artisan Global Media
Manual 331
Individual answersYou can search for personal data in the text answers stored in the system. In the search box at the top of the page, type the entire or parts of a search argument and click the Search button.
All answers, both in progress as well as submitted, containing a text that matches your search is listed.
The list contains:
• Survey name
• Answer ID
• Answer key
• Response status
• Answer date
You are able to generate a PDF of the respondent's complete answer to the current survey.
SettingsOn this page you indicate whether consent forms should be used in different situations and, if so, which of the prepared forms. The selection lists give you access to all forms that are sorted under the tab Consent Forms.
• Surveys - You can choose to show a consent form to the respondents before they answer the survey. In order to answer the survey, the respondent must tick an "I agree" checkbox and click on an "I accept" button to proceed to the survey. If a respondent clicks the "I do not accept" button, a refused consent page will be displayed and the respondent gets the status Unregistered on the survey.
Mandatory / Non-Mandatory Consent:The system may require that a respondents first agree to participate in a survey before it is possible to continue, or leave it open for each user to decide if a consent is needed for the current survey.
The user can change to other prepared forms of consent - Surveys and refused consent as well as adjust these forms on questionnaire level.
• Add Respondent - To remind the user who adds respondents to a survey that he / she needs their consent, you can display a form that informs about this when the user clicks the Add respondents... button.
© Artisan Global Media

Manual 332
• User - If a user log in to Survey & Report using Windows authentication or SAML, the user is automatically created the first time he/she logs in. In this case, you can display a form that the user must agree to before he/her is saved as a user.
• Add user - Normally, users are created in the system by an administrator. To remind the administrator that he/she must have obtained the user's consent, you can display a form with this information when the administrator clicks the Add user button.
Consent Forms
Consent - Survey
Edit consent - SurveyThis page contains the collection of forms in the system that can be used for respondent's consent before answering the survey.
The individual user cannot edit the form with the Default setting under Properties > Basic Information > Consent Form of the survey. However, the user can choose a form from the selection list, and if so, adjust it further under the activated tab Consent form.
The default texts for the consent check box, as well as the agree and refuse buttons are defined under Administration > Languages and Translations > Translation > Survey texts, but you can customise the texts at survey level under Construction > Basic Information > Properties > Layout > Survey texts. This also applies to the message displayed to confirm a refusal.
Creating new consent - Survey1. Click the Create new button.
2. Design the form in the editor. You can write and format text, and insert images and links. See the section Survey > Survey Construction > Basic Information > Introductory text for information on how to insert and align images, and how to link to files and to web and e-mail addresses.
3. Click Save.
The form is automatically created in all active survey languages in the system. If you want a different form in one of the languages, you select this language in the drop down list above the editor, make your changes, and click Save.
Creating copy of a consent - Survey1. Select the form you want to copy, in the drop down list at the top of
the page.
2. Click the Clone button.
3. Select a language in the drop down list above the editor.
4. Make the desired changes.
5. Click Save.
© Artisan Global Media
Manual 333
Note! The change only applies to the current language version.
Click the button if you want the change to apply to all languages.Repeat steps 3 - 5 above for other languages.
Editing consent - Survey1. Select the form you want to edit, in the drop down list at the top of
the page.
2. Select a language in the drop down list above the editor.
3. Make the desired changes.
4. Click Save.
Note! The change only applies to the current language version.
Click the button if you want the change to apply to all languages.Repeat steps 2 - 4 above for other languages.
Remove consent - Survey1. Select the form you want to delete, in the drop down list at the top of
the page.
2. Click the Remove button.
3. Confirm by clicking OK.
If you remove a form from the list, it will also be removed from the surveys it is used in at present. These surveys will instead get the form specified as default.
The system default form can not be deleted.
Read more about the Access tab in the next section.
AccessIf you have created organisations under Administration > Organisations, you can under the tab Access decide which organisations are to have access to the form which is selected in the drop down list at the top of the page.
Select the desired organisations by marking the check box next to them. The organisation you belong to (or, if you belong to several organisations, the one which is selected in the organisation drop down list) is already marked. To be able to give an organisation access to a form, you must belong to this organisation yourself.
If you have a hierarchical structure of organisations, any sub-organisations to selected organisations will automatically be selected. However, any parent organisations will not be automatically selected. The check box next to an organisation indicates that the organisation itself is not selected, but that it has sub-organisations which are selected. If you want the parent organisations to have access to the form, mark the check box Make this accessible to parent organisations.
© Artisan Global Media

Manual 334
The symbol to the right of an organisation indicates that the organisation has access to the form, while organisations without access have the symbol.
Finally, click the Save button.
Consent Resufed - Survey
Edit consent refused - SurveyThis page contains the collection of forms in the system that can be used if the respondent refuses consent before answering the survey.
The individual user cannot edit the form with the Default setting under Properties > Basic Information > Consent Refused Page of the survey. However, the user can choose a form from the selection list, and if so, adjust it further under the activated tab Consent Refused.
The default texts for the consent check box, as well as the agree and refuse buttons are defined under Administration > Languages and Translations > Translation > Survey texts, but you can customise the texts on survey level under Construction > Basic Information > Properties > Layout > Survey texts. This also applies to the message displayed to confirm a refusal.
The handling of forms under Consent Refused - Survey is performed in the same way as for Consent - Surveys.
AccessSee Personal data > Consent Forms > Consent - Survey > Access for more information.
Edit consent - Add respondentThis page contains the collection of forms in the system that can be used for users' acceptance of responsibility before adding respondents to the survey or to the respondent database.
The form selected under Personal data > Settings can not be customised for different situations but applies to all users and surveys in the system. The form therefore has no Access tab. Otherwise, the same handling applies as for Consent - Survey.
Edit consent - UserThis page contains the collection of forms in the system that can be used for a person's approval before his/hers user identity is automatically created with Windows authentication or SAML.
The form selected under Personal data > Settings cannot be customised for different situations but applies to all users and any eventual organisations in the system. The form therefore has no Access tab. Otherwise, the same handling applies as for Consent - Survey.
© Artisan Global Media

Manual 335
Edit consent - Add UserThis page contains the collection of forms in the system that can be used for the administrator's approval of responsibility before adding new users to the system.
The form selected under Personal data > Settings cannot be customised for different situations but applies to all administrators and users in the system. The form therefore has no Access tab. Otherwise, the same handling applies as for Consent – Survey.
© Artisan Global Media

Manual 336
Help
Manual Here is a link to the program manual. You can also receive help and information regarding the page you are currently working on by clicking the
icon which can be found in the top-right corner.
About On this page you can find information about your license and which version of the software is installed. Under Active surveys you can see how many on-going surveys there are, and how many your license allows for.
If you need to enter the license key you can do this by clicking on the button.
© Artisan Global Media