Embed Size (px)
Citation preview

ENGINEERING 2258
ELECTRIC MACHINES
Laboratory Manual
Jason Servais El. Eng. Technologist
Manfred Klein
El. Eng. Technologist (2008)
Department of Electrical Engineering Lakehead University
Thunder Bay, ON
Revised Fall 2008


3
SAFETY 1. Some of the experiments involve voltages that could conceivably lead to serious
injury or death. Therefore strict adherence to the following rules will greatly decrease the probability that accidents will occur. However, no set of rules can replace basic common sense, and all persons using the laboratory are encouraged to constantly THINK SAFETY !
2. Always assume all circuits are energized unless you know with certainty that they are
not.
3. Use one hand to make connections.
4. Never work on electrical circuits with wet or moist hands.
5. Do not play with equipment not directly involved in your experiment.
6. When in the lab do not wear clothing or jewelry which could constitute a health hazard. Shoes, preferably rubber soled ones, must be worn in the lab. Long hair presents a hazard near moving parts of machinery.
7. It is important for safety reasons for anyone to easily trace out your test circuit and, therefore do not work on a cluttered bench.
8. Never touch moving parts of machinery.
9. Think out ahead of time the consequences of closing or opening a switch.
10. Never alter an energized circuit unless you are certain of the outcome.
11. If you know or suspect that an accident is about to occur, take immediate steps tp prevent it but do not jeopardize your own safety in so doing.
THINK SAFETY

ELECTRICAL MACHINES
4
EXPERIMENTS Policy and Rules for Laboratory Exercises.......................................................................4 1. DC Generator........................................................................................................6 2. DC Motor .............................................................................................................14 3. Synchronous Generator......................................................................................20 4. Synchronous Motor .............................................................................................28 5. 3-Phase Induction Machine.................................................................................34 Appendix A...........................................................................................................42 Appendix B ..........................................................................................................43 Appendix C..........................................................................................................44 REFERENCES 1. “Electric Machinery Fundamentals” (class text) Stephen J. Chapman McGraw Hill, 3rd. Ed., 1999

5
Lakehead University Department of Electrical Engineering
POLICY AND RULES FOR LABORATORY EXERCISES
• No Food, No Beverages allowed in the laboratory room!! • Keep clothes, bags, etc. OFF the benches with equipment on them. • Be On Time ! Being late is annoying to your lab partners and if the experiment has progressed too far
you may not be credited with doing the experiment! • Safety precautions must be observed at all times to prevent electric shock, damage to instruments, etc. COME PREPARED! BOTH THE WRITTEN LAB REPORTS AND LAB PERFORMANCE (INCL. ATTITUDE, PUNCTUALITY, PREPAREDNESS) WILL BE CONSIDERED FOR THE FINAL LAB MARK!
Lab Exercises General The maximum number of students in a lab work group is indicated on the sign-up sheet. Should students leave a work group for whatever reason such that only one student remains in a group, this student may join another team provided there is still room in that team without exceeding the above maximum number. Missed Lab Exercises It is mandatory to perform all lab exercises according to course requirements. Failure to perform one or more lab exercises results in a grade of "F" for the course. When a student misses a lab exercise for whatever reason he/she must notify the instructor as soon as possible. If the reasons given for the absence are satisfactory to the instructor, a make-up opportunity may be arranged. There may be a chance to let the student join another team to perform the missed lab provided this does not then exceed the max number of students in that group. If it is not possible to accommodate this then a final make-up date will be arranged to take place within one week after the end of classes. Should the student fail to attend this appointment he/she will be required to provide sufficient proof of inability to attend (medical certificate, air ticket, etc.) to avoid the "F" grade. The onus of proof lies entirely with the student! The student then must immediately make another appointment with the lab instructor! The lab report in such a case is due within one week after performance, else the "F' stands.
Lab Reports General It is mandatory that all lab reports must be submitted on time as specified by the lab instructor! Plagiarism Plagiarism will not be tolerated and may result in a grade of "F" for the course. Any material taken from sources like books, manuals, web sites, magazines, etc. must be clearly referenced as a footnote or under a bibliography! A re-write of a report will be granted only under exceptional circumstances! Missed Lab exercises In some courses group lab reports may be allowed by the lab instructor. The group's composition is also determined by the lab instructor. If a student fails to perform a lab exercise with his group he/she will have to write his/her own individual lab report! Late Submission The submission schedule (due date) will be made known by the attending lab instructor. Late submission results in a deduction of 0.5 marks per day out of 10 full marks. No or Partial Submission

6
A final date for submission will be clearly indicated on the sign-up sheet and/or announced by the lab instructor. If after that date not all lab reports have been submitted, the student will receive a grade of "F" for the course! The deduction of marks for late submission still applies. Format • The report must be typed. Graphs may be produced by computer, provided the software is suited for
that use, i.e. grid, proper scaling and correct labelling can be achieved and the plot is smooth. If a graph is used to extract data or to provide some precise information, show precisely how the information is obtained (here it may be better to draw it on graph paper by hand - usually is faster, too).
• For your report use YOUR OWN words to present your report concise, clear and clean. As pointed out above, copying etc. will be considered as plagiarism and will be severely punished by reducing marks or, in severe cases, served with an "F" as mentioned above (the provider/lender of the original work included)!
• The notes/sheets containing the raw data taken by each student during the experiment are to be initialized by the attending technologist before leaving the lab and attached to the written report. Reports with the raw data missing are subject to a deduction of one full mark (= 10%)!
The student is encouraged to develop and use his/her own personal style for writing and presenting his/her report. However, standard procedures in industry and research laboratories require certain information to be documented. Therefore, adhere fairly loosely to a general format like the following: - Title page (Please make an exception here: Pages stapled - no folders, plastic covers, etc): Course number, Experiment number, Experiment Title, Name, Lab partners, Date of performance - Abstract Statement of objective of the experiment (one or two sentences) Concise and pertinent outline of the theory underlying the experiment (max one page) - Experiment and Analysis If the experiment consists of two or more parts, keep the experimental and analysis sections together – the reader of your report does not want to continuously flip pages back and forth to look for data etc.! Brief outline of the method of investigation (whatever is applicable): Procedure Measurement techniques Schematic diagrams Equipment identification Data (tables) Observations relevant to the experiment and the results Arrange experimental data, and do the necessary calculations (if applicable, at least a sample calculation), to prepare for analysis Theoretical calculations (at least sample calculation) Comparison of experimental results with theory (preferably in form of tables/graphs) Probable causes and magnitude of errors - Conclusion (Summary) - Review questions - Raw data notes, attached to report, and initialized by the attending lab technologist.
GOOD PRESENTATION IS OF THE UTMOST IMPORT ANCE, AS IS CORRECT ENGLISH AND GRAMMAR. EXPECT 20% OF YOUR LAB MARK ASSIGNED TO THIS AREA!! GENERAL INFORMATION
EQUIPMENT If equipment needs to be signed out, contact one of the technologists. The person signing it out is responsible for it! Your marks will be held back until all equipment, books, data manuals, tools etc. are returned (i.e. your graduation might depend upon it!). Signed-out equipment has to be returned to the same technologist from whom you signed it out! Assure your name is then removed from his sign-out list! No equipment may be removed from any of the laboratories without explicit permission!

7
As you see, this is very important! TAKE LABS VERY SERIOUSLY!
Lakehead University, Electrical Engineering Department July 2007

ELECTRICAL MACHINES Experiment No. 1 - 2258 DC Generator
8
DC GENERATOR Objective To study the characteristics and the performance of a Shunt DC Generator Background Electrical generators transform mechanical energy into electrical energy. The electric motor converts electrical energy to mechanical energy. DC machines convert the internal ac currents and voltages into dc by means of a mechanism called commutation. The armature conductors are wound around the rotating part, the field coils are placed around the stator (or frame) poles. In general, the various types of DC machines (generator or motor) can be classified by the way their field is excited: Separately excited (the field is excited by a separate, external power source) Shunt (the field cct is connected parallel to the armature cct) Series (the field cct is connected in series with the armature cct) Compound (both shunt and series field circuits are connected) In a dc generator, the rotor is turned by a driving unit called a ‘prime mover’ whose speed is kept constant (diesel engine, turbine, etc.). Separate excitation requires a separate field supply and is therefore used only for applications where a wide range of controlled voltage is desired. Shunt generators excite themselves and maintain an approximately constant output voltage. In this experiment, we use the separate excitation configuration to find the magnetization curve, and then use the parallel connection to investigate the performance of a DC Shunt Generator. Theory See reference text, chapters 8 and 9.11 - 9.14. The dc generator investigated in this lab is of the type shown in Fig. 1.1. This generator is also called ‘self-excited’, since the generator supplies its own excitation of the field windings by having the field connected across the terminals of the machine, in parallel to the armature.

ELECTRICAL MACHINES Experiment No. 1 - 2258 DC Generator
9
Voltage Generation To supply its own field current, the machine needs to generate some voltage EA, which in turn depends on the existence of some residual flux in the poles. However, initially there may not be enough residual flux and hence no voltage is generated. In this case a small dc voltage can be applied to create some flux in the poles. The induced voltage EA is given by: E KA res= Φ ω (1.1) where, EA = internally generated voltage (steady state generated emf) K = machine constant Φres = residual flux in the poles of the generator ω = angular velocity
Fig. 1.1 Equivalent circuit − d.c. shunt-generator If there is no residual flux, then EA= 0 and IF = 0 , and the process can’t get started. This can be corrected by reversing the rotational direction of the machine, reversing the field connections, or “flashing” the field. The internally generated voltage EA is related to the terminal voltage VT by: V E I RT A A A= − (1.2) and, I I IA F L= + (1.3)

ELECTRICAL MACHINES Experiment No. 1 - 2258 DC Generator
10
where,
IA = armature current (in Amp) RA = armature resistance (in Ohm) VT = terminal voltage (in Volts) IL = load current (in Amps) RL = load resistance (in Ohm) IF = field current (in Amps) RF = field resistance (in Ohm) RRh = rheostat resistance (in Ohm) VNL = generated output terminal voltage at No Load (in Volts) VFL = generated output terminal voltage at Full Load (in Volts)
The generator performance can be evaluated from the voltage regulation:
VRV V
VNL FL
FL
=−
× 100 % (1.4)
Power and Losses A power-flow diagram shows the relationship of input power, losses, and output power: Armature Terminal EM = PCONV Power PIN POUT
PROT PCO, A PCO,F PSTRAY PBRUSHES PIN = Prime Mover PROT = Rotational Losses PSTRAY = Stray Losses (very small, ignored) EM = PCONVERTED = EA IA PCO,A = Armature copper losses IA2 RA PCO,F = Field copper losses IF2 RF PBRUSHES = Brush losses IA 2 Volts [W] PATP = Armature Terminal Power VT IA POUT = Output Power at shaft VT IL In this experiment we do not measure the input power provided by the prime mover. Then POUT = PCONV − PCO − PBRUSH − PFIELD

ELECTRICAL MACHINES Experiment No. 1 - 2258 DC Generator
11
Experiment Note the set number of the machine set you are using (on the right side of the acrylic cover) Nameplate Data Record the nameplate data of both the dc and the ac machine. Of interest are: rated power, voltage, current, and speed for the AC machine also record Design class letter and starting code (KVA-) letter Keep the notes at hand since you will need the nameplate date for the DC Motor and the Induction Motor experiments, too. Equipment Variac (Variable Transformer) Tachometer (installed on back frame) Bridge Rectifier Rheostats 180Ω, 44Ω, 22Ω V-meter (15VDC) A-Meter (5ADC), for IL Armature and Field Resistance Measure RA and RF using the V/A- meter method. The measurement procedure is described in Appendix B of this manual. - For the measurement of RA the switch at the instrument panel needs to be in the "Mot" position. Start with zero Volts (!!), use the supplied V-meter (set to range to cover 15V) meter to read the voltage and increase until the current IA reaches 4 A. Then compute RA. - For the measurement of RF set the switch at the panel to "Gen". Apply 100V to the field terminals and measure the current. Compute RF. Magnetization Curve and Open Circuit Characteristic Eq. 1.1 shows that the generated voltage EA is proportional to the flux and the rotational speed. Since the speed is kept constant, the emf EA is directly proportional to the flux. The flux is produced by the magnetomotive force which in turn is proportional to the field current. Thus, EA is proportional to IF and the magnetization curve is usually plotted as EA vs. IF (see Fig. 1.2). Since in the open circuit configuration EA ≅ VT, this is also frequently referred to as the ‘open circuit characteristic’ (OCC).
Fig. 1.2 Magnetization Curve

ELECTRICAL MACHINES Experiment No. 1 - 2258 DC Generator
12
The magnetization curve can be measured with either the shunt circuit configuration as well as with the separately exited circuit configuration. Since we want to investigate the shunt type generator it may appear to be logical to use this circuit for the measurement. However, since the machine needs to provide its own field current, and the field current is limited by the internal field resistance, the generated open circuit voltage will reach its maximum before reaching or even coming close to the saturation area. Conversely, when the field current is supplied externally it can be adjusted to an amount sufficiently large so that the voltage EA can reach the saturation area. Therefore, for the procurement of the magnetization curve we use the external or separate excitation. Later on, for the measurement of the output characteristics under load we then use the shunt circuit as outlined earlier. Connect the circuit shown in Fig. 1.3. All meters are already wired in and located at the back panel.
How to use the AC Drive: Switch power ‘ON’. Push ‘START’ to start the prime mover. Adjust the potentiometer on the AC drive unit until the desired speed is reached. Then, for the remainder of the experiment, the pot can stay in that position and the AC drive is simply switched on and off by pressing START/STOP. After a Stop and Re-Start the drive accelerates the ac machine until it reaches the previously set speed.
On the back panel, confirm that the mode switch is set to ‘Gen’ ! Adjust the prime mover speed until rated speed of the generator is reached and keep it constant. Using the variac to increase IF from 0 in increments of approx. 50mA to 500mA (IFmax ~ 10% of rated current, i.e ~ 0.5A). Try to do this slowly and in one smooth sweep to avoid hysteresis effects. Do NOT try to set a precise value for VT by varying the voltage up and down! Carefully record IF, VF and VT. Fig. 1.3 Connection diagram − no load (OCC) characteristic

ELECTRICAL MACHINES Experiment No. 1 - 2258 DC Generator
13
Start-Up As mentioned earlier, in a shunt-connected generator configuration, the initial generation of an emf in the generator depends on a residual flux remaining in the poles. Also, if the field resistance is larger than a certain critical resistance, the terminal voltage VT remains at the residual level and will not build up. This problem will be investigated here. With the circuit shown in Fig. 1.4., set the field rheostat RRh to a value of approx. 180 Ω. Figure 1.4 Connection diagram − Start up test Start the prime mover and bring it to the rated generator speed. Observe the terminal voltage VT . There will be no output voltage, i.e. no voltage generated. Now decrease the field resistance slowly. When the voltage does begin to build up, stop the machine and measure the resistance of the rheostat. This is the ‘critical resistance’ RC which, when exceeded, prevents the voltage build-up as shown in Fig. 1.5. Since RRh is in series with RF, RC = field resistance RF + external RRh Fig. 1.5 OCC characteristics

ELECTRICAL MACHINES Experiment No. 1 - 2258 DC Generator
14
Terminal Characteristics This part of the experiment investigates the machine under load Usually the machine is run at a constant speed set by the prime mover. The generator provides its own field current which, however, depends on its terminal voltage. Connect the circuit as shown in Fig.1.6. Use the supplied A-meter (5ADC) for IL. The field is shunted directly to the armature, with no external resistance added. Fig. 1.6 Connection diagram − generator under load Bring the prime mover up to rated speed. Starting with the 180Ω-rheostat fully inserted, connect the load resistances as required (observe the current rating limits!) to obtain several load currents in 0.5A-increments from near zero (180Ω-rheostat set to full resistance) to full load (see nameplate) or as high a load current the generator can sustain, by decreasing the rheostat resistance.
Keep n = constant, adjust AC drive unit if necessary! • To avoid damage to the rheostats or the motor, select the proper rheostat for the
particular current range by observing the current ratings (shown on the glider) and by calculating the approx. resistance value for the desired current.
• If this current rating is exceeded switch the prime mover off. Exchange the rheostat with one of lower resistance but higher current rating. When connecting the new rheostat make sure it is initially set to the maximum resistance to avoid damage due to high currents. Then re-start the prime mover and continue with the experiment.
For each value of IL, measure VT, IA, n and IF. Most likely VT will break down before the rated current can be achieved. Stop the experiment when IL and VT begin to decrease, and note IMAX and VT.

ELECTRICAL MACHINES Experiment No. 1 - 2258 DC Generator
15
Analysis 1. Plot the OCC (EA vs. IF) on graph paper (EA = VT, NO LOAD). 2. Obtain a reasonable value for the critical resistance RC from the graph and compare
with the (approximate) value found from measurement. Show how you did this. 3. Using the data from your load measurement, plot the RF-line onto the magnetization
curve (VT [LOAD] vs IF). Determine RF and compare with the value found earlier. 4. Plot VT vs IL (on graph paper) using the measured results of loading the generator. 5. Making use of the same graph, calculate the voltage regulation (VNL is at IL = 0). 6. For IL = 2A and the corresponding IF find EA from the OCC-curve. Using the
measured values for RA and RF, calculate POUT by finding the internally generated power PCONV and subtracting the losses as shown in the theory section. Compare the result with the measured POUT = VT IL.
7. If the rotational losses PROT are assumed to be ~ 24.6 W, what would be the efficiency η = POUT / PIN be? (The value for the rotational losses comes from a separate experiment, but can be used here)
8. Comment on the overall performance of the dc generator. Keep notes for RA, RF for the following labs Conclusion Comment on your results and the performance of the generator.

ELECTRICAL MACHINES Experiment No. 2 - 2258 DC Motor
16
DC MOTOR Objective To study the characteristics and the performance of both a separately excited and a shunt connected D.C. Motor Background There is no physical difference between the d.c. generator and the d.c. motor. The only difference between the two is the direction of power flow. Separately excited and shunt dc motors exhibit a linear relationship between speed and torque. This allows for excellent speed control and, despite the fact that they are more expensive than induction motors, these motors still find a wide range of applications. Theory See reference text, chapters 8 and 9.1-9.10. The equivalent circuits of the separately excited and shunt dc motors are the same as for the generator, but with the direction of currents reversed (see Figs. 2.1 and 2.2):
Fig. 2.1 Fig. 2.2
Equivalent circuit Equivalent Circuit Separately excited Shunt Excitation

ELECTRICAL MACHINES Experiment No. 2 - 2258 DC Motor
17
While dc generators are compared by their voltage regulation, dc motors are compared by their speed regulation.
Speed regulation is defined by SR NL FL
FL
=−
×ω ω
ω100 [%] (Eq. 2.1)
If it is assumed that the voltage applied to the motor, VT, is kept constant, then the relevant equations are: Internally generated voltage E KA = Φω (Eq. 2.2) and E V I RA T A A= − (Eq. 2.3) Developed torque T K I A= Φ (Eq. 2.4) For the separately excited motor
I IL A= (Eq. 2.5)
I
VRF
F
F
= (Eq. 2.6)
For the shunt motor
I I IL A F= + (Eq. 2.7)
I
VRF
T
F
= (Eq. 2.8)
Angular velocity in rad/sec
ωπ
=260
n (Eq. 2.9)
where n is in rev/min [rpm] Input Power (power applied to exterior terminals) P V IIN T L= (Eq. 2.10)
Efficiency η = ×PPOUT
IN
100 [%] (Eq. 2.11)
Copper losses, sep.excited P I RCo A A= 2 (Eq. 2.12a)
Copper losses, shunt P I R I RCo A A F F= +2 2 (Eq. 2.12b)
Rotational losses
)()( NLCoNLINROT PPP −= (Eq. 2.13)
Core losses and stray losses are usually small and will be ignored.
ELECTRICAL MACHINES Experiment No. 2 - 2258 DC Motor
18
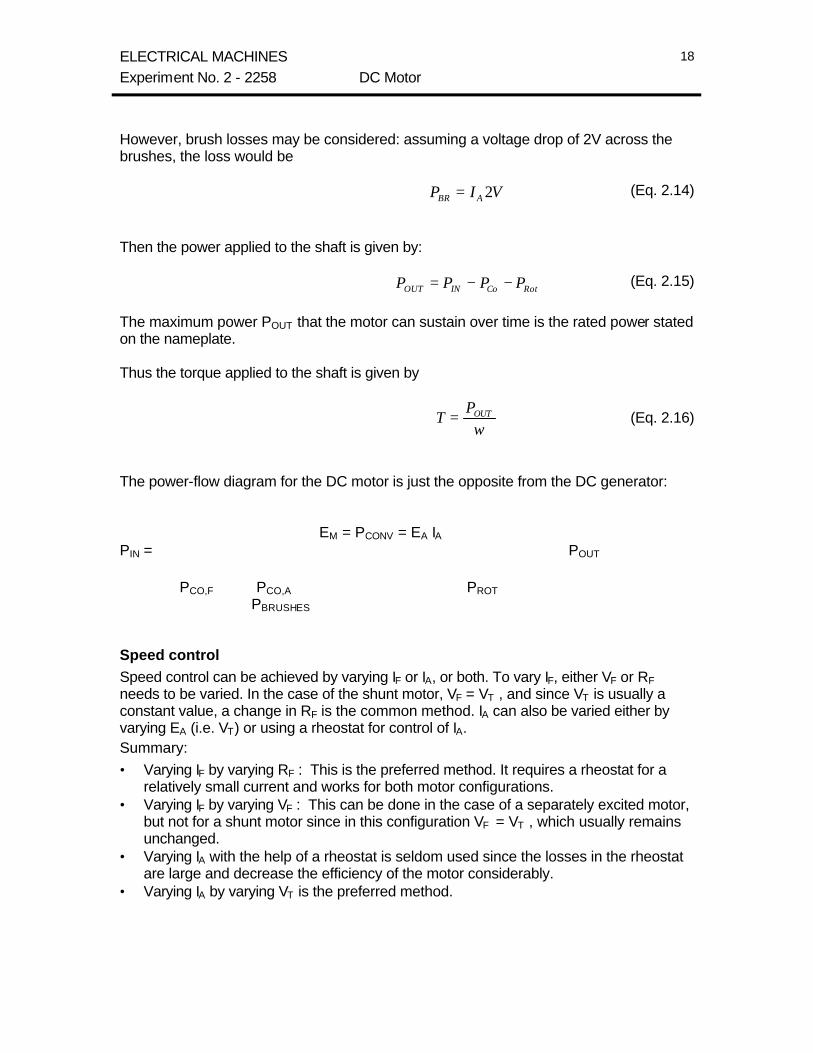
However, brush losses may be considered: assuming a voltage drop of 2V across the brushes, the loss would be VIP ABR 2= (Eq. 2.14)
Then the power applied to the shaft is given by:
RotCoINOUT PPPP −−= (Eq. 2.15)
The maximum power POUT that the motor can sustain over time is the rated power stated on the nameplate. Thus the torque applied to the shaft is given by
TPOUT=
ω (Eq. 2.16)
The power-flow diagram for the DC motor is just the opposite from the DC generator:
EM = PCONV = EA IA PIN = POUT PCO,F PCO,A PROT PBRUSHES Speed control Speed control can be achieved by varying IF or IA, or both. To vary IF, either VF or RF needs to be varied. In the case of the shunt motor, VF = VT , and since VT is usually a constant value, a change in RF is the common method. IA can also be varied either by varying EA (i.e. VT) or using a rheostat for control of IA. Summary: • Varying IF by varying RF : This is the preferred method. It requires a rheostat for a
relatively small current and works for both motor configurations. • Varying IF by varying VF : This can be done in the case of a separately excited motor,
but not for a shunt motor since in this configuration VF = VT , which usually remains unchanged.
• Varying IA with the help of a rheostat is seldom used since the losses in the rheostat are large and decrease the efficiency of the motor considerably.
• Varying IA by varying VT is the preferred method.

ELECTRICAL MACHINES Experiment No. 2 - 2258 DC Motor
19
Experiment 2 - variacs 1 - rheostat 180 Ω 1 - Tachometer 2 - bridges 1 - A meter, 5A dc The experiment uses ‘Dynamic Braking’. The ac machine is used as a load to the dc motor. For that purpose, a dc current (via a rectifier bridge) is applied to two of the three phases which can be varied with the variac and produces a counter-torque on the ac machine and thus a brake action on the dc machine. Assume the induction machine Y-connected! Nameplate data Record the nameplate data of both the dc and the ac machine. Armature and field resistance Measure RA and RF using the Voltmeter/Ammeter method. The measurement is described in Appendix B of this manual. If you are using the same set of machines as in Experiment No. 1 you can use the already measured data.
Separately excited dc motor Connect the circuit shown in Fig. 2.3. Fig. 2.3 Connection diagram − separately excited d.c. motor Set the mode switch on the back panel to ‘Mot’ ! Set VT to 0V (variac fully counterclockwise)! Set the rheostat to minimum resistance and apply VF to the field terminals (switch dc-drive 'ON'). VF should read about 100V and IF approx. 400 mA.
It is imperative that the field excitation is established before the armature voltage is applied!
ELECTRICAL MACHINES Experiment No. 2 - 2258 DC Motor
20
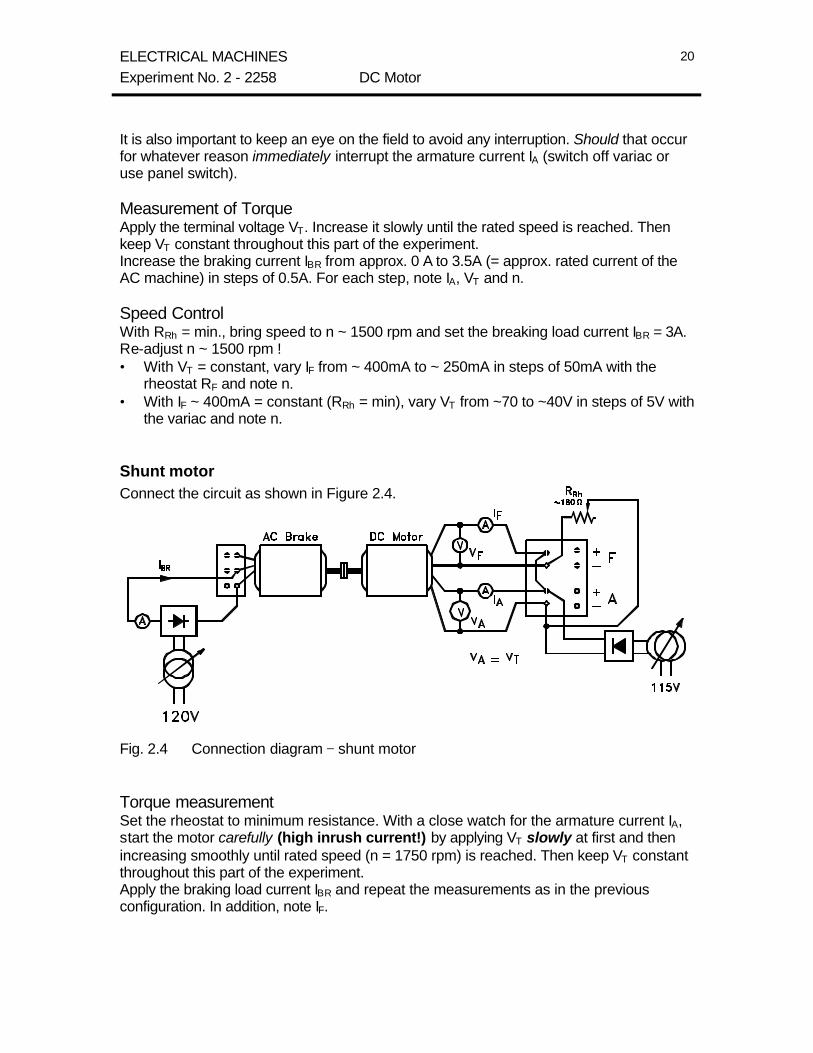
It is also important to keep an eye on the field to avoid any interruption. Should that occur for whatever reason immediately interrupt the armature current IA (switch off variac or use panel switch). Measurement of Torque Apply the terminal voltage VT. Increase it slowly until the rated speed is reached. Then keep VT constant throughout this part of the experiment. Increase the braking current IBR from approx. 0 A to 3.5A (= approx. rated current of the AC machine) in steps of 0.5A. For each step, note IA, VT and n. Speed Control With RRh = min., bring speed to n ~ 1500 rpm and set the breaking load current IBR = 3A. Re-adjust n ~ 1500 rpm ! • With VT = constant, vary IF from ~ 400mA to ~ 250mA in steps of 50mA with the
rheostat RF and note n. • With IF ~ 400mA = constant (RRh = min), vary VT from ~70 to ~40V in steps of 5V with
the variac and note n. Shunt motor Connect the circuit as shown in Figure 2.4. Fig. 2.4 Connection diagram − shunt motor Torque measurement Set the rheostat to minimum resistance. With a close watch for the armature current IA, start the motor carefully (high inrush current!) by applying VT slowly at first and then increasing smoothly until rated speed (n = 1750 rpm) is reached. Then keep VT constant throughout this part of the experiment. Apply the braking load current IBR and repeat the measurements as in the previous configuration. In addition, note IF.

ELECTRICAL MACHINES Experiment No. 2 - 2258 DC Motor
21
Speed control With no load applied (IBR = 0) and the rheostat set to min (RRh ~ 0), start the motor and adjust to n ~ 1500 rpm. Then apply the load, IBR = 3A. Re-adjust VT to set speed to n ~ 1500. • Note VT and keeping it constant (adjust variac if necessary), vary IF from ≈ 240mA to
≈ 160mA in steps of 20mA. Record n. • Set VT = 60V and adjust IF = 200mA with the rheostat. Keeping IF = constant (adjust
rheostat as necessary), vary VT from 60V to 50V in steps of 2V. Record n. Change of rotation Set IBR to 0 (no load). - Run the machine shortly and note the direction of rotation. - Stop the machine. Switch field off! Change the polarity of the field voltage. Switch field on again. Re-start the machine again and just long enough (to avoid damage to the meters because some of which will go in the wrong direction) to note the direction of rotation. Stop, switch field off and change the polarity of the field back. Switch field on again, and start the machine shortly to verify that the direction is as it was initially. - Now change the polarity of the armature voltage and repeat the exercise above, again just long enough to note the direction of rotation. Analysis For both the separately excited machine and the shunt machine: (for the rotational losses assume 24.6W) 1. Table all your results 2. Calculate and plot T vs IA 3. Plot n vs T (Plot the results for both 4. Calculate and plot η vs T configurations on the same 5. Plot n vs IF (with VT = const.) graph for comparison) 6. Plot n vs VT (with IF = const.) 7. Find efficiency η = POUT (Shaft) / PIN 8. Calculate speed regulation (For all plots use graph paper!) 9. How can you change the direction of rotation? Questions a) Why has the field always to be connected first and must not be interrupted? b) Can you design a circuit or some device to protect the motor in case the field
connection accidentally opens? (Hand sketch sufficient) Conclusion Comment on your results and the performance of the motor.

ELECTRICAL MACHINES Experiment No. 2 - 2258 DC Motor
22

ELECTRICAL MACHINES Experiment No. 3 - 2258 Synchronous Generator
23
SYNCHRONOUS GENERATOR Objective To measure the impedances of a Synchronous Generator. Theory See reference text, chapter 5. The synchronous generator requires a prime mover to turn the rotor of the machine. A dc current applied to the rotor winding produces a rotating magnetic field which in turn induces a three-phase voltage within the stator windings, quite similar to a transformer action. As the name implies, the frequency is given by:
fn pm=120
(Eq. 4.1)
where f = frequency [Hz] nm = mechanical speed [rpm] p = number of poles For a 4-pole machine such as the one used in this experiment, to achieve a frequency of 60 Hz the speed needs to be exactly n = 1800 rpm, i.e. the rotor must rotate at 1800 revolutions/minute. The voltage induced in the stator is given by E KA = Φω (Eq. 4.2) where K = a machine constant depending on number of poles etc. Φ = flux ω = angular velocity Eq. (4.2) shows that EA is proportional to the flux Φ . The flux depends on the rotor current which is the field current IF. Similarly as in the dc generator, IF depends on the flux and since EA is directly proportional to flux, this relationship is shown in Fig. 4.1.

ELECTRICAL MACHINES Experiment No. 3 - 2258 Synchronous Generator
24
Fig. 4.1 The magnetization curve This is known as the magnetization curve or the open circuit curve of the machine. The synchronous generator can be represented by an equivalent circuit on per phase basis (assuming the system is balanced), as shown in Fig. 4.2: Fig. 4.2 Equivalent circuit on per phase basis For a Y-connected stator as in our machine, we have: V VT = 3 ϕ (Eq. 4.3)
or
V EV
ATϕ = =3
(Eq. 4.4)
where Vt is the terminal voltage. To find the parameters of the equivalent circuit, three quantities must be found:
1) The relationship between field current IF and flux, i.e. between field current IF and EA
2) The synchronous reactance XS 3) The armature resistance RA
Item (3) can be found by means of the V/A-meter method used in previous experiments (or see Appendix B). In a pinch, an Ω-meter will suffice.

ELECTRICAL MACHINES Experiment No. 3 - 2258 Synchronous Generator
25
Item (1) can be found by performing the open circuit test. The result is a plot EA vs IF (open circuit characteristic OCC). The linear portion is called the “air gap line” (Fig. 4.1). Item (2) is found by performing the short circuit test. The resulting plot shows the relationship IA vs IF (see Fig. 4.3), called the short circuit characteristic SCC: Fig. 4.3 Plotting the results of both the open circuit test (OCC) and the short circuit test (SCC) onto the same graph, XS can be found by
XEI
V ocIS
A
A A SC
≈ ≈ϕ ,
,,
(Eq. 4.5)
Consider Fig. 4.4:
Fig. 4.4
ELECTRICAL MACHINES Experiment No. 3 - 2258 Synchronous Generator
26
From the plot • Choose a field current • Find the internal generated voltage EA = Vϕ,OC from the OCC at that field current • Find the short circuit current IA,SC at that field current • Calculate XS From Figs 4.1 and 4.4 we have:
IEZ
E
R XA
A A
A S
= =+2 2
(Eq. 4.6)
with RA << XS IEXA
A
S
= (Eq. 4.7)
and XEI
V ocIS
A
A A SC
≈ ≈ϕ ,
,
(Eq. 4.8)
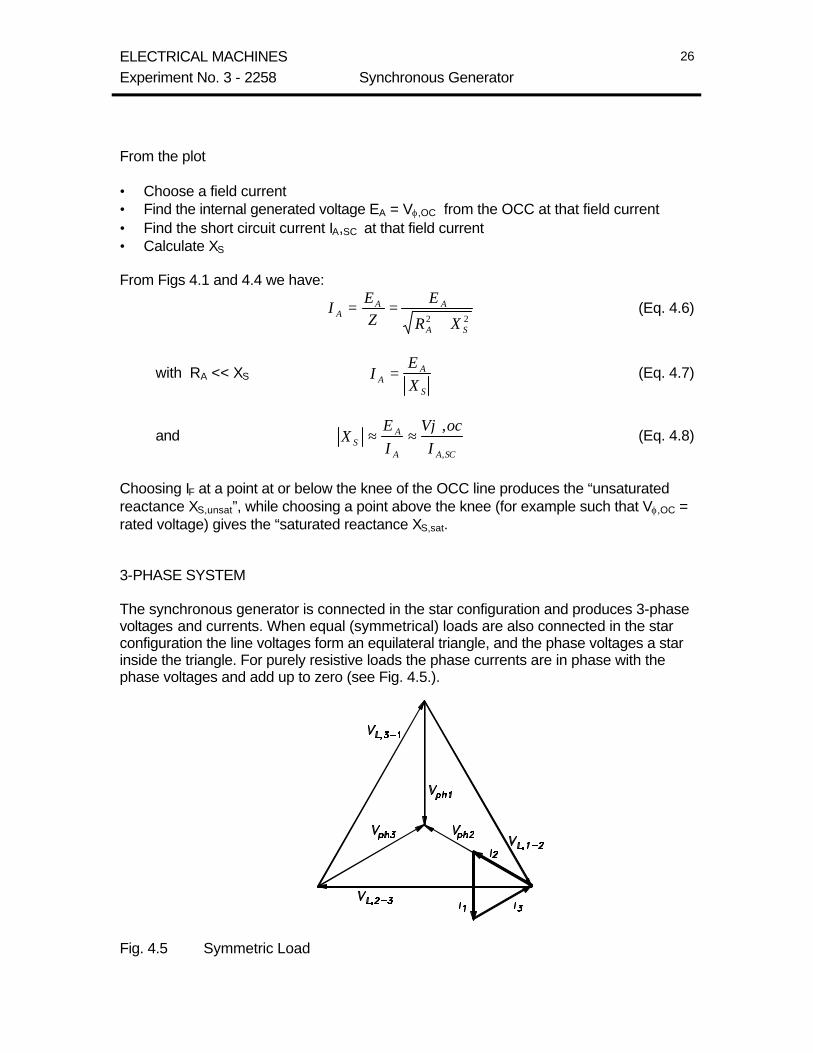
Choosing IF at a point at or below the knee of the OCC line produces the “unsaturated reactance XS,unsat”, while choosing a point above the knee (for example such that Vϕ,OC = rated voltage) gives the “saturated reactance XS,sat. 3-PHASE SYSTEM The synchronous generator is connected in the star configuration and produces 3-phase voltages and currents. When equal (symmetrical) loads are also connected in the star configuration the line voltages form an equilateral triangle, and the phase voltages a star inside the triangle. For purely resistive loads the phase currents are in phase with the phase voltages and add up to zero (see Fig. 4.5.). Fig. 4.5 Symmetric Load

ELECTRICAL MACHINES Experiment No. 3 - 2258 Synchronous Generator
27
If the loads are of different values, i.e. unsymmetrical, then the line voltage triangle becomes scalene. The middle point of the star formed by the phase voltages moves from the center. The phase currents are still in phase with the phase voltage and also form a scalene triangle with the current vectors still adding up to zero (see Fig. 4.6.).
Fig. 4.6 Non-symmetric Load Experiment 1 Wound rotor motor (Generator) 1 DC Motor (Prime Mover) 3 Variacs 3 DC Bridges 1 A-meter 1ADC 3 A-meter 1AAC 1 A-meter 2.5ADC 1 V-meter AVO, 1000VAC, probes 1 A-meter 3ADC 1 Tachometer 1 V-meter 300VAC 1 Resistor box 1 DMM Nameplate Data Record the nameplate data of both the ac and the dc machine. DC Test Measure RA (one stator winding, = resistance per phase!). See Appendix B. Open Circuit Test (OCC)

ELECTRICAL MACHINES Experiment No. 3 - 2258 Synchronous Generator
28
Connect the circuit as shown in Fig. 4.7.
Fig. 4.7 Connection diagram - open cct test On the dc motor, first establish the field! Set the field voltage to ~100V. Then adjust the armature voltage/current to achieve a speed such that the synchronous generator produces a 3-phase voltage of exactly 60 Hz. Keep this speed constant! Vary IF,Gen from 0 to 2.4A in steps of 0.2A and measure VT . Then
E VV
AT OC= =ϕ ,
3 (Eq. 4.9)
Short Circuit Test (SCC) Connect the circuit as shown in Fig. 4.8
ELECTRICAL MACHINES Experiment No. 3 - 2258 Synchronous Generator
29
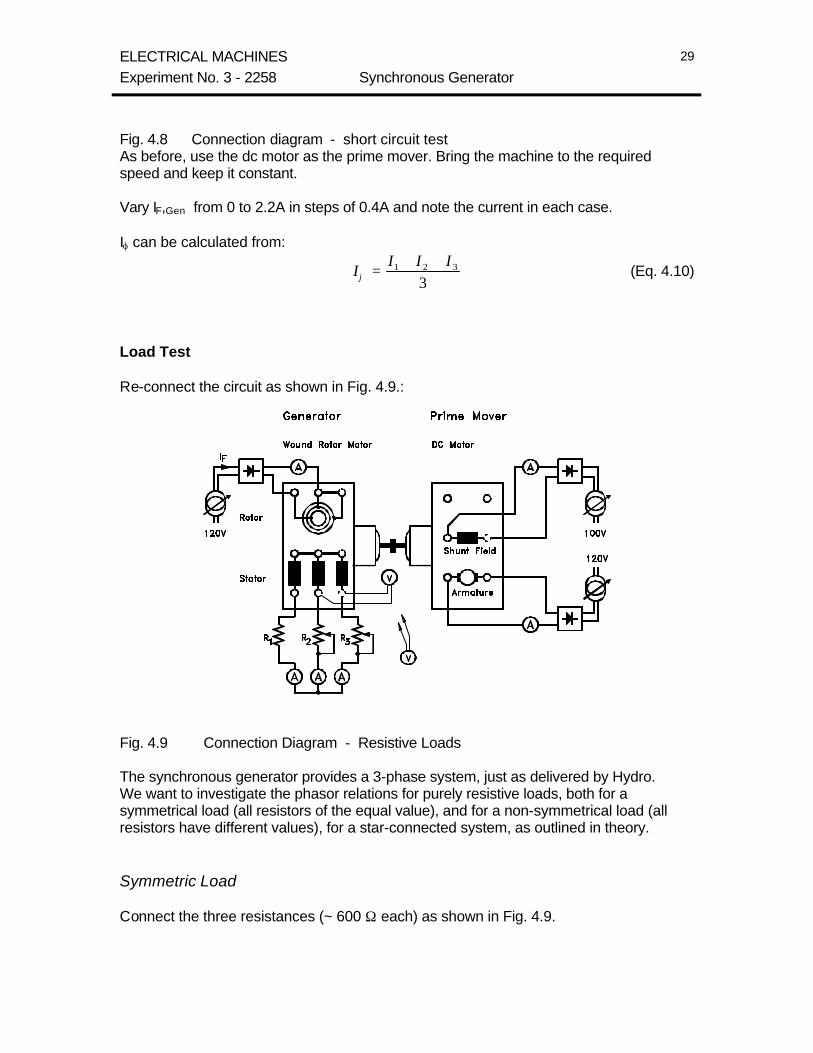
Fig. 4.8 Connection diagram - short circuit test As before, use the dc motor as the prime mover. Bring the machine to the required speed and keep it constant. Vary IF,Gen from 0 to 2.2A in steps of 0.4A and note the current in each case. Iϕ can be calculated from:
II I I
ϕ =+ +1 2 3
3 (Eq. 4.10)
Load Test Re-connect the circuit as shown in Fig. 4.9.: Fig. 4.9 Connection Diagram - Resistive Loads The synchronous generator provides a 3-phase system, just as delivered by Hydro. We want to investigate the phasor relations for purely resistive loads, both for a symmetrical load (all resistors of the equal value), and for a non-symmetrical load (all resistors have different values), for a star-connected system, as outlined in theory. Symmetric Load Connect the three resistances (~ 600 Ω each) as shown in Fig. 4.9.

ELECTRICAL MACHINES Experiment No. 3 - 2258 Synchronous Generator
30
Bring the system up to synchronous speed and adjust IF such that the permanently installed voltmeter shows 200VAC. Measure the phase currents, the phase voltages, the line voltages, the voltages across the resistors, and the voltage between the shorting point of the stator windings and the shorting point of the resistors ( V0-0 ). Stop the system. Non-symmetric Load Re-connect the resistors as follows: phase 1: 600 Ω; phase 2: 300 Ω, phase 3: 200 Ω (600 and 300 in parallel). Again, bring the system up to synchronous speed and adjust IF such that the permanently installed voltmeter shows 200VAC. Measure the phase currents, the phase voltages, the line voltages, the voltages across the resistors, and V0-0, as before.. Analysis 1) Plot EA vs IF and IA vs IF, on the same graph. Use proper graph paper! 2) From the plot, take several sets of data EA,OC / IA,SC for IF between 0 and 2.4A and
calculate XS. For IF = 1.5A, show how you do that on the graph. 3) Plot XS vs IF. Indicate the regions where XS is unsaturated, and where it is saturated. 4) Calculate RA. The effective armature resistance RA is approximately 1.6 times the
measured dc value, taking into account effects of operating temperature and skin effects caused by ac currents
5) Draw the complete equivalent circuit diagram on per phase basis with all parameters shown on it for IF = 1.5A.
6) Draw the phasor diagram for the symmetric load to scale, on graph paper. Show ALL voltages and phase currents.
7) Repeat for the non-symmetric load. Keep the value of RA on your records for use in the following experiment. A copy of the plot EA vs IF may also come in handy. Conclusion Comment on your experiment.

ELECTRICAL MACHINES Experiment No. 4 - 2258 Synchronous Motor
31
SYNCHRONOUS MOTOR Objective To determine the relationships between field current, power factor and efficiency, power factor correction, and to draw a phasor diagram for a Synchronous Motor. Theory See reference text, chapter 6. The synchronous motor is physically the same as the synchronous generator, except the direction of the armature current IA is reversed (keep in mind that in a synchronous machine the armature current is applied to the stator and the field is applied to the rotor - opposite compared to dc machines). The 3-phase voltage applied to the stator produces a rotating electromagnetic field. The field produced by the rotor field current (dc) tries to line up with the rotating field and “chases” constantly after it. The angle between the internal induced voltage EA and the applied phase voltage Vϕ is called the torque angle. The larger this angle the larger the developed torque. The equivalent circuit is the same as that of the generator, but with the direction of current reversed (Fig. 5.1, equiv. cct per phase): Fig. 5.1 Equivalent circuit - synchronous motor For small field currents IF, the power factor angle θ is lagging - the motor is under-excited. For high field currents θ is leading - the motor is said to be over-excited (Fig. 5.2 and 5.3).

ELECTRICAL MACHINES Experiment No. 4 - 2258 Synchronous Motor
32
Fig. 5.2 Vector diagram - leading θ Fig. 5.3 Vector diagram - lagging θ Refer to your text, chapter 9, with regard to the behaviour of the motor to changes in load, the variation of field current and about the use of power factor correction. From the equivalent circuit we have:
r r r rV E R I jX IA A A S Aϕ = + + (Eq. 5.1)
In our experiment the stator will be connected in ∆ - configuration. Thus the terminal voltage is given by V V VT ph= =ϕ (Eq. 5.2)
and I IA ph= (Eq. 5.3)
The speed of the motor is constant from No Load (no torque) to maximum load (max. torque), since it is locked to the frequency of the supplying power system. If the load and thus the torque becomes larger than the motor can supply the motor is said to surpass the “pull out torque” limit. Then the rotor looses the “catch-up game”, ie. looses synchronization with the stator field, which results in rapidly changing directions of the torque within the motor. The consequence are heavy vibrations of the motor possibly leading to damage. Power and efficiency The following relationships are in order: P P I Vapplied IN ph ph= = 3 cosθ active power (Eq. 5.4)
= 3Wph Wph = wattmeter reading
FdTmot = T = torque of brake [Nm] (Eq. 5.5) F = force applied to prony brake [N] d = length of lever (see Appendix C)

ELECTRICAL MACHINES Experiment No. 4 - 2258 Synchronous Motor
33
ωmotOUTmot TPP == (Eq. 5.6)
Q I Vph ph= sinθ [VAr] (Eq. 5.7)
θsin2Sph XI=
where Q is the reactive power. Since RA << XS, eq. 5.1 may be written as
r r rE V I jXA T A S= − (Eq. 5.8)
and the vector IA RA may then be omitted from the phasor diagram. XS may be taken from the previous experiment (#4, synchronous generator). Start-Up When power is applied to the synchronous motor, the rotating field (60Hz) is much too fast for the rotor to follow immediately (text, chapter 9.3). Of the three methods described in the text of how to overcome this problem and to start the motor described in the text we use the third method. Experiment 1 Wound rotor motor 1 A-meter 2.5ADC 1 Prony brake 1 V-meter 250VAC 1 Variac 1 AVO meter 1 Bridge rectifier box 1 Wattmeter, analog 1 Tachometer For our experiment the rotor will be connected in Y-configuration while the stator will be connected in the ∆ -configuration (Fig. 5.4): Fig. 5.4 Stator circuit diagram

ELECTRICAL MACHINES Experiment No. 4 - 2258 Synchronous Motor
34
The corresponding experimental set-up is shown in Fig. 5.5. In this experiment we use a 4-pole Wound Rotor motor. That is a machine where the rotor windings are connected mirror-like to the stator windings, but are accessible to external connections through slip rings.
Fig. 5.5 Connection diagram - 3-φ wound rotor motor used as a synchronous motor The Prony Brake represents the load to the motor. With the help of the friction belt the torque to be supplied by the motor can be varied. The force exerted can be read off the spring scale. The field current IF can be varied between 0 and 2.5A by means of a variac.

ELECTRICAL MACHINES Experiment No. 4 - 2258 Synchronous Motor
35
Starting the Motor To bring the motor up to ~90% of the synchronous speed we start the machine as an induction machine. The initial starting current is much higher than the rated current and therefore certain precautions need to be observed. The Wattmeter and the A-meter need to be protected and with regard to the prony brake, make sure that the machine runs in the right direction. Before starting, do the following: • Short the current coil of the Watt-meter (terminals a and b, see Appendix A) • Short the terminals of the A-meter for Iph. • Loosen the belt of the prony brake so that the wheel can run freely without friction • Short the rotor coils (no dc current into the rotor) so that the machine acts as an
induction motor. • Turn the variac fully counter-clockwise (no voltage). Switch the 3-phase switch ‘ON’. The motor should now run. Observe the direction. It should be such that when the belt is tightened, i.e. friction is applied, the force will pull on the spring scale. If the motor runs in the wrong direction, switch the motor off, exchange two of the phases on the wall outlet and start again. It should be ok now. Measure the speed n with the tachometer. The shorts to the Wattmeter current coil and to the A-meter can now be removed. With it’s switch set ‘OFF’, adjust the variac to approximately 20V, using its potentiometer scale. Now pull the rotor shorting cable. Immediately set the switch of the variac to ‘ON’. Some field current IF will flow as indicated on the meter. The motor very quickly will now adjust itself to the speed of the rotating stator field. Measure the speed n again. It should be the synchronous speed. The field current can now be adjusted to the desired value. To Stop the Motor Set the Wattmeter to the "Short" position. Switch the field OFF first, then switch the (3-phase-) power OFF. Measurements
• Measure RA or use the value found in the previous experiment # 3 • With the prony brake still “loose”, i.e. no force exerted on the belt, vary IF from ~0.2 to
2.4A in steps of 0.2A. Should the motor get out of synch at the lower end, increase IF until synchronism is established again, and note IF – then start over at this IF-value. Measure Iph and Wph. The current Iph will decrease to a minimum, then increase again. Make sure to take a measurement of Iph and Wph at this minimum point! IPH has to be measured as precise as possible!
• Tighten the prony brake’s friction belt so that the scale indicates a force of 300g. Keep this force constant for the duration of the measurements!

ELECTRICAL MACHINES Experiment No. 4 - 2258 Synchronous Motor
36
Repeat the previous measurements for IF between ~0.6...2.4A in steps of 0.2A. Again, make sure to acquire a set of data at the minimum field current!
• Repeat the measurements applying a force of 600g, for a current range IF ~ 1.0...2.4A.
• Repeat the measurements applying a force of 900g, for a current range IF ~ 1.2...2.4A.
• A particular set of data will be assigned to the individual student or team by the lab technologist after completion of the experiment. This set of data is to be used to do question 4 of the analysis below.
Analysis 1) Shortly, in your own words, describe the starting procedure. 2) From the measurements, for each value of force applied to the prony brake, and for
each value of IF, calculate PIN, Pmot, cos θ and efficiency η. See Appendix C (page 44) for how to compute the torque applied to the prony brake. If the power factor turns out to be >1, due to measurement conditions and inaccuracies, normalize to 1.0 ! (normalizing means to set the highest value of the cosine to 1.0, and adjust ALL other cos values accordingly). [for sample calculations do not use No-load data!)
3) Plot the set of V-curves IA vs IF for FNo Load, F300g, F600g and F900g on one graph. On the plot, indicate the areas of lagging and leading power factor and the areas where Q is taken from the system (i.e. from the Hydro grid), and where Q is delivered to the system.
4) For ONE measurement (data set of F, IF, Iph, Vph and cos θ), calculate the corresponding vectors and angles and construct the correct vector diagram (as in Fig. 5.3 or 5.4, depending on conditions). XS can readily be calculated from the data above. If you kept a copy, it may also be taken from the EA vs IF graph of the previous experiment, but then show how you did this! Use graph paper for this drawing and draw exactly to scale!
Conclusion Comment on the experiment.

ELECTRICAL MACHINES Experiment No. 5 - 2258 Induction Motor
37
THREE PHASE INDUCTION MOTOR (Polyphase Induction Machine) Objective To find the equivalent circuit parameters and to study some of the characteristics of an Induction Motor. Theory See your reference text, chapter 7. Referring to chapter 2.5 (equiv. cct of a transformer), your class notes on transformers, and chapter 9 of your text (synchronous machines) may help to further your understanding of the induction motor principles. The voltage applied to the terminals of the motor, i.e., the stator, induces voltages and currents in the rotor and thus acts as a transformer with the secondary allowed to rotate. There is, however, a difference: In a transformer the frequency of the voltage induced in the secondary winding is the same as the frequency of the voltage applied to the primary winding. For the induction motor, the frequency is dependent on the slip s. If the induction motor’s rotor is locked so that it can’t rotate then the rotor has the same frequency a the stator. If the rotor turns with the same speed as the field in the stator, the frequency on the rotor is zero. This speed is called synchronous speed. For any speed between these two extremes, the frequency of the rotor will be proportional to the stator frequency by a factor s:
f s fR S= (Eq. 3.1)
The rotor tries to “keep up” with the rotating stator field, and the difference between the rotating field and the rotor speed is known as the ‘slip’ and can be expressed as
s
n n
nsync m
sync
=−
× 100 [%] (Eq. 3.2)
where nsync = synchronous speed nm = mechanical speed of rotor s = slip in % The synchronous speed is given by
nf
PsyncSt=
120 (rpm.) (Eq. 3.3)
where fSt = frequency of the stator’s rotating electromagnetic field P = number of poles in the machine (used in the lab: 4-pole machine)

ELECTRICAL MACHINES Experiment No. 5 - 2258 Induction Motor
38
The output or developed torque (shaft torque) is given by:
T
POUT
m
=ω
(Nm) (Eq. 3.4)
where POUT = output power (nameplate power would yield max torque) ωm = angular velocity (= mechanical speed of rotor) in rad/s The induction motor can be represented by the equivalent circuit shown in Fig. 3.1 :
Fig. 3.1 The equivalent cct of a 3-Φ induction motor on per phase basis Description of circuit parameters:
R1 stator resistance jX1 stator reactance R2 rotor resistance jX2 rotor reactance RC core losses jXm magnetizing reactance
To find the parameters of the equivalent circuit, three tests need to be performed: a) the “dc Test” b) the “Locked Rotor Test” (see Fig. 3.2) c) the “No Load Test” (see Fig. 3.3) DC Test The parameter R2 (the rotor resistance), can be found by performing the “Locked Rotor Test”. This test, however, yields the total resistance R1 + R2. To find the value of R2, the value of R1 has to be known. The stator resistance R1 can easily be found using a simple dc test. A test circuit is shown in Appendix B of this manual. The voltage VDC is applied to the stator terminals and the variac adjusted to give a current IDC equal to the rated value. The resistance R1 can be found using equation (3.5):
RVIDC
DC1 2
= (Eq. 3.5)

ELECTRICAL MACHINES Experiment No. 5 - 2258 Induction Motor
39
Locked Rotor Test This test gives the parameters R2 and X2.
Fig. 3.2 Equivalent circuit − Locked Rotor Test In comparison to the short circuit test on a transformer, the rotor is locked (i.e. prevented to rotate!). A small voltage is applied to the terminals and is slowly increased until the current reaches its rated value. When the current reaches the rated value measure the current, voltage and the power. At standstill, the slip s = 1 and the motor resistance R2 /2 = R2. Compared to RC and Xm (Figure 3.1), R2 and X2 are small and therefore all the current assured to flow through R2 and X2. Thus
( ) ( )Z R jX R R j X XLK LK LK= + = + + +1 2 1 2 (Eq. 3.6)
( )R R R
P
ILK
LK
LK
= + =1 2 23 (Eq. 3.7)
( )jX j X XLK = +1 2 (Eq. 3.8)
X Z RLK LK LK= −2 2 (Eq. 3.9)
Z
VILK
LK
LK
=3
(Eq. 3.10)
where PLK = the Wattmeter readings R1 = Stator resistance obtained from the d.c. test When XLK is known, X1 and X2 still can’t be seperated easily. Using the IEEE Test Code for dividing motor and stator circuit resistance (based on practical experience), X1 and X2 can then be found. The following table is taken from the text :
X1 and X2 as functions of XLK
Rotor design X1 X2
Wound rotor Design A Design B Design C Design D
0.5 XLK 0.5 XLK 0.4 XLK 0.3 XLK 0.5 XLK
0.5 XLK
0.5 XLK 0.6 XLK 0.7 XLK 0.5 XLK

ELECTRICAL MACHINES Experiment No. 5 - 2258 Induction Motor
40
The design type of the motor is indicated on the nameplate as “DSGN B”. No Load Test Yields the parameters RC and Xm. Consider the circuit shown in Fig. 3.3 : Fig. 3.3 Equivalent circuit − No Load Test Under no load the motor losses are mechanical losses and s = 0. The measured input power thus represents the losses in the motor. Since a wattmeter measures and shows the average power, the power factor cos θ can be found from:
cosθ =PV I
NL
NL NL3 (Eq. 3.11)
where PNL = Wattmeter reading VNL = V-meter reading INL = A-meter reading The components of INL are: I IX NLm
= sinθ
I IRC NL= cosθ Then
XV
Im
NL
X m
=3
(Eq. 3.12)
R
VIC
NL
RC
=3
(Eq. 3.13)

ELECTRICAL MACHINES Experiment No. 5 - 2258 Induction Motor
41
Load Test To find the torque/speed characteristics a load is attached to the motor. In our experiment the load is simulated using a dc generator and a set of rheostats. Measuring ILine, VLine and power at varying load provides information about the reaction of torque and speed to changes of load. Power flow diagram: PCONV = ΤIND ωm
PIN POUT
= 3 VPH IA cosθ = ΤLOAD ωm = π3 VL IL cos θ core mech. stray losses losses losses IA = IPH = IPHASE Stator 14444444443 (PIN = Pair gap) copper lumped together RS = RSTATOR losses = PROT = 1.25 RA PSCL=3 IA2 RS = 1.25 R1 Experiment 1 (2 if available) Power Meters, Fluke 1 Variac 1 (2 if available) Current clamps, Fluke 1 rectifier bridge 1 Tachometer 3 Rheostats (180, 45, 22 Ohm) 1 V-meter ∠50V (locked rotor test) 1 wrench (locked rotor test) Nameplate data Record the nameplate data of the ac machine, including the design class. The motor used is a 3-phase motor, with 4 poles. Also note the nameplate data of the dc machine. DC-test The circuit for this test is shown in Appendix B. Apply a small dc voltage to two of the three input terminals of the induction motor. Slowly increase the voltage VDC until the current IDC reaches its rated value (or as high as the variac allows it to go). Measure VDC, and calculate R1 (note : this motor’s stator is Y-connected!). Alternatively, the resistance can be measured with a DMM. How to use the Wattmeter

ELECTRICAL MACHINES Experiment No. 5 - 2258 Induction Motor
42
To recapitulate the connections to a standard analog wattmeter and to avoid damage to the instrument and the circuit, see Appendix A. Don’t apply any power until the lab technologist checks the circuit! When doing any changes on the AC side, switch the 3-phase switch at the acrylic panel OFF, or on the AC drive push the Stop button and switch the power off: When the AC drive power is switched on, 208V appear at the terminals at all times, whether the motor is rotating or not. Be extremely careful! The method used here to measure the supplied input power is the so-called ‘Two Wattmeter Method’ as shown in Fig. 3.4. The measured power is the algebraic sum of the two wattmeter readings. A problem is that, depending on the power factor, one of the meters could read negative. When using the digital Fluke power meters, the display simply shows a negative number. But when using the traditional analog meters, the needle goes the wrong way and the voltage connection needs to be reversed. Most of the time it is quite obvious whether the readings are to be added or subtracted. But sometimes it may not be, and then to determine whether the total power is the sum or the difference of the two readings, use the following method:
Make sure that initially both meters have an upscale deflection. If a meter deflects down, reverse the potential (voltage) connections (terminals c and d in Appendix A). To test whether one meter should show negative, remove the lead of the potential coil of the lower-reading wattmeter from the common line that has no current coil, and touch the lead to the line that has the current coil of the higher-reading wattmeter. If the pointer of the lower-reading meter deflects upward, add the two wattmeter readings; if the pointer deflects in the downward, subtract the lower reading from the higher reading wattmeter.
Fig. 3.4 Connection diagram The wattmeter measurement gives the real power while the measurement of ILine and VLine gives the apparent power. When using the yellow Fluke power meter(s), switch it ON (green button) and - press the V/A/W button for A, and with the probe switched on and set to 10mV/A but not yet connected, adjust the pot on the probe for min reading (< 0.15A will do)
ELECTRICAL MACHINES Experiment No. 5 - 2258 Induction Motor
43
- press the V/A/W button for W - at the 10mV/A setting of the probe all readings on the wattmeter are to be divided by 10 !! (for example, a display of 0.35kW means a measurement of 35W) If only one W-meter is available, always measure the two phases and add them up! Locked Rotor Test Connect the circuit as shown in Fig. 3.4., leaving the d.c. machine disconnected. For this test only, use the extra voltmeter (range < 50V) to measure the line voltage for increased accuracy, not the installed panel meter. Use the lever/wrench (!) to prevent the induction motor from rotating. On the drive unit, turn the speed control potentiometer fully counterclockwise (0 speed). Switch ‘Power ON’ and set the Start/Stop switch to ‘START’. Turn the potentiometer slowly up until the line current ILine (= ILK) is close to the rated value. Read the line voltage VLine (= VLK) and the power indicated by the power meters (= PLK). Switch the power off and remove the extra (low range) voltmeter. No Load Test Use the same connection as in the previous test, again with the dc machine NOT connected. Start the machine again and bring it up to the rated speed. Measure the line voltage VLine (= VNL), the line current ILine (=INL) and the power (= PNL). Load Test
Set the mode switch at the back panel to ‘Gen’. With the a.c. circuit connected as before, connect the d.c. machine as shown in Fig. 3.4. Set the ac motor to the rated speed (n = 1725 rpm). As seen from the diagram the d.c. generator is separately excited. Adjust the field voltage to VF = 100V. For the load RL, use rheostats as necessary (180Ω, 44Ω and 22Ω). For each rheostat observe the maximum current ratings! Vary the dc load current IL from minimum (max resistance ≈ open circuit) to a maximum of 4.5A in increments of 0.5A and measure VL, IF, IPHASE, VLINE, PIN (wattmeters), and n. Proceed as follows: Connect the 180Ω-rheostat and set it to maximum resistance (make sure about this). With VF at 0 VDC, start the machine. Then apply VF slowly until it reaches 100V. Now adjust the rheostat so that IL = 0.5A, 1A etc. When a change of rheostat is necessary (because the current rating is surpassed), de-load the generator by turning the field voltage to Zero, then push the Start/Stop switch (or button) to ‘STOP’. Change the rheostat, and with VF = 0 VDC as above, re-start the motor toggling the switch to ‘START’. The motor then will accelerate until it reaches its previous speed. Now smoothly increase the field voltage again until its previous value (VF = 100V) and continue with the measurements. Analysis

ELECTRICAL MACHINES Experiment No. 5 - 2258 Induction Motor
44
1. Using the measurements from the dc test, find R1. 2. From the data of the Locked Rotor Test, calculate R2 and X2. 3. From the data of the No Load Test, calculate RC and Xm. 4. Draw the complete equivalent circuit with the calculated parameters marked on it. 5. From the data of the Load Test, calculate and tabulate PIN, POUT, T, s, P.F., and
efficiency η for each value of load current IL. (For the rotational losses assume 76.1 W, measured in a separate experiment).
6. POUT is the power at the shaft of the induction motor. For IL = 4 A only, compute the losses entailed in the dc machine (as you did in the DC Generator experiment; for the rotational losses in the dc machine assume 24.6 W, measured in a separate experiment).). Then: PDC Generator = POUT Ind.mach. - lossesDC mach. Compare the result with the measured generator output PDC Generator = VT IL.
7. Plot T vs speed n Questions a) DC test: Why is the value of R1 only half the value of the measured resistance? b) What is theoretically the maximum speed of the motor? Can that speed achieved?
What determines the limit? Conclusion Comment on the experiment.
ELECTRICAL MACHINES Appendices
45
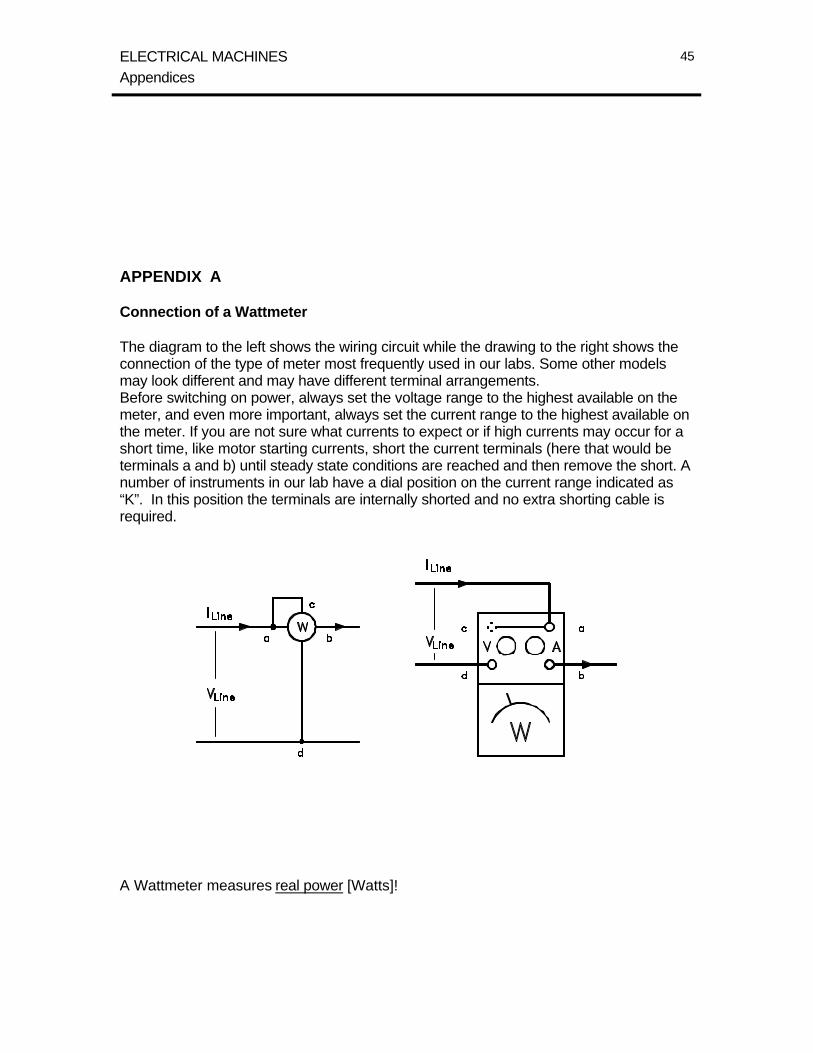
APPENDIX A Connection of a Wattmeter The diagram to the left shows the wiring circuit while the drawing to the right shows the connection of the type of meter most frequently used in our labs. Some other models may look different and may have different terminal arrangements. Before switching on power, always set the voltage range to the highest available on the meter, and even more important, always set the current range to the highest available on the meter. If you are not sure what currents to expect or if high currents may occur for a short time, like motor starting currents, short the current terminals (here that would be terminals a and b) until steady state conditions are reached and then remove the short. A number of instruments in our lab have a dial position on the current range indicated as “K”. In this position the terminals are internally shorted and no extra shorting cable is required.
A Wattmeter measures real power [Watts]!

ELECTRICAL MACHINES Appendices
46
APPENDIX B Measurement of Armature Resistance RA and Field Resistance RF This describes the method known as the Volt-/Ammeter Method. A variac and a bridge rectifier allow to apply a variable dc voltage to the winding in question. Measure the voltage and the dc current and then calculate the resistance using Ohm’s Law. Armature: Since the resistance of the armature winding is very low, initially apply only a very small voltage of 1...2Vdc to the coil. Then increase the voltage slowly until the dc current reaches its rated value. Calculate RA. Turn the shaft: The resistance may change somewhat depending on the position of the brushes. If it does, take the average value. Field: To measure the field resistance apply the rated voltage (for example 100V), measure the current (which should then be approximately 10% of the rated current) and then calculate RF.

ELECTRICAL MACHINES Appendices
47
APPENDIX C Prony Brake
In your calculations, make sure that the correct dimensions and conversion factors are adopted : T torque [Nm] r radius [m] 1 inch = 0.0254 m d length of lever arm [m] F, ‘F’ force [N] and in [kgF] 1 N = 1 kgm/s2 = 0.102 kgF P power [W] 1W = 0.102 kgF m/s