Embed Size (px)
Citation preview
4825 Mark Center Drive • Alexandria, Virginia 22311-1850
CAB D0015714.A2/FinalApril 2007
Manpower Performance Indicators: Final Report
Cathleen M. McHugh •Aline O. Quester Theresa H. Kimble
CNA’s annotated briefings are either condensed presentations of the results of formal CNA studies that have been further documented elsewhere or stand-alone presentations of research reviewed and endorsed by CNA. These briefings repre-sent the best opinion of CNA at the time of issue. They do not necessarily represent the opinion of the Department of the Navy.
Approved for Public Release; Distribution Unlimited. Specific authority: N00014-05-D-0500. For copies of this document call: CNA Document Control and Distribution Section (703)824-2123.
Copyright © 2007 The CNA Corporation
Approved for distribution: April 2007
Aline O. Quester, DirectorMarine Corps ManpowerResource Analysis Division
1
Manpower Performance Indicators: Final Report
The mission of the Deputy Commandant for Manpower and Reserve Affairs (M&RA) is to provide the appropriate number of adequately trained, sufficiently experienced, qualified Marines to unit commanders so that they can accomplish their assigned missions. Because the Marine Corps devotes about 65 percent of its budget to personnel costs, any improvement in the manpower process provides the opportunity to realize significant monetary savings while improving unit manning and readiness. Accurate and meaningful measures of effectiveness are needed to ensure the efficient and effective running of the manpower process and to identify possible problems. Thus, manpower performance indicators (MPIs) have been developed to measure performance to provide decision-makers with up-to-date information.
Using MPIs, the management information division of M&RA has built a website that is very well used (www.manpower.usmc.mil/mpi). The Deputy Commandant, M&RA, asked CNA to help develop additional performance indicators. This annotated briefing reports on that work.

2
Outline
• Measures of stress on the force• Time to train• Marine Corps civilians• Using Marine Corps MPIs to create
unit profiles• Forecasting the Marine Corps’
aviator inventory
In this final report, we’ll discuss the first three sets of indicators described on the slide. The final two topics on the slide have been discussed in previous papers.1
We’ll start with MPIs to measure stress on the force, then turn to MPIs for entry-level training, and finish with MPIs for civilian Marines.
____________1 Using Marine Corps Manpower Performance Indicators To Create Unit Profiles, by Michael J. Moskowitz, Michael C. Markowitz, and Aline O. Quester (CNA Annotated Briefing D0015073/November 2006), and Forecasting the Marine Corps’ Aviator Inventory, by Michael J. Moskowitz with Theresa H. Kimble and Robert W. Shuford (CNA Information Memorandum D0014629/August 2006).
3
Stress-on-the-Force Metrics
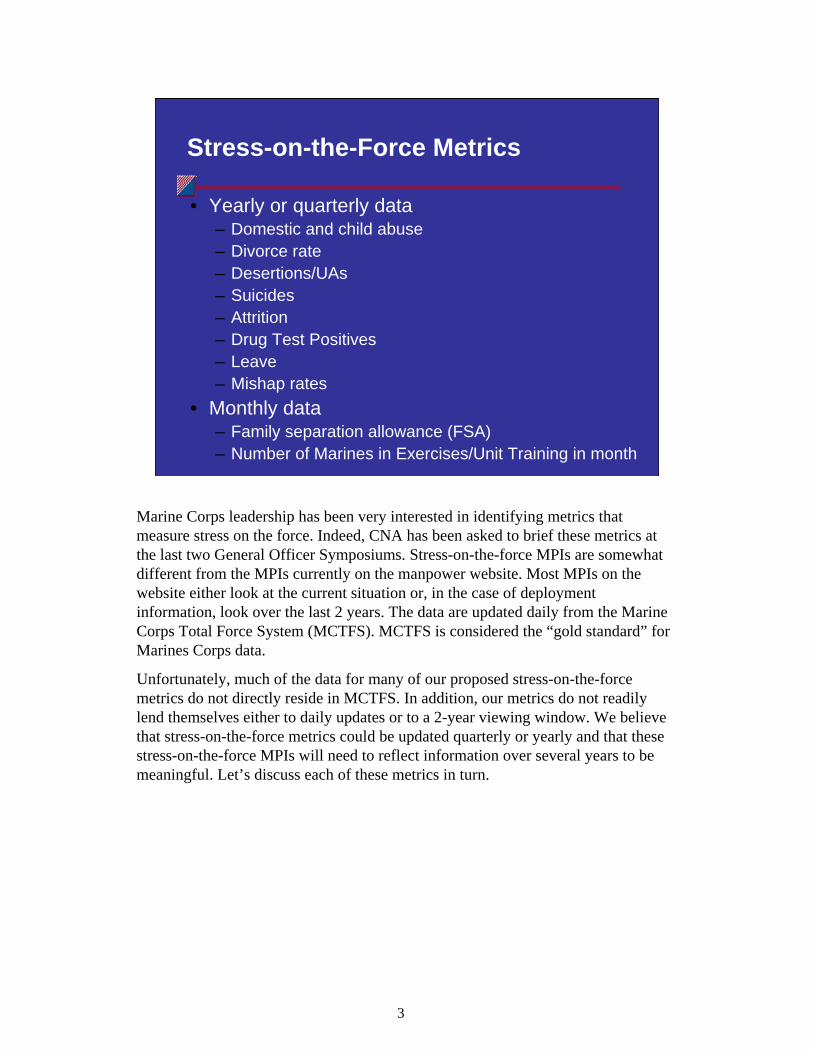
• Yearly or quarterly data– Domestic and child abuse– Divorce rate – Desertions/UAs– Suicides– Attrition– Drug Test Positives– Leave– Mishap rates
• Monthly data– Family separation allowance (FSA)– Number of Marines in Exercises/Unit Training in month
Marine Corps leadership has been very interested in identifying metrics that measure stress on the force. Indeed, CNA has been asked to brief these metrics at the last two General Officer Symposiums. Stress-on-the-force MPIs are somewhat different from the MPIs currently on the manpower website. Most MPIs on the website either look at the current situation or, in the case of deployment information, look over the last 2 years. The data are updated daily from the Marine Corps Total Force System (MCTFS). MCTFS is considered the “gold standard” for Marines Corps data.
Unfortunately, much of the data for many of our proposed stress-on-the-force metrics do not directly reside in MCTFS. In addition, our metrics do not readily lend themselves either to daily updates or to a 2-year viewing window. We believe that stress-on-the-force metrics could be updated quarterly or yearly and that these stress-on-the-force MPIs will need to reflect information over several years to be meaningful. Let’s discuss each of these metrics in turn.
4
0
500
1,000
1,500
2,000
FY01 FY02 FY03 FY04 FY05 FY06
Domestic Abuse Child Abuse
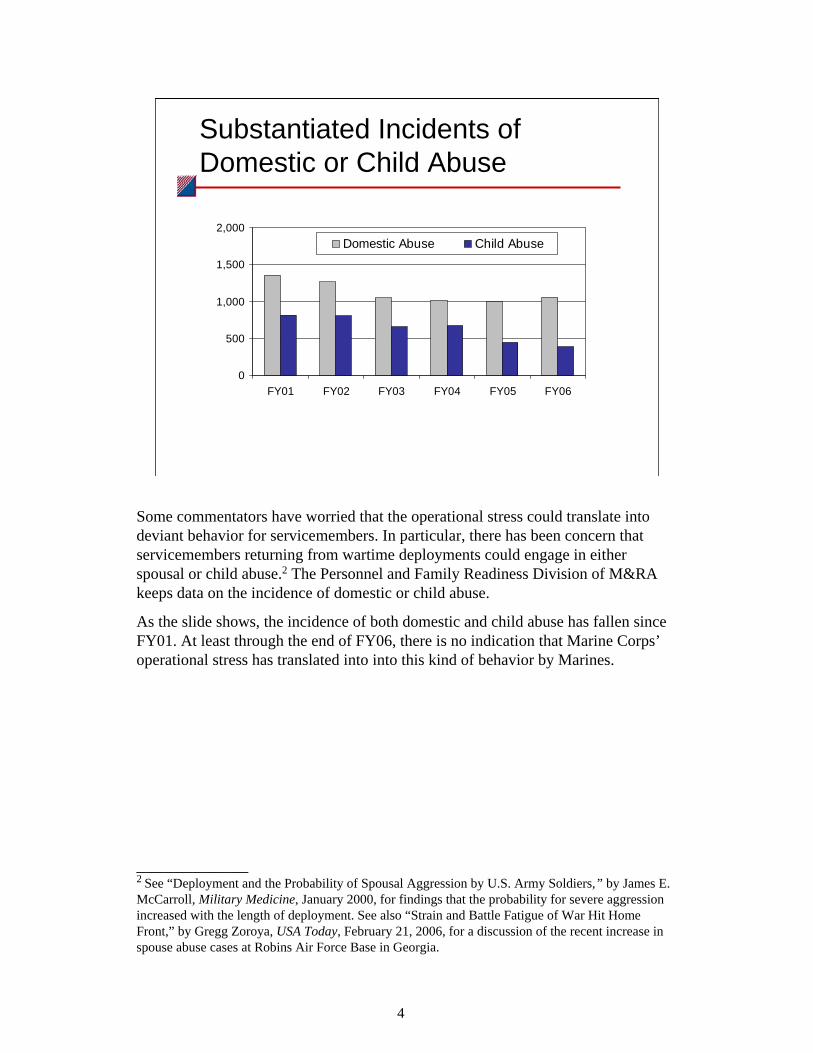
Substantiated Incidents of Domestic or Child Abuse
Some commentators have worried that the operational stress could translate into deviant behavior for servicemembers. In particular, there has been concern that servicemembers returning from wartime deployments could engage in either spousal or child abuse.2 The Personnel and Family Readiness Division of M&RA keeps data on the incidence of domestic or child abuse.
As the slide shows, the incidence of both domestic and child abuse has fallen since FY01. At least through the end of FY06, there is no indication that Marine Corps’ operational stress has translated into into this kind of behavior by Marines.
____________2 See “Deployment and the Probability of Spousal Aggression by U.S. Army Soldiers,” by James E. McCarroll, Military Medicine, January 2000, for findings that the probability for severe aggression increased with the length of deployment. See also “Strain and Battle Fatigue of War Hit Home Front,” by Gregg Zoroya, USA Today, February 21, 2006, for a discussion of the recent increase in spouse abuse cases at Robins Air Force Base in Georgia.
5
0
1
2
3
4
5
FY98 FY99 FY00 FY01 FY02 FY03 FY04 FY05 FY06
Per
cent
age
Enlisted Officer
Divorce Rates
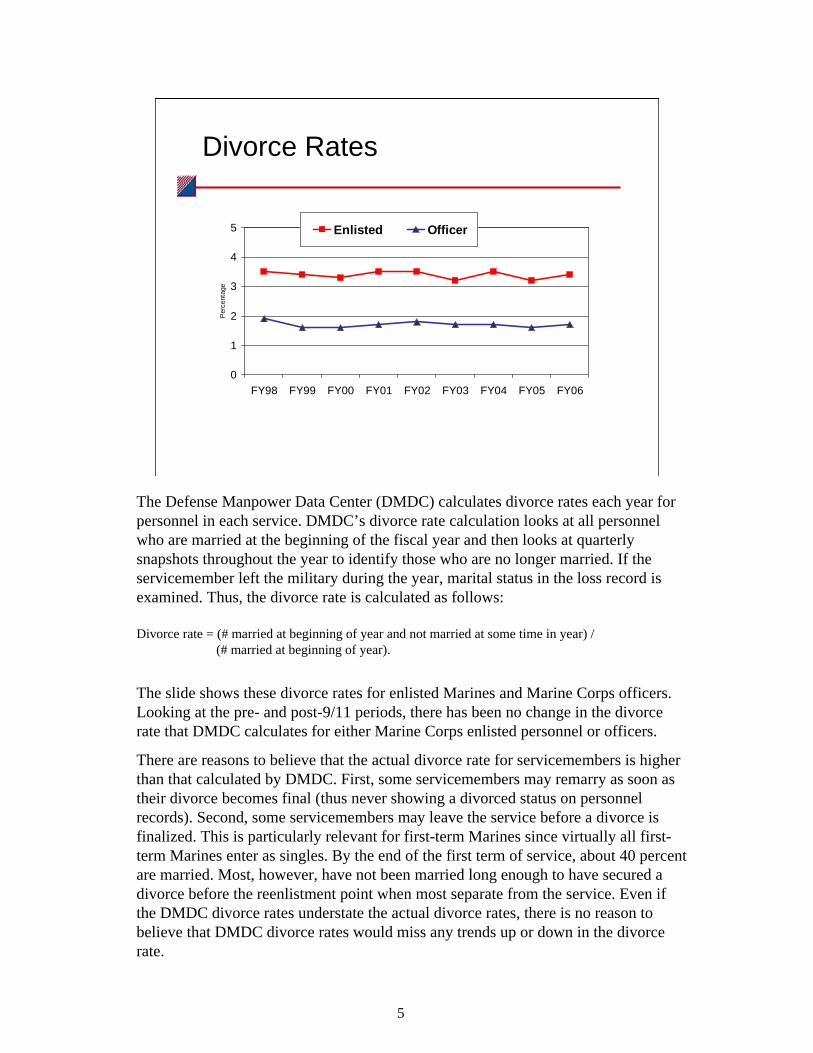
The Defense Manpower Data Center (DMDC) calculates divorce rates each year for personnel in each service. DMDC’s divorce rate calculation looks at all personnel who are married at the beginning of the fiscal year and then looks at quarterly snapshots throughout the year to identify those who are no longer married. If the servicemember left the military during the year, marital status in the loss record is examined. Thus, the divorce rate is calculated as follows:
Divorce rate = (# married at beginning of year and not married at some time in year) / (# married at beginning of year).
The slide shows these divorce rates for enlisted Marines and Marine Corps officers. Looking at the pre- and post-9/11 periods, there has been no change in the divorce rate that DMDC calculates for either Marine Corps enlisted personnel or officers.
There are reasons to believe that the actual divorce rate for servicemembers is higher than that calculated by DMDC. First, some servicemembers may remarry as soon as their divorce becomes final (thus never showing a divorced status on personnel records). Second, some servicemembers may leave the service before a divorce is finalized. This is particularly relevant for first-term Marines since virtually all first-term Marines enter as singles. By the end of the first term of service, about 40 percent are married. Most, however, have not been married long enough to have secured a divorce before the reenlistment point when most separate from the service. Even if the DMDC divorce rates understate the actual divorce rates, there is no reason to believe that DMDC divorce rates would miss any trends up or down in the divorce rate.
6
0
2
4
6
8
10
FY93FY94
FY95FY96
FY97FY98
FY99FY00
FY01FY02
FY03FY04
FY05FY06
Per
cent
age
Female Male
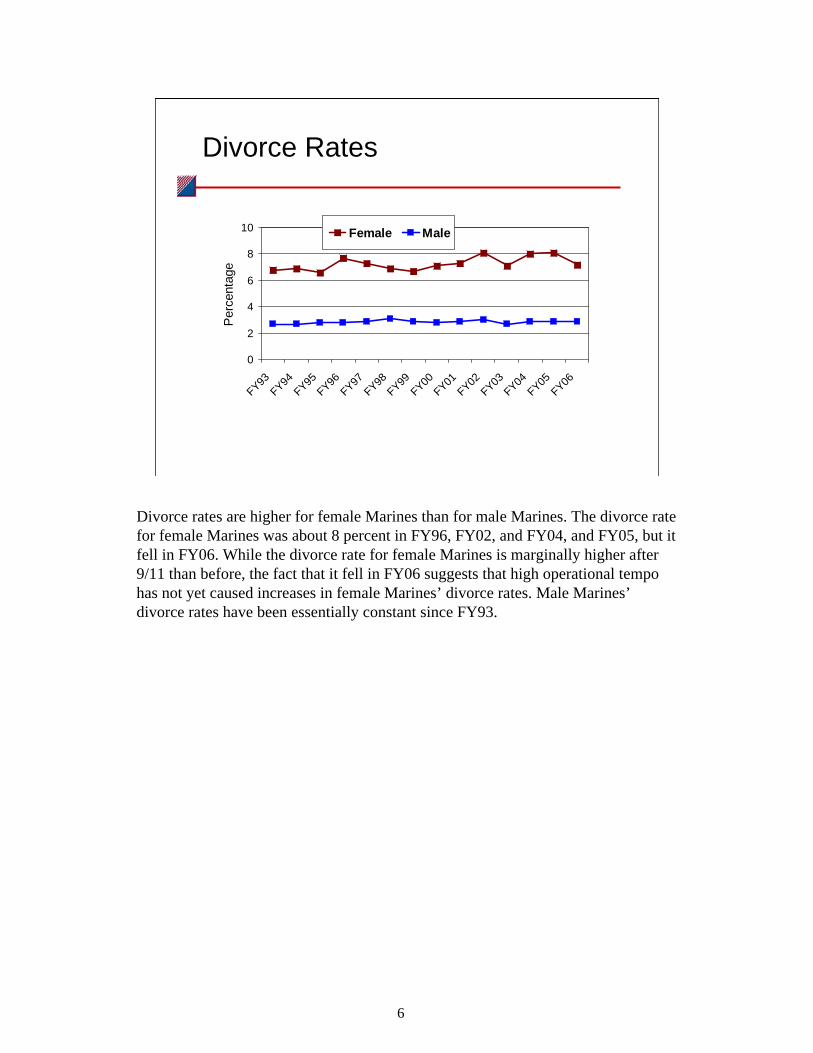
Divorce Rates
Divorce rates are higher for female Marines than for male Marines. The divorce rate for female Marines was about 8 percent in FY96, FY02, and FY04, and FY05, but it fell in FY06. While the divorce rate for female Marines is marginally higher after 9/11 than before, the fact that it fell in FY06 suggests that high operational tempo has not yet caused increases in female Marines’ divorce rates. Male Marines’ divorce rates have been essentially constant since FY93.
7
0
500
1,000
1,500
FY00 FY01 FY02 FY03 FY04 FY05 FY06*
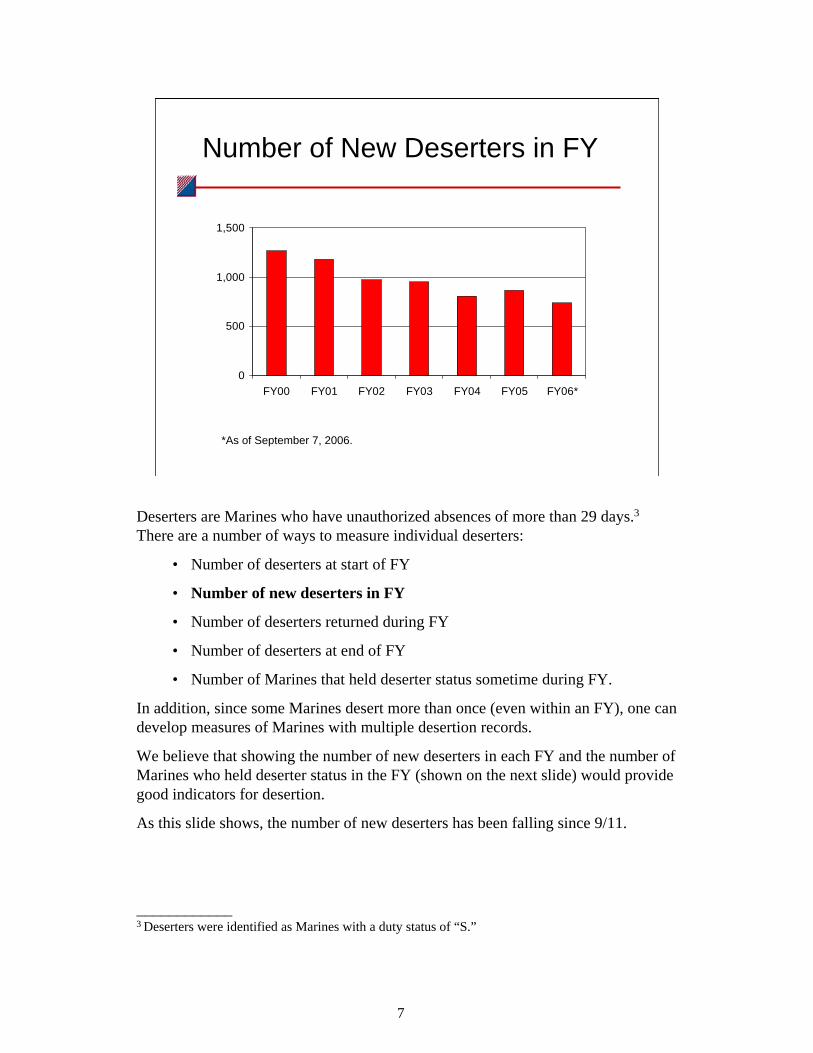
Number of New Deserters in FY
*As of September 7, 2006.
Deserters are Marines who have unauthorized absences of more than 29 days.3There are a number of ways to measure individual deserters:
• Number of deserters at start of FY
• Number of new deserters in FY
• Number of deserters returned during FY
• Number of deserters at end of FY
• Number of Marines that held deserter status sometime during FY.
In addition, since some Marines desert more than once (even within an FY), one can develop measures of Marines with multiple desertion records.
We believe that showing the number of new deserters in each FY and the number of Marines who held deserter status in the FY (shown on the next slide) would provide good indicators for desertion.
As this slide shows, the number of new deserters has been falling since 9/11.
____________3 Deserters were identified as Marines with a duty status of “S.”
8
0
500
1,000
1,500
2,000
2,500
3,000
FY00 FY01 FY02 FY03 FY04 FY05 FY06*
Carried from previous year New deserters
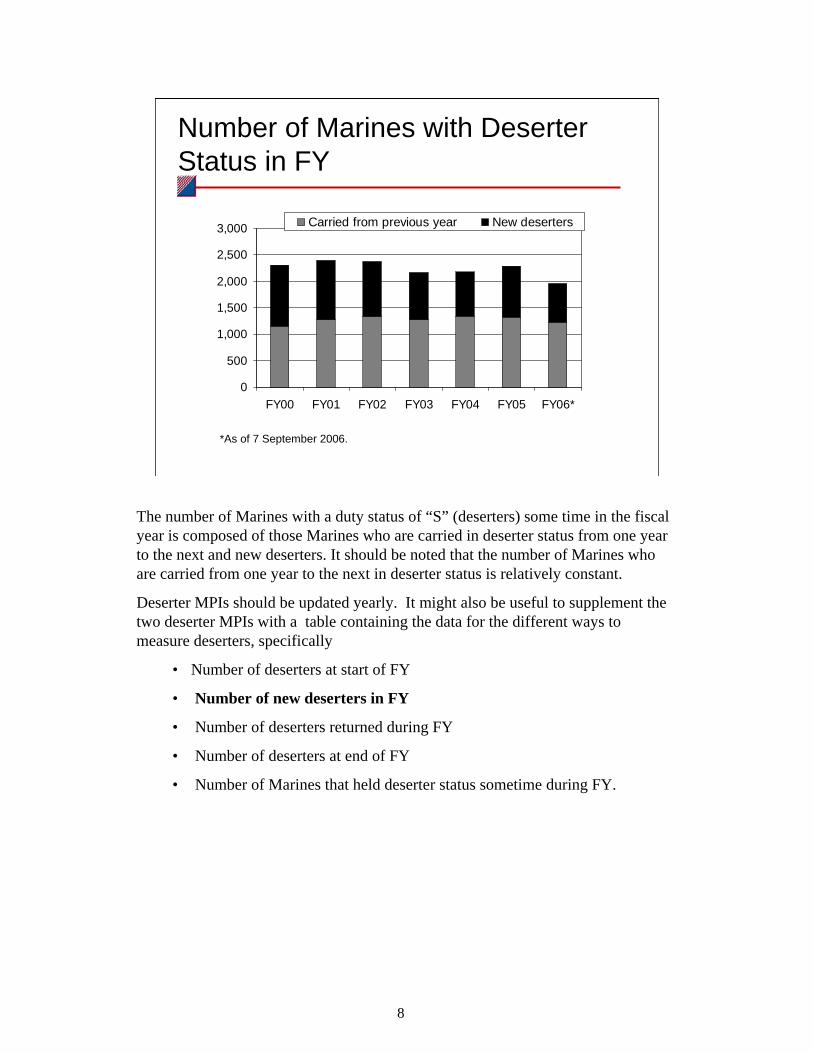
Number of Marines with Deserter Status in FY
*As of 7 September 2006.
The number of Marines with a duty status of “S” (deserters) some time in the fiscal year is composed of those Marines who are carried in deserter status from one year to the next and new deserters. It should be noted that the number of Marines who are carried from one year to the next in deserter status is relatively constant.
Deserter MPIs should be updated yearly. It might also be useful to supplement the two deserter MPIs with a table containing the data for the different ways to measure deserters, specifically
• Number of deserters at start of FY
• Number of new deserters in FY
• Number of deserters returned during FY
• Number of deserters at end of FY
• Number of Marines that held deserter status sometime during FY.
9
0
10
20
30
CY01 CY02 CY03 CY04 CY05 CY06
Rat
e pe
r 10
0,00
0 M
arin
es
Preliminary
Suicide Rate
National average
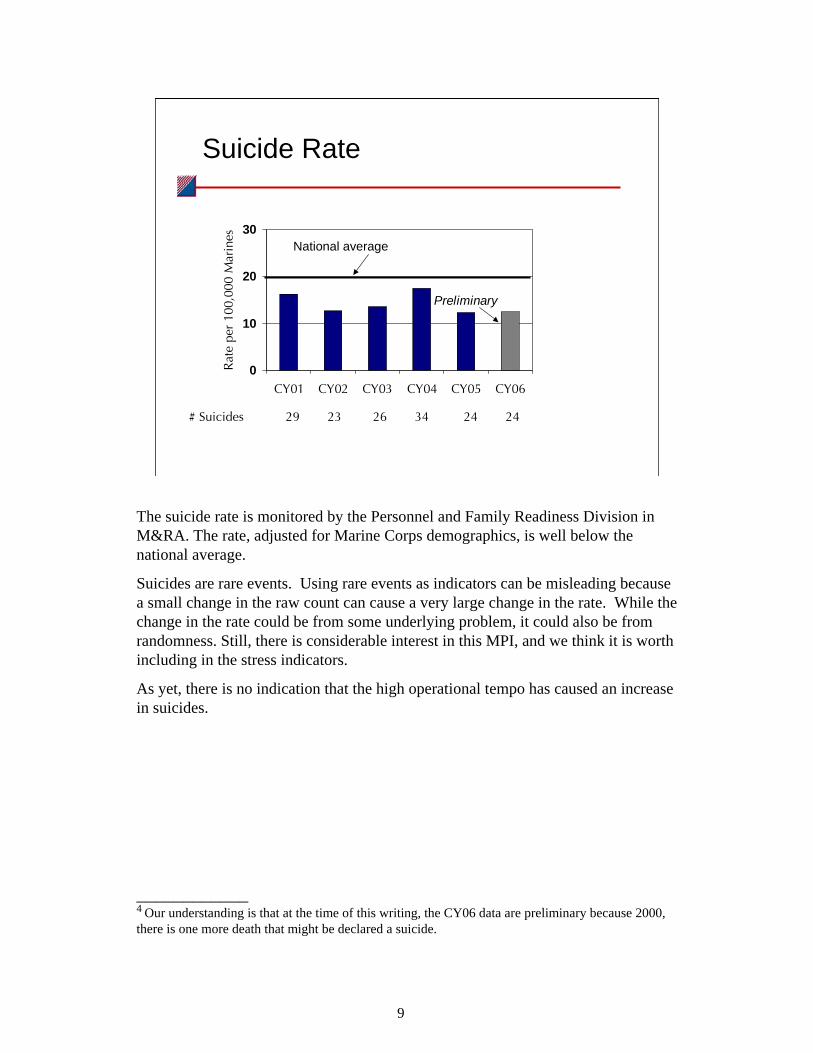
# Suicides 29 23 26 34 24 24
The suicide rate is monitored by the Personnel and Family Readiness Division in M&RA. The rate, adjusted for Marine Corps demographics, is well below the national average.
Suicides are rare events. Using rare events as indicators can be misleading because a small change in the raw count can cause a very large change in the rate. While the change in the rate could be from some underlying problem, it could also be from randomness. Still, there is considerable interest in this MPI, and we think it is worth including in the stress indicators.
As yet, there is no indication that the high operational tempo has caused an increase in suicides.
____________4 Our understanding is that at the time of this writing, the CY06 data are preliminary because 2000, there is one more death that might be declared a suicide.
10
0
10
20
30
40
FY90 FY91 FY92 FY93 FY94 FY95 FY96 FY97 FY98 FY99 FY00 FY01
Per
cent
age
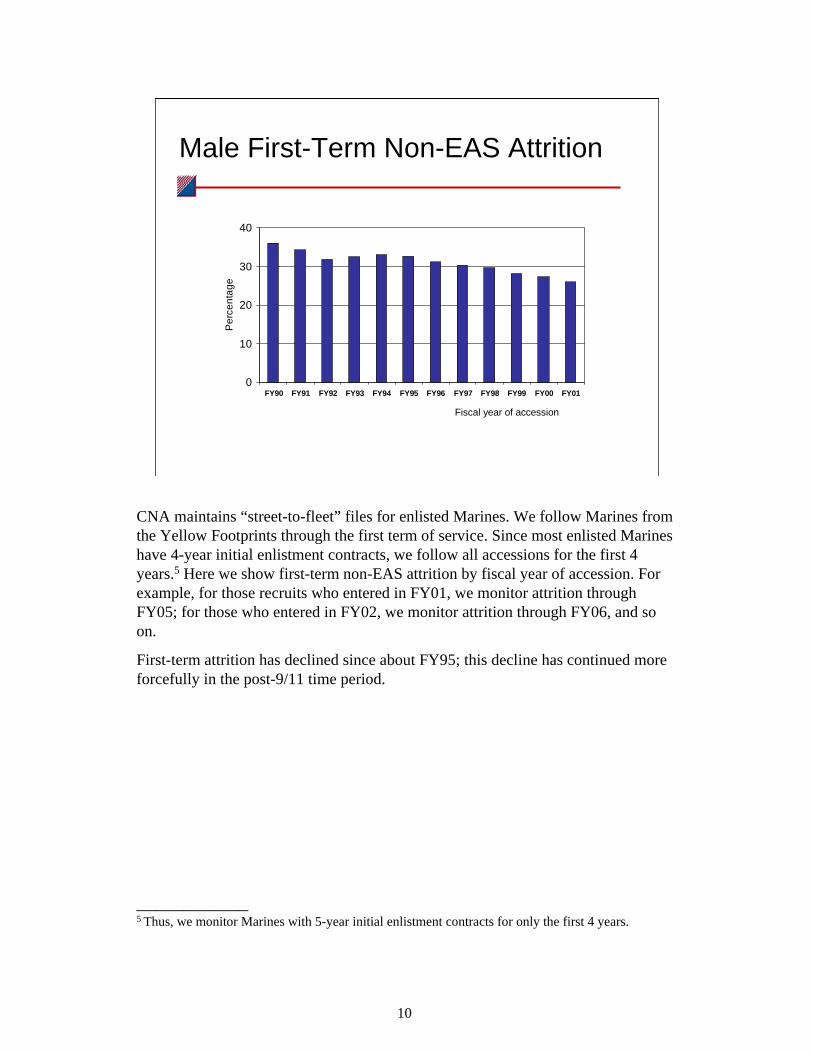
Male First-Term Non-EAS Attrition
Fiscal year of accession
CNA maintains “street-to-fleet” files for enlisted Marines. We follow Marines from the Yellow Footprints through the first term of service. Since most enlisted Marines have 4-year initial enlistment contracts, we follow all accessions for the first 4 years.5 Here we show first-term non-EAS attrition by fiscal year of accession. For example, for those recruits who entered in FY01, we monitor attrition through FY05; for those who entered in FY02, we monitor attrition through FY06, and so on.
First-term attrition has declined since about FY95; this decline has continued more forcefully in the post-9/11 time period.
____________5 Thus, we monitor Marines with 5-year initial enlistment contracts for only the first 4 years.
11
0
2
4
6
8
10
FY01 FY02 FY03 FY04 FY05 FY06
Num
ber p
er 1
,000
Tes
ts
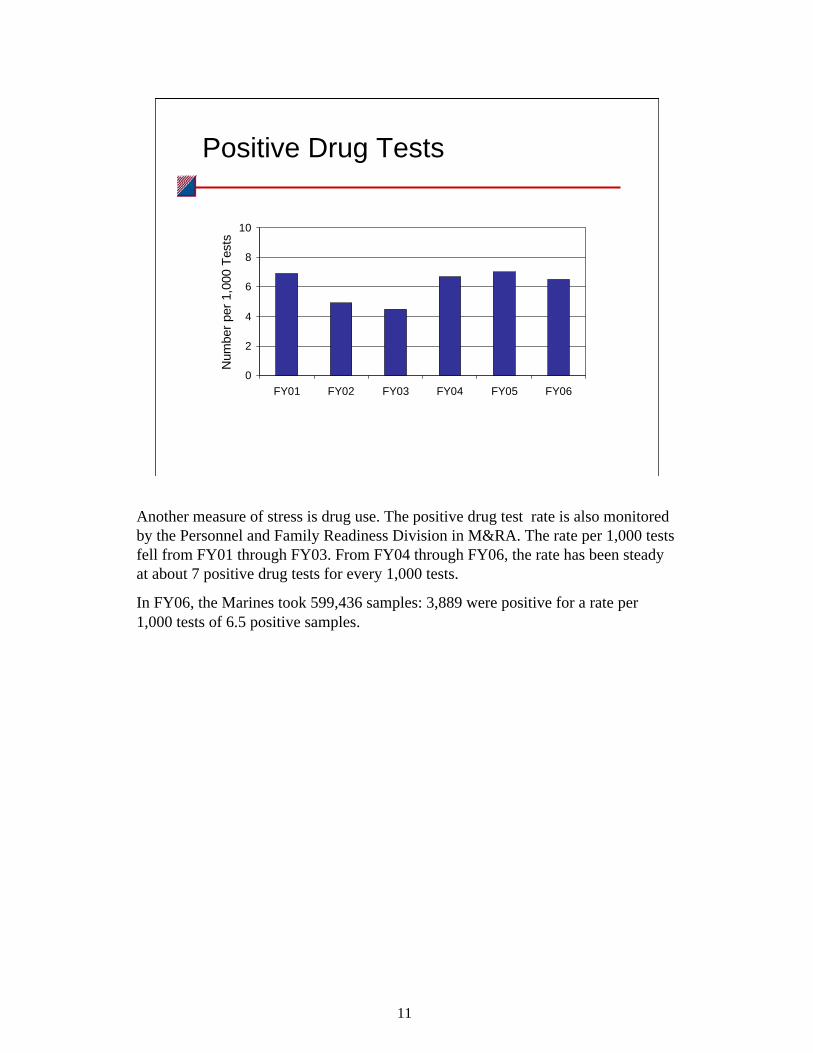
Positive Drug Tests
Another measure of stress is drug use. The positive drug test rate is also monitored by the Personnel and Family Readiness Division in M&RA. The rate per 1,000 tests fell from FY01 through FY03. From FY04 through FY06, the rate has been steady at about 7 positive drug tests for every 1,000 tests.
In FY06, the Marines took 599,436 samples: 3,889 were positive for a rate per 1,000 tests of 6.5 positive samples.
12
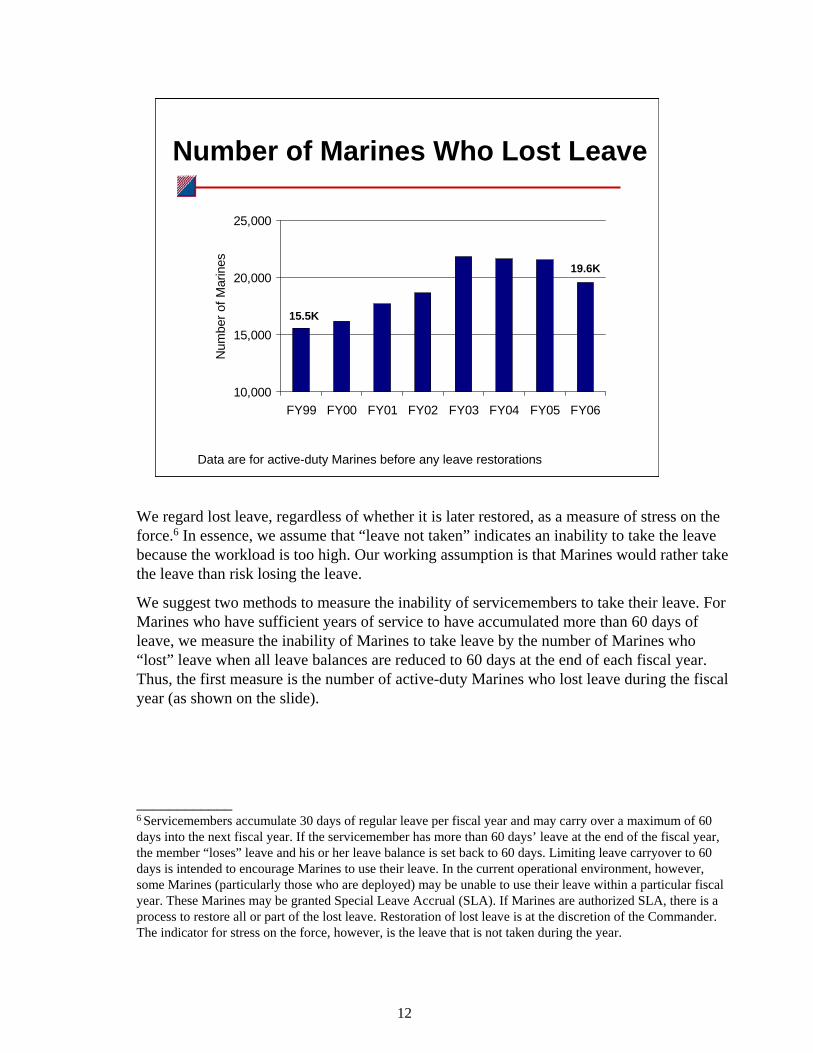
Number of Marines Who Lost Leave
10,000
15,000
20,000
25,000
FY99 FY00 FY01 FY02 FY03 FY04 FY05 FY06
Num
ber o
f Mar
ines
Data are for active-duty Marines before any leave restorations
15.5K
19.6K
We regard lost leave, regardless of whether it is later restored, as a measure of stress on the force.6 In essence, we assume that “leave not taken” indicates an inability to take the leave because the workload is too high. Our working assumption is that Marines would rather take the leave than risk losing the leave.
We suggest two methods to measure the inability of servicemembers to take their leave. For Marines who have sufficient years of service to have accumulated more than 60 days of leave, we measure the inability of Marines to take leave by the number of Marines who “lost” leave when all leave balances are reduced to 60 days at the end of each fiscal year. Thus, the first measure is the number of active-duty Marines who lost leave during the fiscal year (as shown on the slide).
____________6 Servicemembers accumulate 30 days of regular leave per fiscal year and may carry over a maximum of 60 days into the next fiscal year. If the servicemember has more than 60 days’ leave at the end of the fiscal year, the member “loses” leave and his or her leave balance is set back to 60 days. Limiting leave carryover to 60 days is intended to encourage Marines to use their leave. In the current operational environment, however, some Marines (particularly those who are deployed) may be unable to use their leave within a particular fiscal year. These Marines may be granted Special Leave Accrual (SLA). If Marines are authorized SLA, there is a process to restore all or part of the lost leave. Restoration of lost leave is at the discretion of the Commander. The indicator for stress on the force, however, is the leave that is not taken during the year.
13
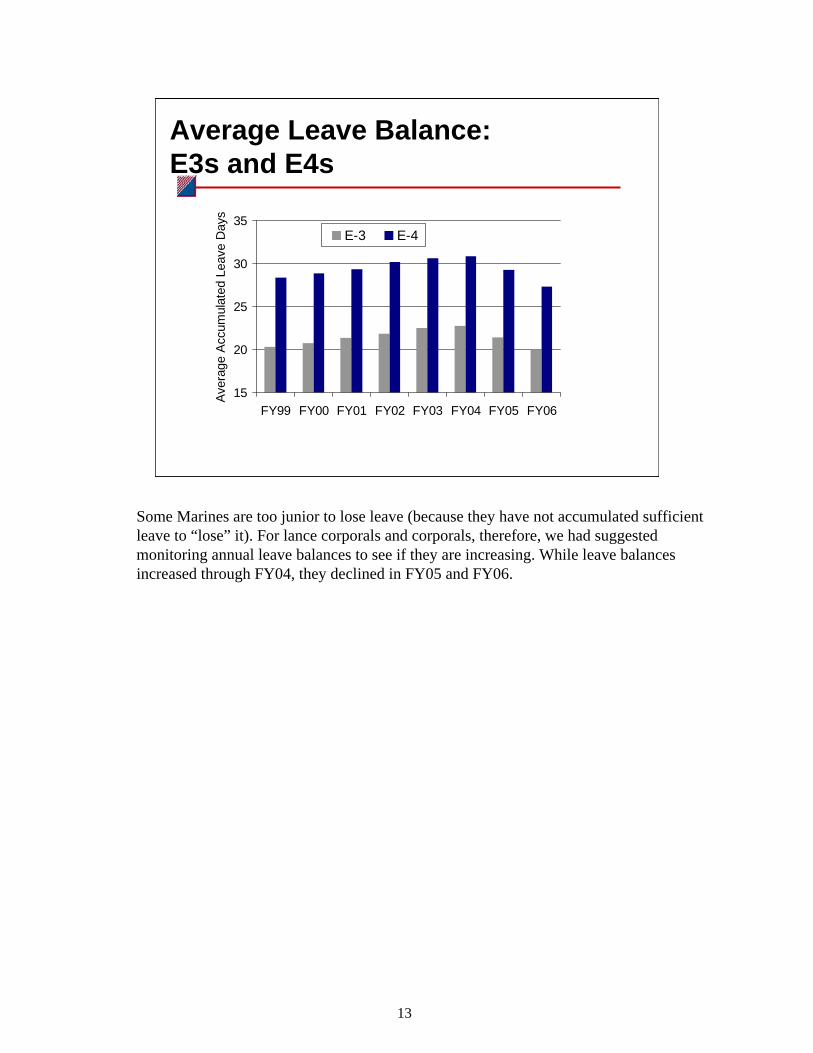
Average Leave Balance:E3s and E4s
15
20
25
30
35
FY99 FY00 FY01 FY02 FY03 FY04 FY05 FY06
Ave
rage
Acc
umul
ated
Lea
ve D
ays
E-3 E-4
Some Marines are too junior to lose leave (because they have not accumulated sufficient leave to “lose” it). For lance corporals and corporals, therefore, we had suggested monitoring annual leave balances to see if they are increasing. While leave balances increased through FY04, they declined in FY05 and FY06.
14
Ground Mishap Rates: Class A + Class B
Operational Non-Operational 11 Sep 2001
0
10
20
30
40
50
60
FY94 FY96 FY98 FY00 FY02 FY04 FY06
RatePer
100KMarines
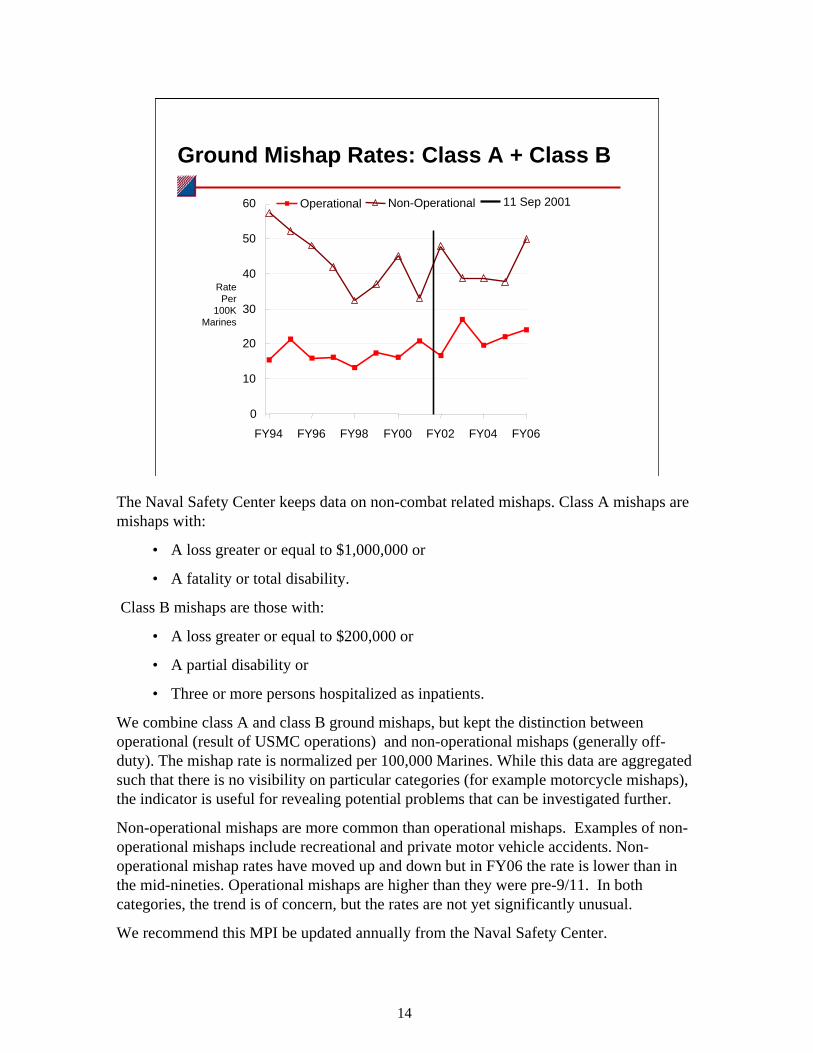
The Naval Safety Center keeps data on non-combat related mishaps. Class A mishaps are mishaps with:
• A loss greater or equal to $1,000,000 or
• A fatality or total disability.
Class B mishaps are those with:
• A loss greater or equal to $200,000 or
• A partial disability or
• Three or more persons hospitalized as inpatients.
We combine class A and class B ground mishaps, but kept the distinction between operational (result of USMC operations) and non-operational mishaps (generally off-duty). The mishap rate is normalized per 100,000 Marines. While this data are aggregated such that there is no visibility on particular categories (for example motorcycle mishaps), the indicator is useful for revealing potential problems that can be investigated further.
Non-operational mishaps are more common than operational mishaps. Examples of non-operational mishaps include recreational and private motor vehicle accidents. Non-operational mishap rates have moved up and down but in FY06 the rate is lower than in the mid-nineties. Operational mishaps are higher than they were pre-9/11. In both categories, the trend is of concern, but the rates are not yet significantly unusual.
We recommend this MPI be updated annually from the Naval Safety Center.
15
Aviation Mishap Rates: Class A + Class B
0
1
2
3
4
5
6
7
8
FY94 FY96 FY98 FY00 FY02 FY04 FY06
Sep 11 2005
RatePer
100KFlightHours
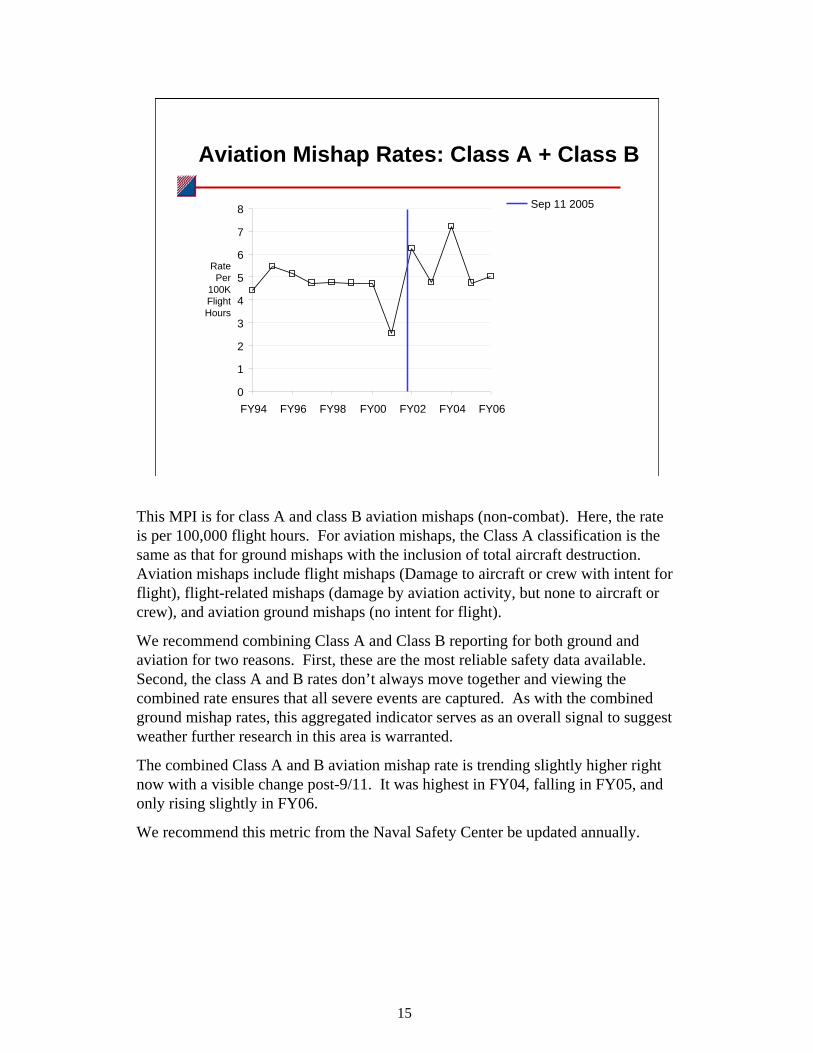
This MPI is for class A and class B aviation mishaps (non-combat). Here, the rate is per 100,000 flight hours. For aviation mishaps, the Class A classification is the same as that for ground mishaps with the inclusion of total aircraft destruction. Aviation mishaps include flight mishaps (Damage to aircraft or crew with intent for flight), flight-related mishaps (damage by aviation activity, but none to aircraft or crew), and aviation ground mishaps (no intent for flight).
We recommend combining Class A and Class B reporting for both ground and aviation for two reasons. First, these are the most reliable safety data available. Second, the class A and B rates don’t always move together and viewing the combined rate ensures that all severe events are captured. As with the combined ground mishap rates, this aggregated indicator serves as an overall signal to suggest weather further research in this area is warranted.
The combined Class A and B aviation mishap rate is trending slightly higher right now with a visible change post-9/11. It was highest in FY04, falling in FY05, and only rising slightly in FY06.
We recommend this metric from the Naval Safety Center be updated annually.
16
Percentage of Eligible Officers andEnlisted Marines Receiving FSA
0
10
20
30
40
50
NO
V, 1
998
FEB
, 199
9
MA
Y, 1
999
AU
G, 1
999
NO
V, 1
999
FEB
, 200
0
MA
Y, 2
000
AU
G, 2
000
NO
V, 2
000
FEB
, 200
1
MA
Y, 2
001
AU
G, 2
001
NO
V, 2
001
FEB
, 200
2
MA
Y, 2
002
AU
G, 2
002
NO
V, 2
002
FEB
, 200
3
MA
Y, 2
003
AU
G, 2
003
NO
V, 2
003
FEB
, 200
4
MA
Y, 2
004
AU
G, 2
004
NO
V, 2
004
FEB
, 200
5
MA
Y, 2
005
AU
G, 2
005
Perc
enta
geEnlisted Officers
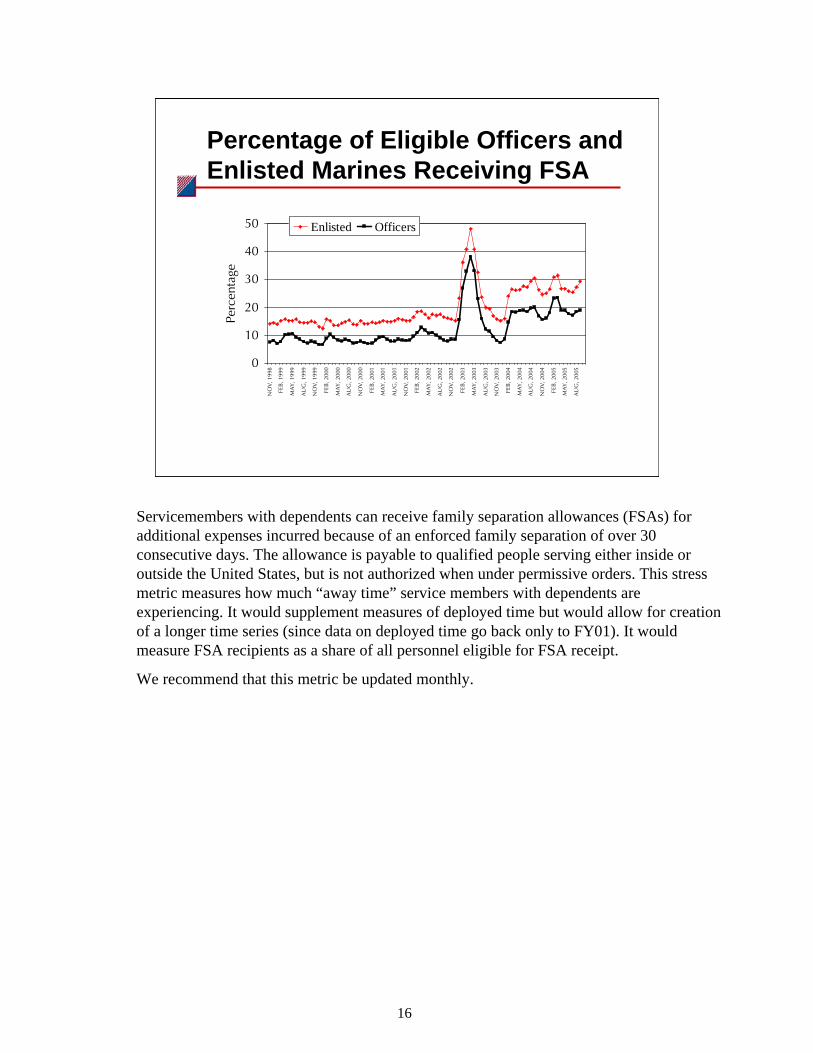
Servicemembers with dependents can receive family separation allowances (FSAs) for additional expenses incurred because of an enforced family separation of over 30 consecutive days. The allowance is payable to qualified people serving either inside or outside the United States, but is not authorized when under permissive orders. This stress metric measures how much “away time” service members with dependents are experiencing. It would supplement measures of deployed time but would allow for creation of a longer time series (since data on deployed time go back only to FY01). It would measure FSA recipients as a share of all personnel eligible for FSA receipt.
We recommend that this metric be updated monthly.
17
0
3,000
6,000
9,000
12,000
15,000
18,000
Less Time to Train: Exercises
FY 01 FY 03 FY 04 FY 05 FY 06FY 02
Number of Marines withExercise Days in Month
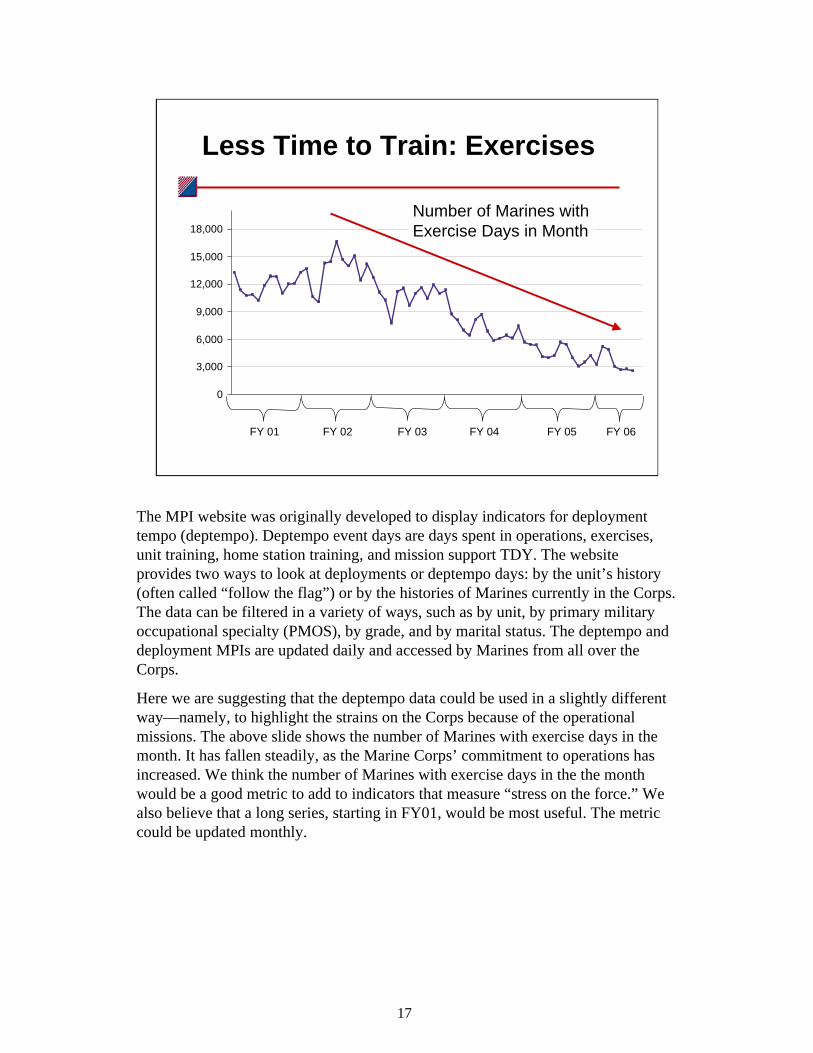
The MPI website was originally developed to display indicators for deployment tempo (deptempo). Deptempo event days are days spent in operations, exercises, unit training, home station training, and mission support TDY. The website provides two ways to look at deployments or deptempo days: by the unit’s history (often called “follow the flag”) or by the histories of Marines currently in the Corps. The data can be filtered in a variety of ways, such as by unit, by primary military occupational specialty (PMOS), by grade, and by marital status. The deptempo and deployment MPIs are updated daily and accessed by Marines from all over the Corps.
Here we are suggesting that the deptempo data could be used in a slightly different way—namely, to highlight the strains on the Corps because of the operational missions. The above slide shows the number of Marines with exercise days in the month. It has fallen steadily, as the Marine Corps’ commitment to operations has increased. We think the number of Marines with exercise days in the the month would be a good metric to add to indicators that measure “stress on the force.” We also believe that a long series, starting in FY01, would be most useful. The metric could be updated monthly.
18
0
3,000
6,000
9,000
12,000
15,000
18,000
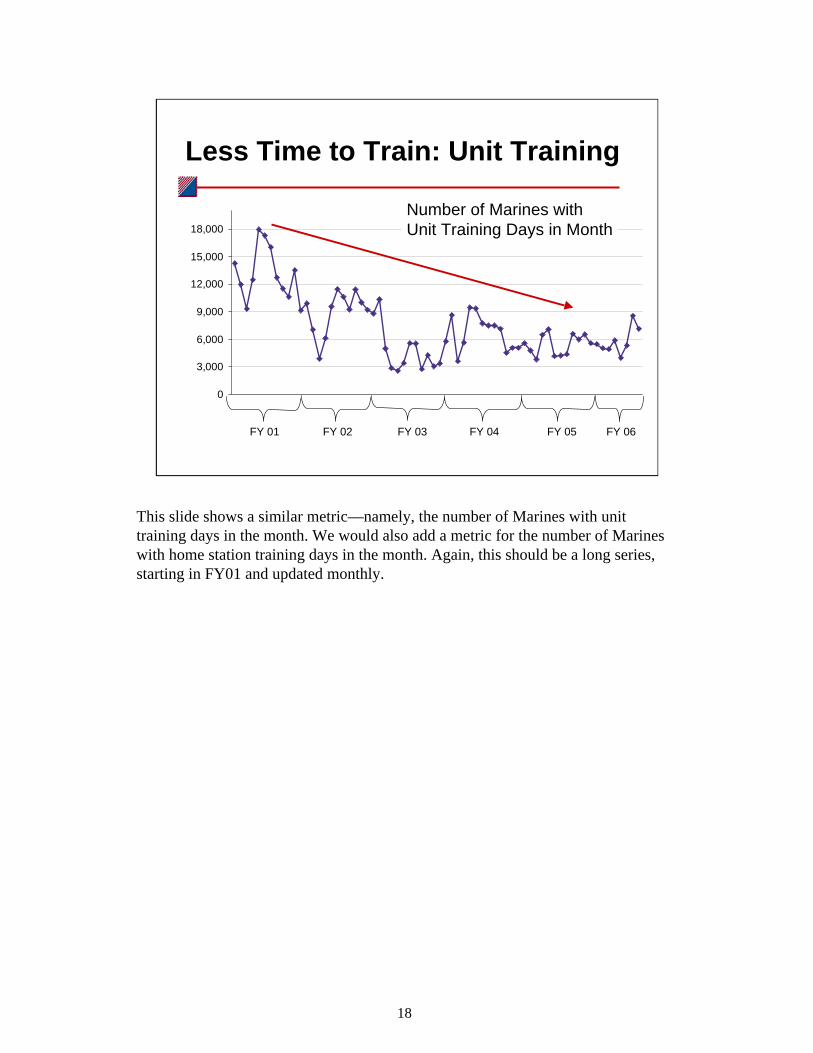
Less Time to Train: Unit Training
FY 01 FY 03 FY 04 FY 05 FY 06FY 02
Number of Marines withUnit Training Days in Month
This slide shows a similar metric—namely, the number of Marines with unit training days in the month. We would also add a metric for the number of Marines with home station training days in the month. Again, this should be a long series, starting in FY01 and updated monthly.
19
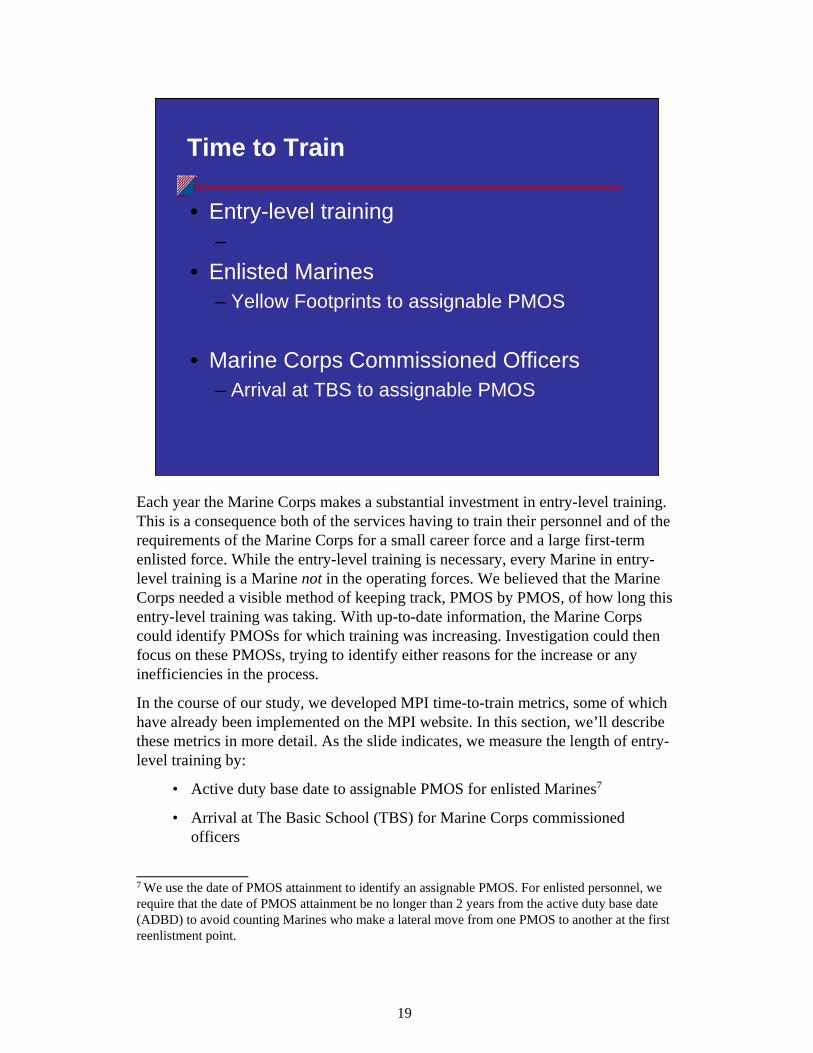
Time to Train
• Entry-level training–
• Enlisted Marines– Yellow Footprints to assignable PMOS
• Marine Corps Commissioned Officers– Arrival at TBS to assignable PMOS
Each year the Marine Corps makes a substantial investment in entry-level training. This is a consequence both of the services having to train their personnel and of the requirements of the Marine Corps for a small career force and a large first-term enlisted force. While the entry-level training is necessary, every Marine in entry-level training is a Marine not in the operating forces. We believed that the Marine Corps needed a visible method of keeping track, PMOS by PMOS, of how long this entry-level training was taking. With up-to-date information, the Marine Corps could identify PMOSs for which training was increasing. Investigation could then focus on these PMOSs, trying to identify either reasons for the increase or any inefficiencies in the process.
In the course of our study, we developed MPI time-to-train metrics, some of which have already been implemented on the MPI website. In this section, we’ll describe these metrics in more detail. As the slide indicates, we measure the length of entry-level training by:
• Active duty base date to assignable PMOS for enlisted Marines7
• Arrival at The Basic School (TBS) for Marine Corps commissioned officers
____________7 We use the date of PMOS attainment to identify an assignable PMOS. For enlisted personnel, we require that the date of PMOS attainment be no longer than 2 years from the active duty base date (ADBD) to avoid counting Marines who make a lateral move from one PMOS to another at the first reenlistment point.

20
Current Systems
• Great Micro Visibility – Course by course through Training
Information Management System (TIMS)• Poor Macro Visibility
– Actual time to complete entry-level trainingNeed visibility on time to initial PMOS
to identify potential inefficiencies
Training and Education Command (TECOM) has TIMS to track Marines in training, course by course. While this electronic system maintains detailed information for each course, the Marine Corps was lacking information on how long it took individual Marines to complete their initial training. Without this information, one cannot determine how much time in the training pipeline was spent in actual training and how much time was spent not in training (travel between training sites, waiting for courses to begin, etc.). Moreover, there was no visibility as to whether current initial skill training was taking more or less time than it had in the past.
With visibility—PMOS by PMOS—on the time it takes to train a Marine Corps officer or enlisted Marine, the Marine Corps will be better able to identify inefficiencies in entry-level training. Questions about the number of course convenings and the timing of these course convenings for a PMOS can be better addressed if we have accurate information on how much “wait time” there is in the training pipeline.
21
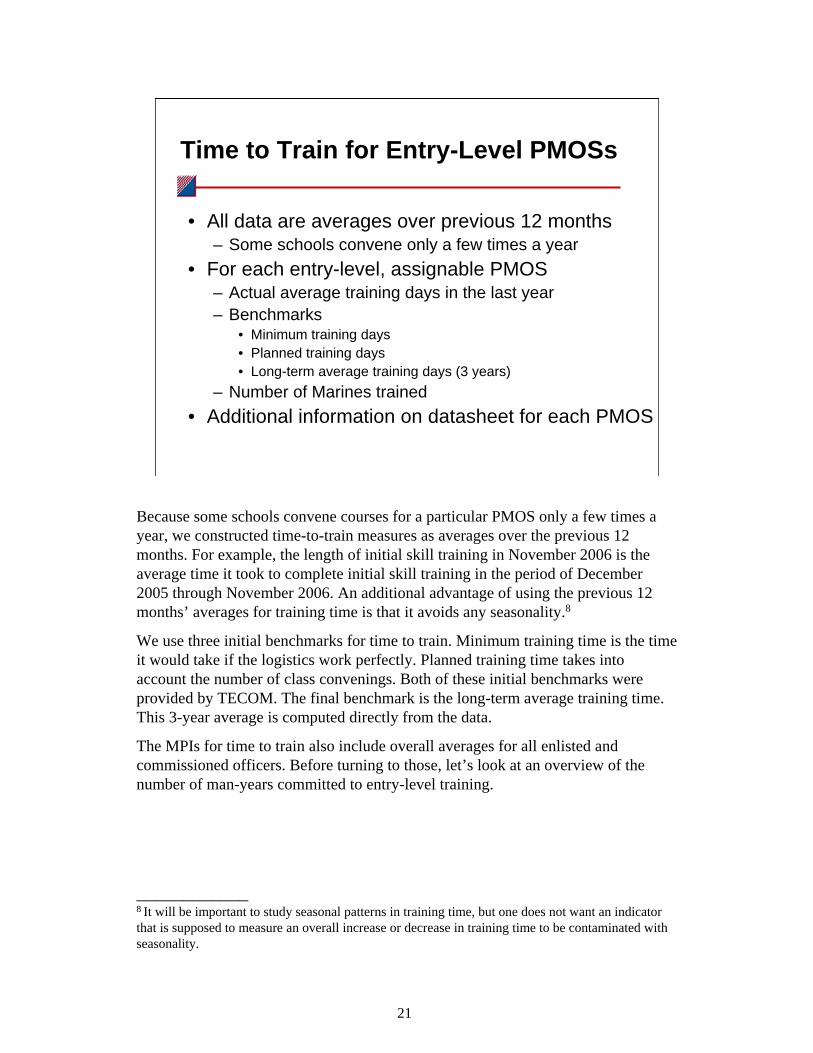
Time to Train for Entry-Level PMOSs
• All data are averages over previous 12 months– Some schools convene only a few times a year
• For each entry-level, assignable PMOS– Actual average training days in the last year– Benchmarks
• Minimum training days• Planned training days• Long-term average training days (3 years)
– Number of Marines trained• Additional information on datasheet for each PMOS
Because some schools convene courses for a particular PMOS only a few times a year, we constructed time-to-train measures as averages over the previous 12 months. For example, the length of initial skill training in November 2006 is the average time it took to complete initial skill training in the period of December 2005 through November 2006. An additional advantage of using the previous 12 months’ averages for training time is that it avoids any seasonality.8
We use three initial benchmarks for time to train. Minimum training time is the time it would take if the logistics work perfectly. Planned training time takes into account the number of class convenings. Both of these initial benchmarks were provided by TECOM. The final benchmark is the long-term average training time. This 3-year average is computed directly from the data.
The MPIs for time to train also include overall averages for all enlisted and commissioned officers. Before turning to those, let’s look at an overview of the number of man-years committed to entry-level training.
____________8 It will be important to study seasonal patterns in training time, but one does not want an indicator that is supposed to measure an overall increase or decrease in training time to be contaminated with seasonality.
22
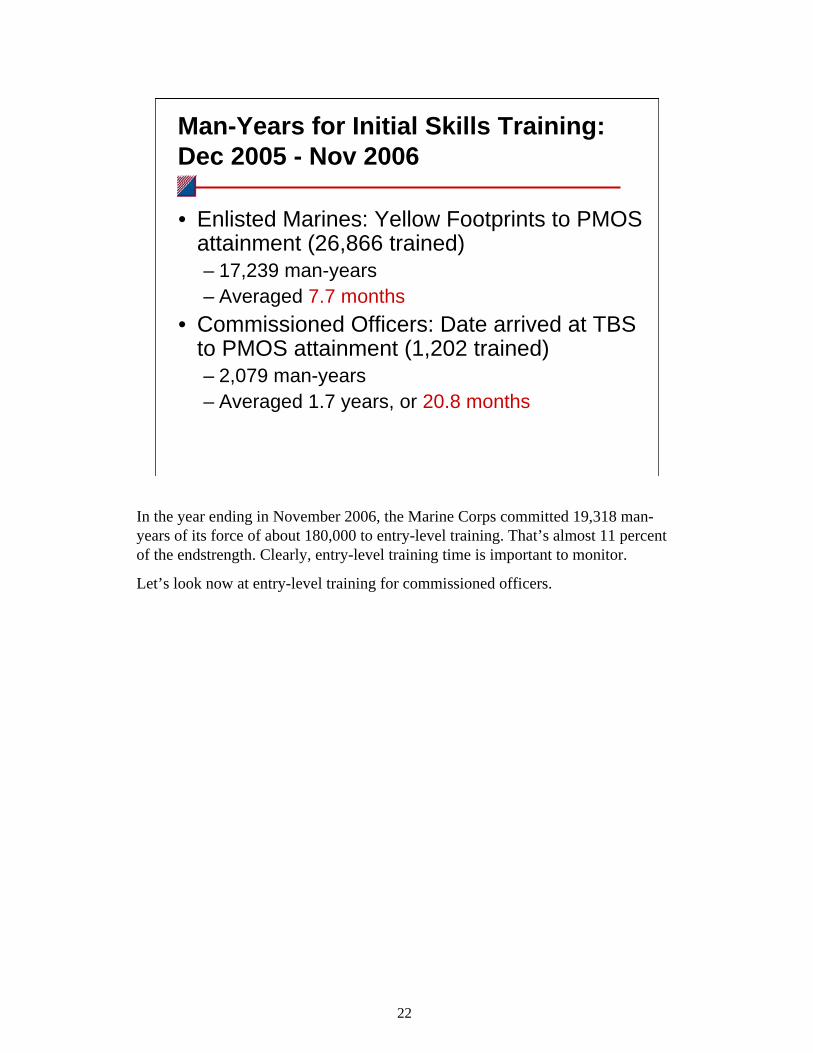
Man-Years for Initial Skills Training: Dec 2005 - Nov 2006
• Enlisted Marines: Yellow Footprints to PMOS attainment (26,866 trained)– 17,239 man-years – Averaged 7.7 months
• Commissioned Officers: Date arrived at TBS to PMOS attainment (1,202 trained)– 2,079 man-years – Averaged 1.7 years, or 20.8 months
In the year ending in November 2006, the Marine Corps committed 19,318 man-years of its force of about 180,000 to entry-level training. That’s almost 11 percent of the endstrength. Clearly, entry-level training time is important to monitor.
Let’s look now at entry-level training for commissioned officers.
23
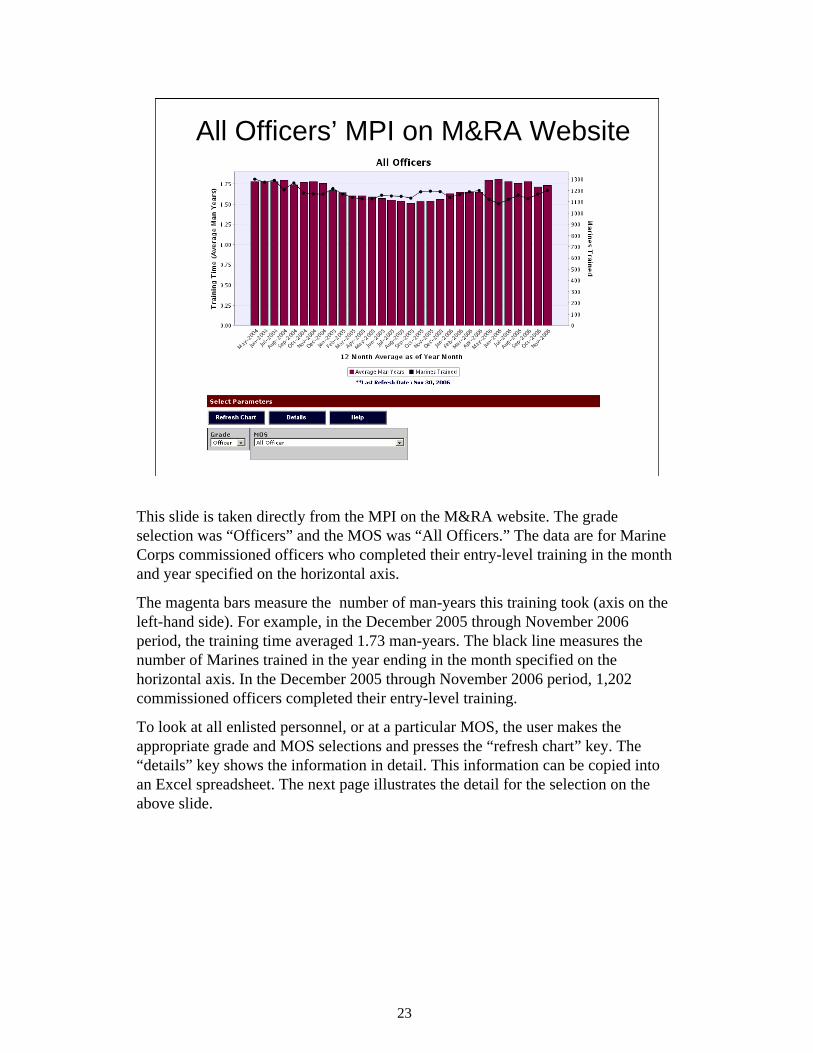
All Officers’ MPI on M&RA Website
This slide is taken directly from the MPI on the M&RA website. The grade selection was “Officers” and the MOS was “All Officers.” The data are for Marine Corps commissioned officers who completed their entry-level training in the month and year specified on the horizontal axis.
The magenta bars measure the number of man-years this training took (axis on the left-hand side). For example, in the December 2005 through November 2006 period, the training time averaged 1.73 man-years. The black line measures the number of Marines trained in the year ending in the month specified on the horizontal axis. In the December 2005 through November 2006 period, 1,202 commissioned officers completed their entry-level training.
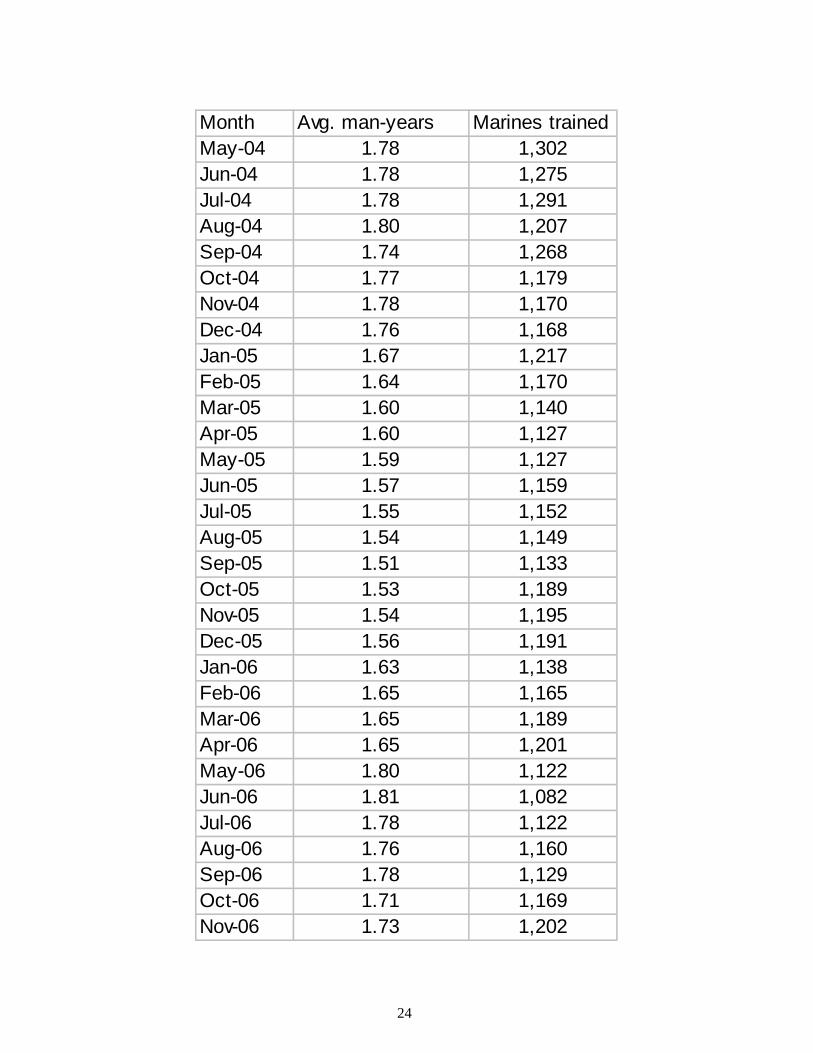
To look at all enlisted personnel, or at a particular MOS, the user makes the appropriate grade and MOS selections and presses the “refresh chart” key. The “details” key shows the information in detail. This information can be copied into an Excel spreadsheet. The next page illustrates the detail for the selection on the above slide.
24
Month Avg. man-years Marines trainedMay-04 1.78 1,302Jun-04 1.78 1,275Jul-04 1.78 1,291Aug-04 1.80 1,207Sep-04 1.74 1,268Oct-04 1.77 1,179Nov-04 1.78 1,170Dec-04 1.76 1,168Jan-05 1.67 1,217Feb-05 1.64 1,170Mar-05 1.60 1,140Apr-05 1.60 1,127May-05 1.59 1,127Jun-05 1.57 1,159Jul-05 1.55 1,152Aug-05 1.54 1,149Sep-05 1.51 1,133Oct-05 1.53 1,189Nov-05 1.54 1,195Dec-05 1.56 1,191Jan-06 1.63 1,138Feb-06 1.65 1,165Mar-06 1.65 1,189Apr-06 1.65 1,201May-06 1.80 1,122Jun-06 1.81 1,082Jul-06 1.78 1,122Aug-06 1.76 1,160Sep-06 1.78 1,129Oct-06 1.71 1,169Nov-06 1.73 1,202
25
MPI on M&RA Website
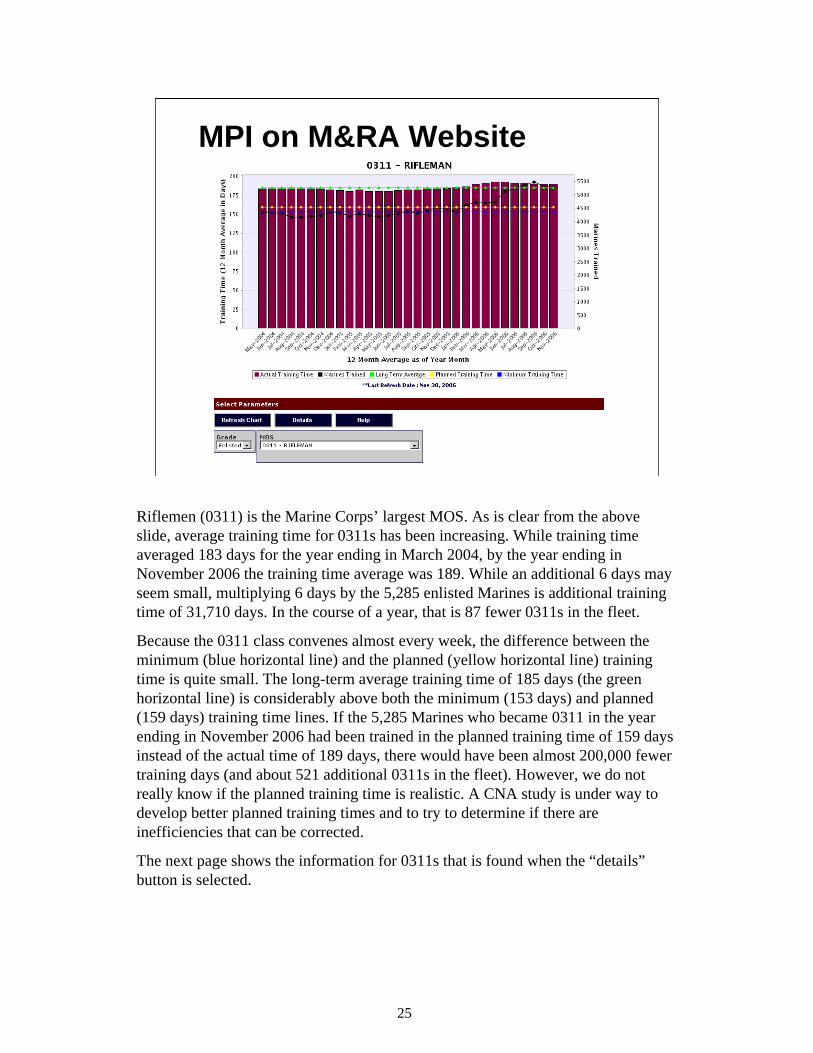
Riflemen (0311) is the Marine Corps’ largest MOS. As is clear from the above slide, average training time for 0311s has been increasing. While training time averaged 183 days for the year ending in March 2004, by the year ending in November 2006 the training time average was 189. While an additional 6 days may seem small, multiplying 6 days by the 5,285 enlisted Marines is additional training time of 31,710 days. In the course of a year, that is 87 fewer 0311s in the fleet.
Because the 0311 class convenes almost every week, the difference between the minimum (blue horizontal line) and the planned (yellow horizontal line) training time is quite small. The long-term average training time of 185 days (the green horizontal line) is considerably above both the minimum (153 days) and planned (159 days) training time lines. If the 5,285 Marines who became 0311 in the year ending in November 2006 had been trained in the planned training time of 159 days instead of the actual time of 189 days, there would have been almost 200,000 fewer training days (and about 521 additional 0311s in the fleet). However, we do not really know if the planned training time is realistic. A CNA study is under way to develop better planned training times and to try to determine if there are inefficiencies that can be corrected.
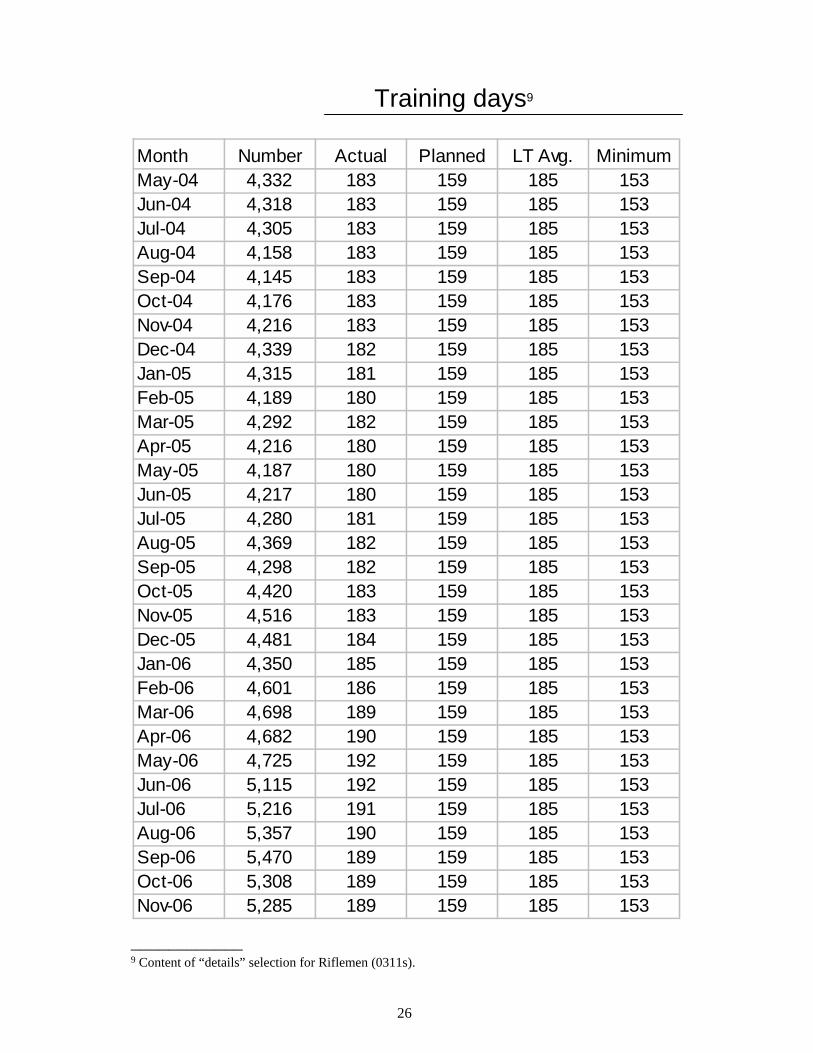
The next page shows the information for 0311s that is found when the “details” button is selected.
26
Training days9
Month Number Actual Planned LT Avg. MinimumMay-04 4,332 183 159 185 153Jun-04 4,318 183 159 185 153Jul-04 4,305 183 159 185 153Aug-04 4,158 183 159 185 153Sep-04 4,145 183 159 185 153Oct-04 4,176 183 159 185 153Nov-04 4,216 183 159 185 153Dec-04 4,339 182 159 185 153Jan-05 4,315 181 159 185 153Feb-05 4,189 180 159 185 153Mar-05 4,292 182 159 185 153Apr-05 4,216 180 159 185 153May-05 4,187 180 159 185 153Jun-05 4,217 180 159 185 153Jul-05 4,280 181 159 185 153Aug-05 4,369 182 159 185 153Sep-05 4,298 182 159 185 153Oct-05 4,420 183 159 185 153Nov-05 4,516 183 159 185 153Dec-05 4,481 184 159 185 153Jan-06 4,350 185 159 185 153Feb-06 4,601 186 159 185 153Mar-06 4,698 189 159 185 153Apr-06 4,682 190 159 185 153May-06 4,725 192 159 185 153Jun-06 5,115 192 159 185 153Jul-06 5,216 191 159 185 153Aug-06 5,357 190 159 185 153Sep-06 5,470 189 159 185 153Oct-06 5,308 189 159 185 153Nov-06 5,285 189 159 185 153
____________9 Content of “details” selection for Riflemen (0311s).
27
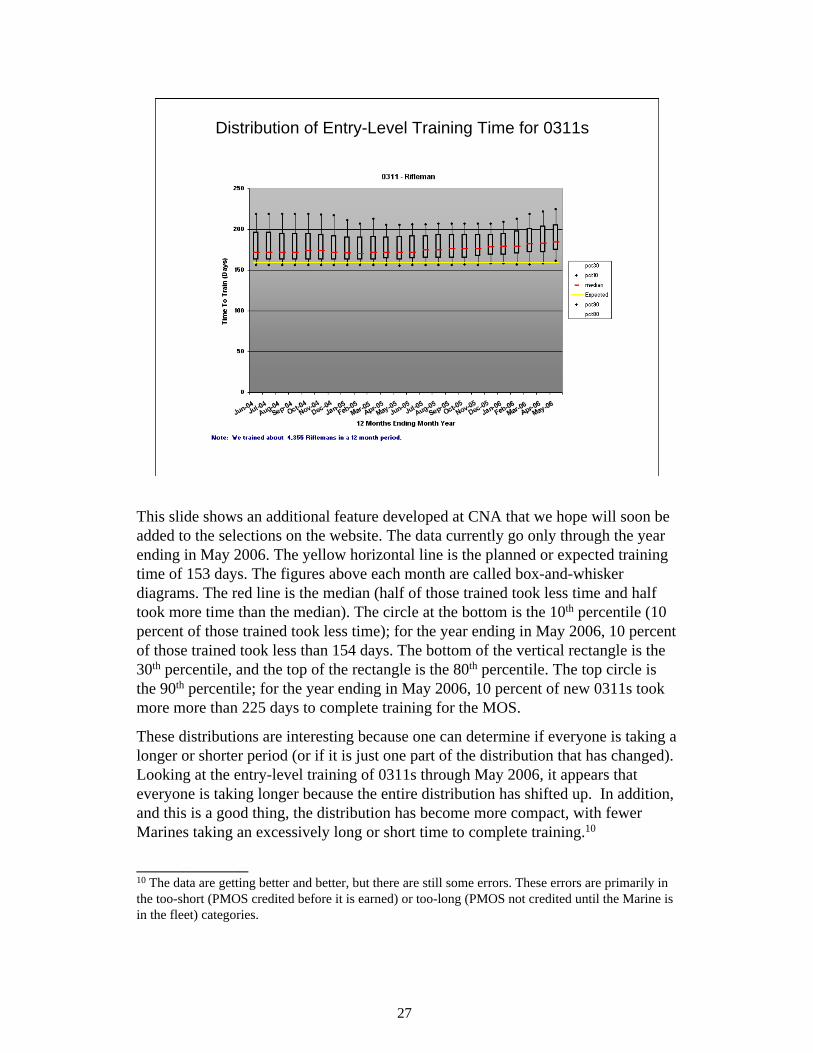
Distribution of Entry-Level Training Time for 0311s
This slide shows an additional feature developed at CNA that we hope will soon be added to the selections on the website. The data currently go only through the year ending in May 2006. The yellow horizontal line is the planned or expected training time of 153 days. The figures above each month are called box-and-whisker diagrams. The red line is the median (half of those trained took less time and half took more time than the median). The circle at the bottom is the 10th percentile (10 percent of those trained took less time); for the year ending in May 2006, 10 percent of those trained took less than 154 days. The bottom of the vertical rectangle is the 30th percentile, and the top of the rectangle is the 80th percentile. The top circle is the 90th percentile; for the year ending in May 2006, 10 percent of new 0311s took more more than 225 days to complete training for the MOS.
These distributions are interesting because one can determine if everyone is taking a longer or shorter period (or if it is just one part of the distribution that has changed). Looking at the entry-level training of 0311s through May 2006, it appears that everyone is taking longer because the entire distribution has shifted up. In addition, and this is a good thing, the distribution has become more compact, with fewer Marines taking an excessively long or short time to complete training.10
____________10 The data are getting better and better, but there are still some errors. These errors are primarily in the too-short (PMOS credited before it is earned) or too-long (PMOS not credited until the Marine is in the fleet) categories.
28
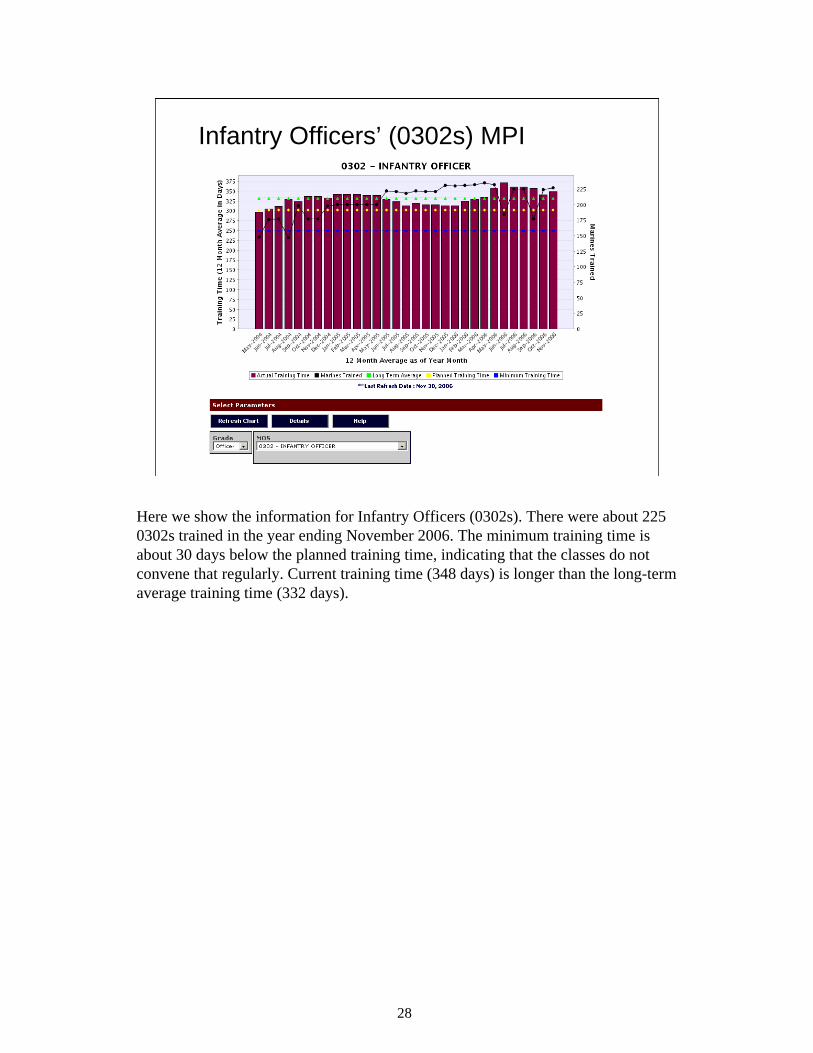
Infantry Officers’ (0302s) MPI
Here we show the information for Infantry Officers (0302s). There were about 225 0302s trained in the year ending November 2006. The minimum training time is about 30 days below the planned training time, indicating that the classes do not convene that regularly. Current training time (348 days) is longer than the long-term average training time (332 days).
29
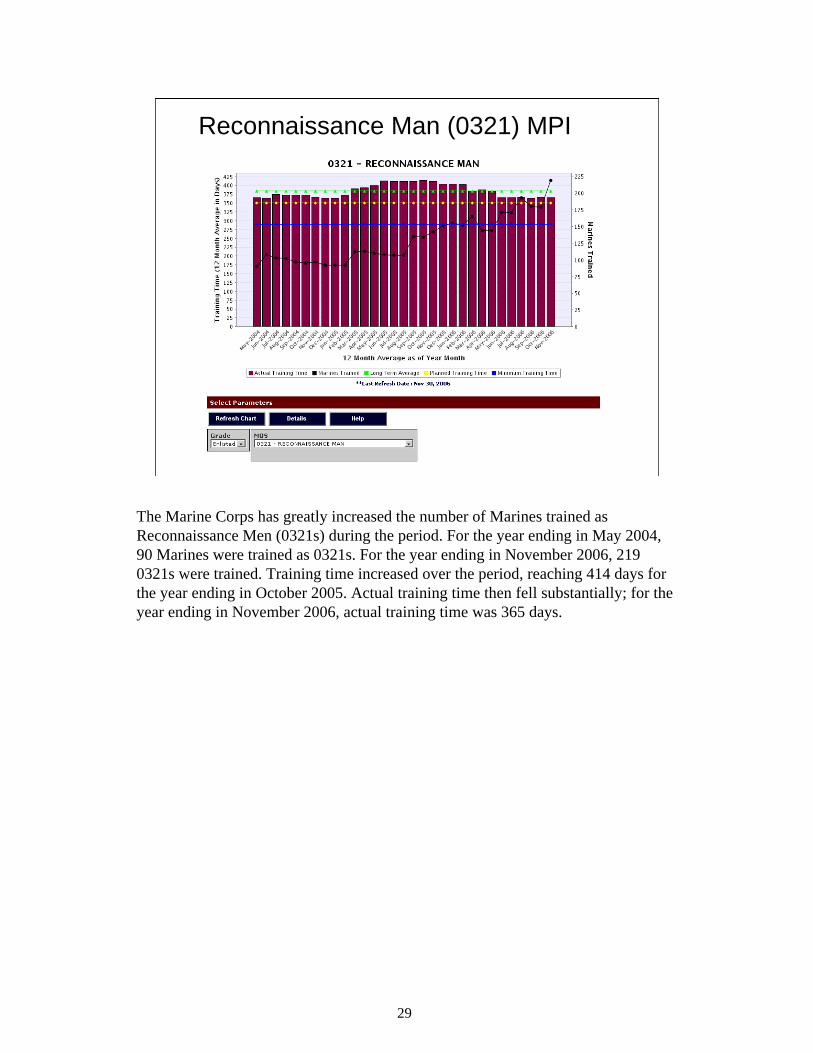
Reconnaissance Man (0321) MPI
The Marine Corps has greatly increased the number of Marines trained as Reconnaissance Men (0321s) during the period. For the year ending in May 2004, 90 Marines were trained as 0321s. For the year ending in November 2006, 219 0321s were trained. Training time increased over the period, reaching 414 days for the year ending in October 2005. Actual training time then fell substantially; for the year ending in November 2006, actual training time was 365 days.
30
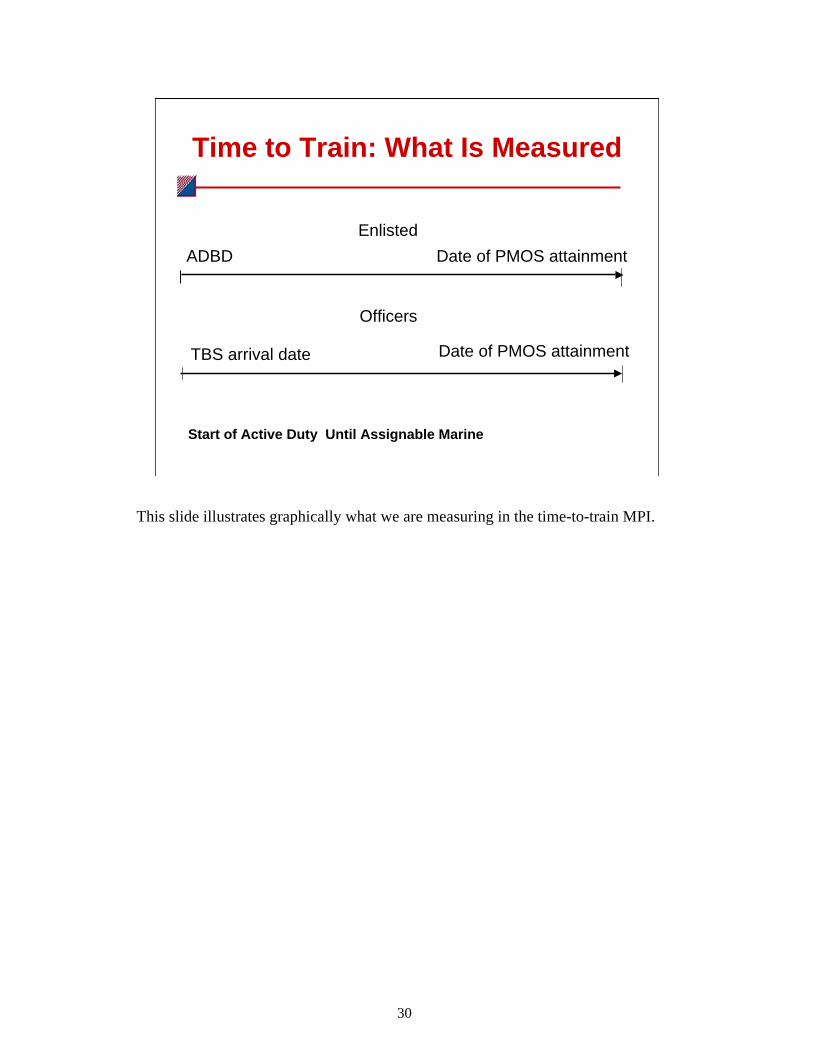
Time to Train: What Is Measured
ADBDEnlisted
Officers
TBS arrival date
Date of PMOS attainment
Date of PMOS attainment
Start of Active Duty Until Assignable Marine
This slide illustrates graphically what we are measuring in the time-to-train MPI.
31
MPIs for Civilian Marines
• Appropriated-Fund employees
• Non-Appropriated-Fund employees
The United States Marine Corps (USMC) employs a large civilian workforce. In this section, we describe how MPIs could be created for the civilian workforce. Our MPIs are annual snapshots that allow Marine Corps managers throughout the Marine Corps to see the composition of their workforces and how it has changed over time. When implemented on the website, we anticipate they would be updated monthly.The data used to construct these MPIs for Civilian Marines can be obtained from the Defense Manpower Data Center (DMDC).
32
Civilian MarinesIn 2006, USMC employed: • 15,376 Appropriated-Fund (APF)
civilian employees• 10,246 Non-Appropriated-Fund
(NAF) civilian employees• ~3,300 Foreign national employees
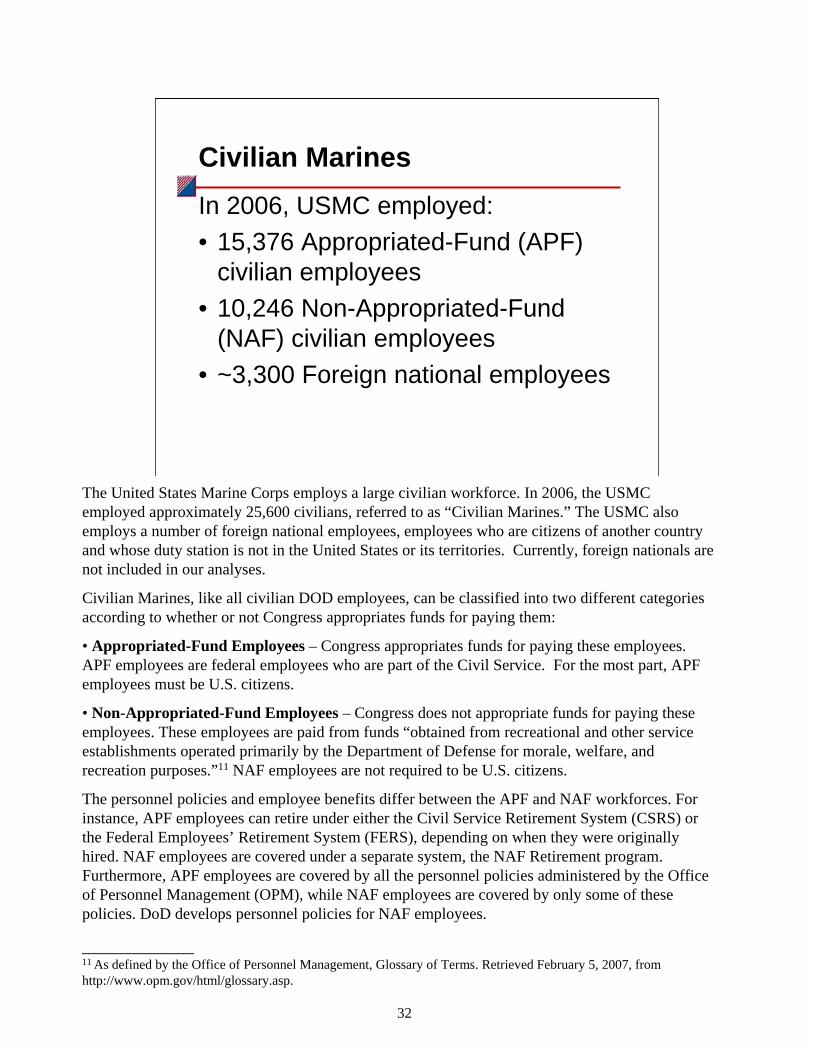
The United States Marine Corps employs a large civilian workforce. In 2006, the USMC employed approximately 25,600 civilians, referred to as “Civilian Marines.” The USMC also employs a number of foreign national employees, employees who are citizens of another country and whose duty station is not in the United States or its territories. Currently, foreign nationals are not included in our analyses.
Civilian Marines, like all civilian DOD employees, can be classified into two different categories according to whether or not Congress appropriates funds for paying them:
• Appropriated-Fund Employees – Congress appropriates funds for paying these employees. APF employees are federal employees who are part of the Civil Service. For the most part, APF employees must be U.S. citizens.
• Non-Appropriated-Fund Employees – Congress does not appropriate funds for paying these employees. These employees are paid from funds “obtained from recreational and other service establishments operated primarily by the Department of Defense for morale, welfare, and recreation purposes.”11 NAF employees are not required to be U.S. citizens.
The personnel policies and employee benefits differ between the APF and NAF workforces. For instance, APF employees can retire under either the Civil Service Retirement System (CSRS) or the Federal Employees’ Retirement System (FERS), depending on when they were originally hired. NAF employees are covered under a separate system, the NAF Retirement program. Furthermore, APF employees are covered by all the personnel policies administered by the Office of Personnel Management (OPM), while NAF employees are covered by only some of these policies. DoD develops personnel policies for NAF employees.
____________11 As defined by the Office of Personnel Management, Glossary of Terms. Retrieved February 5, 2007, from http://www.opm.gov/html/glossary.asp.
33
APF and NAF Pay Systems
APF pay systems• Federal Wage System (FWS)• General Schedule (GS)• National Security Personnel System (NSPS)
NAF pay systems• FWS
– Worker– Leader– Supervisor
• Pay Band System• Children and Youth Pay System
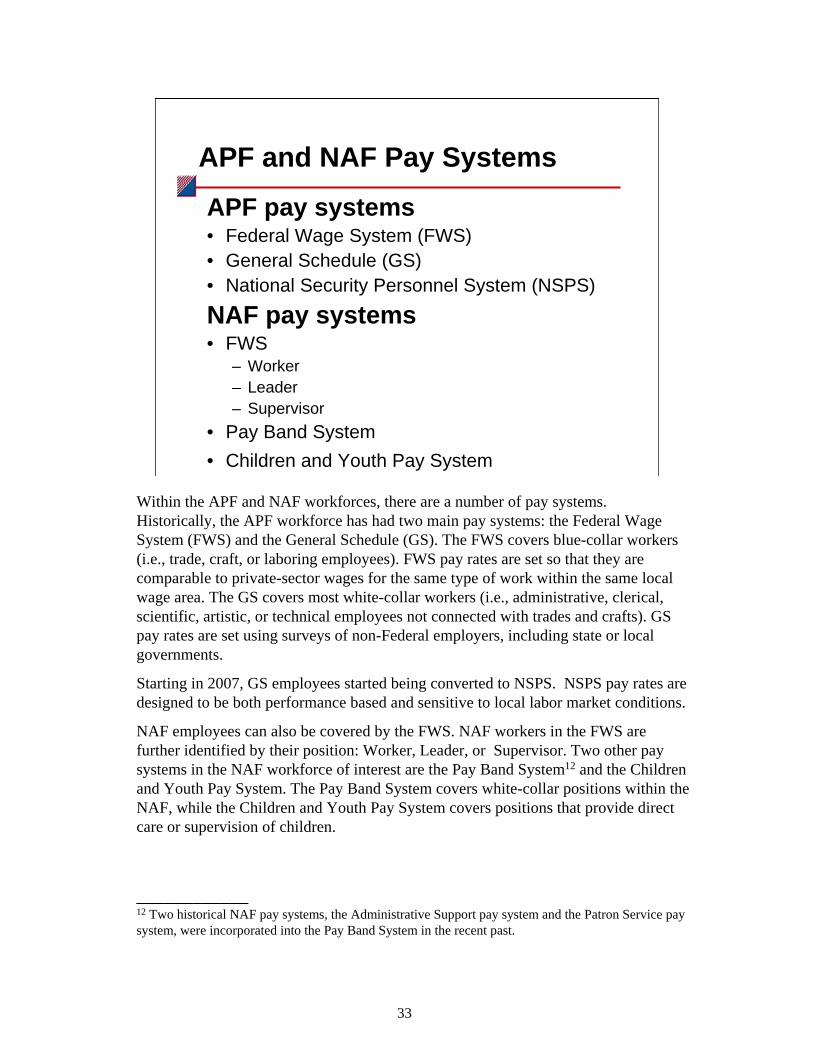
Within the APF and NAF workforces, there are a number of pay systems. Historically, the APF workforce has had two main pay systems: the Federal Wage System (FWS) and the General Schedule (GS). The FWS covers blue-collar workers (i.e., trade, craft, or laboring employees). FWS pay rates are set so that they are comparable to private-sector wages for the same type of work within the same local wage area. The GS covers most white-collar workers (i.e., administrative, clerical, scientific, artistic, or technical employees not connected with trades and crafts). GS pay rates are set using surveys of non-Federal employers, including state or local governments.
Starting in 2007, GS employees started being converted to NSPS. NSPS pay rates are designed to be both performance based and sensitive to local labor market conditions.
NAF employees can also be covered by the FWS. NAF workers in the FWS are further identified by their position: Worker, Leader, or Supervisor. Two other pay systems in the NAF workforce of interest are the Pay Band System12 and the Children and Youth Pay System. The Pay Band System covers white-collar positions within the NAF, while the Children and Youth Pay System covers positions that provide direct care or supervision of children.
____________12 Two historical NAF pay systems, the Administrative Support pay system and the Patron Service pay system, were incorporated into the Pay Band System in the recent past.
34
Data Covering Civilian Marines• Defense Manpower Data Center
gathers information on these civilian Marines– Demographic characteristics– Job characteristics – Military/veteran background (APF
only)
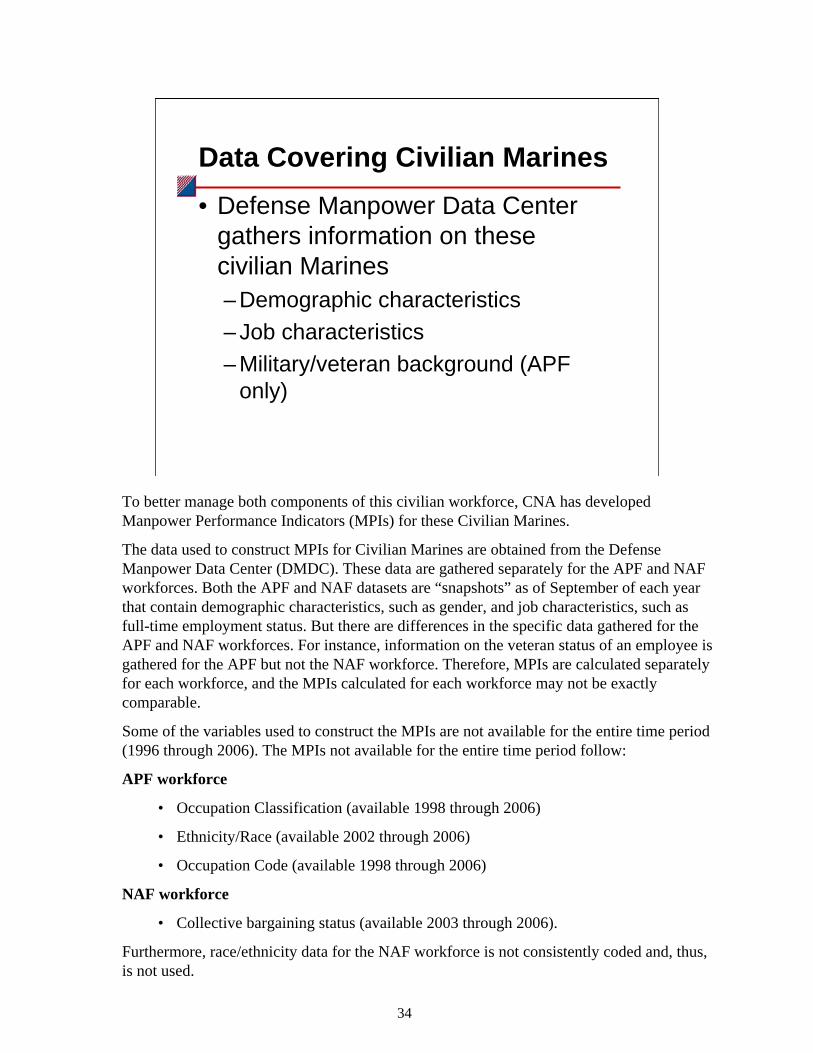
To better manage both components of this civilian workforce, CNA has developed Manpower Performance Indicators (MPIs) for these Civilian Marines.
The data used to construct MPIs for Civilian Marines are obtained from the Defense Manpower Data Center (DMDC). These data are gathered separately for the APF and NAF workforces. Both the APF and NAF datasets are “snapshots” as of September of each year that contain demographic characteristics, such as gender, and job characteristics, such as full-time employment status. But there are differences in the specific data gathered for the APF and NAF workforces. For instance, information on the veteran status of an employee is gathered for the APF but not the NAF workforce. Therefore, MPIs are calculated separately for each workforce, and the MPIs calculated for each workforce may not be exactly comparable.
Some of the variables used to construct the MPIs are not available for the entire time period (1996 through 2006). The MPIs not available for the entire time period follow:
APF workforce
• Occupation Classification (available 1998 through 2006)
• Ethnicity/Race (available 2002 through 2006)
• Occupation Code (available 1998 through 2006)
NAF workforce
• Collective bargaining status (available 2003 through 2006).
Furthermore, race/ethnicity data for the NAF workforce is not consistently coded and, thus, is not used.
35
Data Covering Civilian Marines (continued)
• DMDC data can be used to:– Construct MPIs for Civilian Marines– Construct subgroups of workforce so
that MPIs can be applied both to the entire workforce and to these subgroups
The DMDC data can be used not only to construct these MPIs but also to split each workforce into various subgroups. For instance, one can use these data to split the workforce by gender into a male subgroup and a female subgroup. The MPIs constructed can then be applied not only to the entire workforce but also to specific subgroups within that workforce.
Some variables are used both to construct MPIs and as a way to subset the workforce. For instance, gender and age group are both MPIs and gender is also used to create a subset of the workforce. Therefore, one can view gender for the entire workforce and also view age group by gender.
36
MPIs Can Answer the Following Questions• What is happening to the racial and
gender composition of the workforce?• What proportion of the workforce
belongs to a union?• Is the workforce aging?• How many retired Marines are entering
as Civilian Marines? (APF workforce only)
• How much of the workforce is eligible to retire? (APF workforce only)
The MPIs that can be constructed with the DMDC data can be used to address the following types of questions:
• What is happening to the racial and gender composition of the workforce?
• What proportion of the workforce belongs to a union?
• Is the workforce aging?
• How many retired Marines are entering as Civilian Marines? (APF workforce only)?
• How much of the workforce is eligible to retire? (APF workforce only)?
37
MPIs Can Answer the Following Questions (cont’d)• Are Civilian Marines representative
of the civilian labor force?– Comparisons by race/ethnicity and
gender– Geographic comparisons
• Are subsets of the Civilian Marine workforce representative of the entire Civilian Marine workforce?
The MPIs that can be constructed with the DMDC data can also be used to examine the degree to which Civilian Marines are representative of the civilian labor force. Probably the most useful comparisons will be in terms of race/ethnicity and gender. These Census comparisons can also be made geographically. The civilian labor force data from the Decennial Census is collected every 10 years and is based on a 1-in-6 sample.
MPIs can also be used to examine the degree to which subsets of the Civilian Marine workforce are representative of the entire Civilian Marine workforce. For instance, one could examine the degree to which supervisors/managers mirror the entire Civilian Marine workforce in terms of race/ethnicity or gender.
38
MPIs Available for APF Workforce1. Total workforce (by pay plan)2. Occupation classification3. Supervisory status4. Work schedule5. Collective bargaining status6. Age group7. Gender8. Ethnicity/race
Below is a list of the APF workforce MPIs along with a description of what the graph pertaining to the MPI would show:
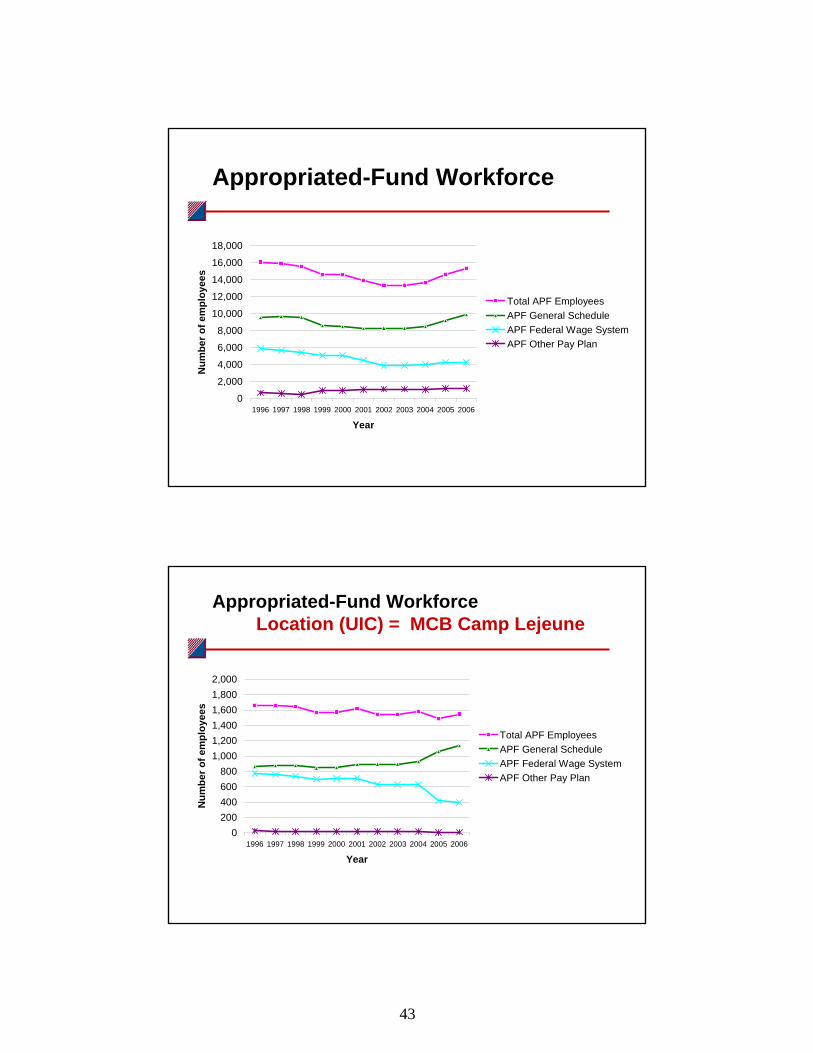
Total workforce (by pay plan) – the total number of APF employees each year from 1996 through 2006. This graph also shows the breakdown of APF employees by pay plan (General Schedule, Federal Wage System, other pay plan).
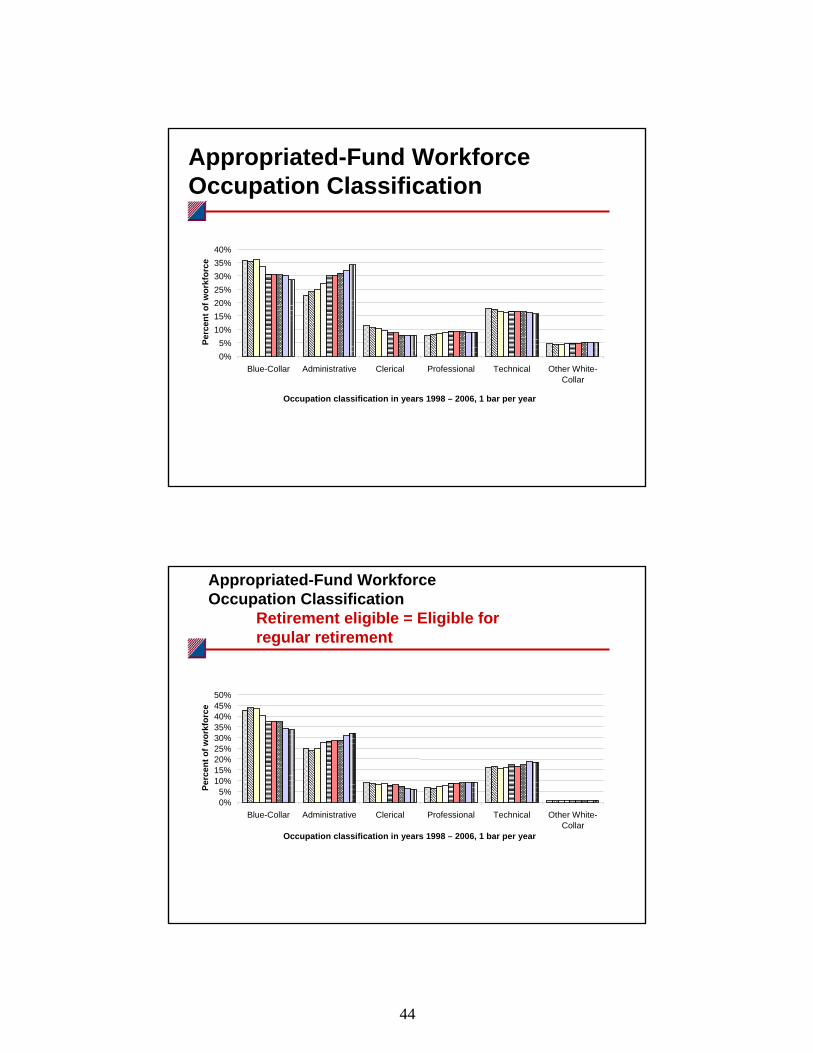
Occupation classification – the percentage of the workforce classified as blue-collar and the percentage classified into each of the following white-collar groups: administrative, clerical, professional, technical, and other white-collar.
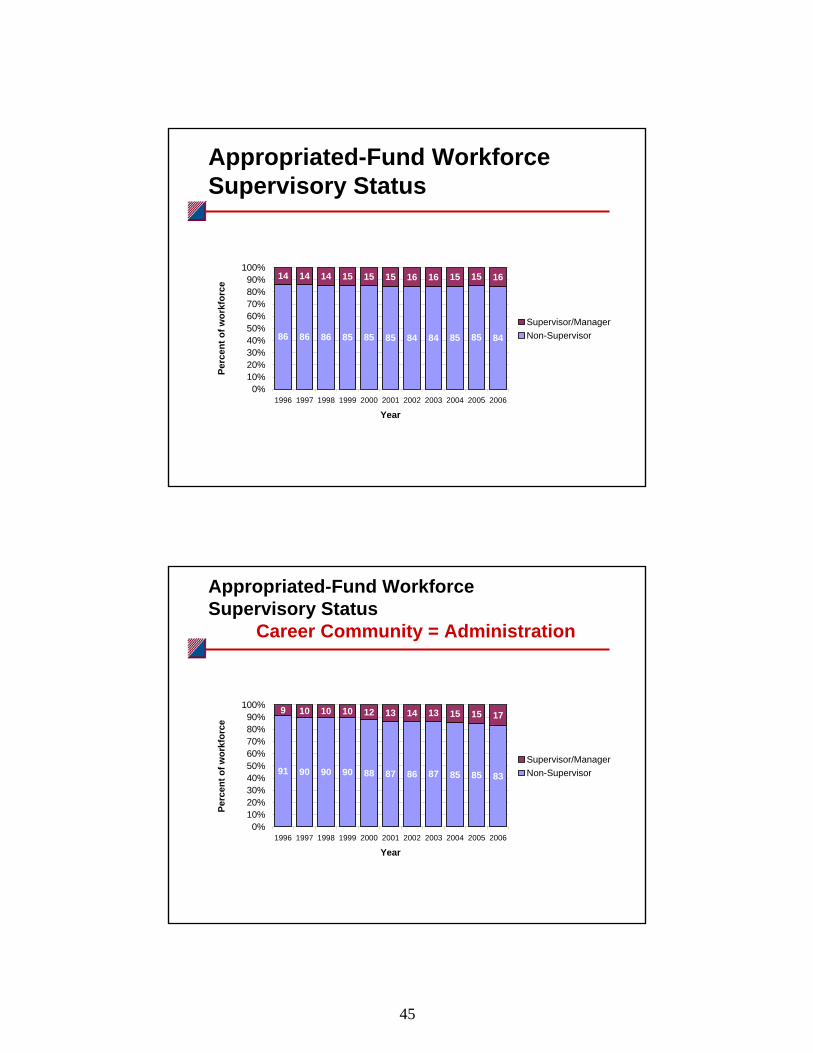
Supervisory status – the percentage of the workforce classified as managers/supervisors and non-supervisors.
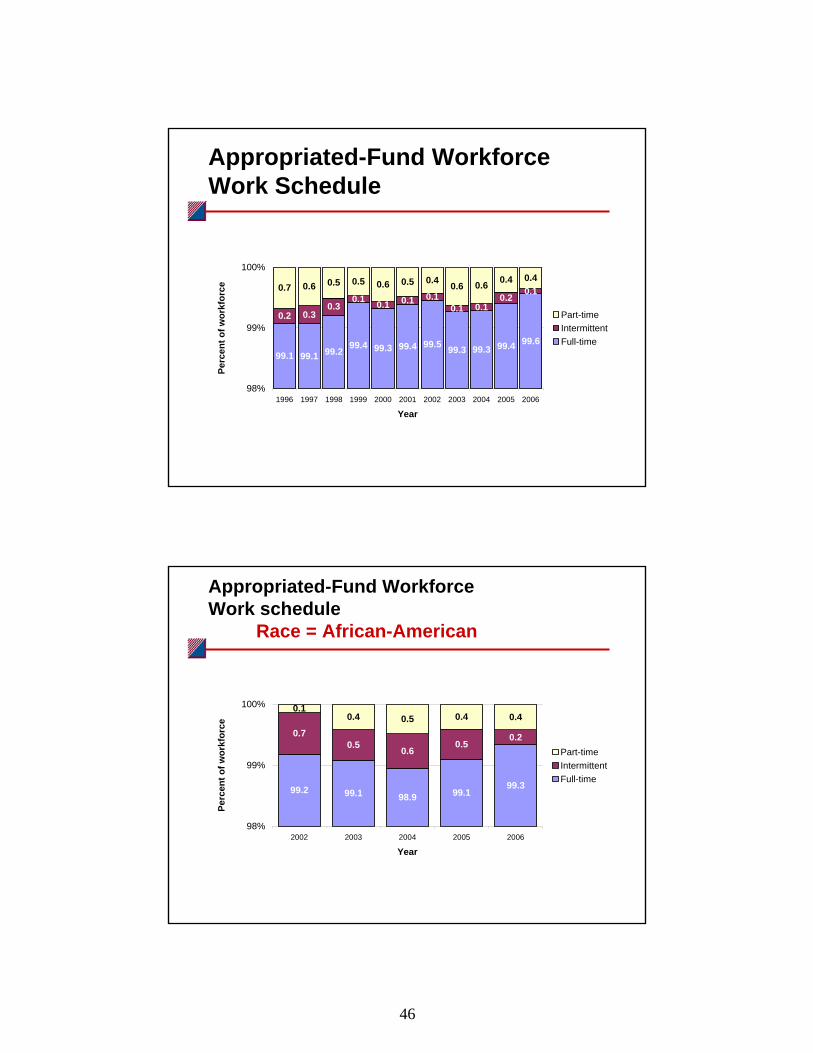
Work Schedule – the percentage of the workforce classified as full-time workers and part-time workers.
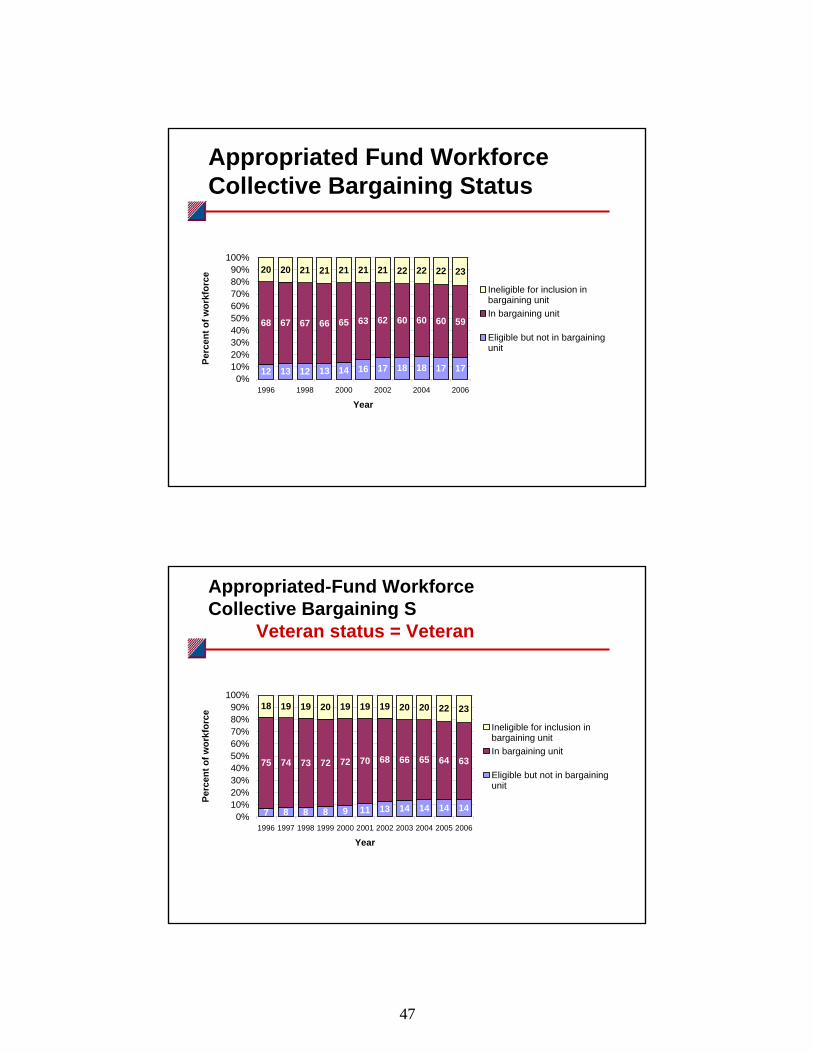
Collective bargaining status – the percentage of the workforce classified as:
• In a bargaining unit
• Eligible but not in bargaining unit
• Ineligible for inclusion in bargaining unit.
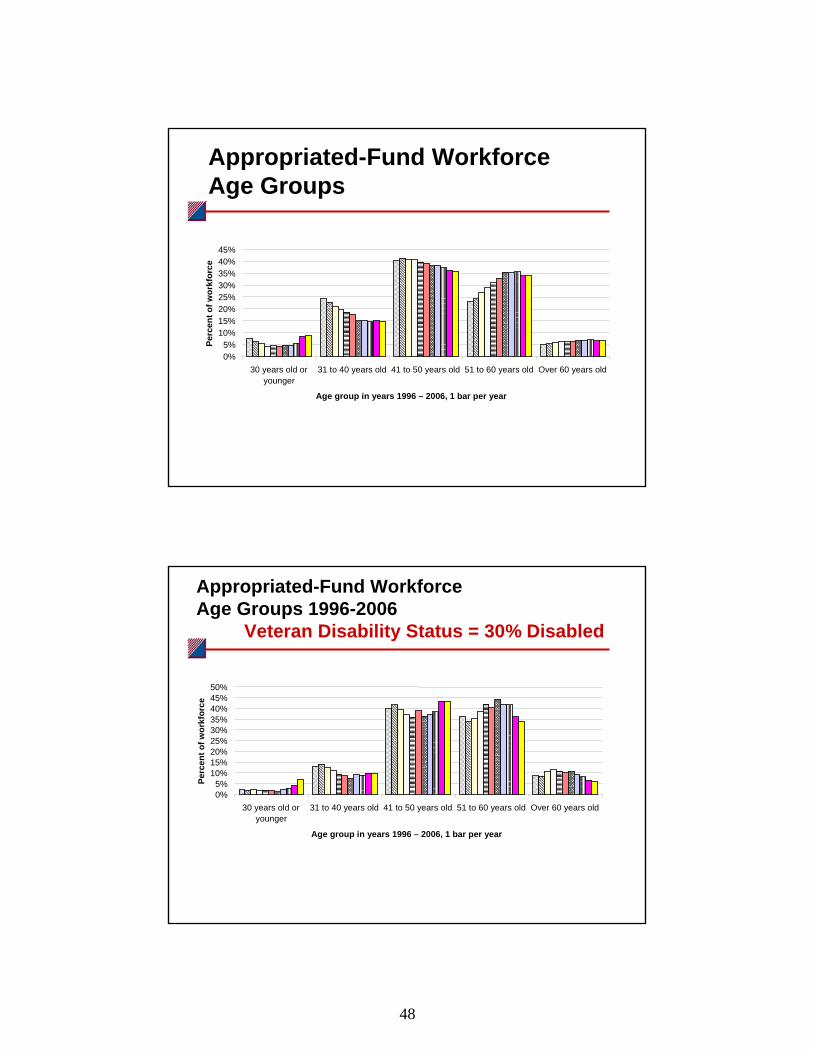
Age group – the percentage of the workforce that falls into specific age groups.
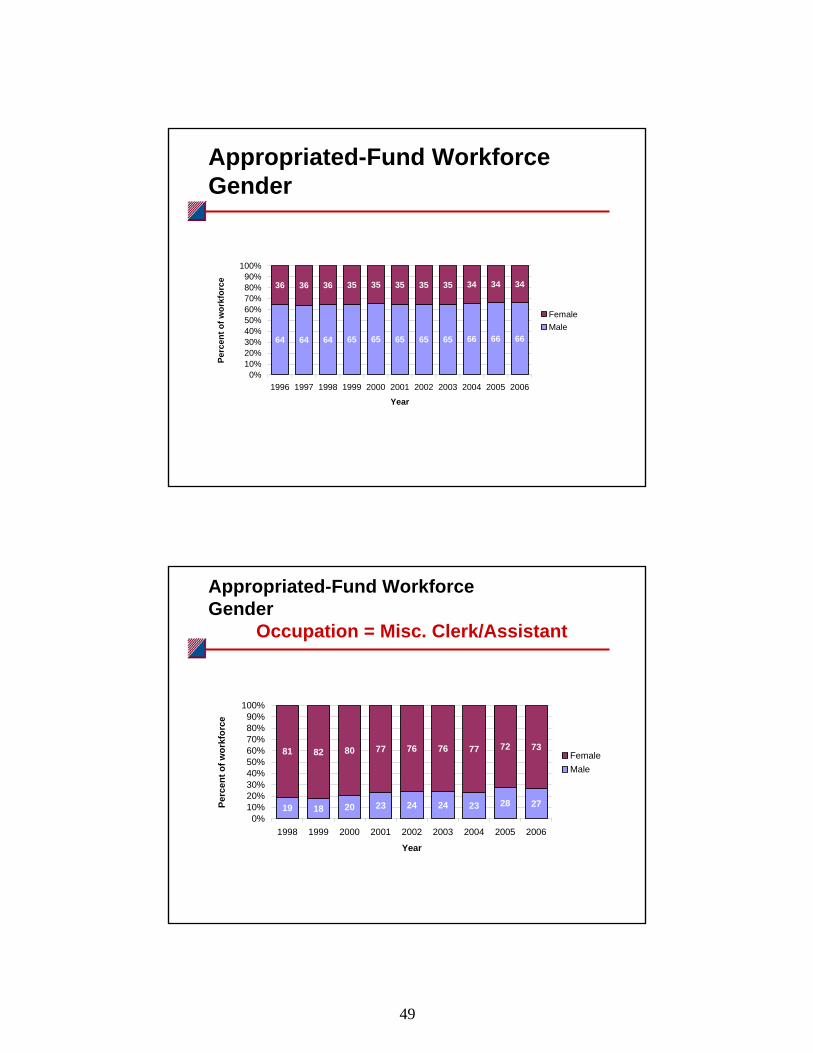
Gender – the percentage of the workforce classified as male and female.
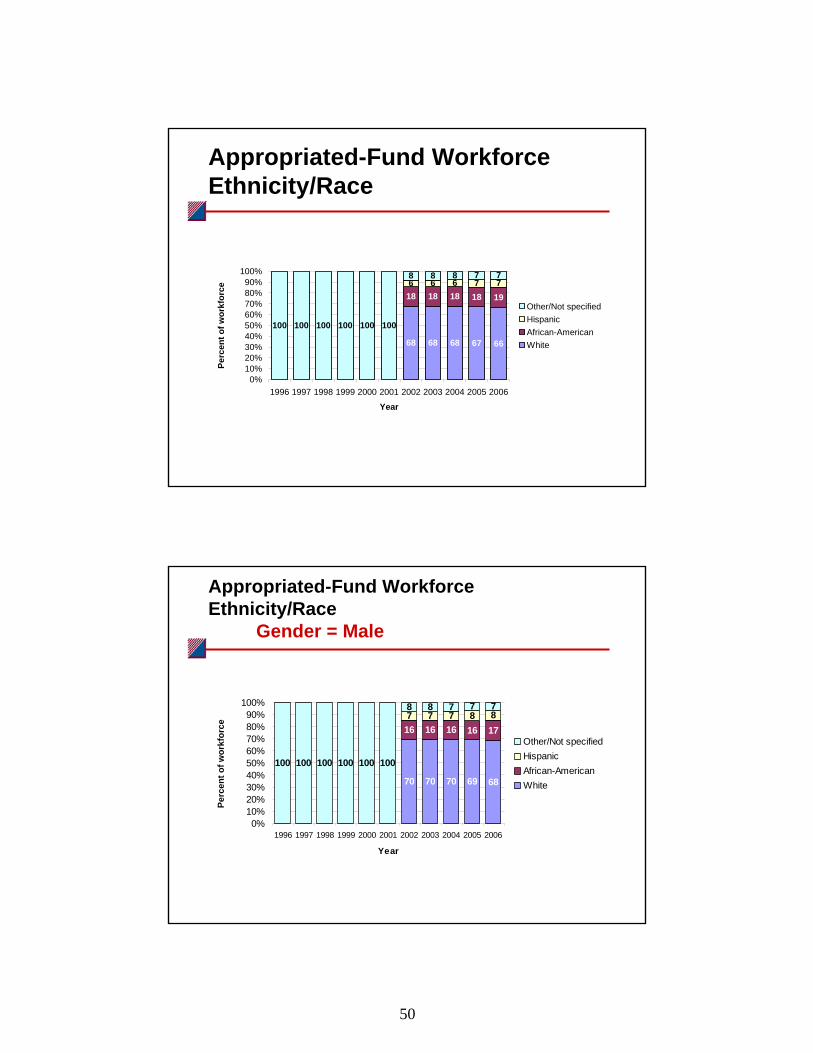
Ethnicity/race – the percentage of the workforce classified as white (non-Hispanic), black (non-Hispanic), Hispanic, and other/not determined.
39
APF workforce can be split into subgroups by:• Occupation• Civilian career community • Location (Unit Identification Code, or UIC)• Retirement eligibility• Veteran status• Retired military status• Disability status• Gender• Ethnicity/race
The available workforce subsets are defined by the different values of the following variables:
Occupation – The occupation code for each employee submitted by the appropriate DoD agency consistent with standards set by OPM.
Civilian career community – The USMC groups civilian occupations into career communities. We grouped occupation codes to accord with these USMC career communities.
Location (UIC) –The UIC identifies the location of each civilian Marine.13
Retirement eligibility – Indicates whether an employee is eligible for regular retirement, eligible for early retirement, or not eligible for retirement.
Veteran status – This variable, constructed using several variables from the DMDC dataset per instructions in the DoD APF Civilian Personnel Master Edit File, indicates whether an employee is a veteran.
Retired military status – Indicates whether an employee retired from the military.
Veteran disability status – Indicates whether an employee who is eligible for a veterans preference received veterans preference due to a disability of less than 30 percent, due to a disability of 30 percent or more, or did not receive preference due to a disability.
Gender – Indicates whether an employee is male or female.
Ethnicity/race – Indicates whether an employee is white (not Hispanic), African-American (not Hispanic), Hispanic, or other race/not identified.____________13 For a formal definition see NAVY TRAINING PLAN N88-NTP-A-50-9204B/A, 1 December 1998, downloaded from http://www.fas.org/irp/program/process/jsips-n-ntsp/Append_b.htm on February 6, 2007.

40
MPIs Available for NAF Workforce1. Total workforce (by pay plan)2. Work schedule3. Collective bargaining status4. Age group5. Gender6. Citizenship status
Below is a list of the NAF workforce MPIs along with a description of what the graph pertaining to the MPI would show:
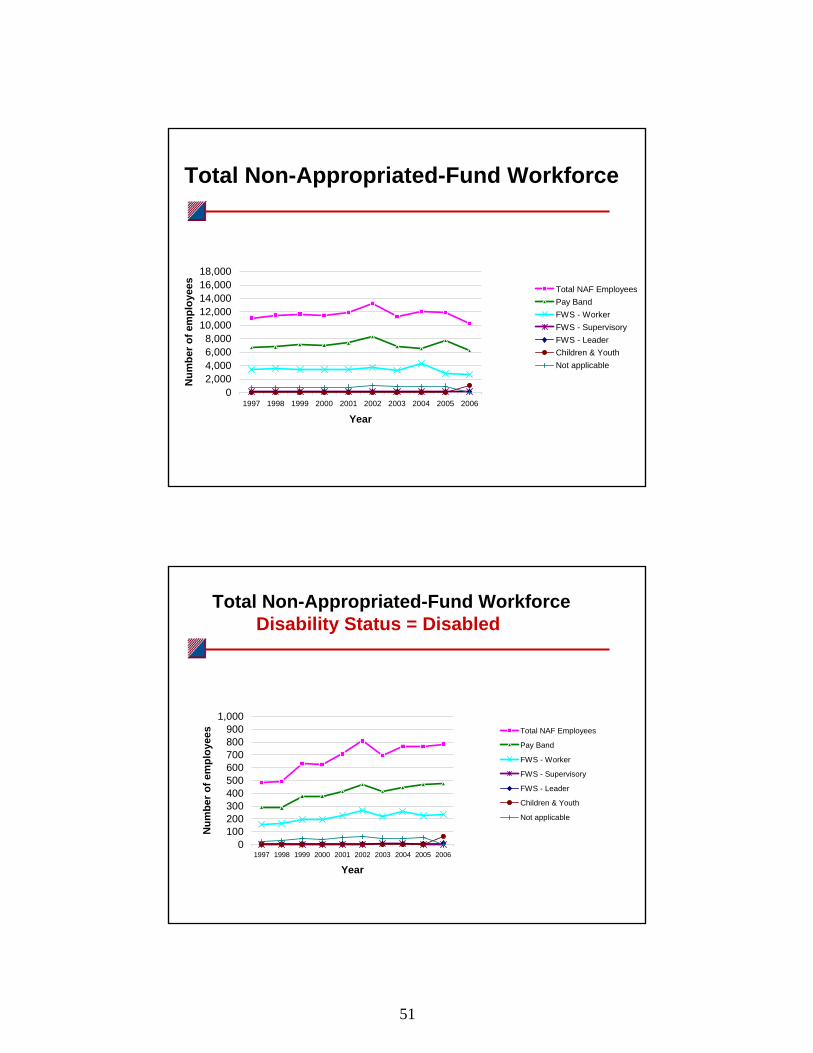
Total workforce (by pay plan) – the total number of NAF employees each year from 1996 through 2006. This graph also shows the breakdown of NAF employees by pay system (FWS Worker, FWS Leader, or FWS Supervisor, Pay Band System, Children and Youth Pay System, and Other Pay Plan).
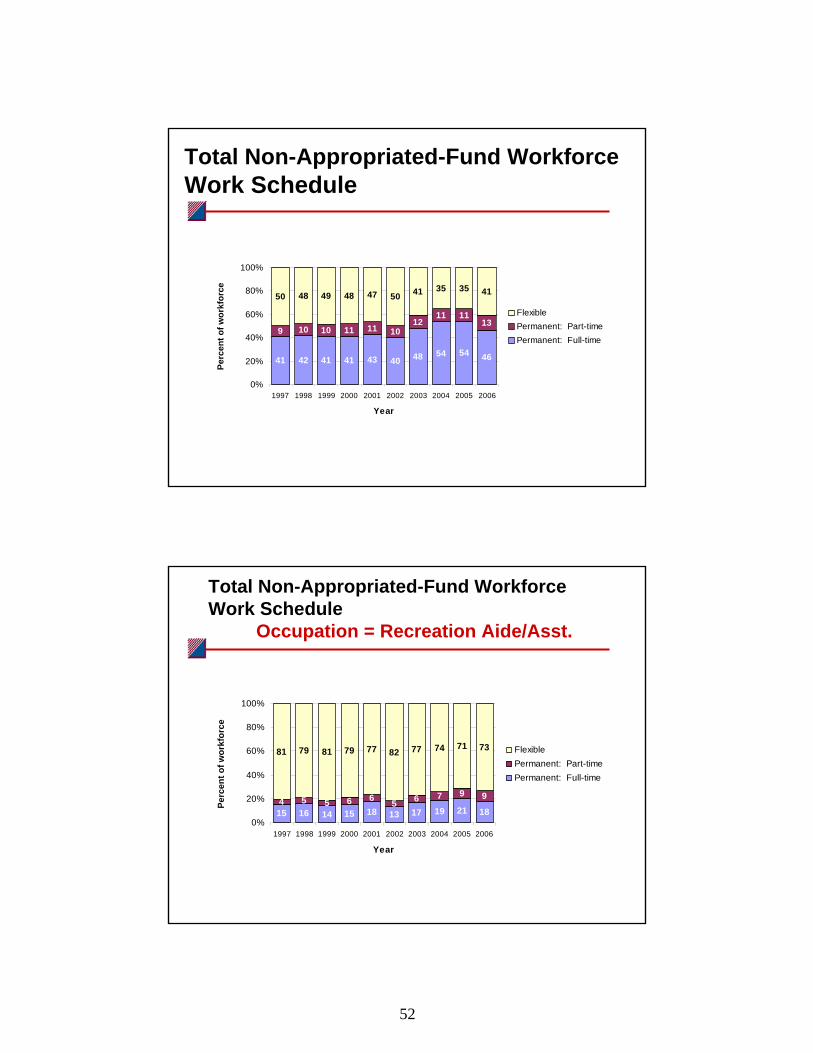
Work schedule – the percentage of the workforce classified as permanent/full-time, permanent/part-time, and flexible.
Collective bargaining status – the percentage of the workforce classified as unionized and not unionized.
Age group – the percentage of the workforce that falls into certain age groups.
Gender - the percentage of the workforce classified as male and female.
Citizenship status – the percentage of the workforce classified as U.S. citizen and not U.S. citizen.
41
MPIs for NAF Workforce Can Be Viewed by:• Occupation• Gender• Disability status (Disabled/Not Disabled)• Citizenship status
The available subsets for the NAF workforce are defined by the different values of the following variables:
Occupation – The occupation code for each employee submitted by the appropriate DoD agency consistent with standards set by OPM.
Gender – Indicates whether an employee is male or female.
Disability status – Indicates whether an employee is disabled. NAF does not gather information on the degree to which an employee is disabled, so this variable would equal 1 both for employees with a minor disability and for employees with a major disability.
Citizenship status – Indicates whether an employee is a U.S. citizen.
The rest of the brief will show examples of MPIs calculated for both the APF and the NAF workforce. An example of each available MPI will be shown for both the entire workforce and for a subset of the data. The MPIs for the APF workforce will be shown first, followed by the MPIs for the NAF workforce.

42
This page intentionally left blank
43
Appropriated-Fund Workforce
0
2,000
4,000
6,000
8,000
10,000
12,000
14,000
16,000
18,000
1996 1997 1998 1999 2000 2001 2002 2003 2004 2005 2006
Year
Num
ber o
f em
ploy
ees
Total APF EmployeesAPF General ScheduleAPF Federal Wage SystemAPF Other Pay Plan
Appropriated-Fund Workforce Location (UIC) = MCB Camp Lejeune
0200400600800
1,0001,2001,4001,6001,8002,000
1996 1997 1998 1999 2000 2001 2002 2003 2004 2005 2006
Year
Num
ber o
f em
ploy
ees
Total APF EmployeesAPF General ScheduleAPF Federal Wage SystemAPF Other Pay Plan
44
Appropriated-Fund Workforce Occupation Classification
0%5%
10%15%20%25%30%35%40%
Blue-Collar Administrative Clerical Professional Technical Other White-Collar
Occupation classification in years 1998 – 2006, 1 bar per year
Perc
ent o
f wor
kfor
ce
Appropriated-Fund Workforce Occupation Classification
Retirement eligible = Eligible for regular retirement
0%5%
10%15%20%25%30%35%40%45%50%
Blue-Collar Administrative Clerical Professional Technical Other White-Collar
Perc
ent o
f wor
kfor
ce
Occupation classification in years 1998 – 2006, 1 bar per year
45
Appropriated-Fund Workforce Supervisory Status
86 86 86 85 85 85 84 84 85 85 84
14 14 14 15 15 15 16 16 15 15 16
0%10%20%30%40%50%60%70%80%90%
100%
1996 1997 1998 1999 2000 2001 2002 2003 2004 2005 2006
Year
Perc
ent o
f wor
kfor
ce
Supervisor/ManagerNon-Supervisor
Appropriated-Fund Workforce Supervisory Status
Career Community = Administration
91 90 90 90 88 87 86 87 85 85 83
9 10 10 10 12 13 14 13 15 15 17
0%10%20%30%40%50%60%70%80%90%
100%
1996 1997 1998 1999 2000 2001 2002 2003 2004 2005 2006
Year
Perc
ent o
f wor
kfor
ce
Supervisor/ManagerNon-Supervisor
46
Appropriated-Fund Workforce Work Schedule
99.1 99.1 99.2 99.4 99.3 99.4 99.5 99.3 99.3 99.4 99.6
0.2 0.30.3
0.1 0.1 0.1 0.10.1 0.1
0.20.10.7 0.6 0.5 0.5 0.6 0.5 0.4 0.6 0.6 0.4 0.4
98%
99%
100%
1996 1997 1998 1999 2000 2001 2002 2003 2004 2005 2006
Year
Perc
ent o
f wor
kfor
ce
Part-timeIntermittentFull-time
Appropriated-Fund Workforce Work schedule
Race = African-American
99.2 99.1 98.9 99.199.3
0.70.5 0.6
0.50.2
0.10.4 0.5 0.4 0.4
98%
99%
100%
2002 2003 2004 2005 2006
Year
Perc
ent o
f wor
kfor
ce
Part-timeIntermittentFull-time
47
Appropriated Fund Workforce Collective Bargaining Status
12 13 12 13 14 16 17 18 18 17 17
68 67 67 66 65 63 62 60 60 60 59
20 20 21 21 21 21 21 22 22 22 23
0%10%20%30%40%50%60%70%80%90%
100%
1996 1998 2000 2002 2004 2006
Year
Perc
ent o
f wor
kfor
ce
Ineligible for inclusion inbargaining unitIn bargaining unit
Eligible but not in bargainingunit
Appropriated-Fund Workforce Collective Bargaining S
Veteran status = Veteran
7 8 8 8 9 11 13 14 14 14 14
75 74 73 72 72 70 68 66 65 64 63
18 19 19 20 19 19 19 20 20 22 23
0%10%20%30%40%50%60%70%80%90%
100%
1996 1997 1998 1999 2000 2001 2002 2003 2004 2005 2006
Year
Perc
ent o
f wor
kfor
ce
Ineligible for inclusion inbargaining unitIn bargaining unit
Eligible but not in bargainingunit
48
Appropriated-Fund Workforce Age Groups
0%5%
10%15%20%25%30%35%40%45%
30 years old oryounger
31 to 40 years old 41 to 50 years old 51 to 60 years old Over 60 years old
Perc
ent o
f wor
kfor
ce
Age group in years 1996 – 2006, 1 bar per year
Appropriated-Fund Workforce Age Groups 1996-2006
Veteran Disability Status = 30% Disabled
0%5%
10%15%20%25%30%35%40%45%50%
30 years old oryounger
31 to 40 years old 41 to 50 years old 51 to 60 years old Over 60 years old
Perc
ent o
f wor
kfor
ce
Age group in years 1996 – 2006, 1 bar per year
49
Appropriated-Fund Workforce Gender
64 64 64 65 65 65 65 65 66 66 66
36 36 36 35 35 35 35 35 34 34 34
0%10%20%30%40%50%60%70%80%90%
100%
1996 1997 1998 1999 2000 2001 2002 2003 2004 2005 2006
Year
Perc
ent o
f wor
kfor
ce
FemaleMale
Appropriated-Fund Workforce Gender
Occupation = Misc. Clerk/Assistant
19 18 20 23 24 24 23 28 27
81 82 80 77 76 76 77 72 73
0%10%20%30%40%50%60%70%80%90%
100%
1998 1999 2000 2001 2002 2003 2004 2005 2006
Year
Perc
ent o
f wor
kfor
ce
FemaleMale
50
Appropriated-Fund Workforce Ethnicity/Race
68 68 68 67 66
18 18 18 18 196 6 6 7 7
100 100 100 100 100 100
8 8 8 7 7
0%10%20%30%40%50%60%70%80%90%
100%
1996 1997 1998 1999 2000 2001 2002 2003 2004 2005 2006
Year
Perc
ent o
f wor
kfor
ce
Other/Not specifiedHispanicAfrican-AmericanWhite
Appropriated-Fund Workforce Ethnicity/Race
Gender = Male
70 70 70 69 68
16 16 16 16 177 7 7 8 8
100 100 100 100 100 100
8 8 7 7 7
0%10%20%30%40%50%60%70%80%90%
100%
1996 1997 1998 1999 2000 2001 2002 2003 2004 2005 2006
Year
Perc
ent o
f wor
kfor
ce
Other/Not specifiedHispanicAfrican-AmericanWhite
51
Total Non-Appropriated-Fund Workforce
02,0004,0006,0008,000
10,00012,00014,00016,00018,000
1997 1998 1999 2000 2001 2002 2003 2004 2005 2006
Year
Num
ber o
f em
ploy
ees
Total NAF EmployeesPay BandFWS - WorkerFWS - SupervisoryFWS - LeaderChildren & YouthNot applicable
Total Non-Appropriated-Fund Workforce Disability Status = Disabled
0100200300400500600700800900
1,000
1997 1998 1999 2000 2001 2002 2003 2004 2005 2006
Year
Num
ber o
f em
ploy
ees Total NAF Employees
Pay Band
FWS - Worker
FWS - Supervisory
FWS - Leader
Children & Youth
Not applicable
52
Total Non-Appropriated-Fund WorkforceWork Schedule
41 42 41 41 43 40 48 54 54 46
9 10 10 11 11 1012
11 1113
50 48 49 48 47 50 41 35 35 41
0%
20%
40%
60%
80%
100%
1997 1998 1999 2000 2001 2002 2003 2004 2005 2006
Year
Perc
ent o
f wor
kfor
ce
FlexiblePermanent: Part-timePermanent: Full-time
Total Non-Appropriated-Fund Workforce Work Schedule
Occupation = Recreation Aide/Asst.
15 16 14 15 18 13 17 19 21 184 5 5 6 6 5 6 7 9 9
81 79 81 79 77 82 77 74 71 73
0%
20%
40%
60%
80%
100%
1997 1998 1999 2000 2001 2002 2003 2004 2005 2006
Year
Perc
ent o
f wor
kfor
ce
FlexiblePermanent: Part-timePermanent: Full-time
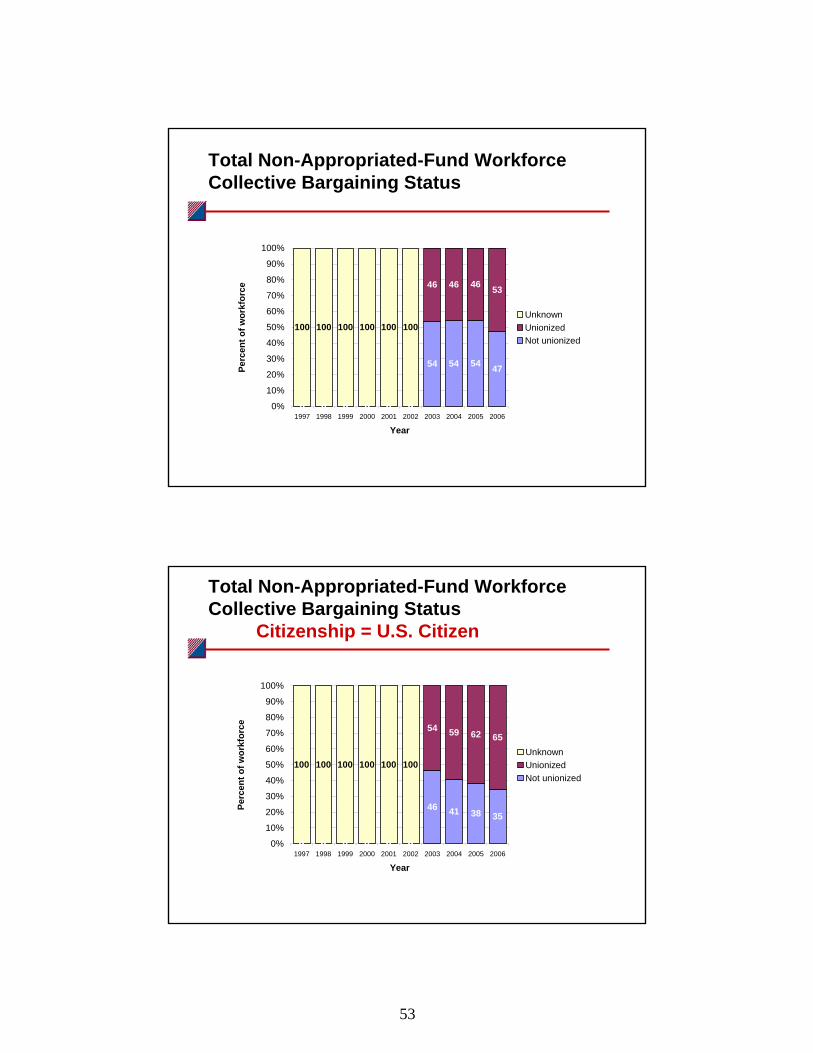
53
Total Non-Appropriated-Fund Workforce Collective Bargaining Status
0 0 0 0 0 0
54 54 54 47
0 0 0 0 0 0
46 46 46 53
100 100 100 100 100 100
0%
10%
20%
30%
40%
50%
60%
70%
80%
90%
100%
1997 1998 1999 2000 2001 2002 2003 2004 2005 2006
Year
Perc
ent o
f wor
kfor
ce
UnknownUnionizedNot unionized
Total Non-Appropriated-Fund Workforce Collective Bargaining Status
Citizenship = U.S. Citizen
0 0 0 0 0 0
46 41 38 35
0 0 0 0 0 0
54 59 62 65
100 100 100 100 100 100
0%
10%
20%
30%
40%
50%
60%
70%
80%
90%
100%
1997 1998 1999 2000 2001 2002 2003 2004 2005 2006
Year
Perc
ent o
f wor
kfor
ce
UnknownUnionizedNot unionized
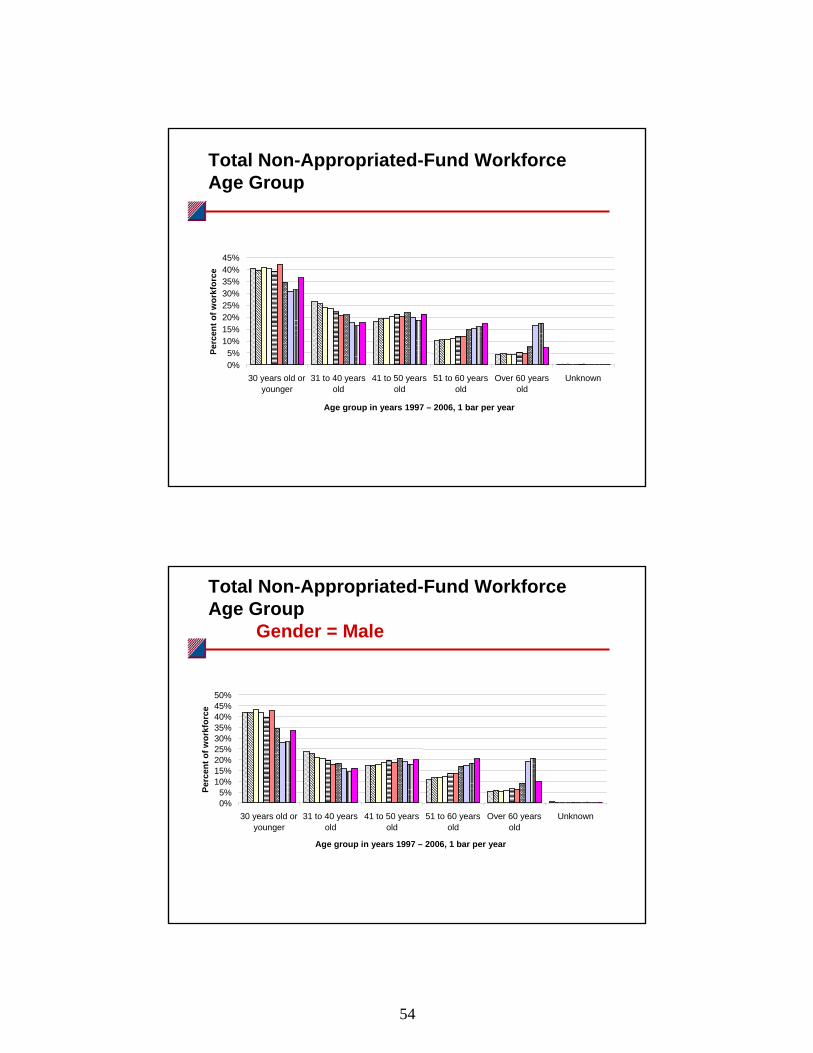
54
Total Non-Appropriated-Fund Workforce Age Group
0%5%
10%15%20%25%30%35%40%45%
30 years old oryounger
31 to 40 yearsold
41 to 50 yearsold
51 to 60 yearsold
Over 60 yearsold
Unknown
Perc
ent o
f wor
kfor
ce
Age group in years 1997 – 2006, 1 bar per year
Total Non-Appropriated-Fund Workforce Age Group
Gender = Male
0%5%
10%15%20%25%30%35%40%45%50%
30 years old oryounger
31 to 40 yearsold
41 to 50 yearsold
51 to 60 yearsold
Over 60 yearsold
Unknown
Perc
ent o
f wor
kfor
ce
Age group in years 1997 – 2006, 1 bar per year
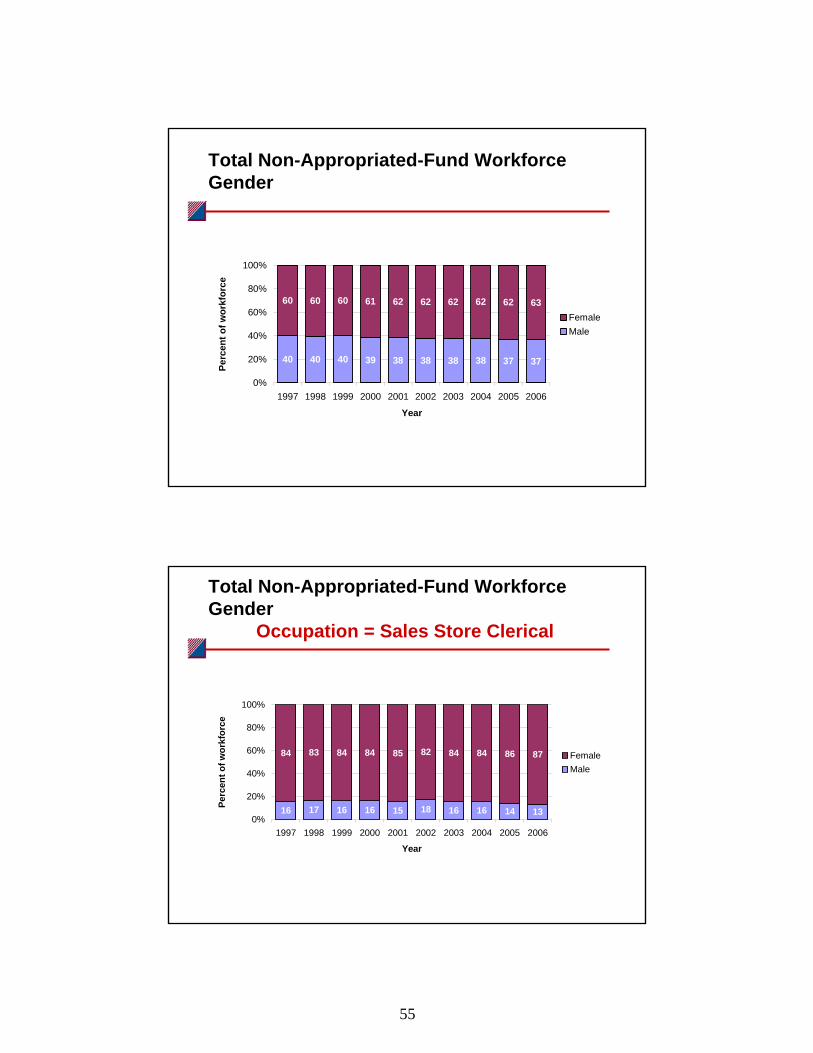
55
Total Non-Appropriated-Fund Workforce Gender
40 40 40 39 38 38 38 38 37 37
60 60 60 61 62 62 62 62 62 63
0%
20%
40%
60%
80%
100%
1997 1998 1999 2000 2001 2002 2003 2004 2005 2006
Year
Perc
ent o
f wor
kfor
ce
FemaleMale
Total Non-Appropriated-Fund Workforce Gender
Occupation = Sales Store Clerical
16 17 16 16 15 18 16 16 14 13
84 83 84 84 85 82 84 84 86 87
0%
20%
40%
60%
80%
100%
1997 1998 1999 2000 2001 2002 2003 2004 2005 2006
Year
Perc
ent o
f wor
kfor
ce
FemaleMale
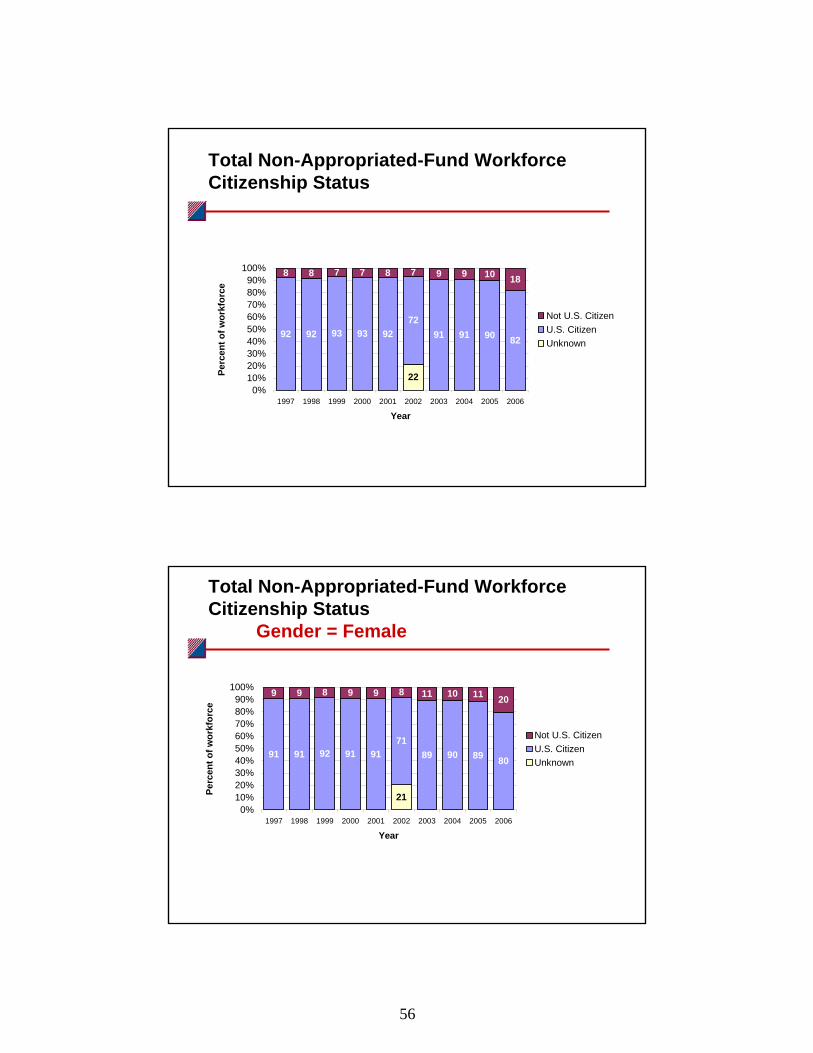
56
Total Non-Appropriated-Fund Workforce Citizenship Status
22
92 92 93 93 9272
91 91 90 82
8 8 7 7 8 7 9 9 10 18
0%10%20%30%40%50%60%70%80%90%
100%
1997 1998 1999 2000 2001 2002 2003 2004 2005 2006
Year
Perc
ent o
f wor
kfor
ce
Not U.S. CitizenU.S. CitizenUnknown
Total Non-Appropriated-Fund Workforce Citizenship Status
Gender = Female
21
91 91 92 91 9171
89 90 89 80
9 9 8 9 9 8 11 10 11 20
0%10%20%30%40%50%60%70%80%90%
100%
1997 1998 1999 2000 2001 2002 2003 2004 2005 2006
Year
Perc
ent o
f wor
kfor
ce
Not U.S. CitizenU.S. CitizenUnknown
57
MPIs for Civilian Marines -Summary• MPIs based on data gathered by DMDC• MPIs available separately for NAF and APF
workforces• MPIs can be viewed for entire NAF and APF
workforces as well as subsets of each workforce
The Manpower Performance Indicators (MPIs) for Civilian Marines that were covered in this brief should help the USMC to better monitor their civilian workforce. These MPIs allow the USMC to understand if and how the civilian workforce is changing both in terms of demographic characteristics and in terms of job characteristics. Furthermore, these MPIs can be monitored for specific subsets of the workforce. If one is interested in the civilian workforce at MCB Camp Lejeune, one can view the MPIs for only the civilian workforce there. If one is interested in a certain career community (such as the “Administration” career community), one can view the MPIs for that certain career community. One can also use the MPIs to become aware of how the civilian workforce may change in the future by monitoring the number of Civilian Marines who are retired military and the number of Civilian Marines who are eligible to retire.
CNA will supply the MI section of M&RA with both the DMDC data for the 1996–2006 time period as well as any recoding of that data. Updates can be obtained by MI from DMDC.
58
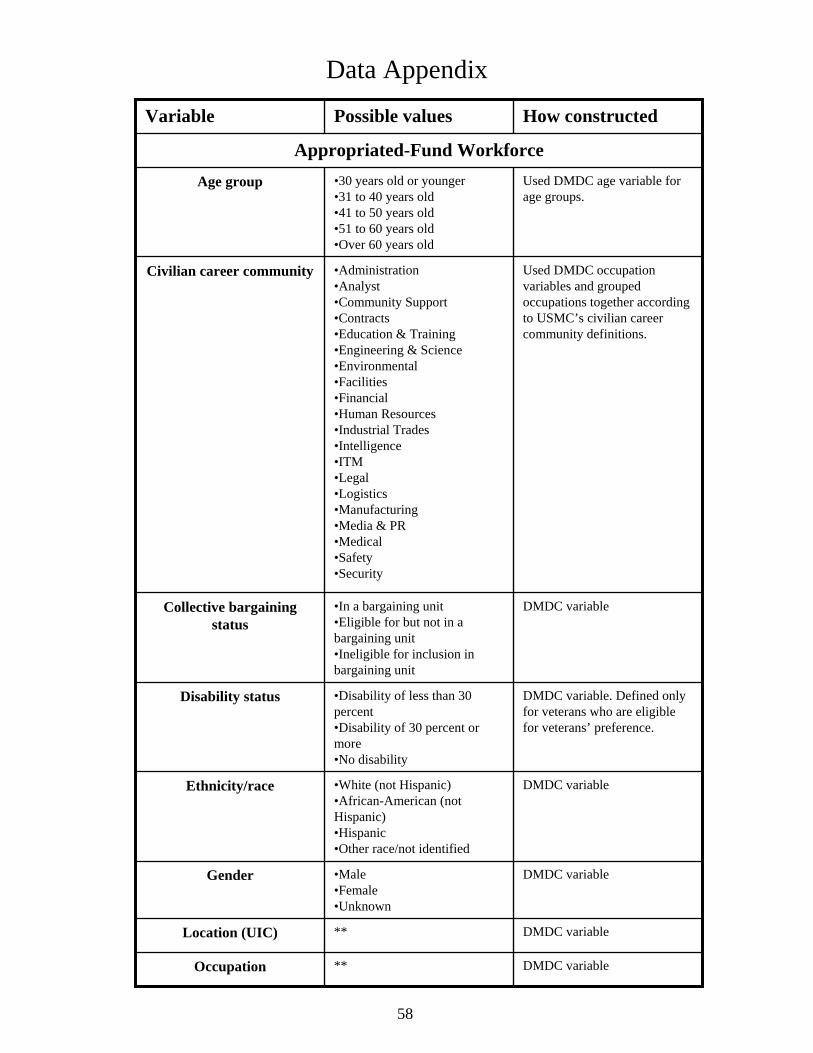
Data Appendix
Appropriated-Fund Workforce
DMDC variable**Occupation
DMDC variable**Location (UIC)
DMDC variable•Male•Female•Unknown
Gender
DMDC variable•White (not Hispanic)•African-American (not Hispanic)•Hispanic•Other race/not identified
Ethnicity/race
DMDC variable. Defined only for veterans who are eligible for veterans’ preference.
•Disability of less than 30 percent•Disability of 30 percent or more•No disability
Disability status
DMDC variable•In a bargaining unit•Eligible for but not in a bargaining unit•Ineligible for inclusion in bargaining unit
Collective bargaining status
Used DMDC occupation variables and grouped occupations together according to USMC’s civilian career community definitions.
•Administration•Analyst•Community Support•Contracts•Education & Training•Engineering & Science•Environmental•Facilities•Financial•Human Resources•Industrial Trades•Intelligence•ITM•Legal•Logistics•Manufacturing•Media & PR•Medical•Safety•Security
Civilian career community
Used DMDC age variable for age groups.
•30 years old or younger•31 to 40 years old•41 to 50 years old•51 to 60 years old•Over 60 years old
Age group
How constructedPossible valuesVariable

59
Data Appendix (continued)
Constructed using DMDC variables on work schedule and employment code.
•Permanent: Full-time•Permanent: Part-time•Intermittent
Work schedule
DMDC variable•Unionized•Not unionized
Collective bargaining status
DMDC variable•U.S. citizen•Not U.S. citizen
Citizenship status
Used DMDC age variable for age groups.
•30 years old or younger•31 to 40 years old•41 to 50 years old•51 to 60 years old•Over 60 years old•Unknown
Age group
Non-Appropriated-Fund Workforce
DMDC variable•Male•Female•Unknown
Gender
DMDC variable•Disabled•Not disabled
Disability status
DMDC variable**Occupation
Constructed using DMDC variables on work schedule and employment code.
•Permanent: Full-time•Permanent: Part-time•Flexible
Work schedule
Constructed using several DMDC variables per instructions in the DoD APF Civilian Personnel Master Edit File.
•Veteran•Not a veteran
Veteran status
DMDC variable•Managers/supervisors•Non-supervisors
Supervisory status
DMDC variable•Eligible for regular retirement•Eligible for early retirement•Not eligible for retirement
Retirement eligibility
DMDC variable•Retired military•Not retired military
Retired military status
DMDC variable•Blue-collar•White-collar: Administrative•White-collar: Clerical•White-collar: Professional•White-collar: Technical•White-collar: Other
Occupation classification
How constructedPossible valuesVariable
** This variable takes on too many values to list.

60
This page intentionally left blank.


CA
B D
0015
714.
A2/
Fin
al