Embed Size (px)
Citation preview

University of South CarolinaScholar Commons
Theses and Dissertations
2014
Mannequin Size on Consumers' Perception of Selfand Satisfaction with FitAmanda CohenUniversity of South Carolina - Columbia
Follow this and additional works at: https://scholarcommons.sc.edu/etd
Part of the Sales and Merchandising Commons
This Open Access Thesis is brought to you by Scholar Commons. It has been accepted for inclusion in Theses and Dissertations by an authorizedadministrator of Scholar Commons. For more information, please contact [email protected].
Recommended CitationCohen, A.(2014). Mannequin Size on Consumers' Perception of Self and Satisfaction with Fit. (Master's thesis). Retrieved fromhttps://scholarcommons.sc.edu/etd/2634

MANNEQUIN SIZE ON CONSUMERS’ PERCEPTION OF SELF AND SATISFACTION
WITH FIT
by
Amanda Cohen
Bachelor of Science
University of North Carolina at Greensboro, 2012
Submitted in Partial Fulfillment of the Requirements
For the Degree of Master of Retailing in
Retailing
College of Hospitality, Retail and Sports Management
University of South Carolina
2014
Accepted by:
Deborah Brosdahl, Director of Thesis
K. Annette Burnsed, Reader
Joohyung Park, Reader
Lacy Ford, Vice Provost and Dean of Graduate Studies

ii
© Copyright by Amanda Cohen, 2014
All Rights Reserved.

iii
ACKNOWLEDGEMENTS
I would like to graciously thank my advisor Dr. Deborah Brosdahl, who has
supported and guided me throughout my graduate studies at the University of South
Carolina. I would also like to thank my other committee members Dr. Joohyung Park and
Dr. K. Annette Burnsed. Thank you for taking the time to help me understand consumer
behavior and research design, as well as for the encouragement and motivation to
succeed.
I would not be where I am today without the love and support from my parents.
They have continuously supported me and encouraged me to be the best I can be. I am
especially thankful for my unofficial committee member, Dr. Janice K. Janken, also
known as my mother. She was my statistics teacher, advisor, motivator, and mother
compiled into one, and for that I am truly thankful. Finally, a special thanks to AJ Dance
for being my support system in Columbia, S.C. and for his tremendous support as he
made the rough days better and good times more enjoyable.

iv
ABSTRACT
This study examines the influencing factors that affect females’ perceptions
towards mannequins in retail environments. Data was collected using an online survey
through the use of a snowball convenience technique. A total of 316 respondents were
included. Results indicate that the use of idealized mannequins in retail stores have a
significant impact on social comparison, body dissatisfaction, and satisfaction of fit for
female consumers. These results suggest that female consumers compare their bodies to
those of mannequins and the larger the discrepancy between the size of the mannequin
and the woman, the more dissatisfied the woman is with the fit of clothing.

v
TABLE OF CONTENTS
ACKNOWLEDGEMENTS ........................................................................................................ iii
ABSTRACT .......................................................................................................................... iv
LIST OF TABLES ................................................................................................................. vii
LIST OF FIGURES ............................................................................................................... viii
CHAPTER 1: INTRODUCTION ..................................................................................................1
CHAPTER 2: REVIEW OF LITERATURE ...................................................................................5
VISUAL MERCHANDISING ..........................................................................................5
SOCIOCULTURAL THEORY AND
SOCIAL COMPARISON THEORY............................................................................11
BODY IMAGE ...........................................................................................................18
BODY CATHEXIS ......................................................................................................20
SATISFACTION OF FIT...............................................................................................22
CHAPTER 3: METHODOLOGY ..............................................................................................26
QUESTIONNAIRE DEVELOPMENT .............................................................................26
POPULATION AND SAMPLE ......................................................................................33
QUESTION DISTRIBUTION ........................................................................................33
CHAPTER 4: ANALYSIS ........................................................................................................34
SAMPLE INFORMATION ...........................................................................................34
SOCIAL COMPARISON ..............................................................................................37
vi
BODY DISSATISFACTION .........................................................................................38
SATISFACTION OF FIT ..............................................................................................41
PERCEPTIONS OF MANNEQUINS ..............................................................................43
CHAPTER 5: DISCUSSION .....................................................................................................44
SOCIAL COMPARISON ..............................................................................................44
BODY DISSATISFACTION .........................................................................................46
SATISFACTION OF FIT ..............................................................................................47
CONCLUSION ...........................................................................................................49
LIMITATIONS AND RECOMMENDATIONS..................................................................55
REFERENCES .......................................................................................................................52
APPENDIX A – SURVEY .......................................................................................................58
APPENDIX B – IRB APPROVAL ...........................................................................................67

vii
LIST OF TABLES
Table 3.1 Social Comparison Questions Part 1 .................................................................27
Table 3.2 Social Comparison Questions Part 2 .................................................................28
Table 3.3 Body Dissatisfaction Questions Part 1 ...............................................................29
Table 3.4 Body Dissatisfaction Questions Part 2 ...............................................................30
Table 3.5 Satisfaction of Fit Questions ..............................................................................31
Table 4.1 Summary of Respondent’s Age and Ethnic Background ..................................35
Table 4.2 Respondents Clothing Size ................................................................................36
Table 4.3 BMI ....................................................................................................................36
Table 4.4 BMI and Social Comparison: Individual vs Mannequins ..................................38
Table 4.5 Body Dissatisfaction ..........................................................................................39
Table 4.6 Perceived Difference between Actual Body Shape
and Mannequin Body Shape ..................................................................................41
Table 4.7 Satisfaction of Fit ...............................................................................................42
Table 4.8 Clothing on Thin Mannequins ...........................................................................43

viii
LIST OF FIGURES
Figure 3.1 Mannequin and Body Parts ..............................................................................32

1
CHAPTER 1
INTRODUCTION
The ideal body size of the American woman has been documented to be impacted
by unrealistic images portrayed through the advertised images of stick-thin models in
print and broadcast media and mannequins used in brick-and-mortar stores (Bessenoff,
2006). The introduction of mannequins as a way to display clothing has been a part of
clothing display in brick-and-mortar stores for centuries. In 1997, Schneider documented
the history of the mannequin and its use in today’s retail stores. According to Schneider,
the first form originated in the mid-eighteenth century when dressmakers would use a
steel replication of a customer’s measurements to fit clothing. However, it wasn’t until
the late 1940’s to early 1950’s when mannequins began to take their modern form as the
development of plastics made it possible for detailed body sculpting (Schneider, 1997).
At this time, female mannequins had tightly pinched waists, full hips, and large busts,
while male mannequins had an athletic build, a v-shaped silhouette, and hair combed
back. When Christian Dior introduced his “New Look” collection featuring an ultra-
feminine, full-skirted runway shows took on the image of a typical mannequin of the
1950’s with small waists, full hips, and large busts, but critics of this look stated the
models looked unrealistic (Schneider, 1997).
Schneider contends that it was at this point in history that the idealized body form
for the Western-world woman was created: taller than average, thinner than average and

2
yet still evenly proportioned. Martha Landau, a popular designer in 1973 tried to
persuade Wolf & Vine, a manufacturer of mannequins, to make larger mannequins
resembling real women; the response from the manufacturer was “Inside every fat
woman is a thin woman trying to get out, our mannequins are what every large girl would
like to be: beautifully proportioned, and clothes simply look better on taller, thinner
figures” (Schneider, 1997, p. 11).
In today’s society, industry standard mannequins are a woman’s size 2, although
the average American woman’s body size is growing (Kim & Damhorst, 2010). These
size 2 mannequins are based on typical fashion models in today’s society, who are a
typical size 0-2 and weighing 23% less than the average woman in the U.S. (weighing
162.9 pounds) and wearing a size 14 (Vesilind, 2009).
Body image has been shown to impact consumer behavior in shopping (Garner &
Kerney-Cooke, 1996). Research has shown that many women suffer from body image
self-discrepancies (Vartanian, 2009). These self-discrepancies occur when a person’s
actual attributes do not match the attributes ideal attributes assigned by society. Such self-
discrepancies have been shown to be associated with negative emotions such as body
dissatisfaction and disappointment (Higgins, 1987).
Social comparison occurs when one compares an idealized body to the actual
body, (Posavac & Posavac, 2002). Thus, social comparison theory can be used to explain
how people might explain the apparent deficiencies between the idealized-self versus the
actual-self and also can be useful to explain how it might affect consumer behavior in
brick-and-mortar stores with regard to consumers comparing their body size to store
mannequins’ body size. The purpose of using mannequins in retail stores to display

3
clothing serves to show consumers how the clothing might look on the human body.
Therefore, a consumer may be drawn to the clothing itself, the way the clothing looks on
the mannequin, or the mannequin whether it be to imitate the poise, stature, or grace of
the mannequin (Schneider, 1997).
Visual merchandising has been demonstrated to be a key element in consumer
behavior. Brick-and-mortar stores are constantly changing their visual merchandising to
keep the customer interested. Mannequins are a key component in visual merchandising
helping a retailer communicate product cues to the consumer, and oftentimes, keeping a
customer’s interest. Mannequins are located in store windows and throughout stores to
help attract customers into stores, allowing retailers to present their newest items on a
human form thereby letting customers picture themselves in those clothes. An idealized
body shape is symbolized through mannequins and when the clothing displayed on the
mannequin fits the customer differently or poorly, customers may experience any number
of feelings because they do not match the appearance projected by the mannequin.
Although using mannequins to display a store’s products is a decades-old practice
and used by every major retailer in the world, the idea that mannequin size can impact
consumers’ feelings towards their body image and their satisfaction with fit is largely
unexplored as a topic of research. However this phenomenon is becoming important to
today’s fashion industry with the notion of the ideal body making its way into the media.
Previous research has noted that the media are responsible for creating the Westernized
image of the female body as being very tall and thin (Bessenoff, 2006).
There have been a number of research studies investigating how the idealized
body image in media and advertising impacts social comparison among females, however

4
no research has yet explored to what extent comparisons of mannequins to a customer’s
self may impact behavior (Bessenoff, 2006; Kim & Lennon, 2007; Tiggemann & McGill,
2004; Richins, 1991). Using Social Comparison Theory as a framework, this study will
explore perception of mannequin size, the relationships between body image and
mannequins, how consumers’ satisfaction with fit of clothing is impacted by the use of
mannequins, as well as how consumers’ perceive their own body image and how this
may impact satisfaction of fit after looking at a mannequin displaying clothing.

5
CHAPTER 2
REVIEW OF LITERATURE
VISUAL MERCHANDISING
Visual merchandising is one aspect of the shopping environment that many
retailers have deemed an important component in customer evaluation of brick-and-
mortar stores, yet this area of research has received little attention in the academic
literature. Ultimately, visual merchandising is how the product and brand is visually
communicated to the consumer and also whether the message is accurately decoded by
consumers to persuade them into buying the product (Kerfoot, Davies & Ward, 2003).
The use of visual merchandising is about making the customer feel how the retailer wants
them to feel. A good retailer will properly identify a target market and display products to
appeal to that market, with the understanding that the customer is vital (Jain, Sharma, &
Narwal, 2012). Visual merchandising can be composed of both exterior and interior
displays with exterior display including window displays, exterior advertising including
signage as well as the exterior appearance of the retail store. Interior display consists of
merchandise displays, point-of-sale displays, and architectural displays (Kerfoot et al.,
2003). The aspect of visual merchandising about which this paper will be focusing is the
use of mannequins which can fall into both exterior (as in the case of store windows) as
well as interior displays.

6
Mannequins
In 1997, Schneider documented the history of the mannequin and its use in
today’s retail stores. According to Schneider (1997), the first form originated in the mid-
eighteenth century when dressmakers would use a steel replication of a customer’s
measurements to fit clothing. However, it wasn’t until the late 1940’s to early 1950’s
when mannequins began to take their modern form when the development of plastics
made it possible for detailed body sculpting (Schneider, 1997). At this time, female
mannequins had tightly pinched waists, full hips, and large busts, while male mannequins
had an athletic build, a v-shaped silhouette, and hair combed back. It was at this point
that people were styled to look like mannequins rather than mannequins being styled to
look like average people. This concept exploded when Christian Dior introduced his new
collection featuring the ultra-feminine, full-skirted New Look. The models used in Dior’s
runway shows took on the image of a typical mannequin of the 1950’s with small waists,
full hips, and large busts, with critics of this look stating that the models looked
unrealistic (Schneider, 1997). It was at this point in history that the idealized body form
for the Western world woman was solidified as being taller than average, thinner than
average and yet still evenly proportioned.
In today’s society, mannequins have stayed the same, with a woman’s size 2
being the industry standard, although the average American woman’s body size gotten
larger through the years (Kim & Damhorst, 2010). These size 2 mannequins are based on
a typical fashion model in today’s society who usually wears a size 0 - 2 and weighs 23%
less than the average woman. This contrasts with the average female in the U.S. who
weighs 162.9 pounds and wears a size 14 (Vesilind, 2009).

7
A mannequin is a model of the human body used by retailers to demonstrate their
products, designed especially to show how clothing items should be worn and how it
should sit on the body (Jain et al., 2012). Mannequins can be placed in windows as well
as throughout the interior of a store to create cues that allow consumers to better visualize
how clothes will look on their body. Mannequins are also used to show how to mix and
match colors, garments and accessories (Sen, Block, & Chandran, 2002). Mannequins
can generate a positive response from customers because of the ability to visually see the
clothing offered allowing the customer to get a mental picture of the store brand (Kerfoot
et al., 2003). In a study conducted in Hong Kong, Chan and Chan (2008) found that
mannequins that are dressed well may lead the customer to stay in the store longer, which
then can lead to a greater chance of the customer making a purchase, and may ultimately
lead to a customer feeling happiness and enjoyment. Mannequins have also been found to
provoke feelings of pleasure and arousal which may help raise the degree of wear-ability
in the minds of consumers (Law, Wong, & Yip, 2012).
In a study exploring the impact of visual merchandising, Jain et al. (2012) found
that 42% of women chose the store to shop in based on eye-catching window displays. In
the study it was found that women give a lot of attention to what is displayed on the
mannequins and approximately 45% of the women surveyed said they get ideas of what
to buy only after looking at the mannequin displays. Overall, the findings of this research
suggest the importance of mannequin displays especially to female consumers and that
mannequins should be visually appealing to attract customers into the store (Jain et al.,
2012).

8
In a study by Sen et al., (2002), it was found that clothing retailers would be more
successful in attracting customers into the store if they focused on communicating cues
that allow consumers to infer fit. As clothing retailers usually use mannequins with
idealized, rather than average, body-types, Sen et al., (2002) suggest that in order to
communicate fit with the targeted customer it would be better to use life-like mannequins
that more closely reflects the dimensions and proportions of the store’s major target
market. Anitha and Selvaraj (2010) conclude that people can envision themselves in
outfits worn by mannequins only if they can relate to the mannequin, further suggesting
that customers have a hard time conceptualizing themselves with idealistically-sized
mannequins. Law et al,, (2012) found that using mannequins with natural body shapes
can decrease the perception that only a person with an ideal body shape is attractive and
that garments only look good on a person who is an unrealistic size.
In a study by Law et al., (2012) mannequins were manipulated with regard to
heavy make-up, the ideal Size 2 body size, and seductive body gestures while wearing
intimate apparel. These mannequins were displayed in windows to attract customers into
the store. One of the participants in the study stated “Those mannequins’ body shapes
look unreal to me, I don’t see how I will look good in those lingerie styles” (Law et al.,
2012, pg.119). Another participant stated “I feel that there is a long conceptual distance
between my body shape and those in the window display” (Law et al., 2012, pg.120). The
authors conclude that mannequins with a body shape and proportion that is very similar
to consumers tend to leave a better impression on consumers. They also found that
headless mannequins allow consumers to put themselves into the display and imagine
themselves in the featured garments. They also found that Asian customers preferred a

9
feminine and subtle image, did not like sexy visual displays, and felt there was a great
perceptual distance between the body figure of mannequins and their own (Law, Wong,
& Yip, 2012).
In a recent interview by the author of this study (Neuhaus, 2013), Salina Neuhaus,
vice president of sales and account services for MCG, a merchandising company located
in the United States, with experience in visual merchandising and the use of mannequin
displays in a variety of stores, discussed how clothing displayed on mannequins sell the
fastest. She stated “you can put a towel on the mannequin, spice it up with some
accessories and that outfit is the hottest commodity” (Neuhaus, 2013). She also talked
about the importance of mannequins connecting to the customer. In all of her work with
visual merchandising, Neuhas (2013) said she has always worked with size 4
mannequins. When asked if she thought using an average Western-sized mannequin
would help the customer relate to the mannequin she had conflicting opinions. On one
hand, Neuhaus (2013) said as a customer she would like to see how clothing looks on an
average-sized mannequin. On the other hand, from a retailer stand point, she did not
think it would be attractive or able to appeal to the customer (Neuhaus, 2013).
Hazen (1998) pointed out that clothing manufacturers traditionally use an
idealized size as their fit model which is a three-dimensional form that represents the
figure type of the target market--much like a mannequin. However the problem is that
very few consumers are built like the perfect body form, and this helps explain the
difficulty experienced by consumers in finding well-fitting clothing. Brown (1992)
discussed visiting a designer’s studio and seeing a line of mannequins from a size 6 to a
22. She said, “The thing that fascinates me about these dress forms is that the size 22

10
didn’t have a tummy, I still haven’t figured out how someone can be a size 22 and not
have some sort of tummy unless she is seven feet tall” (p. 22).
The first retailer to acknowledge that they need to fit the size of their target
female customer is Debenhams, the U.K.’s third-largest department store (Bishop, 2013).
Debenhams announced in November 2013 that they would be releasing size 16
mannequins (equivalent to a size 14 in the United States) in 170 of their stores before
Black Friday (Bishop, 2013). The dress size of the average British woman has grown
from a 12 to a 16 (equivalent to sizes 10 to 14 in the United States) in just over a decade
(Barnett, 2013). Isabel Vavill, an apparel and luxury analyst at Planet Retail told CNBC
that “recognizing that women’s average size has increased is a clever move; shops that
still use size 10 (size 6 in U.S.) mannequins- such as Marks and Spencer- are not
reflecting the real market” (Bishop, 2013). Recent research in the U.K. revealed that
women are three times more likely to buy clothes when the fashion models are their size
(Bishop, 2013). Jo Swinson, stated “women are fed a diet of images which suggest that
there is only one way to look great- and that is to be very slim, white and young. That is
the look which is pushed onto all women, regardless of their body shape or age. It is
reinforced from the catwalks right through to shop mannequins- which is why I support
Debenhams’s decision” (Barnett, 2013). Although it appears that some European
countries are leaning toward making their customers feel comfortable about their bodies
(Bishop, 2013), to date there been not documented discussion of this occurring in the
United States.

11
SOCIOCULTURAL THEORY AND SOCIAL COMPARISON
Social comparison has been a topic of interest by many researchers because of the
impact it has on self-evaluation, body image, and how the media is increasing exposure to
ideal body forms. Social comparison is the act of comparing one’s attributes to another’s
attributes that they find to be superior to their own (Festinger, 1954). Both society and
culture impact the way consumers perceive themselves (Bessenoff, 2006). According to
Jones and Buckingham (2005) socio-cultural norms are stemmed from social comparison.
Criticism of the media for creating idealist images of the body is not a new
phenomenon in society. Theorists and researchers alike have suggested that body
dissatisfaction is influenced by sociocultural norms for ideal appearance particularly
directed at women. “These norms convey the message that women are valued for their
bodies and appearance, that standards for attractiveness are very high, and that it is
reasonable to measure one against, and strive for, such standards” (Strahan et al., 2008 p.
288). It has been found that preferences for specific female body sizes are believed to be
learned in social and cultural contexts (Markey, Tinsley, Ericksen, Ozer, & Markey,
2002). As such two theories help explain the impact that both media and others have on a
person’s body image: sociocultural theory and social comparison theory.
Sociocultural Theory
Sociocultural Theory states that “women's dissatisfaction with their physical
appearance stems from: (1) the thin body ideal that is promulgated in Western societies;
(2) the tendency for women to adopt a "body as object" rather than "body as process"
orientation; and (3) the thin is good assumption which emphasizes the rewards that are
accrued by being attractive (i.e., thin) and, concomitantly, the costs that are associated

12
with being unattractive (i.e., fat)” (Morrison, Kalin, & Morrison, 2004, p. 572). This
theory also contends that as exposure to mass media containing idealistic representations
of the body increases, body-image evaluation becomes less favorable (Morrison et al.,
2004).
One of the tools through which women internalize social standards of
attractiveness is through media representations and messages of women about
attractiveness (Seock & Merritt, 2013). Tiggemann (2004) stated that “current societal
standards for female beauty inordinately emphasizes the desirability of thinness, an ideal
accepted by most women but impossible for most to achieve” (p. 29). Seock and Merritt
(2013) assert that women’s body dissatisfaction and lower body esteem stems from the
thin body ideal prevalent in the Western society. As such, society’s conceptualization of
an ultrathin female body ideal as portrayed in mass media impacts the way a woman
views her own body.
Previous research has found that exposure to media depictions of the thin ideal
can have damaging effects on women (Groesz, Levine, & Murnen, 2002; Bessenoff,
2006). One study suggests that the sociocultural norms for appearance have a significant
impact on women’s dissatisfaction with their bodies and the extent to which they are
concerned with other people’s perceptions of them (Groesz et al., 2002). Additionally,
exposure to images reflecting these norms led women to base their self-worth more
strongly on their appearance, which in turn led them to feel less satisfied with their bodies
and more concerned with others’ opinions (Strahan et al., 2008). Stice and Shaw (1994)
found that the more females are exposed to media containing a high proportion of ideal
body images, the more likely they were to experience body dissatisfaction, negative

13
moods, and weight regulatory thoughts. Another study by Posavac, Posavac, and Posavac
(1998) found that media exposure to body shape ideals is related to weight concerns,
body dissatisfaction and disordered eating behavior. This study will look at look two
variables- thin body ideal and thin is good which can be applied to the use of idealized
body of mannequins.
Thin body ideal
The media is responsible for the idealized images of beauty in society (Bessenoff,
2006). Research has found that visual media such as fashion magazines and television
advertising use young, tall, and extremely thin women to epitomize the current beauty
ideal (Tiggemann & McGill, 2004). The current standard of attractiveness for U.S.
women portrayed in the media is slimmer than it has been in the past and has now
reached a size that is unattainable to most (Kim & Lennon, 2007). On average, American
women under 30 have become heavier, while media images of women have
simultaneously become thinner (Morrison, Kalin, & Morrison, 2004). Stice and Shaw
(1994) observed that when college women were exposed to attractive images from
magazines, respondents reported feeling less confident, more depressed, more ashamed,
and more dissatisfied with their bodies than those who were not exposed to the attractive
images. This supports a finding by Richins (1991) who found that fifty percent of
respondents said that when they see clothing ads using models with ideal body sizes they
compare themselves to the models and that this makes them feel dissatisfied with the way
they look (Richins, 1991). In another study (Owen & Spencer, 2013) differences between
a healthy model and thin model in ads were shown to female respondents. It was found
that individuals had a more positive affect after viewing healthy weight models whereas

14
seeing a thin model in media led to more weight-regulatory thoughts and dissatisfaction
with their own bodies. Yet, to date no research has investigated consumers’ perceptions
and attitudes toward mannequins with idealized figures and unrealistic body proportions
and what role these may have on a woman’s self-evaluation.
Thin is good
Few studies have explicitly examined the ways in which mass media promote the
view that what is thin is good, however many retailers continue to use the idealized this
body image in advertisements and store merchandising. One report found that
advertisements featuring thin models made women feel better about the brands being
displayed yet this study did not look at how other sizes might affect respondents’
perceptions of the advertisements (Dittmar, 2005). Another study investigating print
media’s influence on consumer influence found that the use of overweight models made
the brand being advertised seem dull and unappealing, in turn causing female shoppers to
disassociate with that brand (Aagerup, 2011). Again, to date there have been no studies
investigating how thinness as seen in mannequins may influence or impact a consumer’s
perception of themselves.
Sociocultural Theory is one of the most recognized theories used to explain the
development of body dissatisfaction and notes that social interaction plays a fundamental
role in how people perceive themselves (Seock & Merritt, 2013). Sociocultural Theory is
often associated with Social Comparison Theory which concerns the dissatisfaction a
person feels when they compare their body to another person’s body (Stormer &
Thompson, 1996).

15
Social Comparison Theory
Social Comparison Theory is based on the premise that people often compare
their own attributes to another’s person’s attributes (Festinger, 1954). Over the past 50
years, research involving social comparison has evolved yet all of the research supports
three basic ideas including (a) people frequently compare themselves to others on
dimensions including physical attractiveness, (b) people compare themselves to others of
higher standing (upward comparison) as well as those of lower standing (downward
comparison), and (c) social comparisons shape self-evaluations and mood (Jones &
Buckingham, 2005).
Two of the basic ideas represented in social comparison theory involve upward
and downward comparison. Upward comparison occurs when women evaluate their
appearance in contrast to women who they perceive to be superior to them (Bessenoff,
2006; Vartanian & Dey, 2013). An example of this would be women comparing
themselves to thin mannequins seen displaying clothing in brick-and-mortar stores.
Research suggests that social comparisons based on physical appearance tend to be
upward comparisons (Morrison, Kalin, & Morrison, 2004). Upward comparisons have
been found to increase body dissatisfaction (Bessenoff, 2006; Vartanian & Dey, 2013).
Downward comparison occurs when women are exposed to less attractive images thereby
causing the women to have more positive self-evaluations (Bessenoff, 2006; Vartanian &
Dey, 2013).
Many researchers have used Social Comparison Theory as a framework for
studies investigating the effects of media exposure on women. Research has shown that

16
advertising affects consumers because they often compare themselves with the idealized
images portrayed in ads. This has been found to be especially true with regard to women
who will often compare themselves to women in advertisements (Richins, 1991). In his
study, Richins (1991) found that women compare their physical appearance to models in
magazine advertisements causing women to negatively evaluate their attractiveness
(Richins, 1991). When women compare themselves to an image showing physically
attractive women, it often represents an upward social comparison as viewers will often
find themselves lacking in certain physical attributes, thus leading to negative moods and
body dissatisfaction (Tiggemann & McGill, 2004). Most studies on the effects of social
comparison on body image have found that thinness is only one component of physical
attractiveness (Groesz et al., 2002; Halliwell & Dittmar, 2004). Previous studies on social
comparison and physical attractiveness have not based attractiveness solely on size;
rather, attractiveness has also been based on facial features, skin, hair, and body
(Bessenoff, 2006; Richins, 1991; Tiggemann & McGill, 2004; Vartainian & Dey, 2013).
In all of the previously mentioned studies, women were the main focus of social
comparison because it has been shown that women are more likely than men to have
body image or weight concerns and this has been found to cross over cultural boundaries
(Jones & Buckingham, 2005; Martin & Kennedy, 1993; Richins, 1991; Tiggemann &
McGill, 2004).
Body Mass Index and Social Comparison
In recent years, it has been documented that the media has portrayed the ideal
Western woman’s body, such as those exhibited by fashion models, is tall and thin with a
height of 5’10 and a weight of 110 pounds (Jones & Buckingham, 2005) and has a

17
waistline of 24 inches which would be approximately an American size 2 (Halliwell &
Ditmar, 2004). These measurements contrast with the average American woman who is
5’3, weighing 162 pounds (Jones & Buckingham, 2005) and having a waistline of 32
inches and is a size 14 (Halliwell & Ditmar, 2004).
Body mass index (BMI) is a measure for human body shape based on the
individual’s height and weight (Terzieff, 2006). BMI does not measure body fat directly,
but it is used as an indicator of the amount of body fat for most people. Therefore,
measurements of the idealized Western woman’s body such as exhibited by fashion
models and mannequins with the same dimensions (given above) would have a Body
Mass Index (BMI) of 16.3. This is compared to the average American woman with the
measurements as stated above who would have a BMI of 28.7.
A number of studies have found that a female’s BMI is a strong predictor of her
overall body dissatisfaction and is an important factor in the development of body image
(Jones & Buckingham, 2005; Kostanski & Gullone, 1998; Seock & Merritt, 2013; Stice
& Whitenton, 2002). One study found that women of all ages invest time and effort into
their appearance and the choice of clothing is the biggest variable in appearance
(Tiggemann & Lacey, 2009). In this study, the authors found a link between body image
and BMI. The larger the woman’s BMI the more likely she was to be dissatisfied with her
body and overall more dissatisfied with the fit of clothing. It was also found the women
with a higher BMI avoided shopping for clothing because brick-and-mortar stores tend to
emphasis the size of a customer (Tiggemann & Lacey, 2009).
Although a healthy weight-for-height ratio does not guarantee a positive self-
image, being overweight or obese is a major risk factor associated with negative body

18
image or body dissatisfaction (Jones & Buckingham, 2005; Seock & Merritt, 2013).
Mannequins are modeled after this idealized body size and BMI. Although there has been
no prior research on women comparing their body size to mannequins in a retail setting,
based on previous literature, the following hypotheses will be tested.
H1 (a): The higher the women’s BMI, the more likely she is to experience upward
social comparison to other females.
H1 (b): The higher the women’s BMI, the more likely she is to experience upward
social comparison to female mannequins.
BODY IMAGE
Body image has an effect on consumer behavior (Higgins, 1987) and is
determined by feelings of satisfaction or dissatisfaction with one’s body, including
feelings about specific body parts and feelings about body weight (Lennon, Lillethun &
Buckland, 1999). Research has shown that many women suffer from body image self-
discrepancies (Vartanian, 2009). These self-discrepancies occur when a person’s actual
attributes do not match the attributes that others think are ideal (Higgins, 1987).
Higgins (1987) developed the Selves Questionnaire where participants were asked
to list descriptive attributes about themselves and how they think others would describe
their attributes. However, the Selves’ Questionnaire did not test actual physical
appearance (Higgins, 1987). Since then other assessments have been formulated, the most
common assessment depicting drawings of different body shapes and asking women to
pick a drawing that represents their actual shape and their ideal shape (Vartanian, 2009).
Using this self-discrepancy assessment tool, psychologists concluded that most women
choose a larger body shape for their actual self and always choose a smaller body shape

19
for their ideal self (Vartanian, 2009). There is evidence showing that wanting an ideal
body that is thinner than the person’s current body is associated with greater body image
self-discrepancies (Vartanian, 2009). Therefore, the following hypothesis will be tested:
H2: The greater the woman’s perceived discrepancy between her body and the
mannequin’s body, the more likely she is to associate thin body sizes as the ideal
body size.
Research has shown that women with high levels of body image self-
discrepancies experience higher levels of agitation, low self-esteem, and depression after
viewing media that portrays the ideal body (Bessenoff, 2006). In a study by Tiggemann
and McGill (2004), results indicated that even a brief exposure to thin female models
induced greater weight concern, body dissatisfaction, self-consciousness, negative mood,
and decreased perception of one’s own attractiveness. Bessenoff (2006) found that
women with high body image self-discrepancies are more than two times as likely to
compare themselves to women in the media who possess an idealized body image,
thereby leading to weight-regulatory thoughts (Bessenoff, 2006).
Body image and self are inescapably linked (Secord & Jourard, 1953). In a study
of body image by Garner and Kerney-Cooke (1996), a survey with 3,500 women
respondents indicated that sixty-six percent were dissatisfied with their body weight.
Labat and DeLong (1990) found that female consumers are more dissatisfied with their
lower bodies, including the buttocks, thighs, hips, crotch, pant length, and waist, than
their upper bodies. Another study examined American women and their dissatisfaction
with their body (Cash & Henry, 1995). This study found that nearly one-half of the
women reported negative evaluations of their looks and voiced concern with being
20
overweight or becoming overweight (Cash & Henry, 1995). Over one-third of the
participants expressed body-image discontent and the majority of these women stated
they were most dissatisfied with their middle or lower torso, weight or muscle tone (Cash
& Henry, 1995). Results from this study also found that women have become more
dissatisfied with their body image throughout their lives most likely due to media placing
high importance on the ideal body (Cash & Henry, 1995). Women’s body dissatisfaction
has been increasing over the past 25 years and now more than ever women are striving to
obtain the ideal body (Jones & Buckingham, 2005). Based on the proceeding review of
literature on body dissatisfaction, the following hypothesis will be tested:
H3: The greater the discrepancy between mannequin size and women’s clothing size,
the greater the women’s body dissatisfaction.
BODY CATHEXIS
Body cathexis is defined as the evaluation of body image where the person
experiences either positive or negative feelings toward their body (LaBat & DeLong,
1990). Body cathexis has also been referred to as body dissatisfaction (Secord & Jourard,
1953). Studies have shown that body cathexis is caused by social interaction and social
comparison (Bessneoff, 2006; LaBat & DeLong, 1990; Tiggemann & McGill, 2004).
With regard to the present study, body cathexis has been used to study feelings about the
self (Secord & Jourard,1953), satisfaction with fit (LaBat & DeLong, 1990), retail
satisfaction and clothing behavior (Shim et al., 1991), as well as the importance of
meeting the ideal body image in relation to clothing attitude (Hwang, 1996).
A study done by Shim and Kotsiopulos (1990) looked at women’s physical size,
body cathexis, and shopping for apparel and looked at petite women, average women,

21
and tall/large-sized women. They found that petite-size women showed the lowest body-
cathexis, which means that the petite women were most ssatisfied with their bodies
among the three groups of women. It was also found that tall/large-sized women showed
the lowest score on self-confidence in choosing the right clothes for themselves and
preferred to shop in the privacy of their own home. The findings of this study found that
all women indicated low satisfaction with size and fit of ready-to-wear. Importantly, it
was found that even the average women in the sample reported dissatisfaction with fit.
Although the portrayal of the ideal body size was not a variable in this study, the two
variables of body cathexis and shopping for apparel are related to the research at hand.
A study done by Secord and Jourard (1954) found that women’s satisfaction with
aspects of their bodies varies with the degree of the deviation between measured size and
what they consider ideal size. The sample included sixty women from Emory University
aged 18 to 36. None of the women in the sample had physical dimensions that were
identical with their ideal self-ratings, and none of the women rated all of their body parts
positively (Secord & Jourard, 1954). Thus it can be assumed that anxiety, insecurity, and
dissatisfaction can occur because the ideal body is difficult to attain. (Secord & Jourard,
1954).
Labat and DeLong (1990) found that female consumers are more dissatisfied
with their lower bodies, including the buttocks, thighs, hips, crotch, pant length, and
waist, than their upper bodies. Song and Ashdown (2013) took this idea a step further and
examined not only how women perceive parts of their body, but also what the ideal shape
of each body part should look like. However, results indicate that the participant’s idea of
the ideal shape comes from the media (Song & Ashdown, 2013). In this study, the

22
authors found that women perceive their ideal body to have a small waist, flat abdomen,
full buttock, curvy waist-to-hip shape, thin thighs, and long leg length. Overall, this study
found that women perceived their body larger than what it actually was, i.e. specifically;
participant’s overestimated the size of their waist, hips, and thighs. Furthermore, because
of this discrepancy, respondents were more dissatisfied with the way clothing fit on these
body parts (Song & Ashdown, 2013).
SATISFACTION OF FIT
Fit can be defined as the way clothing conforms to the body (Workman & Lentz,
2000) or the relationship between the clothing item and the body (Ashdown & DeLong,
1995). Stamper et al. (1991) defines a well-fitting garment as “one that is comfortable to
wear with sufficient room to allow for easy movement, no unnecessary wrinkles and
bunching of the fabric, or a display of bagginess, and that it should be aesthetically
acceptable as well as fashionable” (p. 295). Suitable fit is also defined as the way the
garment appears on the wearer’s body (De Klerk & Tselepis, 2007).
It was found that about 84 percent of women claim they are unable to find
clothing that fits and 55 percent hate or refuse to try on clothes (Giovis, 2007). Consumer
research shows that poor or inconsistent fit accounts for more than $11 billion in lost
women's apparel sales (Giovis, 2007). Consumers want clothes that are flattering to the
figure and that make the customer feel good about their figure (Tiggemann & Lacey,
2009). However, previous research shows that every person has different concerns with
fit depending on their perceived body image (De Klerk & Tselepis, 2007; Pisut &
Connell, 2007; Song & Ashdown, 2013). Fit/size is one of the most important criteria to
evaluate when making apparel purchases (Kim & Damhorst, 2010).

23
Tate (2004) explained the importance of fit as “A clothing item with a good fit should
conceal the wearer’s figure faults, compliment the body and provide well-balanced
proportions” (p. 65). According to Brown (1992) “Personal preferences of fit are shaped
by current fashion trends and cultural influences, age, sex figure type and life style” (p.
261)
Kim and Damhorst (2010) found that individuals who are dissatisfied with their
bodies were more likely to have negative attitudes towards apparel and to be less
confident about their apparel choices. Thus, individuals who are dissatisfied with their
bodies may be less confident that garments will fit their bodies and feel a higher degree
of concern with fit and size of garments. Pisut & Connell (2007) did a study on fit
preference and body cathexis and found that the higher the body cathexis score, the
higher the fitted preference score. Thus, those who enjoyed more fitted clothing felt
better about their bodies.
A study done by Sontag and Schlater (1982) found that women with high levels
of body dissatisfaction tend to be less confident about their clothing selection and are less
likely to follow trends. It was also found that clothing can compensate for body
dissatisfaction or enhance body satisfaction depending on the individuals’ perceptions of
their own body image. LaBat and DeLong (1990) found that women with higher degrees
of body satisfaction had positive attitudes toward the fit of ready-to-wear clothing.
Furthermore, body image was a factor of consumer satisfaction or dissatisfaction with fit
and that women want garments to be more defining on the part of the body with which
they are most satisfied (Garner & Kerney-Cooke, 1996).

24
Labat (1988) found that the higher the body-cathexis, the more satisfied female
consumers were with the physical fit of ready-to-wear clothing among female consumers.
Labat (1988) suggested that dissatisfaction with physical fit may be tempered by the
availability of diverse sizing systems and styles to accommodate many body types.
Sontag and Schlater (1982) also stated that clothing may compensate for body
dissatisfaction or body satisfaction or dissatisfactions may be transferred to clothing and
affect self-esteem.
Body image and clothing are undeniably a topic of research that goes hand in
hand because of the ability of one to affect the other. To illustrate this point, Kwon
(1991) found that the way a person feels about them self can affect clothing choices and
inversely, the clothing a person wears can affect a person’s feelings about themselves.
Kwon (1991) also found that weight-conscious women and those who see themselves as
overweight were more likely to select clothing they believed would camouflage certain
parts of the body they were unhappy with. Feelings about the body play a major role in
clothing preferences and attitudes.
Fit problems can be disseminated by consumers’ perceptions of their bodies and
the tendency of the apparel industry to have rigid solutions to fit problems such as figure
fixers (Spanx and tummy tuckers) (DesMarteau, 2000). McVey (1984) found that when
fashionable garments fit poorly, consumers feel that something is wrong with their own
bodies that are far from the perceived ideal body size. However, academic literature is
lacking research on the impact that mannequin size has on consumers’ satisfaction with
fit after looking at mannequins for visual cues. Based on previous literature, the
following hypotheses will be tested:

25
H4: The more satisfied a woman is with her body size, the more likely she is to be
satisfied when looking at mannequins for visual cues on apparel fit.
H5: The greater the discrepancy between mannequin size and women’s clothing
size, the less satisfied the women will be with the fit of apparel.

26
CHAPTER 3
METHODOLOGY
QUESTIONNAIRE DEVELOPMENT
The purpose of this study was to investigate consumers’ perception of themselves
in terms of body image and how it impacts social comparison towards their peers and
toward mannequins used to display clothing. The self-administered survey was designed
to be taken online. Questions were used from multiple sources and adapted to fit the
purpose of this study. The 14-page instrument included a cover page, a picture of a
mannequin with body parts listed, as well as questions on social comparison between
peers and between mannequins, body satisfaction, and satisfaction of fit after looking at
mannequins, perceptions on mannequins, as well as questions asking for demographic
information of the respondents.
This study was submitted and approved by the University of South Carolina
Human Subject Review Committee before data collection commenced (see Appendix B).
The study was approved as this study maintained respondents’ confidentiality, and it was
determined that there were no physical or mental risks to respondents. A complete
description of the instrument follows.
Cover Page
The cover of the questionnaire included the title “Mannequin Size on Consumers’
Perception of Self and Satisfaction of Fit”. Introductory information was provided which
explained the purpose of the study, the procedure and any risks that the participant may

27
encounter, contact information should the participant have any questions regarding the
survey, and a statement that the study has been approved by the University of South
Carolina Institutional Review Board (see Appendix A).
Social Comparison Questions
The first variable tested was social comparison. The body comparison scale from
Thompson and Coovert (1999) employs a seven-point Likert-type scale (1=never;
7=always) (see Table 3.1). Other questions regarding social comparison were adapted
from Richins (1991) which uses a seven point Likert-type scale (1=never; 7=always) (see
Table 3.2).
Table 3.1
Social Comparison Questions Part 1
Questions Items
How often do you compare these aspects
of your body to those of other
individuals of the same sex?
Arms
Body Shape
Body Size
Buttocks
Chest
Face
Height
Hips
Legs
Torso
Waist
Weight
Width of Shoulders
How often do you compare these aspects
of your body to those of mannequins of
the same sex?

28
Table 3.2
Social Comparison Questions Part 2
Questions Items
When I see mannequins with clothing I
like on, I think about how well or how
badly I look compared to the mannequins
body
1= never
7= always
Mannequins displaying clothing items
make me feel dissatisfied with the way I
look
1= never
7= always
I have wished my body shape was more
like the mannequins displaying clothing
1= never
7= always
When buying clothes I look at the
mannequins to give me ideas about how I
should dress
1= never
7= always
How different are you from mannequins
in terms of body shape?
1= very different
7= exactly the same
Body Dissatisfaction Questions
To assess participant’s satisfaction with their own body, two scales were used.
The first scale was adapted from Secord and Jourard (1953) (see Table 3.3).This scale
employs a five point Likert-type answers (1=have strong feeling and wish change could
somehow be made; 2=don’t like, but can put up with; 3=have no particular feelings one
way or the other; 4=am satisfied; 5=consider myself fortunate). The body parts were the
same as used in the body comparison scale.

29
Table 3.3
Body Dissatisfaction Questions Part 1
Questions Items
Rate your feelings you have about
each of your body parts
1. Have strong feelings and wish
change could somehow be made.
2. Don’t like, but can put up with
3. Have no particular feelings one way
or the other.
4. Am satisfied
5. Consider myself fortunate.
To examine body satisfaction a scale by Heinberg, Thompson and Stormer (1995)
labeled as the SATAQ scale was used (see Table 3.4). Questions from this scale were
changed from model appearance to mannequin size employing a seven-point Likert-type
scale (1=completely disagree; 7=completely agree).

30
Table 3.4
Body Dissatisfaction Questions Part 2
Questions
Thin mannequins project the type of appearance that I see as my goal
I believe that clothes look better on thin mannequins
Mannequins displayed in store windows make me wish that I were thin
I do not wish to have the body figure of mannequins
I tend to compare my body to mannequins bodies
In our society, fat people are not regarded as unattractive
Attractiveness is very important if you want to get ahead in our culture
It’s important for people to work hard on their figures/physiques if they want to
succeed in today’s culture
Most people do not believe that the thinner you are, the better you look
People think that the thinner you are, the better you look in clothes
In today’s society, it’s not important to always look attractive
I wish I had the body shape of mannequins
I often window shop and compare my body to the mannequins
Satisfaction of Fit Questions
Satisfaction with fit questions were adapted from LaBat and DeLong (1990) using
a five point Likert-type scale (1= very dissatisfied; 5= very satisfied) and asked “how
satisfied are you with fit of clothing after looking at mannequin displays?” A list of body
parts similar to those used in previous questions was given including arms, abdomen,
bust, buttocks, crotch, hips, midriff, neckline, sleeve length, skirt length, shoulders, pant
length, thigh, and waist (See Table 3.5).

31
Table 3.5
Satisfaction of Fit Questions Questions Items
How satisfied are you with the fit of
clothing after looking at mannequin
displays?
Arms
Abdomen
Bust
Buttocks
Crotch
Hips
Midriff
Neckline
Sleeve Length
Skirt Length
Shoulders
Pant Length
Thigh
Waist
Demographic Information
The last section of the survey was designed to collect demographic information.
To help participants feel more comfortable answering personal information it was once
again noted that the entire survey was both anonymous and confidential. Respondents
were asked age, gender, ethnicity, clothing size, height, and weight. After all of the
surveys were completed, BMI was calculated from the height and weight of each
respondent.
PRE-TEST
A pretest was done in order to check the validity of the manipulated scales. The
pretest was administered to one graduate level retail class and two undergraduate retail
classes at a large southeastern university. Respondents were orally asked to provide their
comments regarding the clarity of instructions and questions or difficulty in answering
any questions. Sixty-nine surveys were completed and handed back to the researcher.
Fifty-three of the surveys were completed by female participants and sixteen were male

32
participants. As the survey was geared towards female participants, the sixteen survey’s
taken by male participants were not used to check the validity of the scales, leaving fifty-
three surveys to be analyzed for clarification and validity. Based on the participants’
critiques, improvements and changes were made and final modifications were made to
the questionnaire. It was concluded that an image of a mannequin with body parts listed
needed to be added for clarity (See Figure 3.1)
Figure 3.1
Mannequin and Body Parts

33
POPULATION AND SAMPLE
Previous research has found females to be more prone to compare themselves to
others and more likely to be dissatisfied with their bodies (Bessenoff, 2006), thus females
were the target sample of this study. Due to the difficulty in obtaining parental approval
to sample children under the age of 15, it was decided to limit the present study to women
aged 18 and older.
QUESTIONNAIRE DISTRIBUTION
Due to money and time constraints, it was determined that a convenience sample
accessed online would be acceptable. The popular social network site Facebook was used
to target a variety of females aged 18 and over. The study survey was composed using
Qualtrics, an online survey software which was licensed for use by the College in which
the author was enrolled.
The survey link was posted on Facebook for one week in late February. The
Facebook post stated the purpose of the study and asked for females over the age of 18 to
help in the study as well as help in sharing the link to other females. Additionally, the
study’s author had a connection to an email database of alumni sorority organizations at
two large Southeastern Universities. The convenience snowball technique allowed the
researcher to quickly get respondents. There were no incentives to participants.
Participants were told that completing the survey was voluntary and that they were free to
stop the survey at any point. The survey was available online for two weeks.

34
CHAPTER 4
ANALYSIS
SAMPLE INFORMATION
The snowball convenience sample consisted of females between the ages of 18
and 75. A total of 325 questionnaires were submitted online through the survey link. Out
of the 325 questionnaires, nine questionnaires were discarded due to lack of completion.
This resulted in a total of 316 usable questionnaires.
As can be seen in Table 4.1 the sample was comprised of females between the
ages of 18 to 75 years. The respondents belong to 6 age groups broken down by 10 year
increments, with approximately 69.4% falling in the 18-27 years age group, with the
second most represented group in the age group of 28-37. Eighty-three percent of those
surveyed were of Caucasian ethnicity. According to the U.S. Census Bureau in 2010,
4.8% of the U.S. population identified as Asian, 12.6% identified as African American,
72.4% identified as Caucasian, and 16.3% identified as Hispanic. The sample population
is similar to the findings of the U.S. Census Bureau (2010).

35
Table 4.1
Summary of Respondent’s Age and Ethnic Background
Item n % of Sample
Age
18-27 218 69.4
28-37 48 15.4
38-47 11 3.4
48-57 15 4.8
58-67 17 5.3
68-75 5 1.5
Ethnicity
Asian 10 3.2
African American 13 4.1
Caucasian 264 83.5
Hispanic 15 4.7
Native American 4 1.3
Other 8 2.5
As average clothing size of mannequins and the US female populations is
important to this study, participants were asked to specify their average clothing size.
Clothing sizes of the respondents ranged from a size 00 to size 24. The majority of those
surveyed were in the size range of a 4 to 12, which is below the average American
woman’s clothing size of a 14. Approximately, 73% of respondents were between a size
4 and 12 (see Table 4.2).

36
Table 4.2
Respondents Clothing Size
Clothing Size Number of Respondents % of Respondents
00 4 1.3
0 13 4.1
2 19 6.1
4 59 18.8
6 50 15.9
8 42 13.4
10 40 12.7
12 41 13.1
14 16 5.1
16 12 3.8
18 9 2.9
20 4 1.3
22 3 1.0
24 2 .6
Table 4.3 shows the respondents BMI. Respondents were asked to specify their
height and weight. Height was converted from feet to inches and computed for the BMI
formula. BMI was calculated (weight/ (height *12)²) *703. According to the Centers for
Disease Control and Prevention (2011) there are four BMI categories. Underweight is
categorized as a BMI of 18.5 and below, normal BMI is considered to range from 18.5 to
24.9, the overweight category has a BMI between 25 and 29.9, and the obesity BMI level
is 30 and above. Table 4.3 breaks down each category, approximately 51% of the
respondents surveyed fall within the normal weight category with a BMI of 18.5 to 24.9.
Table 4.3
BMI
Category Number of
Respondents
% of Respondents
Underweight (BMI 18.5 and below) 10 3.1
Normal weight 160 51.1
Overweight 72 26.1
Obese 61 19.4

37
SOCIAL COMPARISON
In order to compute social comparison, a latent variable was created by adding
arms, body shape, body size, buttocks, chest, height, hips, legs, torso, waist, weight, and
width of shoulders to create an average mean score. Using BMI and the social
comparison mean comparing themselves to other females, the following hypothesis was
tested using Pearson product-moment correlation (r) analysis
H1 (a): The higher the women’s BMI, the more likely she is to experience
upward social comparison to other females.
Result: Hypothesis 1a was supported.
There was a weak positive relationship with correlation equivalency of 0.172 at a
significance level of 0.001.
Using BMI and the social comparison mean, the following hypothesis was tested
using Pearson r analysis.
H1 (b): The higher the women’s BMI, the more likely she is to experience
upward social comparison to female mannequins.
Result: Hypothesis 1b was supported.
There was a weak positive relationship with r equivalent to 0.192 with a
significance level of 0.000.
A frequency chart was then formulated to see what body parts were more
common to be compared to other females based on a 7-point Likert-type scale for which
respondents were asked how often they compare certain aspects of their body to those of
other females with responses ranging from never = 1 to always = 7. Respondents were
also asked how often they compare certain aspects of their body to those of female
mannequins using the same 7-point Likert-type scale with 1 = never to 7 = always. Table

38
4.4 lists the comparison of body parts to other females as well as to female mannequins
from the highest means to the lowest means.
Table 4.4
BMI and Social Comparison: Other Females vs Female Mannequins
Body part-
Mean-
Compared to
Other Females
Body part- Mean-
Compared to
Female Mannequins
Body size 5.17 Body shape 3.20
Weight 5.12 Waist 3.16
Body shape 5.02 Body size 3.15
Waist 4.74 Weight 2.78
Legs 4.61 Legs 2.75
Torso 4.31 Hips 2.73
Buttocks 4.29 Torso 2.67
Chest 4.24 Chest 2.63
Hips 4.13 Buttocks 2.38
Arms 3.88 Arms 2.27
Height 3.65 Height 2.23
Width of shoulders 2.96 Width of shoulders 2.08
Body size was most likely to be compared when looking at other females and
body shape was most likely to be compared when looking at female mannequins. The
least likely to be compared for both other females and mannequins were arms, height and
width of shoulders.
BODY DISSATISFACTION
Respondents were asked to rate their feelings about each of their own body parts
with 1 = have strong feelings and wish changes could somehow be made, 2 = don’t like,
but can put up with, 3 = have no particular feelings one way or the other, 4 = am
satisfied, 5 = consider myself fortunate. This was based on a 5 point Likert-type scale
with 1 being the most dissatisfied and 5 being the most satisfied. Table 4.5 shows most
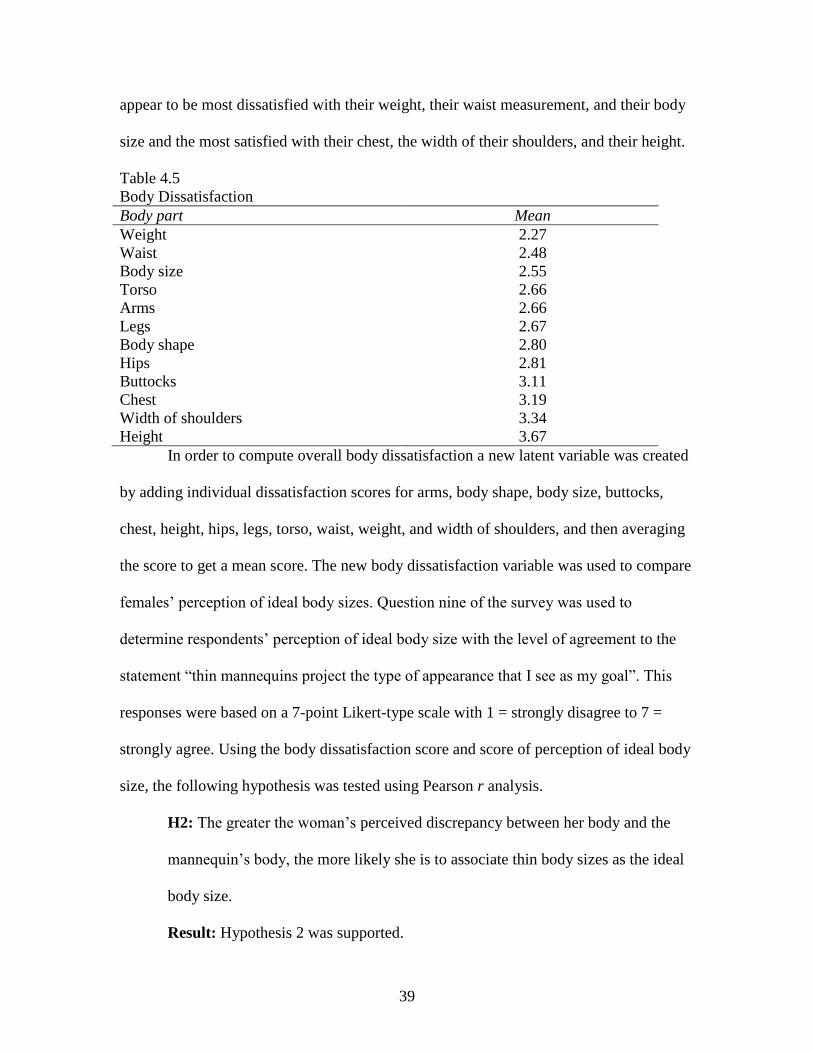
dissatisfied to least dissatisfied based on the mean of the respondents. Respondents
39
appear to be most dissatisfied with their weight, their waist measurement, and their body
size and the most satisfied with their chest, the width of their shoulders, and their height.
Table 4.5
Body Dissatisfaction
Body part Mean
Weight 2.27
Waist 2.48
Body size 2.55
Torso 2.66
Arms 2.66
Legs 2.67
Body shape 2.80
Hips 2.81
Buttocks 3.11
Chest 3.19
Width of shoulders 3.34
Height 3.67
In order to compute overall body dissatisfaction a new latent variable was created
by adding individual dissatisfaction scores for arms, body shape, body size, buttocks,
chest, height, hips, legs, torso, waist, weight, and width of shoulders, and then averaging
the score to get a mean score. The new body dissatisfaction variable was used to compare
females’ perception of ideal body sizes. Question nine of the survey was used to
determine respondents’ perception of ideal body size with the level of agreement to the
statement “thin mannequins project the type of appearance that I see as my goal”. This
responses were based on a 7-point Likert-type scale with 1 = strongly disagree to 7 =
strongly agree. Using the body dissatisfaction score and score of perception of ideal body
size, the following hypothesis was tested using Pearson r analysis.
H2: The greater the woman’s perceived discrepancy between her body and the
mannequin’s body, the more likely she is to associate thin body sizes as the ideal
body size.
Result: Hypothesis 2 was supported.

40
There was a weak negative relationship with r equivalent to -0.233 at a significance level
of 0.000. This finding show that the more dissatisfied the woman is with her body size
the more likely she is to want to achieve an appearance as projected by a thin mannequin.
It was stated in Chapter 2 that mannequins are typically a size 2. To analyze
hypothesis 4 a new score was calculated. This new score took the clothing size of the
respondents and subtracted 2 from it (2 is the size of the typical mannequin) leaving a
latent variable called mannequin difference. Using the mannequin difference variable and
the body dissatisfaction score, the following hypothesis was tested using Pearson r
analysis.
H3: The greater the discrepancy between mannequin size and women’s clothing
size, the greater the women’s body dissatisfaction.
Result: Hypothesis 3 was supported.
There was a moderate negative relationship with r equivalent to -0.465 at a
significance level of 0.000. This finding indicates that the larger the difference in body
size between females and mannequins, the more dissatisfied the woman will be about her
body size.
Question 7 asked respondents “how different are you from mannequins in terms
of your body shape?” Frequencies and percentages were run on this question to see how
females perceived their body shape compared to a mannequin’s body shape (see Table
4.6). Nearly 55% of the respondents were either underweight or normal weight and 27
respondents were either smaller or the same size as a typical size 2 mannequin.

41
Table 4.6
Perceived Difference between Actual Body Shape and Mannequins Body Shape
Response Options Frequency Percent
Very different 109 34.5
Fairly different 96 30.4
Somewhat different 48 15.2
Neutral 16 5.1
Somewhat the same 38 12.0
Fairly the same 9 2.8
Exactly the same 0 0.0
SATISFACTION OF FIT
In order to compute satisfaction of fit a new latent variable was created. A
satisfaction of fit score was computed by adding the mean scores of arms, abdomen, bust,
buttocks, crotch, hips, midriff, neckline, sleeve length, skirt length, shoulders, pant
length, thigh, and waist, and then averaging the sum to create a mean. Using the
satisfaction of fit variable and the body dissatisfaction variable, the following hypothesis
was tested using Pearson r analysis.
H4: The more satisfied a woman is with her own body, the more likely she is to
be satisfied when looking at mannequins for visual cues on apparel fit.
Result: Hypothesis 4 was supported.
There was a moderate positive relationship with r equivalent to 0.522 at a
significance level of 0.000. The findings indicate that the more satisfied a woman is with
her body, the more satisfied she is to be with the fit of clothing after looking at
mannequins.
Table 4.7 shows how respondents rated their satisfaction of the fit of clothing
after looking at the clothing on mannequins given a 5-point Likert-scale with 1 = very
dissatisfied to 5 = very satisfied. Fourteen items are listed in order from most satisfied to

42
least satisfied. The table shows that respondents are most dissatisfied with the fit of
clothing on the thigh, midriff, and waist after looking at mannequins wearing clothing.
Table 4.7
Satisfaction of Fit
Clothing body parts Mean
Neckline 3.24
Sleeve length 3.20
Shoulders 3.10
Arms 3.05
Skirt length 2.97
Crotch 2.95
Buttocks 2.94
Bust 2.88
Pant length 2.82
Hips 2.72
Abdomen 2.69
Thigh 2.67
Midriff 2.62
Waist 2.59
Hypothesis 5 looked at the difference between a typical mannequin size and
women’s clothing size and the effect it has on a woman’s satisfaction with fit with
clothing. The use of two created variables calculated earlier was used including the
mannequin difference variable and satisfaction of fit variable. Using these two variables,
the following hypothesis was tested with Pearson’s product-moment correlation
coefficient analysis.
H5: The greater the discrepancy between mannequin size and women’s clothing
size, the less satisfied the women will be with the fit of apparel.
Result: Hypothesis 5 was supported.
There was a weak negative relationship with r equivalent to -0.297 with a significance
level of 0.000. The findings indicate that the larger the woman is, the more dissatisfied
she will be with the fit of clothing after looking at the clothing on mannequins.

43
PERCEPTIONS OF MANNEQUINS
There were a number of questions on the survey regarding respondents’
perception of mannequins. Approximately 25.3% of respondents stated that they almost
always or always think about how well or how badly they look when they compare
themselves to a mannequin’s body. Whereas, mannequins’ display clothing items only
made 12.4% of respondents feel dissatisfied with the way they look. Respondents were
asked if they wished their body shape was more like the mannequins displaying clothing
and 14.2% said they almost always or always wished their body shape was more like that
of mannequins. A similar question stated “mannequins displayed in store windows make
me wish that I were thin” with 18% of the respondents agreeing or strongly agreeing with
this statement. Table 4.8 shows the frequency and percentages associated of respondents’
beliefs that clothing looks better on thin mannequins. The table indicates that compared
to other previous findings, only 20.2% of respondents agree or strongly agree that
clothing looks better on thin mannequins, whereas 25.3% feel that clothing does not look
better on thin mannequins.
Table 4.8
Clothing on Thin Mannequins
Responses Frequency Percent
Strongly disagree 30 9.5
Disagree 50 15.8
Somewhat disagree 32 10.1
Neither agree nor disagree 62 19.6
Somewhat agree 78 24.7
Agree 44 13.9
Strongly agree 20 6.3

44
CHAPTER 5
DISCUSSION
SOCIAL COMPARISON
This study examined how individuals perceived themselves when compared to
other females and female mannequins using social comparison theory. The first variable
investigated an individual’s Body Mass Index (BMI). According to the Centers for
Disease Control and Prevention (2011) there are four categories that a person can fall
under when calculating BMI. Underweight is categorized as 18.5 and below, normal
weight is 18.5 to 24.9, overweight falls between 25 and 29.9, and obesity is 30 and above.
To test how BMI impacted their comparison to others, the following hypothesis was
tested:
H1 (a): The higher the women’s BMI, the more likely she is to experience
upward social comparison to other females.
Result: Hypothesis 1a was supported.
It was found that women who are categorized with a BMI as overweight or obese
are more likely to compare themselves to other individuals of the same sex. Respondents
were asked how often they compare certain body parts to those of other individuals. The
top five body parts that are most commonly compared to other individuals are body size,
weight, body shape, waist, and legs. This finding is similar to that of Tiggemann and
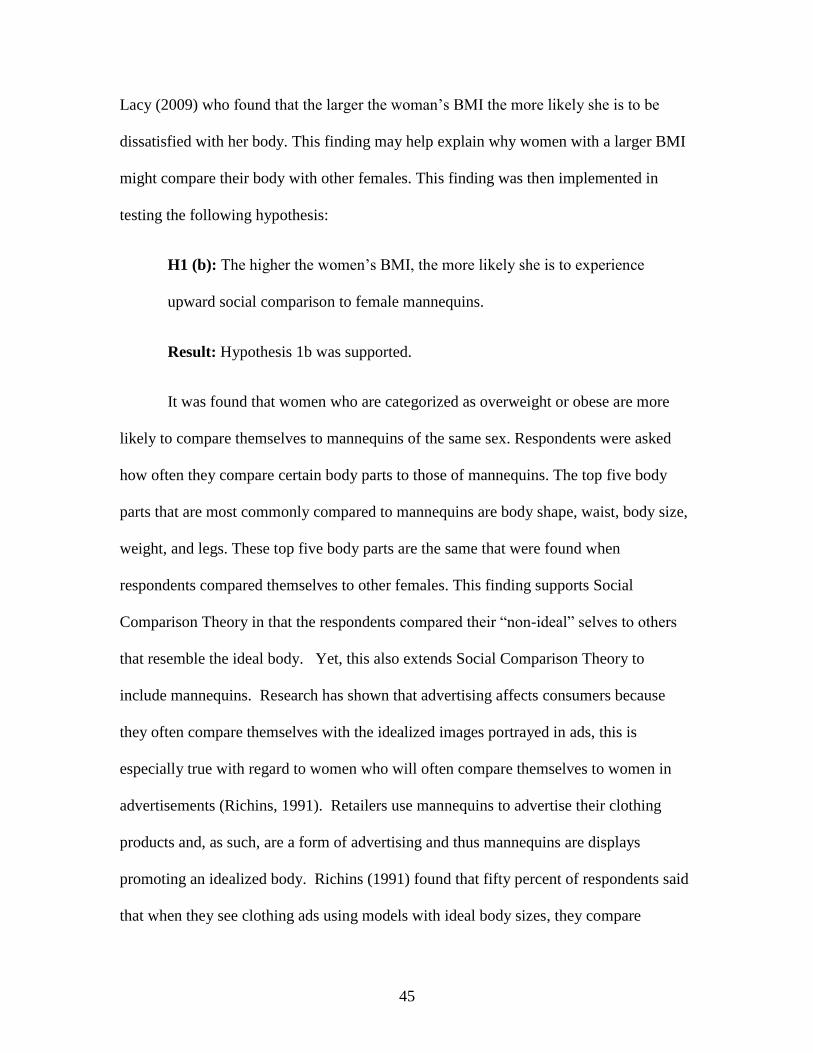
45
Lacy (2009) who found that the larger the woman’s BMI the more likely she is to be
dissatisfied with her body. This finding may help explain why women with a larger BMI
might compare their body with other females. This finding was then implemented in
testing the following hypothesis:
H1 (b): The higher the women’s BMI, the more likely she is to experience
upward social comparison to female mannequins.
Result: Hypothesis 1b was supported.
It was found that women who are categorized as overweight or obese are more
likely to compare themselves to mannequins of the same sex. Respondents were asked
how often they compare certain body parts to those of mannequins. The top five body
parts that are most commonly compared to mannequins are body shape, waist, body size,
weight, and legs. These top five body parts are the same that were found when
respondents compared themselves to other females. This finding supports Social
Comparison Theory in that the respondents compared their “non-ideal” selves to others
that resemble the ideal body. Yet, this also extends Social Comparison Theory to
include mannequins. Research has shown that advertising affects consumers because
they often compare themselves with the idealized images portrayed in ads, this is
especially true with regard to women who will often compare themselves to women in
advertisements (Richins, 1991). Retailers use mannequins to advertise their clothing
products and, as such, are a form of advertising and thus mannequins are displays
promoting an idealized body. Richins (1991) found that fifty percent of respondents said
that when they see clothing ads using models with ideal body sizes, they compare

46
themselves to the models which in turn make them feel dissatisfied with the way they
look. The findings of the current study suggest that the higher the woman’s BMI the more
likely she is to compare herself to not only other individuals but also mannequins, a
finding never before documented.
BODY DISSATISFACTION
The current study looked at body dissatisfaction and what body parts women are
most dissatisfied with. The findings show that women are most dissatisfied with weight,
waist, body size, torso, and arms. This is similar to the findings of previous research by
Labat and DeLong (1990) who found that female consumers are more dissatisfied with
their lower bodies including the buttocks, thighs, hips, and waist. Over one-third of the
participants expressed body-image discontent and the majority of these women stated
they were most dissatisfied with their middle or lower torso, weight or muscle tone (Cash
& Henry, 1995). Based on a review of literature, the following hypothesis was tested:
H2: The greater the woman’s perceived discrepancy between her body and the
mannequin’s body, the more likely she is to associate thin body sizes as the ideal
body size.
Result: Hypothesis 2 was supported.
Hypothesis 2 suggests that the more dissatisfied women are with their own body
the more likely they are to want to have a thin, idealized body. This finding is supported
from previous research by Cash and Henry (1995) who found that women have become
more dissatisfied with their body image due to media placing high importance on the
ideal body. Based on previous literature the following hypothesis was tested:

47
H3: The greater the discrepancy between mannequin size and woman’s clothing
size, the greater the woman’s body dissatisfaction.
Result: Hypothesis 3 was supported.
A typical mannequin is a size 2, whereas the average size of American woman is
a size 14 (Vesilind, 2009). Hypothesis 3 suggests that the larger a woman’s clothing size,
the more dissatisfied she is about her body. Respondents were asked how different they
felt they were from the body size of most mannequins. Results showed that the perceived
difference between actual body size and mannequin body size was larger than what it
actually was. From the sample collected nearly 55% of the respondents were either
underweight or normal weight and 27 respondents were either smaller or the same size as
a typical size 2 mannequins, however not a single respondent perceived themselves as
being exactly the same size as a mannequin. Of the respondents, 64% perceived their
body size as very different or fairly different from the mannequin’s body size. This
finding supports the findings of Song and Ashdown (2013) who found that women
perceived their body larger than what it actually was.
SATISFACTION OF FIT
The current study looked at how satisfied women are with the fit of clothing after
looking at mannequins. The findings show that women are most dissatisfied with the fit
of clothing on the waist, midriff, thigh, abdomen, and hips when comparing how the
clothing looks on mannequins. This is similar to the findings of Labat and DeLong
(1990) who found that female consumers are more dissatisfied with the fit of clothing in
their lower bodies, including the buttocks, thighs, hips, and waist. To examine

48
respondent’s dissatisfaction with fit when comparing themselves to mannequins, the
following hypothesis was tested:
H4: The more satisfied a woman is with her own body, the more likely she is to
be satisfied when looking at mannequins for visual cues on apparel of fit.
Result: Hypothesis 4 was supported.
The findings of hypothesis 4 suggest that the more confident a woman is about
her body image, the more satisfied she will be with the fit of clothing. This supports the
finding of Kim and Damhorst (2010) who found that individuals who are dissatisfied
with their bodies were more likely to have negative attitudes towards apparel and to be
less confident about their apparel choices. Labat (1988) found that the more dissatisfied a
person is with a specific body part, the more dissatisfied they will be with the fit of
clothing.
H5: The greater the discrepancy between mannequin size and women’s clothing
size, the less satisfied the women will be with the fit of apparel.
Result: Hypothesis 5 was supported.
The findings suggest that the larger the woman compared to the standard size 2 of
mannequins, the more likely she is to be dissatisfied with the fit of apparel. Mannequins
are used to display clothing and show consumers how clothing should fit. Therefore,
when the clothing does not fit the same on the woman as it does on a mannequin, the
current findings show that this will lead to dissatisfaction with the fit of apparel.
Approximately 25% of respondents stated that they almost always or always think about

49
how well or how badly they look compared to a mannequin’s body. This supports
findings of Anitha and Selvaraj (2010) who conclude that people can envision themselves
in outfits worn by mannequins only if they can relate to the mannequin and further
suggesting that customers have a hard time with idealistically-sized mannequins. Law et
al., (2012) found that using mannequins with natural body shapes can decrease the
perception that only an ideal body shape is attractive and that garments only look good on
an unrealistic size, thereby raising the degree of wear-ability of garments in the minds of
the consumer.
CONCLUSION
This study contributes to the understanding of how females perceive mannequins
and how body dissatisfaction increases customer dissatisfaction when looking at
mannequins. This study also found that the Social Comparison Theory can be applied to
mannequins that exhibit the ideal body size. No prior research has looked in-depth into
the effects of mannequins and women’s body dissatisfaction. The average American
woman is becoming larger in size and the typical mannequin is becoming smaller in size,
thus there is a large discrepancy between the two. As retailers use mannequins as a form
of visual advertising to showcase their merchandise, it allows consumers to visualize
wearing the merchandise. However, the findings of this study indicate that female
consumers do compare their bodies to those of mannequins, and the larger the
discrepancy between the size of the mannequin and the size of the woman, the more
dissatisfied the woman will be with the fit of clothing after looking at mannequins
displaying clothing. Retailers can use this new information to adapt their mannequins to
fit their specific target market and perhaps increase sales as realistically-sized

50
mannequins may increase a customers’ satisfaction not only with themselves but also
with the fit of the clothing being advertised. Overall, having a better understanding about
the impact mannequins have on female consumers and their body satisfaction may help
retailers meet their customers’ needs and perceptions.
LIMITATION AND RECOMMENDATIONS
This study had several limitations. In this study, women were asked questions
regarding satisfaction of their body and were asked to specify their height and weight.
With a study like this, the participants might not have been honest about their weight or
height because it made them uncomfortable, even though the survey clearly stated that
results were anonymous and confidential. Although there is no way of knowing if
participants did not answer truthfully, it is assumed some participants were less than
forthcoming about their weight.
Due to money and time constraints, the convenience sample also has limitations.
Data was collected by the researcher using the snowball data collection method. The
social network site, Facebook, was used and emails were sent out to contacts of the
researcher and were asked to post the survey link on their own pages. Thus, the sample
employed in this study limits the generalizability of the study. Because of this limitation,
there was not a large variety in ethnicity and age. Future research should include a larger
and more diverse population assessed randomly. Increasing the diversity would allow
further examination into how mannequins affect women from different ethnicities.
Increasing the number of different age groups also would allow examination into age
cohorts and the effect mannequins have on each age generation. Additional research

51
could also focus on the male population. Little research has explored male perceptions
even though it has been documented that more males are shopping for clothing due to the
change in gender roles (Brown, 2008).

52
REFERENCES
Aagerup, U. (2011). The influence of real women in advertising on mass market fashion
brand perception. Journal of Fashion Marketing and Management, 15(4), 486-
502.
Anitha, N. & Selvaraj, C. (2010). The effects of mannequins on consumers’ perception
and shopping attitude. Information and Processing Management, 70, 641-647.
Ashdown, S.P. and Delong, M. (1995), “Perceptual testing of apparel ease variation”,
Applied Ergonomics, Vol. 26 No. 1, pp. 47-54.
Barnett, E. (2013, November 06). Debenhams launches size 16 mannequins nationally to
'better represent real women's bodies'. The Telegraph. Retrieved from
http://www.telegraph.co.uk/women/womens-life/10428452/Debenhams-launches-
size-16-mannequins-nationally-to-better-represent-real-womens-bodies.html
Bessenoff, G. (2006). Can the media affect us? Social comparison, self-discrepancy,
and the thin ideal. Psychology of Women Quarterly, 30, 239-251.
Bishop, K. (2013, November 06). Plus-sized mannequins introduced as average size
grows. CNBC. Retrieved from http://www.cnbc.com/id/101174696
Brown, P. (1992). Ready-To-Wear Apparel Analysis, Macmillan. New York, NY.
Brown, R. (2008). It's raining men. Display & design ideas, 20(3), 98-98.
Cash, T. F., & Henry, P. E. (1995). Women’s body images: The results of a national
survey in the U.S.A. Sex roles, 33(12), 19-28.
Centers for Disease Control and Prevention (2011). Retrieved March 18, 2014 at < http://www.cdc.gov/healthyweight/assessing/bmi/adult_bmi/index.html>.
Chan, J. & Chan, P. (2008). Merchandise display affects store image. European Advances
in Consumer Research, 8, 408-415.
De Klerk, H. M., & Tselepis, T. (2007).The early adolescent female clothing
consumer: expectations, evaluation and satisfaction with fit as part of the
appreciation of clothing quality. Journal of Fashion Marketing and Management,
11(3), 413-428.

53
DesMarteau, K. (2000). CAD: Let the fit revolution begin. Bobbin, 42(2), 42-50.
Dittmar, H. (2005). Introduction to the special issue: Body image—vulnerability factors
and processes linking sociocultural pressures and body dissatisfaction. Journal of
Social and Clinical Psychology, 24(8), 1081-1087.
Festinger, L. (1954). A theory of social comparison processes. Human Relations, 7(2),
117-140.
Garner, D.M., Kearney-Cooke, A.(1996) Body image 1996. Psychology Today, 29(2),
55-58.
Giovis, J. (2007). More fitting clothes urged. Chicago Tribune. Retrieved December 3,
2013, from http://articles.chicagotribune.com/2007-01-
22/business/0701220053_1_fit-technologies-apparel-industry-long-torso
Groesz, L. M., Levine, M. P., & Murnen, S. K. (2002). The effect of experimental
presentation of thing media images on body satisfaction: A meta-analytic review.
International Journal of Eating Disorders, 31, 1-16.
Halliwell, E., & Dittmar, H. (2004). Does size matter? The impact of model's body size
on women's body-focused anxiety and advertising effectiveness. Journal of Social
and Clinical Psychology, 23(1), 104-122.
Hazen, G. G. (1998). Fantastic fit for every body. Emmaus: Rodale Press.
Heinberg, L. J., Thompson, J. K., & Stormer, S. (1995). Development and validation of
the sociocultural attitudes towards appearance questionnaire. International
Journal of Eating Disorders, 17(1), 81-89.Higgins, E.T. (1987). Self-discrepancy:
a theory relating self and affect. Psychological
Review, 94(3), 319-340.
Hwang, J. (1996), “Relationships between body-cathexis, clothing benefits sought, and
clothing behavior and effects of importance of meeting the ideal body image and
clothing attitude”, unpublished doctoral dissertation, Virginia Polytechnic
Institute and State University, Blacksburg, VA.
Jain, V., Sharma, A., Narwal, P. (2012). Impact of visual merchandising on consumer
behaviour towards women’s apparel. International Journal of Research in
Management, 2(5), 106-117.
Jones, A. M., & Buckingham, J. T. (2005). Self–esteem as a moderator of the effect of
social comparison on women’s body image. Journal of Social and Clinical
Psychology, 24(8), 1164-1187.

54
Kerfoot, S., Davies, B., & Ward, P. (2003). Visual merchandising and the creation
of discernible retail brands. International Journal of Retail & Distribution
Management 31(3) 143-152.
Kim, H. & Damhorst, M.L. (2010). The relationship of body-related self-discrepancy to
body dissatisfaction, apparel, involvement, concerns with fit and size of garments,
and purchase intentions in online apparel shopping. Clothing & Textiles Research
Journal, 28(4) 239-254.
Kim, J. H., & Lennon, S. J. (2007). Mass media and self-esteem, body image, and eating
disorder tendencies. Clothing and Textiles Research Journal, 25(1), 3-23.
Kostanski, M., & Gullone, E. (1998). Adolescent body image dissatisfaction:
relationships with self‐esteem, anxiety, and depression controlling for body mass.
Journal of Child Psychology and Psychiatry, 39(2), 255-262.
Kwon, Y. H. (1991). The influence of the perception of mood and self-consciousness on
the selection of clothing. Clothing and Textiles Research Journal, 9, 41-46.
Labat, K.L. (1988). Consumer satisfaction/dissatisfaction with the fit of ready-to-wear
clothing. Unpublished doctoral dissertation, University of Minnesota.
Labat, K.L., DeLong, M. (1990). Body cathexis and satisfaction with fit of apparel.
Clothing Textile Research Journal, 8(2), 43-48.
Law, D., Wong, C., & Yip, J. (2012). How does visual merchandising affect
consumer affective response? European Journal of Marketing (46)1/2 112-133.
Lennon, S. J., Lillethun, A., & Buckland, S. S. (1999). Attitudes toward social
comparison as a function of self‐esteem: Idealized appearance and body image.
Family and Consumer Sciences Research Journal, 27(4), 379-405.
Markey, C. N., Tinsley, B. J., Ericksen, A. J., Ozer, D. J., & Markey, P. M. (2002).
Preadolescents' perceptions of females' body size and shape: Evolutionary and
social learning perspectives. Journal of Youth and Adolescence, 31(2), 137-146.
Martin, M. C., & Kennedy, P. F. (1993). Advertising and social comparison:
Consequences for female preadolescents and adolescents. Psychology &
Marketing, 10(6), 513-530..
McVey, D. (1984). Fit to be sold. Apparel Industry Magazine, 45(2), 24-26.
Morrison, T. G., Kalin, R., & Morrison, M. A. (2004). Body-image evaluation and body
image investment among adolescents: a test of sociocultural and social
comparison theories. Adolescence, 39(155), 571-592.
55
Neuhaus, S. (2013, November 14). Interview by A Cohen. Mcg thesis interview.
Owen, R. & Spencer, R.M.C. (2013). Body ideals in women after viewing images of
typical and healthy weight models. Body Image, 10, 489-494.
Pisut, G. & Connell, L.J. (2007). Fit preferences of female consumers in the U.S.A.
Journal of Fashion Marketing and Management, 11(3), 366-379.
Posavac, H. D., Posavac, S. S., & Posavac, E. J. (1998). Exposure to media images of
female attractiveness and concern with body weight among young women. Sex
Roles, 38(3/4), 187-201.
Posavac, S. S., & Posavac, H. D. (2002). Predictors of women's concern with body
weight: the roles of perceived self-media ideal discrepancies and self-esteem.
Eating Disorders, 10(2), 153-160.
Richins, M. L. (1991). Social comparison and the idealized images of advertising.
Journal of Consumer Research, 18, 71-83.
Schneider, S. (1997). Body design, variable realisms: The case of female fashion
mannequins. Design Issues, 13(3), 5-18.
Secord, P. F., & Jourard, S. M. (1953). The appraisal of body-cathexis: body-cathexis and
the self. Journal of Consulting Psychology, 17(5), 343-347.
Secord, P. F., & Jourard, S. M. (1955). Body-cathexis and the ideal female figure. The
Journal of Abnormal and Social Psychology, 50(2), 243-247.
Sen, S., Block, L., & Chandran, S. (2002). Window displays and consumer
shopping decisions. Journal of Retailing and Consumer Services, 9, 277-290.
Seock, Y.K., & Merritt, L. R. (2013). Influence of body mass index, perceived media
pressure, and peer criticism/teasing on adolescent girls’ body
satisfaction/dissatisfaction and clothing-related behaviors. Clothing and Textiles
Research Journal, 31(4) 244-258.
Shim, S., Kotsiopulos, A. (1990). Women’s physical size, body-cathexis, and shopping
for apparel. Perceptual and Motor Skills, 71, 1031-1042.
Shim, S., Kotsiopulos, A. and Knoll, D.S. (1991), “Body cathexis, clothing attitude, and
their relations to clothing and shopping behavior among male consumers”,
Clothing and Textiles Research Journal, 9(3), 35-44.
Song, H. K., & Ashdown, S. P. (2013). Female apparel consumers’ understanding of
body size and shape relationship among body measurements, fit satisfaction, and
body cathexis. Clothing and Textiles Research Journal, 31(3), 143-156.

56
Sontag, M. S., & Schlater, J. D. (1982). Proximity of clothing to self: Evolution of a
concept. Clothing and Textiles Research Journal, 1(1), 1-8.
Stamper, A.A., Sharp, S.H. and Donnel, L.B. (1991), Evaluating Apparel Quality, 2nd
ed., Fairchild, New York, NY.
Stice, E., & Shaw, H. E. (1994). Adverse effects of the media portrayed thin-ideal on
women and linkages to bulimic symptomatology. Journal of Social and Clinical
Psychology, 13(3), 288-308.
Stice, E., & Whitenton, K. (2002). Risk factors for body dissatisfaction in adolescent
girls: a longitudinal investigation. Developmental Psychology, 38(5), 669-678.
Stormer, S. M., & Thompson, J. K. (1996). Explanations of body image disturbance: A
test of maturational status, negative verbal commentary, social comparison, and
sociocultural hypotheses. International Journal of Eating Disorders, 19(2), 193-
202.
Strahan, E. J., Lafrance, A., Wilson, A. E., Ethier, N., Spencer, S. J., & Zanna, M. P.
(2008). Victoria's dirty secret: How sociocultural norms influence adolescent girls
and women. Personality and Social Psychology Bulletin, 34(2), 288-301.
Tate, S.L. (2004), Inside Fashion Design, 5th ed., Prentice-Hall, Englewood Cliffs, NJ.
Terzieff, Juliette. "Fashion world says too thin is too hazardous | Womens ENews."
Women's ENews. 24 Sept. 2006. Web. 26 Sep. 2013.
<http://womensenews.org/story/arts/060924/fashion-world-says-too-thin-too-
hazardous>.
Tiggemann, M. (2004). Body image across the adult life span: Stability and change. Body
Image, 1(1), 29-41.
Tiggemann, M., & Lacey, C. (2009). Shopping for clothes: Body satisfaction, appearance
investment, and functions of clothing among female shoppers. Body Image, 6,
285-291.
Tiggemann, M., & McGill, B. (2004). The role of social comparison in the effect of
magazine advertisements on women's mood and body dissatisfaction. Journal of
Social and Clinical Psychology, 23(1), 23-44.
Thompson, J. K., & Coovert, M. D. (1999). Body image, social comparison, and eating
disturbance: A covariance structure modeling investigation. International Journal
of Eating Disorders, 26(1), 43-51.

57
U.S. Census Bureau (2010). Retrieved March 21, 2014 at
<http://www.census.gov/prod/cen2010/briefs/c2010br-02.pdf>.
Vartanian, L. R. (2009). When the body defines the self: Self-concept clarity,
internalization, and body image. Journal of Social and Clinical Psychology,
28(1), 94-126.
Vartanian, L.R. & Dey, S. (2013). Self-concept clarity, thin-ideal internalization, and
Appearance related social comparison as predictors of body dissatisfaction. Body
Image, 10(6), 495-500.
Vesilind, Emili. "Average Size Of Women In Us -Fashion's Invisible Woman –Los
Angeles Times."Featured Articles From The Los Angeles Times. 01 Mar. 2009.
Web. 06 Jan. 2011. <http://articles.latimes.com/2009/mar/01/image/ig-size1>.
Workman, J.E. and Lentz, E.S. (2000), “Measurement specifications for manufacturers’
prototype bodies”, Clothing and Textiles Research Journal, 18(4), 251-259.

58
APPENDIX A – SURVEY
Mannequin Size on Consumers’ Perception of Self and Satisfaction of Fit
Amanda Cohen, Principal Investigator
Introduction
You are being asked to participate in this study conducted by Amanda Cohen, a Master’s
student in the Department of Retailing at the University of South Carolina as part of her
requirements for completion of her program of study. This study is under the direction of
Dr. Deborah J. C. Brosdahl, Assoc. Professor in the Dept. of Retailing.
Purpose and Description of Study
This exploratory study investigates consumers’ perception about, and satisfaction with,
mannequin sizes as used in retail stores. As part of the marketing process used by
retailers, mannequins can play an important part in how consumers view merchandise
and more importantly if consumers are satisfied or dissatisfied with clothing displayed
and sold on mannequins in retail outlets especially in comparison to their own body.
Description and Risk of Study Procedures
There are minimal risks to you as a subject completing this survey; however several
questions may make you feel uncomfortable as some questions relate to satisfaction of
your body. Participation in this study is voluntary. You are free not to participate and
you may withdraw at any time, for whatever reason. In the event that you do withdraw
from this study, the information you have already provided will be kept in a confidential
manner. If you are part of the student sample for this study, completion or non-

59
completion of this survey will not jeopardize your grades nor will you risk loss of present
or future faculty/school/ University relationships.
This survey is intended to be both anonymous and confidential and your responses will
not be associated nor linked to you in any way. Individual responses for this study will
be used and available only to the investigator and study director. The results of this
research study may be presented at meetings or in publications; however your identity
will not be disclosed. This survey should take less than 15 minutes of your time to
complete. Your completion of this survey will serve as your agreement that you
understand the purpose of this study as well as your consent to use your answers in
aggregated form.
Contact Persons
For more information concerning this research you should contact Amanda Cohen at 980-
254-5102 or
Dr. Deborah Brosdahl at 803-777-6249.
If you have any questions about your rights as a research subject, you may contact:
Thomas Coggins, Director
Office of Research Compliance
University of South Carolina
Columbia, SC 29208
Phone – (803) 777-4456 Fax – (803) 576-5589 E-Mail – [email protected]

60
I have read the contents of this consent form and have been encouraged to ask questions.
I have received answers to my questions. My completion of this survey will serve as my
consent to participate in this study.
Thank you very much for your help in this study.
Figure A.1: mannequin and body parts

61
Directions: For the following questions, please circle the number that best describes
your answer with
1 = Never to 7 = Always.
1. How often do you compare these aspects of your body to those of other
individuals of the same sex?
Nev
er
Ha
rdly
Ev
er
Occa
sion
ally
Neu
tral
So
metim
es
Alm
ost
Alw
ay
s
Alw
ay
s
Arms 1 2 3 4 5 6 7 Body Shape 1 2 3 4 5 6 7 Body Size 1 2 3 4 5 6 7 Buttocks 1 2 3 4 5 6 7 Chest 1 2 3 4 5 6 7 Height 1 2 3 4 5 6 7 Hips 1 2 3 4 5 6 7 Legs 1 2 3 4 5 6 7 Torso 1 2 3 4 5 6 7 Waist 1 2 3 4 5 6 7 Weight 1 2 3 4 5 6 7 Width of Shoulders 1 2 3 4 5 6 7
2. How often do you compare these aspects of your body to those of mannequins of
the same sex?
Nev
er
Hard
ly E
ver
Occa
sion
ally
Neu
tral
Som
etimes
Alm
ost
Alw
ays
Alw
ays
Arms 1 2 3 4 5 6 7 Body Shape 1 2 3 4 5 6 7 Body Size 1 2 3 4 5 6 7 Buttocks 1 2 3 4 5 6 7 Chest 1 2 3 4 5 6 7 Height 1 2 3 4 5 6 7 Hips 1 2 3 4 5 6 7 Legs 1 2 3 4 5 6 7 Torso 1 2 3 4 5 6 7
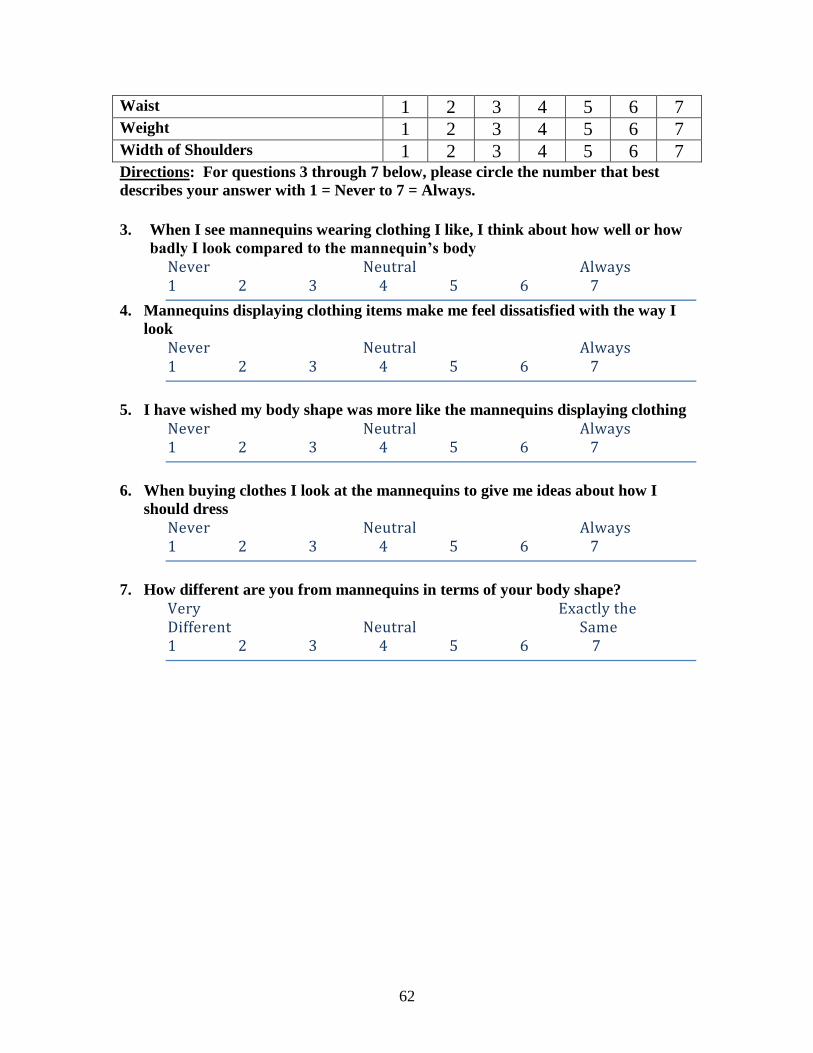
62
Waist 1 2 3 4 5 6 7 Weight 1 2 3 4 5 6 7 Width of Shoulders 1 2 3 4 5 6 7 Directions: For questions 3 through 7 below, please circle the number that best
describes your answer with 1 = Never to 7 = Always.
3. When I see mannequins wearing clothing I like, I think about how well or how
badly I look compared to the mannequin’s body
Never Neutral Always 1 2 3 4 5 6 7
4. Mannequins displaying clothing items make me feel dissatisfied with the way I
look
Never Neutral Always 1 2 3 4 5 6 7
5. I have wished my body shape was more like the mannequins displaying clothing
Never Neutral Always 1 2 3 4 5 6 7
6. When buying clothes I look at the mannequins to give me ideas about how I
should dress
Never Neutral Always 1 2 3 4 5 6 7
7. How different are you from mannequins in terms of your body shape?
Very Exactly the Different Neutral Same 1 2 3 4 5 6 7

63
Directions: For question 8, please circle the number that best describes your
feelings toward your body.
8. Rate your feelings you have about each of your body parts listed
Have strong
feelings and
wish changes
could somehow
be made
Don’t
like, but
can put
up with
Have no
particular
feelings one
way or the
other
Am
satisfied
Consider
myself
fortunate
Arms 1 2 3 4 5
Body Shape 1 2 3 4 5
Body Size 1 2 3 4 5
Buttocks 1 2 3 4 5
Chest 1 2 3 4 5
Height 1 2 3 4 5
Hips 1 2 3 4 5
Legs 1 2 3 4 5
Torso 1 2 3 4 5
Waist 1 2 3 4 5
Weight 1 2 3 4 5
Width of
Shoulders
1 2 3 4 5
Directions: For questions 9 through 21 below, please circle the number that best
describes your level of agreement with the statements, with 1 = Completely Disagree
to 7 = Completely Agree.
9. Thin mannequins project the type of appearance that I see as my goal
Completely Completely Disagree Neutral Agree
1 2 3 4 5 6 7
10. I believe that clothes look better on thin mannequins
Completely Completely Disagree Neutral Agree
1 2 3 4 5 6 7
11. Mannequins displayed in store windows make me wish that I were thin
Completely Completely Disagree Neutral Agree
1 2 3 4 5 6 7

64
12. I do not wish to have the body figure of mannequins
Completely Completely Disagree Neutral Agree
1 2 3 4 5 6 7
13. I tend to compare my body to mannequins bodies
Completely Completely Disagree Neutral Agree
1 2 3 4 5 6 7
14. In our society, fat people are regarded as unattractive
Completely Completely Disagree Neutral Agree
1 2 3 4 5 6 7
15. Attractiveness is very important if you want to get ahead in our culture
Completely Completely Disagree Neutral Agree
1 2 3 4 5 6 7
16. It’s important for people to work hard on their figures/physiques if they want
to succeed in today’s culture
Completely Completely Disagree Neutral Agree
1 2 3 4 5 6 7
17. Most people do not believe that the thinner you are, the better you look
Completely Completely Disagree Neutral Agree
1 2 3 4 5 6 7
18. People think that the thinner you are, the better you look in clothes
Completely Completely Disagree Neutral Agree
1 2 3 4 5 6 7
19. In today’s society, it’s not important to always look attractive
Completely Completely Disagree Neutral Agree
1 2 3 4 5 6 7

65
20. I wish I had the body shape of mannequins
Completely Completely Disagree Neutral Agree
1 2 3 4 5 6 7
21. I often window shop and compare my body to the mannequins
Completely Completely Disagree Neutral Agree
1 2 3 4 5 6 7
Directions: For question 22, please circle the number that best describes your
feelings of satisfaction
22. How satisfied are you with the fit of clothing after looking at mannequin
displays?
Alm
ost
Nev
er
Satisfied
Rarely
Satisfied
Neu
tral
Som
etimes
satisfied
Alm
ost
Alw
ays
Satisfied
Arms 1 2 3 4 5
Abdomen 1 2 3 4 5
Bust 1 2 3 4 5
Buttocks 1 2 3 4 5
Crotch 1 2 3 4 5
Hips 1 2 3 4 5
Midriff 1 2 3 4 5
Neckline 1 2 3 4 5
Sleeve Length 1 2 3 4 5
Skirt Length 1 2 3 4 5
Shoulders 1 2 3 4 5
Pant Length 1 2 3 4 5
Thigh 1 2 3 4 5
Waist 1 2 3 4 5

66
Age ____________
Gender
Male ____
Female ____
Ethnicity
Asian ____
Black/African-American ____
Caucasian ____
Hispanic ____
Native American ____
Other ____
Clothing Size (please circle the size of garment that you USUALLY buy)
00 4 10 16 22 28
0 6 12 18 24 30
2 8 14 20 26
Height ___________
Weight ___________

67
APPENDIX B – IRB APPROVAL