Embed Size (px)
Citation preview

Vital Statistics on Congresswww.brookings.edu/vitalstats
Ornstein, Mann, Malbin, Rugg and WakemanLast updated April 18, 2014
Chapter 8: Political Polarization in Congress and Changing Voting AlignmentsTable of Contents
8-18-28-38-48-58-68-78-88-98-10
Average Ideological Positions of Senate Committees, 80th-112th CongressesAverage Ideological Positions of House Committees, 80th-112th Congresses
Congressional Voting in Support of the President's Position, 1954-2013
Average Ideological Positions of House Party Coalitions, 80th-113th Congresses, 1947-Average Ideological Positions of Senate Party Coalitions, 80th-113th Congresses, 1947-
Presidential Victories on Votes in Congress, 1953-2013
Votes in Support of the Conservative Coalition, 1959-2000Conservative Coalition Votes and Victories in Congress, 1957-2000Party Unity Scores in Congressional Voting, 1954-2013Party Unity Votes in Congress, 1953-2013

Vital Statistics on Congresswww.brookings.edu/vitalstats
Ornstein, Mann, Malbin, Rugg and WakemanLast updated April 18, 2014
Table 8-1
President and year
House and Senate (%)
House (%)
No. of Votes
Senate (%)
No. of Votes
President and year
House and Senate (%)
House (%)
No. of Votes
Senate (%)
No. of Votes
Eisenhower Reagan1953 89.2 91.2 34 87.8 49 1981 82.4 72.4 76 88.3 1281954 78.3 n.a. n.a. n.a. n.a. 1982 72.4 55.8 77 83.2 1191955 75.3 63.4 41 84.6 52 1983 67.1 47.6 82 85.9 851956 69.7 73.5 34 67.7 65 1984 65.8 52.2 113 85.7 771957 68.4 58.3 60 78.9 57 1985 59.9 45.0 80 71.6 1021958 75.7 74.0 50 76.5 98 1986 56.1 34.1 88 81.2 801959 52.0 55.5 54 50.4 121 1987 43.5 33.3 99 56.4 781960 65.1 65.0 43 65.1 86 1988 47.4 32.7 104 64.8 88
Average 71.7 Average 61.8
Kennedy Bush1961 81.4 83.1 65 80.6 124 1989 62.6 50.0 86 73.3 1011962 85.4 85.0 60 85.6 125 1990 46.8 32.4 108 63.4 931963 87.1 83.1 71 89.6 115 1991 54.2 43.0 111 69.0 81
Average 84.6 1992 43.0 37.0 105 53.0 60Average 51.7
Johnson1964 87.9 88.5 52 87.6 97 Clinton1965 93.1 93.8 112 92.6 162 1993 86.4 87.2 102 85.4 891966 78.9 91.3 103 68.8 125 1994 86.4 87.2 78 85.5 621967 78.8 75.6 127 81.2 165 1995 36.2 26.3 133 49.0 1021968 74.5 83.5 103 68.9 164 1996 55.1 53.2 79 57.6 59
Average 82.6 1997 53.6 38.7 75 71.4 631998 50.6 36.6 82 67.0 72
Nixon 1999 37.8 35.4 82 42.2 451969 73.9 72.3 47 76.4 72 2000 55.0 49.3 69 65.0 401970 76.9 84.6 65 71.4 91 Average 57.61971 74.8 82.5 57 69.5 821972 66.3 81.1 37 54.3 46 Bush1973 50.6 48.0 125 52.4 185 2001 86.7 83.7 43 88.3 771974 59.6 67.9 53 54.2 83 2002 87.8 82.5 40 91.4 58
Average 67.0 2003 78.7 87.3 48 74.8 892004 72.6 70.6 24 74.0 37
Ford 2005 78.0 78.3 46 77.8 451974 58.2 59.3 54 57.4 68 2006 80.9 85.0 40 78.6 701975 61.0 50.6 89 71.0 93 2007 38.3 15.4 117 66.0 971976 53.8 43.1 51 64.2 53 2008 26.3 33.8 80 68.5 54
Average 57.7 Average 68.7
Carter Obama1977 75.4 74.7 79 76.1 88 2009 96.7 94.4 72 98.8 791978 78.3 69.6 112 84.8 151 2010 85.8 88.1 42 84.4 641979 76.8 71.7 145 81.4 161 2011 57.1 31.6 95 84.3 891980 75.1 76.9 117 73.3 116 2012 53.6 19.7 61 79.7 79
Average 76.4 2013 56.7 20.9 86 85.2 108Average 70.0
Presidential Victories on Votes in Congress, 1953-2013
n.a. = not available
Source: Congressional Quarterly Weekly Report , various issues.
Notes: Percentages indicate the number of congressional votes supporting the president divided by the total number of votes on which the president had taken a clear position. The percentages are normalized to eliminate the effects of absences as follows: support = (support)/(support + opposition).

Vital Statistics on Congresswww.brookings.edu/vitalstats
Ornstein, Mann, Malbin, Rugg and WakemanLast updated April 18, 2014
Table 8-2
President and year
All Democrats
Southern Democrats Republicans
All Democrats
Southern Democrats Republicans
Eisenhower1954 54 n.a. n.a. 45 n.a. 821955 58 n.a. 67 65 n.a. 851956 58 n.a. 79 44 n.a. 801957 54 n.a. 60 60 n.a. 801958 63 n.a. 65 51 n.a. 771959 44 n.a. 76 44 n.a. 801960 49 n.a. 63 52 n.a. 76
Kennedy1961 81 n.a. 41 73 n.a. 421962 83 71 47 76 63 481963 84 71 36 77 65 52
Johnson1964 84 70 42 73 63 521965 83 65 46 75 60 551966 81 64 45 71 59 531967 80 65 51 73 69 631968 77 63 59 64 50 57
Nixon1969 56 55 65 55 56 741970 64 64 79 56 62 741971 53 69 79 48 59 761972 56 59 74 52 71 771973 39 49 67 42 55 701974 52 64 71 44 60 65
Ford1974 48 52 59 45 55 671975 40 48 67 53 67 761976 36 52 70 47 61 73
Carter1977 69 58 46 77 71 581978 67 54 40 74 61 471979 70 58 37 75 66 511980 71 63 44 71 69 50
Congressional Voting in Support of the President's Position, 1954-2013 (percent)
House Senate

Vital Statistics on Congresswww.brookings.edu/vitalstats
Ornstein, Mann, Malbin, Rugg and WakemanLast updated April 18, 2014
Table 8-2
President and year
All Democrats
Southern Democrats Republicans
All Democrats
Southern Democrats Republicans
Congressional Voting in Support of the President's Position, 1954-2013 (percent)
House Senate
Reagan1981 46 60 72 52 63 841982 43 55 70 46 57 771983 30 45 74 45 46 771984 37 47 64 45 58 811985 31 43 69 36 46 801986 26 37 69 39 56 901987 26 36 64 38 42 671988 27 34 61 51 58 73
Bush1989 38 49 72 56 66 841990 26 35 65 39 49 721991 35 43 74 42 53 831992 27 38 75 33 41 75
Clinton1993 80 81 39 87 84 301994 78 68 49 88 88 441995 75 69 22 81 78 291996 74 70 38 83 75 371997 73 68 31 87 84 611998 78 72 27 86 84 421999 75 70 24 86 84 352000 76 68 28 92 88 47
Bush2001 32 38 92 67 71 962002 33 40 85 73 81 952003 27 36 92 52 60 962004 31 42 83 63 70 932005 24 33 81 38 54 862006 31 45 85 51 62 852007 7 n.a. 72 37 n.a. 782008 16 n.a. 64 34 n.a. 70
Obama2009 92 n.a. 27 96 n.a. 512010 87 n.a. 30 97 n.a. 432011 80 n.a. 22 92 n.a. 532012 77 n.a. 17 93 n.a. 472013 83 n.a. 12 96 n.a. 40
n.a.= not available
Source: Congressional Quarterly Weekly Report , various issues.
Note: Percentages indicate the number of congressional votes supporting the president divided by the total number of votes on which the president had taken a clear position. The percentages are normalized to eliminate the effects of absences as follows: support = (support)/(support + opposition).

Vital Statistics on Congresswww.brookings.edu/vitalstats
Ornstein, Mann, Malbin, Rugg and WakemanLast updated April 18, 2014
Table 8-3
Year House Senate Year House Senate1953 52.1 51.7 1983 55.6 43.71954 38.2 48.0 1984 47.1 40.01955 40.8 29.9 1985 61.0 49.61956 43.8 53.1 1986 56.5 52.31957 59.0 35.5 1987 63.7 40.71958 39.8 43.5 1988 47.0 42.51959 55.2 47.9 1989 56.3 35.31960 52.7 36.7 1990 49.1 54.31961 50.0 62.3 1991 55.1 49.31962 46.0 41.1 1992 64.5 53.01963 48.7 47.2 1993 65.5 67.11964 54.9 35.7 1994 61.8 51.71965 52.2 41.9 1995 73.2 68.81966 41.5 50.2 1996 56.4 62.41967 36.3 34.6 1997 50.4 50.31968 35.2 32.0 1998 55.5 55.71969 31.1 36.3 1999 47.3 62.81970 27.1 35.2 2000 43.2 48.71971 37.8 41.6 2001 40.2 55.31972 27.1 36.5 2002 43.3 45.51973 41.8 29.9 2003 51.7 66.71974 29.4 44.3 2004 47.0 52.31975 48.4 47.8 2005 49.0 62.61976 35.9 37.2 2006 54.5 57.31977 42.2 42.4 2007 62.0 60.01978 33.2 45.2 2008 53.3 51.61979 47.3 46.7 2009 50.9 72.01980 37.6 45.8 2010 40.0 78.61981 37.4 47.8 2011 75.8 51.11982 36.4 43.4 2012 72.8 59.8
2013 68.6 69.8
Note: Data indicate the percentage of all roll call votes on which a majority of voting
Party Unity Votes in Congress, 1953-2013 (percentage of all votes)
Source: Congressional Quarterly Weekly Report , various issues.

Vital Statistics on Congresswww.brookings.edu/vitalstats
Ornstein, Mann, Malbin, Rugg and WakemanLast updated April 18, 2014
Table 8-4
YearAll
DemocratsSouthern
Democrats RepublicansAll
DemocratsSouthern
Democrats Republicans1954 80 n.a. 84 77 n.a. 891955 84 68 78 82 78 821956 80 79 78 80 75 801957 79 71 75 79 81 811958 77 67 73 82 76 741959 85 77 85 76 63 801960 75 62 77 73 60 741961 n.a. n.a. n.a. n.a. n.a. n.a.1962 81 n.a. 80 80 n.a. 811963 85 n.a. 84 79 n.a. 791964 82 n.a. 81 73 n.a. 751965 80 55 81 75 55 781966 78 55 82 73 52 781967 77 53 82 75 59 731968 73 48 76 71 57 741969 71 47 71 74 53 721970 71 52 72 71 49 711971 72 48 76 74 56 751972 70 44 76 72 43 731973 75 55 74 79 52 741974 72 51 71 72 41 681975 75 53 78 76 48 711976 75 52 75 74 46 721977 74 55 77 72 48 751978 71 53 77 75 54 661979 75 60 79 76 62 731980 78 64 79 76 64 741981 75 57 80 77 64 851982 77 62 76 76 62 801983 82 67 80 76 70 791984 81 68 77 75 61 831985 86 76 80 79 68 811986 86 76 76 74 59 801987 88 78 79 85 80 781988 88 81 80 85 78 741989 86 77 76 79 69 791990 86 78 78 82 75 771991 86 78 81 83 73 831992 86 79 84 82 70 83
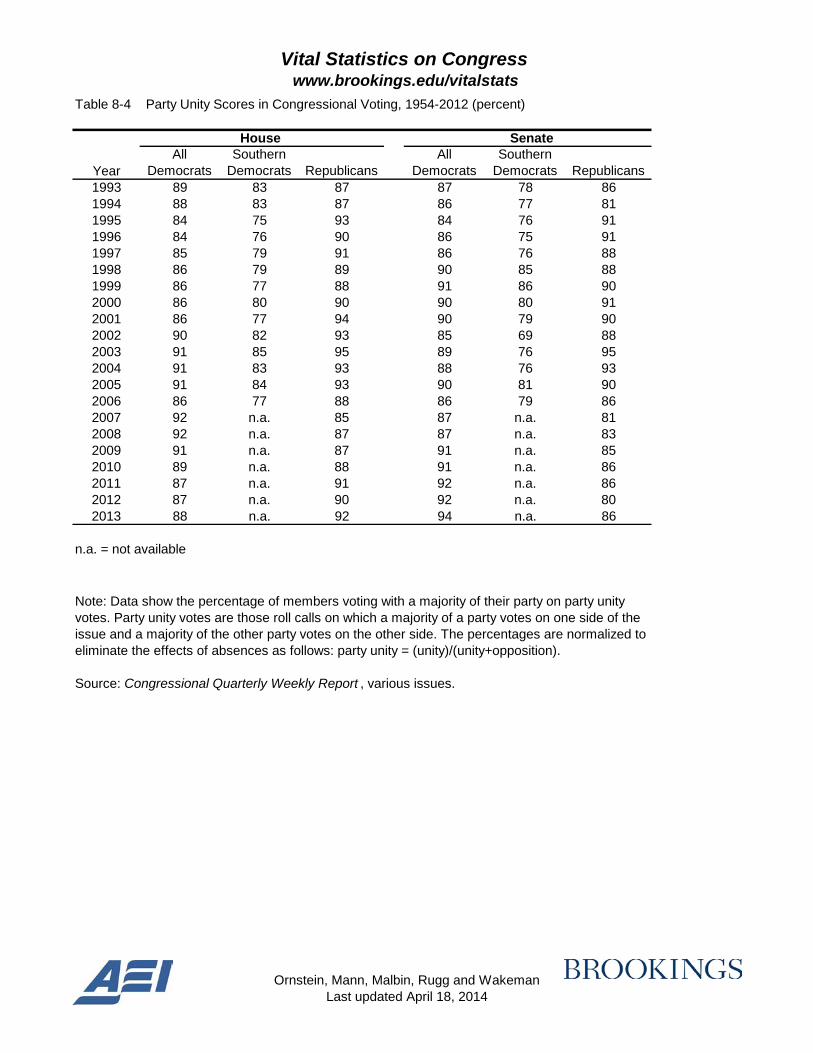
Party Unity Scores in Congressional Voting, 1954-2012 (percent)
House Senate
Vital Statistics on Congresswww.brookings.edu/vitalstats
Ornstein, Mann, Malbin, Rugg and WakemanLast updated April 18, 2014
Table 8-4
YearAll
DemocratsSouthern
Democrats RepublicansAll
DemocratsSouthern
Democrats Republicans
Party Unity Scores in Congressional Voting, 1954-2012 (percent)
House Senate
1993 89 83 87 87 78 861994 88 83 87 86 77 811995 84 75 93 84 76 911996 84 76 90 86 75 911997 85 79 91 86 76 881998 86 79 89 90 85 881999 86 77 88 91 86 902000 86 80 90 90 80 912001 86 77 94 90 79 902002 90 82 93 85 69 882003 91 85 95 89 76 952004 91 83 93 88 76 932005 91 84 93 90 81 902006 86 77 88 86 79 862007 92 n.a. 85 87 n.a. 812008 92 n.a. 87 87 n.a. 832009 91 n.a. 87 91 n.a. 852010 89 n.a. 88 91 n.a. 862011 87 n.a. 91 92 n.a. 862012 87 n.a. 90 92 n.a. 802013 88 n.a. 92 94 n.a. 86
n.a. = not available
Source: Congressional Quarterly Weekly Report , various issues.
Note: Data show the percentage of members voting with a majority of their party on party unity votes. Party unity votes are those roll calls on which a majority of a party votes on one side of the issue and a majority of the other party votes on the other side. The percentages are normalized to eliminate the effects of absences as follows: party unity = (unity)/(unity+opposition).

Vital Statistics on Congresswww.brookings.edu/vitalstats
Ornstein, Mann, Malbin, Rugg and WakemanLast updated April 18, 2014
Table 8-5 Conservative Coalition Votes and Victories in Congress, 1957-2000 (percent)
Year Votes Victories Votes Victories1957 16 81 11 1001958 15 64 19 861959 13 91 19 651960 20 35 22 671961 30 74 32 481962 13 44 15 711963 13 67 19 441964 11 67 17 471965 25 25 24 391966 19 32 30 511967 22 73 18 541968 22 63 25 801969 25 71 28 671970 17 70 26 641971 31 79 28 861972 25 79 29 631973 25 67 21 541974 22 67 30 541975 28 52 28 481976 17 59 26 581977 22 60 29 741978 20 57 23 461979 21 73 18 651980 16 67 20 751981 21 88 21 951982 16 78 20 901983 18 71 12 891984 14 75 17 941985 13 84 16 931986 11 78 20 931987 9 88 8 1001988 8 82 10 971989 11 80 12 951990 10 74 11 951991 9 86 14 951992 10 88 14 871993 7 98 10 901994 7 92 10 721995 13 100 9 951996 11 100 12 971997 9 100 8 921998 8 95 3 1002000 4 41 4 31
House Senate
Note: "Votes" is the percentage of all roll call votes on which a majority of voting southern Democrats and a majority of voting Republicans - the conservative coalition - opposed the stand taken by a majority of voting northern Democrats. "Victories" is the percentage of conservative coalition votes won by the
Sources: Congressional Quarterly Almanac (Washington, D.C.: Congressional Quarterly, various years); Congressional Quarterly Weekly Report , various issues.
*Congressional Quarterly stopped compiling this data after 2000. The ideological scores developed by Keith Poole and Howard Rosenthal (voteview.com) are used in tables 8-7, 8-8, 8-9, and 8-10.
Vital Statistics on Congresswww.brookings.edu/vitalstats
Ornstein, Mann, Malbin, Rugg and WakemanLast updated April 18, 2014
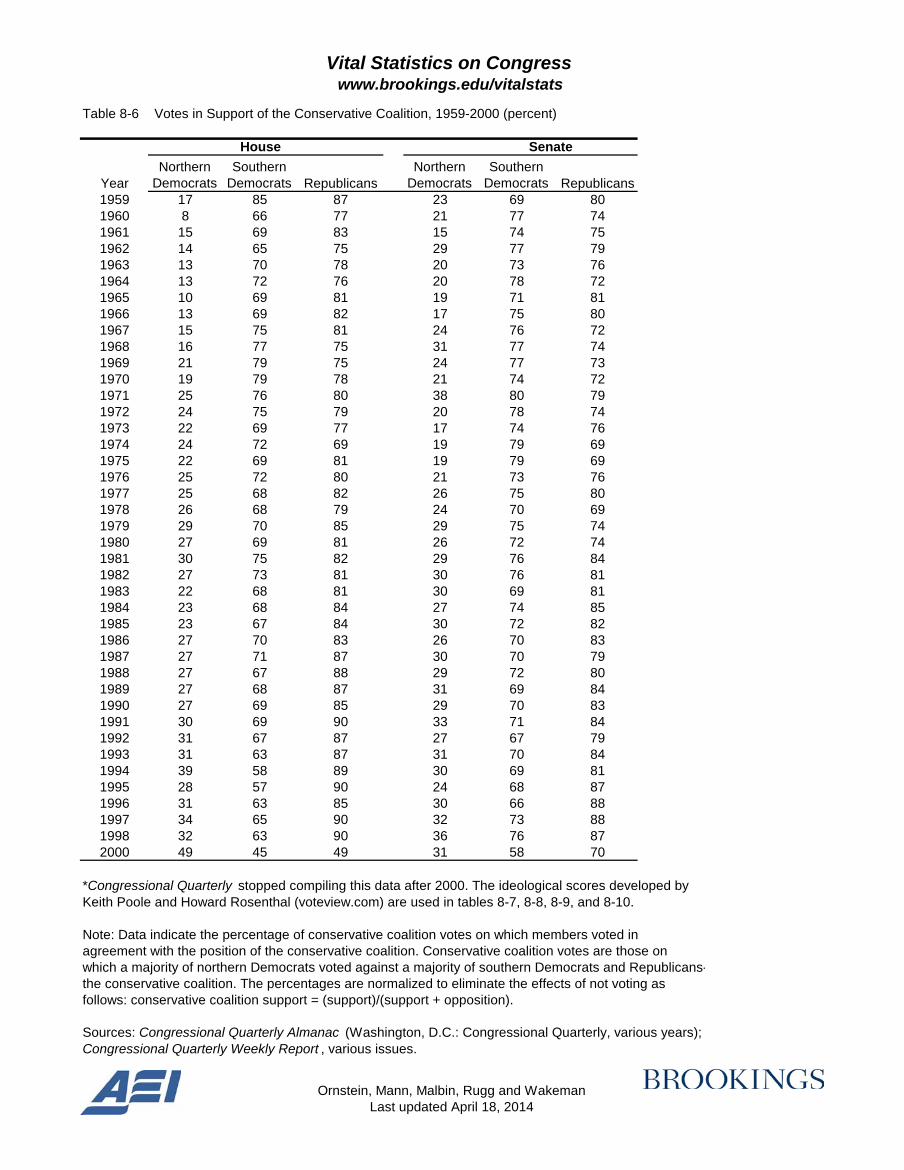
Table 8-6 Votes in Support of the Conservative Coalition, 1959-2000 (percent)
YearNorthern
DemocratsSouthern
Democrats RepublicansNorthern
DemocratsSouthern
Democrats Republicans1959 17 85 87 23 69 801960 8 66 77 21 77 741961 15 69 83 15 74 751962 14 65 75 29 77 791963 13 70 78 20 73 761964 13 72 76 20 78 721965 10 69 81 19 71 811966 13 69 82 17 75 801967 15 75 81 24 76 721968 16 77 75 31 77 741969 21 79 75 24 77 731970 19 79 78 21 74 721971 25 76 80 38 80 791972 24 75 79 20 78 741973 22 69 77 17 74 761974 24 72 69 19 79 691975 22 69 81 19 79 691976 25 72 80 21 73 761977 25 68 82 26 75 801978 26 68 79 24 70 691979 29 70 85 29 75 741980 27 69 81 26 72 741981 30 75 82 29 76 841982 27 73 81 30 76 811983 22 68 81 30 69 811984 23 68 84 27 74 851985 23 67 84 30 72 821986 27 70 83 26 70 831987 27 71 87 30 70 791988 27 67 88 29 72 801989 27 68 87 31 69 841990 27 69 85 29 70 831991 30 69 90 33 71 841992 31 67 87 27 67 791993 31 63 87 31 70 841994 39 58 89 30 69 811995 28 57 90 24 68 871996 31 63 85 30 66 881997 34 65 90 32 73 881998 32 63 90 36 76 872000 49 45 49 31 58 70
House Senate
Note: Data indicate the percentage of conservative coalition votes on which members voted in agreement with the position of the conservative coalition. Conservative coalition votes are those on which a majority of northern Democrats voted against a majority of southern Democrats and Republicans-the conservative coalition. The percentages are normalized to eliminate the effects of not voting as follows: conservative coalition support = (support)/(support + opposition).
Sources: Congressional Quarterly Almanac (Washington, D.C.: Congressional Quarterly, various years); Congressional Quarterly Weekly Report , various issues.
*Congressional Quarterly stopped compiling this data after 2000. The ideological scores developed by Keith Poole and Howard Rosenthal (voteview.com) are used in tables 8-7, 8-8, 8-9, and 8-10.

Vital Statistics on Congresswww.brookings.edu/vitalstats
Ornstein, Mann, Malbin, Rugg and WakemanLast updated April 18, 2014
Table 8-7
80th 81st 82nd 83rd 84th 85th 86th 87th 88th 89thCommittee 1947 1949 1951 1953 1955 1957 1959 1961 1963 1965
Agriculture All members 0.188 0.034 0.092 0.166 0.077 0.079 0.030 0.065 0.049 -0.002Democrats -0.084 -0.123 -0.071 -0.031 -0.141 -0.140 -0.134 -0.124 -0.158 -0.161Republicans 0.375 0.301 0.304 0.338 0.352 0.357 0.315 0.348 0.361 0.345
Appropriations All members 0.144 0.019 0.025 0.164 0.012 0.029 0.019 0.011 -0.004 -0.062Democrats -0.170 -0.196 -0.206 -0.162 -0.217 -0.195 -0.201 -0.210 -0.218 -0.225Republicans 0.370 0.342 0.371 0.382 0.356 0.352 0.348 0.330 0.316 0.286
Armed Services All members 0.131 0.019 0.050 0.098 0.020 0.014 -0.018 0.024 0.045 -0.030Democrats -0.105 -0.189 -0.172 -0.132 -0.169 -0.172 -0.185 -0.153 -0.148 -0.178Republicans 0.306 0.323 0.313 0.305 0.243 0.232 0.256 0.257 0.285 0.278
Budget All members n.a. n.a. n.a. n.a. n.a. n.a. n.a. n.a. n.a. n.a.Democrats n.a. n.a. n.a. n.a. n.a. n.a. n.a. n.a. n.a. n.a.Republicans n.a. n.a. n.a. n.a. n.a. n.a. n.a. n.a. n.a. n.a.
District of Columbia All members 0.125 0.024 0.055 0.075 0.034 0.029 -0.005 0.010 -0.004 -0.048Democrats -0.119 -0.166 -0.129 -0.129 -0.136 -0.142 -0.158 -0.095 -0.134 -0.159Republicans 0.317 0.308 0.271 0.264 0.250 0.246 0.269 0.167 0.191 0.188
Education & the Workforce All members 0.123 -0.088 0.016 0.014 -0.083 -0.112 -0.151 -0.066 -0.113 -0.189Democrats -0.305 -0.345 -0.280 -0.365 -0.441 -0.440 -0.400 -0.354 -0.397 -0.415Republicans 0.408 0.369 0.393 0.365 0.386 0.317 0.348 0.390 0.338 0.285
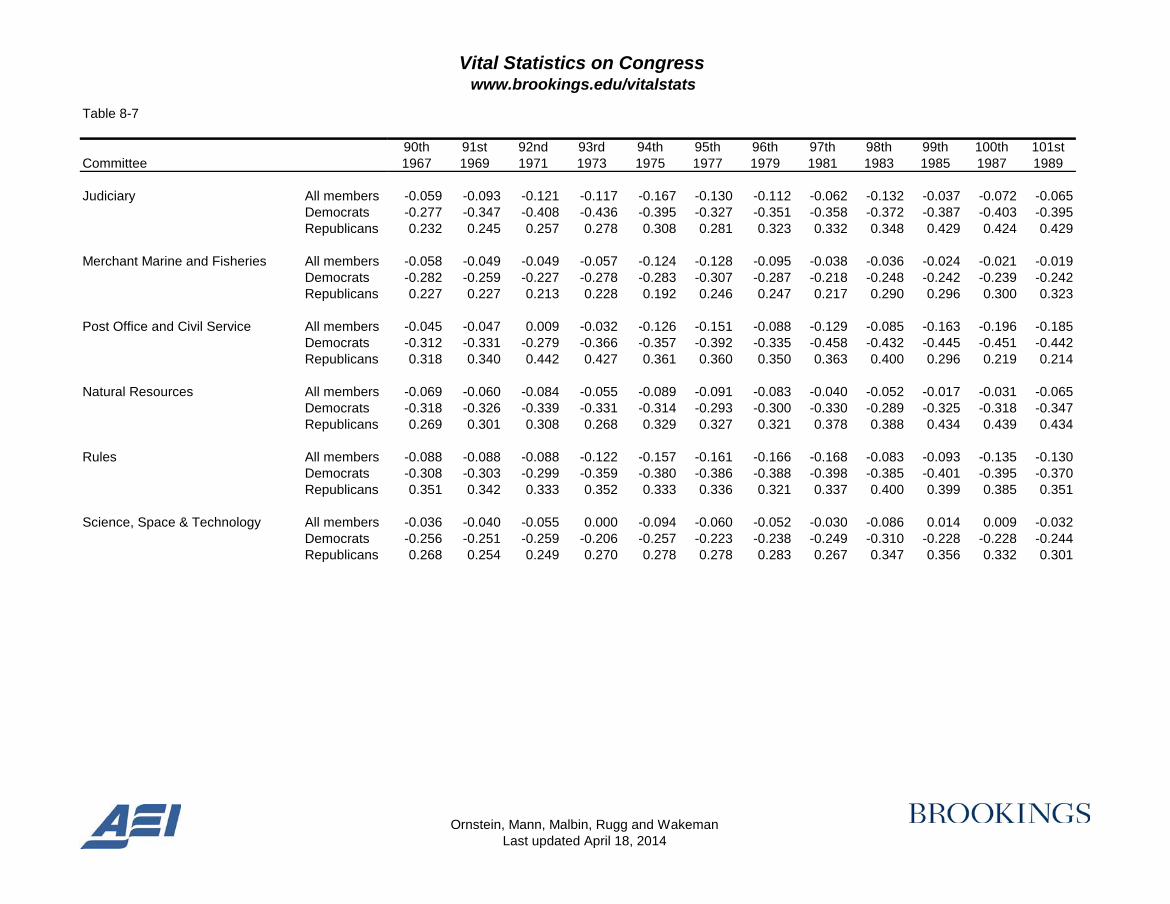
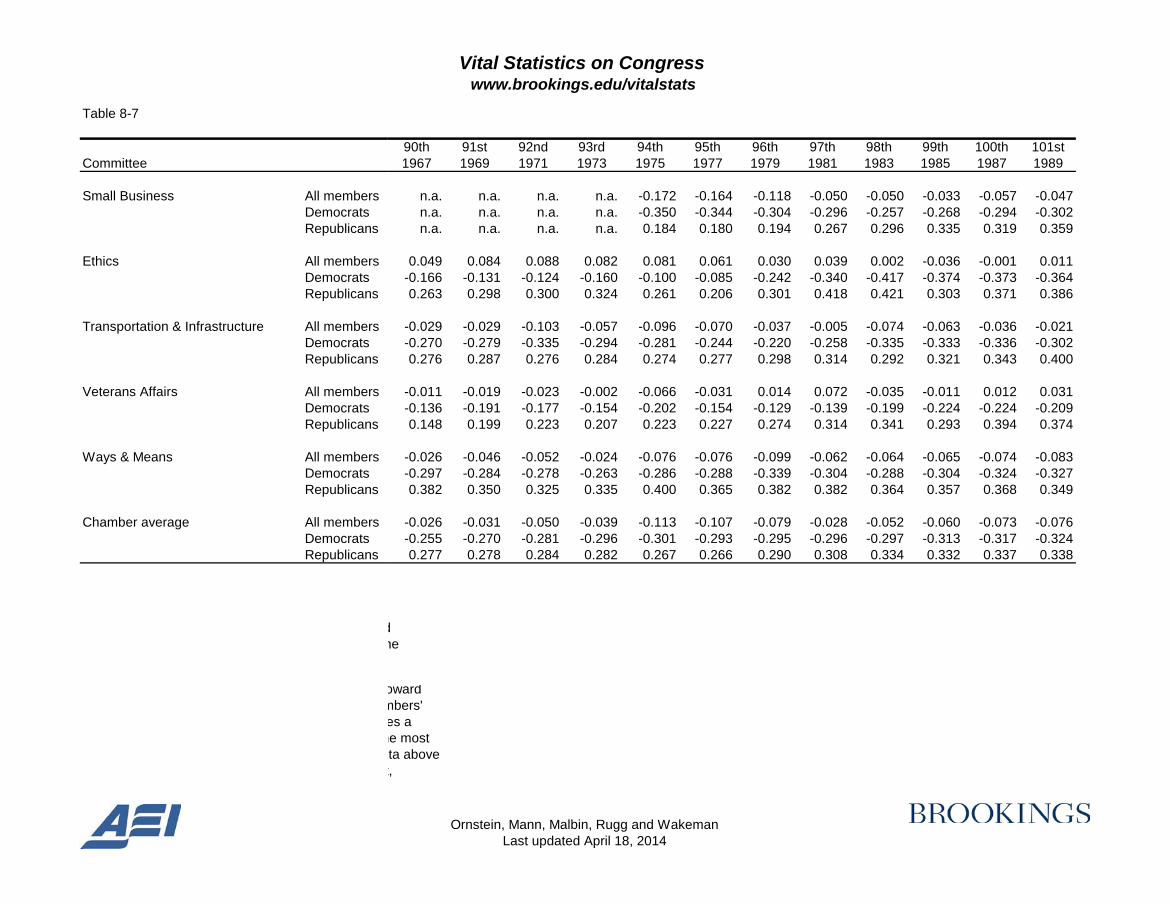
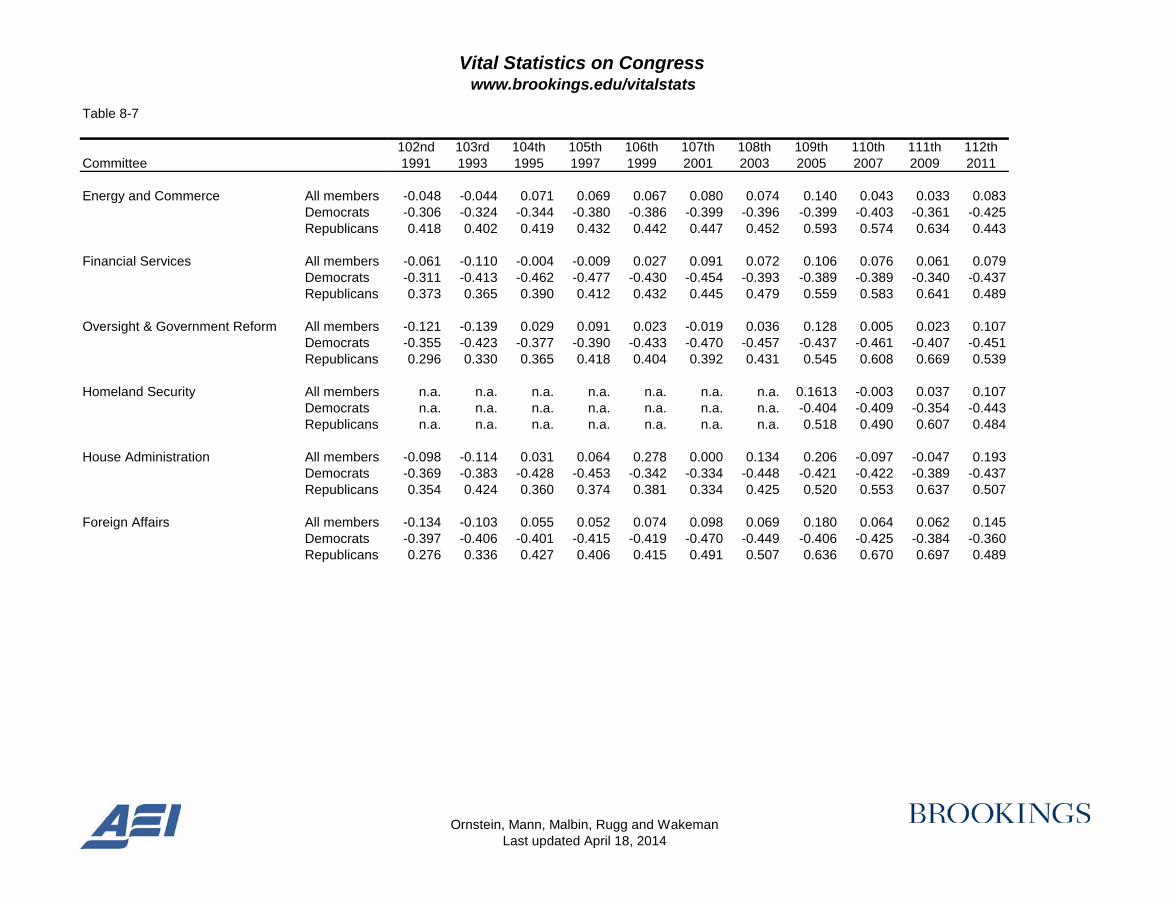
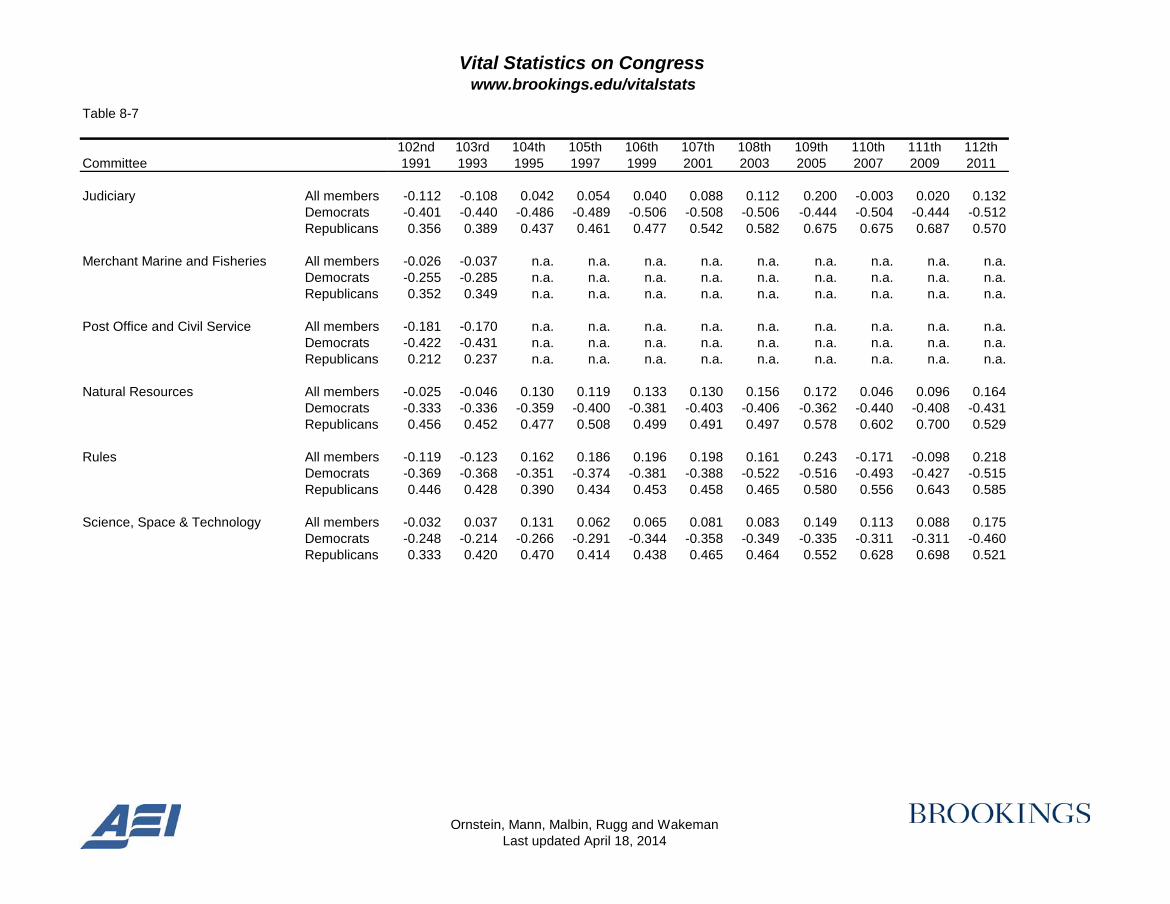
Average Ideological Positions of House Committees, 80th-112th Congresses

Vital Statistics on Congresswww.brookings.edu/vitalstats
Ornstein, Mann, Malbin, Rugg and WakemanLast updated April 18, 2014
Table 8-7
80th 81st 82nd 83rd 84th 85th 86th 87th 88th 89thCommittee 1947 1949 1951 1953 1955 1957 1959 1961 1963 1965
Average Ideological Positions of House Committees, 80th-112th Congresses
Energy and Commerce All members 0.065 -0.087 0.000 0.042 -0.001 0.028 -0.006 -0.003 -0.021 -0.065Democrats -0.235 -0.321 -0.226 -0.244 -0.211 -0.179 -0.176 -0.181 -0.201 -0.224Republicans 0.271 0.253 0.260 0.261 0.254 0.277 0.292 0.270 0.255 0.284
Financial Services All members 0.106 -0.061 -0.027 0.010 -0.051 -0.058 -0.139 -0.119 -0.124 -0.149Democrats -0.270 -0.366 -0.325 -0.374 -0.354 -0.356 -0.366 -0.369 -0.369 -0.327Republicans 0.365 0.382 0.321 0.342 0.344 0.332 0.253 0.255 0.215 0.206
Oversight & Government Reform All members 0.123 -0.156 -0.036 0.003 -0.035 -0.025 -0.082 -0.088 -0.129 -0.151Democrats -0.248 -0.380 -0.310 -0.366 -0.342 -0.310 -0.296 -0.294 -0.337 -0.352Republicans 0.355 0.420 0.362 0.325 0.367 0.347 0.288 0.269 0.200 0.268
Homeland Security All members n.a. n.a. n.a. n.a. n.a. n.a. n.a. n.a. n.a. n.a.Democrats n.a. n.a. n.a. n.a. n.a. n.a. n.a. n.a. n.a. n.a.Republicans n.a. n.a. n.a. n.a. n.a. n.a. n.a. n.a. n.a. n.a.
House Administration All members 0.172 -0.097 -0.012 0.106 0.004 0.016 -0.014 0.025 0.013 -0.042Democrats -0.062 -0.183 -0.179 -0.182 -0.196 -0.189 -0.183 -0.193 -0.170 -0.220Republicans 0.356 0.340 0.300 0.312 0.258 0.277 0.286 0.353 0.288 0.337
Foreign Affairs All members -0.032 -0.071 -0.053 0.019 0.015 -0.019 -0.152 -0.110 -0.066 -0.126Democrats -0.320 -0.297 -0.279 -0.236 -0.199 -0.261 -0.353 -0.294 -0.308 -0.340Republicans 0.213 0.196 0.212 0.227 0.257 0.256 0.230 0.172 0.306 0.302

Vital Statistics on Congresswww.brookings.edu/vitalstats
Ornstein, Mann, Malbin, Rugg and WakemanLast updated April 18, 2014
Table 8-7
80th 81st 82nd 83rd 84th 85th 86th 87th 88th 89thCommittee 1947 1949 1951 1953 1955 1957 1959 1961 1963 1965
Average Ideological Positions of House Committees, 80th-112th Congresses
Judiciary All members 0.080 -0.006 0.028 0.072 0.008 0.005 -0.048 -0.005 -0.038 -0.115Democrats -0.208 -0.190 -0.176 -0.159 -0.198 -0.196 -0.222 -0.198 -0.233 -0.278Republicans 0.310 0.306 0.316 0.260 0.272 0.262 0.283 0.271 0.240 0.239
Merchant Marine and Fisheries All members 0.039 -0.011 -0.020 0.031 -0.049 -0.008 -0.039 -0.019 -0.052 -0.105Democrats -0.256 -0.199 -0.251 -0.194 -0.296 -0.233 -0.242 -0.236 -0.221 -0.253Republicans 0.272 0.271 0.267 0.255 0.256 0.264 0.332 0.324 0.217 0.207
Post Office and Civil Service All members 0.135 -0.018 -0.009 0.101 0.060 0.037 -0.020 0.088 0.026 -0.086Democrats -0.145 -0.204 -0.249 -0.111 -0.170 -0.206 -0.258 -0.143 -0.284 -0.301Republicans 0.322 0.261 0.263 0.281 0.352 0.348 0.363 0.382 0.393 0.371
Natural Resources All members 0.107 0.020 0.041 0.119 -0.012 -0.006 -0.060 -0.007 0.001 -0.070Democrats -0.181 -0.172 -0.231 -0.113 -0.293 -0.281 -0.293 -0.218 -0.232 -0.253Republicans 0.300 0.289 0.381 0.317 0.334 0.328 0.290 0.285 0.318 0.295
Rules All members 0.245 0.002 0.002 0.190 -0.028 -0.049 -0.004 -0.040 -0.023 -0.047Democrats -0.121 -0.168 -0.176 -0.046 -0.222 -0.221 -0.220 -0.247 -0.246 -0.250Republicans 0.429 0.341 0.357 0.308 0.359 0.295 0.429 0.478 0.424 0.359
Science, Space & Technology All members n.a. n.a. n.a. n.a. n.a. n.a. -0.095 -0.075 -0.040 -0.081Democrats n.a. n.a. n.a. n.a. n.a. n.a. -0.266 -0.254 -0.239 -0.233Republicans n.a. n.a. n.a. n.a. n.a. n.a. 0.209 0.211 0.235 0.238

Vital Statistics on Congresswww.brookings.edu/vitalstats
Ornstein, Mann, Malbin, Rugg and WakemanLast updated April 18, 2014
Table 8-7
80th 81st 82nd 83rd 84th 85th 86th 87th 88th 89thCommittee 1947 1949 1951 1953 1955 1957 1959 1961 1963 1965
Average Ideological Positions of House Committees, 80th-112th Congresses
Small Business All members n.a. n.a. n.a. n.a. n.a. n.a. n.a. n.a. n.a. n.a.Democrats n.a. n.a. n.a. n.a. n.a. n.a. n.a. n.a. n.a. n.a.Republicans n.a. n.a. n.a. n.a. n.a. n.a. n.a. n.a. n.a. n.a.
Ethics All members n.a. n.a. n.a. n.a. n.a. n.a. n.a. n.a. n.a. n.a.Democrats n.a. n.a. n.a. n.a. n.a. n.a. n.a. n.a. n.a. n.a.Republicans n.a. n.a. n.a. n.a. n.a. n.a. n.a. n.a. n.a. n.a.
Transportation & Infrastructure All members 0.132 -0.002 0.018 0.057 0.027 0.011 -0.082 -0.042 -0.061 -0.087Democrats -0.150 -0.210 -0.219 -0.285 -0.197 -0.208 -0.273 -0.272 -0.279 -0.267Republicans 0.319 0.301 0.314 0.334 0.321 0.289 0.269 0.286 0.251 0.291
Veterans Affairs All members 0.090 -0.024 0.040 0.031 -0.019 0.001 -0.081 -0.004 -0.014 -0.060Democrats -0.148 -0.193 -0.098 -0.127 -0.192 -0.150 -0.222 -0.137 -0.151 -0.172Republicans 0.254 0.261 0.219 0.179 0.241 0.227 0.183 0.195 0.214 0.178
Ways & Means All members 0.174 0.001 0.017 0.107 -0.025 -0.031 -0.006 0.004 -0.016 -0.065Democrats -0.193 -0.276 -0.251 -0.299 -0.278 -0.288 -0.293 -0.281 -0.309 -0.285Republicans 0.418 0.418 0.419 0.377 0.356 0.354 0.471 0.479 0.424 0.402
Chamber average All members 0.100 -0.020 0.033 0.054 0.023 0.016 -0.057 -0.018 -0.026 -0.086Democrats -0.189 -0.235 -0.211 -0.209 -0.229 -0.228 -0.250 -0.229 -0.249 -0.264Republicans 0.328 0.313 0.315 0.309 0.309 0.297 0.299 0.300 0.294 0.286
n.a. = not available
Note: In 1995, the new Republican majority abolished the District of Columbia, Merchant Marine and Fisheries, and Post Office and Civil Service Committees. It also renamed several committees. For th changes, please see chapter 4. The committee titles here reflect the current names.
Source: Keith Poole, Professor of Political Science at the University of California, San Diego, and Ho Rosenthal, Professor of Politics at Princeton University, developed ideological scores based on mem voting records. The Poole-Rosenthal scores can be viewed at voteview.com. A positive score denote conservative ideology, while a negative score denotes a liberal one. Scores closest to zero reflect th centrist ideologies, while more extreme scores reflect stronger conservative or liberal ideologies. Da represent a statistical analysis of committee members' voting records performed by Charles Stewart Professor of Political Science at the Massachusetts Institute of Technology.

Vital Statistics on Congresswww.brookings.edu/vitalstats
Ornstein, Mann, Malbin, Rugg and WakemanLast updated April 18, 2014
Table 8-7
Committee
Agriculture All membersDemocratsRepublicans
Appropriations All membersDemocratsRepublicans
Armed Services All membersDemocratsRepublicans
Budget All membersDemocratsRepublicans
District of Columbia All membersDemocratsRepublicans
Education & the Workforce All membersDemocratsRepublicans
90th 91st 92nd 93rd 94th 95th 96th 97th 98th 99th 100th 101st1967 1969 1971 1973 1975 1977 1979 1981 1983 1985 1987 1989
0.121 0.102 0.034 0.033 -0.085 -0.065 -0.040 0.019 0.008 -0.002 0.008 0.020-0.034 -0.060 -0.150 -0.190 -0.248 -0.228 -0.213 -0.211 -0.187 -0.211 -0.211 -0.1960.327 0.297 0.323 0.311 0.267 0.260 0.271 0.309 0.333 0.318 0.343 0.362
-0.012 -0.028 -0.048 -0.058 -0.114 -0.126 -0.145 -0.102 -0.128 -0.122 -0.113 -0.118-0.211 -0.218 -0.255 -0.270 -0.289 -0.307 -0.337 -0.340 -0.346 -0.361 -0.360 -0.3640.288 0.273 0.277 0.274 0.247 0.247 0.238 0.254 0.247 0.258 0.279 0.275
0.021 0.039 0.040 0.064 0.005 0.010 0.024 0.068 0.081 0.064 0.035 0.022-0.167 -0.145 -0.125 -0.148 -0.139 -0.129 -0.117 -0.094 -0.127 -0.153 -0.182 -0.2090.274 0.304 0.298 0.331 0.291 0.299 0.278 0.292 0.411 0.372 0.371 0.353
n.a. n.a. n.a. -0.096 -0.105 -0.138 -0.150 -0.015 -0.077 -0.036 -0.047 -0.058n.a. n.a. n.a. -0.380 -0.322 -0.368 -0.378 -0.303 -0.339 -0.325 -0.338 -0.326n.a. n.a. n.a. 0.347 0.358 0.352 0.335 0.394 0.400 0.408 0.388 0.345
-0.012 0.000 -0.012 -0.059 -0.189 -0.179 -0.164 -0.278 -0.254 -0.241 -0.237 -0.211-0.161 -0.160 -0.180 -0.380 -0.288 -0.295 -0.397 -0.520 -0.539 -0.540 -0.531 -0.5790.177 0.202 0.241 0.321 0.036 0.037 0.209 0.206 0.245 0.282 0.279 0.433
-0.125 -0.126 -0.140 -0.112 -0.197 -0.173 -0.153 -0.101 -0.161 -0.090 -0.114 -0.155-0.427 -0.459 -0.429 -0.436 -0.393 -0.381 -0.403 -0.405 -0.400 -0.414 -0.377 -0.4370.285 0.318 0.285 0.320 0.228 0.242 0.327 0.312 0.295 0.327 0.312 0.321

Vital Statistics on Congresswww.brookings.edu/vitalstats
Ornstein, Mann, Malbin, Rugg and WakemanLast updated April 18, 2014
Table 8-7
Committee
Energy and Commerce All membersDemocratsRepublicans
Financial Services All membersDemocratsRepublicans
Oversight & Government Reform All membersDemocratsRepublicans
Homeland Security All membersDemocratsRepublicans
House Administration All membersDemocratsRepublicans
Foreign Affairs All membersDemocratsRepublicans
90th 91st 92nd 93rd 94th 95th 96th 97th 98th 99th 100th 101st1967 1969 1971 1973 1975 1977 1979 1981 1983 1985 1987 1989
-0.021 -0.043 -0.028 -0.029 -0.114 -0.120 -0.069 -0.021 -0.031 -0.045 -0.019 -0.026-0.249 -0.284 -0.289 -0.285 -0.305 -0.310 -0.300 -0.289 -0.296 -0.303 -0.303 -0.3070.288 0.272 0.335 0.294 0.270 0.273 0.331 0.323 0.360 0.373 0.399 0.402
-0.105 -0.073 -0.085 -0.118 -0.122 -0.128 -0.080 -0.052 -0.041 -0.058 -0.045 -0.055-0.354 -0.292 -0.331 -0.401 -0.341 -0.301 -0.307 -0.324 -0.299 -0.298 -0.289 -0.3210.233 0.218 0.277 0.273 0.318 0.229 0.304 0.311 0.360 0.314 0.320 0.344
-0.113 -0.147 -0.142 -0.118 -0.180 -0.144 -0.105 -0.050 -0.139 -0.046 -0.084 -0.103-0.338 -0.360 -0.382 -0.384 -0.374 -0.349 -0.324 -0.317 -0.343 -0.366 -0.358 -0.3960.185 0.156 0.205 0.221 0.223 0.279 0.285 0.295 0.304 0.387 0.387 0.367
n.a. n.a. n.a. n.a. n.a. n.a. n.a. n.a. n.a. n.a. n.a. n.a.n.a. n.a. n.a. n.a. n.a. n.a. n.a. n.a. n.a. n.a. n.a. n.a.n.a. n.a. n.a. n.a. n.a. n.a. n.a. n.a. n.a. n.a. n.a. n.a.
0.048 -0.027 -0.019 -0.075 -0.123 -0.122 -0.099 -0.050 -0.075 -0.071 -0.069 -0.086-0.155 -0.281 -0.308 -0.367 -0.345 -0.352 -0.372 -0.354 -0.342 -0.367 -0.366 -0.3550.306 0.295 0.414 0.349 0.347 0.367 0.385 0.368 0.383 0.436 0.439 0.350
-0.072 -0.072 -0.077 -0.062 -0.192 -0.195 -0.140 -0.102 -0.177 -0.101 -0.117 -0.137-0.346 -0.381 -0.340 -0.326 -0.371 -0.382 -0.343 -0.351 -0.394 -0.391 -0.376 -0.4150.310 0.310 0.249 0.233 0.152 0.178 0.216 0.230 0.258 0.325 0.321 0.287
Vital Statistics on Congresswww.brookings.edu/vitalstats
Ornstein, Mann, Malbin, Rugg and WakemanLast updated April 18, 2014
Table 8-7
Committee
Judiciary All membersDemocratsRepublicans
Merchant Marine and Fisheries All membersDemocratsRepublicans
Post Office and Civil Service All membersDemocratsRepublicans
Natural Resources All membersDemocratsRepublicans
Rules All membersDemocratsRepublicans
Science, Space & Technology All membersDemocratsRepublicans
90th 91st 92nd 93rd 94th 95th 96th 97th 98th 99th 100th 101st1967 1969 1971 1973 1975 1977 1979 1981 1983 1985 1987 1989
-0.059 -0.093 -0.121 -0.117 -0.167 -0.130 -0.112 -0.062 -0.132 -0.037 -0.072 -0.065-0.277 -0.347 -0.408 -0.436 -0.395 -0.327 -0.351 -0.358 -0.372 -0.387 -0.403 -0.3950.232 0.245 0.257 0.278 0.308 0.281 0.323 0.332 0.348 0.429 0.424 0.429
-0.058 -0.049 -0.049 -0.057 -0.124 -0.128 -0.095 -0.038 -0.036 -0.024 -0.021 -0.019-0.282 -0.259 -0.227 -0.278 -0.283 -0.307 -0.287 -0.218 -0.248 -0.242 -0.239 -0.2420.227 0.227 0.213 0.228 0.192 0.246 0.247 0.217 0.290 0.296 0.300 0.323
-0.045 -0.047 0.009 -0.032 -0.126 -0.151 -0.088 -0.129 -0.085 -0.163 -0.196 -0.185-0.312 -0.331 -0.279 -0.366 -0.357 -0.392 -0.335 -0.458 -0.432 -0.445 -0.451 -0.4420.318 0.340 0.442 0.427 0.361 0.360 0.350 0.363 0.400 0.296 0.219 0.214
-0.069 -0.060 -0.084 -0.055 -0.089 -0.091 -0.083 -0.040 -0.052 -0.017 -0.031 -0.065-0.318 -0.326 -0.339 -0.331 -0.314 -0.293 -0.300 -0.330 -0.289 -0.325 -0.318 -0.3470.269 0.301 0.308 0.268 0.329 0.327 0.321 0.378 0.388 0.434 0.439 0.434
-0.088 -0.088 -0.088 -0.122 -0.157 -0.161 -0.166 -0.168 -0.083 -0.093 -0.135 -0.130-0.308 -0.303 -0.299 -0.359 -0.380 -0.386 -0.388 -0.398 -0.385 -0.401 -0.395 -0.3700.351 0.342 0.333 0.352 0.333 0.336 0.321 0.337 0.400 0.399 0.385 0.351
-0.036 -0.040 -0.055 0.000 -0.094 -0.060 -0.052 -0.030 -0.086 0.014 0.009 -0.032-0.256 -0.251 -0.259 -0.206 -0.257 -0.223 -0.238 -0.249 -0.310 -0.228 -0.228 -0.2440.268 0.254 0.249 0.270 0.278 0.278 0.283 0.267 0.347 0.356 0.332 0.301
Vital Statistics on Congresswww.brookings.edu/vitalstats
Ornstein, Mann, Malbin, Rugg and WakemanLast updated April 18, 2014
Table 8-7
Committee
Small Business All membersDemocratsRepublicans
Ethics All membersDemocratsRepublicans
Transportation & Infrastructure All membersDemocratsRepublicans
Veterans Affairs All membersDemocratsRepublicans
Ways & Means All membersDemocratsRepublicans
Chamber average All membersDemocratsRepublicans
90th 91st 92nd 93rd 94th 95th 96th 97th 98th 99th 100th 101st1967 1969 1971 1973 1975 1977 1979 1981 1983 1985 1987 1989
n.a. n.a. n.a. n.a. -0.172 -0.164 -0.118 -0.050 -0.050 -0.033 -0.057 -0.047n.a. n.a. n.a. n.a. -0.350 -0.344 -0.304 -0.296 -0.257 -0.268 -0.294 -0.302n.a. n.a. n.a. n.a. 0.184 0.180 0.194 0.267 0.296 0.335 0.319 0.359
0.049 0.084 0.088 0.082 0.081 0.061 0.030 0.039 0.002 -0.036 -0.001 0.011-0.166 -0.131 -0.124 -0.160 -0.100 -0.085 -0.242 -0.340 -0.417 -0.374 -0.373 -0.3640.263 0.298 0.300 0.324 0.261 0.206 0.301 0.418 0.421 0.303 0.371 0.386
-0.029 -0.029 -0.103 -0.057 -0.096 -0.070 -0.037 -0.005 -0.074 -0.063 -0.036 -0.021-0.270 -0.279 -0.335 -0.294 -0.281 -0.244 -0.220 -0.258 -0.335 -0.333 -0.336 -0.3020.276 0.287 0.276 0.284 0.274 0.277 0.298 0.314 0.292 0.321 0.343 0.400
-0.011 -0.019 -0.023 -0.002 -0.066 -0.031 0.014 0.072 -0.035 -0.011 0.012 0.031-0.136 -0.191 -0.177 -0.154 -0.202 -0.154 -0.129 -0.139 -0.199 -0.224 -0.224 -0.2090.148 0.199 0.223 0.207 0.223 0.227 0.274 0.314 0.341 0.293 0.394 0.374
-0.026 -0.046 -0.052 -0.024 -0.076 -0.076 -0.099 -0.062 -0.064 -0.065 -0.074 -0.083-0.297 -0.284 -0.278 -0.263 -0.286 -0.288 -0.339 -0.304 -0.288 -0.304 -0.324 -0.3270.382 0.350 0.325 0.335 0.400 0.365 0.382 0.382 0.364 0.357 0.368 0.349
-0.026 -0.031 -0.050 -0.039 -0.113 -0.107 -0.079 -0.028 -0.052 -0.060 -0.073 -0.076-0.255 -0.270 -0.281 -0.296 -0.301 -0.293 -0.295 -0.296 -0.297 -0.313 -0.317 -0.3240.277 0.278 0.284 0.282 0.267 0.266 0.290 0.308 0.334 0.332 0.337 0.338
d he
oward mbers'
es a he most
ta above t,

Vital Statistics on Congresswww.brookings.edu/vitalstats
Ornstein, Mann, Malbin, Rugg and WakemanLast updated April 18, 2014
Table 8-7
Committee
Agriculture All membersDemocratsRepublicans
Appropriations All membersDemocratsRepublicans
Armed Services All membersDemocratsRepublicans
Budget All membersDemocratsRepublicans
District of Columbia All membersDemocratsRepublicans
Education & the Workforce All membersDemocratsRepublicans
102nd 103rd 104th 105th 106th 107th 108th 109th 110th 111th 112th1991 1993 1995 1997 1999 2001 2003 2005 2007 2009 2011
0.027 0.052 0.121 0.155 0.141 0.165 0.152 0.208 0.124 0.112 0.145-0.210 -0.237 -0.305 -0.251 -0.239 -0.257 -0.243 -0.216 -0.211 -0.195 -0.3200.403 0.438 0.468 0.471 0.464 0.462 0.473 0.563 0.543 0.590 0.485
-0.120 -0.101 0.038 0.028 0.035 0.052 0.047 0.110 -0.031 -0.054 0.056-0.373 -0.386 -0.404 -0.428 -0.410 -0.412 -0.395 -0.388 -0.423 -0.401 -0.4650.306 0.344 0.365 0.388 0.389 0.403 0.403 0.511 0.471 0.528 0.419
0.003 0.025 0.137 0.168 0.119 0.114 0.144 0.165 0.080 0.070 0.110-0.231 -0.229 -0.261 -0.281 -0.303 -0.324 -0.289 -0.309 -0.320 -0.262 -0.3640.370 0.395 0.456 0.466 0.462 0.470 0.485 0.541 0.551 0.549 0.462
-0.074 -0.083 0.094 0.094 0.096 0.130 0.127 0.210 0.043 -0.006 0.183-0.316 -0.323 -0.356 -0.360 -0.375 -0.413 -0.381 -0.332 -0.406 -0.389 -0.4340.324 0.346 0.446 0.466 0.484 0.500 0.529 0.629 0.625 0.649 0.624
-0.205 -0.161 n.a. n.a. n.a. n.a. n.a. n.a. n.a. n.a. n.a.-0.577 -0.553 n.a. n.a. n.a. n.a. n.a. n.a. n.a. n.a. n.a.0.446 0.427 n.a. n.a. n.a. n.a. n.a. n.a. n.a. n.a. n.a.
-0.164 -0.119 0.027 0.022 0.071 0.038 0.052 0.113 -0.040 -0.008 0.071-0.454 -0.426 -0.456 -0.447 -0.455 -0.460 -0.465 -0.428 -0.480 -0.439 -0.4650.350 0.400 0.404 0.467 0.496 0.459 0.459 0.590 0.553 0.629 0.445
Vital Statistics on Congresswww.brookings.edu/vitalstats
Ornstein, Mann, Malbin, Rugg and WakemanLast updated April 18, 2014
Table 8-7
Committee
Energy and Commerce All membersDemocratsRepublicans
Financial Services All membersDemocratsRepublicans
Oversight & Government Reform All membersDemocratsRepublicans
Homeland Security All membersDemocratsRepublicans
House Administration All membersDemocratsRepublicans
Foreign Affairs All membersDemocratsRepublicans
102nd 103rd 104th 105th 106th 107th 108th 109th 110th 111th 112th1991 1993 1995 1997 1999 2001 2003 2005 2007 2009 2011
-0.048 -0.044 0.071 0.069 0.067 0.080 0.074 0.140 0.043 0.033 0.083-0.306 -0.324 -0.344 -0.380 -0.386 -0.399 -0.396 -0.399 -0.403 -0.361 -0.4250.418 0.402 0.419 0.432 0.442 0.447 0.452 0.593 0.574 0.634 0.443
-0.061 -0.110 -0.004 -0.009 0.027 0.091 0.072 0.106 0.076 0.061 0.079-0.311 -0.413 -0.462 -0.477 -0.430 -0.454 -0.393 -0.389 -0.389 -0.340 -0.4370.373 0.365 0.390 0.412 0.432 0.445 0.479 0.559 0.583 0.641 0.489
-0.121 -0.139 0.029 0.091 0.023 -0.019 0.036 0.128 0.005 0.023 0.107-0.355 -0.423 -0.377 -0.390 -0.433 -0.470 -0.457 -0.437 -0.461 -0.407 -0.4510.296 0.330 0.365 0.418 0.404 0.392 0.431 0.545 0.608 0.669 0.539
n.a. n.a. n.a. n.a. n.a. n.a. n.a. 0.1613 -0.003 0.037 0.107n.a. n.a. n.a. n.a. n.a. n.a. n.a. -0.404 -0.409 -0.354 -0.443n.a. n.a. n.a. n.a. n.a. n.a. n.a. 0.518 0.490 0.607 0.484
-0.098 -0.114 0.031 0.064 0.278 0.000 0.134 0.206 -0.097 -0.047 0.193-0.369 -0.383 -0.428 -0.453 -0.342 -0.334 -0.448 -0.421 -0.422 -0.389 -0.4370.354 0.424 0.360 0.374 0.381 0.334 0.425 0.520 0.553 0.637 0.507
-0.134 -0.103 0.055 0.052 0.074 0.098 0.069 0.180 0.064 0.062 0.145-0.397 -0.406 -0.401 -0.415 -0.419 -0.470 -0.449 -0.406 -0.425 -0.384 -0.3600.276 0.336 0.427 0.406 0.415 0.491 0.507 0.636 0.670 0.697 0.489
Vital Statistics on Congresswww.brookings.edu/vitalstats
Ornstein, Mann, Malbin, Rugg and WakemanLast updated April 18, 2014
Table 8-7
Committee
Judiciary All membersDemocratsRepublicans
Merchant Marine and Fisheries All membersDemocratsRepublicans
Post Office and Civil Service All membersDemocratsRepublicans
Natural Resources All membersDemocratsRepublicans
Rules All membersDemocratsRepublicans
Science, Space & Technology All membersDemocratsRepublicans
102nd 103rd 104th 105th 106th 107th 108th 109th 110th 111th 112th1991 1993 1995 1997 1999 2001 2003 2005 2007 2009 2011
-0.112 -0.108 0.042 0.054 0.040 0.088 0.112 0.200 -0.003 0.020 0.132-0.401 -0.440 -0.486 -0.489 -0.506 -0.508 -0.506 -0.444 -0.504 -0.444 -0.5120.356 0.389 0.437 0.461 0.477 0.542 0.582 0.675 0.675 0.687 0.570
-0.026 -0.037 n.a. n.a. n.a. n.a. n.a. n.a. n.a. n.a. n.a.-0.255 -0.285 n.a. n.a. n.a. n.a. n.a. n.a. n.a. n.a. n.a.0.352 0.349 n.a. n.a. n.a. n.a. n.a. n.a. n.a. n.a. n.a.
-0.181 -0.170 n.a. n.a. n.a. n.a. n.a. n.a. n.a. n.a. n.a.-0.422 -0.431 n.a. n.a. n.a. n.a. n.a. n.a. n.a. n.a. n.a.0.212 0.237 n.a. n.a. n.a. n.a. n.a. n.a. n.a. n.a. n.a.
-0.025 -0.046 0.130 0.119 0.133 0.130 0.156 0.172 0.046 0.096 0.164-0.333 -0.336 -0.359 -0.400 -0.381 -0.403 -0.406 -0.362 -0.440 -0.408 -0.4310.456 0.452 0.477 0.508 0.499 0.491 0.497 0.578 0.602 0.700 0.529
-0.119 -0.123 0.162 0.186 0.196 0.198 0.161 0.243 -0.171 -0.098 0.218-0.369 -0.368 -0.351 -0.374 -0.381 -0.388 -0.522 -0.516 -0.493 -0.427 -0.5150.446 0.428 0.390 0.434 0.453 0.458 0.465 0.580 0.556 0.643 0.585
-0.032 0.037 0.131 0.062 0.065 0.081 0.083 0.149 0.113 0.088 0.175-0.248 -0.214 -0.266 -0.291 -0.344 -0.358 -0.349 -0.335 -0.311 -0.311 -0.4600.333 0.420 0.470 0.414 0.438 0.465 0.464 0.552 0.628 0.698 0.521

Vital Statistics on Congresswww.brookings.edu/vitalstats
Ornstein, Mann, Malbin, Rugg and WakemanLast updated April 18, 2014
Table 8-7
Committee
Small Business All membersDemocratsRepublicans
Ethics All membersDemocratsRepublicans
Transportation & Infrastructure All membersDemocratsRepublicans
Veterans Affairs All membersDemocratsRepublicans
Ways & Means All membersDemocratsRepublicans
Chamber average All membersDemocratsRepublicans
102nd 103rd 104th 105th 106th 107th 108th 109th 110th 111th 112th1991 1993 1995 1997 1999 2001 2003 2005 2007 2009 2011
-0.046 -0.061 0.054 0.085 0.070 0.067 0.140 0.203 0.038 0.128 0.115-0.302 -0.374 -0.411 -0.322 -0.391 -0.410 -0.401 -0.348 -0.368 -0.221 -0.4200.388 0.390 0.455 0.469 0.474 0.491 0.538 0.570 0.601 0.621 0.507
-0.034 -0.052 -0.081 -0.002 -0.329 0.150 0.058 0.078 0.085 0.073 0.020-0.450 -0.445 -0.477 -0.483 -0.479 -0.409 -0.335 -0.406 -0.434 -0.406 -0.4870.381 0.340 0.315 0.479 0.420 0.708 0.451 0.562 0.604 0.553 0.426
-0.016 -0.054 0.042 0.034 0.044 0.047 0.055 0.109 0.021 0.025 0.063-0.266 -0.296 -0.304 -0.333 -0.328 -0.358 -0.387 -0.358 -0.365 -0.337 -0.4040.389 0.353 0.344 0.356 0.376 0.381 0.410 0.516 0.475 0.556 0.428
0.015 -0.053 0.085 0.082 0.093 0.068 0.063 0.128 0.095 0.101 0.103-0.212 -0.314 -0.356 -0.380 -0.362 -0.365 -0.414 -0.362 -0.291 -0.222 -0.3550.383 0.404 0.453 0.457 0.450 0.423 0.428 0.553 0.569 0.630 0.464
-0.098 -0.101 0.066 0.060 0.060 0.065 0.074 0.146 -0.035 -0.035 0.060-0.348 -0.382 -0.425 -0.455 -0.467 -0.463 -0.463 -0.447 -0.464 -0.423 -0.4820.344 0.417 0.435 0.435 0.426 0.440 0.455 0.558 0.544 0.636 0.448
-0.091 -0.083 -0.071 0.039 0.033 0.034 0.054 0.129 0.036 0.027 0.084-0.321 -0.329 -0.368 -0.387 -0.392 -0.399 -0.403 -0.383 -0.391 -0.354 -0.4290.339 0.365 0.380 0.428 0.434 0.445 0.462 0.571 0.566 0.620 0.478

Vital Statistics on Congresswww.brookings.edu/vitalstats
Ornstein, Mann, Malbin, Rugg and WakemanLast updated April 18, 2014
Table 8-8
80th 81st 82nd 83rd 84th 85th 86th 87th 88th 89th 90thCommittee 1947 1949 1951 1953 1955 1957 1959 1961 1963 1965 1967
Agriculture, Nutrition, & Forestry All members 0.081 0.036 0.072 0.152 0.067 0.082 -0.006 -0.083 -0.050 -0.056 -0.040Democrats -0.168 -0.103 -0.097 -0.052 -0.139 -0.114 -0.200 -0.239 -0.211 -0.177 -0.125Republicans 0.294 0.258 0.268 0.331 0.302 0.306 0.350 0.201 0.245 0.160 0.129
Appropriations All members 0.133 0.056 0.093 0.106 0.081 0.079 -0.017 0.008 -0.058 -0.048 -0.078Democrats -0.095 -0.102 -0.109 -0.098 -0.101 -0.087 -0.167 -0.164 -0.191 -0.176 -0.200Republicans 0.305 0.314 0.316 0.293 0.279 0.278 0.283 0.301 0.207 0.206 0.153
Armed Services All members 0.083 0.060 0.087 0.044 0.063 0.067 0.000 0.009 -0.051 -0.013 -0.021Democrats -0.108 -0.059 -0.052 -0.095 -0.106 -0.107 -0.140 -0.130 -0.150 -0.158 -0.192Republicans 0.275 0.228 0.255 0.166 0.255 0.266 0.234 0.240 0.167 0.334 0.319
Banking, Housing, & Urban Affairs All members 0.023 -0.066 0.112 0.070 -0.057 0.011 -0.131 -0.174 -0.143 -0.143 -0.124Democrats -0.316 -0.284 -0.127 -0.206 -0.258 -0.204 -0.312 -0.353 -0.403 -0.393 -0.329Republicans 0.313 0.284 0.392 0.312 0.260 0.257 0.229 0.184 0.377 0.484 0.246
Budget All members n.a. n.a. n.a. n.a. n.a. n.a. n.a. n.a. n.a. n.a. n.a.Democrats n.a. n.a. n.a. n.a. n.a. n.a. n.a. n.a. n.a. n.a. n.a.Republicans n.a. n.a. n.a. n.a. n.a. n.a. n.a. n.a. n.a. n.a. n.a.
Commerce, Science, & Transportation All members 0.094 -0.018 0.089 0.048 0.058 0.097 -0.095 -0.093 -0.156 -0.146 -0.115Democrats -0.206 -0.234 -0.173 -0.179 -0.149 -0.164 -0.291 -0.289 -0.320 -0.342 -0.283Republicans 0.351 0.328 0.395 0.246 0.266 0.321 0.232 0.234 0.204 0.247 0.222
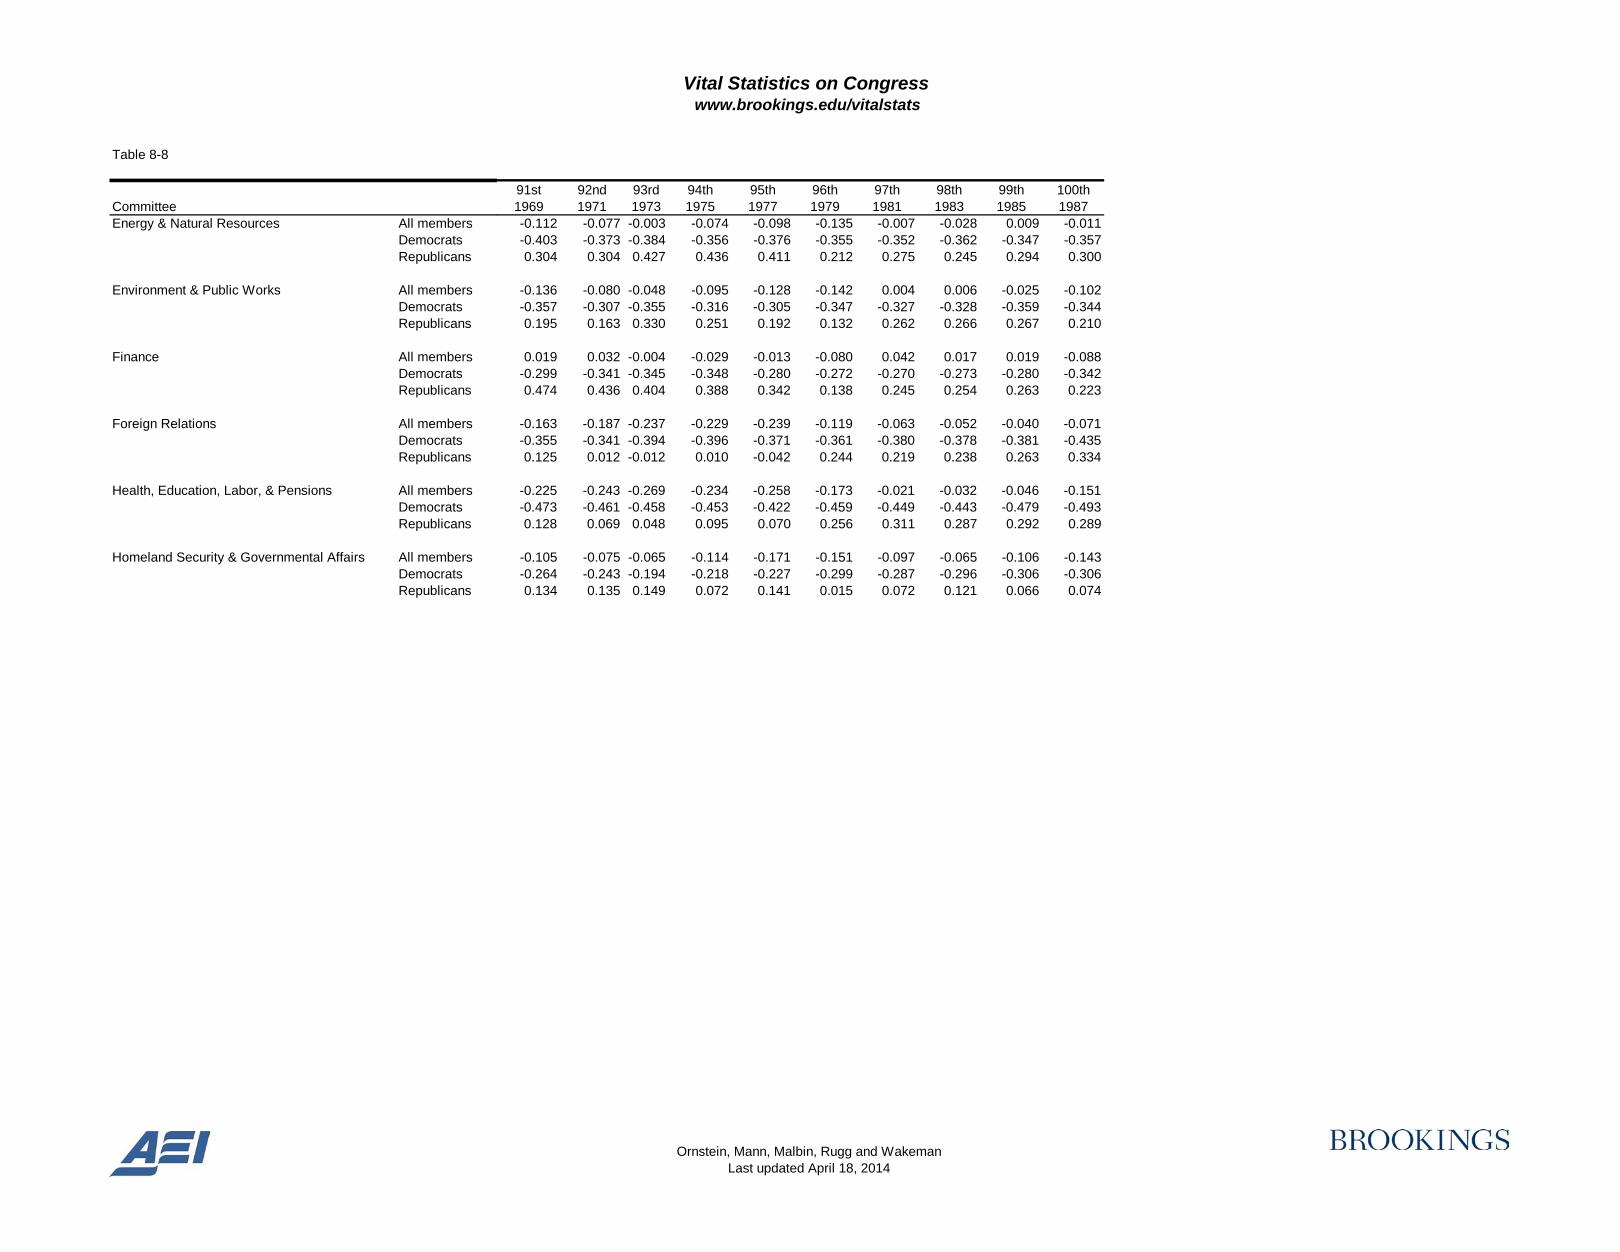
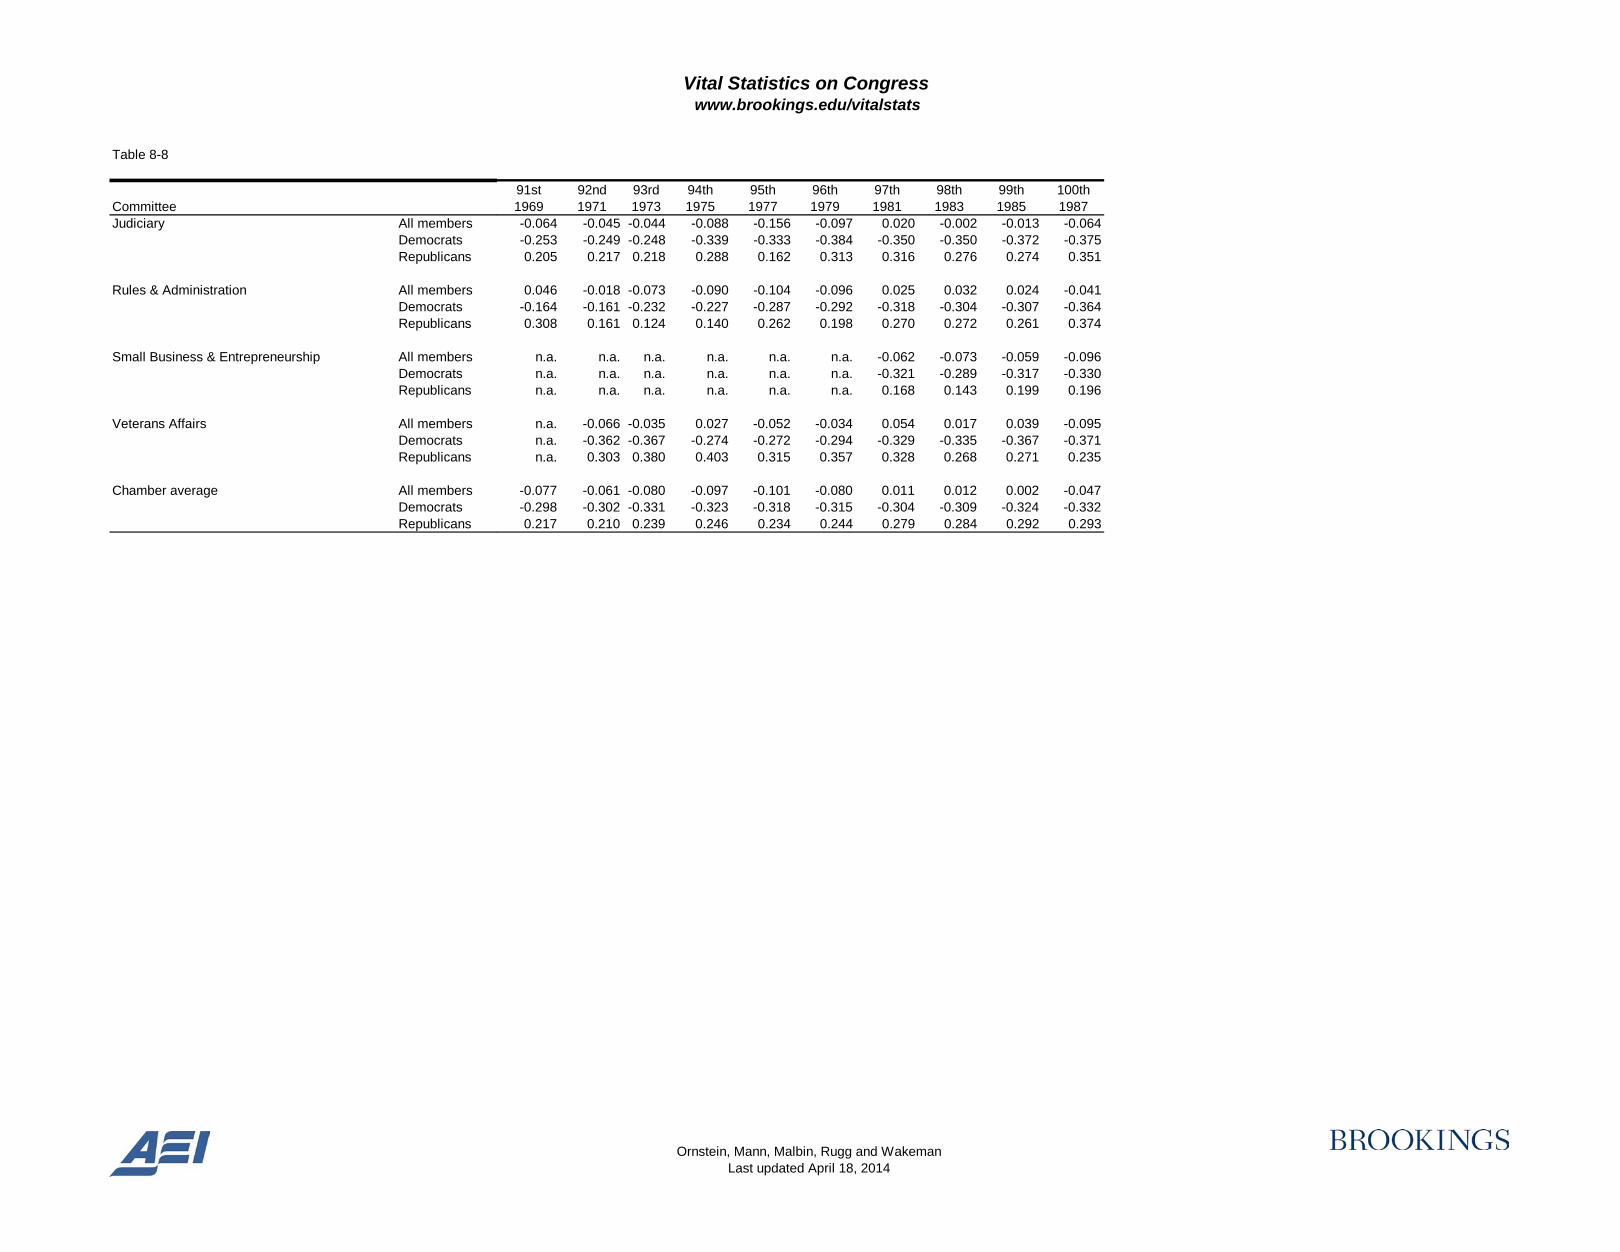
Average Ideological Positions of Senate Committees, 80th-112th Congresses

Vital Statistics on Congresswww.brookings.edu/vitalstats
Ornstein, Mann, Malbin, Rugg and WakemanLast updated April 18, 2014
Table 8-8
80th 81st 82nd 83rd 84th 85th 86th 87th 88th 89th 90thCommittee 1947 1949 1951 1953 1955 1957 1959 1961 1963 1965 1967
Average Ideological Positions of Senate Committees, 80th-112th Congresses
Energy & Natural Resources All members 0.144 0.036 0.022 0.087 -0.004 -0.059 -0.205 -0.159 -0.127 -0.169 -0.170Democrats -0.289 -0.276 -0.294 -0.204 -0.318 -0.405 -0.448 -0.417 -0.419 -0.418 -0.416Republicans 0.415 0.400 0.391 0.342 0.354 0.335 0.280 0.316 0.409 0.379 0.281
Environment & Public Works All members 0.190 0.110 0.147 0.061 -0.026 -0.059 -0.238 -0.236 -0.259 -0.254 -0.156Democrats -0.004 -0.097 -0.086 -0.120 -0.386 -0.410 -0.444 -0.440 -0.440 -0.430 -0.384Republicans 0.357 0.441 0.381 0.242 0.334 0.351 0.175 0.140 0.175 0.170 0.223
Finance All members 0.180 0.159 0.218 0.226 0.140 0.127 0.047 0.005 -0.022 -0.031 -0.064Democrats -0.100 -0.065 0.037 0.035 -0.065 -0.149 -0.182 -0.234 -0.270 -0.283 -0.336Republicans 0.419 0.421 0.430 0.394 0.375 0.442 0.468 0.442 0.431 0.432 0.433
Foreign Relations All members -0.022 -0.089 -0.058 -0.004 -0.095 -0.110 -0.157 -0.113 -0.125 -0.161 -0.175Democrats -0.268 -0.243 -0.166 -0.221 -0.279 -0.381 -0.335 -0.339 -0.324 -0.354 -0.411Republicans 0.189 0.157 0.093 0.185 0.199 0.200 0.169 0.300 0.355 0.257 0.231
Health, Education, Labor, & Pensions All members -0.029 -0.214 -0.211 -0.092 -0.183 -0.165 -0.245 -0.268 -0.226 -0.287 -0.235Democrats -0.347 -0.405 -0.449 -0.477 -0.514 -0.537 -0.499 -0.477 -0.492 -0.523 -0.519Republicans 0.198 0.169 0.123 0.237 0.204 0.208 0.137 0.150 0.307 0.231 0.239
Homeland Security & Governmental Affairs All members 0.074 -0.015 0.048 0.064 0.005 0.061 -0.054 -0.118 -0.125 -0.156 -0.138Democrats -0.124 -0.209 -0.162 -0.234 -0.234 -0.198 -0.288 -0.289 -0.311 -0.354 -0.355Republicans 0.245 0.211 0.292 0.319 0.244 0.320 0.415 0.225 0.248 0.339 0.295

Vital Statistics on Congresswww.brookings.edu/vitalstats
Ornstein, Mann, Malbin, Rugg and WakemanLast updated April 18, 2014
Table 8-8
80th 81st 82nd 83rd 84th 85th 86th 87th 88th 89th 90thCommittee 1947 1949 1951 1953 1955 1957 1959 1961 1963 1965 1967
Average Ideological Positions of Senate Committees, 80th-112th Congresses
Judiciary All members 0.041 -0.044 0.058 0.112 0.072 0.054 -0.102 -0.050 -0.110 -0.128 -0.082Democrats -0.207 -0.270 -0.139 -0.153 -0.181 -0.205 -0.274 -0.211 -0.266 -0.270 -0.256Republicans 0.254 0.273 0.287 0.344 0.361 0.351 0.241 0.272 0.201 0.155 0.301
Rules & Administration All members 0.092 -0.015 -0.040 0.057 0.033 -0.115 -0.113 -0.059 -0.119 -0.119 -0.119Democrats -0.279 -0.183 -0.291 -0.244 -0.335 -0.252 -0.262 -0.246 -0.293 -0.296 -0.299Republicans 0.324 0.256 0.252 0.297 0.493 0.114 0.186 0.315 0.229 0.235 0.242
Small Business & Entrepreneurship All members n.a. n.a. n.a. n.a. n.a. n.a. n.a. n.a. n.a. n.a. n.a.Democrats n.a. n.a. n.a. n.a. n.a. n.a. n.a. n.a. n.a. n.a. n.a.Republicans n.a. n.a. n.a. n.a. n.a. n.a. n.a. n.a. n.a. n.a. n.a.
Veterans Affairs All members n.a. n.a. n.a. n.a. n.a. n.a. n.a. n.a. n.a. n.a. n.a.Democrats n.a. n.a. n.a. n.a. n.a. n.a. n.a. n.a. n.a. n.a. n.a.Republicans n.a. n.a. n.a. n.a. n.a. n.a. n.a. n.a. n.a. n.a. n.a.
Chamber average All members 0.082 0.018 0.064 0.048 0.023 0.014 -0.100 -0.096 -0.113 -0.125 -0.110Democrats -0.173 -0.194 -0.162 -0.171 -0.226 -0.245 -0.290 -0.291 -0.310 -0.321 -0.311Republicans 0.307 0.287 0.306 0.280 0.291 0.278 0.248 0.260 0.279 0.284 0.248
n.a. = not available
Source: Keith Poole, Professor of Political Science at the University of California, San Diego, and Howard Rosenthal, Professor of Politics at Princeton University, developed ideological scores based on members' voting records. The Poole-Rosenthal scores can be viewed at voteview.com. A positive score denotes a conservative ideology, while a negative score denotes a liberal one. Scores closest to zero reflect the most centrist ideologies, while more extreme scores reflect stronger conservative or liberal ideologies. Data above represent a statistical analysis of committee members' voting records performed by Charles Stewart, Professor of Political Science at the Massachusetts Institute of Technology.

Vital Statistics on Congresswww.brookings.edu/vitalstats
Ornstein, Mann, Malbin, Rugg and WakemanLast updated April 18, 2014
Table 8-8
Committee
Agriculture, Nutrition, & Forestry All membersDemocratsRepublicans
Appropriations All membersDemocratsRepublicans
Armed Services All membersDemocratsRepublicans
Banking, Housing, & Urban Affairs All membersDemocratsRepublicans
Budget All membersDemocratsRepublicans
Commerce, Science, & Transportation All membersDemocratsRepublicans
91st 92nd 93rd 94th 95th 96th 97th 98th 99th 100th1969 1971 1973 1975 1977 1979 1981 1983 1985 1987
0.089 0.046 -0.011 -0.015 -0.020 0.022 0.081 0.100 0.059 0.038-0.042 -0.126 -0.278 -0.244 -0.269 -0.228 -0.189 -0.193 -0.234 -0.3150.243 0.275 0.345 0.396 0.394 0.335 0.322 0.335 0.319 0.351
-0.024 -0.052 -0.123 -0.148 -0.195 -0.099 -0.014 -0.031 -0.042 -0.083-0.183 -0.224 -0.266 -0.260 -0.270 -0.298 -0.272 -0.272 -0.297 -0.3020.199 0.151 0.071 0.032 -0.045 0.209 0.226 0.194 0.197 0.187
0.018 0.030 0.082 0.033 0.031 0.048 0.147 0.084 0.081 0.049-0.173 -0.227 -0.220 -0.297 -0.323 -0.263 -0.240 -0.297 -0.292 -0.2630.255 0.299 0.463 0.494 0.525 0.416 0.431 0.389 0.416 0.431
-0.192 -0.066 -0.107 -0.092 -0.089 -0.100 -0.039 -0.001 -0.005 -0.033-0.380 -0.335 -0.350 -0.333 -0.354 -0.394 -0.412 -0.397 -0.387 -0.3210.090 0.242 0.205 0.292 0.309 0.340 0.287 0.350 0.377 0.328
n.a. n.a. -0.138 -0.107 -0.137 -0.110 0.025 0.025 0.009 -0.009n.a. n.a. -0.408 -0.371 -0.381 -0.345 -0.337 -0.340 -0.348 -0.319n.a. n.a. 0.268 0.295 0.268 0.243 0.326 0.329 0.307 0.301
-0.102 -0.094 -0.105 -0.151 -0.148 -0.049 0.011 -0.002 -0.010 -0.077-0.319 -0.306 -0.324 -0.321 -0.275 -0.251 -0.225 -0.255 -0.283 -0.3270.197 0.172 0.208 0.120 0.232 0.239 0.221 0.223 0.232 0.229
Vital Statistics on Congresswww.brookings.edu/vitalstats
Ornstein, Mann, Malbin, Rugg and WakemanLast updated April 18, 2014
Table 8-8
CommitteeEnergy & Natural Resources All members
DemocratsRepublicans
Environment & Public Works All membersDemocratsRepublicans
Finance All membersDemocratsRepublicans
Foreign Relations All membersDemocratsRepublicans
Health, Education, Labor, & Pensions All membersDemocratsRepublicans
Homeland Security & Governmental Affairs All membersDemocratsRepublicans
91st 92nd 93rd 94th 95th 96th 97th 98th 99th 100th1969 1971 1973 1975 1977 1979 1981 1983 1985 1987-0.112 -0.077 -0.003 -0.074 -0.098 -0.135 -0.007 -0.028 0.009 -0.011-0.403 -0.373 -0.384 -0.356 -0.376 -0.355 -0.352 -0.362 -0.347 -0.3570.304 0.304 0.427 0.436 0.411 0.212 0.275 0.245 0.294 0.300
-0.136 -0.080 -0.048 -0.095 -0.128 -0.142 0.004 0.006 -0.025 -0.102-0.357 -0.307 -0.355 -0.316 -0.305 -0.347 -0.327 -0.328 -0.359 -0.3440.195 0.163 0.330 0.251 0.192 0.132 0.262 0.266 0.267 0.210
0.019 0.032 -0.004 -0.029 -0.013 -0.080 0.042 0.017 0.019 -0.088-0.299 -0.341 -0.345 -0.348 -0.280 -0.272 -0.270 -0.273 -0.280 -0.3420.474 0.436 0.404 0.388 0.342 0.138 0.245 0.254 0.263 0.223
-0.163 -0.187 -0.237 -0.229 -0.239 -0.119 -0.063 -0.052 -0.040 -0.071-0.355 -0.341 -0.394 -0.396 -0.371 -0.361 -0.380 -0.378 -0.381 -0.4350.125 0.012 -0.012 0.010 -0.042 0.244 0.219 0.238 0.263 0.334
-0.225 -0.243 -0.269 -0.234 -0.258 -0.173 -0.021 -0.032 -0.046 -0.151-0.473 -0.461 -0.458 -0.453 -0.422 -0.459 -0.449 -0.443 -0.479 -0.4930.128 0.069 0.048 0.095 0.070 0.256 0.311 0.287 0.292 0.289
-0.105 -0.075 -0.065 -0.114 -0.171 -0.151 -0.097 -0.065 -0.106 -0.143-0.264 -0.243 -0.194 -0.218 -0.227 -0.299 -0.287 -0.296 -0.306 -0.3060.134 0.135 0.149 0.072 0.141 0.015 0.072 0.121 0.066 0.074
Vital Statistics on Congresswww.brookings.edu/vitalstats
Ornstein, Mann, Malbin, Rugg and WakemanLast updated April 18, 2014
Table 8-8
CommitteeJudiciary All members
DemocratsRepublicans
Rules & Administration All membersDemocratsRepublicans
Small Business & Entrepreneurship All membersDemocratsRepublicans
Veterans Affairs All membersDemocratsRepublicans
Chamber average All membersDemocratsRepublicans
91st 92nd 93rd 94th 95th 96th 97th 98th 99th 100th1969 1971 1973 1975 1977 1979 1981 1983 1985 1987-0.064 -0.045 -0.044 -0.088 -0.156 -0.097 0.020 -0.002 -0.013 -0.064-0.253 -0.249 -0.248 -0.339 -0.333 -0.384 -0.350 -0.350 -0.372 -0.3750.205 0.217 0.218 0.288 0.162 0.313 0.316 0.276 0.274 0.351
0.046 -0.018 -0.073 -0.090 -0.104 -0.096 0.025 0.032 0.024 -0.041-0.164 -0.161 -0.232 -0.227 -0.287 -0.292 -0.318 -0.304 -0.307 -0.3640.308 0.161 0.124 0.140 0.262 0.198 0.270 0.272 0.261 0.374
n.a. n.a. n.a. n.a. n.a. n.a. -0.062 -0.073 -0.059 -0.096n.a. n.a. n.a. n.a. n.a. n.a. -0.321 -0.289 -0.317 -0.330n.a. n.a. n.a. n.a. n.a. n.a. 0.168 0.143 0.199 0.196
n.a. -0.066 -0.035 0.027 -0.052 -0.034 0.054 0.017 0.039 -0.095n.a. -0.362 -0.367 -0.274 -0.272 -0.294 -0.329 -0.335 -0.367 -0.371n.a. 0.303 0.380 0.403 0.315 0.357 0.328 0.268 0.271 0.235
-0.077 -0.061 -0.080 -0.097 -0.101 -0.080 0.011 0.012 0.002 -0.047-0.298 -0.302 -0.331 -0.323 -0.318 -0.315 -0.304 -0.309 -0.324 -0.3320.217 0.210 0.239 0.246 0.234 0.244 0.279 0.284 0.292 0.293

Vital Statistics on Congresswww.brookings.edu/vitalstats
Ornstein, Mann, Malbin, Rugg and WakemanLast updated April 18, 2014
Table 8-8
Committee
Agriculture, Nutrition, & Forestry All membersDemocratsRepublicans
Appropriations All membersDemocratsRepublicans
Armed Services All membersDemocratsRepublicans
Banking, Housing, & Urban Affairs All membersDemocratsRepublicans
Budget All membersDemocratsRepublicans
Commerce, Science, & Transportation All membersDemocratsRepublicans
101st 102nd 103rd 104th 105th 106th 107th 108th 109th 110th 111th 112th1989 1991 1993 1995 1997 1999 2001 2003 2005 2007 2009 2011
0.024 0.042 -0.006 0.063 0.096 0.081 0.077 0.044 0.065 0.018 -0.004 0.019-0.309 -0.313 -0.355 -0.327 -0.345 -0.339 -0.300 -0.297 -0.341 -0.375 -0.341 -0.3010.357 0.397 0.429 0.410 0.448 0.417 0.454 0.355 0.398 0.412 0.446 0.370
-0.080 -0.103 -0.065 -0.022 -0.001 -0.002 -0.026 -0.008 0.015 -0.023 -0.098 -0.005-0.350 -0.354 -0.355 -0.373 -0.411 -0.406 -0.382 -0.383 -0.396 -0.414 -0.386 -0.3220.253 0.231 0.293 0.282 0.354 0.348 0.330 0.342 0.371 0.397 0.335 0.357
-0.010 -0.004 0.044 0.067 0.069 0.072 0.040 0.016 0.012 0.012 -0.002 0.033-0.286 -0.287 -0.278 -0.319 -0.360 -0.371 -0.370 -0.392 -0.386 -0.386 -0.348 -0.2800.370 0.386 0.437 0.418 0.412 0.435 0.449 0.392 0.443 0.443 0.460 0.397
-0.035 -0.036 -0.056 0.049 0.063 0.080 0.054 0.041 0.078 0.003 0.009 0.019-0.346 -0.346 -0.376 -0.441 -0.455 -0.408 -0.371 -0.371 -0.407 -0.437 -0.381 -0.3420.307 0.305 0.384 0.431 0.477 0.479 0.478 0.416 0.475 0.486 0.515 0.453
-0.005 0.013 -0.047 0.023 -0.021 -0.017 -0.019 0.042 0.078 -0.027 -0.009 0.051-0.325 -0.341 -0.395 -0.396 -0.472 -0.473 -0.426 -0.436 -0.435 -0.537 -0.425 -0.3570.344 0.403 0.419 0.373 0.355 0.363 0.387 0.480 0.506 0.530 0.532 0.495
-0.049 -0.046 -0.014 0.023 0.044 0.046 -0.014 -0.009 0.060 -0.017 0.008 0.054-0.280 -0.282 -0.294 -0.300 -0.327 -0.325 -0.348 -0.378 -0.370 -0.422 -0.363 -0.3160.269 0.278 0.296 0.314 0.347 0.350 0.320 0.330 0.418 0.425 0.481 0.454

Vital Statistics on Congresswww.brookings.edu/vitalstats
Ornstein, Mann, Malbin, Rugg and WakemanLast updated April 18, 2014
Table 8-8
CommitteeEnergy & Natural Resources All members
DemocratsRepublicans
Environment & Public Works All membersDemocratsRepublicans
Finance All membersDemocratsRepublicans
Foreign Relations All membersDemocratsRepublicans
Health, Education, Labor, & Pensions All membersDemocratsRepublicans
Homeland Security & Governmental Affairs All membersDemocratsRepublicans
101st 102nd 103rd 104th 105th 106th 107th 108th 109th 110th 111th 112th1989 1991 1993 1995 1997 1999 2001 2003 2005 2007 2009 2011
0.013 -0.007 -0.012 0.035 0.072 0.070 0.035 0.051 0.050 0.008 0.016 0.049-0.323 -0.331 -0.323 -0.375 -0.341 -0.323 -0.352 -0.354 -0.373 -0.419 -0.346 -0.3330.386 0.388 0.369 0.364 0.409 0.392 0.422 0.423 0.403 0.475 0.486 0.506
-0.066 -0.145 -0.081 0.100 0.090 0.051 -0.027 0.027 0.062 -0.020 -0.104 -0.013-0.318 -0.368 -0.396 -0.364 -0.378 -0.384 -0.392 -0.369 -0.391 -0.469 -0.440 -0.3930.257 0.190 0.369 0.461 0.464 0.399 0.337 0.381 0.425 0.480 0.473 0.461
-0.085 -0.088 -0.061 0.003 0.036 0.057 0.045 0.081 0.076 -0.004 0.016 0.038-0.347 -0.329 -0.347 -0.343 -0.313 -0.296 -0.301 -0.300 -0.353 -0.389 -0.351 -0.3130.234 0.205 0.257 0.286 0.322 0.347 0.390 0.430 0.426 0.419 0.493 0.453
-0.014 -0.037 -0.105 0.034 0.032 0.018 -0.066 -0.064 -0.055 -0.074 -0.018 0.061-0.405 -0.411 -0.440 -0.445 -0.489 -0.527 -0.510 -0.506 -0.473 -0.521 -0.425 -0.3740.420 0.430 0.354 0.416 0.448 0.454 0.378 0.334 0.280 0.417 0.542 0.546
-0.185 -0.209 -0.194 -0.067 -0.050 -0.032 -0.076 -0.011 0.046 -0.034 -0.047 -0.011-0.497 -0.508 -0.498 -0.526 -0.506 -0.507 -0.493 -0.457 -0.449 -0.528 -0.453 -0.3810.217 0.219 0.241 0.291 0.315 0.349 0.340 0.383 0.451 0.510 0.481 0.434
-0.113 -0.129 -0.130 0.009 -0.006 -0.028 -0.035 -0.061 -0.010 -0.044 -0.045 0.090-0.295 -0.320 -0.347 -0.353 -0.387 -0.390 -0.367 -0.433 -0.399 -0.378 -0.360 -0.2700.129 0.126 0.217 0.326 0.291 0.253 0.297 0.270 0.293 0.333 0.405 0.496

Vital Statistics on Congresswww.brookings.edu/vitalstats
Ornstein, Mann, Malbin, Rugg and WakemanLast updated April 18, 2014
Table 8-8
CommitteeJudiciary All members
DemocratsRepublicans
Rules & Administration All membersDemocratsRepublicans
Small Business & Entrepreneurship All membersDemocratsRepublicans
Veterans Affairs All membersDemocratsRepublicans
Chamber average All membersDemocratsRepublicans
101st 102nd 103rd 104th 105th 106th 107th 108th 109th 110th 111th 112th1989 1991 1993 1995 1997 1999 2001 2003 2005 2007 2009 2011-0.063 -0.074 -0.085 0.010 0.009 0.034 -0.047 -0.017 -0.048 -0.048 -0.071 0.043-0.372 -0.376 -0.388 -0.418 -0.459 -0.450 -0.476 -0.476 -0.540 -0.540 -0.441 -0.3670.350 0.329 0.293 0.353 0.384 0.421 0.382 0.396 0.499 0.499 0.562 0.555
-0.035 -0.075 -0.049 0.042 0.089 0.082 0.043 0.032 0.058 -0.014 -0.039 0.002-0.366 -0.368 -0.335 -0.359 -0.338 -0.363 -0.351 -0.376 -0.383 -0.392 -0.392 -0.3030.390 0.364 0.319 0.354 0.421 0.429 0.436 0.400 0.410 0.405 0.446 0.384
-0.037 -0.079 -0.056 0.013 0.029 0.001 -0.038 0.006 0.071 -0.017 -0.013 0.058-0.315 -0.367 -0.393 -0.395 -0.427 -0.428 -0.430 -0.372 -0.362 -0.400 -0.352 -0.3060.345 0.374 0.394 0.347 0.394 0.344 0.354 0.345 0.417 0.408 0.453 0.463
-0.108 -0.131 -0.118 0.033 -0.034 -0.033 -0.021 0.059 0.083 -0.060 -0.096 -0.018-0.377 -0.380 -0.332 -0.336 -0.477 -0.487 -0.341 -0.268 -0.401 -0.499 -0.419 -0.3640.213 0.219 0.182 0.296 0.283 0.291 0.300 0.354 0.446 0.441 0.441 0.377
-0.045 -0.060 -0.059 -0.040 0.029 0.028 -0.005 -0.002 0.060 -0.010 -0.033 0.031-0.336 -0.340 -0.349 -0.358 -0.396 -0.394 -0.388 -0.388 -0.424 -0.441 -0.368 -0.3280.310 0.306 0.308 0.304 0.389 0.387 0.386 0.369 0.456 0.440 0.425 0.445
Vital Statistics on Congresswww.brookings.edu/vitalstats
Ornstein, Mann, Malbin, Rugg and WakemanLast updated April 18, 2014
Table 8-9
CongressEntire
chamber Democrats RepublicansNonsouthern Democrats
Southern Democrats
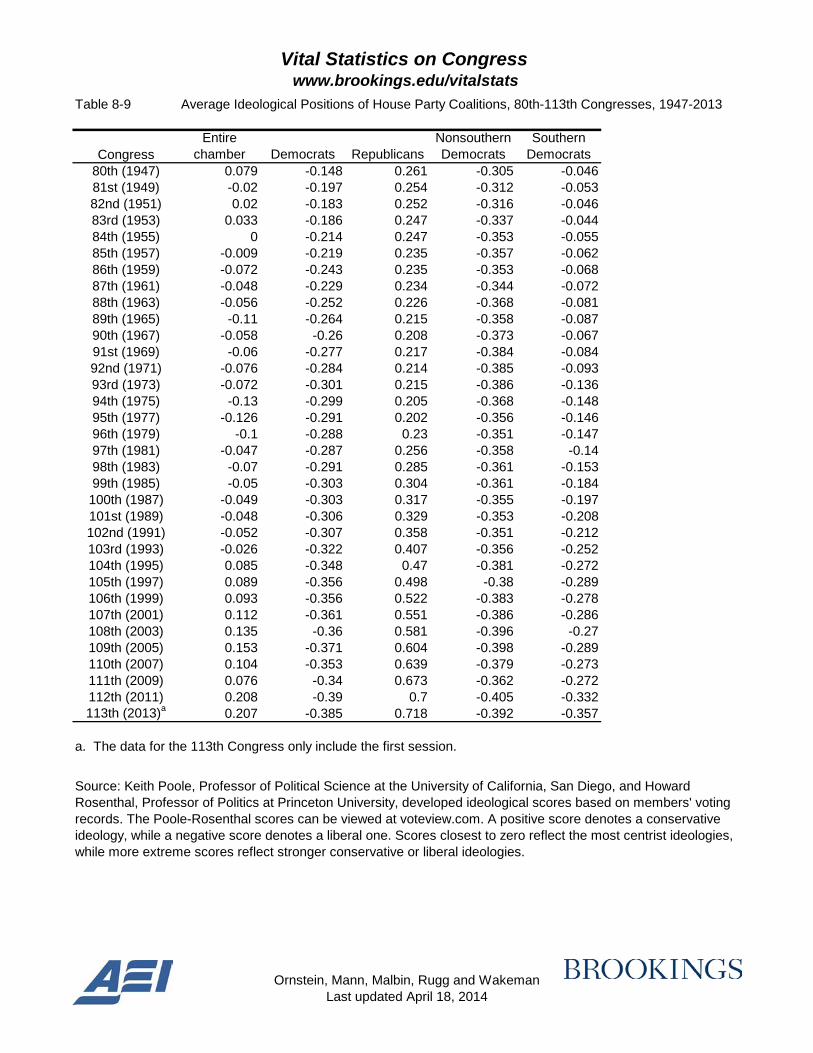
80th (1947) 0.079 -0.148 0.261 -0.305 -0.04681st (1949) -0.02 -0.197 0.254 -0.312 -0.05382nd (1951) 0.02 -0.183 0.252 -0.316 -0.04683rd (1953) 0.033 -0.186 0.247 -0.337 -0.04484th (1955) 0 -0.214 0.247 -0.353 -0.05585th (1957) -0.009 -0.219 0.235 -0.357 -0.06286th (1959) -0.072 -0.243 0.235 -0.353 -0.06887th (1961) -0.048 -0.229 0.234 -0.344 -0.07288th (1963) -0.056 -0.252 0.226 -0.368 -0.08189th (1965) -0.11 -0.264 0.215 -0.358 -0.08790th (1967) -0.058 -0.26 0.208 -0.373 -0.06791st (1969) -0.06 -0.277 0.217 -0.384 -0.08492nd (1971) -0.076 -0.284 0.214 -0.385 -0.09393rd (1973) -0.072 -0.301 0.215 -0.386 -0.13694th (1975) -0.13 -0.299 0.205 -0.368 -0.14895th (1977) -0.126 -0.291 0.202 -0.356 -0.14696th (1979) -0.1 -0.288 0.23 -0.351 -0.14797th (1981) -0.047 -0.287 0.256 -0.358 -0.1498th (1983) -0.07 -0.291 0.285 -0.361 -0.15399th (1985) -0.05 -0.303 0.304 -0.361 -0.184100th (1987) -0.049 -0.303 0.317 -0.355 -0.197101st (1989) -0.048 -0.306 0.329 -0.353 -0.208102nd (1991) -0.052 -0.307 0.358 -0.351 -0.212103rd (1993) -0.026 -0.322 0.407 -0.356 -0.252104th (1995) 0.085 -0.348 0.47 -0.381 -0.272105th (1997) 0.089 -0.356 0.498 -0.38 -0.289106th (1999) 0.093 -0.356 0.522 -0.383 -0.278107th (2001) 0.112 -0.361 0.551 -0.386 -0.286108th (2003) 0.135 -0.36 0.581 -0.396 -0.27109th (2005) 0.153 -0.371 0.604 -0.398 -0.289110th (2007) 0.104 -0.353 0.639 -0.379 -0.273111th (2009) 0.076 -0.34 0.673 -0.362 -0.272112th (2011) 0.208 -0.39 0.7 -0.405 -0.332113th (2013)a 0.207 -0.385 0.718 -0.392 -0.357
a. The data for the 113th Congress only include the first session.
Average Ideological Positions of House Party Coalitions, 80th-113th Congresses, 1947-2013
Source: Keith Poole, Professor of Political Science at the University of California, San Diego, and Howard Rosenthal, Professor of Politics at Princeton University, developed ideological scores based on members' voting records. The Poole-Rosenthal scores can be viewed at voteview.com. A positive score denotes a conservative ideology, while a negative score denotes a liberal one. Scores closest to zero reflect the most centrist ideologies, while more extreme scores reflect stronger conservative or liberal ideologies.

Vital Statistics on Congresswww.brookings.edu/vitalstats
Ornstein, Mann, Malbin, Rugg and WakemanLast updated April 18, 2014
Table 8-10
CongressEntire
chamber Democrats RepublicansNonsouthern Democrats
Southern Democrats
80th (1947) 0.096 -0.053 0.23 -0.178 0.05281st (1949) 0.027 -0.119 0.212 -0.212 -0.00982nd (1951) 0.067 -0.087 0.23 -0.192 0.01183rd (1953) 0.071 -0.093 0.245 -0.205 0.00284th (1955) 0.038 -0.154 0.258 -0.287 -0.04485th (1957) 0.028 -0.186 0.254 -0.317 -0.04986th (1959) -0.063 -0.232 0.244 -0.334 -0.0587th (1961) -0.054 -0.249 0.269 -0.37 -0.03888th (1963) -0.097 -0.27 0.275 -0.378 -0.05789th (1965) -0.103 -0.283 0.278 -0.383 -0.07790th (1967) -0.098 -0.289 0.237 -0.366 -0.12991st (1969) -0.057 -0.284 0.235 -0.365 -0.11892nd (1971) -0.04 -0.277 0.227 -0.354 -0.11793rd (1973) -0.057 -0.311 0.255 -0.379 -0.12194th (1975) -0.083 -0.304 0.252 -0.374 -0.12395th (1977) -0.102 -0.301 0.234 -0.375 -0.1396th (1979) -0.075 -0.297 0.243 -0.347 -0.1897th (1981) 0.021 -0.284 0.272 -0.328 -0.18698th (1983) 0.02 -0.289 0.274 -0.331 -0.19299th (1985) 0.014 -0.302 0.285 -0.343 -0.206100th (1987) -0.033 -0.311 0.286 -0.357 -0.217101st (1989) -0.036 -0.311 0.299 -0.346 -0.229102nd (1991) -0.045 -0.32 0.309 -0.354 -0.236103rd (1993) -0.046 -0.33 0.329 -0.365 -0.231104th (1995) 0.023 -0.343 0.349 -0.366 -0.252105th (1997) 0.045 -0.358 0.381 -0.375 -0.273106th (1999) 0.045 -0.346 0.374 -0.375 -0.225107th (2001) 0.022 -0.345 0.388 -0.371 -0.224108th (2003) 0.03 -0.342 0.382 -0.37 -0.224109th (2005) 0.068 -0.359 0.419 -0.37 -0.245110th (2007) 0.047 -0.352 0.445 -0.365 -0.23111th (2009) -0.028 -0.361 0.463 -0.377 -0.23112th (2011) 0.054 -0.357 0.523 -0.372 -0.238113th (2013)a 0.026 -0.387 0.55 -0.403 -0.252
a. The data for the 113th Congress only include the first session.
Source: Keith Poole, Professor of Political Science at the University of California, San Diego, and Howard Rosenthal, Professor of Politics at Princeton University, developed ideological scores based on members' voting records. The Poole-Rosenthal scores can be viewed at voteview.com. A positive score denotes a conservative ideology, while a negative score denotes a liberal one. Scores closest to zero reflect the most centrist ideologies, while more extreme scores reflect stronger conservative or liberal ideologies.
Average Ideological Positions of Senate Party Coalitions, 80th-113th Congresses, 1947-2013