Embed Size (px)
Citation preview

CONFIDENTIAL
Manitoba Fiscal Performance Review
Phase 2 ReportBusiness Case –Procurement Modernization
BUSINESS CASE: PROCUREMENT MODERNIZATION

© 2017 KPMG LLP, a Canadian limited liability partnership and a member firm of the KPMG network of independent member firms affiliated with KPMG International Cooperative (“KPMG International”), a Swiss entity. All rights reserved. The KPMG name and logo are registered trademarks or trademarks of KPMG International. 1
CONFIDENTIAL
Notice
This Phase 2 report (the “Report”) by KPMG LLP (“KPMG”) is provided to The Province of Manitoba’s Treasury Board represented by the Minister of Finance (“Manitoba”) pursuant to the consulting service agreement dated July 14, 2016 to conduct an independent fiscal performance review (the “Review”) of Core Government spending (except the Department of Health) for Manitoba.
If this Report is received by anyone other than Manitoba, the recipient is placed on notice that the attached Report has beenprepared solely for Manitoba for its own internal use and this Report and its contents may not be shared with or disclosed toanyone by the recipient without the express written consent of KPMG and Manitoba. KPMG does not accept any liability or responsibility to any third party who may use or place reliance on our Report.
Our scope was limited to a review and observations over a relatively short timeframe. The intention of the Report is to developbusiness cases for select areas of opportunity. The procedures we performed were limited in nature and extent, and those procedures will not necessarily disclose all matters about departmental functions, policies and operations, or reveal errors in the underlying information.
Our procedures consisted of inquiry, observation, comparison and analysis of Manitoba-provided information. In addition, we considered leading practices. Readers are cautioned that the potential cost improvements outlined in this Report are order of magnitude estimates only. Actual results achieved as a result of implementing opportunities are dependent upon Manitoba and department actions and variations may be material.
The procedures we performed do not constitute an audit, examination or review in accordance with standards established by theChartered Professional Accountants of Canada, and we have not otherwise verified the information we obtained or presented in this Report. We express no opinion or any form of assurance on the information presented in our Report, and make no representations concerning its accuracy or completeness. We also express no opinion or any form of assurance on potential cost improvements that Manitoba may realize should it decide to implement the options and considerations contained within this Report. Manitoba is responsible for the decisions to implement any options and for considering their impact. Implementation will require Manitoba to plan and test any changes to ensure that Manitoba will realize satisfactory results.

© 2017 KPMG LLP, a Canadian limited liability partnership and a member firm of the KPMG network of independent member firms affiliated with KPMG International Cooperative (“KPMG International”), a Swiss entity. All rights reserved. The KPMG name and logo are registered trademarks or trademarks of KPMG International. 2
CONFIDENTIAL
Table of Contents – Procurement Modernization
Notice 1
1 – Purpose and Objective 31.1 Organizational Needs and Desired Outcomes 31.2 Description of Approach 4
2 – Strategic Context 62.1 Problem/Opportunity Statement 62.2 Cost Drivers for Change 82.3 Scope and Key Assumptions 9
3 – Analysis 103.1 Fiscal Performance Review Framework and Evaluation Criteria 103.2 Procurement: Gaps to Leading Practices and Future State 123.3 Overview of Spend Categories and Adjusted Spend 153.4 Strategic Sourcing Category Initiatives 17
4 – Options 194.1 Procurement Options for Re-Organization 194.2 Options Analysis 25
5 – Considerations 295.1 Preferred Option 295.2 Benefits and Potential Cost Improvements 315.3 Risks 325.4 Implementation Plan Framework at a High-level 33
AppendicesAppendix A – Source-to-Pay metrics 35Appendix B – Category Detailed Spend Analysis 44

© 2017 KPMG LLP, a Canadian limited liability partnership and a member firm of the KPMG network of independent member firms affiliated with KPMG International Cooperative (“KPMG International”), a Swiss entity. All rights reserved. The KPMG name and logo are registered trademarks or trademarks of KPMG International. 3
CONFIDENTIAL
1.1 Organizational Needs and Desired OutcomesPurpose and Objective
Currently a decentralized environment, the Procurement Services Branch (PSB) is housed within the Department of Finance and has authority to procure goods and materials of over $2,500 for Manitoba government departments.
Most services do not go through the Procurement Services Branch, as the PSB does not have legislated mandate for services even though there are dedicated resources to services in the PSB.
The Procurement Services Branch of the Government of Manitoba (GoM) develops its own strategy in regard to purchasing and it has ownership of the Procurement Administration Manual. However, the Branch has limited authority and has been engaged in promoting the potential benefits of a centralized function to Executive Finance Officers, who have control of Department budgets, and Executive Committees (DMs, ADMs).
The Government of Manitoba aims to modernize procurement and achieve better supply chain management, in order to improve value for money spent. To achieve such transformation, PSB will be positioned as a more centralized unit that executes a strategy developed to:
• Enhance the Materials Management module in the SAP system which will drive more automation, as there is no leveraged technology;
• Get a handle on Core Government spend – large amounts are outside the ERP system; • Shift from commodity-based purchases to category management; • Implement strategic sourcing; • Improve supplier management and monitor key performance indicators (KPIs); and • Better manage contracts.
The Government is focused on performance and results. Procurement will consistently report on key metrics to monitor the procurement performance and the impacts of improvement measures. The measurement of value creation remains a challenge because it is not clearly defined, but the procurement function needs to demonstrate its contribution to cost savings and value for money.

© 2017 KPMG LLP, a Canadian limited liability partnership and a member firm of the KPMG network of independent member firms affiliated with KPMG International Cooperative (“KPMG International”), a Swiss entity. All rights reserved. The KPMG name and logo are registered trademarks or trademarks of KPMG International. 4
CONFIDENTIAL
1.2 Description of Approach Purpose and Objective
Performance enhancement
Cost optimization
■ Clear insight into diagnostic & maturity level of procurement
■ Roadmap for performance enhancement
■ Sustainable maturity increase by strategic measures
Procurement Function Enhancement
■ Clear category strategy■ Category planning initiation to
execute against■ Category savings potential
evaluation
Category Optimization
■ Spend transparency and classification■ Validation for reasonableness■ Spend Areas/Categories prioritization
Spend Transparency
A structured approach ensures a systematic diagnostic phase, identification of tangible savings and the organizational optimization potential of the procurement function. (Note: a larger chart and description of the first “wheel” is on page 12.)

© 2017 KPMG LLP, a Canadian limited liability partnership and a member firm of the KPMG network of independent member firms affiliated with KPMG International Cooperative (“KPMG International”), a Swiss entity. All rights reserved. The KPMG name and logo are registered trademarks or trademarks of KPMG International. 5
CONFIDENTIAL
1.2 Description of Approach Purpose and Objective
Implementation Strategic Sourcing
1Current State Assessment and Spend Analytics & Transparency 2 3Future State Recommendations
& Business Case Development
Gaps to Leading Practices and Category Opportunity
Prioritization & Evaluation
■ Validation with Steering Committee of scope and planning
■ Project kick-off ■ Determine relevant interviewees ■ Provide and review data collection requirements
Project Launch and Detailed Planning
■ Data requirements− Assess data complexity/availability− Determine spend taxonomy
■ Rapid assessment of spend data− Review available spend data breakdown − Assess priorities based on data sets (spend volume,
dispersed spend, and how quickly benefits can be reached)
Spend Analytics & Transparency
■ Conduct opportunity assessments and prioritize focus categories using:− Spend analytics and transparency results− KPMG category knowledge base and benchmarks
Spend Categories Prioritization
■ Category evaluation− Clustering of spend categories, as relevant− Focus categories will be evaluated to identify specified
lever(s)■ Conduct value lever analysis
− Expose information and intended value levers, based on preliminary review and fact finding
■ Category savings potential assessment− Assess savings potential
■ Develop Business Case document to:
− Consolidate procurement function future state considerations,
− Identify then assess future state options for the procurement function,
− Identify preferred option,− Outline anticipated costs and benefits,− Provide a high-level implementation plan
Business Case Development
Category Opportunity Identification
■ Identify Gaps to Leading Practices and develop key considerations on core components of Procurement:− Governance and controls− Organizational structure, roles and responsibilities− Processes and enabling tools and technologies
Gaps to Leading Practices – Procurement Function
■ Perform Diagnostic of Procurement Function− Conduct interviews and review key documentation of
current processes, practices, policies and roles and responsibilities
■ Prioritize foundational components to be further developed in the Future State
Diagnostic - Procurement Function Assessment

© 2017 KPMG LLP, a Canadian limited liability partnership and a member firm of the KPMG network of independent member firms affiliated with KPMG International Cooperative (“KPMG International”), a Swiss entity. All rights reserved. The KPMG name and logo are registered trademarks or trademarks of KPMG International. 6
CONFIDENTIAL
2.1 Problem/Opportunity StatementStrategic Context
— Data from the Procurement Services Branch in the Department of Finance shows Government of Manitoba Department purchases of goods and services over $1.2 billion in 2015/16. This data consists of purchase orders only and does not capture all procurement (also excludes Crown agencies, etc.). Construction Services is the largest category, representing approximately one-half of the $1.2 billion in 2015/16. Construction Services has ramped up substantially in the past three years.
— Manitoba has a decentralized procurement model. Procurement Services Branch acts as a purchasing agent for a portion of spend, and larger departments do much of their own procurement, e.g., Infrastructure manages its procurement of Construction Services, and Health manages its procurement of goods and services.
— Also, Materials Distribution Agency, a Special Operating Agency (SOA) covers certain types of items, and Vehicle and Equipment Management Agency (also a SOA) covers vehicles, machinery and equipment purchasing and leasing, etc. As SOAs, expenditures of the Materials Distribution Agency and Vehicle and Equipment Management Agency (VEMA) are outside of Core Government expenditures. As such, they are not considered in this business case, but should be reviewed and considerations outlined here are applicable to their efforts to improve value for money.
— KPMG conducted in 2014 a study on Collaborative Procurement between federal and provincial/territorial governments, which included an overview of procurement spend, maturity and model for each province and territory across Canada. Although not the only province in this situation, Manitoba was ranked as a developing jurisdiction in terms of procurement maturity, based on considerations including spend visibility, breadth of spend and support covered by a centralized procurement function, number of entities operating independently their own procurement activities, etc. Manitoba’s procurement function lags behind most jurisdictions in procurement modernization and leading practices.
— Strategic alignment with Government priorities is to develop a modernized procurement function that leverages the Government’s purchasing power and delivers results and value for money for Manitobans.

© 2017 KPMG LLP, a Canadian limited liability partnership and a member firm of the KPMG network of independent member firms affiliated with KPMG International Cooperative (“KPMG International”), a Swiss entity. All rights reserved. The KPMG name and logo are registered trademarks or trademarks of KPMG International. 7
CONFIDENTIAL
2.1 Problem/Opportunity StatementStrategic Context
* Note: Line Ministry led Centres of Excellence for specialized procurement Source: KPMG Study on Collaborative Procurement

© 2017 KPMG LLP, a Canadian limited liability partnership and a member firm of the KPMG network of independent member firms affiliated with KPMG International Cooperative (“KPMG International”), a Swiss entity. All rights reserved. The KPMG name and logo are registered trademarks or trademarks of KPMG International. 8
CONFIDENTIAL
2.2 Cost Drivers for ChangeStrategic Context
The following are some typical key organizational challenges related to procurement functions considering a transformation:
Perception of procurement as a Transactional and a Non-Strategic Service Provider — Typically procurement is generally perceived to be transactional, a bottleneck and a non-strategic service provider, with a
gap in capabilities and unclear roles in the procurement process. Given that a component of the restructuring involves moving to a more strategic organization and role in the procurement processes, this perception fosters a resistance to any restructuring that involves transitioning functions to the future procurement organization.
Capability and Capacity to Deliver — The Procurement Services Branch is already at capacity delivering existing services based on current processes. As well, the
Department is staffed with capabilities which reflect current processes. The additional activities to be undertaken to implement redesigned processes will present challenges and the PSB will need to be supplemented with additional capabilities to move forward with the changes. These can largely be re-allocated.
Culture— The culture of the organization can explain how individual departments wish to maintain as much control over their
activities as possible. They may view redesigned processes and new organizational model as a loss of control and therefore resist changing until they are confident the process will work. However, value for money for the whole of Government and working collaboratively across departments is more important to Government’s direction of bending the cost curve and finding efficiencies and cost savings.

© 2017 KPMG LLP, a Canadian limited liability partnership and a member firm of the KPMG network of independent member firms affiliated with KPMG International Cooperative (“KPMG International”), a Swiss entity. All rights reserved. The KPMG name and logo are registered trademarks or trademarks of KPMG International. 9
CONFIDENTIAL
2.3 Scope and Key AssumptionsStrategic Context
Key Assumptions
A single year of spend data (2015/16) has been analyzed and considered representative of the Government of Manitoba’s spend for the foreseeable future. No adjustments were made for forecasted growth or decrease of spend and any related underlying assumptions.
Based on the transactional purchase order files provided by PSB, and following our spend analysis and spend categories prioritization, we have defined an adjusted spend base for 13 spend areas/categories, on which we performed a more detailed category value lever analysis and cost savings evaluation.
Procurement officers or resources of Procurement Services Branch, who are knowledgeable about the specific spend categories that have been prioritized, should focus on key categories and continually review and qualify the identified category management opportunities to drive cost savings through various levers.
Scope
Spend data was provided by the Procurement Services Branch, in the format designated by KPMG.
This data contained spend data from the three following branches:1. Procurement Services Branch (PSB);2. Business Transformation and Technology (BTT);3. Accommodation Services Division (ASD).
More specifically, spend data relates to: 1. Purchase Orders created by PSB2. Release Orders for Outline Agreements created by PSB3. Purchase Orders for Professional Services - excluding PSB4. Purchase Orders created by BTT5. Release Orders for Outline Agreements created by BTT6. Purchase Orders created by ASD7. Outline Agreements by ASD and Release Orders

© 2017 KPMG LLP, a Canadian limited liability partnership and a member firm of the KPMG network of independent member firms affiliated with KPMG International Cooperative (“KPMG International”), a Swiss entity. All rights reserved. The KPMG name and logo are registered trademarks or trademarks of KPMG International. 10
CONFIDENTIAL
3.1 Fiscal Performance Review Framework and Evaluation CriteriaAnalysis
Procurement Modernization
Scope
1. From a spend perspective: We derived our preliminary analysis from source spend data from the Province of Manitoba’s annual procurement spend of approximately $1.2 billion for the year 2015/16. As outlined in the Phase 1 report, well over one-half is construction services and materials, which are categories with very limited cost saving opportunity. Approximately 30% of procurement spend is considered “addressable spend” for starting cost improvement initiatives such as category management. It is understood that as part of the spend analytics process, we will apply logical filters sequentially to be able to prioritize key spend categories/areas, for which further detailed analysis will be performed to assess strategic sourcing savings potential on the basis of these individual categories.
2. From an organizational standpoint: Procurement modernization will focus its attention on the diagnosis, evaluation of gaps to leading practices, as well as issuing performance enhancement considerations for the Procurement Services Branch in the Department of Finance. A review of IT systems is out of scope. Procurement activities undertaken directly by other Government of Manitoba departments and agencies, as well as Crown corporations, for which Procurement Services Branch isn’t formally mandated is considered out-of-scope of the current project.

© 2017 KPMG LLP, a Canadian limited liability partnership and a member firm of the KPMG network of independent member firms affiliated with KPMG International Cooperative (“KPMG International”), a Swiss entity. All rights reserved. The KPMG name and logo are registered trademarks or trademarks of KPMG International. 11
CONFIDENTIAL
3.1 Fiscal Performance Review Framework and Evaluation CriteriaAnalysis
Key Evaluation Criteria
Alignment Government commitment to find savings from better procurement.
Economy and Efficiency
Category spend management typically yields results through focus and streamlining numerous contract orders and vendors.
Effectiveness The current model is not effective and does not properly leverage or manage the Province’s considerable spend.
Implementation/ Transition Risk
Overhauling the system will require significant time and work, but savings can be realized in the short-term and into the long-term. A measured, phased-in approach should be planned.
Moderately Positive (4)
Strongly Positive (5)
Neutral / Uncertain (3)
Strongly Negative (1)
Moderately Negative (2)
Rating Scale:
The figure below presents a dashboard approach to provide a summary overview in applying the Fiscal Performance Review Framework and evaluation criteria to the business case for procurement modernization.

© 2017 KPMG LLP, a Canadian limited liability partnership and a member firm of the KPMG network of independent member firms affiliated with KPMG International Cooperative (“KPMG International”), a Swiss entity. All rights reserved. The KPMG name and logo are registered trademarks or trademarks of KPMG International. 12
CONFIDENTIAL
3.2 Procurement: Gaps to Leading Practices and Future State – FrameworkAnalysis
KPMG leveraged a Procurement Maturity Assessment (PMA) framework that provides clear insight across the organization and identifies procurement gaps to leading practices.
Managing suppliers throughout the lifecycle including identifying and managing supplier performance, supplier risk and ongoing relationships.
The existence and quality of organizational data applicable to procurement including the ability to track savings (e.g., Master Data Management and Management Information).
How well the procurement function operates and is governed. Consideration is given to thepolicies and processes in place, and the extent to which standard operating procedures are implemented and managed.
The extent to which the procurement function has visibility and management of issues of regulation and legislation that otherwise would lead to exposure to penalties.
The operational or transactional activities involved typically within the Purchase to Pay process (e.g.,
Requisition and Approval, Invoicing and Payment).
The step by step processes involved from initialspend analysis, through sourcing and
negotiation contracting, recognizing the different approaches between high and low complexity.
The role and scope of the procurement function, the development of its visionand strategy, and the extent to which it is aligned with wider corporate strategy. It also considers the extent to which the function has the processes and capabilities to manage change.
The existence of enabling technology aligned to a wide range of established processes and actions. From sourcing and P2P to supplier management.
The processes and activities undertaken to identify opportunities, develop strategies and plans for categories through assessing supply
market and demand drivers.
The management of people within the function. From talent acquisition, through training and
career progression.
The structure of the organization and the procurement functionwithin it, and the alignment of the two (i.e., Organizational Design,
Procurement Delivery Models)

© 2017 KPMG LLP, a Canadian limited liability partnership and a member firm of the KPMG network of independent member firms affiliated with KPMG International Cooperative (“KPMG International”), a Swiss entity. All rights reserved. The KPMG name and logo are registered trademarks or trademarks of KPMG International. 13
CONFIDENTIAL
3.2 Procurement: Gaps to Leading Practices and Future State – DimensionsAnalysis
This report provides a high-level assessment of key dimensions of the PMA framework based on discussions between KPMG and key stakeholders within the Government of Manitoba. Five key dimensions were assessed in terms of maturity level, as indicated below in blue (top line) and light blue (sub-dimensions): strategy and change management, structure, category management cycle, source to contract, and supplier lifecycle management. The assessment required a number of assumptions to be made, and was undertaken with the aim to provide directional indications. While caution and care was taken in developing assumptions, actual results may differ. Transformational changes will require leadership, strategy, focus on results, and execution.
ProcessOrganization EnablersStrategyStrategy &
Change Mgmt
Procurement Scope
& Mandate
StrategyDevelopment
Corporate Strategy
Alignment
Business Partnering
Procurement Vision
ChangeMgmt
Regulation & Compliance
Tax-efficient Procurement
Fraud Forensics
Governance & Controls
General Governance
Approval Authority &
Policies
Continuous Improvement
Standard Operating
Procedures
Structure
Org Design
Procurement Delivery Models
Org Alignment
People
Skill Training &Development
Knowledge Mgmt
Category Management
Cycle
Category Strategy & Planning
Category Risk Mgmt
DemandMgmt
Cat Strat Implemt’n
Supply Assessment
Category Performance
Mgmt
Source to Contract
Spend & Trend Analysis
Supply MktAnalysis & Planning
Sourcing Strategy
Strategic Sourcing
ComplexProcurement
Operational / Low
Value Proc
Contracting
Effectiveness/Efficiency RfXProcurementKnowledge
Operational Process
P2P general
Requisition &Approval
P.O. & Receipt Mgmt
Inv Proc’g &Payment
Supplier Lifecycle
Mgmt
SupplierPerformance
Mgmt
Supplier Risk Mgmt
Supplier Relationship
Mgmt
Systems & Technology
Accounts Payable
Contract Lifecycle
Mgmt
Master Data Mgmt
Operational Procurement
Procurement Analytics
Sourcing & RFx
Supplier Collaboration
Supplier Risk Management
Master Data & BI-PI
Master Data Mgmt
MgmtInfo (MI)
Category Tree / Taxonomy
Supplier Imp’n& Transition
Legend: Dimensions and sub-dimensions relevant to the High-Level Procurement Performance Assessment.
© 2017 KPMG LLP, a Canadian limited liability partnership and a member firm of the KPMG network of independent member firms affiliated with KPMG International Cooperative (“KPMG International”), a Swiss entity. All rights reserved. The KPMG name and logo are registered trademarks or trademarks of KPMG International. 14
CONFIDENTIAL
3.2 Procurement: Gaps to Leading Practices and Future State – ObservationsAnalysis
Dimension & Key Observations
Procurement activity appears to be largely decentralized with limited collaboration between departments and agencies, and many commercial contracts are managed outside the Procurement Services Branch (PSB). Communication of the procurement vision does not seem clear and consistent within the Government.
Strategy and Change Management
Estimated Maturity Level
Despite the existence of the Procurement Services Branch, sourcing decisions and procurement activities are frequently executed at the department/agency level and there is little or no coordination across organizations. As a result, the Government of Manitoba does not take full advantage of its consolidated bargaining power to negotiate better deals.
Structure
No category strategies are developed or formally documented. Demand data is not systematically reviewed and supply assessment is performed on an ad hoc basis. Performance targets are not clearly defined and without a solid performance measurement system, savings are not systematically tracked.
Category Management Cycle
Procurement activities do not rely on formal sourcing strategies established or documented by PSB. Sourcing takes place within a department/agency, and PSB may, or not, be informed along the way. Contract development is often decentralized and performed on an ad-hoc basis. Only limited analysis are performed to give insight into the category to inform sourcing activities.
Source-to-Contract
There seems to be no formal supplier performance measurement system and no clearly defined Key Performance Indicators (KPIs). The procurement function appears to have a basic understanding of its supply base. There is currently no governance in place to support a formal Supplier Relationship Management process and benefits are not understood.
Supplier Lifecycle Management
1 2 3 4 5Laggard Foundation Established Leading Excellence
2
1 2 3 4 5Laggard Foundation Established Leading
Excellence
1.5
1 2 3 4 5Laggard Foundation Established Leading Excellence
1.5
1 2 3 4 5Laggard Foundation Established Leading Excellence
1.5
1 2 3 4 5Laggard Foundation Established Leading Excellence
2
© 2017 KPMG LLP, a Canadian limited liability partnership and a member firm of the KPMG network of independent member firms affiliated with KPMG International Cooperative (“KPMG International”), a Swiss entity. All rights reserved. The KPMG name and logo are registered trademarks or trademarks of KPMG International. 15
CONFIDENTIAL
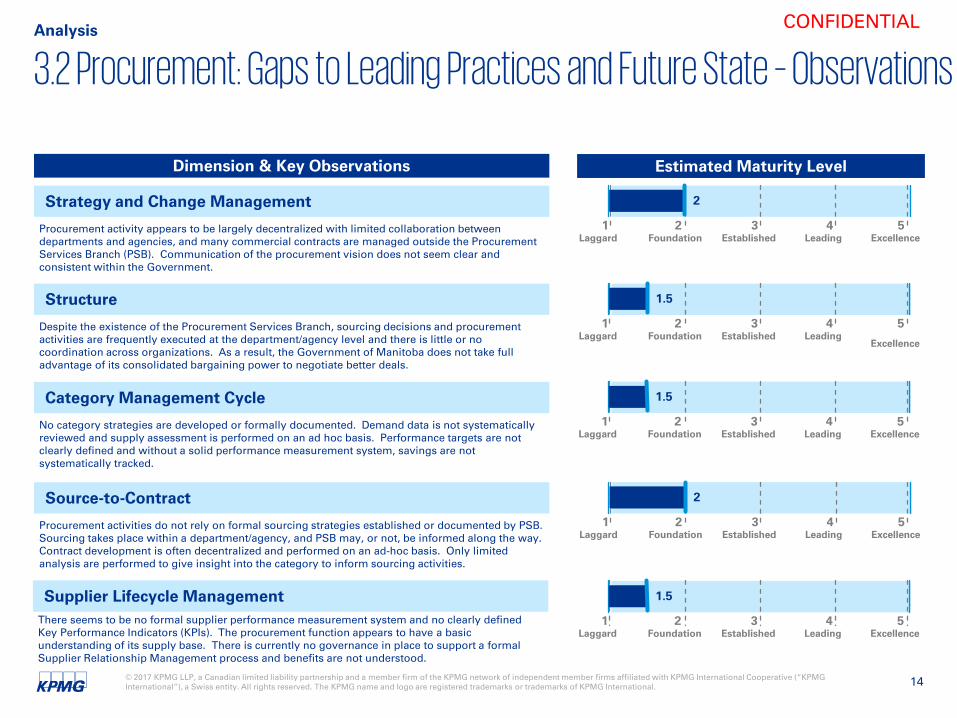
3.3 Overview of Spend Categories and Adjusted SpendAnalysis
We emphasize that this spend analysis represents addressable spend that PSB currently has a window to, and only represents a portion of Core Government spend of $1.2 billion annually on the procurement of goods and services.Based on the provided data sets, the spend categories presented in the table below have been analyzed in order to qualify thecharacteristics of the spend.1 For each category, when the total spend provided in the first data set provided by PSB in Phase 1 was higher than in the second data set provided by PSB in Phase 2 (primarily due to the more detailed level of information required for Phase 2 analysis, which was not available for some of the data received in Phase 1), the spend amount was adjusted by a portion of the difference to reflect that the level of spend for these categories is still the same range.
Source: Derived from Manitoba 2015/16 Spend Data
Spend Categories 1st Data set - Spend in 2015/16 2nd Data set - Spend in 2015/16Adjusted Data set - Spend in
2015/16
1 – Operating Services $ 122 755 101 $ 166 513 123 $ 166 513 123
2 – Professional Services $ 109 730 469 $ 67 328 652 $ 97 009 924
3 – Medical, Dental, Veterinary $ 32 264 377 $ 1 830 180 $ 23 134 118
4 – Office Equipment $ 21 084 429 $ 6 384 287 $ 16 674 386
5 – Communication Equipment $ 20 947 116 $ 272 128 $ 14 744 620
6 – Maintenance & Repair Services $ 20 536 299 $ 11 722 749 $ 17 892 234
7 – Communication Services $ 17 802 460 $ 23 824 $ 12 468 869
8 – Food $ 11 129 773 $ 2 887 749 $ 8 657 166
9 – Vehicles, All types $ 6 294 413 $ 4 696 219 $ 5 814 955
10 – Fuels and Lubricants $ 5 775 494 $ 1 152 819 $ 4 388 692
11 – Machinery $ 3 784 628 $ 3 784 628
12 – Furniture and Furnishings $ 2 419 709 $ 2 419 709
13 – Safety Equipment and Devices $ 1 222 035 $ 1 222 035
Total $ 368 319 931 $ 270 238 102 $ 374 724 458 1 Only categories Communication Equipment and Communication Services have not been detailed due to the lack of detailed transactional data available.
© 2017 KPMG LLP, a Canadian limited liability partnership and a member firm of the KPMG network of independent member firms affiliated with KPMG International Cooperative (“KPMG International”), a Swiss entity. All rights reserved. The KPMG name and logo are registered trademarks or trademarks of KPMG International. 16
CONFIDENTIAL
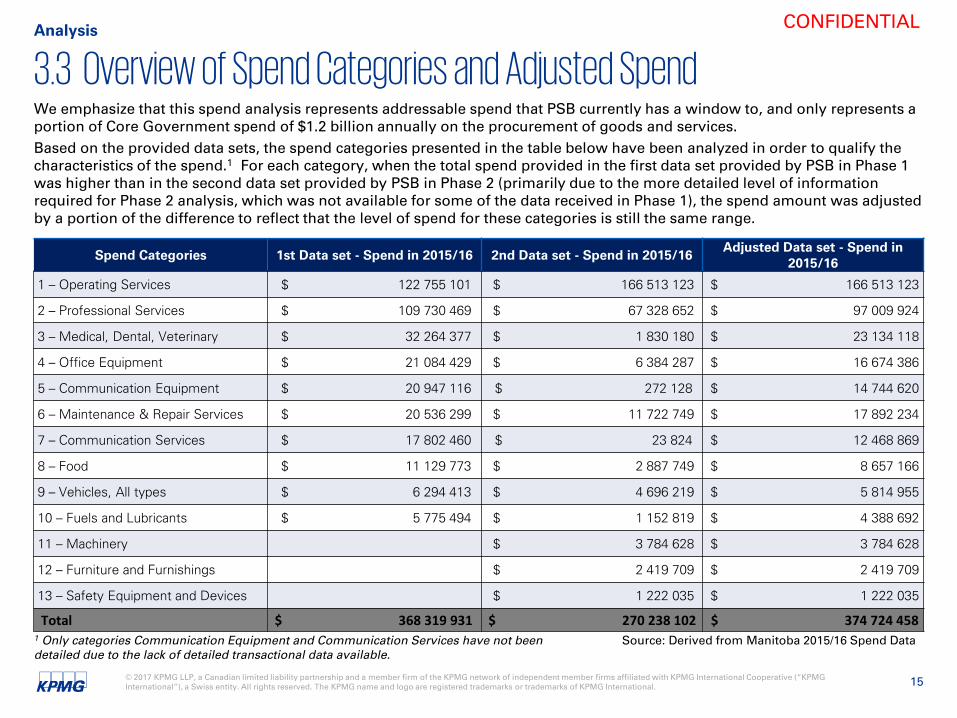
3.3 Overview of Spend Categories and Adjusted Spend –Detailed Category Analysis
Analysis
The detailed category analysis intends to gather some insights and evidence on the considered spend category, with the view to identify the relevant value levers. More precisely, this analysis notably provides some insights on top vendors, on the nature of spend (i.e., subcategories), as well as on the proportion of spend under control of procurement.
The analysis is available in Appendix B.
© 2017 KPMG LLP, a Canadian limited liability partnership and a member firm of the KPMG network of independent member firms affiliated with KPMG International Cooperative (“KPMG International”), a Swiss entity. All rights reserved. The KPMG name and logo are registered trademarks or trademarks of KPMG International. 17
CONFIDENTIAL
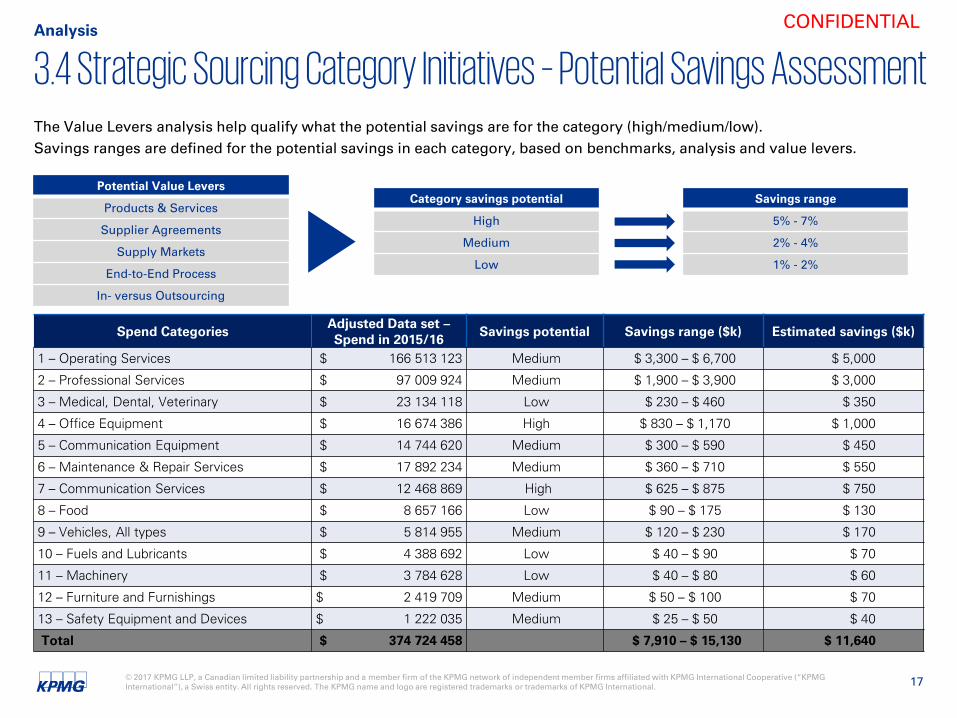
3.4 Strategic Sourcing Category Initiatives – Potential Savings AssessmentAnalysis
The Value Levers analysis help qualify what the potential savings are for the category (high/medium/low).Savings ranges are defined for the potential savings in each category, based on benchmarks, analysis and value levers.
Potential Value Levers
Products & Services
Supplier Agreements
Supply Markets
End-to-End Process
In- versus Outsourcing
Category savings potential
High
Medium
Low
Savings range
5% - 7%
2% - 4%
1% - 2%
Spend CategoriesAdjusted Data set –Spend in 2015/16
Savings potential Savings range ($k) Estimated savings ($k)
1 – Operating Services $ 166 513 123 Medium $ 3,300 – $ 6,700 $ 5,000
2 – Professional Services $ 97 009 924 Medium $ 1,900 – $ 3,900 $ 3,000
3 – Medical, Dental, Veterinary $ 23 134 118 Low $ 230 – $ 460 $ 350
4 – Office Equipment $ 16 674 386 High $ 830 – $ 1,170 $ 1,000
5 – Communication Equipment $ 14 744 620 Medium $ 300 – $ 590 $ 450
6 – Maintenance & Repair Services $ 17 892 234 Medium $ 360 – $ 710 $ 550
7 – Communication Services $ 12 468 869 High $ 625 – $ 875 $ 750
8 – Food $ 8 657 166 Low $ 90 – $ 175 $ 130
9 – Vehicles, All types $ 5 814 955 Medium $ 120 – $ 230 $ 170
10 – Fuels and Lubricants $ 4 388 692 Low $ 40 – $ 90 $ 70
11 – Machinery $ 3 784 628 Low $ 40 – $ 80 $ 60
12 – Furniture and Furnishings $ 2 419 709 Medium $ 50 – $ 100 $ 70
13 – Safety Equipment and Devices $ 1 222 035 Medium $ 25 – $ 50 $ 40
Total $ 374 724 458 $ 7,910 – $ 15,130 $ 11,640

© 2017 KPMG LLP, a Canadian limited liability partnership and a member firm of the KPMG network of independent member firms affiliated with KPMG International Cooperative (“KPMG International”), a Swiss entity. All rights reserved. The KPMG name and logo are registered trademarks or trademarks of KPMG International. 18
CONFIDENTIAL
3.4 Strategic Sourcing Category Initiatives – Potential Savings AssessmentBased on information shared by the Procurement Services Branch, KPMG considered 5 value levers to better circumvent the potential savings evaluation. The following 5 value levers were assumed to be sub-optimized because of the lack of any category management and sourcing strategies currently in place:
Product & Service- Standardization of specifications- Optimization of Total Cost of Ownership (TCO)- Volume bundling across commodity sub-categories with certain vendors
In- vs. Outsourcing- Internal resources relied upon when value is favorable vs. that of external providers- Perform selectively internally when core competencies/capability/flexibility is required
- Efficiency, automation and control level of processes from demand-to-delivery (transaction costs)- Extent to which systems support processes optimally
- Regular competitive tendering relying on optimal channels based on market structure and conditions- Leveraging market insight and global offering- Use of catalogue/e-Procurement systems
- Agreements in place, renegotiation frequency, commercial conditions- Consideration of alternative agreement models in decision-making- Supplier cost structure transparency and ability to influence
End-to-End Process
Supply Markets
Supplier Agreements
The detailed category analysis specified which levers can apply to each category, such as streamlining the number of contracts, consolidating vendors further by category, bundling volumes across department/agencies, as well as standardizing and reducing the variety of products procured across departments and agencies. Implementing formal category management and contract management would also favorably impact volumes being procured and total cost of ownership.
Analysis
Based on analysis of only a portion of Government spend, i.e., where the Procurement Services Branch has current involvement to some extent and the summary analysis on the previous page, Government should target $8 – $15 million, or over $10 million in cost savings in these key categories. Further levers such as Government directives to reduce advertising(Communication Services) could yield further targeted savings.

© 2017 KPMG LLP, a Canadian limited liability partnership and a member firm of the KPMG network of independent member firms affiliated with KPMG International Cooperative (“KPMG International”), a Swiss entity. All rights reserved. The KPMG name and logo are registered trademarks or trademarks of KPMG International. 19
CONFIDENTIAL
4.1 Procurement Options for Reorganization Options
1 Examples of metrics applied to different steps of the Source-to-Pay process are provided in Appendix A.
— The structure of Procurement Services Branch requires amalgamation and redesign, new skills, a move from acting as a purchasing department to more value-added supply chain management, and defining performance metrics to measure procurement performance and value generation.1
— Focused category management and standardization of contracts would yield immediate results.— Materials Distribution Agency and Vehicle Equipment and Management Agency (VEMA) need to be reviewed. There is
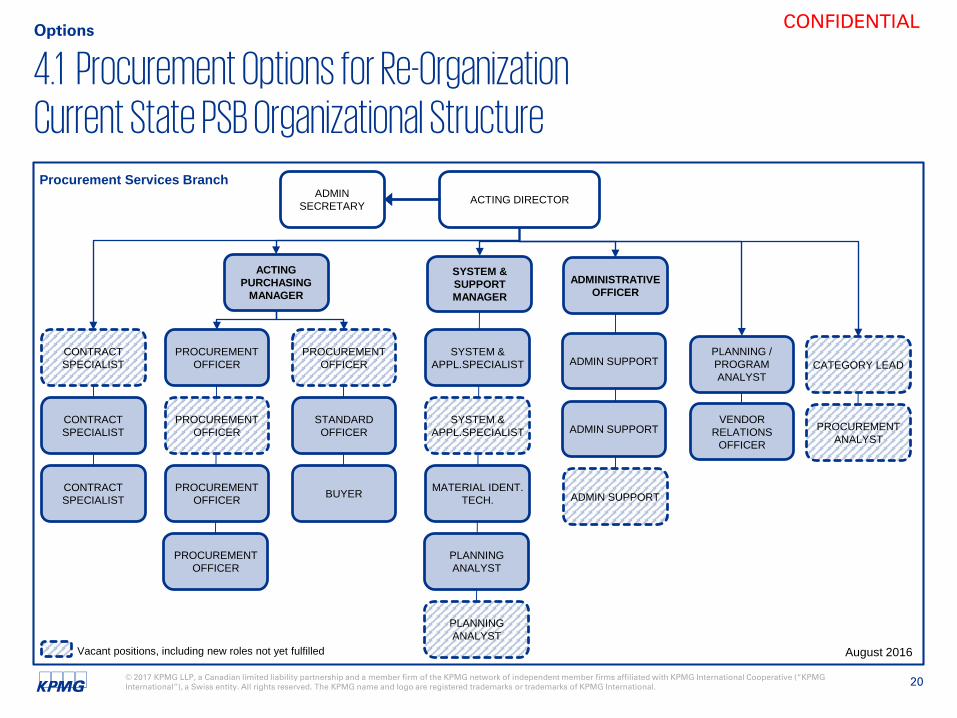
potential to transfer certain VEMA purchases (e.g., light duty trucks) to a standard tender process.— Beyond Core Government, provincial agencies would benefit from collaboration on certain bulk purchasing of goods.— The Procurement Services Branch has a 2016/17 budget of $2.6 million ($2.35 million for salaries and benefits, an additional
$0.25 million for other expenditures), and an organizational structure of 27 positions including vacancies (see next page).— PSB is predominantly involved only in the front-end and transactional aspect of the procurement process. There is no
strategic sourcing and no category management activity.
Additional considerations are provided in the next section.
© 2017 KPMG LLP, a Canadian limited liability partnership and a member firm of the KPMG network of independent member firms affiliated with KPMG International Cooperative (“KPMG International”), a Swiss entity. All rights reserved. The KPMG name and logo are registered trademarks or trademarks of KPMG International. 20
CONFIDENTIAL
4.1 Procurement Options for Re-OrganizationCurrent State PSB Organizational Structure
Options
August 2016
ACTING DIRECTORADMINSECRETARY
ACTING PURCHASING
MANAGER
CONTRACT SPECIALIST
PROCUREMENTOFFICER
PROCUREMENT OFFICER
PROCUREMENT OFFICER
PROCUREMENT OFFICER
CONTRACTSPECIALIST
CONTRACT SPECIALIST
PROCUREMENT OFFICER
STANDARD OFFICER
Procurement Services Branch
Vacant positions, including new roles not yet fulfilled
BUYER
SYSTEM & SUPPORT MANAGER
SYSTEM & APPL.SPECIALIST
SYSTEM & APPL.SPECIALIST
PLANNING ANALYST
PLANNING ANALYST
MATERIAL IDENT. TECH.
ADMINISTRATIVE OFFICER
ADMIN SUPPORT
ADMIN SUPPORT
ADMIN SUPPORT
PLANNING / PROGRAM ANALYST
VENDOR RELATIONS
OFFICER
CATEGORY LEAD
PROCUREMENT ANALYST
© 2017 KPMG LLP, a Canadian limited liability partnership and a member firm of the KPMG network of independent member firms affiliated with KPMG International Cooperative (“KPMG International”), a Swiss entity. All rights reserved. The KPMG name and logo are registered trademarks or trademarks of KPMG International. 21
CONFIDENTIAL
4.1 Procurement Options for Re-OrganizationCurrent Organizational Structure Compared to Benchmarks
Options
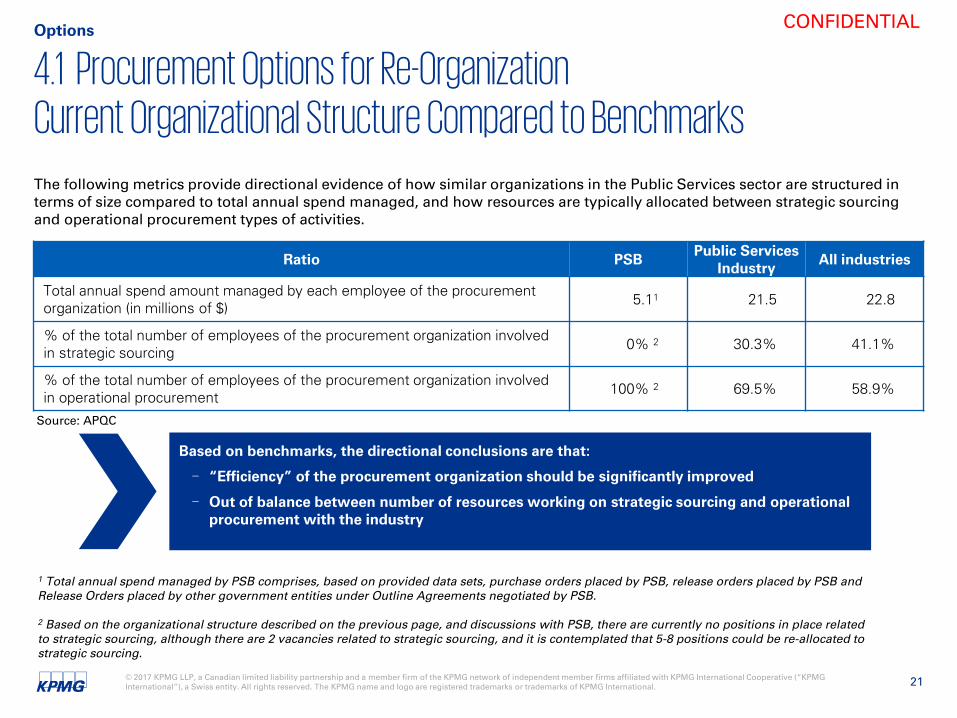
The following metrics provide directional evidence of how similar organizations in the Public Services sector are structured in terms of size compared to total annual spend managed, and how resources are typically allocated between strategic sourcing and operational procurement types of activities.
Ratio PSB Public Services Industry All industries
Total annual spend amount managed by each employee of the procurement organization (in millions of $) 5.11 21.5 22.8
% of the total number of employees of the procurement organization involved in strategic sourcing 0% 2 30.3% 41.1%
% of the total number of employees of the procurement organization involved in operational procurement 100% 2 69.5% 58.9%
1 Total annual spend managed by PSB comprises, based on provided data sets, purchase orders placed by PSB, release orders placed by PSB and Release Orders placed by other government entities under Outline Agreements negotiated by PSB.
2 Based on the organizational structure described on the previous page, and discussions with PSB, there are currently no positions in place related to strategic sourcing, although there are 2 vacancies related to strategic sourcing, and it is contemplated that 5-8 positions could be re-allocated to strategic sourcing.
Based on benchmarks, the directional conclusions are that:
- “Efficiency” of the procurement organization should be significantly improved
- Out of balance between number of resources working on strategic sourcing and operational procurement with the industry
Source: APQC

© 2017 KPMG LLP, a Canadian limited liability partnership and a member firm of the KPMG network of independent member firms affiliated with KPMG International Cooperative (“KPMG International”), a Swiss entity. All rights reserved. The KPMG name and logo are registered trademarks or trademarks of KPMG International. 22
CONFIDENTIAL
4.1 Procurement Options for Re-OrganizationProcurement Function Value Proposition
Options
A leadingprocurement function
drives value to the business
- Value is identified through category management and value levers
- Value is generated in strategic sourcing through cost savings, risk management, and innovation
- Value is delivered by maximizing visibility and driving compliance to a preferred supplier contract
- Value is sustained though the supplier management process
- Value is enhanced and protected through advanced data and analytics, and technology enablement
A leading procurement function entails efforts to ensure efficiency in day-to-day operations and transactions, spend data transparency and analysis, and strategic activities such as category management and strategic sourcing to focus on value for money.

© 2017 KPMG LLP, a Canadian limited liability partnership and a member firm of the KPMG network of independent member firms affiliated with KPMG International Cooperative (“KPMG International”), a Swiss entity. All rights reserved. The KPMG name and logo are registered trademarks or trademarks of KPMG International. 23
CONFIDENTIAL
4.1 Procurement Options for Re-OrganizationTransferring the Procurement Focus on the Source-to-Pay Activities
Options
+ -
Source-to-Pay
Process
Expected saving curve
Tim
e
Analyze needs
Analyze & Understand
Supply Markets
Negotiate &
Contract
Sign and deploy
contract
Reduce time spent on transactional tasks
Focus your time on the sourcing process
FOCUS AREA
Capability to impact savings on the Source to Pay process
Procure-to-PaySource-to-Contract
DevelopSourcingStrategy
Obtain &AnalyzeProposal
While day-to-day procure-to-pay transactions are important necessities of the procurement function, reallocating significant time and resources to sourcing strategies provides greater opportunity for cost savings.
© 2017 KPMG LLP, a Canadian limited liability partnership and a member firm of the KPMG network of independent member firms affiliated with KPMG International Cooperative (“KPMG International”), a Swiss entity. All rights reserved. The KPMG name and logo are registered trademarks or trademarks of KPMG International. 24
CONFIDENTIAL
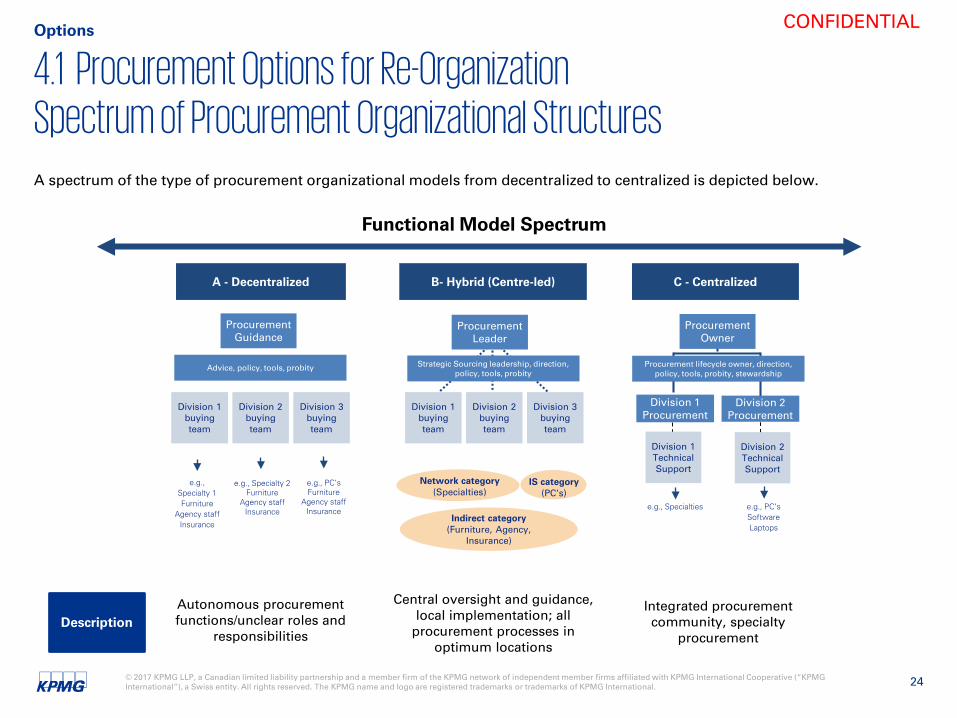
4.1 Procurement Options for Re-OrganizationSpectrum of Procurement Organizational Structures
Description
Functional Model Spectrum
Autonomous procurement functions/unclear roles and
responsibilities
Central oversight and guidance, local implementation; all
procurement processes in optimum locations
Integrated procurement community, specialty
procurement
B- Hybrid (Centre-led)A - Decentralized
Division 1 buying team
Procurement Leader
Procurement Guidance
Division 1Procurement
Procurement Owner
C - Centralized
Division 2 buying team
Division 3 buying team
Division 1 buying team
Division 2 buying team
Division 3 buying team
Advice, policy, tools, probity Strategic Sourcing leadership, direction, policy, tools, probity
e.g.,Specialty 1Furniture
Agency staffInsurance
e.g., Specialty 2Furniture
Agency staffInsurance
e.g., PC’sFurniture
Agency staffInsurance
Indirect category(Furniture, Agency,
Insurance)
Network category(Specialties)
IS category(PC’s)
Division 2 Procurement
Division 1 Technical Support
Division 2 Technical Support
e.g., Specialties e.g., PC’sSoftwareLaptops
Procurement lifecycle owner, direction, policy, tools, probity, stewardship
Options
A spectrum of the type of procurement organizational models from decentralized to centralized is depicted below.

© 2017 KPMG LLP, a Canadian limited liability partnership and a member firm of the KPMG network of independent member firms affiliated with KPMG International Cooperative (“KPMG International”), a Swiss entity. All rights reserved. The KPMG name and logo are registered trademarks or trademarks of KPMG International. 25
CONFIDENTIAL
4.2 Options Analysis Options
Summary Assessment – Procurement Organization
A further assessment is provided on the following pages.
Lowest Highest
Alignment
Economy
Efficiency
Effectiveness
Highest Lowest
Risk
Capacity and Capability
A B C
A B
A B
A B C
AC B
B CA
C
C
Option A B C
ProcurementOrganization Options
Status quo – decentralized, centralized function exists but strategy and
decisions largely devolved to departments, no category management.
Hybrid – Agency led, centrally controlled, coordinate strategic categories,
departments conduct unique procurement and manage contracts.
Centralized – whole of government strategy, portfolio approach, sourcing execution, procure to pay, contract
management.

© 2017 KPMG LLP, a Canadian limited liability partnership and a member firm of the KPMG network of independent member firms affiliated with KPMG International Cooperative (“KPMG International”), a Swiss entity. All rights reserved. The KPMG name and logo are registered trademarks or trademarks of KPMG International. 26
CONFIDENTIAL
4.2 Options Analysis Options
▲ - Positive impact relative to Status Quo▼ - Negative impact relative to Status Quo= - even with A
Number of ▲ or ▼ indicates magnitude of impact
Leg
end
Criteria B - Compared to Status Quo C - Compared to Status Quo
Alignment
This change will better align with government’s intended outcomes for better value for money for procurement with performance results.
This change will better align with government’s intended outcomes for better value for money for procurement with performance results.
Economy
This would help to improve the way that procurement is organized, more strategic, and focused on value for money.
With performance indicators around cost controls/reductions, there are additional opportunities to better control overall procurement spend and improve category management and control demand/volumes.
Efficiency
Cost containment/savings in spend categories that contribute better performance to the system in an accountable manner.
Cost containment/savings in spend categories that contribute better performance to the system in an accountable manner.
Furthermore, centralization transfers existing procurement activity in departments to one centralized agency.
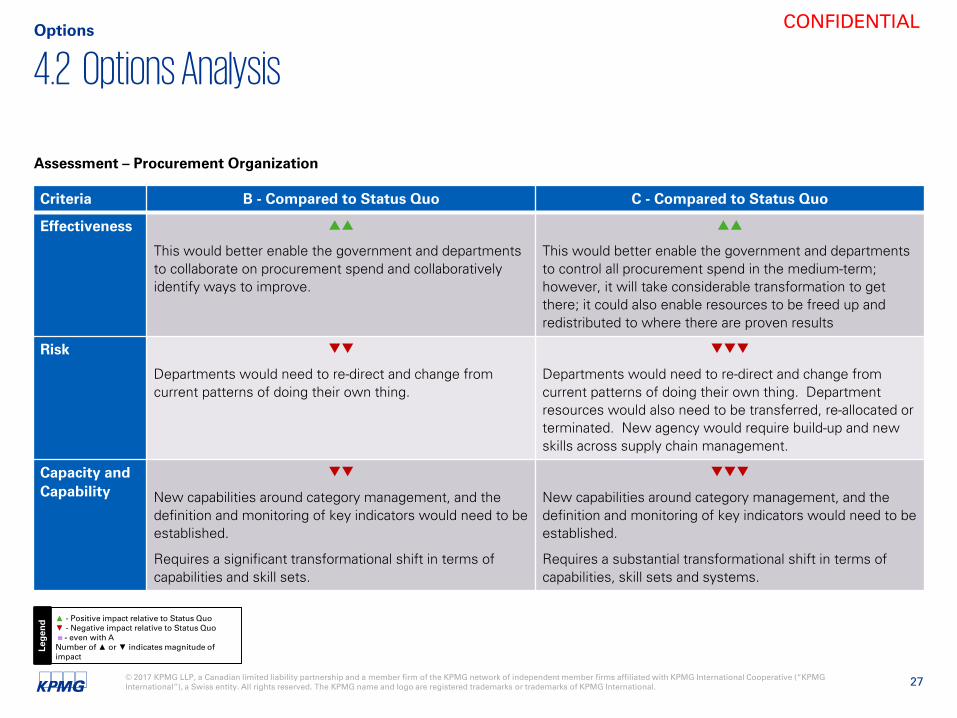
Assessment – Procurement Organization
© 2017 KPMG LLP, a Canadian limited liability partnership and a member firm of the KPMG network of independent member firms affiliated with KPMG International Cooperative (“KPMG International”), a Swiss entity. All rights reserved. The KPMG name and logo are registered trademarks or trademarks of KPMG International. 27
CONFIDENTIAL
4.2 Options Analysis Options
▲ - Positive impact relative to Status Quo▼ - Negative impact relative to Status Quo= - even with A
Number of ▲ or ▼ indicates magnitude of impact
Leg
end
Assessment – Procurement Organization
Criteria B - Compared to Status Quo C - Compared to Status Quo
Effectiveness
This would better enable the government and departments to collaborate on procurement spend and collaboratively identify ways to improve.
This would better enable the government and departments to control all procurement spend in the medium-term; however, it will take considerable transformation to get there; it could also enable resources to be freed up and redistributed to where there are proven results
Risk
Departments would need to re-direct and change from current patterns of doing their own thing.
Departments would need to re-direct and change from current patterns of doing their own thing. Department resources would also need to be transferred, re-allocated or terminated. New agency would require build-up and new skills across supply chain management.
Capacity and Capability
New capabilities around category management, and the definition and monitoring of key indicators would need to be established.
Requires a significant transformational shift in terms of capabilities and skill sets.
New capabilities around category management, and the definition and monitoring of key indicators would need to be established.
Requires a substantial transformational shift in terms of capabilities, skill sets and systems.

© 2017 KPMG LLP, a Canadian limited liability partnership and a member firm of the KPMG network of independent member firms affiliated with KPMG International Cooperative (“KPMG International”), a Swiss entity. All rights reserved. The KPMG name and logo are registered trademarks or trademarks of KPMG International. 28
CONFIDENTIAL
4.2 Options Analysis Options
Option A B C
ProcurementOrganization Options
Status quo – decentralized, centralized function exists but strategy and
decisions largely devolved to departments, no category management.
Hybrid – Agency led, centrally controlled, coordinate strategic categories,
departments conduct unique procurement and manage contracts.
Centralized – whole of government strategy, portfolio approach, sourcing execution, procure to pay, contract
management.
Costs None
Costs incurred to adapt PSB current organizational structure, policy and
processes to hybrid model.
Limited impact on other Government departments.
Significant costs incurred to transform procurement activities performed in all Government departments into a new
centralized entity.
Benefits None
Realization of savings potential with focused and enhanced sourcing
activities, reviewed and standardized procurement policy and adherence to
policy.
Faster realization of savings potential due to centralization of all procurement activities, once transformation is
established, but considerable time and risk to get there.
Note 1 : costs related to potential implementation/upgrade of a technological solution supporting procurement activities are excluded.Note 2 : targeted savings are at maturity, i.e., savings in the near term will be partial as capabilities are being developed and as individual categories are targeted.

© 2017 KPMG LLP, a Canadian limited liability partnership and a member firm of the KPMG network of independent member firms affiliated with KPMG International Cooperative (“KPMG International”), a Swiss entity. All rights reserved. The KPMG name and logo are registered trademarks or trademarks of KPMG International. 29
CONFIDENTIAL
5.1 Preferred Option Considerations
Option A B C
ProcurementOrganization Options
Status quo – decentralized, centralized function exists but strategy and decisions
largely devolved to departments, no category management.
Hybrid – Agency led, central oversight, centrally controlled, coordinate strategic categories, departments conduct unique
procurement and manage contracts.
Centralized – whole of government strategy, portfolio approach, sourcing execution, procure to pay, contract
management.
Additional considerations
— The ability to transition from an operational, transactional procurement role towards supply chain management and a more strategic sourcing role for PSB requires a shift in how requisitions and purchases are currently being done, i.e., evolving from the current purchasing office service delivery model offered by PSB to a self-serve service delivery model, where other departments and branches handle some of the operational procurement activities. This may require technology investments in e-Procurement solutions or functionalities (e.g., eCatalogue enablement). However, such technology investments are expected to be integrated to SAP, practical and with costs that represent a relatively small share of potential cost savings. These would need to be explored as part of a phased-in plan with an IT strategy and a specific IT business case demonstrating effectiveness and positive return on investment.
— Central direction and strong oversight is required at the outset to clarify roles and responsibilities, and department accountabilities and compliance. Government direction is needed to establish clear authority and mandate to PSB, for central coordination with clear roles and responsibilities of both PSB and departments, accountabilities, and focus on performance and results to drive cost savings and value for money.
— The transition plan will require leadership and execution and a change in culture with an organization focused on delivering results and performance. Transition to target operating model will require PSB to assemble a core category management unit within PSB. This can be done by filling current branch vacancies and hiring the right profiles for these new roles to be further documented and established.
Based on the outcomes of the analysis conducted, our recommendation is to adopt an hybrid centre-led procurement function.
© 2017 KPMG LLP, a Canadian limited liability partnership and a member firm of the KPMG network of independent member firms affiliated with KPMG International Cooperative (“KPMG International”), a Swiss entity. All rights reserved. The KPMG name and logo are registered trademarks or trademarks of KPMG International. 30
CONFIDENTIAL
5.1 Preferred Option Considerations
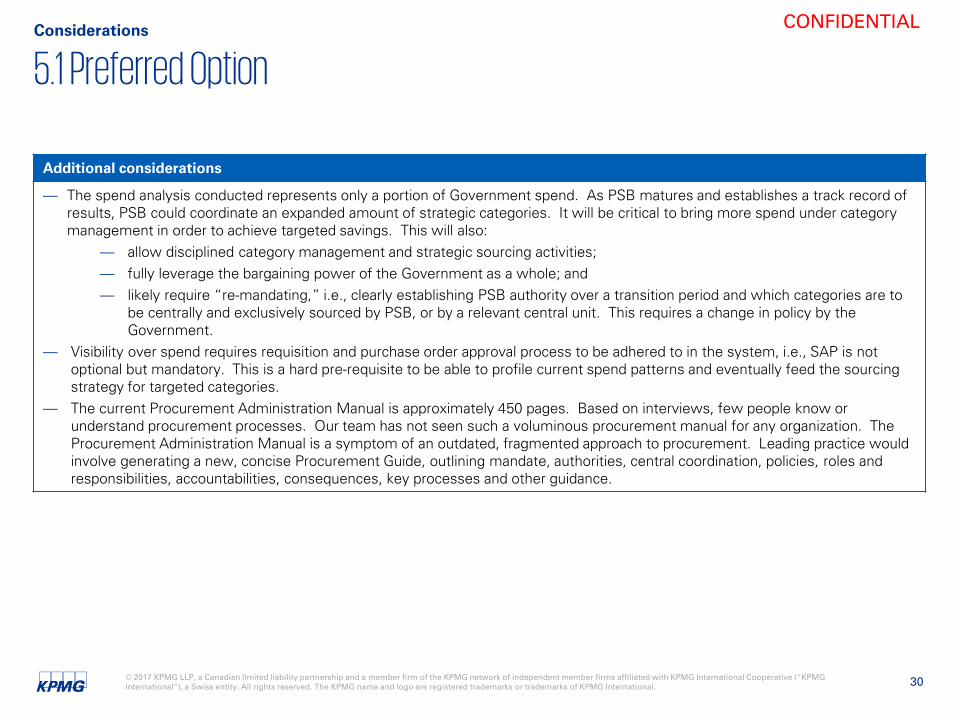
Additional considerations
— The spend analysis conducted represents only a portion of Government spend. As PSB matures and establishes a track record ofresults, PSB could coordinate an expanded amount of strategic categories. It will be critical to bring more spend under category management in order to achieve targeted savings. This will also:
— allow disciplined category management and strategic sourcing activities;— fully leverage the bargaining power of the Government as a whole; and— likely require “re-mandating,” i.e., clearly establishing PSB authority over a transition period and which categories are to
be centrally and exclusively sourced by PSB, or by a relevant central unit. This requires a change in policy by the Government.
— Visibility over spend requires requisition and purchase order approval process to be adhered to in the system, i.e., SAP is not optional but mandatory. This is a hard pre-requisite to be able to profile current spend patterns and eventually feed the sourcing strategy for targeted categories.
— The current Procurement Administration Manual is approximately 450 pages. Based on interviews, few people know or understand procurement processes. Our team has not seen such a voluminous procurement manual for any organization. The Procurement Administration Manual is a symptom of an outdated, fragmented approach to procurement. Leading practice would involve generating a new, concise Procurement Guide, outlining mandate, authorities, central coordination, policies, roles and responsibilities, accountabilities, consequences, key processes and other guidance.

© 2017 KPMG LLP, a Canadian limited liability partnership and a member firm of the KPMG network of independent member firms affiliated with KPMG International Cooperative (“KPMG International”), a Swiss entity. All rights reserved. The KPMG name and logo are registered trademarks or trademarks of KPMG International. 31
CONFIDENTIAL
5.2 Benefits and Potential Cost Improvements Considerations
Note 1: costs related to potential implementation/upgrade of a technological solution supporting procurement activities are excluded. System review is outside of scope.Note 2: targeted savings are at maturity, i.e., savings in the near term will be partial as capabilities are being developed and as individual categories are targeted.
Option B
ProcurementOrganization Options
Hybrid – Agency led, centrally controlled, coordinate strategic categories, departments retain ability and resources to conduct unique procurement and manage contracts.
CostsCosts incurred to adapt PSB current organizational structure,
policy and processes to hybrid model.
Limited impact on other Government departments.
One-off costs related to the implementation and transition to the new model (to be estimated)
Recurring operating costs: same order of magnitude as current costs of PSB ($2.6M) and costs of procurement activities
performed in the other departments (to be estimated)
BenefitsRealization of savings potential with focused and enhanced sourcing activities, reviewed and standardized procurement
policy and adherence to policy.
Target of $10M+ of recurring annual savings, achievable annually, once transition to central-led agency with authority
With a focus on select key categories in 2017/18, and actions to drive savings such as policy to substantially reduce advertising or limit volumes that are discretionary, cost improvements can start to materialize in 2017/18 and a target of at least $5 million could be set for 2017/18. Once the transition is well under way, Government should target annualized savings of over $10M from strategic procurement, which can be expanded to other categories/areas, over time.Appendix A outlines a number of key performance indicators (KPIs) at the Executive, Managerial and Operational level. At a dashboard level for Executive, key performance measures would include: cost reduction savings as a $ amount and % of total sourceable spend, average cost reduction per sourcing project, share of spend under category management, as well as productivity measures.A specific procurement IT business case would need to be developed as part of a practical, tactical and phased-in plan. Considerable investment and tools are already in place in the Province’s SAP system. Enhancements such as e-catalogue and further automations can be integrated. Technology investments should be a relatively small share of recurring cost-savings.
© 2017 KPMG LLP, a Canadian limited liability partnership and a member firm of the KPMG network of independent member firms affiliated with KPMG International Cooperative (“KPMG International”), a Swiss entity. All rights reserved. The KPMG name and logo are registered trademarks or trademarks of KPMG International. 32
CONFIDENTIAL
5.3 RisksConsiderations
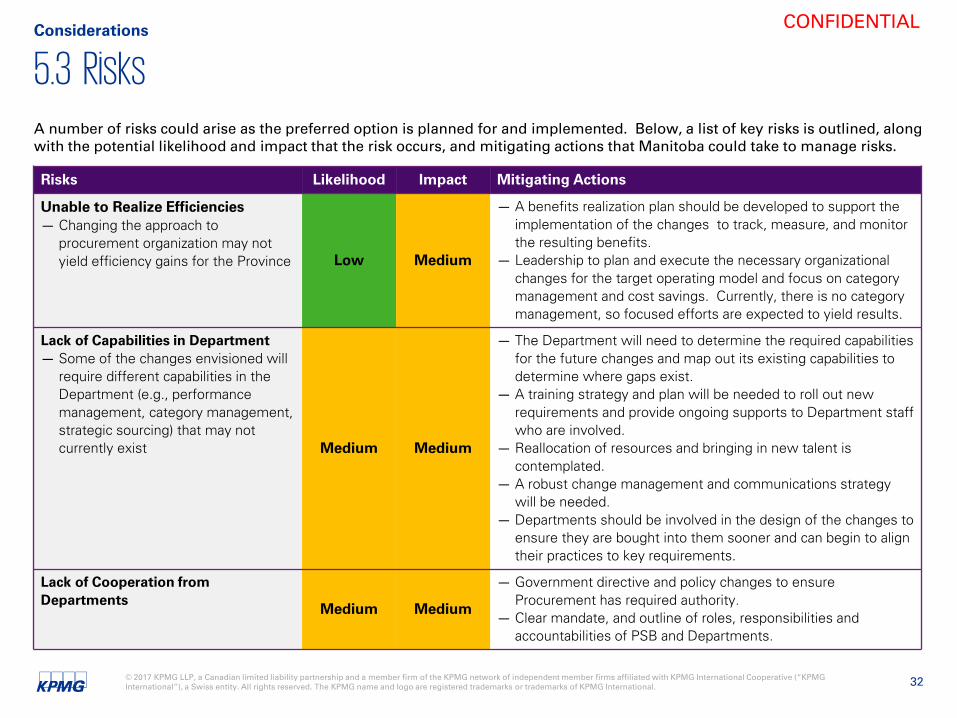
A number of risks could arise as the preferred option is planned for and implemented. Below, a list of key risks is outlined, along with the potential likelihood and impact that the risk occurs, and mitigating actions that Manitoba could take to manage risks.
Risks Likelihood Impact Mitigating Actions
Unable to Realize Efficiencies— Changing the approach to
procurement organization may not yield efficiency gains for the Province Low Medium
— A benefits realization plan should be developed to support the implementation of the changes to track, measure, and monitor the resulting benefits.
— Leadership to plan and execute the necessary organizational changes for the target operating model and focus on category management and cost savings. Currently, there is no category management, so focused efforts are expected to yield results.
Lack of Capabilities in Department— Some of the changes envisioned will
require different capabilities in the Department (e.g., performance management, category management, strategic sourcing) that may not currently exist Medium Medium
— The Department will need to determine the required capabilities for the future changes and map out its existing capabilities to determine where gaps exist.
— A training strategy and plan will be needed to roll out new requirements and provide ongoing supports to Department staff who are involved.
— Reallocation of resources and bringing in new talent is contemplated.
— A robust change management and communications strategy will be needed.
— Departments should be involved in the design of the changes to ensure they are bought into them sooner and can begin to align their practices to key requirements.
Lack of Cooperation from Departments
Medium Medium
— Government directive and policy changes to ensure Procurement has required authority.
— Clear mandate, and outline of roles, responsibilities and accountabilities of PSB and Departments.

© 2017 KPMG LLP, a Canadian limited liability partnership and a member firm of the KPMG network of independent member firms affiliated with KPMG International Cooperative (“KPMG International”), a Swiss entity. All rights reserved. The KPMG name and logo are registered trademarks or trademarks of KPMG International. 33
CONFIDENTIAL
5.4 Implementation Plan Framework at a High-levelConsiderations
Project Management
Change Management and Communications
Phase 0Current State– Detailed Planning
Phase 1Interim Org Model– Pilot 1st Categories– Select process changes
Phase 2Interim Org Model– Pilot 2nd Categories – Roll-out of process changes
Phase 3 End State Org Model – Final Categories– Complete process changes
A phased approach to the implementation of the organizational model and redesigned procurement processes is recommended. The key benefits include:— Allow sufficient time to recruit and/or re-skill for the capabilities and capacity needed to support the new organizational model.— Allow sufficient time to implement the technology changes to fully support the new processes while progressing towards the Vision.— Change is implemented in manageable pieces allowing time for the organization to adjust.— Provide the opportunity to continually evaluate the implementation and make changes along the way.
The proposed phases for the transition are depicted below:

© 2017 KPMG LLP, a Canadian limited liability partnership and a member firm of the KPMG network of independent member firms affiliated with KPMG International Cooperative (“KPMG International”), a Swiss entity. All rights reserved. The KPMG name and logo are registered trademarks or trademarks of KPMG International. 34
CONFIDENTIAL
5.4 Implementation Plan Framework at a High-levelConsiderations
Phase Detail Year 1 Year 2 Year 3 Year 4
Phase 0 (3 – 6 months)
— Project Setup/Establish project governance
— Engage Project Manager/Key project resources
— Establish Change Management/Communication Strategy/Plans
— Detailed Project Planning for Phase 1
Phase 1 (~ 12 months)
— Implement Interim Model/Recruit key resources
— Opportunistic strategic sourcing of goods and services
— Implement select process changes
— Focus and report on cost savings and KPIs
Phase 2 (~ 12 months)
— Implement Interim Model/Recruit resources
— Form first Category Team/Continue strategic sourcing
— Implement process changes to fully strategic categories
— Focus and report on cost savings and KPIs
Phase 3 (~ 12 months)
— Implement End State Organizational Model
— Implement all Key Category Teams
— Complete process change implementation
— Focus and report on cost savings and KPIs
Phase 0
(3-6mo)
Phase 2(12 months)
Phase 3(12 months)
Phase 1(12 months)

© 2017 KPMG LLP, a Canadian limited liability partnership and a member firm of the KPMG network of independent member firms affiliated with KPMG International Cooperative (“KPMG International”), a Swiss entity. All rights reserved. The KPMG name and logo are registered trademarks or trademarks of KPMG International. 35
CONFIDENTIALCONFIDENTIAL
Appendix A –Source-to-Pay Metrics

© 2017 KPMG LLP, a Canadian limited liability partnership and a member firm of the KPMG network of independent member firms affiliated with KPMG International Cooperative (“KPMG International”), a Swiss entity. All rights reserved. The KPMG name and logo are registered trademarks or trademarks of KPMG International. 36
CONFIDENTIAL
Design Criteria
— Improve Alignment – align what is measured with organizational performance objectives
— Drive Behavior – select metrics that drive the right behaviors and outcomes
— Promote Consistency – standardize what is measured across Supply Chain
— Enable Comparisons – implement metrics that compare progress against both internal expectations and external peers
— Demonstrate Success – allow Supply Chain to promote ongoing progress and continuous improvement
Guiding Principles
— Design metrics to be SMART – Specific, Measurable, Actionable, Realistic and Timely
— Measure a manageable number of metrics— Develop clear definitions which ease creation and
tracking— Include internal customers/ stakeholders in the
process as undertaken during creation of target models and design documents
— Define metrics which are actionable and can drive results
Strategy and RationaleAppendix A – Metrics
Design criteria and guiding principles to define these metrics is as follows:

© 2017 KPMG LLP, a Canadian limited liability partnership and a member firm of the KPMG network of independent member firms affiliated with KPMG International Cooperative (“KPMG International”), a Swiss entity. All rights reserved. The KPMG name and logo are registered trademarks or trademarks of KPMG International. 37
CONFIDENTIAL
Various Views of Metrics by Target AudienceAppendix A – Metrics
The defined metrics are broken down into key measurement groups, which are defined by the target audience for the metric. Metrics will vary by audience and this categorization helps to establish where metrics should be managed and reported to:
1. Executive Metrics
High-level metrics which help manage critical areas of the supply chain and provide insight into the overall performance
2. Managerial Metrics
Metrics which would be utilized by the management groups across key functional areas to help assess the performance of a particular process
3. Operational Metrics
Metrics to gauge adherence to policies and procedures, transaction volumes, and directional changes in overall activity to help managers and supervisors appropriately manage their functional areas
© 2017 KPMG LLP, a Canadian limited liability partnership and a member firm of the KPMG network of independent member firms affiliated with KPMG International Cooperative (“KPMG International”), a Swiss entity. All rights reserved. The KPMG name and logo are registered trademarks or trademarks of KPMG International. 38
CONFIDENTIAL
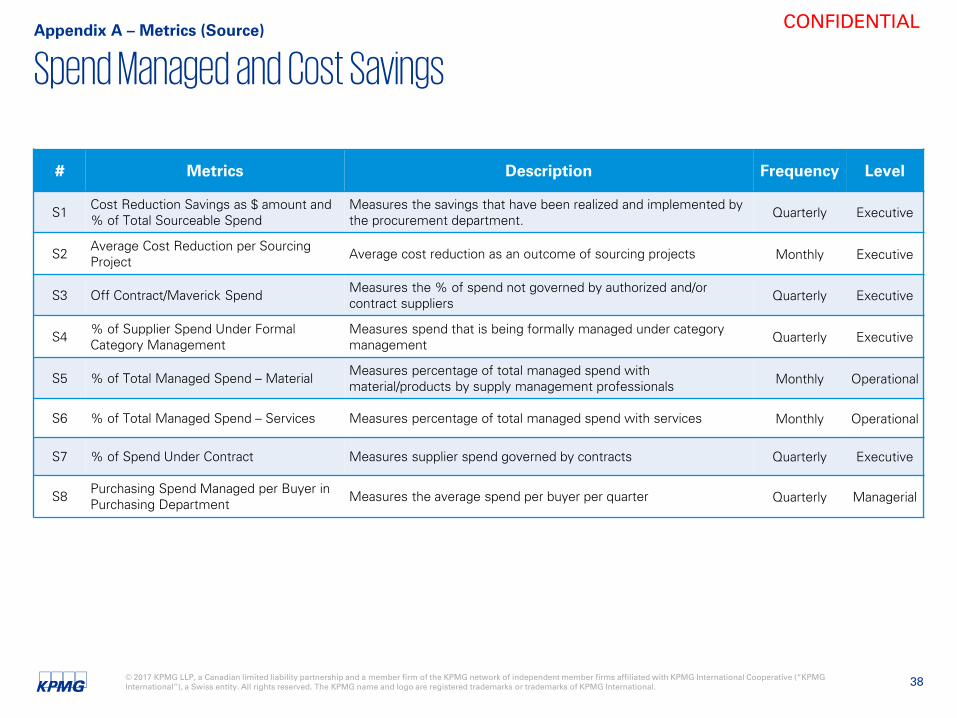
Spend Managed and Cost SavingsAppendix A – Metrics (Source)
# Metrics Description Frequency Level
S1 Cost Reduction Savings as $ amount and % of Total Sourceable Spend
Measures the savings that have been realized and implemented by the procurement department. Quarterly Executive
S2 Average Cost Reduction per Sourcing Project Average cost reduction as an outcome of sourcing projects Monthly Executive
S3 Off Contract/Maverick Spend Measures the % of spend not governed by authorized and/or contract suppliers Quarterly Executive
S4 % of Supplier Spend Under Formal Category Management
Measures spend that is being formally managed under category management Quarterly Executive
S5 % of Total Managed Spend – Material Measures percentage of total managed spend with material/products by supply management professionals Monthly Operational
S6 % of Total Managed Spend – Services Measures percentage of total managed spend with services Monthly Operational
S7 % of Spend Under Contract Measures supplier spend governed by contracts Quarterly Executive
S8 Purchasing Spend Managed per Buyer in Purchasing Department Measures the average spend per buyer per quarter Quarterly Managerial

© 2017 KPMG LLP, a Canadian limited liability partnership and a member firm of the KPMG network of independent member firms affiliated with KPMG International Cooperative (“KPMG International”), a Swiss entity. All rights reserved. The KPMG name and logo are registered trademarks or trademarks of KPMG International. 39
CONFIDENTIAL
Technology Usage and Cycle TimeAppendix A – Metrics (Source)
# Metrics Description Frequency Level
S9 # of Bid Events Executed Through eSourcing Tool/Manual Methods Measures the number of bid events executed in the eSourcing tool Monthly Executive
S10 % of Strategic Sourcing Events Planned Versus Executed
Measures the percentage of sourcing events executed as a percent planned as part of the category strategies and/or sourcing plans Quarterly Managerial
S11 Timeframe to Execute Full Sourcing Event Measures the time from initiation of the project to contract execution Quarterly Managerial
S12 Timeframe from Bid/RFP Award to Contract Execution
Measures the effectiveness of the process between awarding the business to executing the contract Quarterly Managerial
S13 % of Contracts Executed within Allotted Timeframe
Measures the percentage of contracts that are completed by their due date Quarterly Executive
S14 % of Sourcing Projects Completed on Schedule
Measures the effectiveness of the planning and full product lifecycle. Clear initiation and completion dates must be consistently identified and documented.
Yearly Managerial

© 2017 KPMG LLP, a Canadian limited liability partnership and a member firm of the KPMG network of independent member firms affiliated with KPMG International Cooperative (“KPMG International”), a Swiss entity. All rights reserved. The KPMG name and logo are registered trademarks or trademarks of KPMG International. 40
CONFIDENTIAL
Supplier ManagementAppendix A – Metrics (Source)
# Metrics Description Frequency Level
S15 % of Active Suppliers that account for 80% of total spend
Measures the current state of supplier consolidation and activity within the supply base from the previous year. Quarterly Executive
S16 % of Level 1 Suppliers with scorecards Measures the percent of Level 1 suppliers with scorecards Quarterly Executive
S17 Contract Compliant Spend Measures the spend on a contract for a given material, category, or commodity. Quarterly Executive
S18 % of procurement spend satisfied by preferred suppliers
Measure value of procurement requests satisfied by the preferred supplier list. This KPI can be measured for specific commodities as well
Quarterly Executive
S19 % of Spend Under Formal Management (Levels 1-2)
Measures spend with Level 1 and Level 2 suppliers as a percent of total sourceable spend. Quarterly Executive
S20 # of suppliers with spend over $X Measures number of suppliers with over $X in spend within a predetermined period Quarterly Managerial
S21 Operational Savings as a % of Total Managed Spend
Measures the percent of savings identified through management of contract metrics such as rebates, damages, payment terms, etc. compared to the total spend under formal management.
Quarterly Managerial
S22% of Strategic Sourcing Events with Supplier Relationship Management (SRM) Involvement
Measures the SRM involvement in strategic sourcing events for suppliers/categories that are currently under formal management, which includes all Level 1 and Level 2 Suppliers.
Quarterly Managerial
S23 % Returns Measures number of deliveries returned to supplier due to quality issues. Quarterly Operational

© 2017 KPMG LLP, a Canadian limited liability partnership and a member firm of the KPMG network of independent member firms affiliated with KPMG International Cooperative (“KPMG International”), a Swiss entity. All rights reserved. The KPMG name and logo are registered trademarks or trademarks of KPMG International. 41
CONFIDENTIAL
TransactionsAppendix A – Metrics (Buy)
# Metrics Description Frequency Level
B1 # of Transactions below $X Defines the number of transactions in the 'low dollar' transactions category which may be driving a high level of processing effort Monthly Managerial
B2 % of Auto Three-way Match Transactions
Confirms the number of transactions that were process via an automated three way match (no manual intervention) Monthly Executive
B3 Average PO transaction value Average PO transaction value Monthly Managerial
B4 PO Volume at Specific BreaksMeasures the volume of transactions which executed via PO at specific value amounts. (Volume breakdowns can change as required over time)
Quarterly Operational
B5 PO Issues Requiring Change Orders: Percentage of PO Changes
Average Percentage of Change Orders for those suppliers that send PO Confirmations. Monthly Managerial
B6 # of Partial Purchase Order Receipt of Goods per Week
Defines the number of partial PO receipts which may be driving down the three-way match compliance rate Monthly Managerial
B7 % of Purchase Orders Transacted using Supplier Catalogs Purchase order transmitted through catalog transactions Monthly Managerial
B8 Catalog Count Number of Catalog Items Loaded to Date Monthly Managerial
B9 Catalog Punchout: Purchase Requisition (PR) Count Number of PR’s Utilizing Catalog Punchout Monthly Managerial
B10 P-Card Volume at Specific BreaksMeasures the volume of transactions which executed via P-Card at specific value amounts. (Volume breakdowns can change as required over time)
Quarterly Operational
B11 # of Invoice Only Transactions Defines the number of transactions which were requested and paid via the invoice only transaction Monthly Executive

© 2017 KPMG LLP, a Canadian limited liability partnership and a member firm of the KPMG network of independent member firms affiliated with KPMG International Cooperative (“KPMG International”), a Swiss entity. All rights reserved. The KPMG name and logo are registered trademarks or trademarks of KPMG International. 42
CONFIDENTIAL
SpendAppendix A – Metrics (Buy)
# Metrics Description Frequency Level
B12 % of Discounts Available that are Taken Measures percent of available discounts taken by AP Monthly Executive
B13 $ Value of Lost Discounts Defines the dollar value of the discounts lost in the month due to late payments Monthly Executive
B14 $ Value of List Price Discrepancies to Contract Value
Displays the difference between the purchase order price and contracted price Yearly Operational
B15 Total “No Touch” Spend Total spend that is not able to be managed Monthly Executive
B16 Average spend by buyer Average amount of spend initiated by each buyer Monthly Managerial
B17 Rogue P-Card Spend Review of transactions using P-Card, to identify prohibited categories and vendors Monthly Managerial

© 2017 KPMG LLP, a Canadian limited liability partnership and a member firm of the KPMG network of independent member firms affiliated with KPMG International Cooperative (“KPMG International”), a Swiss entity. All rights reserved. The KPMG name and logo are registered trademarks or trademarks of KPMG International. 43
CONFIDENTIAL
Technology Usage and Cycle TimeAppendix A – Metrics (Buy)
# Metrics Description Frequency Level
B18 Days Payable Outstanding (DPO) Measures the number of days on average an organization takes to pay bills from the day they are received Monthly Executive
B19 % of Invoices Paid on Time Measures the percent of times an invoice is paid on time Monthly Executive
B21 Average Days to Process Invoice Approval
Calculates the average number of days required to receive an invoice approval Monthly Executive
B22 Average # of Days to Approve Purchase Order from Requisition Average number of days from requisition to PO approval Monthly Managerial
B23 Transacting Suppliers in the Portal Number of suppliers capable of transacting via the technology tool to date Monthly Executive
B24 Invoice Volume in the Portal Number of Invoices that suppliers are transacting in the technology tool Monthly Managerial
B25 PO Volume in the Portal Total number of POs throughput on the technology tool to date Monthly Managerial
B26 PO Spend in the Portal Total spend throughput on the technology tool to date Monthly Executive

© 2017 KPMG LLP, a Canadian limited liability partnership and a member firm of the KPMG network of independent member firms affiliated with KPMG International Cooperative (“KPMG International”), a Swiss entity. All rights reserved. The KPMG name and logo are registered trademarks or trademarks of KPMG International. 44
CONFIDENTIALCONFIDENTIAL
Appendix B – Category Detailed Spend Analysis

© 2017 KPMG LLP, a Canadian limited liability partnership and a member firm of the KPMG network of independent member firms affiliated with KPMG International Cooperative (“KPMG International”), a Swiss entity. All rights reserved. The KPMG name and logo are registered trademarks or trademarks of KPMG International. 45
CONFIDENTIAL
Fiscal Year 2015/16 – Overview of Spend Categories and Adjusted SpendAppendix B – Spend Analysis
Data from the Procurement Services Branch in Manitoba Finance shows Government of Manitoba purchases of goods and services over $1.2 billion in 2015/16. This data consists of Purchase Orders only and does not capture all procurement (alsoexcludes Crown agencies, etc.). Construction Services is the largest category, representing approximately one-half of the $1.2 billion in 2015/16. Construction Services has been excluded from the analysis as the nature of this type of spend has very limited cost saving opportunities, although there are cost improvement opportunities related to better contract management. As outlined in the Phase 1 Report, filters were applied to identify categories of “addressable spend” that are candidates forcategory management and significant cost saving potential. As per the scope of Phase 2, data analysis was targeted to “top 10” categories of opportunity. There are opportunities in other areas of procurement spend where similar analysis and principlescan be applied in the future. Thus, this represents only a portion of procurement opportunities. As the system is implemented and transformed over the medium-term, more categories and spend should be coordinated by PSB.Based on the provided data sets, the spend categories presented in the table below have been analyzed in order to qualify thecharacteristics of the spend1. For each category, when the total spend provided in the first data set was higher than in the second data set, the adjusted spend amount leverages a portion of the difference to reflect the similar level of spend. Part of the difference between the two data sets is KPMG requested more detailed data requirements and information for Phase 2.

© 2017 KPMG LLP, a Canadian limited liability partnership and a member firm of the KPMG network of independent member firms affiliated with KPMG International Cooperative (“KPMG International”), a Swiss entity. All rights reserved. The KPMG name and logo are registered trademarks or trademarks of KPMG International. 46
CONFIDENTIAL
Fiscal Year 2015/16 – Overview of Spend Categories and Adjusted SpendAppendix B – Spend Analysis
Source: Derived from Manitoba 2015/16 Spend Data.
Spend Categories 1st Data set – Spend in 2015/16 2nd Data set – Spend in 2015/16Adjusted Data set – Spend in
2015/16
1 – Operating Services $ 122 755 101 $ 166 513 123 $ 166 513 123
2 – Professional Services $ 109 730 469 $ 67 328 652 $ 97 009 924
3 – Medical, Dental, Veterinary $ 32 264 377 $ 1 830 180 $ 23 134 118
4 – Office Equipment $ 21 084 429 $ 6 384 287 $ 16 674 386
5 – Communication Equipment $ 20 947 116 $ 272 128 $ 14 744 620
6 – Maintenance & Repair Services $ 20 536 299 $ 11 722 749 $ 17 892 234
7 – Communication Services $ 17 802 460 $ 23 824 $ 12 468 869
8 – Food $ 11 129 773 $ 2 887 749 $ 8 657 166
9 – Vehicles, All types $ 6 294 413 $ 4 696 219 $ 5 814 955
10 – Fuels and Lubricants $ 5 775 494 $ 1 152 819 $ 4 388 692
11 – Machinery $ 3 784 628 $ 3 784 628
12 – Furniture and Furnishings $ 2 419 709 $ 2 419 709
13 – Safety Equipment and Devices $ 1 222 035 $ 1 222 035
Total $ 368 319 931 $ 270 238 102 $ 374 724 458 1 Only categories Communication Equipment and Communication Services have not been detailed due to the lack of detailed transactional data available.

© 2017 KPMG LLP, a Canadian limited liability partnership and a member firm of the KPMG network of independent member firms affiliated with KPMG International Cooperative (“KPMG International”), a Swiss entity. All rights reserved. The KPMG name and logo are registered trademarks or trademarks of KPMG International. 47
CONFIDENTIAL
Category Evaluation – Operating Services (1/2) Appendix B – Spend Analysis
The following analyses intend to gather some intelligence on the considered spend category, with the view to identify the relevant value levers. More precisely, these analyses notably provide some insights on top vendors, on the nature of spend (i.e., subcategories), as well as on the proportion of spend under Outline Agreements.
Proportion of spend under an Outline AgreementWhich entity placed the order?
98.90%
0.44%0.20%
0.45%
COMPUTER RELATED SERVICESOPERATING FEES FOR SERVICERENTALS AND LEASESTRANSPORTATION SERVICES
77%
23% Under an OA
Not under an OA
Spend Control Assessment
Nature of Spend Specificities
• As this top spend category is being procured by BTT (76%), ASD (23%) and PSB, opportunities to further centralize this type of purchase and have it managed by BTT could be examined.
• Increasing the proportion of spend under control of BTT would indeed present several benefits, among which:1. Bundling the volumes bought to
increase Manitoba’s bargaining power;
2. Standardizing the procurement processes and market approach.
76%
23%
1%
BTT ASD PSB
Business Areas
Total # of business areas buying this category 22
Subcategories/Groups
• Within this division, the group/ subcategory Computer Related Services accounts for almost 99% of the total annual spend.
• A total of 4 subcategories are included within this spend category.
Total annual spend for the category (2015/16) $ 167m
• A total of 22 business areas are requesting this spend category. Analyzing current contracts might enable to identify bundling and/or negotiation opportunities.
• Among the 22 business areas, the business areas Central Services and Growth, Enterprise and Trade account for 99% of the spend.
81%
18%
1%
Central ServicesGrowth, Enterprise and TradeOthers
• Only 23% of the total annual spend for this category was ordered using Outline Agreements.
• This spend represents 1,502 Release Orders, which were placed under 52 different Outline Agreements.
• 2,046 other Purchase Orders were placed for this category.
1

© 2017 KPMG LLP, a Canadian limited liability partnership and a member firm of the KPMG network of independent member firms affiliated with KPMG International Cooperative (“KPMG International”), a Swiss entity. All rights reserved. The KPMG name and logo are registered trademarks or trademarks of KPMG International. 48
CONFIDENTIAL
Category Evaluation – Operating Services (2/2) Appendix B – Spend Analysis
Rank Vendor Spend in $K (2015/16)
Spend in % (2015/16)
1 2009627 – IBM CANADA LTD $ 44 709 27%
2 2001349 – HEWLETT- PACKARD (CANADA) CO $ 33 037 20%
3 2058449 – MTS ALLSTREAM INC $ 17 462 10%
4 2117139 – TECHNOLOGY CONSORTIUM $ 15 768 9%
5 2206711 – #N/A $ 14 936 9%
6 2139886 – #N/A $ 14 741 9%
7 2086488 – ESRI CANADA $ 2 497 1%
8 2074103 – I D FUSION SOFTWARE $ 2 351 1%
9 2068369 – EPIC INFORMATION SOLUTIONS $ 1 924 1%
10 2208078 – #N/A $ 1 509 1%
11 All other vendors (335) $ 17 579 11%
Total – Top 10 Vendors only $ 148 935 89%
Total – All Vendors (345) $ 166 513 100%
Source: Derived from Manitoba 2015/16 spend data.
MediumTotal annual spend(2015/16)
Potential Savings$ 167m
Top 10 Vendors
Potential Value Levers Relevance
Products and Services
• Not a priority value lever
Supplier Agreements
• As many business areas (22) are buying from this category, analyzing current needs might enable the identification of bundling opportunities, resulting in an increase of the organization’s bargaining power. This vendor is also in the top 10 of the vendors of other selected categories, such as Office Equipment.
• BTT is currently managing the largest part of the spend. The opportunity for BTT to benefit from PSB’s assistance, at least on the most critical purchases, should be examined. PSB’s expertise could indeed be leveraged, notably for negotiating and for providing potential additional market insights.
Supply Markets
• An advanced understanding of supply markets is required for this top highly technical spend category. PSB is the entity which should be prepared to provide precise competitive intelligence to its internal clients.
End-to-End Process
• As both BTT and ASD are managing this critical category, opportunities to standardize and streamline the procurement processes might be considered, with a view to improve efficiency, decrease transaction costs and eliminate potential duplicated activities. Some procurement activities, such as market analysis or supplier performance management, should be progressively centralized.
In- versus Outsourcing
• Not a priority value lever
Value Levers Analysis
1

© 2017 KPMG LLP, a Canadian limited liability partnership and a member firm of the KPMG network of independent member firms affiliated with KPMG International Cooperative (“KPMG International”), a Swiss entity. All rights reserved. The KPMG name and logo are registered trademarks or trademarks of KPMG International. 49
CONFIDENTIAL
• Only 4% of the total annual spend for this category was ordered using Outline Agreements.
• This spend represents 367 Release Orders, which were placed under 40 different Outline Agreements.
• 2,468 other Purchase Orders were placed for this category.
Category Evaluation – Professional Services (1/2) Appendix B – Spend Analysis
The following analyses intend to gather some intelligence on the considered spend category, with the view to identify the relevant value levers. More precisely, these analyses notably provide some insights on top vendors, on the nature of spend (i.e., subcategories), as well as on the proportion of spend under Outline Agreements.
Proportion of spend under an Outline Agreement
Spend Control Assessment
Nature of Spend Specificities
86%
13%
1%
PSB ASD BTT
Business Areas
Total # of business areas buying this category 26
Subcategories/Groups
Total annual spend for the category (2015/16) $ 67m
99.80%
0.20%
PROFESSIONAL SERVICE PROVISIONOTHER FEES FOR SERVICE
• Only two groups/subcategories are accounting for all of the annual spend for this category : Professional Service Provision and Other Fees for Service.
• Among them, Professional Service Provision accounts almost all of the spend.
30%
22%21%
21%
6%
InfrastructureHealth, Seniors and Active LivingCentral ServicesOthers
• A total of 26 business areas are buying from this spend category. Further investigation on existing needs and buying methods could be conducted to identify potential bundling opportunities and processes to be standardized .
• The 4 main business areas presented on this graph account for almost 80% of the annual spend.
• As this top spend category is being mainly procured by PSB (86%), opportunities to further centralize the procurement of this category appear rather low, even though they still exist.
• Other value levers should however be prioritized to secure savings on this high spend category.
96%
4% Under an OA
Not under an OA
2
Which entity placed the order?

© 2017 KPMG LLP, a Canadian limited liability partnership and a member firm of the KPMG network of independent member firms affiliated with KPMG International Cooperative (“KPMG International”), a Swiss entity. All rights reserved. The KPMG name and logo are registered trademarks or trademarks of KPMG International. 50
CONFIDENTIAL
Category Evaluation – Professional Services (2/2) Appendix B – Spend Analysis
Rank Vendor Spend in $K (2015/16)
Spend in % (2015/16)
1 NUMBER TEN ARCHITECTURAL GROUP $ 4 990 7%
2 KGS GROUP $ 3 765 6%
3 2027832 – N/A $ 1 929 3%
4 SYNYSHYN ARCHITECTURE $ 1 749 3%
5 STANTEC ARCHITECTURE $ 1 576 2%
6 2221529 – N/A $ 1 512 2%
7 2037214 – N/A $ 1 441 2%
8 2193828 – N/A $ 1 356 2%
9 MORRISON HERSHFIELD LTD $ 1 355 2%
10 CROSIER KILGOUR & PARTNERS LTD $ 1 226 2%
11 All other vendors (685) $ 46 430 69%
Total – Top 10 Vendors only $ 20 898 31%
Total – All Vendors (695) $ 67 329 100%
Source: Derived from Manitoba 2015/16 spend data.
MediumTotal annual spend (2015/16)
Potential Savings$ 67m
Top 10 Vendors
Potential Value Levers Relevance
Products & Services
• Further consolidating the spend and refining a consolidated view on the volumes and types of services requested on a recurring basis throughout the organization, appears as a prerequisite to a thorough needs assessment.
Supplier Agreements
• The high number of vendors (695) and the low proportion represented by the top 10 vendors (only 31% of the total spend), suggest to improve the understanding of business requirements to better establish service agreements with vendors of record, and determine whether further supplier base rationalization can be achieved.
Supply Markets
• Ensuring cost structure transparency through Outline Agreements (currently only 4% of the spend) or commercial agreements (i.e., pre-established rate grids by seniority level) could be leveraged during negotiations.
• Further refining the knowledge of the market offering for the architectural services, a highly specialized type of service which accounts for a significant part of the top 10 vendors.
End-to-End Process
• 26 business areas are buying from this spend category, among which 4 business areas account for almost 80% of the annual spend. Streamlining procurement processes for these 4 business areas should help achieving higher efficiency and securing savings, through lower transactional costs.
In- versus Outsourcing
• Not a priority value lever
Value Levers Analysis
2
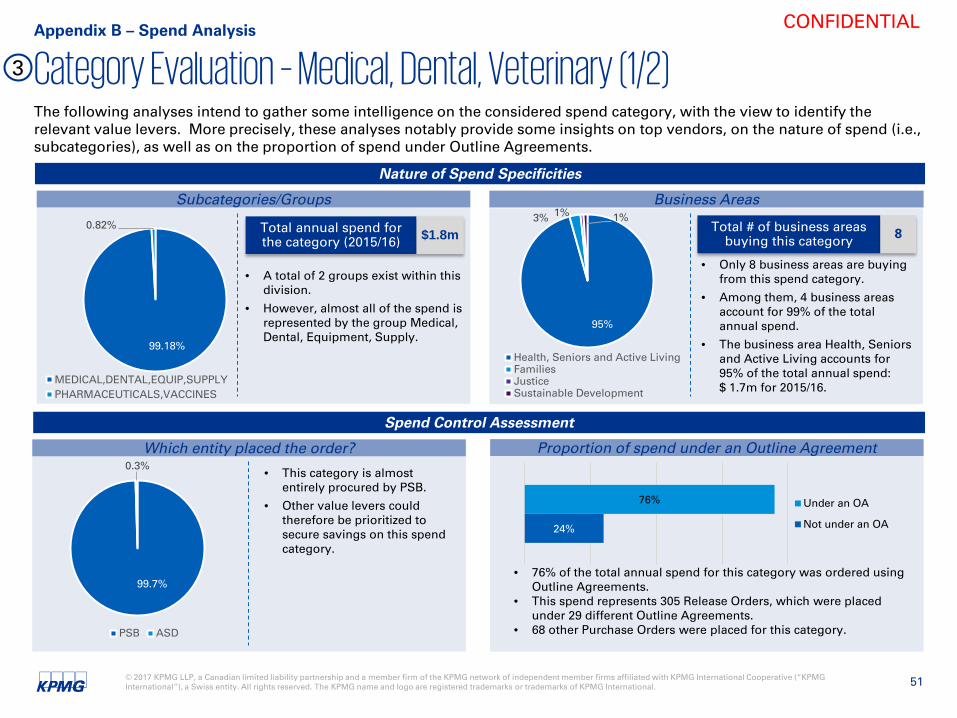
© 2017 KPMG LLP, a Canadian limited liability partnership and a member firm of the KPMG network of independent member firms affiliated with KPMG International Cooperative (“KPMG International”), a Swiss entity. All rights reserved. The KPMG name and logo are registered trademarks or trademarks of KPMG International. 51
CONFIDENTIAL
Category Evaluation – Medical, Dental, Veterinary (1/2) Appendix B – Spend Analysis
The following analyses intend to gather some intelligence on the considered spend category, with the view to identify the relevant value levers. More precisely, these analyses notably provide some insights on top vendors, on the nature of spend (i.e., subcategories), as well as on the proportion of spend under Outline Agreements.
Proportion of spend under an Outline Agreement
Subcategories/Groups Business Areas
99.18%
0.82%
MEDICAL,DENTAL,EQUIP,SUPPLYPHARMACEUTICALS,VACCINES
Spend Control Assessment
Nature of Spend Specificities
• This category is almost entirely procured by PSB.
• Other value levers could therefore be prioritized to secure savings on this spend category.
99.7%
0.3%
PSB ASD
Total # of business areas buying this category 8Total annual spend for
the category (2015/16) $1.8m
95%
3% 1% 1%
Health, Seniors and Active LivingFamiliesJusticeSustainable Development
• A total of 2 groups exist within this division.
• However, almost all of the spend is represented by the group Medical, Dental, Equipment, Supply.
• Only 8 business areas are buying from this spend category.
• Among them, 4 business areas account for 99% of the total annual spend.
• The business area Health, Seniors and Active Living accounts for 95% of the total annual spend: $ 1.7m for 2015/16.
• 76% of the total annual spend for this category was ordered using Outline Agreements.
• This spend represents 305 Release Orders, which were placed under 29 different Outline Agreements.
• 68 other Purchase Orders were placed for this category.
24%
76% Under an OA
Not under an OA
3
Which entity placed the order?

© 2017 KPMG LLP, a Canadian limited liability partnership and a member firm of the KPMG network of independent member firms affiliated with KPMG International Cooperative (“KPMG International”), a Swiss entity. All rights reserved. The KPMG name and logo are registered trademarks or trademarks of KPMG International. 52
CONFIDENTIAL
Category Evaluation – Medical, Dental, Veterinary (2/2) Appendix B – Spend Analysis
Rank Vendor Spend in $K (2015/16)
Spend in % (2015/16)
1 2089628 - #N/A $ 608 33%
2 2268215 - #N/A $ 241 13%
3 2000338 - #N/A $ 169 9%
4 2081458 - #N/A $ 99 5%
5 2238035 - #N/A $ 80 4%
6 2000453 - BIOMERIEUX CANADA INC $ 72 4%
7 2267349 - #N/A $ 72 4%
8 2020156 - #N/A $ 47 3%
9 2000521 - #N/A $ 44 2%
10 2204278 - #N/A $ 44 2%
11 All other vendors (39) $ 354 19%
Total – Top 10 Vendors only $ 1 476 81%
Total – All Vendors (49) $ 1 830 100%
Source: Derived from Manitoba 2015/16 spend data.
LowTotal annual spend (2015/16)
Potential Savings$1.8m
Top 10 Vendors
Potential Value Levers Relevance
Products & Services
• Not a priority value lever
Supplier Agreements
• As the top vendor accounts for 33% of the total spend, regular competitive tendering is required, as well as documented frequent negotiations and a complete supplier performance follow-up.
Supply Markets
• Further refining the knowledge of the market offering could be considered for these highly specialized types of services.
End-to-End Process
• Not a priority value lever
In- versus Outsourcing
• Not a priority value lever
Value Levers Analysis
3
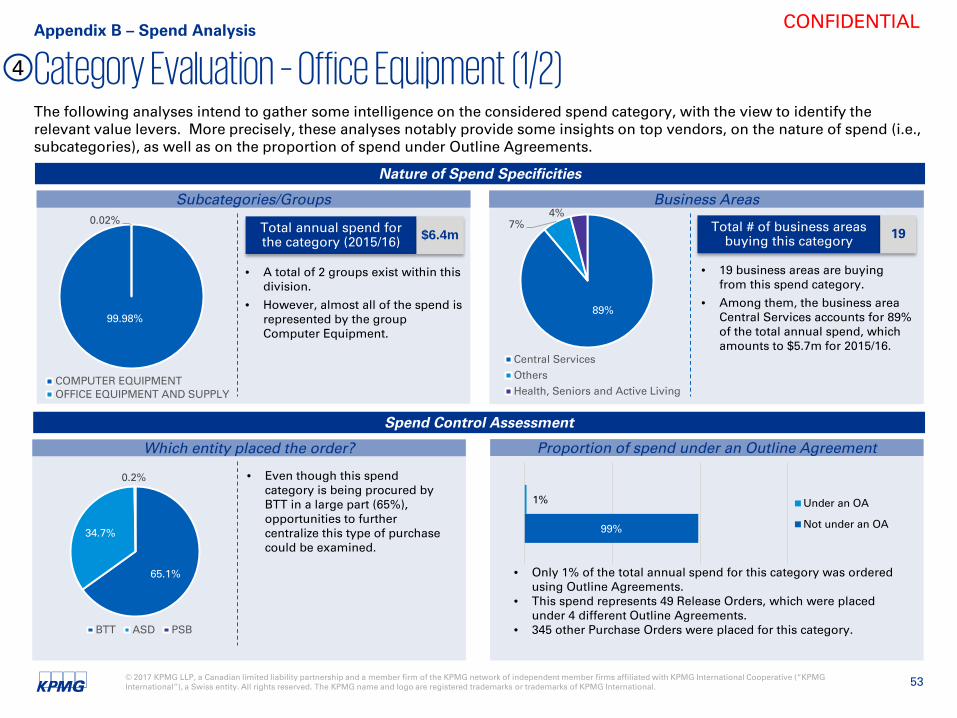
© 2017 KPMG LLP, a Canadian limited liability partnership and a member firm of the KPMG network of independent member firms affiliated with KPMG International Cooperative (“KPMG International”), a Swiss entity. All rights reserved. The KPMG name and logo are registered trademarks or trademarks of KPMG International. 53
CONFIDENTIAL
Category Evaluation – Office Equipment (1/2) Appendix B – Spend Analysis
The following analyses intend to gather some intelligence on the considered spend category, with the view to identify the relevant value levers. More precisely, these analyses notably provide some insights on top vendors, on the nature of spend (i.e., subcategories), as well as on the proportion of spend under Outline Agreements.
Proportion of spend under an Outline Agreement
Subcategories/Groups Business Areas
Spend Control Assessment
Nature of Spend Specificities
• Which business areas are buying from this spend categories?
• Can we identify bundling opportunities?
65.1%
34.7%
0.2%
BTT ASD PSB
Subcategories/Groups Business Areas
Total # of business areas buying this category 19Total annual spend for
the category (2015/16) $6.4m
• A total of 2 groups exist within this division.
• However, almost all of the spend is represented by the group Computer Equipment.
99.98%
0.02%
COMPUTER EQUIPMENTOFFICE EQUIPMENT AND SUPPLY
89%
7%4%
Central ServicesOthersHealth, Seniors and Active Living
• 19 business areas are buying from this spend category.
• Among them, the business area Central Services accounts for 89% of the total annual spend, which amounts to $5.7m for 2015/16.
• Even though this spend category is being procured by BTT in a large part (65%), opportunities to further centralize this type of purchase could be examined.
• Only 1% of the total annual spend for this category was ordered using Outline Agreements.
• This spend represents 49 Release Orders, which were placed under 4 different Outline Agreements.
• 345 other Purchase Orders were placed for this category.
99%
1% Under an OA
Not under an OA
4
Which entity placed the order?

© 2017 KPMG LLP, a Canadian limited liability partnership and a member firm of the KPMG network of independent member firms affiliated with KPMG International Cooperative (“KPMG International”), a Swiss entity. All rights reserved. The KPMG name and logo are registered trademarks or trademarks of KPMG International. 54
CONFIDENTIAL
Category Evaluation – Office Equipment (2/2) Appendix B – Spend Analysis
Rank Vendor Spend in $K (2015/16)
Spend in % (2015/16)
1 2047016 - SAP CANADA INC $ 4 026 63%
2 2266404 - #N/A $ 636 10%
3 2068369 - #N/A $ 390 6%
4 2141932 - ACRODEX INC $ 172 3%
5 2197075 - #N/A $ 161 3%
6 2117139 - #N/A $ 158 2%
7 2206711 - #N/A $ 157 2%
8 2139886 - #N/A $ 140 2%
9 2205424 - B SHARP TECHNOLOGIES INC $ 118 2%
10 2001349 - HEWLETT- PACKARD (CANADA) CO $ 82 1%
11 All other vendors (48) $ 343 5%
Total – Top 10 Vendors only $ 6 041 95%
Total – All Vendors (58) $ 6 384 100%
Source: Derived from Manitoba 2015/16 spend data.
HighTotal annual spend (2015/16)
Potential Savings$ 6.4m
Top 10 Vendors
Potential Value Levers Relevance
Products & Services
• Refining a consolidated view on the volumes and types of computer equipment (top subcategory) requested on a recurring basis throughout the organization, appears as a prerequisite to a thorough needs assessment of the organization, for this category.
Supplier Agreements
• As the top vendor accounts for 63% of the total spend, regular competitive tendering is required, as well as documented frequent negotiations and a complete supplier performance follow-up.
• This vendor is also in the top 10 of the vendors of other selected categories, such as Operating services, which might represent an opportunity for bundling across categories.
Supply Markets
• Not a priority value lever
End-to-End Process
• Not a priority value lever
In- versus Outsourcing
• Not a priority value lever
Value Levers Analysis
4

© 2017 KPMG LLP, a Canadian limited liability partnership and a member firm of the KPMG network of independent member firms affiliated with KPMG International Cooperative (“KPMG International”), a Swiss entity. All rights reserved. The KPMG name and logo are registered trademarks or trademarks of KPMG International. 55
CONFIDENTIAL
Category Evaluation – Maintenance and Repair Services (1/2) Appendix B – Spend Analysis
The following analyses intend to gather some intelligence on the considered spend category, with the view to identify the relevant value levers. More precisely, these analyses notably provide some insights on top vendors, on the nature of spend (i.e., subcategories), as well as on the proportion of spend under Outline Agreements.
Proportion of spend under an Outline Agreement
Spend Control Assessment
Nature of Spend Specificities
97%
2% 1%
ASD PSB BTT
Subcategories/Groups Business Areas
• Which business areas are buying from this spend categories?
• Can we identify bundling opportunities?
Subcategories/Groups Business Areas
Total # of business areas buying this category 6Total annual spend for
the category (2015/16) $ 11.7m
• A total of 3 groups or subcategories exist within this division. These 3 groups seem to refer to 3 different supply markets.
• The subcategory Repairs & Maintenance Services accounts for a significant part of the spend.
• Only 6 business areas are buying from this spend category.
• Among them, the business area Central Services accounts for 94% of the total annual spend, which amounts to more than $ 11m for 2015/16. Buying methods and sourcing initiatives of this business area could be examined.
77.19%
15.67%
7.14%
REPAIRS & MAINTENANCE SERVICESCLEANING SERVICESGROUNDS & SECURITY SERVICES
94%
4% 2%
Central ServicesInfrastructureOthers
• This spend category is being procured by ASD in a large part (97%).
• Only 2% of the total annual spend for this category was ordered using Outline Agreements.
• This spend represents 113 Release Orders, which were placed under 10 different Outline Agreements.
• 3,712 other Purchase Orders were placed for this category.
98%
2% Under an OA
Not under an OA
6
Which entity placed the order?

© 2017 KPMG LLP, a Canadian limited liability partnership and a member firm of the KPMG network of independent member firms affiliated with KPMG International Cooperative (“KPMG International”), a Swiss entity. All rights reserved. The KPMG name and logo are registered trademarks or trademarks of KPMG International. 56
CONFIDENTIAL
Category Evaluation – Maintenance and Repair Services (2/2) Appendix B – Spend Analysis
Rank Vendor Spend in $K (2015/16)
Spend in % (2015/16)
1 2164964 - PROGRESSIVE WASTE SOLUTIONS CANADA $ 1 145 10%
2 0002007276 - GLOBAL MECHANICAL LTD $ 1 143 10%
3 0002018726 - BEN WIEBE CONSTRUCTION (1985) LTD $ 1 089 9%
4 2027514 - VIPOND INC $ 945 8%
5 2124200 - FOUR SEASONS MECHANICAL $ 625 5%
6 2026064 - THYSSENKRUPP ELEVATOR CORP $ 491 4%
7 2248578 - HORIZON BUILDERS LTD $ 212 2%
8 2013598 - LOWE MECHANICAL SERVICES LTD $ 202 2%
9 0002178871 - NATIONAL REFRIGERATION HEATING LTD $ 200 2%
10 2225188 - TOTAL CO- ORDINATION AND $ 199 2%
11 All other vendors (256) $ 5 472 47%
Total – Top 10 Vendors only $ 6 250 53%
Total – All Vendors (266) $ 11 723 100%
Source: Derived from Manitoba 2015/16 spend data.
MediumTotal annual spend (2015/16)
Potential Savings$ 11.7m
Top 10 Vendors
Potential Value Levers Relevance
Products & Services
• Rationale behind the bundling of the 3 subcategories / groups (repairs & maintenance services, cleaning services, grounds and security services) into a single division should be reviewed.
Supplier Agreements
• The relatively low proportion represented by the top 10 vendors (only 53% of the total spend) suggests to improve the understanding of business requirements to better establish service agreements with vendors of record, and determine whether further supplier base rationalization can be achieved.
• Ensure vendors’ cost structure transparency, segregating out supplies from service, and benchmark the vendors’ pricelists against the prices of the general maintenance items bought from vendors separately from the services (for in-house maintenance services, if they exist)
Supply Markets
• This spend category contains three subcategories (repairs & maintenance services, cleaning services and grounds and security services) which seem to pertain to three different suppliers’ markets. A thorough understanding of these markets is required. Also, different procurement strategies, as well as distinct value levers, should be applied.
End-to-End Process
• Not a priority value lever
In- versus Outsourcing
• Not a priority value lever
Value Levers Analysis
6

© 2017 KPMG LLP, a Canadian limited liability partnership and a member firm of the KPMG network of independent member firms affiliated with KPMG International Cooperative (“KPMG International”), a Swiss entity. All rights reserved. The KPMG name and logo are registered trademarks or trademarks of KPMG International. 57
CONFIDENTIAL
Category Evaluation - Food (1/2) Appendix B – Spend Analysis
The following analyses intend to gather some intelligence on the considered spend category, with the view to identify the relevant value levers. More precisely, these analyses notably provide some insights on top vendors, on the nature of spend (i.e., subcategories), as well as on the proportion of spend under Outline Agreements.
Proportion of spend under an Outline Agreement
Subcategories/Groups Business Areas
Spend Control Assessment
Nature of Spend Specificities
98.9%
1.0% 0.1%
PSB ASD BTT
Subcategories/Groups Business Areas
• Which business areas are buying from this spend categories?
• Can we identify bundling opportunities?
Subcategories/Groups Business Areas
Total # of business areas buying this category 9Total annual spend for
the category (2015/16) $ 2.9m
• A total of 3 groups or subcategories exist within this division.
• Only 9 business areas are buying from this spend category.
• Among them, the business areas Justice and Health, Seniors and Active Living account for 77% and 11% of the total annual spend, respectively. Opportunities to assess and possibly bundle needs should be therefore considered.
74.22%
25.12%
0.66%
PROCESSED,CANNED,DRIEDFRESH,FROZENWATER,ICE
77%
11%
7%6%
JusticeHealth, Seniors and Active LivingFamiliesOthers
• This category is almost entirely procured by PSB.
• Other value levers could therefore be prioritized to secure savings on this spend category.
• 96% of the total annual spend for this category was ordered using Outline Agreements.
• This spend represents 11,402 Release Orders, which were placed under 25 different Outline Agreements.
• 388 other Purchase Orders were placed for this category.
4%
96% Under an OA
Not under an OA
8
Which entity placed the order?

© 2017 KPMG LLP, a Canadian limited liability partnership and a member firm of the KPMG network of independent member firms affiliated with KPMG International Cooperative (“KPMG International”), a Swiss entity. All rights reserved. The KPMG name and logo are registered trademarks or trademarks of KPMG International. 58
CONFIDENTIAL
Category Evaluation – Food (2/2) Appendix B – Spend Analysis
Rank Vendor Spend in $K (2015/16)
Spend in % (2015/16)
1 2140934 - SYSCO FOOD SERVICES OF WINNIPEG $ 1 062 37%
2 2197442 - #N/A $ 963 33%
3 2019790 - PRATTS WHOLESALE LTD $ 386 13%
4 2039943 - #N/A $ 371 13%
5 2250931 - #N/A $ 31 1%
6 2027391 - VICTORIA INN BRANDON $ 19 1%
7 2045718 - SWS DETENTION GROUP INC $ 11 0.4%
8 2263522 - #N/A $ 11 0.4%
9 2239187 - L'EAU-1 $ 9 0.3%
10 2033203 - #N/A $ 8 0.3%
11 All other vendors (12) $ 18 0.6%
Total – Top 10 Vendors only $ 2 870 99.4%
Total – All Vendors (22) $ 2 888 100%
Source: Derived from Manitoba 2015/16 spend data.
LowTotal annual spend (2015/16)
Potential Savings$ 2.9m
Top 10 Vendors
Potential Value Levers Relevance
Products & Services
• Refining a consolidated view on the types of goods and/or services requested on a recurring basis throughout the organization, appears as a prerequisite to a thorough needs assessment.
Supplier Agreements
• As the top 2 vendors respectively account for 37% and 33% of the total spend, regular competitive tendering is required, as well as documented frequent negotiations and a complete supplier performance follow-up.
Supply Markets
• Not a priority value lever
End-to-End Process
• Not a priority value lever
In- versus Outsourcing
• Could be a priority value lever. Some additional contextual information would be required.
Value Levers Analysis
8
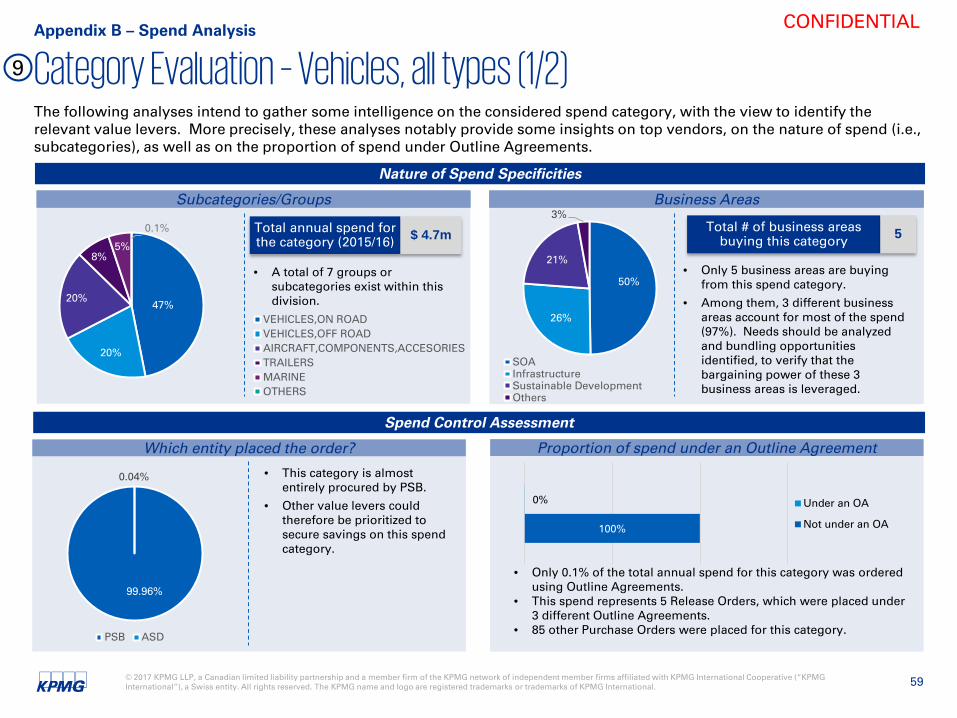
© 2017 KPMG LLP, a Canadian limited liability partnership and a member firm of the KPMG network of independent member firms affiliated with KPMG International Cooperative (“KPMG International”), a Swiss entity. All rights reserved. The KPMG name and logo are registered trademarks or trademarks of KPMG International. 59
CONFIDENTIAL
Category Evaluation – Vehicles, all types (1/2) Appendix B – Spend Analysis
The following analyses intend to gather some intelligence on the considered spend category, with the view to identify the relevant value levers. More precisely, these analyses notably provide some insights on top vendors, on the nature of spend (i.e., subcategories), as well as on the proportion of spend under Outline Agreements.
Proportion of spend under an Outline Agreement
Spend Control Assessment
Nature of Spend Specificities
• This category is almost entirely procured by PSB.
• Other value levers could therefore be prioritized to secure savings on this spend category.
99.96%
0.04%
PSB ASD
Subcategories/Groups Business AreasSubcategories/Groups Business Areas
• Which business areas are buying from this spend categories?
• Can we identify bundling opportunities?
Subcategories/Groups Business Areas
Total # of business areas buying this category 5Total annual spend for
the category (2015/16) $ 4.7m
• A total of 7 groups or subcategories exist within this division.
• Only 5 business areas are buying from this spend category.
• Among them, 3 different business areas account for most of the spend (97%). Needs should be analyzed and bundling opportunities identified, to verify that the bargaining power of these 3 business areas is leveraged.
47%
20%
20%
8%5%
0.1%
VEHICLES,ON ROADVEHICLES,OFF ROADAIRCRAFT,COMPONENTS,ACCESORIESTRAILERSMARINEOTHERS
50%
26%
21%
3%
SOAInfrastructureSustainable DevelopmentOthers
• Only 0.1% of the total annual spend for this category was ordered using Outline Agreements.
• This spend represents 5 Release Orders, which were placed under 3 different Outline Agreements.
• 85 other Purchase Orders were placed for this category.
100%
0% Under an OA
Not under an OA
9
Which entity placed the order?

© 2017 KPMG LLP, a Canadian limited liability partnership and a member firm of the KPMG network of independent member firms affiliated with KPMG International Cooperative (“KPMG International”), a Swiss entity. All rights reserved. The KPMG name and logo are registered trademarks or trademarks of KPMG International. 60
CONFIDENTIAL
Category Evaluation – Vehicles, all types (2/2) Appendix B – Spend Analysis
Rank Vendor Spend in $K (2015/16)
Spend in % (2015/16)
1 2103389 - #N/A $ 1 380 29%
2 2002077 - PRATT AND WHITNEY CANADA $ 879 19%
3 2011266 - KELLEHER FORD LINCOLN SALES LTD $ 389 8%
4 2006030 - FORT GARRY INDUSTRIES LTD $ 273 6%
5 2177455 - #N/A $ 161 3%
6 2267979 - #N/A $ 138 3%
7 2167686 - #N/A $ 138 3%
8 2022368 - SATURN INDUSTRIES LTD $ 131 3%
9 2002849 - WILLIAMS AUTO ELECTRIC (1992) LTD $ 105 2%
10 2153341 - #N/A $ 86 2%
11 All other vendors (41) $ 1 017 22%
Total – Top 10 Vendors only $ 3 679 78%
Total – All Vendors (51) $ 4 696 100%
Source: Derived from Manitoba 2015/16 spend data.
MediumTotal annual spend (2015/16)
Potential Savings$ 4.7m
Top 10 Vendors
Value Levers Discussed Relevance
Products & Services
• A thorough needs assessment appears as a prerequisite to fully understand this large spend category.
Supplier Agreements
• As the top 2 vendors respectively account for 29% (N/A) and 19% of the total spend, regular competitive tendering is required, as well as frequent negotiations, documented by a complete supplier performance follow-up.
• As 3 different business areas account for most of the spend (97%),bundling opportunities should be analyzed to verify that common needs have indeed been identified, which should have resulted in common contracts and, in turn, in a correct leverage of the bargaining power of Manitoba.
Supply Markets
• Based on this top 10 vendor table, the goods and services included in this category seem to belong to different supply markets (ex: engines from Pratt and Whitney or cars from Kelleher Ford Lincoln), which requires distinct market analyses and procurement strategies.
End-to-End Process
• Standard and streamlined procurement processes should be implemented to make sure that the top business areas are following the same guidelines, optimizing efficiency and reducing costs.
In- versus Outsourcing
• Not a priority value lever
Value Levers Analysis
9

© 2017 KPMG LLP, a Canadian limited liability partnership and a member firm of the KPMG network of independent member firms affiliated with KPMG International Cooperative (“KPMG International”), a Swiss entity. All rights reserved. The KPMG name and logo are registered trademarks or trademarks of KPMG International. 61
CONFIDENTIAL
Category Evaluation – Fuels and Lubricants (1/2) Appendix B – Spend Analysis
The following analyses intend to gather some intelligence on the considered spend category, with the view to identify the relevant value levers. More precisely, these analyses notably provide some insights on top vendors, on the nature of spend (i.e., subcategories), as well as on the proportion of spend under Outline Agreements.
Proportion of spend under an Outline Agreement
Spend Control Assessment
Nature of Spend Specificities
• As this top spend category is being mainly procured by PSB (84%), opportunities to further centralize the procurement of this category appear rather low but still exist.
• Other value levers should however be prioritized to secure savings on this spend category.
84%
16%
PSB ASD
Subcategories/Groups Business AreasSubcategories/Groups Business Areas
• Which business areas are buying from this spend categories?
• Can we identify bundling opportunities?
Subcategories/Groups Business Areas
Total # of business areas buying this category 3Total annual spend for
the category (2015/16) $ 1.2m
• Only 2 groups or subcategories exist within this division, among which the group Fuel accounts for almost all of the spend.
• 3 business areas are requesting this category, among which the spend is relatively evenly distributed.
• Needs should be assessed and bundling opportunities should be analyzed to verify that the bargaining power of these 3 business areas is correctly leveraged for this category.
99.81%
0.19%
FUEL FLUIDS,LUBRICANTS
52%35%
13%
Sustainable DevelopmentInfrastructureCentral Services
• Only 2% of the total annual spend for this category was ordered using Outline Agreements.
• This spend represents 609 Release Orders, which were placed under 12 different Outline Agreements.
• 119 other Purchase Orders were placed for this category.
18%
82% Under an OA
Not under an OA
10
Which entity placed the order?

© 2017 KPMG LLP, a Canadian limited liability partnership and a member firm of the KPMG network of independent member firms affiliated with KPMG International Cooperative (“KPMG International”), a Swiss entity. All rights reserved. The KPMG name and logo are registered trademarks or trademarks of KPMG International. 62
CONFIDENTIAL
Category Evaluation – Fuels and Lubricants (2/2) Appendix B – Spend Analysis
Rank Vendor Spend in $K (2015/16)
Spend in % (2015/16)
1 2263481 - #N/A $ 561 49%
2 2154174 - IMPERIAL OIL $ 242 21%
3 2000556 - STITTCO ENERGY LTD $ 129 11%
4 2000315 - FEDERATED CO- OP LTD $ 126 11%
5 2265761 - #N/A $ 43 4%
6 2269025 - #N/A $ 24 2%
7 2026365 - TOWN OF THE PAS $ 13 1%
8 2032422 - #N/A $ 4 0.3%
9 2036518 - #N/A $ 4 0.3%
10 2189399 - #N/A $ 3 0.2%
11 All other vendors (16) $ 5 0.4%
Total – Top 10 Vendors only $ 1 148 99.6%
Total – All Vendors (26) $ 1 153 100%
Source: Derived from Manitoba 2015/16 spend data.
LowTotal annual spend (2015/16)
Potential Savings$ 1.2m
Top 10 Vendors
Potential Value Levers Relevance
Products & Services
• Not a priority value lever
Supplier Agreements
• As the top 2 vendors respectively account for 48% and 21% of the total spend, regular competitive tendering is required, as well as frequent negotiations, documented by a complete supplier performance follow-up.
• As 3 different business areas account for all of the spend, bundling opportunities should be analyzed to verify that common needs have indeed been identified, which resulted in common contracts and, in turn, in a correct leverage of the bargaining power of Manitoba.
Supply Markets
• Not a priority value lever
End-to-End Process
• An improved use of purchasing cards might be relevant to maintain visibility and control over the total spend of the category.
In- versus Outsourcing
• Not a priority value lever
Value Levers Analysis
10

© 2017 KPMG LLP, a Canadian limited liability partnership and a member firm of the KPMG network of independent member firms affiliated with KPMG International Cooperative (“KPMG International”), a Swiss entity. All rights reserved. The KPMG name and logo are registered trademarks or trademarks of KPMG International. 63
CONFIDENTIAL
Category Evaluation – Machinery (1/2) Appendix B – Spend Analysis
The following analyses intend to gather some intelligence on the considered spend category, with the view to identify the relevant value levers. More precisely, these analyses notably provide some insights on top vendors, on the nature of spend (i.e., subcategories), as well as on the proportion of spend under Outline Agreements.
Proportion of spend under an Outline Agreement
Spend Control Assessment
Nature of Spend Specificities
• This category is almost entirely procured by PSB.
• Other value levers could therefore be prioritized to secure savings on this spend category.
99.7%
0.3%
PSB ASD
Subcategories/Groups Business AreasSubcategories/Groups Business Areas
• Which business areas are buying from this spend categories?
• Can we identify bundling opportunities?
Subcategories/Groups Business Areas
Total # of business areas buying this category 4Total annual spend for
the category (2015/16) $ 3.8m
90.34%
5.69% 3.92% 0.05%
CONSTRUCTION FORESTRY,PARK,NURSERYAGRICULTURAL OTHERS
• A total of 5 groups or subcategories exist within this division.
• However, the group Construction represents the largest part of the spend.
72%
28%
SOA Sustainable Development
• 4 business areas are buying from this spend category. However, two of them (Infrastructure and Central Services) represent less than 1% of the spend.
• Bundling opportunities should be analyzed to identify potential commonalities between the 2 top business areas.
• Only 0.2% of the total annual spend for this category was ordered using Outline Agreements.
• This spend represents 22 Release Orders, which were placed under 2 different Outline Agreements.
• 225 other Purchase Orders were placed for this category.
100%
0% Under an OA
Not under an OA
11
Which entity placed the order?

© 2017 KPMG LLP, a Canadian limited liability partnership and a member firm of the KPMG network of independent member firms affiliated with KPMG International Cooperative (“KPMG International”), a Swiss entity. All rights reserved. The KPMG name and logo are registered trademarks or trademarks of KPMG International. 64
CONFIDENTIAL
Category Evaluation – Machinery (2/2) Appendix B – Spend Analysis
Rank Vendor Spend in $K (2015/16)
Spend in % (2015/16)
1 2012995 - LEO'S SALES & SERVICE LTD $ 965 25%
2 2009028 - HITRAC (1974) $ 427 11%
3 2093139 - BOBCAT OF CENTRAL MANITOBA LTD $ 383 10%
4 2006030 - FORT GARRY INDUSTRIES LTD $ 292 8%
5 2153341 - #N/A $ 276 7%
6 2000469 - VALLEY BLADES $ 250 7%
7 2138866 - NORDIK BLADES $ 234 6%
8 2110844 - #N/A $ 159 4%
9 2152315 - #N/A $ 159 4%
10 2011416 - KEYSTONE AGRI- MOTIVE (2005) $ 149 4%
11 All other vendors (25) $ 489 13%
Total – Top 10 Vendors only $ 3 295 87%
Total – All Vendors (35) $ 3 785 100%
Source: Derived from Manitoba 2015/16 spend data.
LowTotal annual spend (2015/16)
Potential Savings$ 3.8m
Top 10 Vendors
Potential Value Levers Relevance
Products & Services
• As the main subcategory is Construction, accounting for 90% of the spend, a thorough needs analysis should help to determine whether or not this type of category could be bundled with the corresponding construction services.
Supplier Agreements
• A complete visibility over the spend of this category provides Manitoba with an increased bargaining power.
• Bundling opportunities should also be analyzed to identify potential commonalities between the 2 top business areas : SOA and sustainable development.
Supply Markets
• A precise knowledge of the supply market is required, to determine which procurement options should be preferred, for instance between rental and acquisition.
End-to-End Process
• As 2 business areas are requesting this type of purchase, opportunities to standardize procurement processes to optimize efficiency should be considered.
In- versus Outsourcing
• Not a priority value lever
Value Levers Analysis
11
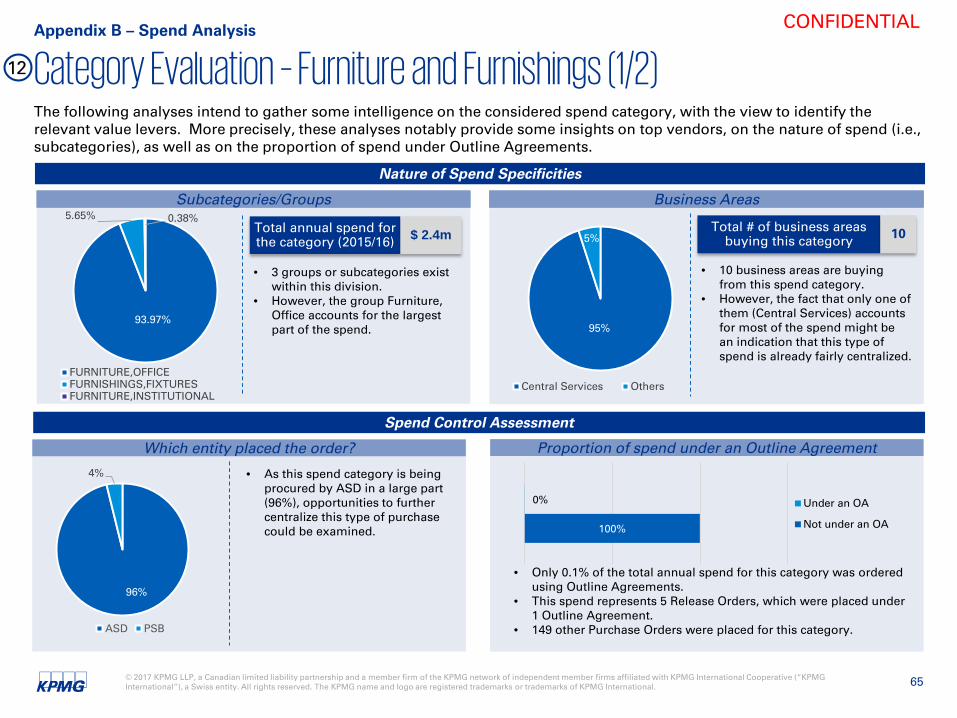
© 2017 KPMG LLP, a Canadian limited liability partnership and a member firm of the KPMG network of independent member firms affiliated with KPMG International Cooperative (“KPMG International”), a Swiss entity. All rights reserved. The KPMG name and logo are registered trademarks or trademarks of KPMG International. 65
CONFIDENTIAL
Category Evaluation – Furniture and Furnishings (1/2) Appendix B – Spend Analysis
The following analyses intend to gather some intelligence on the considered spend category, with the view to identify the relevant value levers. More precisely, these analyses notably provide some insights on top vendors, on the nature of spend (i.e., subcategories), as well as on the proportion of spend under Outline Agreements.
Proportion of spend under an Outline Agreement
Spend Control Assessment
Nature of Spend Specificities
96%
4%
ASD PSB
Subcategories/Groups Business AreasSubcategories/Groups Business Areas
• Which business areas are buying from this spend categories?
• Can we identify bundling opportunities?
Subcategories/Groups Business Areas
Total # of business areas buying this category 10Total annual spend for
the category (2015/16) $ 2.4m
93.97%
5.65% 0.38%
FURNITURE,OFFICEFURNISHINGS,FIXTURESFURNITURE,INSTITUTIONAL
• 3 groups or subcategories exist within this division.
• However, the group Furniture, Office accounts for the largest part of the spend. 95%
5%
Central Services Others
• 10 business areas are buying from this spend category.
• However, the fact that only one of them (Central Services) accounts for most of the spend might be an indication that this type of spend is already fairly centralized.
• As this spend category is being procured by ASD in a large part (96%), opportunities to further centralize this type of purchase could be examined.
• Only 0.1% of the total annual spend for this category was ordered using Outline Agreements.
• This spend represents 5 Release Orders, which were placed under 1 Outline Agreement.
• 149 other Purchase Orders were placed for this category.
100%
0% Under an OA
Not under an OA
12
Which entity placed the order?

© 2017 KPMG LLP, a Canadian limited liability partnership and a member firm of the KPMG network of independent member firms affiliated with KPMG International Cooperative (“KPMG International”), a Swiss entity. All rights reserved. The KPMG name and logo are registered trademarks or trademarks of KPMG International. 66
CONFIDENTIAL
Category Evaluation – Furniture and Furnishings (2/2) Appendix B – Spend Analysis
Rank Vendor Spend in $K (2015/16)
Spend in % (2015/16)
1 2005665 - FIRST AVENUE OFFICE FURNISHINGS LTD $ 2 176 90%
2 2034982 - MATERIALS DISTRIBUTION AGENCY $ 68 3%
3 2116693 - CONTEMPORARY OFFICE INTERIORS LTD $ 29 1%
4 2149836 - #N/A $ 25 1%
5 2049522 - ANTHONY ALLAN WORK ENVIRONMENTS $ 22 1%
6 2033655 - CUNNINGHAM BUSINESS INTERIORS LTD $ 20 1%
7 2032973 - ALMONT INDUSTRIAL MATERIALS LTD $ 15 1%
8 2027084 - V B G DISTRIBUTORS LTD $ 11 0.5%
9 2005139 - EUROCRAFT OFFICE FURNISHINGS $ 11 0.4%
10 2014639 - MARCEL'S DRAPERY AND BLINDS $ 10 0.4%
11 All other vendors (16) $ 32 1.3%
Total – Top 10 Vendors only $ 2 388 98.7%
Total – All Vendors (26) $ 2 420 100%
Source: Derived from Manitoba 2015/16 spend data.
MediumTotal annual spend (2015/16)
Potential Savings$ 2.4m
Top 10 Vendors
Potential Value Levers Relevance
Products & Services
• Not a priority value lever
Supplier Agreements
• The opportunity to negotiate an Outline Agreement with the top vendor, accounting for almost 90% of the spend, should be explored. Only 0.1% of the total annual spend for this category are indeed currently ordered using Outline Agreements. Outline Agreements represent the opportunity to better anticipate on the spend and, in turn, better control it.
Supply Markets
• Not a priority value lever
End-to-End Process
• Catalogs of negotiated items could be leveraged to secure additional savings.
In- versus Outsourcing
• Not a priority value lever
Value Levers Analysis
12
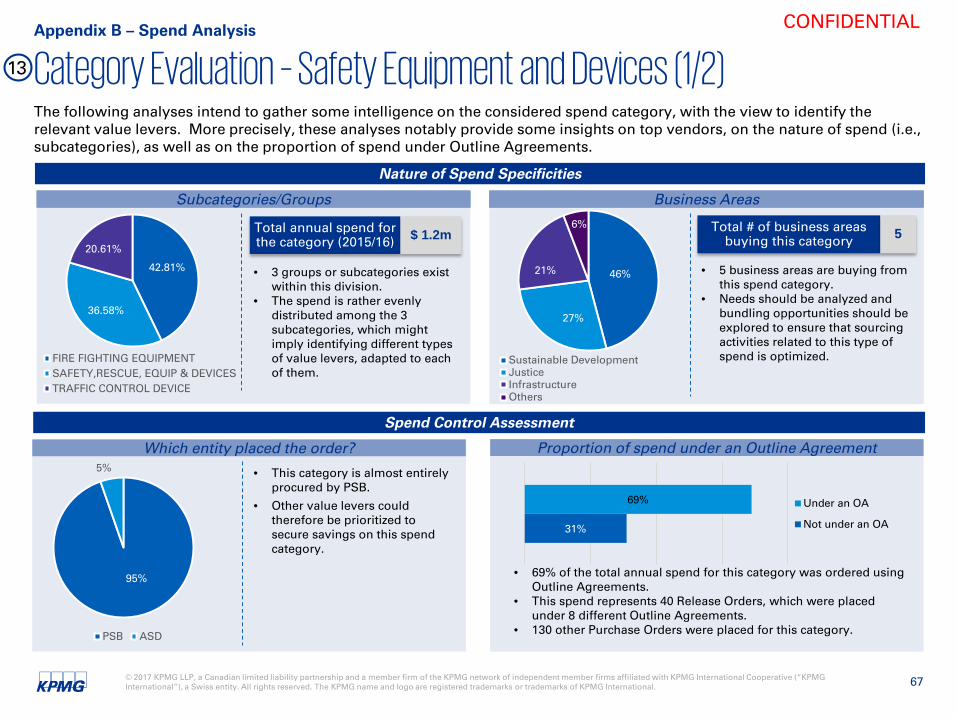
© 2017 KPMG LLP, a Canadian limited liability partnership and a member firm of the KPMG network of independent member firms affiliated with KPMG International Cooperative (“KPMG International”), a Swiss entity. All rights reserved. The KPMG name and logo are registered trademarks or trademarks of KPMG International. 67
CONFIDENTIAL
Category Evaluation – Safety Equipment and Devices (1/2) Appendix B – Spend Analysis
The following analyses intend to gather some intelligence on the considered spend category, with the view to identify the relevant value levers. More precisely, these analyses notably provide some insights on top vendors, on the nature of spend (i.e., subcategories), as well as on the proportion of spend under Outline Agreements.
Proportion of spend under an Outline Agreement
Spend Control Assessment
Nature of Spend Specificities
95%
5%
PSB ASD
Subcategories/Groups Business AreasSubcategories/Groups Business Areas
• Which business areas are buying from this spend categories?
• Can we identify bundling opportunities?
Subcategories/Groups Business Areas
Total # of business areas buying this category 5Total annual spend for
the category (2015/16) $ 1.2m
42.81%
36.58%
20.61%
FIRE FIGHTING EQUIPMENTSAFETY,RESCUE, EQUIP & DEVICESTRAFFIC CONTROL DEVICE
• 3 groups or subcategories exist within this division.
• The spend is rather evenly distributed among the 3 subcategories, which mightimply identifying different types of value levers, adapted to each of them.
46%
27%
21%
6%
Sustainable DevelopmentJusticeInfrastructureOthers
• 5 business areas are buying from this spend category.
• Needs should be analyzed and bundling opportunities should be explored to ensure that sourcing activities related to this type of spend is optimized.
• This category is almost entirely procured by PSB.
• Other value levers could therefore be prioritized to secure savings on this spend category.
• 69% of the total annual spend for this category was ordered using Outline Agreements.
• This spend represents 40 Release Orders, which were placed under 8 different Outline Agreements.
• 130 other Purchase Orders were placed for this category.
31%
69% Under an OA
Not under an OA
13
Which entity placed the order?

© 2017 KPMG LLP, a Canadian limited liability partnership and a member firm of the KPMG network of independent member firms affiliated with KPMG International Cooperative (“KPMG International”), a Swiss entity. All rights reserved. The KPMG name and logo are registered trademarks or trademarks of KPMG International. 68
CONFIDENTIAL
Category Evaluation – Safety Equipment and Devices (2/2) Appendix B – Spend Analysis
Rank Vendor Spend in $K (2015/16)
Spend in % (2015/16)
1 2165337 - #N/A $ 518 42%
2 2079411 - #N/A $ 138 11%
3 2259926 - #N/A $ 138 11%
4 2006064 - #N/A $ 132 11%
5 2217994 - #N/A $ 49 4%
6 2002223 - ATS TRAFFIC- MANITOBA LTD $ 47 4%
7 2266013 - #N/A $ 34 3%
8 2030473 - AIRMASTER SALES LTD $ 34 3%
9 2005911 - FONTAINE ELECTRIC LTD $ 30 2%
10 2167076 - #N/A $ 20 2%
11 All other vendors (30) $ 82 7%
Total – Top 10 Vendors only $ 1 140 93%
Total – All Vendors (40) $ 1 222 100%
Source: Derived from Manitoba 2015/16 spend data.
MediumTotal annual spend (2015/16)
Potential Savings$ 1.2m
Top 10 Vendors
Potential Value Levers Relevance
Products & Services
• Not a priority value lever
Supplier Agreements
• As the top vendor accounts for 42% of the total spend, regular competitive tendering is required, as well as frequent negotiations, documented by a complete supplier performance follow-up.
Supply Markets
• Further refining the knowledge of the market offering for these services, which are highly specialized, is required to improve the organization’s bargaining power towards vendors.
End-to-End Process
• 5 business areas are requesting this type of equipment and devices. Opportunities to standardize procurement processes to optimize efficiency should be considered.
In- versus Outsourcing
• Not a priority value lever
Value Levers Analysis
13

© 2017 KPMG LLP, a Canadian limited liability partnership and a member firm of the KPMG network of independent member firms affiliated with KPMG International Cooperative (“KPMG International”), a Swiss entity. All rights reserved. The KPMG name and logo are registered trademarks or trademarks of KPMG International.
The information contained herein is of a general nature and is not intended to address the circumstances of any particular individual or entity. Although we endeavour to provide accurate and timely information, there can be no guarantee that such information is accurate as of the date it is received or that it will continue to be accurate in the future. No one should act on such information without appropriate professional advice after a thorough examination of the particular situation.
kpmg.ca
CONFIDENTIAL
Detail
Heading
Detail
Heading
Detail
Heading
Detail
Heading