Embed Size (px)
Citation preview

MANHATTANCORE
PublicParkingSurvey
NYC Department of City PlanningTransportation Division
August 2011

1
CONTENTS
INTRODUCTION TO POLICY AND SURVEY ....................................................................................... 3
INTRODUCTION AND PARKING POLICY BACKGROUND .................................................................. 6
Clean Air Legislation .................................................................................................................... 6
1982 Zoning Text Amendment .................................................................................................... 6
Effects of the 1982 Parking Policies in the Manhattan Core ...................................................... 8
Traffic and Parking Supply ....................................................................................................... 8
Employment ............................................................................................................................ 8
Air Quality ................................................................................................................................ 9
Parking Cost ............................................................................................................................. 9
Studies Related to the 1982 Policy............................................................................................ 12
MANHATTAN CORE DEMOGRAPHIC TRENDS SINCE 1980 ........................................................... 13
Vehicle Availability .................................................................................................................... 13
Income ....................................................................................................................................... 14
Families ...................................................................................................................................... 17
Journey to Work ........................................................................................................................ 17
2009 MANHATTAN CORE PUBLIC PARKING SURVEY FINDINGS ................................................... 19
Work and Business-Related Users ............................................................................................ 21
Entertainment and Shopping Users .......................................................................................... 22
Residential monthly parkers ........................................................ Error! Bookmark not defined.
Other Users ............................................................................................................................... 24
MANHATTAN CORE: FINDINGS AND PROPOSED PARKING POLICY GOALS ................................. 25
TECHNICAL APPENDIX FOR THE 2009 MANHATTAN CORE PARKING SURVEY ............................. 26
Outreach to Facility Operators .................................................................................................. 26
Determining the CD Subareas ................................................................................................... 26
Determining Number of Surveys to Administer........................................................................ 26
Selecting Facilities to Survey ..................................................................................................... 27
Surveying Facilities .................................................................................................................... 27
Survey Limitations ..................................................................................................................... 28

2
Data Analysis ............................................................................................................................. 29
Questionnaire ............................................................................................................................ 30
FREQUENCIES ................................................................................................................................ 32
General Trends for Manhattan Core CDs 1-8............................................................................ 32
User Group Survey Results ........................................................................................................ 44
ACKNOWLEDGEMENTS…………………………………………………………………………………………………………….58

3
INTRODUCTION TO POLICY AND SURVEY
The New York City Department of City Planning is revising and clarifying the Zoning Resolution
as it pertains to parking regulations in the Manhattan Core (defined as Community Districts 1-
8). Off-Street parking requirements and regulations in the Manhattan Core are a balancing act
between two competing goals. The first goal is to provide adequate parking for vehicles
traveling to the attractions, services and businesses in the area and for residential car storage.
The second goal is to limit the number of public parking spaces in order to reduce traffic
congestion in the Manhattan Core by increasing the share of non-vehicle modes of travel.
The new parking policy aims to accomplish these two competing goals by preserving the
competitive market for parking, discouraging the use of vehicles for commuting; providing
vehicle storage for residents; and supporting economic growth in the Central Business District
(defined as Community Districts 1-6).
Since 1982, NYC has tried to discourage driving into the Manhattan Core by implementing
special zoning rules that limit the construction of new public parking facilities within the
Manhattan Core. The provisions included 1) a shift from minimum accessory parking
requirements to maximum accessory parking allowances (not requirements), and 2) a Special
Permit requirement for new public parking facilities. Accessory parking is a specified number of
parking spaces related to a building which is the principal user. The parking spaces are typically
located on the same zoning lot unless district regulations specify that off-site accessory parking
facilities are permitted. Public parking is a lot, building or part of a building that is used on a
daily basis for public parking. A public parking garage may sometimes include accessory parking
spaces for other uses on the same zoning lot.
While some new public parking facilities have been built as part of new developments since
1982, the overall parking supply has decreased from 127,000 public parking spaces below 60th
Street (CDs 1-6) in 1978 to 102,025 spaces in 2010. At the same time, demand for public
parking remains strong as more existing lots and garages are redeveloped for land uses that
generate parking demand. Despite a significant decline in the number of public parking spaces
in the Manhattan Core, the New York City Department of City Planning has determined that the
1982 off-street parking policies need to be evaluated and updated.
The purpose of the Manhattan Core Public Parking Survey was to collect and analyze data about
users of off-street public parking in the Manhattan Core, to understand user characteristics and
to determine the flexibility of car usage among user groups.

4
Between March and May 2009, DCP staff collected 2,871 intercept surveys from 110 public
parking facilities managed by several operators who agreed to participate in the study. The
number of parking spaces in the surveyed facilities represented approximately 15 percent of
the 145,660 public parking spaces in the Manhattan Core licensed by the New York City
Department of Consumer Affairs (DCA). In order to better understand public parking usage
patterns affected by geography and land use, surveyed facilities were distributed across six CD-
based study areas: CD1, CDs 2&3, CD4, CD5, CD6, and CDs 7&8.
While the survey captured many different types of users of public parking facilities, the majority
(67 percent) had a trip purpose that was work or business-related. Respondents included
commuters, people conducting business, Manhattan residents, medical patients, and those
visiting for leisure. It was observed that respondents from outside of Manhattan were widely
dispersed geographically with regard to their home ZIP codes, with no single ZIP code in the
New York metropolitan area having more than 25 respondents.
The survey included questions about trip purpose,
home ZIP code, reasons for not taking mass transit,
frequency of auto trips to Manhattan, and
occupation. Results were weighted to more
accurately compare the six CD subareas and the
three larger CD geographic zones: Uptown,
Midtown, and Downtown (see graphic at right).
Evening trips and residential monthly parkers
(respondents who lived in Manhattan, stored their
vehicle, and paid for parking on a monthly basis)
were analyzed separately.
In addition to the survey of public parking users,
DCP also collected operator-provided data about
the parking facilities. This data included the
percentage of residential monthly parkers and the
approximate facility occupancy at the time of the
survey shift. Since workers comprised the vast
majority of survey respondents, DCP staff also analyzed census and transit data for further
information on the characteristics of these commuters.
The major findings of this report focus on four important groups of users: commuters and
business-related users; entertainment and shopping users; residential monthly parkers; and all
other users.

5
This report consists of the following sections:
Policy Background
Manhattan Core Demographic Trends Since 1980
2009 Manhattan Core Public Parking Survey Findings
Manhattan Core Findings and Proposed Parking Policy Goals

6
INTRODUCTION AND PARKING POLICY BACKGROUND
Current parking policy in the Manhattan Core is dictated by zoning text amendments from 1982
that restrict the development of new parking in Community Districts 1 through 8. Below is a
description of the background and content of the 1982 policy; effects of the policy; and studies
related to the policy.
Clean Air Legislation
In response to growing concern over air pollution and the effects of emissions from motor
vehicles, Congress adopted the Clean Air Act (CAA) in 1970. The legislation required all states
to draft a federally-enforceable State Implementation Plan (SIP), which indicates how the state
will achieve National Ambient Air Quality Standards (NAAQS). In response, the City adopted a
Transportation Control Plan (TCP) in 1973, which included the goal of reducing off-street
parking in the CBD by 40 percent. The goals of the TCP shaped zoning-based parking
regulations for Community Districts 1 through 8, which cover the area from the Battery north to
East 96th Street and West 110th Street -- Manhattan’s densest residential areas, along with the
Midtown and Downtown business districts.
1982 Zoning Text Amendment
In 1982 DCP adopted an amendment to the Zoning Resolution that aimed to reduce parking in
the Manhattan CBD in order to improve air quality. It was widely believed that a scarcity of
parking would reduce driving in Manhattan and encourage the use of mass transit. Goals of the
1982 policy included:
A reduction in the supply of parking spaces in the CBD
A reduction in the number of motor vehicles entering the CBD
Improved air quality within the CBD
Prior to 1982, the zoning resolution encouraged off-street parking in the Manhattan CBD by
requiring a significant amount of accessory parking for new residential development. This often
became public parking, permitting substantial amounts of accessory parking for commercial
and community facility development, and allowing public parking lots with a capacity of 150
spaces as-of-right in most commercial and manufacturing districts. In addition, accessory
parking could be provided as-of-right for conversions and existing uses, and was available for
use by non-residents of residential developments. Required parking could be located off-site
and unenclosed, and curb cuts on wide streets were allowed for required parking.
The most fundamental changes made with the establishment of the Manhattan CBD parking
regulations were the elimination of parking requirements for residential use and the
establishment of maximum accessory parking limits; a reduction in the amount of parking that
could be provided for commercial and community facility uses; and the prohibition of as-of-
7
right public parking lots in certain areas. Furthermore, accessory parking regulations were
changed to require that parking be located on the same zoning lot to which it is accessory, and
restricted to only those occupants of particular developments. There was also a Special Permit
created for new public parking facilities. The garages may be stand-alone, or constructed as
part of a development but used for public parking. Nowhere in the regulations are public
garages expressly forbidden, although the regulations state that public parking facilities of up to
150 spaces are generally allowed as-of-right in C2, C4, C6, C8, M1, M2, and M3 districts.1
1 New York City Zoning Resolution, Section 13-20

8
Effects of the 1982 Parking Policies in the Manhattan Core
Traffic and Parking Supply
The 1982 parking policy has been successful in reducing the number of off-street parking spaces
in Manhattan. Below 60th Street, the number of parking spaces decreased from 127,000 to
102,025 between 1978 and 2010.2 However, the reduced number of parking spaces has not
resulted in a reduction of Hub-bound vehicles. (The Hub encompasses Manhattan below 60th
Street.) In 2008, the number of vehicles entering the Hub stood at 751,000, an increase of
102,000 from the 649,000 that entered in 1978.3
Employment
Factors other than parking supply, such as income and employment, have a stronger correlation
to the number of vehicles entering the Hub. The supply of high-paying jobs, particularly those
within the finance, insurance, and real estate (FIRE) and service sectors combined, seem to
have a much stronger correlation with driving trends than parking cost or availability. As
2 New York City Department of Consumer Affairs and Department of Environmental Protection.
3 NYMTC Hub Bound Vehicle Reports. www.nymtc.org.
12
7,0
00
11
2,6
27
10
4,1
34
10
9,6
97
10
4,1
73
10
5,0
00
10
2,0
25
0
100,000
200,000
300,000
400,000
500,000
600,000
700,000
800,000
900,000
19
78
19
79
19
80
19
81
19
82
19
83
19
84
19
85
19
86
19
87
19
88
19
89
19
90
19
91
19
92
19
93
19
94
19
95
19
96
19
97
19
98
19
99
20
00
20
01
20
02
20
03
20
04
20
05
20
06
20
07
20
08
20
09
20
10
Hu
b-B
ou
nd
En
tran
ces
and
DC
A S
pac
es
HUB-BOUND TRAFFIC AND DCA SPACES: 1978-2010
Hub-Bound Vehicles (Inbound) DCA Spaces
Note: All data for MN below 60th St. through traffic accounts for 20%-40% of all traffic in the CBD. Source: NYMTC, DCA.

9
employment in these sectors has increased or decreased, the number of cars entering the CBD
has followed a similar pattern.
Sources: Bureau of Economic Analysis, US Department of Commerce and NYMTC Hub Bound Vehicle Reports
While the number of vehicles entering CDs 1-6 has increased from 1978 to 1999, when the
number of Hub-bound vehicles reached a peak of 844,000, the number of vehicles entering the
Hub has been decreasing since then. Transit improvements such as the introduction of the
MetroCard and free transfers between buses and the subway may have provided commuters
with a better alternative to driving.
Air Quality
Although the number of vehicles entering the CBD has increased since the current parking
regulations were adopted in 1982, according to the State Department of Environmental
Conservation (DEC), most of the air quality objectives of the Clean Air Act have been achieved.
The annual average CO level has been decreasing since 1985 in the CBD and other locations,
according to the New York State Air Quality Report Ambient Air Monitoring System for 1999.
Factors contributing to a decrease in CO may include the implementation of EZ Pass and
improved technology in the auto industry, such as the use of catalytic converters, the removal
of lead from gasoline, and improved fuel efficiency.
Parking Cost
One significant effect of the decrease in public parking spaces is that the cost of parking in
Manhattan has become very high. Colliers International’s 2009 Global Parking Rate Survey
determined that the New York monthly unreserved parking rate and daily parking rate are the
-200,000 400,000 600,000 800,000
1,000,000 1,200,000 1,400,000 1,600,000 1,800,000
EMPLOYMENT IN FIRE AND SERVICE SECTORS AND HUB-BOUND VEHICLES
Total Hub Bound Vehicles Total Employment in FIRE and Service Sectors

10
highest in the nation.4 Parking facilities in Midtown Manhattan charged approximately $550
per month ($500 downtown) and $44 per day ($38 downtown). The high parking rates in the
CBD are a result of the diminishing supply of spaces as well as continued demand. While the
high cost and decreased supply of parking has not resulted in a reduced number of vehicles
entering the CBD, this is not to say that the high cost of parking has not influenced people’s
choice of travel mode. Manhattan-bound travel has the highest transit mode share in the
nation at 73 percent, according to the 2008 American Community Survey (ACS).
4 Colliers International Parking Rates: CBD Parking Rate Survey, 2009.
http://www.colliers.com/Content/Repositories/Base/Corporate/English/Market_Report_Corporate/PDFs/colliersparkingratesurvey2009.pdf

11
COLLIERS MONTHLY UNRESERVED PARKING RATE
Source: Colliers International Global Parking Rate Survey 2009
550
500
402.5
350
325
314
290
215
215
212.33
205
192.5
187
185
180
175
175
172.5
170
160
152.43
140
134.12
133
127.5
125
117.5
110
110
107.25
105
105
96
95
94.54
90
90
90
85
80
69.75
68.9
65
65
65
60
59.12
57.5
57
53
45
40
10.38
0 100 200 300 400 500 600
New York, NY Midtown
New York, NY Downtown
Boston, MA
San Francisco, CA
Chicago, IL
Philadelphia, PA
Seattle, WA
Sacramento, CA
Washington, DC
Honolulu, HI
Los Angeles, CA
Oakland, CA
Minn/St. Paul, MN
Portland, OR
San Diego, CA
Denver
Hartford, CT
Cleveland, OH
Bellevue, WA
Baltimore, MD
National Average
Houston, TX
Miami, FL
Tampa, FL
Cincinnati, OH
Nashville, TN
San Jose/Sil. Valley, CA
Columbus, OH
Milwaukee, WI
Charleston, SC
Indianapolis
St. Louis, MO
Louisville, KY
Raleigh, NC
Jacksonville
Atlanta, GA
Dallas, TX
Kansas, MO
Orlando, FL
Boise, ID
Greenville, SC
West Palm Beach, FL
Columbia, SC
Las Vegas, NV
Phoenix, AZ
Fresno
Little Rock, AR
Walnut Creek, CA
Memphis, TN
Ft. Lauderdale, FL
Reno, NV
Bakersfield, CA
Charlotte, NC

12
Studies Related to the 1982 Policy
Off-street parking policies in New York City have been studied for several decades by DCP and
other agencies. In 1981 the NYC Department of Environmental Protection (DEP) published the
Parking Management Study. The study surveyed 500 off-street parking facilities below 60th
Street to examine the preferences and inclinations of those parking in Manhattan. The purpose
of the study was to help policy-makers determine how parking policy may be used to reduce
traffic volumes and improve air quality in Manhattan.
In 1995, under the guidance of DCP’s Transportation Division, a survey of public and on-street
parking users in Manhattan Community Districts 1 through 8 was conducted by Hayden-
Wegman Consulting Engineers. The sites surveyed for the study included both on-street and
off-street parking spaces throughout the city. The purpose for this study was to examine the
attitudes of drivers and determine the relationship between parking patterns and land use.
These findings, compiled in a report called Parking Facilities Users’ Survey and Parking Needs
Survey in Community Districts 1 through 8, were intended to help the city predict parking needs
for new developments based on the results for similarly zoned areas in the study.
In 2009 DCP’s Transportation Division conducted the Manhattan Core Parking Survey, and
questioned users of off-street public parking facilities in the Manhattan Core (defined as
Community Districts 1 through 8). The purpose of the Manhattan Core Public Parking Survey
was to collect and analyze data about users of off-street public parking in the Manhattan Core,
and to inform public parking policy considerations. The findings of this survey are published in
this report.

13
MANHATTAN CORE DEMOGRAPHIC TRENDS SINCE 1980
Vehicle Availability
Since 1980, vehicle availability has increased for Manhattan Core residents (CDs 1-8), which
correlates with increased income and family size. This increase in residential auto ownership
has also increased parking demand within the Core. Census data indicates that between 1980
and 2008 vehicle availability has increased by approximately 68 percent in CDs 1-8 while
population has increased 61 percent.
Part of the increase in the share of spaces leased to residential monthly parkers can thus be
attributed to demographic and socioeconomic changes among residences of the Manhattan
Core. The population of the Manhattan Core increased between 1980 and 2000 by more than
66,000 people, from 918,071 to 984,367 with additional increases between 2000 and 2008. In
all, Manhattan vehicle registrations rose from 161,491 in 1982 to a peak of 229,715 in 2001.
Since 2003, vehicles registered in Manhattan have varied in a narrow band, and was 220,822 in
2009.
68%
32%
MANHATTAN VEHICLE AVAILABILITY INCREASE 1980 TO 2008
MN Core (vehicle increase = 26,059)
MN Non-Core (vehicle increase = 12,258)
61%
39%
MANHATTAN POPULATION INCREASE 1980 TO 2008
MN Core study area (Increase in population = 120,243)
Manhattan Non-Core (Increase in population = 75,697)

14
Income
The increase of vehicle availability, particularly in the Manhattan Core, may be attributed to
increased income. The Average Median Income increased 80 percent within the Core from
1980 to 2000, while a decrease of 5.5 percent was experienced in Manhattan CDs 9 through 12
during the same time period.
It was found that auto ownership increases with average income throughout the city. This
pattern holds true within the Manhattan Core. While 24 percent of Manhattan households
reported having access to an automobile in 2000, high-income households had a much higher
rate of access to automobiles. The 2008 American Community Survey found that 7 percent of
Manhattan Core households at incomes less than $20,000 had cars; 12 percent of Manhattan
Core households at incomes from $20,000 and $64,999 had cars; 22 percent of Manhattan Core
households with incomes between $65,000 and $124,999; and 35 percent of Manhattan Core
households with incomes over $130,000 had automobiles.
0
50,000
100,000
150,000
200,000
250,000
19
78
19
79
19
80
19
81
19
82
19
83
19
84
19
85
19
86
19
87
19
88
19
89
19
90
19
91
19
92
19
93
19
94
19
95
19
96
19
97
19
98
19
99
20
00
20
01
20
02
20
03
20
04
20
05
20
06
20
07
20
08
20
09
MANHATTAN VEHICLE REGISTRATIONS

15
Furthermore, the ACS data indicate that the Manhattan Core has a large percentage of high
income households, which have a high rate of auto ownership. The largest share of households
in the Manhattan Core (35 percent) earned $130,000 or more and the smallest share (15
percent) earned less than $20,000.
When households that do and do not own a vehicle are grouped by income it is evident that a
larger share of non-Core households in each income range owns a vehicle. The Core has a
smaller share of vehicle owners in each income range.
93%(71,933)
86%(108,625)
78%(106,687) 64%
(119,579)
7%(5,621)
14% (18,282) 22%
(30,492) 36%(66,982)
0%10%20%30%40%50%60%70%80%90%
100%
Less than $20,000
$20,000 -$64,999
$65,000 -$129,999
$130,000 +
MANHATTAN CORE: PERCENT OF HOUSEHOLDS WITH VEHICLES BY HOUSEHOLD INCOME, 2008*
Households with no vehicles Households with vehicles
15%
24%
26%
35%
INCOME DISTRIBUTION OF HOUSEHOLDS IN MANHATTAN CORE
(2008) n=528,201
Less than $20,000 (n=77,554)
$20,000 to 64,999 (n=126,907)
$65,000 to 129,999 (n=137,179)
130,000+ (n=186,561)

16
66,98230,492
18,2825,621
212,492454,517
479,851
120,164
119,579106,687
108,62571,933
45,035173,201
532,821
486,679
0%
10%
20%
30%
40%
50%
60%
70%
80%
90%
100%
$1
30
,00
0 o
r m
ore
$6
5,0
00
to
12
9,9
99
$2
0,0
00
to
64
,99
9
Less
th
an $
20
,00
0
$1
30
,00
0 o
r m
ore
$6
5,0
00
to
12
9,9
99
$2
0,0
00
to
64
,99
9
Less
th
an $
20
,00
0
Manhattan Core City-wide Excluding Core
NUMBER OF HOUSEHOLD VEHICLES BY INCOME (2008)
One or more Zero

17
Families
In addition, family households with children were more likely to have vehicles available than
households without children. The share of family households also increased by two percentage
points from 1990 to 2008, while the share of households without children decreased by one
percentage point during the same period.
Journey to Work
Auto use as the primary means of journeys-to-work declined in spite of the increased number
and share of households owning vehicles. Between 1990 and 2000, the number of Manhattan
residents using a car as their primary means of commuting dropped by 5.4 percent, while
transit mode share increased by 2 percent during the same period. The 2008 ACS data
indicates an increase in the auto share of 4 percentage points; however, the transit share also
increased by 8 percentage points. Overall, about 9 percent of workers who reside in
Manhattan commute to work by car, including the 4 percent that commute within Manhattan.
While the Hub-bound data indicate that there has been an increase in the number of vehicles
entering the Manhattan Core since 1978, it is important to note that the largest mode share is
transit for both daily commuting into Manhattan and for Manhattan residents. Just 15 percent
of daily commuters entering Manhattan travel by vehicle. The largest share of commuters (73
percent) use transit and the remaining 12 percent travel by other means. Manhattan residents
also prefer transit as their mode of transportation to work (68 percent), while 17 percent travel
by other means and 15 percent use a vehicle.
60% 58%79% 80%
40% 42%21% 20%
0%10%20%30%40%50%60%70%80%90%
100%
1990 (n=66,461) 2006-2008 (n=80,177)
1990 (n=345,394) 2006-2008 (n=448,024)
Households with Children Households without Children
Pe
rce
nt
Household Type and Year
VEHICLE OWNERSHIP BY HOUSEHOLDS AND FAMILIES WITH CHILDREN (1990 AND 2008)
Do not own a vehicle Own vehicle

18
Not only is the share of Manhattan residents commuting by car very small, but Manhattan
monthly residential parkers generally use their cars infrequently. According to our survey, 25
percent of Manhattan monthly residential parkers report making five or fewer vehicle trips per
month; 38 percent report making 5-19 trips per month and 37 percent report making 20 or
more trips per month.
Sixty percent of survey respondents who live in Manhattan (but are not monthly parkers)
report using their cars regularly, making 20 or more trips per month by car while 17 percent of
Manhattan residents surveyed indicated that they make less than 5 trips per months. (The
survey methodology, which captures respondents when using vehicles, likely over-represents
frequent auto users and under-represents infrequent auto users.)
Half of the residential monthly parkers surveyed park in a facility other than the building they
live in. Almost all (93 percent) of residential monthly parkers parked close to home, with 63
percent within one-quarter of a mile from home and 84 percent within one-half of a mile from
home. Ninety-one percent reported parking within 5 minutes of home.
15% n=211,430
68% n=964,418
17% n=248,744
MODE OF TRANSPORTATION TO WORK:
MANHATTAN RESIDENTS 2008 ACS
n=1,424,592
Auto
Transit
Other means
15% n=345,853
73% n=1,684,6
11
12% n=275,549
MODE OF TRANSPORTATION TO WORK: COMMUTERS COMING TO
MANHATTAN 2008 ACS
n=2,306,013
Auto
Transit
Other Means
19
2009 MANHATTAN CORE PUBLIC PARKING SURVEY FINDINGS
The purpose of the Manhattan Core Parking Survey was to collect information about public
parking users in the study area in order to inform policy decisions pertaining to public parking.
DCP staff collected 2,871 intercept surveys from 110 public parking facilities for this study. The
number of parking spaces in the surveyed facilities represented approximately 15 percent of
the 145,660 public parking spaces in the Manhattan Core licensed by the New York City
Department of Consumer Affairs (DCA).
The survey included questions about trip purpose, home zip code, reasons for not taking mass
transit, frequency of auto trips to Manhattan, and occupation. Results were weighted to
accurately compare the six CD subareas and the three larger CD geographic zones: Uptown,
Midtown, and Downtown. The survey instrument is located in the Appendix following this
document.
The results of this study indicated several major findings about parking garage users. The
conclusions below specify the different type of users, how often they need to drive into
Manhattan, why transit is not an option for them and their places of origin and destinations.
One of the most interesting findings of this study is that points of origin for public parking users
traveling into the Manhattan Core were widely dispersed across the New York City region and
beyond. Survey respondents lived in over 800 different zip codes, with no more than 25 living
in the same zip code area. This finding indicates that the need for parking in Manhattan cannot
be alleviated simply through transit improvements in a particular localized area. The necessity
for some to drive into Manhattan is geographically widespread and cannot be altered through
targeted/local strategies and policies.
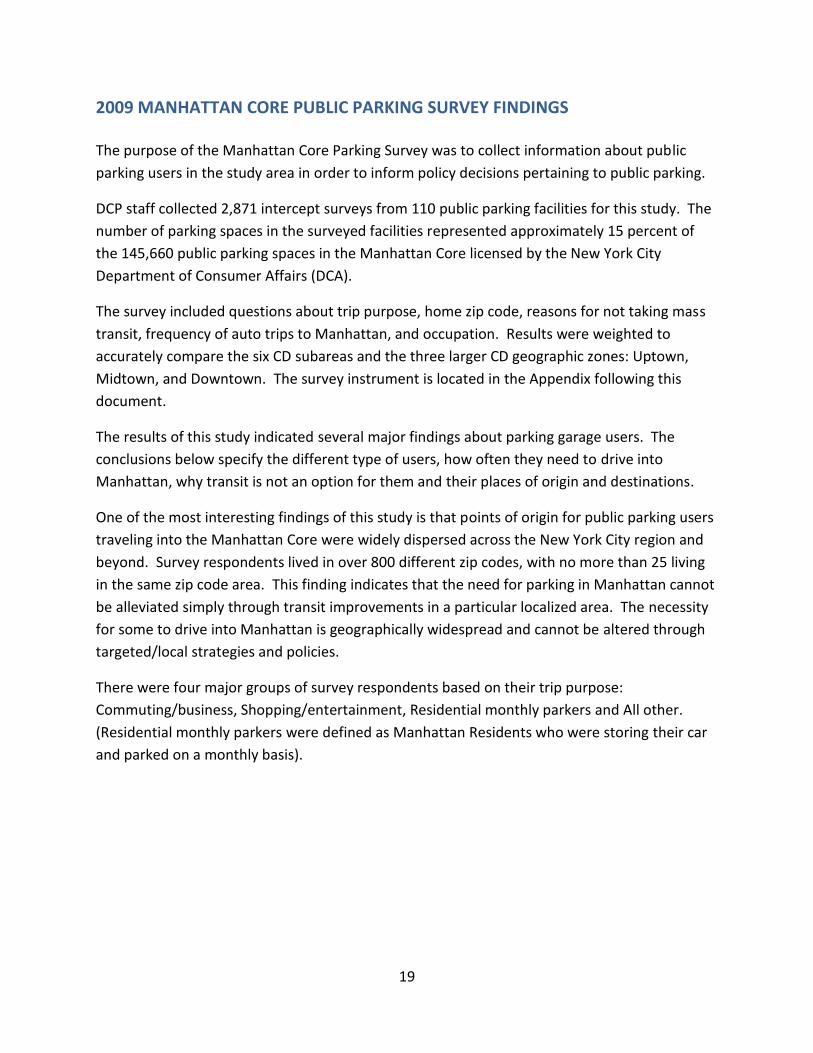
There were four major groups of survey respondents based on their trip purpose:
Commuting/business, Shopping/entertainment, Residential monthly parkers and All other.
(Residential monthly parkers were defined as Manhattan Residents who were storing their car
and parked on a monthly basis).
20
Some of the most significant differences among the four groups can be seen in their response
when asked why they had driven rather than taking mass transit. While commuters/business
users cited transit schedule most frequently, entertainment users reported comfort as being
their main concern, and Manhattan residential monthly parkers most frequently said “other
reasons.”
Below are some additional observations about the four groups and their responses to the
survey. Responses to all survey questions for all respondents and for the four user groups can
be found in the Technical Appendix.

21
25%
20%
18%
21%
8%
10%9%
11%
5%6%
3%
6%
16%
4%
11%
5%
8%
11%
7%
8%
6%
3%
10%
5%
3%
10% 9%8%
2%1% 0% 1%1%
1% 1% 1%
15%
25%
8%
18%
12%10%
23%
15%
0%
5%
10%
15%
20%
25%
30%
Pe
rce
nt
Group
REASONS FOR NOT TAKING TRANSIT BY USER GROUP (N=1,305)
Transit Schedule
Transit Stops
Transit Transfers
Need Car For Work
Multiple Stops
Carrying Packages
Passengers
Parking Cost Subsidized
Carpool
Comfort
Other
Work and Business-Related Users
The work and business-related users composed the largest segment of respondents (67
percent). Many were daily commuters, while some were visiting clients or attending a business
meeting.
A significant segment of workers, particularly those in sales and construction, chose not to take
transit because they needed their car for work, either because they were traveling to several
locations in one day or because they needed to transport heavy tools or equipment. This
segment of the work and business-related users were least likely to be flexible in their
transportation options.

22
Entertainment and Shopping Users
The respondents in this group were more likely than other groups to travel during off-peak
hours and stay at their destination for short periods of time. Many respondents in this group
drove with other occupants in their vehicle. The largest share of this group -- 25 percent --
cited comfort as a reason for not using transit.
These findings indicate that this group of users should not be discouraged from parking in the
Manhattan Core. They are a user group which generates revenue for the city and since they are
likely to travel during off-peak hours and carpool, they do not create additional peak-period
traffic congestion. Lastly, the respondents in this group park for short periods of time, so one
parking space can accommodate several visitors in one day.
Almost half of these respondents (45 percent) parked in Midtown, indicating a great need for
parking in areas where there is a commercial draw.
Residential monthly parkers
Manhattan residential monthly parkers were the smallest group of respondents, in part
because they were able to access their cars quickly and thus were less likely participate in the
survey. Those who were surveyed indicated that they made fewer trips by car in the prior
month than Manhattan residents who were not monthly residential parkers.
According to operator data, 44 percent of all public parking spaces in surveyed facilities were
leased to residential monthly parkers. In residential study areas, the share was much higher:
over 70 percent in CDs 2 & 3 and 7 & 8. The following chart indicates the percentages of
residential monthly parkers in residential or mixed use buildings, and the percentage of
residential monthly parkers in all land uses, by CD.

23
This chart suggests that public parking facilities in residential neighborhoods serve a larger
group of residents than previously thought. CDs 2 and 3, and 7 and 8 had the highest
percentages of monthly residential parkers regardless of the land use, indicating a need for
residential parking.
Another source of data used to obtain information about residential monthly parkers is the
Manhattan Resident Parking Tax Exemption, which reduces taxes on parking fees for eligible
applicants living in Manhattan. Drivers who park in Manhattan are charged an 18.375 percent
tax on rental parking spaces. However, qualified filers for the Manhattan Resident Parking Tax
Exemption have this tax reduced to 10.375 percent. In order to be eligible, Manhattan
residents must own and register their motor vehicle to a Manhattan address and park in a long-
term rented space for a month or more. The vehicle must be for personal use only.
Residents who file for the exemption are required to notify the NYC Department of Finance
(DOF). According to records provided by the DOF, on average only 10 percent of residents who
filed for the tax exemption lived in the same building as where they parked their vehicles.
However, 63 percent of DOF filers lived either in the same building or within a quarter-mile of
69%
44%
24%
30%
67%
42%
44%
72%
50%
44%
41%
74%
48%
60%
0% 10% 20% 30% 40% 50% 60% 70% 80%
CDs 7&8 (n = 21)
CD 6 (n = 11)
CD 5 (n = 28)
CD 4 (n = 15)
CDs 2&3 (n = 13)
CD 1 (n = 9)
CDs 1-8 (n = 97)
PERCENTAGE OF RESIDENTIAL MONTHLY PARKERS BY LAND USE AND CD
Residential or Mixed Use All Land Uses
Source: Operator-Provided Data

24
the parking facility where they parked their vehicles, and 84 percent of DOF filers lived either in
the same building or within a half-mile of the facility where they parked their vehicles.
Other Users
Survey respondents who did not fit into any of the three categories above reported several
different trip purposes. Among those listed were picking up or dropping off passengers and
goods, visiting family or friends, and going to a medical or dental appointment. A significant
share (38 percent) of this group selected a medical or dental appointment as their trip purpose
-- another population of drivers who cannot be flexible with their transportation options. There
will always be a need for people with medical conditions to drive, since mass transit is typically
minimally accessible to people with physical disabilities. Furthermore, this population typically
parks for short periods of time, allowing several vehicles to use one parking space throughout
the day.

25
MANHATTAN CORE FINDINGS AND PROPOSED PARKING POLICY GOALS
The purpose of the Manhattan Core study is to better understand how existing supply of off-
street parking is used. These surveys, along with Census data, yielded the following findings:
Public parking garages serve a large group of Manhattan residents, most of whom do
not use their cars frequently.
Approximately 44 percent of accessory spaces were occupied by Manhattan residential
monthly parkers. This figure increased to 60 percent of spaces in residential and mixed-
use buildings, and over 70 percent in Community Districts 2 and 3, and 7 and 8.
Only 4 percent of Manhattan residents commute within Manhattan by car. About 20
percent of Manhattan Core households with cars commute by car; observations and
CEQR surveys indicate that Manhattan Core residents with cars use them infrequently.
Manhattan Core garages serve a neighborhood need for residential parking.
Half of the residential monthly parkers surveyed park in a facility other than the building
they live in, but almost all residential monthly parkers parked close to home, with 63
percent within one-quarter of a mile from home and 84 percent within one-half of a
mile from home. Ninety-one percent reported parking within 5 minutes of home.
Two-thirds of non-resident trips to public parking garages were associated with
work/business.
Approximately 40 percent of commuter parkers had their parking subsidized by an
employer or client.
Public parking in the Manhattan Core is increasingly utilized by residents rather than
commuters. While diminished, the role of public parking in supporting economic activity in the
Manhattan Core continues to be significant. The net result of off-street parking supply
increases and the redevelopment of existing facilities is expected to continue to result in a
gradual decrease in total supply of off-street spaces. Therefore, the focus should shift to
managing new parking supply to balance residents’ and businesses’ preferences with planning
and environmental objectives.

26
TECHNICAL APPENDIX FOR THE 2009 MANHATTAN CORE PARKING SURVEY
This appendix includes methodology details along with frequencies of all survey responses and
frequencies of the four groups of public parking users: commuting/business,
shopping/entertainment, residential monthly parkers and all other. (Residential monthly
parkers were defined as Manhattan Residents who were storing their car and parked on a
monthly basis).
Outreach to Facility Operators
DCP staff contacted public parking facility operators to obtain their cooperation with this study.
Several operators agreed to participate and provided a list of their facilities within the
Manhattan Core study area. In order to secure their cooperation, DCP staff agreed to keep
their identities, locations, and individual responses from their facilities confidential. These
operators provided a total of 156 facilities (about 15 percent of the total DCA facilities in the
Manhattan Core).
DCA maintains a database that contains all licensed public parking facilities in the city. By
obtaining this database, DCP was able to map how parking facilities are distributed throughout
the Manhattan Core study area. The DCA database for August 2009 listed 1,062 distinct
licensed facilities within CDs 1-8 with a combined total of 145,660 spaces. The 156 facilities
contained 28,135 parking spaces (about 19 percent of all DCA-licensed parking spaces in the
Manhattan Core).
Determining the CD Subareas
DCP divided the Manhattan Core study area into six CD subareas, since parking demands and
patterns differ according to neighborhood character and land uses. The subareas are: CD 1
(Lower Manhattan/Financial District), CDs 2 and 3 (West Village, SoHo, Lower East Side), CD 4
(Chelsea, Clinton), CD 5 (Midtown), CD 6 (Gramercy, Murray Hill), and CDs 7 and 8 (Upper West
Side, Upper East Side). For certain analyses, the study areas were further aggregated into three
geographic zones: Downtown/below 14th Street (CDs 1, 2 and 3); Midtown (CDs 4, 5 and 6) and
Uptown/above 59th Street (CDs 7 and 8).
Determining Number of Surveys to Administer
A target sample of 1,500 survey respondents was set for the entire study area to create a
statistically valid sample for each CD subarea. The target number of surveys to be administered
within each CD subarea was determined by the proportion of DCP database spaces in the CD
subarea to the DCP database spaces in the entire study area.

27
The DCP database contained 28,211 public parking spaces in Manhattan CDs 1-8 (as described
above, this is the number of spaces in cooperating operator facilities, not the total number of
DCA licensed spaces.) The target number of surveys for each subarea was established as
follows: Since nine percent of all parking spaces in the DCP sample were in CD 1, the study was
designed so that nine percent of all 1,500 surveys in the study would come from CD 1.
Therefore, a target of 132 surveys was set to be collected from CD 1. In order to ensure that
survey results could be analyzed in a statistically significant way by CD subarea as well as for the
study area as a whole, no fewer than 125 surveys would be collected in any CD subarea,
regardless of the ratio of spaces in the CD subarea to the total study area.
Selecting Facilities to Survey
Within each CD subarea, specific parking facilities were chosen for surveying based on the
number of parking spaces compared to others in the CD study area.
To calculate the number of surveys needed from each facility, all DCP database facilities within
each CD subarea were sorted in descending order by number of spaces. The number of spaces
in each facility as a percentage of all spaces in the DCP sample within that CD subarea was then
determined. For the largest facility in a CD subarea, a target number of surveys to collect at
that facility were calculated by multiplying the percentage of spaces within the CD subarea at
that facility by the total target number of surveys desired for that CD subarea.
After the largest facility was accounted for, each successively smaller facility’s targets were
determined by calculating the percentage of spaces at that facility relative to all spaces within
the DCP sample within that CD subarea, excluding the spaces from the larger facility. That
percent was then applied to the target number of surveys desired for that CD subarea.
This process was repeated for each successively smaller facility within the CD subarea until the
target number of surveys was reached. Any facilities remaining in the CD subarea after the
target number of surveys was achieved were not scheduled for surveying. In situations where
the assigned facility to be surveyed was deemed inappropriate to survey for reasons including
inaccessibility or poor ventilation, the facility was substituted with the next on the list.
Surveying Facilities
DCP staff surveyed a total of 110 facilities from March to mid-May 2009 in the six CD subareas.
In order to test the survey instrument, a pilot week of surveying was conducted January 26th
through January 30th, 2009; these pilot results were also used in this study. Each week, 15
facilities were scheduled Tuesday through Thursday, from 1:00-3:00pm and from 4:00-6:00pm.
Friday was considered a make-up date for inclement weather, particularly in cases of colder

28
winter weather and open lot sites. A small subset of the facilities was also surveyed Friday
nights, from 9:00-11:00pm, to capture the characteristics of evening parkers in areas, such as
the Theater District, that have large concentrations of nighttime attractions.
Generally, one staff member was scheduled for the 1:00-3:00pm shift and two staff members
were scheduled for the 4:00-6:00pm shift for each facility. However, the location and capacity
of the facility, along with any safety concerns and staff resources, helped to determine the
number of surveyors assigned to each shift. Facilities that were considered to be in high traffic
areas, such as Times Square, Herald Square and Midtown, usually had two surveyors for each
shift period while facilities located in residential buildings or facilities further away from the
CBD, such as the Upper West Side and along the East River, usually had only one surveyor.
Additionally, operators provided input to the busiest times for their facilities to help determine
the number of surveyors needed.
At the commencement of each shift, DCP surveyors approached the facility manager with an
operator letter authorizing the surveying on the premises by their management. Surveyors
gathered data from the attendants such as occupancy data of the facility (either number of
vehicles or percentage estimate) and any other factors that may affect the parking levels for the
day, such as special events. Surveyors then approached parking users after they paid at the
cashier and were waiting for the attendants to retrieve their vehicles. The administering of
surveys was often completed by the time the attendants had retrieved the vehicle.
Survey Limitations
DCP staff intended for the survey methodology to capture a robust sample of public parking
facility users across Manhattan Community Districts 1-8, and within each CD subarea. While
DCP collected 2,871 surveys – and enough to analyze patterns at fairly local levels – the sample
of parking facilities from where surveys were collected was limited. Survey collection entailed a
physical presence at each facility, and DCP only obtained permission to enter facilities run by
cooperating operators. While the total number of parking spaces surveyed represented 15
percent of all DCA parking spaces in the study area, a larger number of cooperating operators
might have contributed to a more thorough study.
Furthermore, staff members conducting the survey were limited by logistics, timing and
available resources. The 1:00-3:00pm, 4:00-6:00pm, and Friday 9:00-11:00pm time slots were
chosen for survey administration since DCP staff was unable to be present at any facility at all
hours of operation.
While the survey methodology was able to capture a wide range of public parking users,
monthly parkers, especially residential monthly parkers, were very difficult to capture because

29
they typically call the facility in advance to have their vehicles ready upon arrival. Moreover, it
was discovered that residential monthly parkers use their cars less frequently during the hours
when the survey was conducted than other user groups. This observation was made by
surveyors who saw far less turnover in facilities with a high percentage of residential monthly
parkers. To offset this issue, the cooperating operators provided DCP staff with a count of the
number of monthly parkers and residential monthly parkers in each of their facilities.
Surveyors also received imperfect data for the occupancy level of facilities during the shift
periods. While many managers were easily able to access the information requested on their
computers, others did not know the information or would make a general estimate based on
how full the facility may be at 1:00pm and 4:00pm based on 25 percent, 50 percent, 75 percent,
or 100 percent occupancy.
In certain cases, DCA capacity for any given facility often varied from the actual capacity,
making occupancy percentages inaccurate.
Data Analysis
DCP staff surveyed 110 facilities and collected a total of 2,871 surveys, surpassing the 1,500
target survey number for the study area. In order to calibrate the number of surveys collected
at each facility with the original target numbers, the DCP staff weighted the surveys up or down
to match the target number for each facility within the subareas.
DCP staff verified the data by fixing data entry errors, inputting missing surveys into a database
and categorizing the most common “other” choices for Questions 3 and 7 on the survey
(reasons for not taking transit and reasons for parking at a certain facility, respectively).
DCP staff then compiled and analyzed the survey data using frequencies for the Manhattan
Core study area and by individual CD subareas. The DCP staff also analyzed frequencies for the
evening parkers and Manhattan residential monthly parker populations.
DCP staff used SPSS software to create cross tabulations of the survey data in order to find
relationships between different groups of respondents and their survey answers. All
frequencies and cross tabulation results use weighted numbers with the exception of
residential monthly parkers and evening parkers (i.e. n values do not represent the number of
respondents but the number of weighted survey responses collected).
In addition to the survey data, DCP staff also obtained monthly parker information from the
operators and DOF data of Manhattan residents who applied and received the Manhattan
Resident Parking Tax Exemption. The operators’ data of the number of monthly parkers and

30
the number of monthly parkers who were Manhattan residents in each of their facilities
provided DCP with an estimate of the percentage of spaces leased to residents on a long-term
basis. The Manhattan Resident Parking Tax Exemption allows Manhattan residents who own
and register a motor vehicle to a Manhattan address and park in a long-term rented space, to
be eligible for a reduced rate of 10.375 percent. The DOF data gives an estimate of the number
of Manhattan residents who applied for the Manhattan Resident Parking Tax Exemption.5 6 By
comparing operator provided data of the number of residential monthly parkers to the DOF
data, DCP was able to capture and approximate the number of Manhattan residential monthly
parkers that eluded its surveyors.
Questionnaire
The survey was designed by DCP, with input from NYC Department of Transportation, Real
Estate Board New York, and the cooperating parking operators. The final survey has twelve
questions that include among others, asking the public parking users’ trip purpose, home ZIP
code, and reasons for not taking mass transit. The survey can be found on the following page.
5 NYC Department of Finance. “Parking and Vehicles: Manhattan Resident Parking Tax Exemption.” Accessed 30 November
2009. < http://www.nyc.gov/html/dof/html/parking/park_manhattan_res.shtml> 6 The Manhattan Resident Parking Tax is 18.375%, which consists of the standard rate of 10.375% and an additional 8% for
Manhattan rental parking spaces. Only Manhattan residents who own and register a motor vehicle to a Manhattan address and park in a long-term rented space are eligible to pay a reduced rate of 10.375%.

31
1. Which of the following best describes why you are
parking at this location today?
a. Store car here
i. Live in the building
ii. Live elsewhere
b. Work or work-related
i. Coming to work
ii. Here on business
c. Entertainment (dining, museums, etc.)
d. Shopping
e. Visiting family or friends
f. Pickup/Deliver Passengers
g. Pickup/Deliver goods
h. Medical/Dental appointment
i. Other
2. What is your home zip code? ________________
3. What are your reasons for not taking mass transit
today? (Check all that apply)
a. Timing/Scheduling
i. Transit schedule did not fit my needs
ii. Transit stops did not fit my needs
iii. My trip would require transfers
b. I need my car for work
c. I need my car for other reasons
i. I am making multiple stops
ii. I am carrying packages
iii. I am traveling with other people
d. Cost
i. The cost of my trip is subsidized
ii. I carpool
e. Comfort
f. Other: __________________________
4. Who is paying for your parking today?
a. I paid the cost
b. My parking is subsidized or fully paid by
one or more of the following (check all that
apply):
i. Employer
ii. Client
iii. Merchant
iv. Other: ___________________
5. Are you a monthly parker? If not, how long were you
parked at this location?
a. I am a monthly parker
b. Less than 1 hour
c. 1-3 hours
d. more than 3 hours- less than 12 hours
e. more than 12 hours- less than 24 hours
f. 24 hours or more, but not monthly
6. Including yourself, how many people were in
your car on this trip? __________
7. Why did you park at this location? (Check all that
apply)
a. It is close to where I live
b. It is close to where I was going
c. Affordable price
d. It was the first place I saw
e. I am reimbursed for parking costs at this
particular garage
f. Other: __________________________
8. How did you return to this parking location from
your destination?
a. Walked
b. Biked
c. Subway/Bus
d. Taxi
e. I live/work in the building
f. Other: __________________________
9. How long did this take?
a. Less than 5 minutes
b. 5 to 15 minutes
c. More than 15 minutes
10. If you live in Manhattan, how many times did you
use your car in the last month? _______________
11. If you do not live in Manhattan, how many trips
did you make into Manhattan in the last month?
___________
a. Of those trips, how many were by car?
___________
b. How many were by another form of
transportation? ___________
12. Which category best describes your occupation?
a. Construction/Maintenance
b. Management/Executive
c. Professional/Technical
d. Sales
e. Secretarial/Clerical/Administrative
f. Services
g. Transportation/Materials Moving
h. Student
i. Other (including homemaker, not employed,
or retired
CITY OF NEW YORK
DEPT. OF CITY PLANNING Manhattan Public Parking Survey

32
FREQUENCIES
General Trends for Manhattan Core CDs 1-8
The following are survey results for all respondents captured in CDs 1-8. Q1: Trip Purpose
Respondents in CDs 1-8 parked in off-street public parking facilities for a variety of trip reasons. The majority of respondents parked in a facility for work or business-related purposes (67 percent). Of this group, 46 percent were here for work (commuters) while 21 percent were here on business such as a meeting or visiting a client (business-related).
Figure 1. Trip Purpose, CDs 1-8
Q2: Home ZIP Code and Home Region Survey respondents who parked in the Manhattan Core lived in over 800 different ZIP codes across the NYC region and beyond. There were no large concentrations of individuals coming from any particular ZIP code. The following figure condenses all ZIP codes by region in the New York City Area. Nearly two-thirds of survey respondents lived in New York City or New Jersey (65 percent). Slightly over one-fourth of survey respondents lived in New Jersey alone (26 percent). Nearly a quarter of
8%
46%
21%
9%
3%
3%
0.1%
0.2%
5.6%
5%
0% 5% 10% 15% 20% 25% 30% 35% 40% 45% 50%
Store car here
Work (n = 605)
Business-related (n = 277)
Entertainment (dining, museums, etc.)
Shopping
Visiting family or friends
Pickup/Deliver Passengers
Pickup/Deliver Goods
Medical/Dental appointment
Other
Percent
Trip
Pu
rpo
se
Trip Purpose, CDs 1-8 (n = 1,315)

33
respondents lived in NYC’s other suburbs, defined as Westchester, Long Island, and Connecticut (24 percent).
Of the 24 percent of survey respondents coming from another borough (outside Manhattan), 41 percent are from Brooklyn.
15%
24%
26%
6%5%
CT, 4%
Long Island, 11%
Westchester, 9%
0%
5%
10%
15%
20%
25%
30%
MN NYC-Other Four Boroughs
NYC-Other Suburbs
New Jersey Upstate NY Outside NY, NJ, and CT
Pe
rce
nt
Region
Home Region, CDs 1-8 (n = 1,300)
24%
Brooklyn41%
Queens 31%
Staten Island 11%
Bronx 17%
Four Borough Breakdown (n = 309)

34
Q3: Reasons for Not Taking Mass Transit
Almost half of all survey respondents stated inadequate transit as the reason for driving into the Manhattan Core (42 percent). Respondents who chose inadequate transit chose at least one of three transit-related reasons (transit schedules did not fit their needs, transit stops did not fit their needs, or their trip would require transfers) when answering this “check all that apply” question.
Transit schedules not meeting respondents’ needs and comfort were also the most frequently cited reasons for not taking mass transit (35 percent and 24 percent, respectively).
DCP staff received over 545 reasons for not taking mass transit in the “Other” answer choice. Staff analyzed these reasons and based on frequency, created five sub-categories for “Other”. Of the 19 percent of “Other” reasons, “Medical reason” (8 percent), “long trip” (7 percent), and “less expensive” (5 percent) were fairly common reasons for not taking mass transit. The remaining 78 percent of uncategorized “Other” comments were a variety of personal reasons for not using mass transit. Note: “Other” reasons percentages are rounded to the nearest whole.
35%
13%
8%
19%
13%
8%
7%
2%
2%
24%
19%
0% 5% 10% 15% 20% 25% 30% 35% 40%
Transit Schedule
Transit Stops
Transit Transfers
Need Car for Work
Multiple Stops
Carrying Packages
Passengers
Parking Cost Subsidized
Carpool
Comfort
Other
Percent
Re
aso
ns
Reasons for Not Taking Mass Transit, CDs 1-8 (n = 1,305)

35
Q4: Who Paid for Parking
Approximately two-thirds of survey respondents paid for their own parking.
Approximately 34 percent of survey respondents had someone else pay for their parking fees. Of that figure, employers paid for parking 90 percent of the time.
5%7% 1%
8%
1%
78%
"Other" Reasons for Not Taking Mass Transit, CDs 1-8 (n = 250)
Less Expensive
Long Trip
Alt. Side Parking
Medical Reason
No Parking at Train Station
Uncategorized Other
I Paid66%
Someone Else Paid/
Subsidized34%
Who Paid for Parking, CDs 1-8 (n = 1,302)

36
Q5: Length of Time Parked
Half of survey respondents parked their vehicle for between three and 12 hours in a parking facility.
18%
4%
24%
50%
2% 2%
0%
10%
20%
30%
40%
50%
60%
Monthly Parker
Less than 1 hour
1-3 hours more than 3-less than 12
more than 12-less than
24
24 hours or more, not monthly
Pe
rce
nt
Length of Time
Length of Time Vehicle Parked, CDs 1-8 (n = 1,290)
Employer90%
Client4%
Merchant1% Other
5%
Subsidized Parking, CDs 1-8 (n = 437)

37
Q6: Vehicle Occupancy
Almost two-thirds of survey respondents drove alone (65 percent).
Across CDs, similar vehicle occupancy patterns were observed, with the majority of survey respondents driving alone.
1 person65%
2 people25%
3+ people10%
Vehicle Occupancy, CD 1-8(n =1,271)
CD 1
CD 2&3CD 4
CD 5CD 6CD 7&8
0
50
100
1 23
Pe
rce
nt
Vehicle Occupancy
Vehicle Occupancy by CD ( n = 1,271)
38
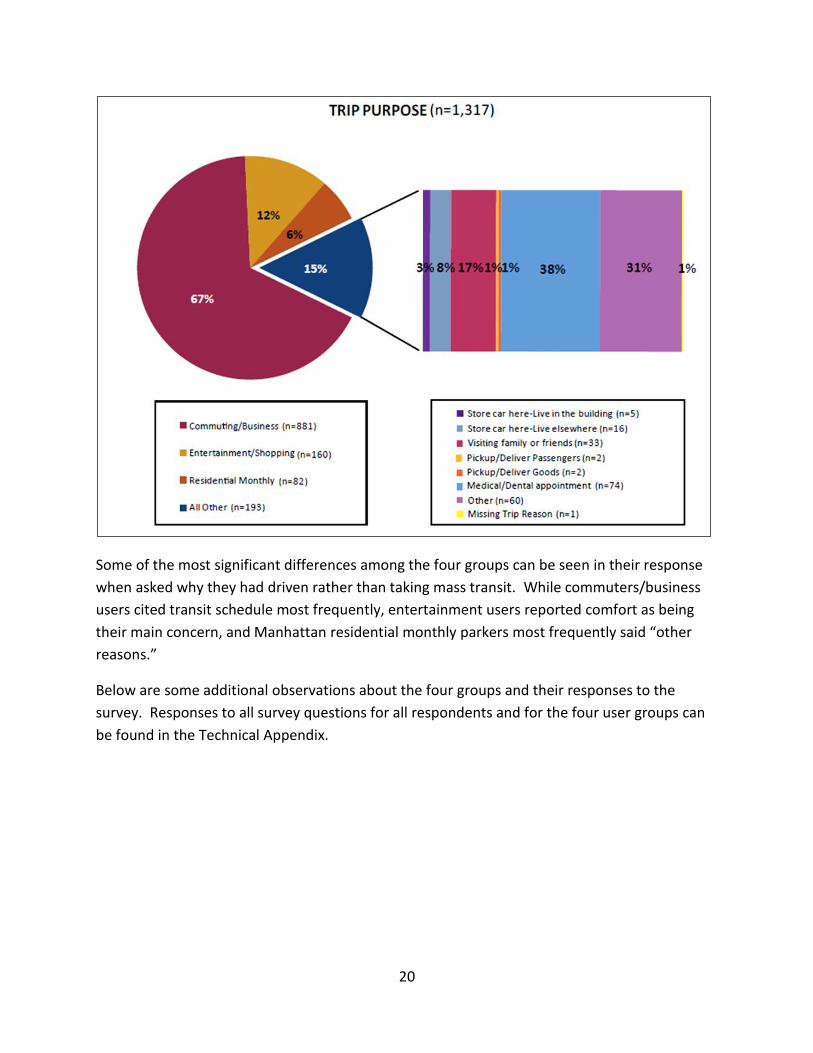
Q7: Reasons for Parking at this Facility
Over 80 percent of survey respondents said that they parked at this particular facility due to its proximity to their destination, and 8 percent of respondents cited they parked at this facility because it was close to home.
Survey respondents had 253 “other” reasons for parking at a particular facility in CDs 1-8. DCP analyzed the “other” reasons and created additional categories for reasons with the greatest frequencies: “nearby facility was full”, “discount”, “work account for parking”, and “good service” from facility attendants. While 36 percent of reasons are still in the uncategorized “other” category, 39 percent of survey respondents that selected “other” parked at a particular facility due to good service from attendants.
8%
81%
12%
2%
3%
10%
0% 20% 40% 60% 80% 100%
Close to home
Close to destination
Affordable
First place I saw
Reimbursed
Other
Percent
Re
aso
ns
Reasons for Parking at this FacilityCDs -8 (n = 1,279)

39
Q8: Mode Used to Return to Facility
The overwhelming majority (97 percent) of survey respondents walked back to the parking facility from their destination.
4%
15%
6%
39%
36%
"Other" Reasons for Parking at this Facility, CD 1-8 (n = 126)
Nearby facility full
Discount
Work account
Good service
Uncategorized Other
97%
0.2% 1% 1% 1%0%
10%20%30%40%50%60%70%80%90%
100%
Walk or Live/Work in the Building
Bike Subway/Bus Taxi Other
Pe
rce
nt
Mode
Mode Used to Return to Parking Facility, CD 1-8 (n = 1,282)

40
Q9: Length of Time to Return to Facility
Over three-fourths of survey respondents (79 percent) were able to return to their facility in less than 5 minutes. As seen in Q7, proximity to the destination was the main reason for choosing a parking facility. Therefore, travel time from the destination to the parking facility would be short for most respondents.
Q10: Live in Manhattan and Monthly Vehicle Usage
Of the Manhattan residents surveyed, slightly over half (52 percent) used their cars for 20 or more trips in the last month. Note: Manhattan residents comprise 15 percent of total survey respondents. Because of the way we administered the survey, we were more likely to intercept users who typically use their cars more frequently.
79%
19%
2%
Length of Time to Return to Parking Facility, CD 1-8 (n = 1,277)
Less than 5 min
5-15 min
more than 15 min
20 or more trips52%
5-19 trips28%
Less than 5 trips20%
Manhattan Residents' Car Trips in the Past Month, CDs 1-8 (n = 187)

41
Q11. Parkers who Lived Outside MN: Total Trips by All Modes and Monthly Vehicle Usage into
Manhattan
Approximately 80 percent of survey respondents live outside of Manhattan. Almost half (45 percent) of the survey respondents who lived outside of Manhattan came into the Manhattan Core for 20 or more trips in the prior month.
In the prior month, survey respondents who did not live in Manhattan were relatively equally split in the number of vehicle trips made into Manhattan: less than 5 trips (37 percent), 5-19 trips (32 percent), and 20 or more trips (31 percent). Note: Survey respondents who took 20 or more total trips into Manhattan in the past month vary in their number of vehicle trips. Hence, vehicle trip totals for some categories may be larger than total number of trips.
20 or more trips
45% (n=480)
5-19 trips27% (n=288)
Less than 5 trips
28% (n=292)
Non-Manhattan Residents: Total Number of Trips into MN in the
Past Month, CD 1-8 (n = 1,060)

42
Nearly three-fourths of survey respondents who lived outside of Manhattan made over 90 percent of their trips into Manhattan by car (73 percent). Note: This chart shows the percent range of vehicle trips compared to total trips per individual rather than the aggregate from the total number of trips.
3%
16%
8%
73%
Non-Manhattan Residents: Percent Range of Vehicle Trips Compared to Total Trips
into MN in the Past Month (n = 1,009)
Less than 10 percent of total trips made by car
10-50 percent of total trips made by car
51-89 percent of total trips made by car
90-100 percent of total trips made by car
20 or more trips
32% (n =330)
5-19 trips31% (n=324)
Less than 5 trips
37% (n=385)
Non-Manhattan Residents: Number of Vehicle Trips into MN in the Past Month, CD 1-8 (n = 1,039)

43
Q12: Occupation of Survey Respondents
Over half of survey respondents (55 percent) categorized themselves in the professional/technical or managerial/executive profession (32 percent and 23 percent, respectively).
11%
23%
32%
13%
2%5%
1%2%
12%
0%
5%
10%
15%
20%
25%
30%
35%
Pe
rce
nt
Occupation
Occupation, CD 1-8 (n = 1,267)

44
User Group Survey Results
The following are survey results for all respondents captured in CDs 1-8 and are analyzed in four user group categories. Q1: Trip Purpose Respondents in CDs 1-8 parked in off-street public parking facilities for a variety of trip reasons. The majority of respondents parked in a facility for work or business-related purposes (67 percent).
All other users made up 15 percent of survey respondents parked in a public parking facility. Of this group, over a third of respondents’ trip purposes were for a medical or dental appointment (38 percent).

45
25%
20%
18%
21%
8%
10% 9%
11%
5% 6%
3%
6%
16%
4%
11%
5%
8%
11%
7%
8%
6%
3%
10%
5%
3%
10% 9%8%
2%1% 0% 1%1% 1% 1% 1%
15%
25%
8%
18%
12%10%
23%
15%
0%
5%
10%
15%
20%
25%
30%
Commuting/Business (n=875)
Entertainment/Shopping (n=159)
Residential Monthly (n=80)
All Other (n=191)
Pe
rce
nt
Group
Reasons for Not Taking Transit by User Group (n=1,305)
Transit Schedule
Transit Stops
Transit Transfers
Need Car For Work
Multiple Stops
Carrying Packages
Passengers
Parking Cost Subsidized
Carpool
Comfort
Other
Q3: Reasons for Not Taking Mass Transit
Commuting and business users most frequently cited transit schedule and needing their car for work as reasons for not taking transit (25 percent and 16 percent respectively).
A quarter of entertainment and shopping users cited comfort as a reason for not taking transit.
Residential monthly users most frequently cited transit schedule and other as reasons for not taking transit (18 percent and 23 percent respectively).
The transit schedule not meeting respondents’ needs and comfort were also the most frequently cited reasons for not taking mass transit among all user groups except residential monthly users.

46
Q4: Who Paid for Parking
Commuting and business users had the highest percentage of trips paid for or subsidized by an employer or client (44 percent).
Q5: Length of Time Parked
Seventy percent of commuting and business users parked their vehicles between three and twelve hours in a parking facility.
Almost half of the entertainment and shopping users parked their vehicles between one and three hours in a parking facility.
44%
5% 8% 8%
55%
92% 92% 88%
1% 3% 0% 4%
0%
10%
20%
30%
40%
50%
60%
70%
80%
90%
100%
Commuting/Business (n=872)
Entertainment/Shopping (n=158)
Residential Monthly (n=82)
All Other (n=189)
Pe
rce
nt
Group
Who Paid for Parking by User Group (n=1,301)
Other Paid or Subsidized
I Paid
Employer/Client Paid or Subsidized
4% 7% 10%
22%
47% 44%
70%
43% 40%
3% 2% 1%2% 1%
5%
0%
10%
20%
30%
40%
50%
60%
70%
80%
90%
100%
Commuting/Business (n=731)
Entertainment/Shopping (n=155)
All Other (n=168)
Pe
rce
nt
Group
Length of Time Vehicle Parked by User Group, CDs 1-8 (n = 1,054)
24 hours or more
More than 12 hours-less than 24 hours
More than 3 hours-less than 12 hours
1-3 hours
Less than 1 hour

47
Q6: Vehicle Occupancy
Entertainment users had the lowest percentage of single occupancy vehicles and were the most likely to travel in large groups.
Over three-fourths (78 percent) of commuting and business users drove alone.
78%
17%
60%51%
18%
48%
23% 37%
5%
35%
17% 12%
0%
10%
20%
30%
40%
50%
60%
70%
80%
90%
100%
Commuting/Business (n=858)
Entertainment/Shopping (n=156)
Residential Monthly (n=78)
All Other (n=179)
Pe
rce
nt
Group
Vehicle Occupancy by User Group (n=1,271)
1 2 3+

48
Q7: Reasons for Parking at this Facility
With the exception of residential monthly parkers, the majority of respondents in all user groups said that they parked at this particular facility due to its proximity to their destination.
Ninety-two percent of residential monthly parkers said that they parked at this facility because it was close to home.
2%
92%
8%
87%85%
6%
83%
13% 11%
5%8%
2%
8%
2%4%1% 1% 1%
9%12%
1%
14%
0%
10%
20%
30%
40%
50%
60%
70%
80%
90%
100%
Commuting/Business (n= 857)
Entertainment/Shopping (n=156)
Residential Monthly (n=82)
All Other (n=184)
Pe
rce
nt
Group
Mode Used to Return to Parking Facility by User Group, CD 1-8 (n = 1,279)
It is close to where I live
It is close to where I was going
Affordable price
It was the first place I saw
I am reimbursed for parking costs at this particular garage
Other

49
Q8: Mode Used to Return to Facility
Over 85 percent of survey respondents in all user groups walked back to the parking facility from their destination.
95.3% 97.1%
88.0%
94.4%
0.2% 0% 1.0% 0.2%1.3% 1.3%
0.0% 0.5%2% 0%
10.8%
0.7%0.3% 0% 0.0%2.5%
0.0%
10.0%
20.0%
30.0%
40.0%
50.0%
60.0%
70.0%
80.0%
90.0%
100.0%
Commuting/Business (n=860)
Entertainment/Shopping (n=157)
Residential Monthly (n=82)
All Other (n=184)
Pe
rce
nt
Group
Mode Used to Return to Parking Facility by User Group, CD 1-8 (n = 1,282)
Walked
Biked
Subway/Bus
Taxi
I live/work in the building
Other

50
Q9: Length of Time to Return to Facility
Over three-fourths of commuting and business users, residential monthly parkers, and all other users were able to return to the facility in less than 5 minutes.
Entertainment and shopping users had the longest travel time from their destination to the parking facility compared to the other user groups; with six percent taking more than 15 minutes to return to the facility.
80%66%
94%84%
18%
28%
5% 15%
2% 6%1% 2%
0%
10%
20%
30%
40%
50%
60%
70%
80%
90%
100%
Commuting/Business (n=855)
Entertainment/Shopping (n=156)
Residential Monthly (n=82)
All Other (n=183)
Pe
rce
nt
Group
Length of Time to Return to Parking Facility by User Group, CD 1-8 (n = 1,277)
More than 15 minutes
5 to 15 minutes
Less than 5 minutes

51
Q10: Live in Manhattan and Monthly Vehicle Usage
Of the residential monthly users surveyed, less than half (40 percent) used their cars for 20 or more trips in the last month. Note: Residents who were intercepted and surveyed in this study are also more likely to use their cars often than residents who used their cars infrequently.
Q11. Parkers who Lived Outside Manhattan: Total Trips Monthly Vehicle Usage into Manhattan
Most entertainment and shopping and all other users who lived outside of Manhattan, made less than five vehicle trips into the Manhattan Core in the past month (80 percent and 55 percent respectively).
Forty percent of commuting and business users, who lived outside of Manhattan, made 20 or more vehicle trips into the Manhattan Core in the past month.
40% (n=32)
36% (n=29)
24% (n=19)
Residential Monthly Parkers: Number of Times Used Car in the
Past Month (n=80)
20 or more
5 to 19
Less than 5
40%
6% 12%
34%
14%
33%
27%
80%
55%
0%
10%
20%
30%
40%
50%
60%
70%
80%
90%
100%
Commuting/Business (n=746)
Entertainment/ Shopping (n=129)
All Other (n=144)
Pe
rce
nt
Group
Non-Manhattan Residents: Number of Vehicle Trips into Manhattan in the Past Month (n=989)
Less than 5
5 to 19
20 or more
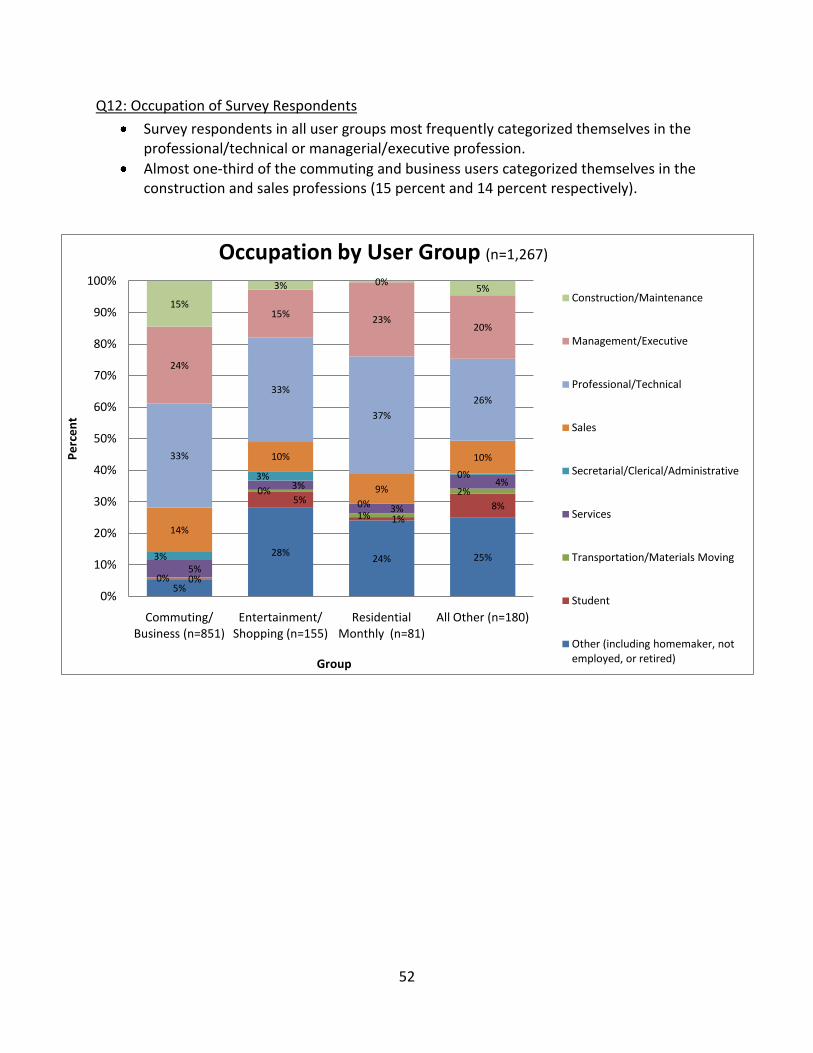
52
Q12: Occupation of Survey Respondents
Survey respondents in all user groups most frequently categorized themselves in the professional/technical or managerial/executive profession.
Almost one-third of the commuting and business users categorized themselves in the construction and sales professions (15 percent and 14 percent respectively).
5%
28%24% 25%
0%
5%
1%8%
0%
0%
1%
2%
5%
3%
3%
4%
3%
3%
0%
0%
14%
10%
9%
10%33%
33%
37%
26%
24%
15%23%
20%
15%
3% 0%5%
0%
10%
20%
30%
40%
50%
60%
70%
80%
90%
100%
Commuting/ Business (n=851)
Entertainment/ Shopping (n=155)
Residential Monthly (n=81)
All Other (n=180)
Pe
rce
nt
Group
Occupation by User Group (n=1,267)
Construction/Maintenance
Management/Executive
Professional/Technical
Sales
Secretarial/Clerical/Administrative
Services
Transportation/Materials Moving
Student
Other (including homemaker, not employed, or retired)

53
Acknowledgements
Department of City Planning
Amanda M. Burden, FAICP, Director
Richard Barth, Executive Director
Sandy Hornick, Consultant for Strategic Planning
Howard Slatkin, Director, Sustainability and Deputy Director, Strategic Planning
DCP Transportation Division
Jack Schmidt, Director
Kevin Olinger, Deputy Director
Karen Johnson, Team Leader
Jetal Bhakta, Project Manager*
Erica Alario, City Planner
Karen Blatt, City Planner
Emilio Feliz, City Planner*
Erik Seims, City Planner
Rodney Stiles, Planning Technician
Nichole Altmix, Intern*
Ray Chetti, Intern*
Jeremy Kim, Intern*
Laura Steven, Intern*
DCP Housing Economic & Infrastructure Planning Division
Eric Kober, Director
Barry Dinerstein, Deputy Director
Jennifer Jensen, City Planner*
Laura Smith, City Planner
Adam Attar, City Planner
Special thanks to Transportation Division and HEIP staff who conducted the Manhattan Core
Parking surveys: Erica Alario, Adam Attar, Sam Baris, Karen Blatt, Jetal Bhakta, Cindi Davidson,
Lise Dorestant, Emilio Feliz, Kyle Gebhart, Ruthie Gray, Seth Hostetter, Jen Jensen, Karen
Johnson, Stephen Johnson, Michelle Katopodes, Angela Kelly, Dekka Michael, Kevin Olinger,
Olga Olovyannikov, Stratos Prassas, Alan Ripps, Yolanda Sanchez, Jack Schmidt, Erik Seims, and
Dorian Statom.
*former DCP employee