Embed Size (px)
Citation preview
Manhattan and Bronx Surface Transit Operating Authority Pension Plan Financial Statements as of and for the Years Ended December 31, 2014 and 2013, Supplemental Schedules, and Independent Auditors’ Report
MANHATTAN AND BRONX SURFACE TRANSIT OPERATING AUTHORITY PENSION PLAN
TABLE OF CONTENTS
Page
INDEPENDENT AUDITORS’ REPORT 1–2
MANAGEMENT’S DISCUSSION AND ANALYSIS (UNAUDITED) 3–11
FINANCIAL STATEMENTS AS OF AND FOR THE YEARS ENDED DECEMBER 31, 2014 AND 2013: Statements of Plan Net Position 12 Statements of Changes in Plan Net Position 13 Notes to Financial Statements 14–31
REQUIRED SUPPLEMENTARY INFORMATION (UNAUDITED): 32 Schedule of Changes in Employers’ Net Pension Liability and Related Ratios—Schedule I 33 Schedule of Employer Contributions and Notes to Schedule—Schedule II 34-35 Schedule of Investment Returns—Schedule III 36
SUPPLEMENTARY INFORMATION (UNAUDITED)— 37 Appendix A—Summary of Principal Plan Provisions 38–58
Member of Deloitte Touche Tohmatsu
INDEPENDENT AUDITORS’ REPORT
To the Participants and Board of Administration of The Manhattan and Bronx Surface Transit Operating Authority Pension Plan:
Report on the Financial Statements
We have audited the accompanying statements of plan net position of The Manhattan and Bronx Surface Transit Operating Authority Pension Plan (the “Plan”) as of December 31, 2014 and 2013, and the related statements of changes in plan net position for the years then ended, and the related notes to the financial statements, which collectively comprise the Plan’s basic financial statements as listed in the table of contents.
Management’s Responsibility for the Financial Statements
Management is responsible for the preparation and fair presentation of these financial statements in accordance with accounting principles generally accepted in the United States of America; this includes the design, implementation, and maintenance of internal control relevant to the preparation and fair presentation of financial statements that are free from material misstatement, whether due to fraud or error.
Auditors’ Responsibility
Our responsibility is to express an opinion on these financial statements based on our audits. We conducted our audits in accordance with auditing standards generally accepted in the United States of America. Those standards require that we plan and perform the audits to obtain reasonable assurance about whether the financial statements are free from material misstatement.
An audit involves performing procedures to obtain audit evidence about the amounts and disclosures in the financial statements. The procedures selected depend on the auditor’s judgment, including the assessment of the risks of material misstatement of the financial statements, whether due to fraud or error. In making those risk assessments, the auditor considers internal control relevant to the Plan’s preparation and fair presentation of the financial statements in order to design audit procedures that are appropriate in the circumstances, but not for the purpose of expressing an opinion on the effectiveness of the Plan’s internal control. Accordingly, we express no such opinion. An audit also includes evaluating the appropriateness of accounting policies used and the reasonableness of significant accounting estimates made by management, as well as evaluating the overall presentation of the financial statements.
We believe that the audit evidence we have obtained is sufficient and appropriate to provide a basis for our audit opinion.
Deloitte & Touche LLP30 Rockefeller Plaza New York, NY 10112-0015 USA Tel: +1 212 492 4000 Fax: +1 212 492 5000 www.deloitte.com
- 2 -
Opinion
In our opinion, the financial statements referred to above present fairly, in all material respects, the Plan’s net position as of December 31, 2014 and 2013, and the changes in plan net position for the years then ended in accordance with accounting principles generally accepted in the United States of America.
Emphasis of Matter As discussed in Note 2, in 2014, the Plan adopted Governmental Accounting Standards Board (“GASB”) Statement No. 67, Financial Reporting for Pension Plans - an amendment of GASB Statement No. 25. Our opinion is not modified with respect to this matter.
Other Matters
Required Supplementary Information
Accounting principles generally accepted in the United States of America require that the Management’s Discussion and Analysis on pages 3 through 11 and the Schedule of Schedule of Changes in the Employers' Net Pension Liability and Related Ratios-Schedule I on page 33; Schedule of Employer Contributions and Notes to Schedule-Schedule II on pages 34-35; Schedule of Investment Returns-Schedule III on page 36 be presented to supplement the basic financial statements. Such information, although not a part of the basic financial statements, is required by the Governmental Accounting Standards Board who considers it to be an essential part of financial reporting for placing the basic financial statements in an appropriate operational, economic, or historical context. We have applied certain limited procedures to the required supplementary information in accordance with auditing standards generally accepted in the United States of America, which consisted of inquiries of management about the methods of preparing the information and comparing the information for consistency with management’s responses to our inquiries, the basic financial statements, and other knowledge we obtained during our audit of the basic financial statements. We do not express an opinion or provide any assurance on the information because the limited procedures do not provide us with sufficient evidence to express an opinion or provide any assurance.
Other Information
Our audits were conducted for the purpose of forming an opinion on the basic financial statements. The Appendix A—Summary of Principal Plan Provisions on pages 38 through 58 is presented for the purpose of additional analysis and is not a required part of the basic financial statements. This supplementary information is the responsibility of the Plan’s management. The Appendix A—Summary of Principal Plan Provisions has not been subjected to the auditing procedures applied in our audits of the basic financial statements and, accordingly, we express no opinion on it.
January 25, 2016
Manhattan and Bronx Surface Transit Operating Authority Pension Plan Management’s Discussion and Analysis As of and For the Years Ended December 31, 2014 and 2013
- 3 -
Overview of the Financial Statements
This narrative discussion and analysis of The Manhattan and Bronx Surface Transit Operating Authority Pension Plan (the “Plan”) financial performance provides an overview of the Plan’s financial activities for the years ended December 31, 2014, 2013, and 2012. It is meant to assist the reader in understanding the Plan’s financial statements by providing an overall review of the financial activities during the two years and the effects of significant changes, as well as a comparison with the prior years’ activity and results. This discussion and analysis has been prepared by management and is intended to be read in conjunction with the Plan’s financial statements, which begin on page 12.
Overview of Basic Financial Statements—The following discussion and analysis are intended to serve as an introduction to the Plan’s basic financial statements. The basic financial statements are:
• The Statements of Plan Net Position—Presents the financial position of the Plan at each year-end. It provides information about the nature and amounts of resources with present service capacity that the Plan presently controls (assets), consumption of net assets by the Plan that is applicable to future reporting period (deferred outflow of resources), present obligations to sacrifice resources that the Plan has little or no discretion to avoid (liabilities), and acquisition of net assets by the Plan that is applicable to a future reporting period (deferred inflow of resources) with the difference between assets/deferred outflow of resources and liabilities/deferred inflow of resources being reported as net position. Investments are shown at fair value. All assets and liabilities are determined on an accrual basis.
• The Statements of Changes in Plan Net Position—Presents the results of activities during each year. All changes affecting the assets/deferred outflow and liabilities/deferred inflow of the Plan are reflected on an accrual basis when the activity occurred, regardless of the timing of the related cash flows. In that regard, changes in the fair values of investments are included in the year’s activity as net appreciation (depreciation) in the fair value of investments.
• The Notes to Financial Statements—Provide additional information that is essential to a full understanding of the data provided in the financial statements. The notes present information about the Plan’s accounting policies, significant account balances and activities, material risks, obligations, contingencies, and subsequent events, if any.
• Required Supplementary Information—As required by the Governmental Accounting Standards Board (GASB), is presented after the Notes to the Financial Statements.
The financial statements are prepared in accordance with GAAP Pronouncements.
Financial Highlights
The assets of the Plan exceeded its liabilities by $2,265 million, $2,094 million, and $1,840 million as of December 31, 2014, 2013, and 2012, respectively. These assets are held in trust for the payment of future benefits to members and pensioners.
The Plan received $226 million, $234 million, and $229 million in annual required contributions (ARC) during 2014, 2013, and 2012, respectively. Employer contributions decreased from December 31, 2013 to the year ended December 31, 2014, due to the ARC, based on the latest actuarial valuation report.
Manhattan and Bronx Surface Transit Operating Authority Pension Plan Management’s Discussion and Analysis As of and For the Years Ended December 31, 2014 and 2013
- 4 -
Deductions from plan net position consist mainly of benefit payments to members and their beneficiaries. Deductions increased by 3% from $170 million in 2013 to $176 million in 2014 due to an increase in benefits paid to retirees. Deductions decreased by 1% from $172 million in 2012 to $170 million in 2013 due to a decrease in death benefits.
FINANCIAL ANALYSIS
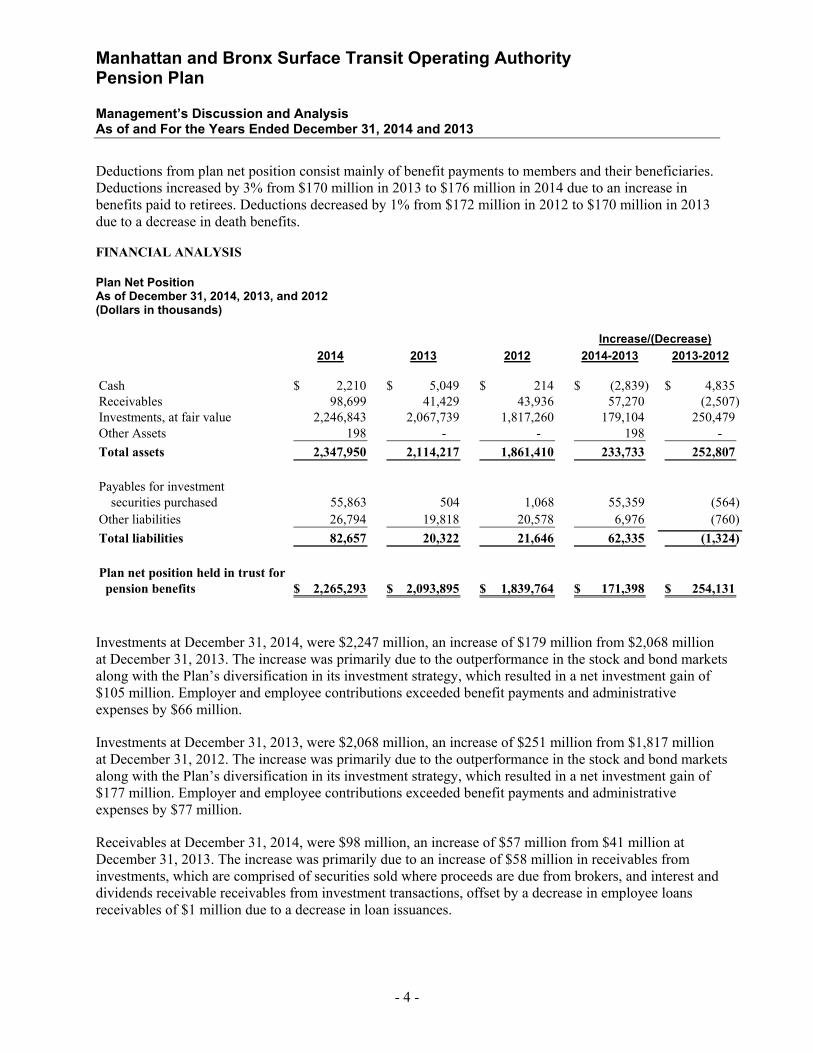
Plan Net Position As of December 31, 2014, 2013, and 2012 (Dollars in thousands)
2014 2013 2012 2014-2013 2013-2012
Cash 2,210$ 5,049$ 214$ (2,839)$ 4,835$ Receivables 98,699 41,429 43,936 57,270 (2,507)Investments, at fair value 2,246,843 2,067,739 1,817,260 179,104 250,479Other Assets 198 - - 198 - Total assets 2,347,950 2,114,217 1,861,410 233,733 252,807
Payables for investmentsecurities purchased 55,863 504 1,068 55,359 (564)
Other liabilities 26,794 19,818 20,578 6,976 (760)Total liabilities 82,657 20,322 21,646 62,335 (1,324)
Plan net position held in trust for pension benefits 2,265,293$ 2,093,895$ 1,839,764$ 171,398$ 254,131$
Increase/(Decrease)
Investments at December 31, 2014, were $2,247 million, an increase of $179 million from $2,068 million at December 31, 2013. The increase was primarily due to the outperformance in the stock and bond markets along with the Plan’s diversification in its investment strategy, which resulted in a net investment gain of $105 million. Employer and employee contributions exceeded benefit payments and administrative expenses by $66 million.
Investments at December 31, 2013, were $2,068 million, an increase of $251 million from $1,817 million at December 31, 2012. The increase was primarily due to the outperformance in the stock and bond markets along with the Plan’s diversification in its investment strategy, which resulted in a net investment gain of $177 million. Employer and employee contributions exceeded benefit payments and administrative expenses by $77 million.
Receivables at December 31, 2014, were $98 million, an increase of $57 million from $41 million at December 31, 2013. The increase was primarily due to an increase of $58 million in receivables from investments, which are comprised of securities sold where proceeds are due from brokers, and interest and dividends receivable receivables from investment transactions, offset by a decrease in employee loans receivables of $1 million due to a decrease in loan issuances.
Manhattan and Bronx Surface Transit Operating Authority Pension Plan Management’s Discussion and Analysis As of and For the Years Ended December 31, 2014 and 2013
- 5 -
Receivables at December 31, 2013, were $41 million, a decrease of $3 million from $44 million at December 31, 2012. The decrease was primarily due to a decrease of $4 million in receivables from investments, which are comprised of securities sold where proceeds are due from brokers, and interest and dividends receivable receivables from investment transactions, offset by an increase in employee loans receivables of $1 million due to an increase in loan issuances.
The Plan fully funded its 2014, 2013, and 2012 annual required contributions (ARC) in calendar year 2014, 2013, and 2012, respectively. There were no deferred employer contributions made in 2014 and 2013 for the estimated annual required contribution for calendar year 2015 and 2014, respectively.
Payables for investments purchased at December 31, 2014, amounted to $56 million, an increase of $55 million from the prior year. Investments are purchased on a trade-date settlement basis. The increase resulted primarily from timing differences in settlement dates, as securities purchased typically do not settle until a few days after the trade date. Payables for investments purchased at December 31, 2013, amounted to $504 thousand, a decrease of $564 thousand from the prior year.
Other liabilities at December 31, 2014, were $27 million, an increase of $7 million from $20 million at December 31, 2013. The increase was primarily due to an increase of $11 million in liabilities from investments, which are comprised of short sales of securities sold where proceeds are due to brokers, offset by a decrease of $3 million in benefit related liabilities.
The Plan’s net position held in trust and available for the payment of benefits increased by 8% or $171 million from December 31, 2013 to December 31, 2014. The increase was due mainly to the ARC and the increase in the market value of assets. The Plan’s net position held in trust and available for the payment of benefits increased by 14% or $254 million from December 31, 2012 to December 31, 2013. The increase was due mainly to the increase in the market value of assets and the increase in ARC.
Statements of Changes in Plan Net Position
Net investment income for the year ended December 31, 2014 totaled $105 million compared to the prior year net investment income of $177 million. In 2014, the Plan experienced a net appreciation of $98 million in the fair market value of investments due to market conditions. In 2013, equity markets continued to soar as the Federal Reserve remained accommodative. In 2013, the Plan experienced a net appreciation of $168 million in the fair market value of investments due to market conditions. In 2012, the Plan experienced a $203 million investment gain due to the fundamental improvement in U.S. equities and emerging markets. Net appreciation in the fair market value of the Plan’s investments in 2012 was $185 million.
Employer contributions for the year ended December 31, 2014, totaled $226 million, a decrease of $8 million over the prior year amount of $234 million. Employer contributions for the year ended December 31, 2013, totaled $234 million, an increase of $5 million over the prior year amount of $229 million. Employer contributions are made on a statutory basis as a result of the actuarial valuations performed as of January 1, 2014, 2013, and 2012, respectively.
Manhattan and Bronx Surface Transit Operating Authority Pension Plan Management’s Discussion and Analysis As of and For the Years Ended December 31, 2014 and 2013
- 6 -
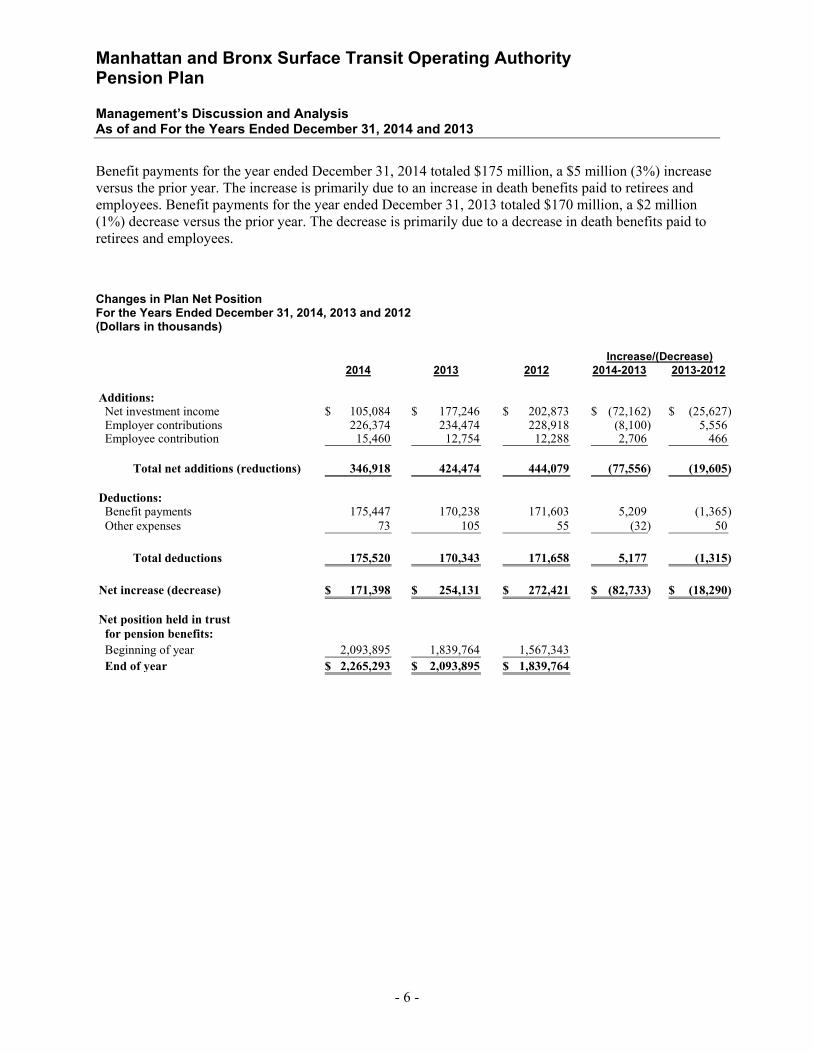
Benefit payments for the year ended December 31, 2014 totaled $175 million, a $5 million (3%) increase versus the prior year. The increase is primarily due to an increase in death benefits paid to retirees and employees. Benefit payments for the year ended December 31, 2013 totaled $170 million, a $2 million (1%) decrease versus the prior year. The decrease is primarily due to a decrease in death benefits paid to retirees and employees.
Changes in Plan Net Position For the Years Ended December 31, 2014, 2013 and 2012 (Dollars in thousands)
2014 2013 2012 2014-2013 2013-2012
Additions: Net investment income 105,084$ 177,246$ 202,873$ (72,162)$ (25,627)$ Employer contributions 226,374 234,474 228,918 (8,100) 5,556 Employee contribution 15,460 12,754 12,288 2,706 466
Total net additions (reductions) 346,918 424,474 444,079 (77,556) (19,605)
Deductions: Benefit payments 175,447 170,238 171,603 5,209 (1,365) Other expenses 73 105 55 (32) 50
Total deductions 175,520 170,343 171,658 5,177 (1,315)
Net increase (decrease) 171,398$ 254,131$ 272,421$ (82,733)$ (18,290)$
Net position held in trust for pension benefits: Beginning of year 2,093,895 1,839,764 1,567,343 End of year 2,265,293$ 2,093,895$ 1,839,764$
Increase/(Decrease)
Manhattan and Bronx Surface Transit Operating Authority Pension Plan Management’s Discussion and Analysis As of and For the Years Ended December 31, 2014 and 2013
- 7 -
Economic Factors
Market Overview and Outlook – 2015 Despite low returns across all major markets and asset classes, 2015 was an eventful year. Market performance was framed by an ever complicated macro environment. Europe was the focus in the first half of the year, as renewed concern about sovereign debt weighed on the common currency. Such concern ultimately led Switzerland to abandon its currency peg to the Euro. Greece continued to make headlines with its contested austerity program, posing an existential threat to the European common currency. In the second half, eyes turned toward a weakening Chinese economy, resulting in commodity markets continuing their steep decline and volatility rising across the equity and fixed income markets. Emerging markets, particularly those centered on commodities where demand is tied to Chinese growth, experienced sharp declines for the year. Weak global growth and low inflation set the stage for divergent central bank monetary policies in developed markets. The year ended with the U.S. Federal Reserve raising interest rates for the first time in nearly 10 years. The European Central Bank and Bank of Japan took a different path, as they continued their quantitative easing programs in an effort to boost inflation and lagging growth in their economies. Perhaps the story for the year was what played out in China, emerging markets, and the commodity markets. As China’s ability to generate the growth expected by the markets became more suspect, the impact was felt across commodity markets. Oil ended the year below $40/barrel, well off its price of just 18 months ago of approximately $120/barrel. Similarly, copper, iron ore, nickel and other industrial metals all are touching lows not seen in recent years. Emerging markets, many of which are tied to China’s growth by supplying it with the raw materials necessary to fuel the economic engine, sold off as investors pulled their risk capital from the markets. Within this context, there were few places to invest to generate meaningful positive returns, while other areas experienced performance not seen since the Great Financial Crisis. Macro Themes
• Weak global growth continuing into 2017 • Central Bank policy divergence, U.S. tightening while Europe and Japan eases • China weakening; turmoil in emerging markets and commodities • Volatile currency markets and sovereign debt stress
The macro picture was framed by tepid global growth in 2015, with the likelihood that sub-optimal economic performance would continue into 2016 and 2017. Developed markets look to remain weak, with Gross Domestic Product (GDP) growth not breaking through the 3% level in the U.S., Europe, or Japan in 2016 or 2017 according to both the International Monetary Fund (IMF) and World Bank. Inflation remains non-existent across the developed markets while currency depreciation in emerging markets have led to spikes in inflation. The U.S. is in an environment where interest rates will likely rise over the next two years; Europe and Japan are in a decidedly different place. Weak demand and low inflation in Europe and Japan have led to further central bank intervention and easing. In emerging markets, central banks have moved to increase interest rates in order to tame both inflation and capital outflows. Ultimately, U.S. interest rate increases will continue to result in a strengthening U.S. Dollar, potentially impacting the U.S. manufacturing and exporting sectors and likely restraining the Fed from increasing rates too quickly. Costs of a rising dollar and interest rates may be partially offset by cheaper natural resources and energy costs.
Manhattan and Bronx Surface Transit Operating Authority Pension Plan Management’s Discussion and Analysis As of and For the Years Ended December 31, 2014 and 2013
- 8 -
Europe continues to be impacted by high levels of public debt and low economic growth. Like many emerging markets, much of Europe’s exports are tied to Chinese demand and growth. Lower growth in China will continue to place pressures on Europe, in particular Germany. Debt levels have not yet moderated post-financial crisis and flare-ups in the periphery, such as in Greece, Portugal, Italy, and Spain, are likely to continue as growth remains challenged and reforms and austerity lose support. Banks will continue their deleveraging cycle as new rules on risk capital are implemented. In Japan, where banks are in better health; high public debt, low growth, a weakening regional economic picture, and aging demographics will challenge the government in delivering their growth and inflation targets. Emerging markets have seen their economic performance deteriorate over the past few years, coinciding with both a weaker global growth picture, sovereign debt concerns in developed markets, and a collapse in energy and mineral prices. The main emerging markets, as defined as the “BRICs” all face their own challenges. Brazil faces high inflation, high interest rates, low growth and a government beset by allegation of corruption. China, in attempting to shift from being manufacturing- oriented to a consumer-based economy, faces significant pressures to meet its growth target of 7% per year. Russia faces a deteriorating financial condition as lower energy prices and economic sanctions take their toll. Finally, India seems to continually disappoint in liberalizing its economy and implementing the structural reforms necessary to unleash its potential. No longer can an argument be made that emerging markets have de-coupled from the developed world.
United States Markets in the U.S. were challenged for the year, but were among the best performers in 2015. Unlike other regions, the U.S. appears to be on relatively sound footing, with unemployment continuing to decline and the remaining hangovers from the 2008 financial crisis continuing to dissipate. The better economic picture provided the Federal Reserve enough leeway to raise interest rates in December for the first time in nearly ten years. The 25 basis point move is largely symbolic, as the frequency and velocity of future interest rate hikes will be determined by continued improvement in the economy.
Equity • Worst year for U.S. Equities since 2008 • Valuations neither cheap nor expensive • Risk Aversion – Large Cap outperformed small & mid cap. Growth outperformed Value • Energy and Materials lagged the broader markets significantly • Health Care and Consumer Sectors relatively strong • Equity markets set for another low-return year
Large cap stocks were barely positive, with the S&P 500 and Russell 1000 posting returns of +1.4% and +0.9%, respectively. Small Cap and Mid Cap indices underperformed large cap. Small Cap, as measured by the Russell 2000 Index, returned -4.4%. The Russell Mid Cap Index performed better, at -2.4%, but still posting its first negative year since 2008. Digging deeper, there was significant performance dispersion across the sectors. Energy and materials performed remarkably poorly. Large cap energy stocks fell by 21.1% for the year while mid cap energy stocks fell by over 33%. Consumer areas performed reasonably well. Consumer Discretionary (+10.1%), Health Care (+6.9%) and Staples (+6.6%) were the leading performers in the S&P 500. With the potential for a new interest rate regime in
Manhattan and Bronx Surface Transit Operating Authority Pension Plan Management’s Discussion and Analysis As of and For the Years Ended December 31, 2014 and 2013
- 9 -
the U.S., active management may finally start to deliver against passive investment options. Dispersion amongst sectors and stocks, as well as increased volatility from a cloudy global macro picture, should provide active managers an adequate environment to deliver value in relation to their fees.
Fixed Income
Unlike recent years where fixed income could be counted on to deliver performance in a weak year for equities, bonds disappointed across all asset classes. Treasuries returned 0.84% for the year, with long-dated bonds outperforming shorter-dated bonds. Importantly, Treasuries were among the best performing areas of the bond markets for 2015. And perhaps more significantly, most investors have been both underweight Treasuries and positioned toward the front end of the yield curve, in anticipation of rising interest rates. This shorter-duration strategy hurt investors in 2015 as the 7-10 Year Index outperformed the 1-3 Year Index by 100 bps for the year. The underweight to Treasuries further eroded performance for many investors in their bond portfolios.
• Intermediate Treasuries returned less than 2% • Investment Grade Credit posted negative returns, driven by BBB-rated • High Yield markets sold off in second half • Declining liquidity in corporate bonds due to capital rules on dealer balance sheets • Fixed income likely to continue to disappoint as interest rates creep higher
Volatility entered the fixed income markets significantly in the back half of the year. High Yield, which had seen strong inflows in recent years, sold off as investors became nervous of rising interest rates, illiquidity, and the impact from the decline in energy prices. Energy issuers comprise roughly 15% of the high yield market and are under significant pressure due to the decline in oil prices. High profile fund closures and liquidations in the fourth quarter added to the volatility in the high yield market. Investment grade was not immune to the volatility either as risk aversion was evident in the corporate bond markets. Lower-rated investment grade, defined as “BBB” by S&P, posted a -1.5% return for the year, underperforming “A” rated bond by nearly 200 bps. Investment in fixed income will remaining challenging in 2016. Potential interest rate increases should continue to dampen returns for Treasuries and risk-aversion in investment grade and high-yield will likely lead to further volatility. Nimbleness and patient deployment of capital in fixed income could offer opportunities to take advantage of periods of market stress. As we have likely entered the later stages of the credit cycle, prudent allocation of risk to the credit sectors will become ever more important.
International Developed • Weak year in Developed Markets ($U.S. returns) • Eurozone, United Kingdom, Australia, Canada all posting negative returns • Japan, Italy, and Scandinavia only major markets positive for the year • Equity valuations in developed markets appear relatively cheaper than the U.S. • Low returns in fixed income in 2015 and expected through 2016
Europe muddled through 2015, never quite able to shake-off a steady procession of crises or concerns, whether the headlines were Greece, sovereign debt levels, weak growth, the viability of the Euro, or the influx of migrants. In $U.S., all major developed markets posted negative performance in 2015. Banks in Europe continue their deleveraging programs, selling off non-core holdings and impaired assets. Opportunities in Europe will continue to exist in taking advantage of the deleveraging cycle, although the
Manhattan and Bronx Surface Transit Operating Authority Pension Plan Management’s Discussion and Analysis As of and For the Years Ended December 31, 2014 and 2013
- 10 -
space has become crowded with ever increasing amounts of capital seeking returns. Unlike the U.S., equity valuations appear a little more attractive in Europe and there may be a likelihood that investors will shift their focus from U.S. to European Equities. In Asia, most developed markets continue to experience very weak performance in $U.S. terms, with the one exception being Japan. Japan, which has embarked on aggressive policies to pull the country from two decades of stagnation, returned +9.6% in 2015. Whether the strong relative performance continues is an open question, particularly in light of the developments in China and whether the Yen can continue to depreciate against other currencies. Fixed income markets in Europe and Japan are largely centered on government bonds, with corporate and asset-backed issuance making up a fraction of the overall markets. European Treasuries returned 1.7% in 2015, and with the latest round of quantitative measures employed by the European Central Bank, returns are likely to be similar in 2016.
Emerging Markets • Terrible year in Emerging Markets (U.S.$ returns) • Weighed by capital outflows and commodity sell-off • Major markets of Indonesia, Brazil, South Africa, Turkey, Malaysia, Thailand at least 20% lower • Only Hungary and Russia posted positive returns • Local Currency Bonds significantly down; hard currency bonds modestly positive • No end in sight for volatility and macro risks remain elevated
Emerging markets posted performance not seen since the financial crisis. The broad emerging markets index declined 14.9% for the year. Only two markets tracked by MSCI, Hungary and Russia, posted positive performance for the year, although Russia was largely a result of performance in the non-energy and basic materials sectors. China, which made significant news through the fall and into winter with the deterioration of its economy and clumsy financial controls implemented to arrest a steep decline in its equity markets, performed better than the broader emerging markets index, falling 7.8% for the year. The worst performance in emerging markets came from Latin America. The Emerging Markets (“EM”) Latin America index fell by 31.0% in 2015, with the worst performance coming from the commodity-heavy economies of Brazil (-41.4%), Peru (-31.7%), and Columbia (-41.8%). More troubling may be the performance of the bond markets of emerging markets. In local currency terms, most emerging markets fixed income indices posted positive performance in 2-5% range. In $U.S. terms, the declines in local currency bonds have been staggering. Brazil (-30.1%), South Africa (-28.2%), and Turkey (-20.9%) highlight the impact of currency on performance. Hard currency bonds, generally issued in $U.S., performed better in 2015, due to the strength of the dollar. The strong performance does not mask the risk due to currency mismatches in the hard currency market and the perennial risk of devaluation, default, and repudiation. Declining currencies, commodity price volatility, high debt levels, and high inflation will likely provide little respite in 2016 for emerging markets.
Commodities • One of the worst years on record for commodities • Slowing China growth, weak global demand, over supply interrelated factors • Little expectation for a recovery in commodity prices in the near term
Manhattan and Bronx Surface Transit Operating Authority Pension Plan Management’s Discussion and Analysis As of and For the Years Ended December 31, 2014 and 2013
- 11 -
Commodities posted amongst the worst performance of any asset class in 2015. The Dow Jones Commodity Index fell by over 25% in 2015, with the energy components leading the downward spiral in prices. Only Cocoa and Cattle provided any positive returns in the index. The Brent Crude Index fell by 45.7% in 2015; Heating Oil fell by 41.4% and Natural Gas fell by 39.1%. While potentially a benefit to consumers, the collapse in energy prices has negative effects near (U.S. shale producers) and far (emerging markets sovereign debt and currencies). Industrial metals were also not immune to the sell-off. As China demand for industrial metals has declined, prices for industrial metals declined by 25% in 2015. The volatility in prices, as well as the impairment on company financials, has led to a significant amount of capital raised in the private equity space in seeking to take advantage of the environment. With little reason to believe that a recovery is near, performance will likely broadly disappoint. Contact Information
This financial report is designed to provide a general overview of the Manhattan and Bronx Surface Transit Operating Authority Pension Plan’s finances. Questions concerning any data provided in this report or requests for additional information should be directed to the Comptroller, Metropolitan Transportation Authority, 2 Broadway, 16th Floor, New York, NY 10004.
* * * * * *
- 12 -
MANHATTAN AND BRONX SURFACE TRANSITOPERATING AUTHORITY PENSION PLAN
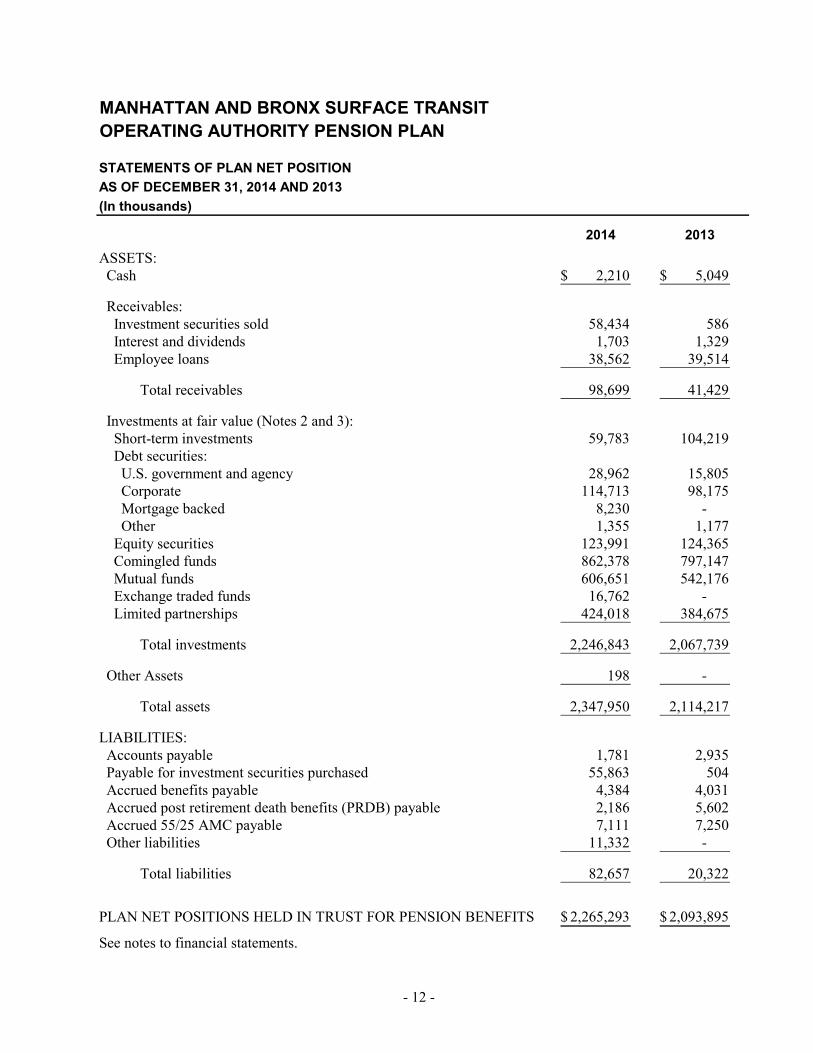
STATEMENTS OF PLAN NET POSITIONAS OF DECEMBER 31, 2014 AND 2013(In thousands)
2014 2013ASSETS: Cash 2,210$ 5,049$
Receivables: Investment securities sold 58,434 586 Interest and dividends 1,703 1,329 Employee loans 38,562 39,514
Total receivables 98,699 41,429
Investments at fair value (Notes 2 and 3): Short-term investments 59,783 104,219 Debt securities: U.S. government and agency 28,962 15,805 Corporate 114,713 98,175 Mortgage backed 8,230 - Other 1,355 1,177 Equity securities 123,991 124,365 Comingled funds 862,378 797,147 Mutual funds 606,651 542,176 Exchange traded funds 16,762 - Limited partnerships 424,018 384,675
Total investments 2,246,843 2,067,739
Other Assets 198 -
Total assets 2,347,950 2,114,217
LIABILITIES: Accounts payable 1,781 2,935 Payable for investment securities purchased 55,863 504 Accrued benefits payable 4,384 4,031 Accrued post retirement death benefits (PRDB) payable 2,186 5,602 Accrued 55/25 AMC payable 7,111 7,250 Other liabilities 11,332 -
Total liabilities 82,657 20,322
PLAN NET POSITIONS HELD IN TRUST FOR PENSION BENEFITS 2,265,293$ 2,093,895$
See notes to financial statements.
- 13 -
MANHATTAN AND BRONX SURFACE TRANSITOPERATING AUTHORITY PENSION PLAN
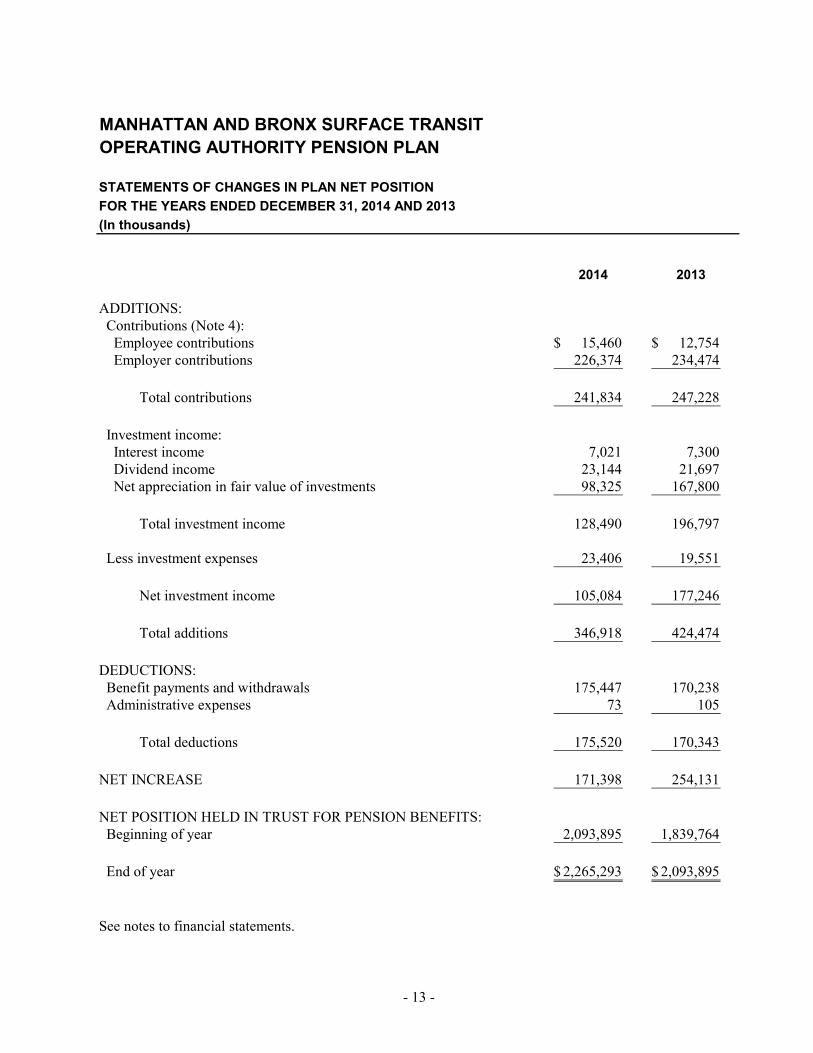
STATEMENTS OF CHANGES IN PLAN NET POSITIONFOR THE YEARS ENDED DECEMBER 31, 2014 AND 2013(In thousands)
2014 2013
ADDITIONS: Contributions (Note 4): Employee contributions 15,460$ 12,754$ Employer contributions 226,374 234,474
Total contributions 241,834 247,228
Investment income: Interest income 7,021 7,300 Dividend income 23,144 21,697 Net appreciation in fair value of investments 98,325 167,800
Total investment income 128,490 196,797
Less investment expenses 23,406 19,551
Net investment income 105,084 177,246
Total additions 346,918 424,474
DEDUCTIONS: Benefit payments and withdrawals 175,447 170,238 Administrative expenses 73 105
Total deductions 175,520 170,343
NET INCREASE 171,398 254,131
NET POSITION HELD IN TRUST FOR PENSION BENEFITS: Beginning of year 2,093,895 1,839,764
End of year 2,265,293$ 2,093,895$
See notes to financial statements.
- 14 -
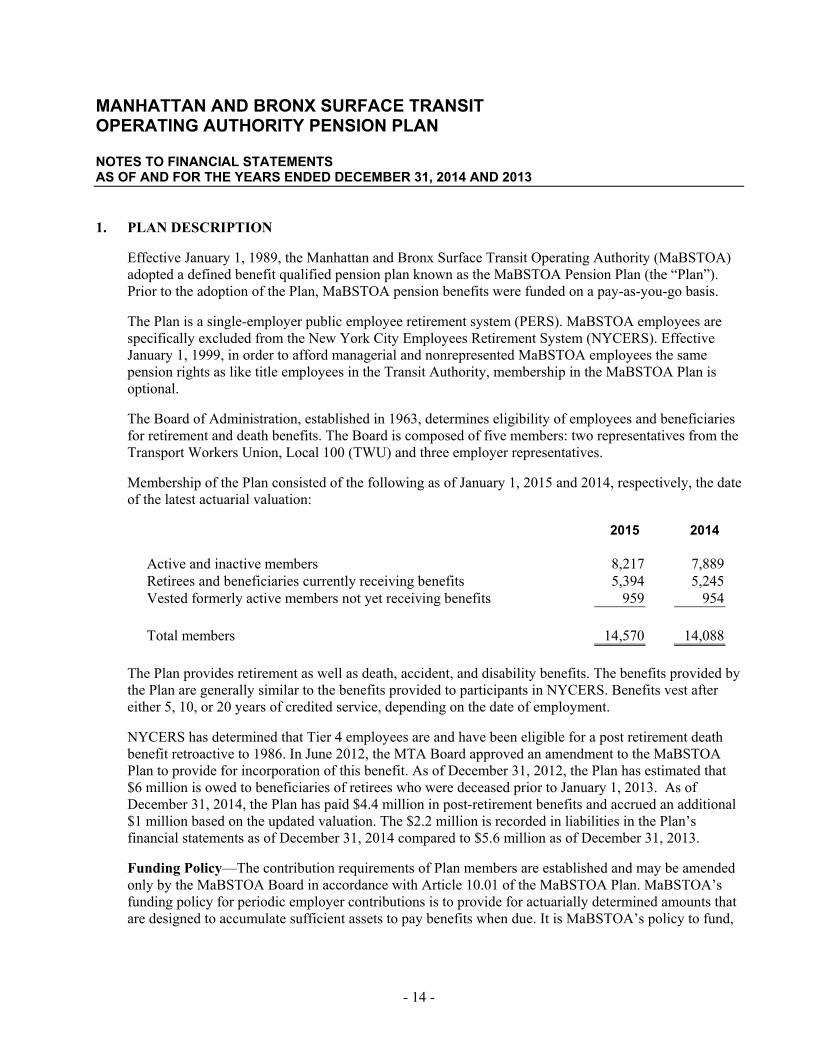
MANHATTAN AND BRONX SURFACE TRANSIT OPERATING AUTHORITY PENSION PLAN
NOTES TO FINANCIAL STATEMENTS AS OF AND FOR THE YEARS ENDED DECEMBER 31, 2014 AND 2013
1. PLAN DESCRIPTION
Effective January 1, 1989, the Manhattan and Bronx Surface Transit Operating Authority (MaBSTOA) adopted a defined benefit qualified pension plan known as the MaBSTOA Pension Plan (the “Plan”). Prior to the adoption of the Plan, MaBSTOA pension benefits were funded on a pay-as-you-go basis.
The Plan is a single-employer public employee retirement system (PERS). MaBSTOA employees are specifically excluded from the New York City Employees Retirement System (NYCERS). Effective January 1, 1999, in order to afford managerial and nonrepresented MaBSTOA employees the same pension rights as like title employees in the Transit Authority, membership in the MaBSTOA Plan is optional.
The Board of Administration, established in 1963, determines eligibility of employees and beneficiaries for retirement and death benefits. The Board is composed of five members: two representatives from the Transport Workers Union, Local 100 (TWU) and three employer representatives.
Membership of the Plan consisted of the following as of January 1, 2015 and 2014, respectively, the date of the latest actuarial valuation:
2015 2014
Active and inactive members 8,217 7,889 Retirees and beneficiaries currently receiving benefits 5,394 5,245 Vested formerly active members not yet receiving benefits 959 954
Total members 14,570 14,088
The Plan provides retirement as well as death, accident, and disability benefits. The benefits provided by the Plan are generally similar to the benefits provided to participants in NYCERS. Benefits vest after either 5, 10, or 20 years of credited service, depending on the date of employment.
NYCERS has determined that Tier 4 employees are and have been eligible for a post retirement death benefit retroactive to 1986. In June 2012, the MTA Board approved an amendment to the MaBSTOA Plan to provide for incorporation of this benefit. As of December 31, 2012, the Plan has estimated that $6 million is owed to beneficiaries of retirees who were deceased prior to January 1, 2013. As of December 31, 2014, the Plan has paid $4.4 million in post-retirement benefits and accrued an additional $1 million based on the updated valuation. The $2.2 million is recorded in liabilities in the Plan’s financial statements as of December 31, 2014 compared to $5.6 million as of December 31, 2013.
Funding Policy—The contribution requirements of Plan members are established and may be amended only by the MaBSTOA Board in accordance with Article 10.01 of the MaBSTOA Plan. MaBSTOA’s funding policy for periodic employer contributions is to provide for actuarially determined amounts that are designed to accumulate sufficient assets to pay benefits when due. It is MaBSTOA’s policy to fund,
- 15 -
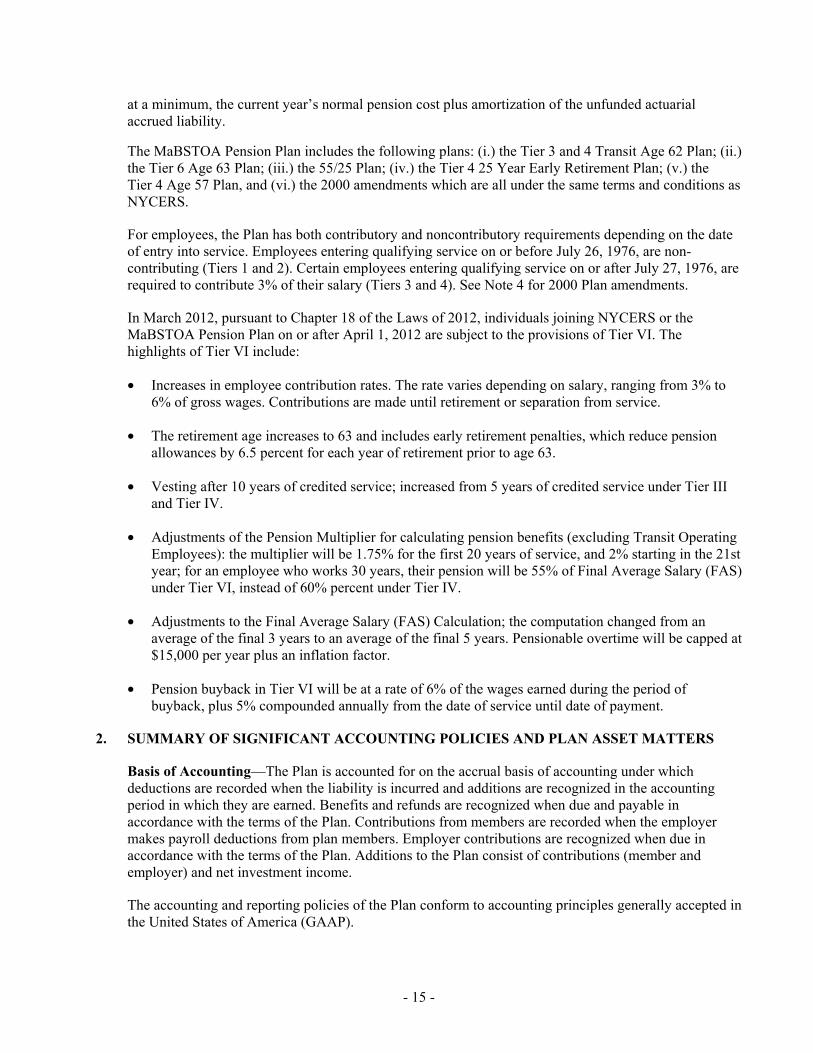
at a minimum, the current year’s normal pension cost plus amortization of the unfunded actuarial accrued liability.
The MaBSTOA Pension Plan includes the following plans: (i.) the Tier 3 and 4 Transit Age 62 Plan; (ii.) the Tier 6 Age 63 Plan; (iii.) the 55/25 Plan; (iv.) the Tier 4 25 Year Early Retirement Plan; (v.) the Tier 4 Age 57 Plan, and (vi.) the 2000 amendments which are all under the same terms and conditions as NYCERS.
For employees, the Plan has both contributory and noncontributory requirements depending on the date of entry into service. Employees entering qualifying service on or before July 26, 1976, are non-contributing (Tiers 1 and 2). Certain employees entering qualifying service on or after July 27, 1976, are required to contribute 3% of their salary (Tiers 3 and 4). See Note 4 for 2000 Plan amendments.
In March 2012, pursuant to Chapter 18 of the Laws of 2012, individuals joining NYCERS or the MaBSTOA Pension Plan on or after April 1, 2012 are subject to the provisions of Tier VI. The highlights of Tier VI include:
• Increases in employee contribution rates. The rate varies depending on salary, ranging from 3% to 6% of gross wages. Contributions are made until retirement or separation from service.
• The retirement age increases to 63 and includes early retirement penalties, which reduce pension allowances by 6.5 percent for each year of retirement prior to age 63.
• Vesting after 10 years of credited service; increased from 5 years of credited service under Tier III and Tier IV.
• Adjustments of the Pension Multiplier for calculating pension benefits (excluding Transit Operating Employees): the multiplier will be 1.75% for the first 20 years of service, and 2% starting in the 21st year; for an employee who works 30 years, their pension will be 55% of Final Average Salary (FAS) under Tier VI, instead of 60% percent under Tier IV.
• Adjustments to the Final Average Salary (FAS) Calculation; the computation changed from an average of the final 3 years to an average of the final 5 years. Pensionable overtime will be capped at $15,000 per year plus an inflation factor.
• Pension buyback in Tier VI will be at a rate of 6% of the wages earned during the period of buyback, plus 5% compounded annually from the date of service until date of payment.
2. SUMMARY OF SIGNIFICANT ACCOUNTING POLICIES AND PLAN ASSET MATTERS
Basis of Accounting—The Plan is accounted for on the accrual basis of accounting under which deductions are recorded when the liability is incurred and additions are recognized in the accounting period in which they are earned. Benefits and refunds are recognized when due and payable in accordance with the terms of the Plan. Contributions from members are recorded when the employer makes payroll deductions from plan members. Employer contributions are recognized when due in accordance with the terms of the Plan. Additions to the Plan consist of contributions (member and employer) and net investment income.
The accounting and reporting policies of the Plan conform to accounting principles generally accepted in the United States of America (GAAP).
- 16 -
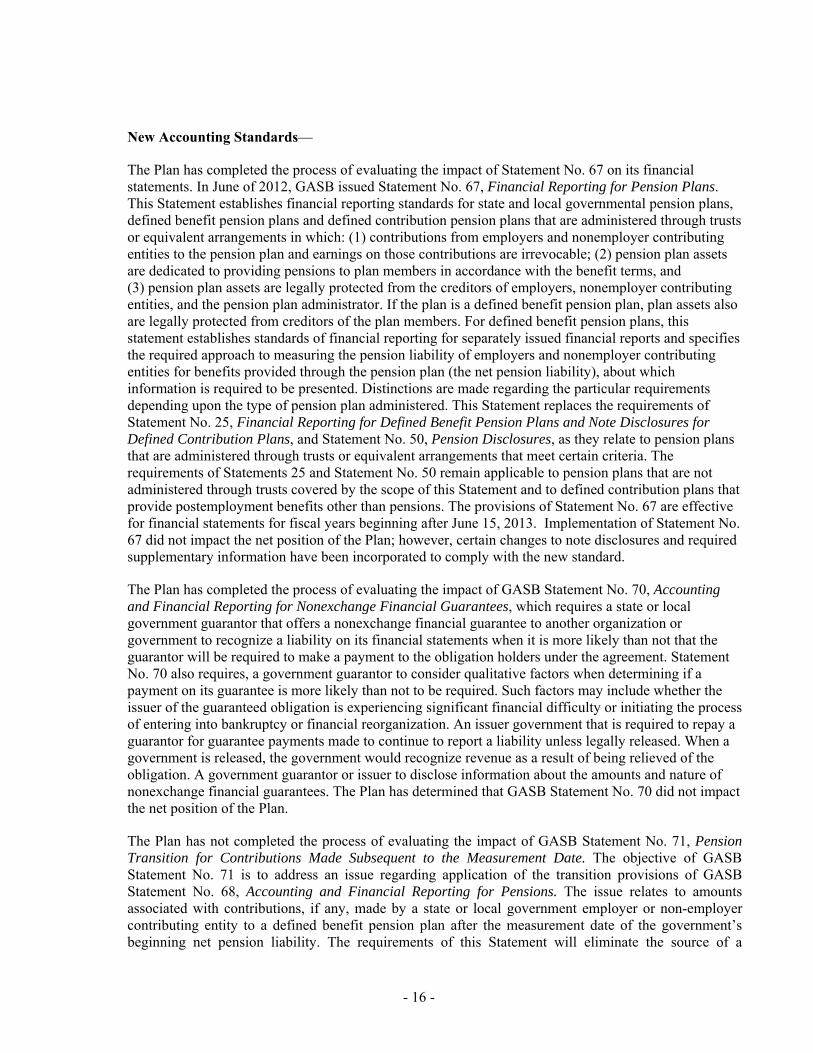
New Accounting Standards—
The Plan has completed the process of evaluating the impact of Statement No. 67 on its financial statements. In June of 2012, GASB issued Statement No. 67, Financial Reporting for Pension Plans. This Statement establishes financial reporting standards for state and local governmental pension plans, defined benefit pension plans and defined contribution pension plans that are administered through trusts or equivalent arrangements in which: (1) contributions from employers and nonemployer contributing entities to the pension plan and earnings on those contributions are irrevocable; (2) pension plan assets are dedicated to providing pensions to plan members in accordance with the benefit terms, and (3) pension plan assets are legally protected from the creditors of employers, nonemployer contributing entities, and the pension plan administrator. If the plan is a defined benefit pension plan, plan assets also are legally protected from creditors of the plan members. For defined benefit pension plans, this statement establishes standards of financial reporting for separately issued financial reports and specifies the required approach to measuring the pension liability of employers and nonemployer contributing entities for benefits provided through the pension plan (the net pension liability), about which information is required to be presented. Distinctions are made regarding the particular requirements depending upon the type of pension plan administered. This Statement replaces the requirements of Statement No. 25, Financial Reporting for Defined Benefit Pension Plans and Note Disclosures for Defined Contribution Plans, and Statement No. 50, Pension Disclosures, as they relate to pension plans that are administered through trusts or equivalent arrangements that meet certain criteria. The requirements of Statements 25 and Statement No. 50 remain applicable to pension plans that are not administered through trusts covered by the scope of this Statement and to defined contribution plans that provide postemployment benefits other than pensions. The provisions of Statement No. 67 are effective for financial statements for fiscal years beginning after June 15, 2013. Implementation of Statement No. 67 did not impact the net position of the Plan; however, certain changes to note disclosures and required supplementary information have been incorporated to comply with the new standard.
The Plan has completed the process of evaluating the impact of GASB Statement No. 70, Accounting and Financial Reporting for Nonexchange Financial Guarantees, which requires a state or local government guarantor that offers a nonexchange financial guarantee to another organization or government to recognize a liability on its financial statements when it is more likely than not that the guarantor will be required to make a payment to the obligation holders under the agreement. Statement No. 70 also requires, a government guarantor to consider qualitative factors when determining if a payment on its guarantee is more likely than not to be required. Such factors may include whether the issuer of the guaranteed obligation is experiencing significant financial difficulty or initiating the process of entering into bankruptcy or financial reorganization. An issuer government that is required to repay a guarantor for guarantee payments made to continue to report a liability unless legally released. When a government is released, the government would recognize revenue as a result of being relieved of the obligation. A government guarantor or issuer to disclose information about the amounts and nature of nonexchange financial guarantees. The Plan has determined that GASB Statement No. 70 did not impact the net position of the Plan.
The Plan has not completed the process of evaluating the impact of GASB Statement No. 71, Pension Transition for Contributions Made Subsequent to the Measurement Date. The objective of GASB Statement No. 71 is to address an issue regarding application of the transition provisions of GASB Statement No. 68, Accounting and Financial Reporting for Pensions. The issue relates to amounts associated with contributions, if any, made by a state or local government employer or non-employer contributing entity to a defined benefit pension plan after the measurement date of the government’s beginning net pension liability. The requirements of this Statement will eliminate the source of a
- 17 -
potential significant understatement of restated beginning net position and expense in the first year of implementation of GASB Statement No. 68 in the accrual-basis financial statements of employers and non-employer contributing entities. This benefit will be achieved without the imposition of significant additional costs. The requirements of this Statement should be applied simultaneously with the provisions of GASB Statement No. 68 and are effective for fiscal years beginning after June 15, 2014.
The Plan has not completed the process of evaluating the impact of GASB Statement No. 72, Fair Value Measurement and Application. This Statement requires the use of valuation techniques which are appropriate under the circumstances and are either a market approach, a cost approach or income approach. GASB Statement No. 72 establishes a hierarchy of inputs used to measure fair value consisting of three levels. Level 1 inputs are quoted prices in active markets for identical assets or liabilities. Level 2 inputs are inputs, other than quoted prices included within Level 1, that are observable for the asset or liability, either directly or indirectly. Level 3 inputs are unobservable inputs, and typically reflect management’s estimates of assumptions that market participants would use in pricing the asset or liability. GASB Statement No. 72 also contains note disclosure requirements regarding the hierarchy of valuation inputs and valuation techniques that was used for the fair value measurements. The provisions in GASB Statement No. 72 are effective for periods beginning after June 15, 2015. The Plan has not completed the process of evaluating the impact of GASB Statement No. 73, Accounting and Financial Reporting for Pensions and Related Assets That Are Not within the Scope of GASB Statement 68, and Amendments to Certain Provisions of GASB Statements 67 and 68. The objective of this Statement is to improve the usefulness of information about pensions included in the general purpose external financial reports of state and local governments for making decisions and assessing accountability. This Statement results from a comprehensive review of the effectiveness of existing standards of accounting and financial reporting for all postemployment benefits with regard to providing decision-useful information, supporting assessments of accountability and interperiod equity, and creating additional transparency. This Statement establishes requirements for defined benefit pensions that are not within the scope of Statement No. 68, Accounting and Financial Reporting for Pensions, as well as for the assets accumulated for purposes of providing those pensions. In addition, it establishes requirements for defined contribution pensions that are not within the scope of Statement No. 68. It also amends certain provisions of Statement No. 67, Financial Reporting for Pension Plans, and Statement No. 68 for pension plans and pensions that are within their respective scopes. The requirements of GASB Statement No. 73, extend the approach to accounting and financial reporting established in Statement No. 68 to all pensions, with modifications as necessary to reflect that for accounting and financial reporting purposes, any assets accumulated for pensions that are provided through pension plans that are not administered through trusts that meet the criteria specified in Statement No. 68 should not be considered pension plan assets. It also requires that information similar to that required by Statement No. 68 be included in notes to financial statements and required supplementary information by all similarly situated employers and nonemployer contributing entities. This Statement also clarifies the application of certain provisions of Statement Nos. 67 and 68 with regard to the following issues: 1) Information that is required to be presented as notes to the 10-year schedules of required supplementary information about investment-related factors that significantly affect trends in the amounts reported; 2) Accounting and financial reporting for separately financed specific liabilities of individual employers and nonemployer contributing entities for defined benefit pensions, and 3) Timing of employer recognition of revenue for the support of nonemployer contributing entities not in a special funding situation. The requirements of this Statement should be applied simultaneously with the provisions of GASB Statement No. 73 and are effective for fiscal years beginning after June 15, 2016.
- 18 -
The Plan has not completed the process of evaluating the impact of Statement No. 76, The Hierarchy of Generally Accepted Accounting Principles for State and Local Governments. The objective of this Statement is to identify—in the context of the current governmental financial reporting environment—the hierarchy of generally accepted accounting principles (GAAP). The “GAAP hierarchy” consists of the sources of accounting principles used to prepare financial statements of state and local governmental entities in conformity with GAAP and the framework for selecting those principles. This Statement reduces the GAAP hierarchy to two categories of authoritative GAAP and addresses the use of authoritative and nonauthoritative literature in the event that the accounting treatment for a transaction or other event is not specified within a source of authoritative GAAP. This Statement supersedes Statement No. 55, The Hierarchy of Generally Accepted Accounting Principles for State and Local Governments. The requirements of this Statement are effective for financial statements for periods beginning after June 15, 2015, and should be applied retroactively. Earlier application is permitted. The Plan has not completed the process of evaluating the impact of Statement No. 78, Pensions Provided Through Certain Multiple-Employer Defined Benefit Pension Plans. The objective of this Statement is to address a practice issue regarding the scope and applicability of Statement No. 68, Accounting and Financial Reporting for Pensions. This issue is associated with pensions provided through certain multiple-employer defined benefit pension plans and to state or local governmental employers whose employees are provided with such pensions. Prior to the issuance of this Statement, the requirements of Statement 68 applied to the financial statements of all state and local governmental employers whose employees are provided with pensions through pension plans that are administered through trusts that meet the criteria in paragraph 4 of that Statement. This Statement amends the scope and applicability of Statement 68 to exclude pensions provided to employees of state or local governmental employers through a cost-sharing multiple-employer defined benefit pension plan that: (1) is not a state or local governmental pension plan; (2) is used to provide defined benefit pensions both to employees of state or local governmental employers and to employees of employers that are not state or local governmental employers, and (3) has no predominant state or local governmental employer (either individually or collectively with other state or local governmental employers that provide pensions through the pension plan). This Statement establishes requirements for recognition and measurement of pension expense, expenditures, and liabilities; note disclosures; and required supplementary information for pensions that have the characteristics described above. The requirements of this Statement are effective for financial statements for periods beginning after December 15, 2015. Earlier application is permitted. The Plan has not completed the process of evaluating the impact of GASB Statement No. 79, Certain External Investment Pools and Pool Participants. This Statement addresses accounting and financial reporting for certain external investment pools and pool participants. Specifically, it establishes criteria for an external investment pool to qualify for making the election to measure all of its investments at amortized cost for financial reporting purposes. An external investment pool qualifies for that reporting if it meets all of the applicable criteria established in this Statement. The specific criteria address: (1) how the external investment pool transacts with participants; (2) requirements for portfolio maturity, quality, diversification, and liquidity, and (3) calculation and requirements of a shadow price. Significant noncompliance prevents the external investment pool from measuring all of its investments at amortized cost for financial reporting purposes. Professional judgment is required to determine if instances of noncompliance with the criteria established by this Statement during the reporting period, individually or in the aggregate, were significant. If an external investment pool does not meet the criteria established by Statement No. 79, that pool should apply the provisions in paragraph 16 of Statement No. 31, Accounting and Financial Reporting for Certain Investments and for External Investment Pools, as amended. If an external investment pool
- 19 -
meets the criteria in this Statement and measures all of its investments at amortized cost, the pool’s participants also should measure their investments in that external investment pool at amortized cost for financial reporting purposes. If an external investment pool does not meet the criteria in this Statement, the pool’s participants should measure their investments in that pool at fair value, as provided in paragraph 11 of Statement No. 31, as amended. This Statement establishes additional note disclosure requirements for qualifying external investment pools that measure all of their investments at amortized cost for financial reporting purposes and for governments that participate in those pools. Those disclosures for both the qualifying external investment pools and their participants include information about any limitations or restrictions on participant withdrawals. The requirements of this Statement are effective for reporting periods beginning after June 15, 2015, except for certain provisions on portfolio quality, custodial credit risk, and shadow pricing. Those provisions are effective for reporting periods beginning after December 15, 2015. Earlier application is encouraged. Methods Used to Value Investments—Investments are stated at fair value. Fair value is the amount that the Plan can reasonably expect to receive for an investment in a current sale between a willing buyer and a willing seller, that is, other than a forced or liquidation sale. All investments, with the exception of alternative investments are valued based on closing market prices or broker quotes.
Traded securities are stated at the last reported sales price on a national securities exchange on the last business day of the fiscal year. Securities purchased pursuant to agreements to resell are carried at the contract price, exclusive of interest, at which the securities will be resold. Alternative investments are valued based on the most current net asset values.
Purchases and sales of securities are reflected on the trade date.
Dividend income is recorded on the ex-dividend date. Interest income is recorded as earned on an accrual basis.
Use of Estimates—The preparation of financial statements in conformity with accounting principles generally accepted in the United States of America requires the Authority to make estimates and assumptions that affect the reported amounts of assets and liabilities and disclosures of contingent assets and liabilities at the date of the financial statements and reported amounts of revenues and expenses during the reporting period. Accordingly, actual results could differ from these estimates.
Reclassifications—Reclassification of certain prior year amounts have been made to conform to the current year presentation.
Risks and Uncertainties—The Plan’s investments are exposed to various risks, such as interest rate, market, and credit risk. Due to the level of risk associated with certain investment securities and level of uncertainty related to changes in the value of investment securities, it is possible that changes in risks in the near term would materially affect the amounts reported in the Plan’s financial statements.
Derivatives—The Plan uses a limited amount of derivative financial instruments. The Plan does not hold derivatives for speculative purposes. Where appropriate, investment managers may be given permission to use derivative securities for the following reasons:
a. Hedging. To the extent that the portfolio is exposed to clearly defined risks and there are derivative contracts that can be used to reduce those risks, the investment managers are permitted to use such derivatives for hedging purposes, including cross-hedging of currency exposures.
- 20 -
b. Creation of Market Exposures. Investment managers are permitted to use derivatives to replicate the risk/return profile of an asset or asset class provided that the guidelines for the investment manager allow for such exposures to be created with the underlying assets themselves.
c. Management of Country and Asset Allocation Exposure. Managers charged with tactically changing the exposure of their portfolio to different countries and/or asset classes are permitted to use derivative contracts for these purposes.
Additional uses of derivatives shall be approved by the Committee prior to implementation and shall be restricted to those specific managers.
Income Taxes—The Plan is designed to satisfy the applicable requirements for governmental plans under Section 401(a) of the Internal Revenue Code. Accordingly, the Plan is tax-exempt and is not subject to the provisions of ERISA. Therefore, income retained by the Plan is not subject to Federal income tax.
3. CASH AND INVESTMENTS
Investment Committee—The Plan authorized the establishment of a five member Investment Committee. Under the Plan, the Investment Committee develops investment objectives, guidelines and restrictions. The Investment Committee is responsible for: 1) determining and adhering to the investment policy and guidelines and 2) setting the asset allocation targets and ranges and defining the permissible investments. The Investment Committee also may appoint an investment advisor (currently New England Pension Consultants) to provide the Committee with investment expertise and may also appoint Investment Managers to direct the investments of the Plan.
Asset Allocation Policy—In order to have a reasonable probability of achieving the target return at an acceptable risk level, the Investment Committee has adopted the asset allocation policy outlined below. The Committee understands that consistent rebalancing is required to maintain the risk/reward profile of the overall portfolio. The actual asset allocation of the Plan will deviate from the strategic asset allocation target due to differences in market returns. The actual asset allocation will be evaluated on a quarterly basis, at a minimum, and will be readjusted when an asset class weighting is outside its target range.
- 21 -
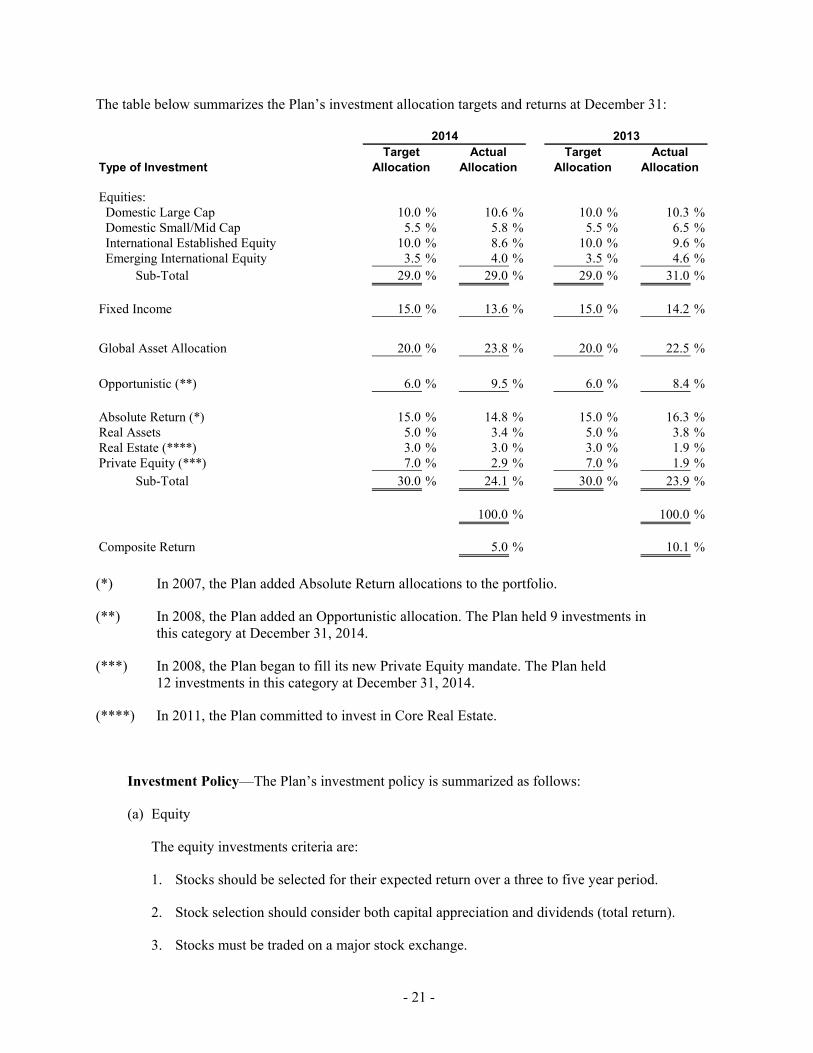
The table below summarizes the Plan’s investment allocation targets and returns at December 31:
Target Actual Target ActualType of Investment Allocation Allocation Allocation Allocation
Equities: Domestic Large Cap 10.0 % 10.6 % 10.0 % 10.3 % Domestic Small/Mid Cap 5.5 % 5.8 % 5.5 % 6.5 % International Established Equity 10.0 % 8.6 % 10.0 % 9.6 % Emerging International Equity 3.5 % 4.0 % 3.5 % 4.6 % Sub-Total 29.0 % 29.0 % 29.0 % 31.0 %
Fixed Income 15.0 % 13.6 % 15.0 % 14.2 %
Global Asset Allocation 20.0 % 23.8 % 20.0 % 22.5 %
Opportunistic (**) 6.0 % 9.5 % 6.0 % 8.4 %
Absolute Return (*) 15.0 % 14.8 % 15.0 % 16.3 %Real Assets 5.0 % 3.4 % 5.0 % 3.8 %Real Estate (****) 3.0 % 3.0 % 3.0 % 1.9 %Private Equity (***) 7.0 % 2.9 % 7.0 % 1.9 % Sub-Total 30.0 % 24.1 % 30.0 % 23.9 %
100.0 % 100.0 %
Composite Return 5.0 % 10.1 %
20132014
(*) In 2007, the Plan added Absolute Return allocations to the portfolio.
(**) In 2008, the Plan added an Opportunistic allocation. The Plan held 9 investments in this category at December 31, 2014.
(***) In 2008, the Plan began to fill its new Private Equity mandate. The Plan held 12 investments in this category at December 31, 2014.
(****) In 2011, the Plan committed to invest in Core Real Estate.
Investment Policy—The Plan’s investment policy is summarized as follows:
(a) Equity
The equity investments criteria are:
1. Stocks should be selected for their expected return over a three to five year period.
2. Stock selection should consider both capital appreciation and dividends (total return).
3. Stocks must be traded on a major stock exchange.
- 22 -
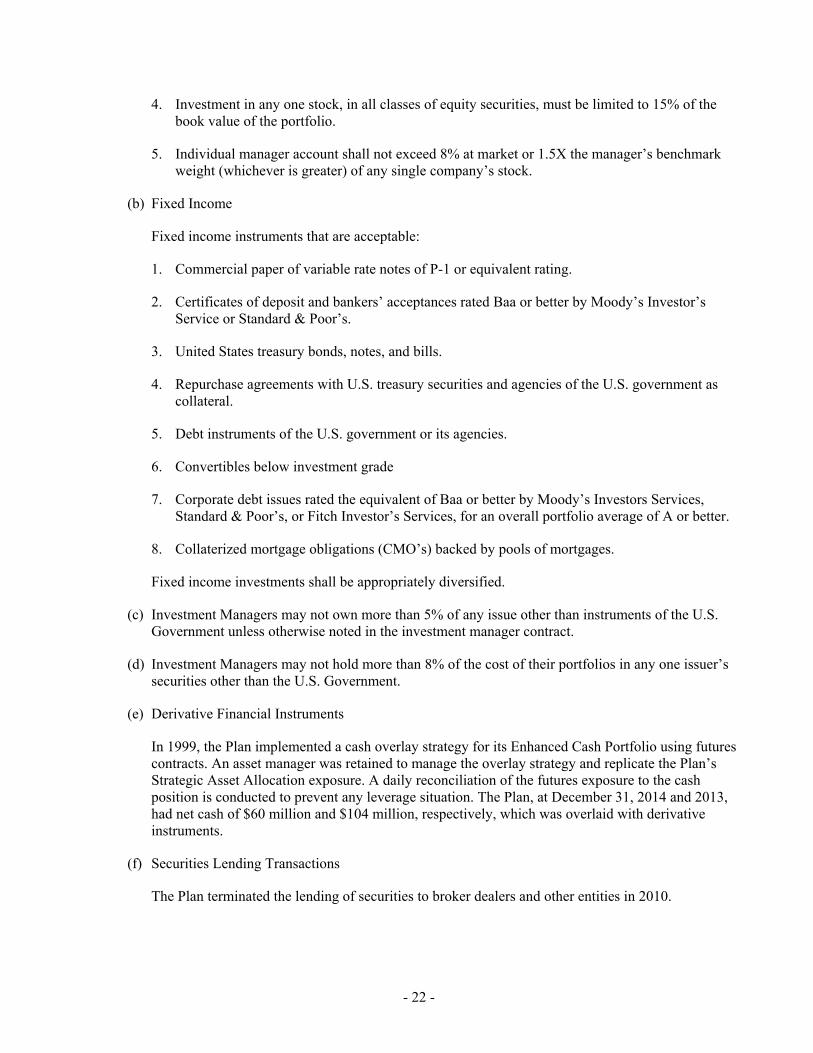
4. Investment in any one stock, in all classes of equity securities, must be limited to 15% of the book value of the portfolio.
5. Individual manager account shall not exceed 8% at market or 1.5X the manager’s benchmark weight (whichever is greater) of any single company’s stock.
(b) Fixed Income
Fixed income instruments that are acceptable:
1. Commercial paper of variable rate notes of P-1 or equivalent rating.
2. Certificates of deposit and bankers’ acceptances rated Baa or better by Moody’s Investor’s Service or Standard & Poor’s.
3. United States treasury bonds, notes, and bills.
4. Repurchase agreements with U.S. treasury securities and agencies of the U.S. government as collateral.
5. Debt instruments of the U.S. government or its agencies.
6. Convertibles below investment grade
7. Corporate debt issues rated the equivalent of Baa or better by Moody’s Investors Services, Standard & Poor’s, or Fitch Investor’s Services, for an overall portfolio average of A or better.
8. Collaterized mortgage obligations (CMO’s) backed by pools of mortgages.
Fixed income investments shall be appropriately diversified.
(c) Investment Managers may not own more than 5% of any issue other than instruments of the U.S. Government unless otherwise noted in the investment manager contract.
(d) Investment Managers may not hold more than 8% of the cost of their portfolios in any one issuer’s securities other than the U.S. Government.
(e) Derivative Financial Instruments
In 1999, the Plan implemented a cash overlay strategy for its Enhanced Cash Portfolio using futures contracts. An asset manager was retained to manage the overlay strategy and replicate the Plan’s Strategic Asset Allocation exposure. A daily reconciliation of the futures exposure to the cash position is conducted to prevent any leverage situation. The Plan, at December 31, 2014 and 2013, had net cash of $60 million and $104 million, respectively, which was overlaid with derivative instruments.
(f) Securities Lending Transactions
The Plan terminated the lending of securities to broker dealers and other entities in 2010.

- 23 -
(g) Other Investments
Use of any other investment for the Plan can be approved by the Plan’s Investment Committee provided that such investment is considered prudent for a pension plan.
(h) Prohibited Transactions
The Plan’s policy prohibits:
1. Investment Managers from entering into any transactions which are not authorized by the MaBSTOA Statement of Investment Objectives, Policies, and Guidelines or without the consent of the Investment Committee.
2. The purchase of securities on margin.
(i) Investment Custodial Credit Risk
Deposits are exposed to custodial credit risk if they are uninsured and uncollateralized. Custodial credit risk, is the risk that in the event of a failure of the counterparty, the Plan will not be able to recover the value of its investment or collateral securities that are in the possession of an outside party. Investment securities are exposed to custodial credit risk if the securities are uninsured, are not registered in the name of the Plan and are held by either the counterparty or the counterparty’s trust department or agent but not in the name of the Plan.
Consistent with the Plan’s investment policy, the investments are held by the Plan’s custodian and registered in the name of the Plan.
All of the Plan’s deposits are insured by the Federal Deposit Insurance Corporation and collateralized by securities held by a financial institution separate from the Plan’s depository financial institution.
(j) Commingled Funds/Mutual Funds
The Committee, in recognition of the benefits of commingled funds as investment vehicles (i.e., the ability to diversify more extensively than in a small, direct investment account and the lower costs which can be associated with these funds) may allow investment in such funds. The Committee recognizes that it cannot give specific policy directives to a fund whose policies are already established; therefore, the Committee is relying on the investment consultant to assess and monitor the investment policies of any funds used by the Plan to ascertain whether they are appropriate.
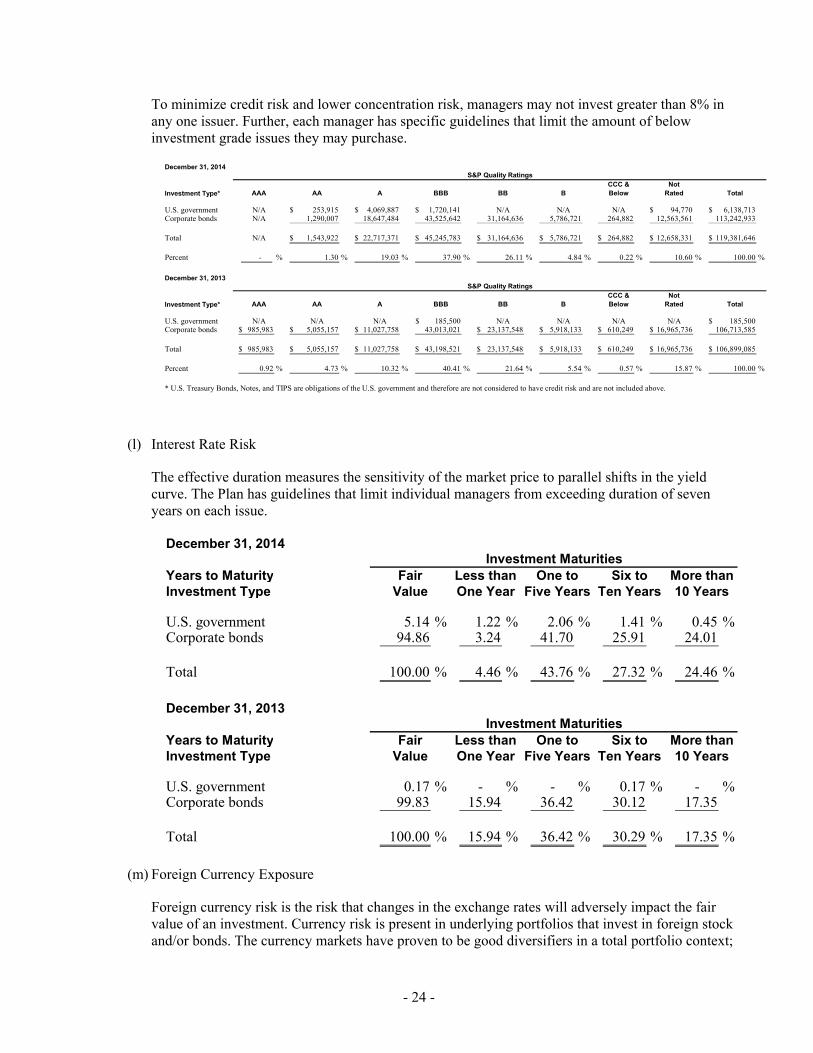
(k) Credit Risk
Generally, credit risk is the risk that an issuer of an investment will not fulfill its obligation to the holder of the investment. Credit risk is measured by the assignment of a rating by a nationally recognized rating organization, and by each bond manager’s internal research group.
- 24 -
To minimize credit risk and lower concentration risk, managers may not invest greater than 8% in any one issuer. Further, each manager has specific guidelines that limit the amount of below investment grade issues they may purchase.
December 31, 2014
CCC & NotInvestment Type* AAA AA A BBB BB B Below Rated Total
U.S. government N/A 253,915$ 4,069,887$ 1,720,141$ N/A N/A N/A 94,770$ 6,138,713$ Corporate bonds N/A 1,290,007 18,647,484 43,525,642 31,164,636 5,786,721 264,882 12,563,561 113,242,933
Total N/A 1,543,922$ 22,717,371$ 45,245,783$ 31,164,636$ 5,786,721$ 264,882$ 12,658,331$ 119,381,646$
Percent - % 1.30 % 19.03 % 37.90 % 26.11 % 4.84 % 0.22 % 10.60 % 100.00 %
December 31, 2013
CCC & NotInvestment Type* AAA AA A BBB BB B Below Rated Total
U.S. government N/A N/A N/A 185,500$ N/A N/A N/A N/A 185,500$ Corporate bonds 985,983$ 5,055,157$ 11,027,758$ 43,013,021 23,137,548$ 5,918,133$ 610,249$ 16,965,736$ 106,713,585
Total 985,983$ 5,055,157$ 11,027,758$ 43,198,521$ 23,137,548$ 5,918,133$ 610,249$ 16,965,736$ 106,899,085$
Percent 0.92 % 4.73 % 10.32 % 40.41 % 21.64 % 5.54 % 0.57 % 15.87 % 100.00 %
* U.S. Treasury Bonds, Notes, and TIPS are obligations of the U.S. government and therefore are not considered to have credit risk and are not included above.
S&P Quality Ratings
S&P Quality Ratings
(l) Interest Rate Risk
The effective duration measures the sensitivity of the market price to parallel shifts in the yield curve. The Plan has guidelines that limit individual managers from exceeding duration of seven years on each issue.
December 31, 2014
Years to Maturity Fair Less than One to Six to More thanInvestment Type Value One Year Five Years Ten Years 10 Years
U.S. government 5.14 % 1.22 % 2.06 % 1.41 % 0.45 % Corporate bonds 94.86 3.24 41.70 25.91 24.01
Total 100.00 % 4.46 % 43.76 % 27.32 % 24.46 %
December 31, 2013
Years to Maturity Fair Less than One to Six to More thanInvestment Type Value One Year Five Years Ten Years 10 Years
U.S. government 0.17 % - % - % 0.17 % - %Corporate bonds 99.83 15.94 36.42 30.12 17.35
Total 100.00 % 15.94 % 36.42 % 30.29 % 17.35 %
Investment Maturities
Investment Maturities
(m) Foreign Currency Exposure
Foreign currency risk is the risk that changes in the exchange rates will adversely impact the fair value of an investment. Currency risk is present in underlying portfolios that invest in foreign stock and/or bonds. The currency markets have proven to be good diversifiers in a total portfolio context;
- 25 -
therefore, the Plan has numerous managers that invest globally. In general, currency exposure is viewed as a benefit for its diversification reasons not as an inherent risk within the portfolio.
(n) Alternative Investments
Alternative investments are broadly categorized into the following 5 categories:
1. Opportunistic 2. Real assets 3. Real estate 4. Absolute return 5. Private equity
Common features of alternative investments are illiquidity, the use of derivatives, leverage and shorting, limited regulatory oversight, limited transparency, and high fees. In order to compensate for these risks, these investments offer diversification and potentially higher rates of return over time.
Rate of Return—For the year ended December 31, 2014, the annual money-weighted rate of return on pension plan investments, net of pension plan investment expense, was 4.95%. The money-weighted rate of return expresses investment performance, net of investment expense, adjusted for the changing amounts actually invested.
- 26 -
The MaBSTOA Investment Committee has adopted a policy that shall define an investment strategy to be a “hedge fund” if that strategy demonstrates at least five characteristics of traditional hedge funds:
1. Global opportunity set: Strategy can invest in a wide range of global assets 2. The ability to short: Investment technique that profits when prices decline 3. The ability to use leverage: Investment technique that magnifies exposures 4. High fees: Management and carried interests 5. Limited transparency: Limitations on ability to confirm underlying security positions 6. Conditional liquidity: The ability to suspend withdrawal requests 7. Lock-ups and gates: Restrictions on withdrawal requests 8. Limited independent pricing: Security prices may not be determined by independent party 9. Sub-optimal legal structure: Uncommon investment vehicles (e.g. offshore LLC) 10. Unfavorable investor terms: Less investor protection and recourse actions
A strategy exhibiting less than five characteristics may or may not be defined as a “hedge fund” as the final decision is generally evaluated and executed in accordance with the investment strategy as a whole. Furthermore, any strategy exhibiting characteristic #5 (lack of transparency) or #8 (lack of independent pricing) shall automatically be defined as a “hedge fund” regardless of the total count.
4. CONTRIBUTIONS
The financial objective of the Plan is to fund, on an actuarial basis, the retirement and death benefits for eligible MaBSTOA employees and beneficiaries. MaBSTOA contributions to the fund are made annually. Contributions to MaBSTOA require the approval of the MaBSTOA Board.
Employer contributions amounted to $226.4 million and $234.5 million for the years ended December 31, 2014 and 2013, respectively. Employee contributions amounted to $15.5 million and $12.8 million for the years ended December 31, 2014 and 2013, respectively. Contributions made by employees are accounted for in separate accounts maintained for each employee. Annually, these accounts are credited with interest at 5%. Effective April 1, 1990, MaBSTOA began to deduct employee contributions as pretax contributions under Section 414H of the Internal Revenue Code.
Pursuant to Section 7.03 of the MaBSTOA Plan, active plan members are permitted to borrow up to 75% of their contributions with interest. Their total contributions and interest remain intact and interest continues to accrue on the full balance. The participant’s accumulated contribution account is used as collateral against the loan. The Plan granted $16.9 million and $19.1 million in loans to members during 2014 and 2013, respectively. Loan repayments by members amounted to $16.1 million and $15.9 million in 2014 and 2013, respectively.
For the year-ended December 31, 2014, the Plans’ contribution rate was 36.73% of the covered payroll.
Upon termination of employment before retirement, certain participants are entitled to refunds of their own contributions including accumulated interest less any loans outstanding.
- 27 -
5. NET PENSION LIABILITY
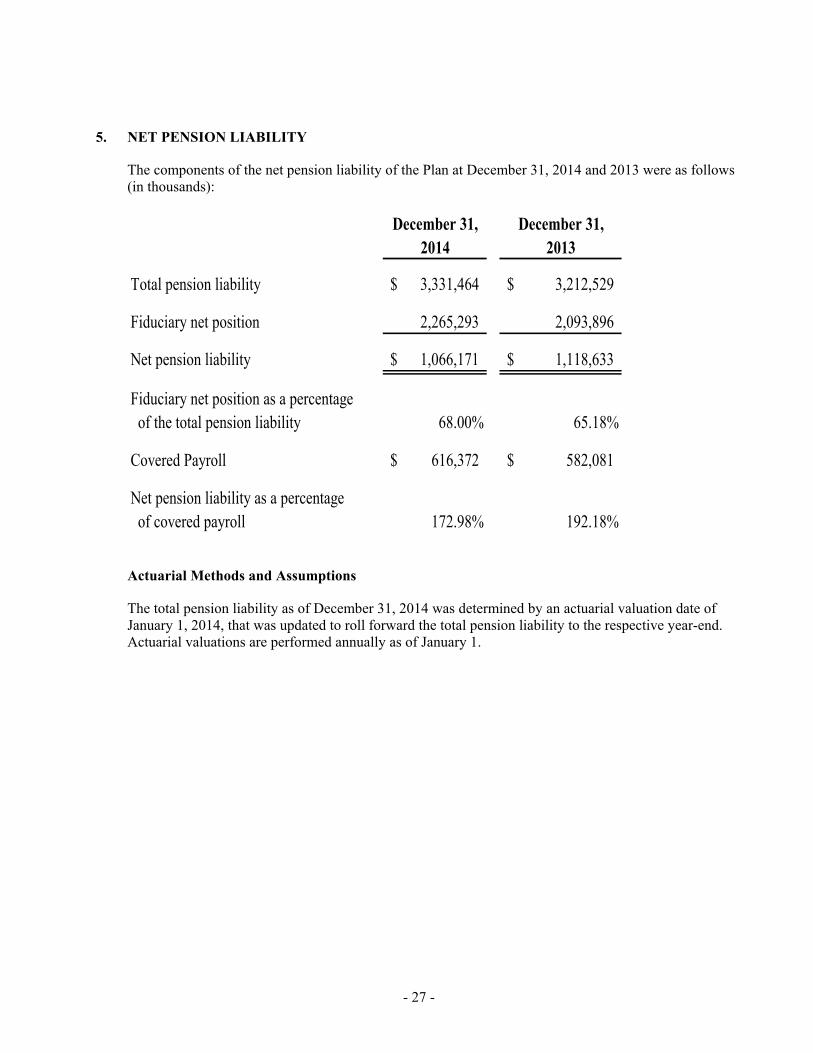
The components of the net pension liability of the Plan at December 31, 2014 and 2013 were as follows (in thousands):
December 31, December 31,2014 2013
Total pension liability 3,331,464$ 3,212,529$
Fiduciary net position 2,265,293 2,093,896
Net pension liability 1,066,171$ 1,118,633$
Fiduciary net position as a percentage of the total pension liability 68.00% 65.18%
Covered Payroll 616,372$ 582,081$
Net pension liability as a percentage of covered payroll 172.98% 192.18%
Actuarial Methods and Assumptions
The total pension liability as of December 31, 2014 was determined by an actuarial valuation date of January 1, 2014, that was updated to roll forward the total pension liability to the respective year-end. Actuarial valuations are performed annually as of January 1.
- 28 -
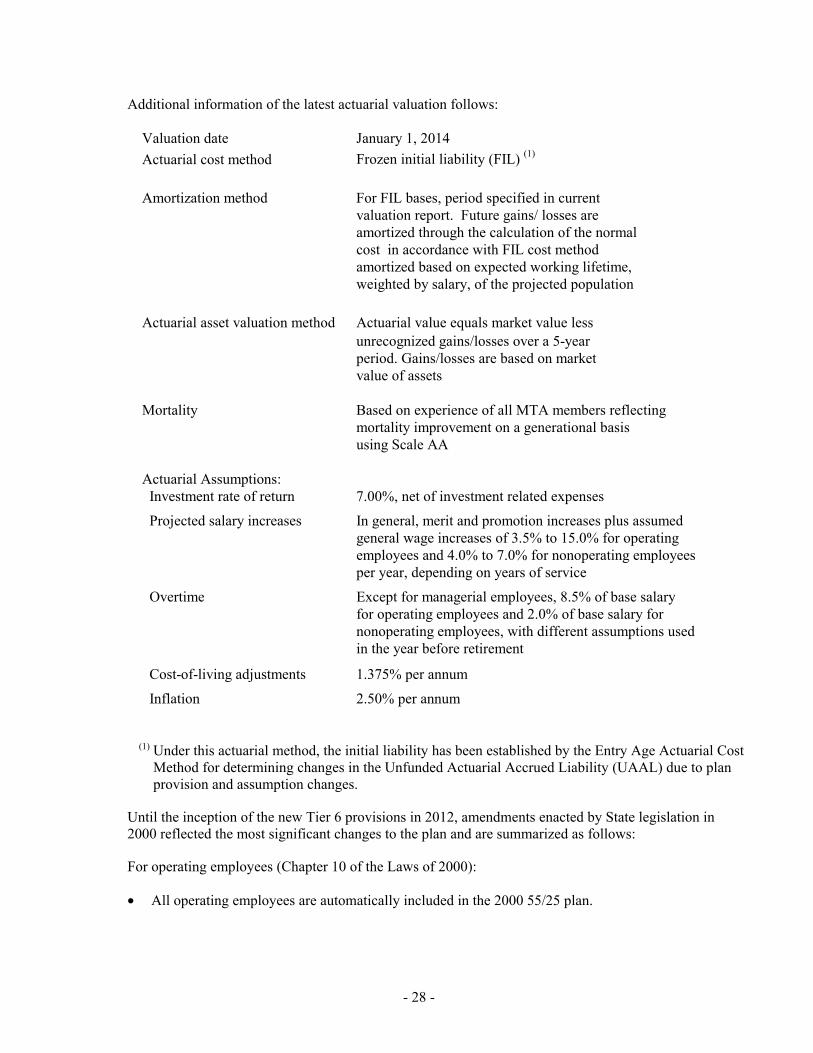
Additional information of the latest actuarial valuation follows:
Valuation date January 1, 2014Actuarial cost method Frozen initial liability (FIL) (1)
Amortization method For FIL bases, period specified in current valuation report. Future gains/ losses are amortized through the calculation of the normalcost in accordance with FIL cost methodamortized based on expected working lifetime,weighted by salary, of the projected population
Actuarial asset valuation method Actuarial value equals market value lessunrecognized gains/losses over a 5-yearperiod. Gains/losses are based on marketvalue of assets
Mortality Based on experience of all MTA members reflectingmortality improvement on a generational basisusing Scale AA
Actuarial Assumptions: Investment rate of return 7.00%, net of investment related expenses Projected salary increases In general, merit and promotion increases plus assumed
general wage increases of 3.5% to 15.0% for operating employees and 4.0% to 7.0% for nonoperating employeesper year, depending on years of service
Overtime Except for managerial employees, 8.5% of base salaryfor operating employees and 2.0% of base salary for nonoperating employees, with different assumptions used in the year before retirement
Cost-of-living adjustments 1.375% per annum Inflation 2.50% per annum
(1) Under this actuarial method, the initial liability has been established by the Entry Age Actuarial Cost
Method for determining changes in the Unfunded Actuarial Accrued Liability (UAAL) due to plan provision and assumption changes.
Until the inception of the new Tier 6 provisions in 2012, amendments enacted by State legislation in 2000 reflected the most significant changes to the plan and are summarized as follows:
For operating employees (Chapter 10 of the Laws of 2000):
• All operating employees are automatically included in the 2000 55/25 plan.
- 29 -
• Elimination of the 2.3% additional employees’ contributions applicable to members of the 55/25 plan.
• Reduction in the Tier 3 and 4 employee contribution rate from 3.0% to 2.0%.
For managerial and nonoperating employees (Chapter 126 of the Laws of 2000):
• Vesting under the Age 57 plan required only five years of service versus ten.
• As of October 1, 2000, regular Tier 3 and 4 employee contributions ceased after the completion of ten years of service.
For retired members (Chapter 125 of the Laws of 2000):
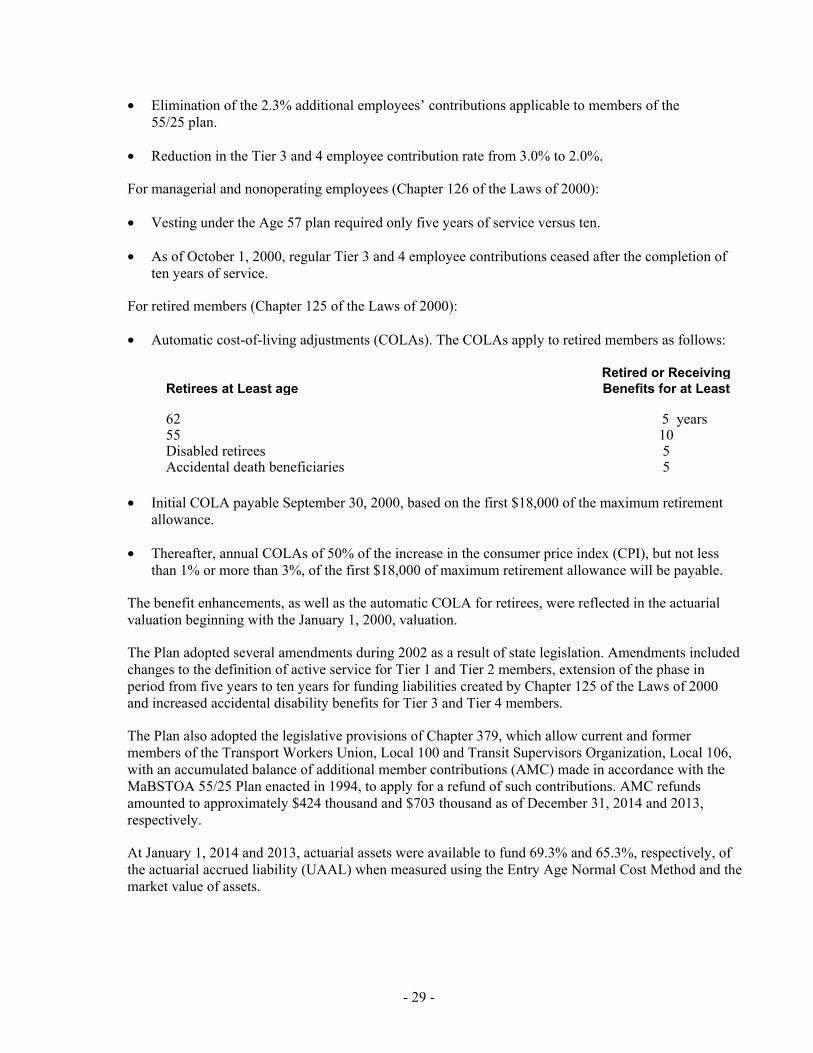
• Automatic cost-of-living adjustments (COLAs). The COLAs apply to retired members as follows:
Retired or ReceivingRetirees at Least age Benefits for at Least
62 5 years55 10Disabled retirees 5Accidental death beneficiaries 5
• Initial COLA payable September 30, 2000, based on the first $18,000 of the maximum retirement allowance.
• Thereafter, annual COLAs of 50% of the increase in the consumer price index (CPI), but not less than 1% or more than 3%, of the first $18,000 of maximum retirement allowance will be payable.
The benefit enhancements, as well as the automatic COLA for retirees, were reflected in the actuarial valuation beginning with the January 1, 2000, valuation.
The Plan adopted several amendments during 2002 as a result of state legislation. Amendments included changes to the definition of active service for Tier 1 and Tier 2 members, extension of the phase in period from five years to ten years for funding liabilities created by Chapter 125 of the Laws of 2000 and increased accidental disability benefits for Tier 3 and Tier 4 members.
The Plan also adopted the legislative provisions of Chapter 379, which allow current and former members of the Transport Workers Union, Local 100 and Transit Supervisors Organization, Local 106, with an accumulated balance of additional member contributions (AMC) made in accordance with the MaBSTOA 55/25 Plan enacted in 1994, to apply for a refund of such contributions. AMC refunds amounted to approximately $424 thousand and $703 thousand as of December 31, 2014 and 2013, respectively.
At January 1, 2014 and 2013, actuarial assets were available to fund 69.3% and 65.3%, respectively, of the actuarial accrued liability (UAAL) when measured using the Entry Age Normal Cost Method and the market value of assets.
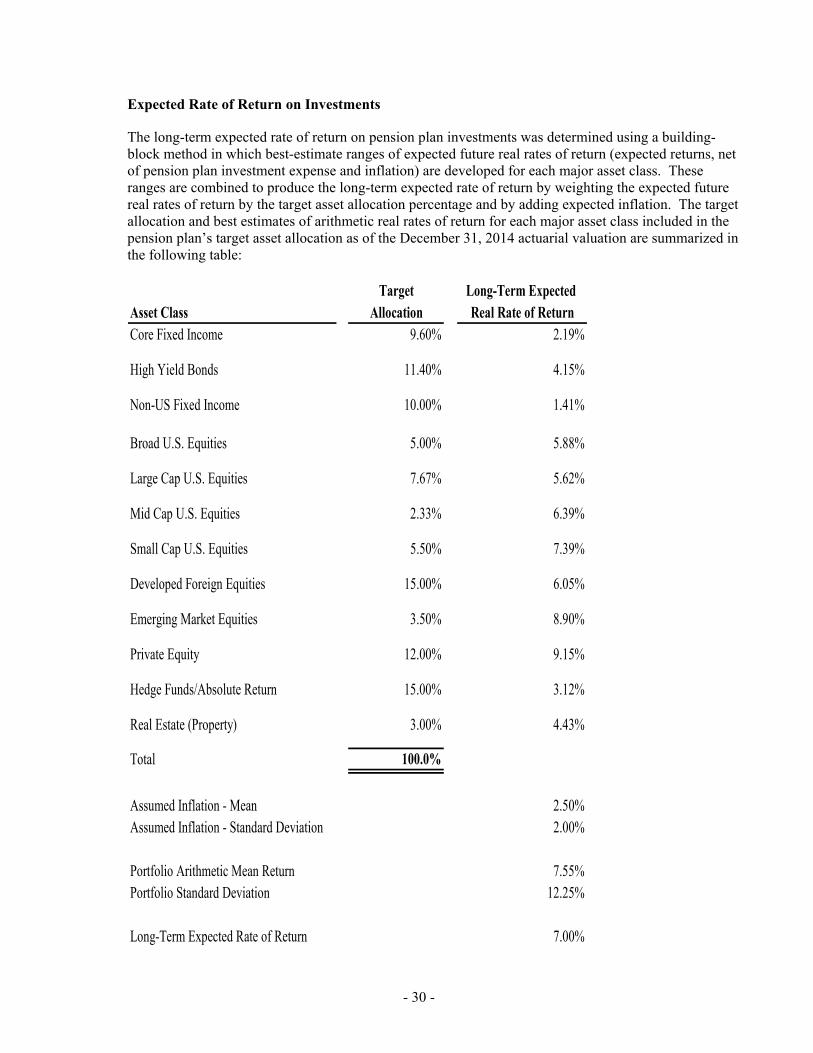
- 30 -
Expected Rate of Return on Investments
The long-term expected rate of return on pension plan investments was determined using a building-block method in which best-estimate ranges of expected future real rates of return (expected returns, net of pension plan investment expense and inflation) are developed for each major asset class. These ranges are combined to produce the long-term expected rate of return by weighting the expected future real rates of return by the target asset allocation percentage and by adding expected inflation. The target allocation and best estimates of arithmetic real rates of return for each major asset class included in the pension plan’s target asset allocation as of the December 31, 2014 actuarial valuation are summarized in the following table:
Target Long-Term Expected Asset Class Allocation Real Rate of ReturnCore Fixed Income 9.60% 2.19%
High Yield Bonds 11.40% 4.15%
Non-US Fixed Income 10.00% 1.41%
Broad U.S. Equities 5.00% 5.88%
Large Cap U.S. Equities 7.67% 5.62%
Mid Cap U.S. Equities 2.33% 6.39%
Small Cap U.S. Equities 5.50% 7.39%
Developed Foreign Equities 15.00% 6.05%
Emerging Market Equities 3.50% 8.90%
Private Equity 12.00% 9.15%
Hedge Funds/Absolute Return 15.00% 3.12%
Real Estate (Property) 3.00% 4.43%
Total 100.0%
Assumed Inflation - Mean 2.50%Assumed Inflation - Standard Deviation 2.00%
Portfolio Arithmetic Mean Return 7.55%Portfolio Standard Deviation 12.25%
Long-Term Expected Rate of Return 7.00%
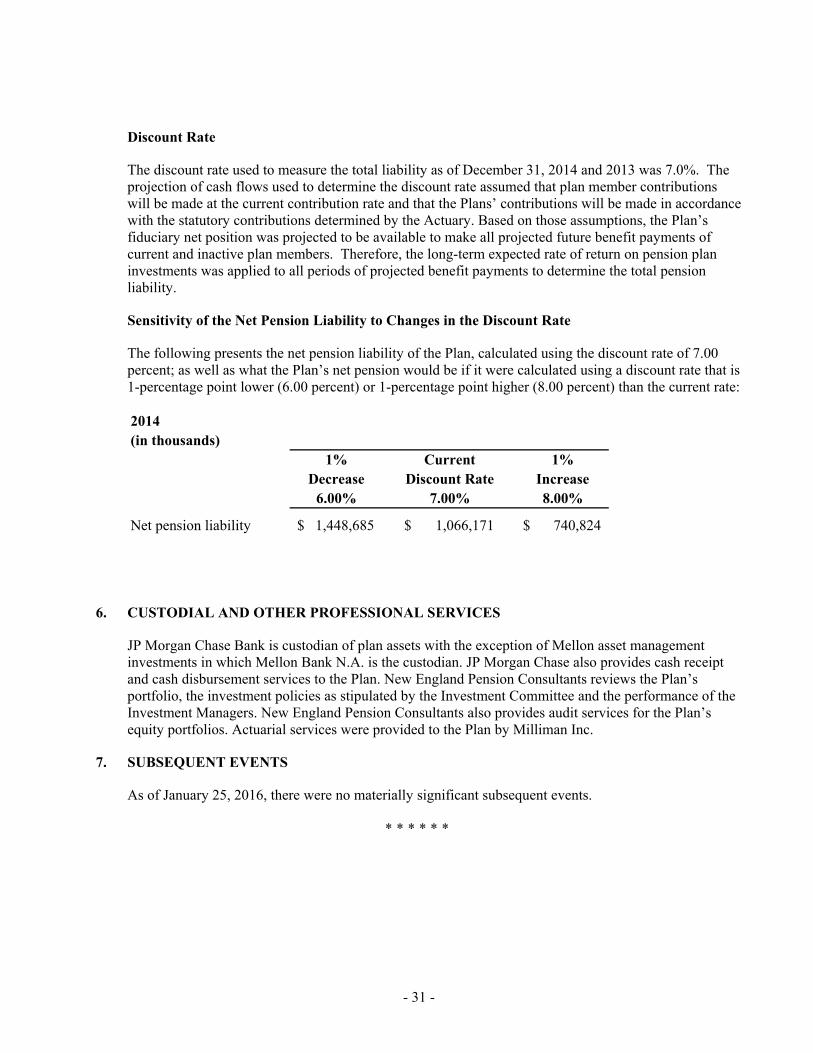
- 31 -
Discount Rate
The discount rate used to measure the total liability as of December 31, 2014 and 2013 was 7.0%. The projection of cash flows used to determine the discount rate assumed that plan member contributions will be made at the current contribution rate and that the Plans’ contributions will be made in accordance with the statutory contributions determined by the Actuary. Based on those assumptions, the Plan’s fiduciary net position was projected to be available to make all projected future benefit payments of current and inactive plan members. Therefore, the long-term expected rate of return on pension plan investments was applied to all periods of projected benefit payments to determine the total pension liability.
Sensitivity of the Net Pension Liability to Changes in the Discount Rate
The following presents the net pension liability of the Plan, calculated using the discount rate of 7.00 percent; as well as what the Plan’s net pension would be if it were calculated using a discount rate that is 1-percentage point lower (6.00 percent) or 1-percentage point higher (8.00 percent) than the current rate:
2014(in thousands)
1% Current 1%Decrease Discount Rate Increase
6.00% 7.00% 8.00%
Net pension liability 1,448,685$ 1,066,171$ 740,824$
6. CUSTODIAL AND OTHER PROFESSIONAL SERVICES
JP Morgan Chase Bank is custodian of plan assets with the exception of Mellon asset management investments in which Mellon Bank N.A. is the custodian. JP Morgan Chase also provides cash receipt and cash disbursement services to the Plan. New England Pension Consultants reviews the Plan’s portfolio, the investment policies as stipulated by the Investment Committee and the performance of the Investment Managers. New England Pension Consultants also provides audit services for the Plan’s equity portfolios. Actuarial services were provided to the Plan by Milliman Inc.
7. SUBSEQUENT EVENTS
As of January 25, 2016, there were no materially significant subsequent events.
* * * * * *
- 32 -
REQUIRED SUPPLEMENTARY INFORMATION (UNAUDITED)
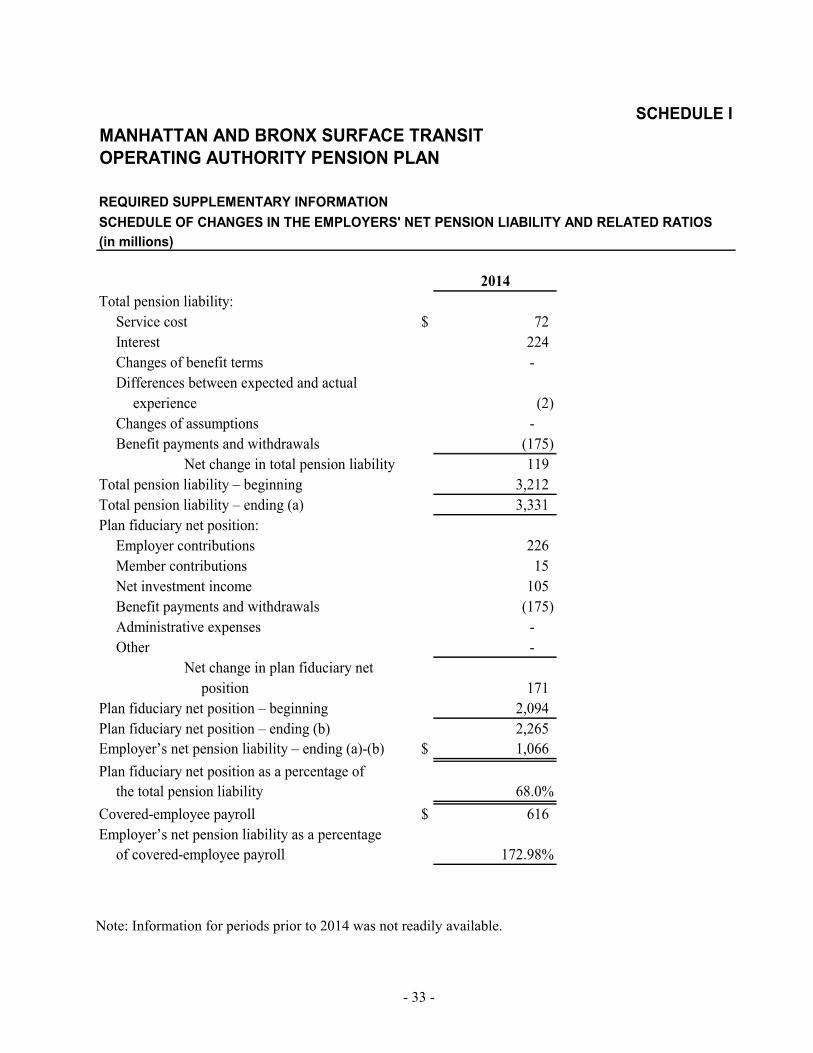
- 33 -
SCHEDULE IMANHATTAN AND BRONX SURFACE TRANSITOPERATING AUTHORITY PENSION PLAN
REQUIRED SUPPLEMENTARY INFORMATIONSCHEDULE OF CHANGES IN THE EMPLOYERS' NET PENSION LIABILITY AND RELATED RATIOS(in millions)
2014Total pension liability:
Service cost $ 72 Interest 224 Changes of benefit terms - Differences between expected and actual
experience (2) Changes of assumptions - Benefit payments and withdrawals (175)
Net change in total pension liability 119 Total pension liability – beginning 3,212 Total pension liability – ending (a) 3,331 Plan fiduciary net position:
Employer contributions 226 Member contributions 15 Net investment income 105 Benefit payments and withdrawals (175) Administrative expenses - Other -
Net change in plan fiduciary netposition 171
Plan fiduciary net position – beginning 2,094 Plan fiduciary net position – ending (b) 2,265 Employer’s net pension liability – ending (a)-(b) $ 1,066 Plan fiduciary net position as a percentage of
the total pension liability 68.0%Covered-employee payroll $ 616 Employer’s net pension liability as a percentage
of covered-employee payroll 172.98% Note: Information for periods prior to 2014 was not readily available.
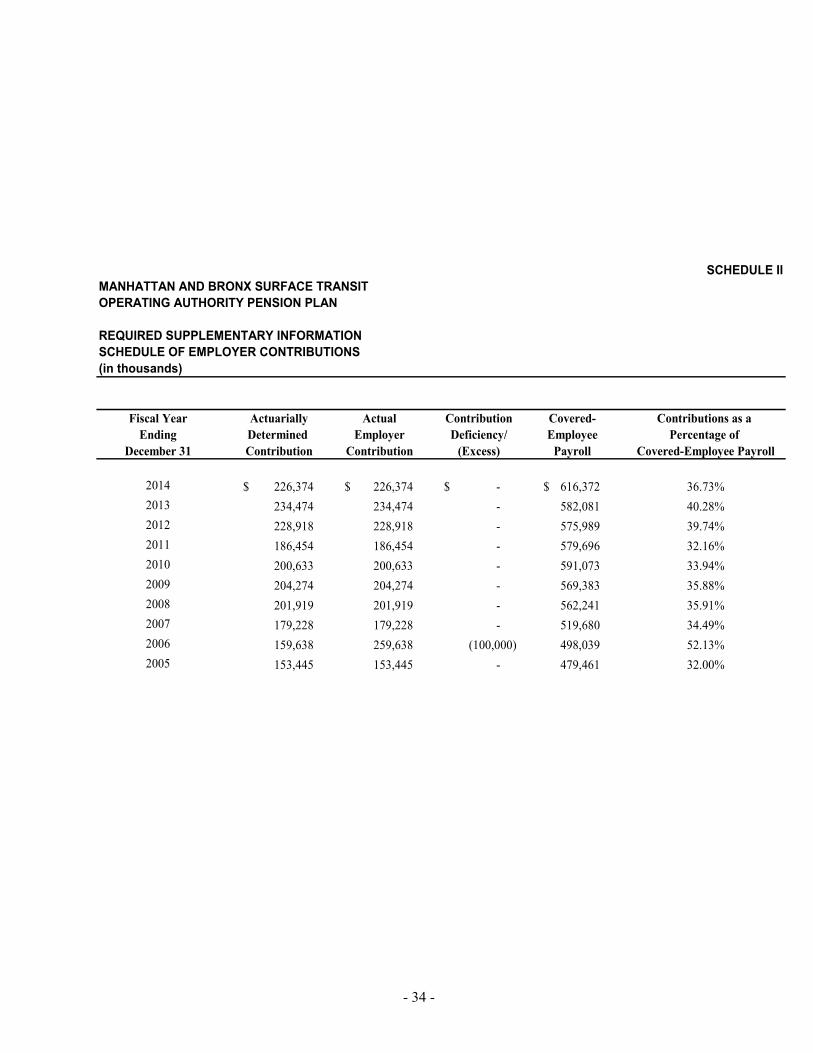
- 34 -
SCHEDULE IIMANHATTAN AND BRONX SURFACE TRANSITOPERATING AUTHORITY PENSION PLAN
REQUIRED SUPPLEMENTARY INFORMATIONSCHEDULE OF EMPLOYER CONTRIBUTIONS (in thousands)
Fiscal Year Actuarially Actual Contribution Covered- Contributions as a Ending Determined Employer Deficiency/ Employee Percentage of
December 31 Contribution Contribution (Excess) Payroll Covered-Employee Payroll
2014 226,374$ 226,374$ -$ 616,372$ 36.73%2013 234,474 234,474 - 582,081 40.28%2012 228,918 228,918 - 575,989 39.74%2011 186,454 186,454 - 579,696 32.16%2010 200,633 200,633 - 591,073 33.94%2009 204,274 204,274 - 569,383 35.88%2008 201,919 201,919 - 562,241 35.91%2007 179,228 179,228 - 519,680 34.49%2006 159,638 259,638 (100,000) 498,039 52.13%2005 153,445 153,445 - 479,461 32.00%
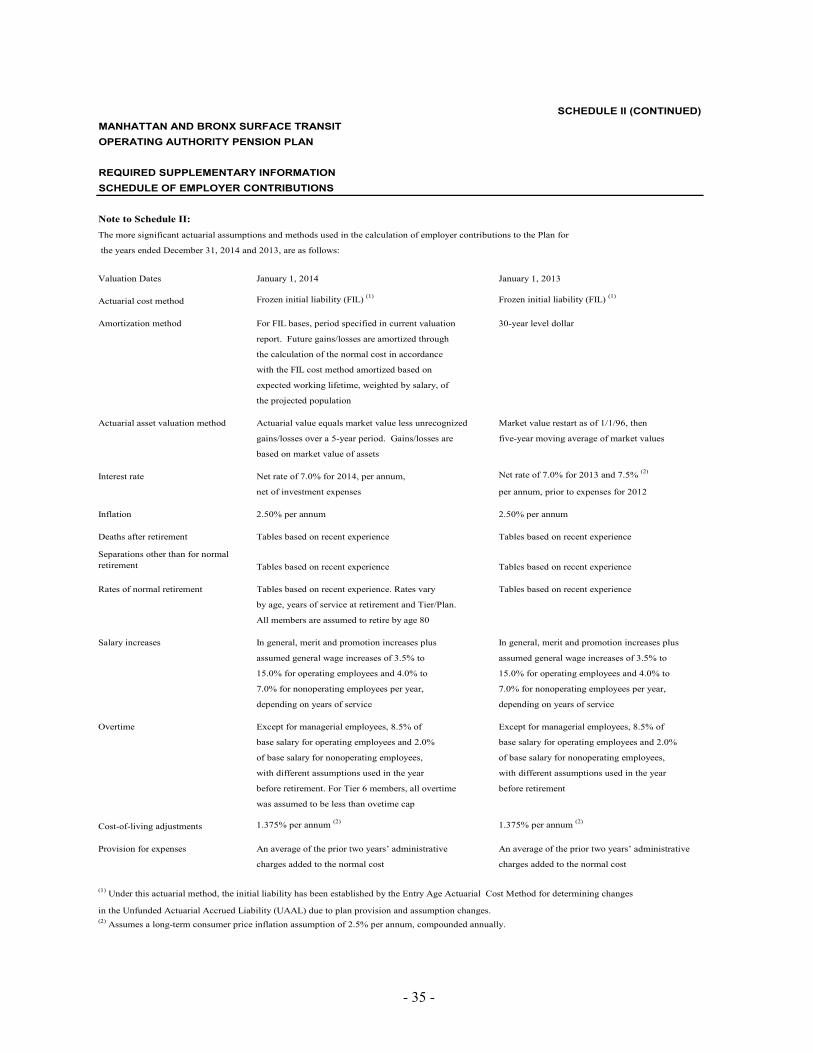
- 35 -
SCHEDULE II (CONTINUED)MANHATTAN AND BRONX SURFACE TRANSITOPERATING AUTHORITY PENSION PLAN
REQUIRED SUPPLEMENTARY INFORMATIONSCHEDULE OF EMPLOYER CONTRIBUTIONS
Note to Schedule II:The more significant actuarial assumptions and methods used in the calculation of employer contributions to the Plan for
the years ended December 31, 2014 and 2013, are as follows:
Valuation Dates January 1, 2014 January 1, 2013
Actuarial cost method Frozen initial liability (FIL) (1) Frozen initial liability (FIL) (1)
Amortization method For FIL bases, period specified in current valuation 30-year level dollar
report. Future gains/losses are amortized through
the calculation of the normal cost in accordance
with the FIL cost method amortized based on
expected working lifetime, weighted by salary, of
the projected population
Actuarial asset valuation method Actuarial value equals market value less unrecognized Market value restart as of 1/1/96, then
gains/losses over a 5-year period. Gains/losses are five-year moving average of market values
based on market value of assets
Interest rate Net rate of 7.0% for 2014, per annum, Net rate of 7.0% for 2013 and 7.5% (2)
net of investment expenses per annum, prior to expenses for 2012
Inflation 2.50% per annum 2.50% per annum
Deaths after retirement Tables based on recent experience Tables based on recent experience
Separations other than for normal retirement Tables based on recent experience Tables based on recent experience
Rates of normal retirement Tables based on recent experience. Rates vary Tables based on recent experience
by age, years of service at retirement and Tier/Plan.
All members are assumed to retire by age 80
Salary increases In general, merit and promotion increases plus In general, merit and promotion increases plus
assumed general wage increases of 3.5% to assumed general wage increases of 3.5% to
15.0% for operating employees and 4.0% to 15.0% for operating employees and 4.0% to
7.0% for nonoperating employees per year, 7.0% for nonoperating employees per year,
depending on years of service depending on years of service
Overtime Except for managerial employees, 8.5% of Except for managerial employees, 8.5% of
base salary for operating employees and 2.0% base salary for operating employees and 2.0%
of base salary for nonoperating employees, of base salary for nonoperating employees,
with different assumptions used in the year with different assumptions used in the year
before retirement. For Tier 6 members, all overtime before retirement
was assumed to be less than ovetime cap
Cost-of-living adjustments 1.375% per annum (2) 1.375% per annum (2)
Provision for expenses An average of the prior two years’ administrative An average of the prior two years’ administrative
charges added to the normal cost charges added to the normal cost
(1) Under this actuarial method, the initial liability has been established by the Entry Age Actuarial Cost Method for determining changes
in the Unfunded Actuarial Accrued Liability (UAAL) due to plan provision and assumption changes.(2) Assumes a long-term consumer price inflation assumption of 2.5% per annum, compounded annually.
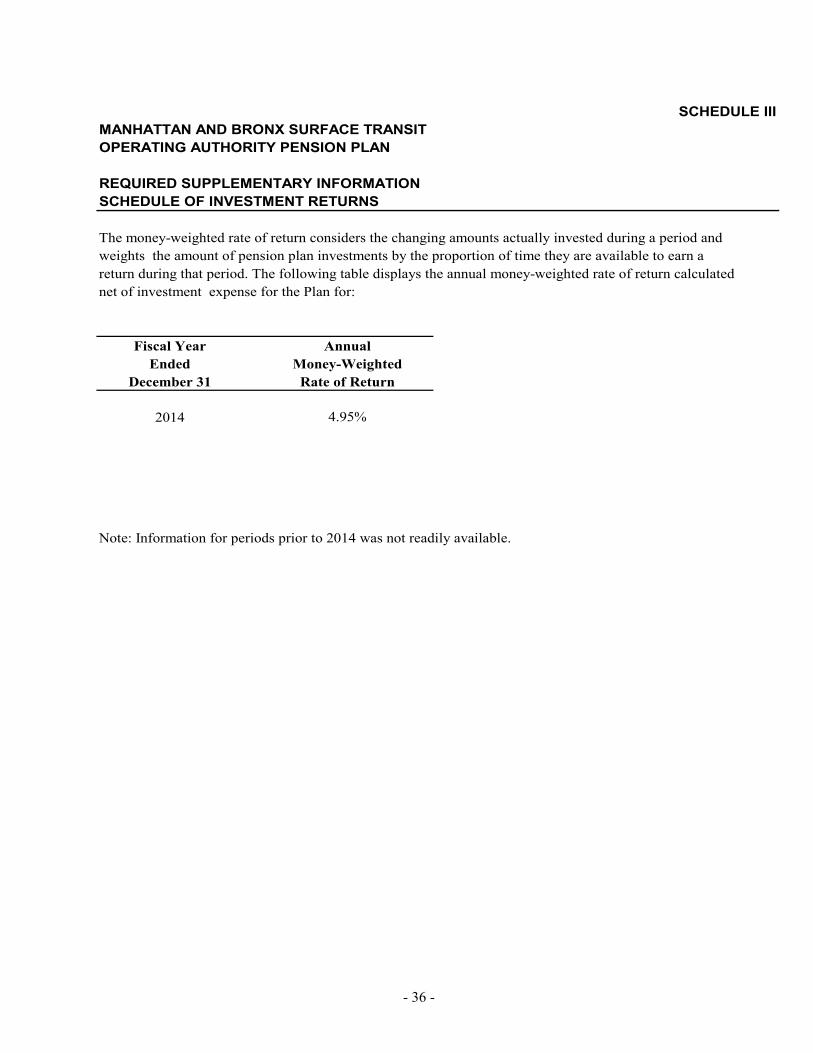
- 36 -
SCHEDULE IIIMANHATTAN AND BRONX SURFACE TRANSITOPERATING AUTHORITY PENSION PLAN
REQUIRED SUPPLEMENTARY INFORMATION SCHEDULE OF INVESTMENT RETURNS
The money-weighted rate of return considers the changing amounts actually invested during a period and weights the amount of pension plan investments by the proportion of time they are available to earn a return during that period. The following table displays the annual money-weighted rate of return calculated net of investment expense for the Plan for:
Fiscal Year AnnualEnded Money-Weighted
December 31 Rate of Return
2014 4.95%
Note: Information for periods prior to 2014 was not readily available.

- 37 -
SUPPLEMENTARY INFORMATION (UNAUDITED)
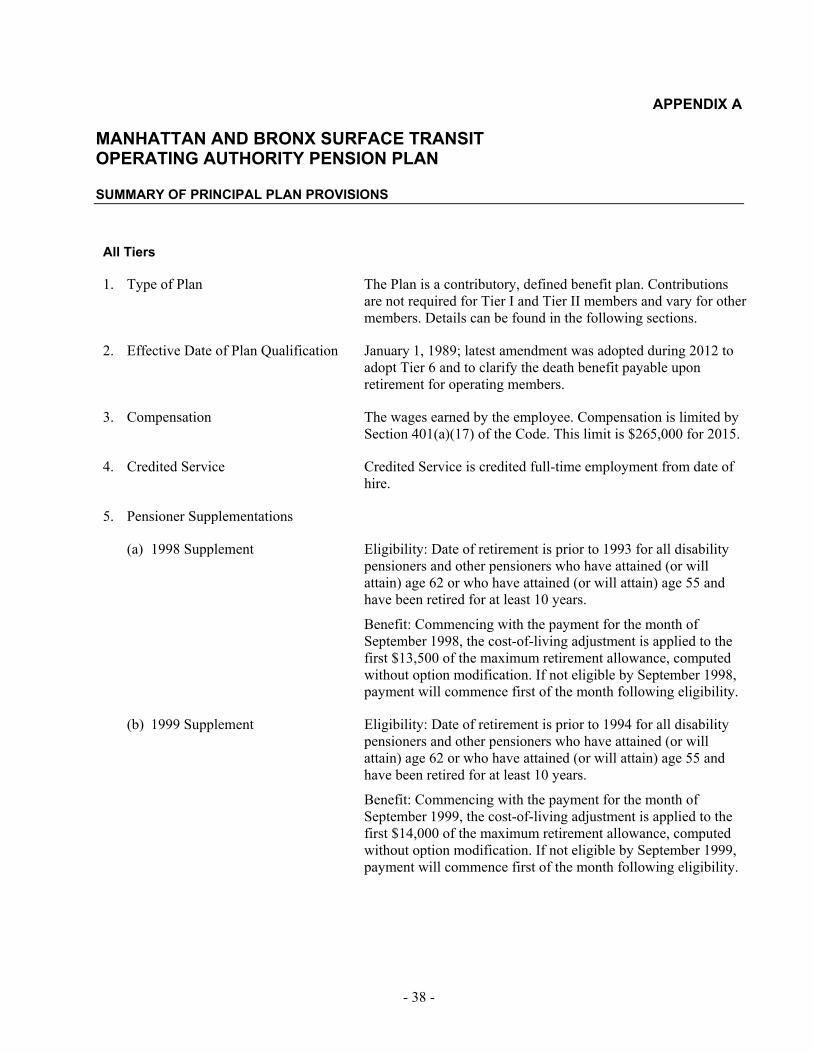
- 38 -
APPENDIX A
MANHATTAN AND BRONX SURFACE TRANSIT OPERATING AUTHORITY PENSION PLAN
SUMMARY OF PRINCIPAL PLAN PROVISIONS
All Tiers
1. Type of Plan The Plan is a contributory, defined benefit plan. Contributions are not required for Tier I and Tier II members and vary for other members. Details can be found in the following sections.
2. Effective Date of Plan Qualification January 1, 1989; latest amendment was adopted during 2012 to adopt Tier 6 and to clarify the death benefit payable upon retirement for operating members.
3. Compensation The wages earned by the employee. Compensation is limited by Section 401(a)(17) of the Code. This limit is $265,000 for 2015.
4. Credited Service Credited Service is credited full-time employment from date of hire.
5. Pensioner Supplementations
(a) 1998 Supplement Eligibility: Date of retirement is prior to 1993 for all disability pensioners and other pensioners who have attained (or will attain) age 62 or who have attained (or will attain) age 55 and have been retired for at least 10 years.
Benefit: Commencing with the payment for the month of September 1998, the cost-of-living adjustment is applied to the first $13,500 of the maximum retirement allowance, computed without option modification. If not eligible by September 1998, payment will commence first of the month following eligibility.
(b) 1999 Supplement Eligibility: Date of retirement is prior to 1994 for all disability pensioners and other pensioners who have attained (or will attain) age 62 or who have attained (or will attain) age 55 and have been retired for at least 10 years.
Benefit: Commencing with the payment for the month of September 1999, the cost-of-living adjustment is applied to the first $14,000 of the maximum retirement allowance, computed without option modification. If not eligible by September 1999, payment will commence first of the month following eligibility.
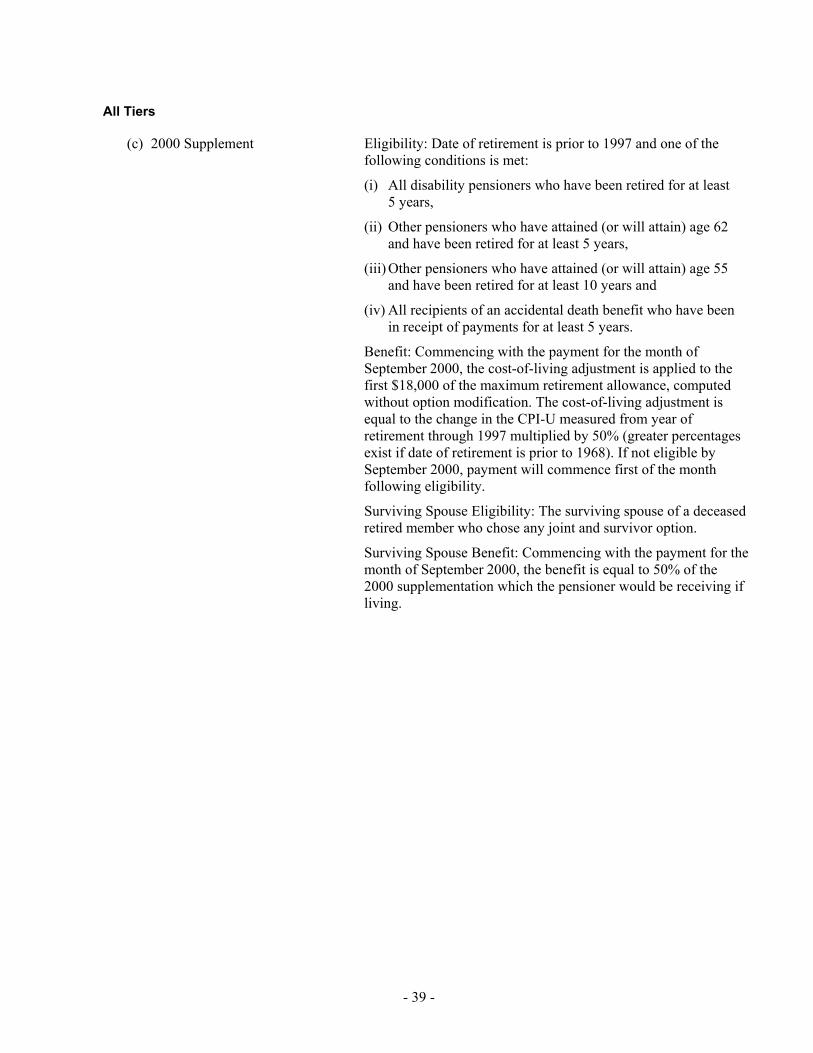
- 39 -
All Tiers
(c) 2000 Supplement Eligibility: Date of retirement is prior to 1997 and one of the following conditions is met:
(i) All disability pensioners who have been retired for at least 5 years,
(ii) Other pensioners who have attained (or will attain) age 62 and have been retired for at least 5 years,
(iii) Other pensioners who have attained (or will attain) age 55 and have been retired for at least 10 years and
(iv) All recipients of an accidental death benefit who have been in receipt of payments for at least 5 years.
Benefit: Commencing with the payment for the month of September 2000, the cost-of-living adjustment is applied to the first $18,000 of the maximum retirement allowance, computed without option modification. The cost-of-living adjustment is equal to the change in the CPI-U measured from year of retirement through 1997 multiplied by 50% (greater percentages exist if date of retirement is prior to 1968). If not eligible by September 2000, payment will commence first of the month following eligibility.
Surviving Spouse Eligibility: The surviving spouse of a deceased retired member who chose any joint and survivor option.
Surviving Spouse Benefit: Commencing with the payment for the month of September 2000, the benefit is equal to 50% of the 2000 supplementation which the pensioner would be receiving if living.
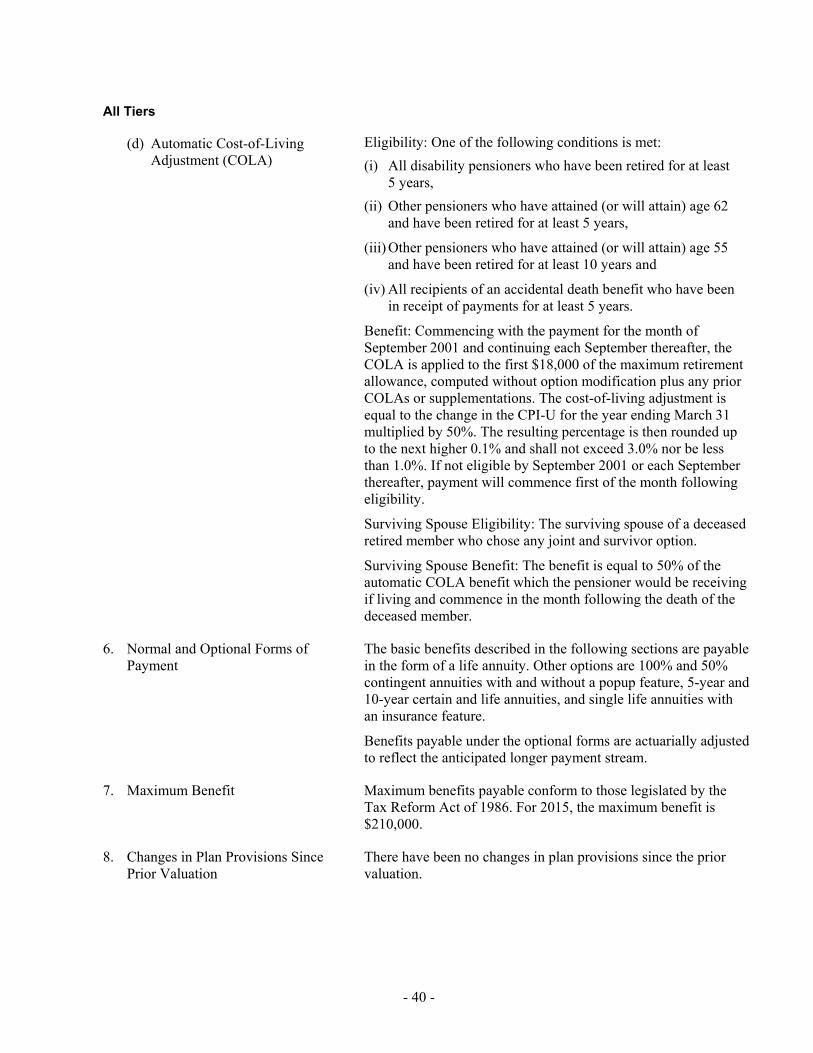
- 40 -
All Tiers
(d) Automatic Cost-of-Living Adjustment (COLA)
Eligibility: One of the following conditions is met: (i) All disability pensioners who have been retired for at least
5 years, (ii) Other pensioners who have attained (or will attain) age 62
and have been retired for at least 5 years,
(iii) Other pensioners who have attained (or will attain) age 55 and have been retired for at least 10 years and
(iv) All recipients of an accidental death benefit who have been in receipt of payments for at least 5 years.
Benefit: Commencing with the payment for the month of September 2001 and continuing each September thereafter, the COLA is applied to the first $18,000 of the maximum retirement allowance, computed without option modification plus any prior COLAs or supplementations. The cost-of-living adjustment is equal to the change in the CPI-U for the year ending March 31 multiplied by 50%. The resulting percentage is then rounded up to the next higher 0.1% and shall not exceed 3.0% nor be less than 1.0%. If not eligible by September 2001 or each September thereafter, payment will commence first of the month following eligibility.
Surviving Spouse Eligibility: The surviving spouse of a deceased retired member who chose any joint and survivor option.
Surviving Spouse Benefit: The benefit is equal to 50% of the automatic COLA benefit which the pensioner would be receiving if living and commence in the month following the death of the deceased member.
6. Normal and Optional Forms of Payment
The basic benefits described in the following sections are payable in the form of a life annuity. Other options are 100% and 50% contingent annuities with and without a popup feature, 5-year and 10-year certain and life annuities, and single life annuities with an insurance feature.
Benefits payable under the optional forms are actuarially adjusted to reflect the anticipated longer payment stream.
7. Maximum Benefit
Maximum benefits payable conform to those legislated by the Tax Reform Act of 1986. For 2015, the maximum benefit is $210,000.
8. Changes in Plan Provisions Since Prior Valuation
There have been no changes in plan provisions since the prior valuation.
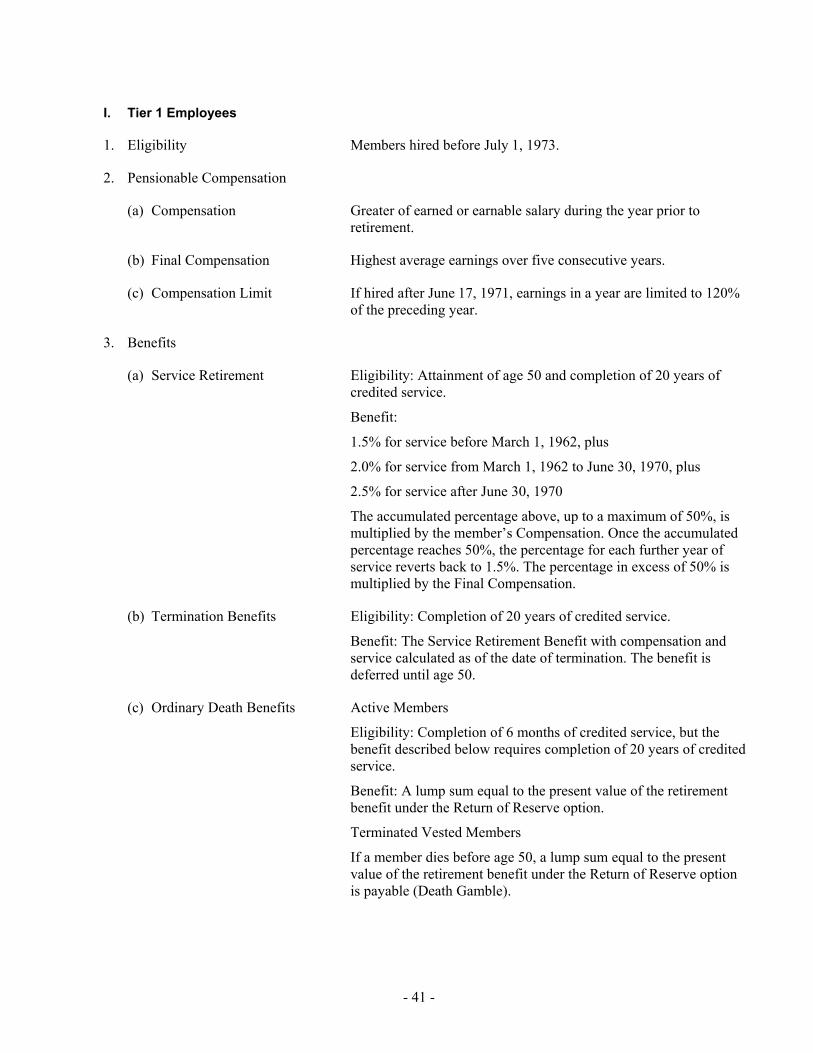
- 41 -
I. Tier 1 Employees
1. Eligibility Members hired before July 1, 1973.
2. Pensionable Compensation
(a) Compensation Greater of earned or earnable salary during the year prior to retirement.
(b) Final Compensation Highest average earnings over five consecutive years.
(c) Compensation Limit If hired after June 17, 1971, earnings in a year are limited to 120% of the preceding year.
3. Benefits
(a) Service Retirement Eligibility: Attainment of age 50 and completion of 20 years of credited service.
Benefit:
1.5% for service before March 1, 1962, plus
2.0% for service from March 1, 1962 to June 30, 1970, plus
2.5% for service after June 30, 1970
The accumulated percentage above, up to a maximum of 50%, is multiplied by the member’s Compensation. Once the accumulated percentage reaches 50%, the percentage for each further year of service reverts back to 1.5%. The percentage in excess of 50% is multiplied by the Final Compensation.
(b) Termination Benefits Eligibility: Completion of 20 years of credited service.
Benefit: The Service Retirement Benefit with compensation and service calculated as of the date of termination. The benefit is deferred until age 50.
(c) Ordinary Death Benefits Active Members
Eligibility: Completion of 6 months of credited service, but the benefit described below requires completion of 20 years of credited service.
Benefit: A lump sum equal to the present value of the retirement benefit under the Return of Reserve option.
Terminated Vested Members
If a member dies before age 50, a lump sum equal to the present value of the retirement benefit under the Return of Reserve option is payable (Death Gamble).
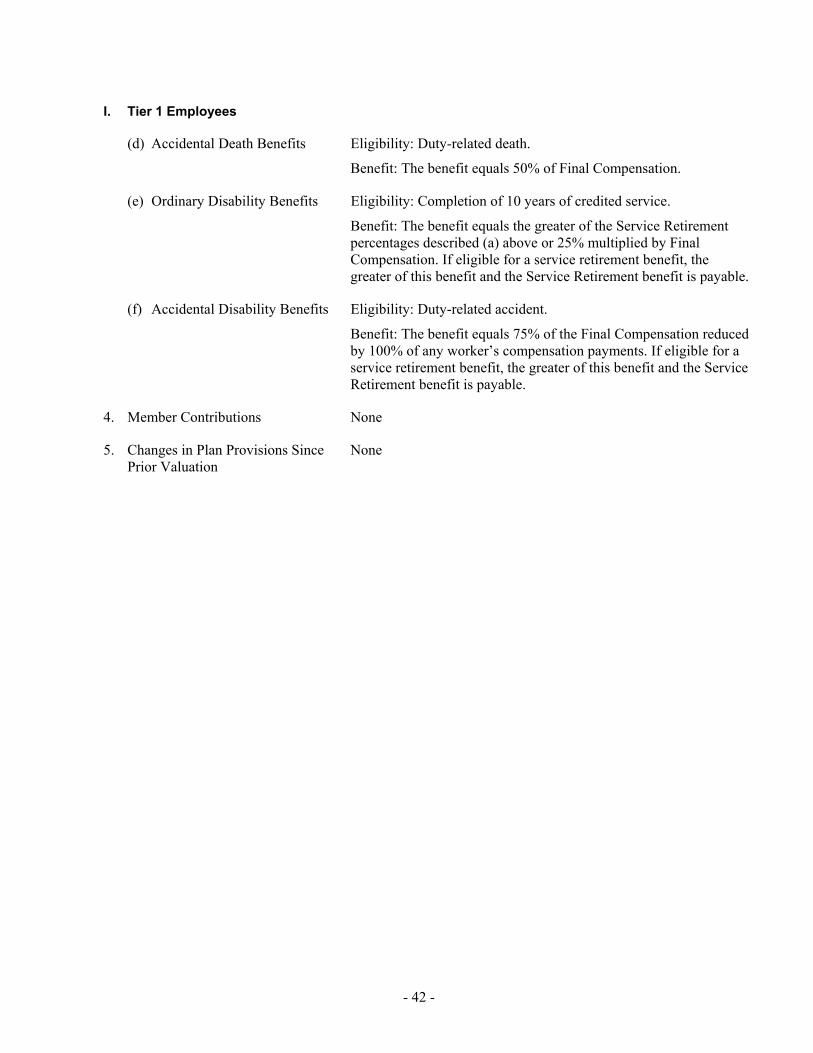
- 42 -
I. Tier 1 Employees
(d) Accidental Death Benefits Eligibility: Duty-related death.
Benefit: The benefit equals 50% of Final Compensation.
(e) Ordinary Disability Benefits Eligibility: Completion of 10 years of credited service.
Benefit: The benefit equals the greater of the Service Retirement percentages described (a) above or 25% multiplied by Final Compensation. If eligible for a service retirement benefit, the greater of this benefit and the Service Retirement benefit is payable.
(f) Accidental Disability Benefits Eligibility: Duty-related accident.
Benefit: The benefit equals 75% of the Final Compensation reduced by 100% of any worker’s compensation payments. If eligible for a service retirement benefit, the greater of this benefit and the Service Retirement benefit is payable.
4. Member Contributions None
5. Changes in Plan Provisions Since Prior Valuation
None
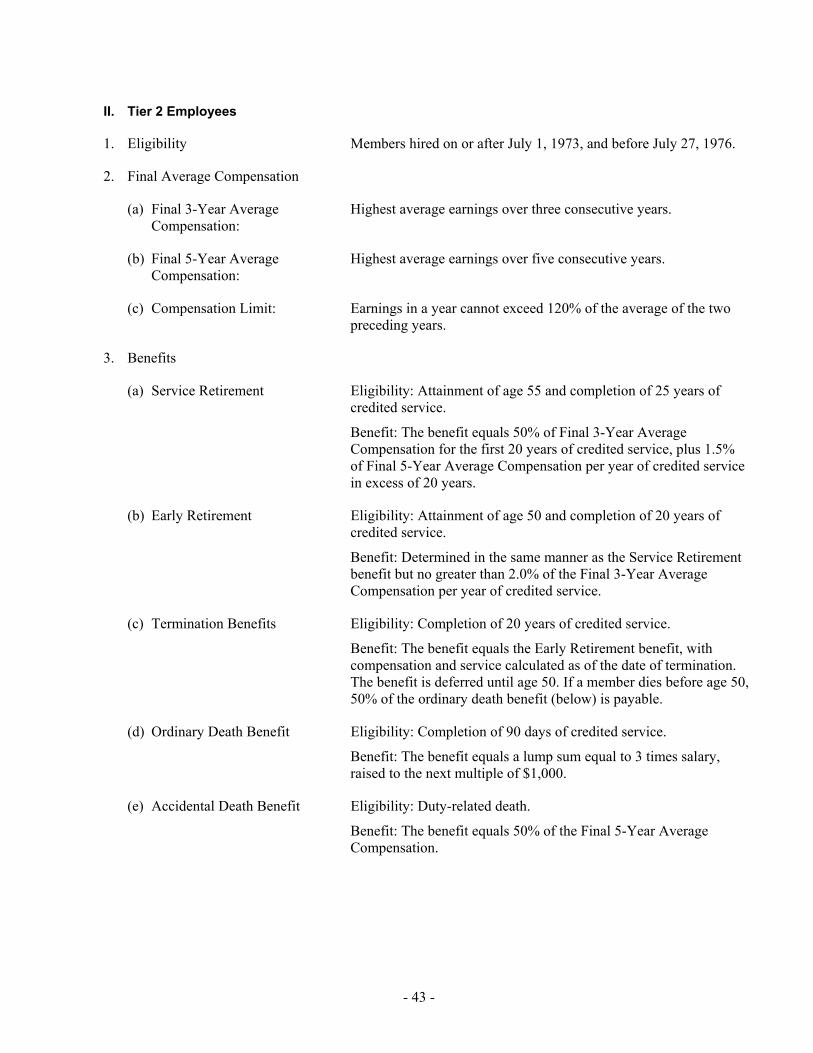
- 43 -
II. Tier 2 Employees
1. Eligibility Members hired on or after July 1, 1973, and before July 27, 1976.
2. Final Average Compensation
(a) Final 3-Year Average Compensation:
Highest average earnings over three consecutive years.
(b) Final 5-Year Average Compensation:
Highest average earnings over five consecutive years.
(c) Compensation Limit: Earnings in a year cannot exceed 120% of the average of the two preceding years.
3. Benefits
(a) Service Retirement Eligibility: Attainment of age 55 and completion of 25 years of credited service.
Benefit: The benefit equals 50% of Final 3-Year Average Compensation for the first 20 years of credited service, plus 1.5% of Final 5-Year Average Compensation per year of credited service in excess of 20 years.
(b) Early Retirement Eligibility: Attainment of age 50 and completion of 20 years of credited service.
Benefit: Determined in the same manner as the Service Retirement benefit but no greater than 2.0% of the Final 3-Year Average Compensation per year of credited service.
(c) Termination Benefits Eligibility: Completion of 20 years of credited service.
Benefit: The benefit equals the Early Retirement benefit, with compensation and service calculated as of the date of termination. The benefit is deferred until age 50. If a member dies before age 50, 50% of the ordinary death benefit (below) is payable.
(d) Ordinary Death Benefit Eligibility: Completion of 90 days of credited service.
Benefit: The benefit equals a lump sum equal to 3 times salary, raised to the next multiple of $1,000.
(e) Accidental Death Benefit Eligibility: Duty-related death.
Benefit: The benefit equals 50% of the Final 5-Year Average Compensation.
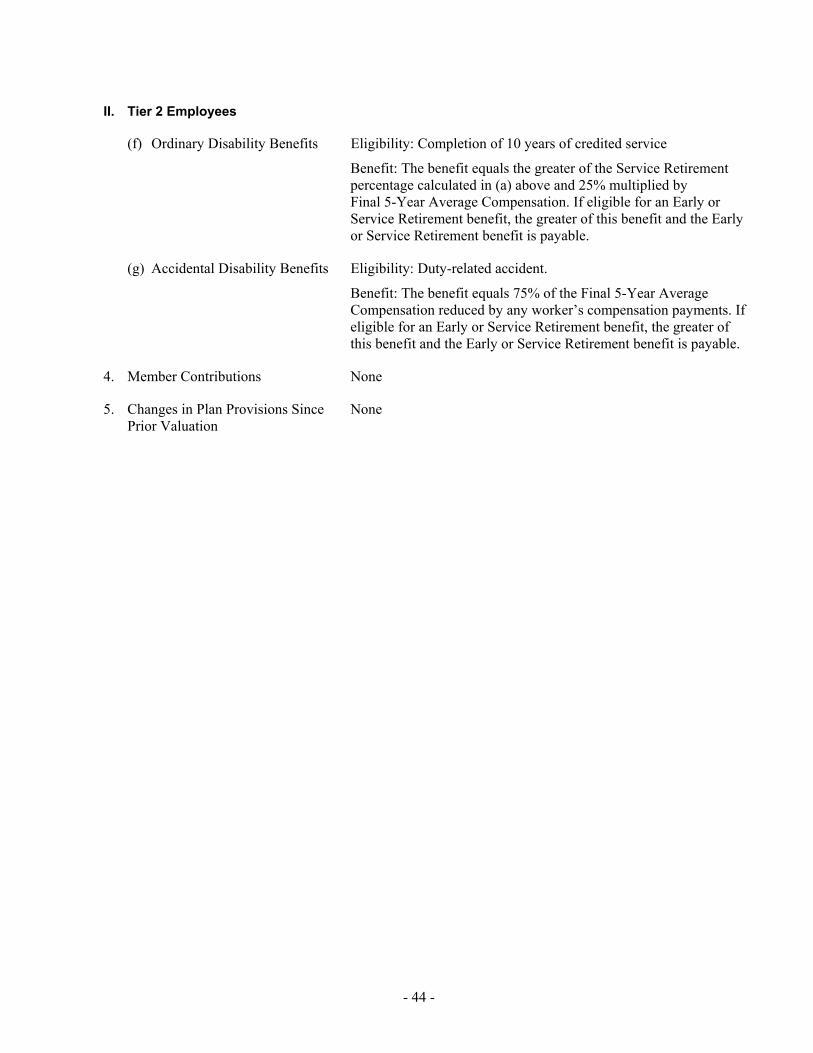
- 44 -
II. Tier 2 Employees
(f) Ordinary Disability Benefits Eligibility: Completion of 10 years of credited service
Benefit: The benefit equals the greater of the Service Retirement percentage calculated in (a) above and 25% multiplied by Final 5-Year Average Compensation. If eligible for an Early or Service Retirement benefit, the greater of this benefit and the Early or Service Retirement benefit is payable.
(g) Accidental Disability Benefits Eligibility: Duty-related accident.
Benefit: The benefit equals 75% of the Final 5-Year Average Compensation reduced by any worker’s compensation payments. If eligible for an Early or Service Retirement benefit, the greater of this benefit and the Early or Service Retirement benefit is payable.
4. Member Contributions None
5. Changes in Plan Provisions Since Prior Valuation
None
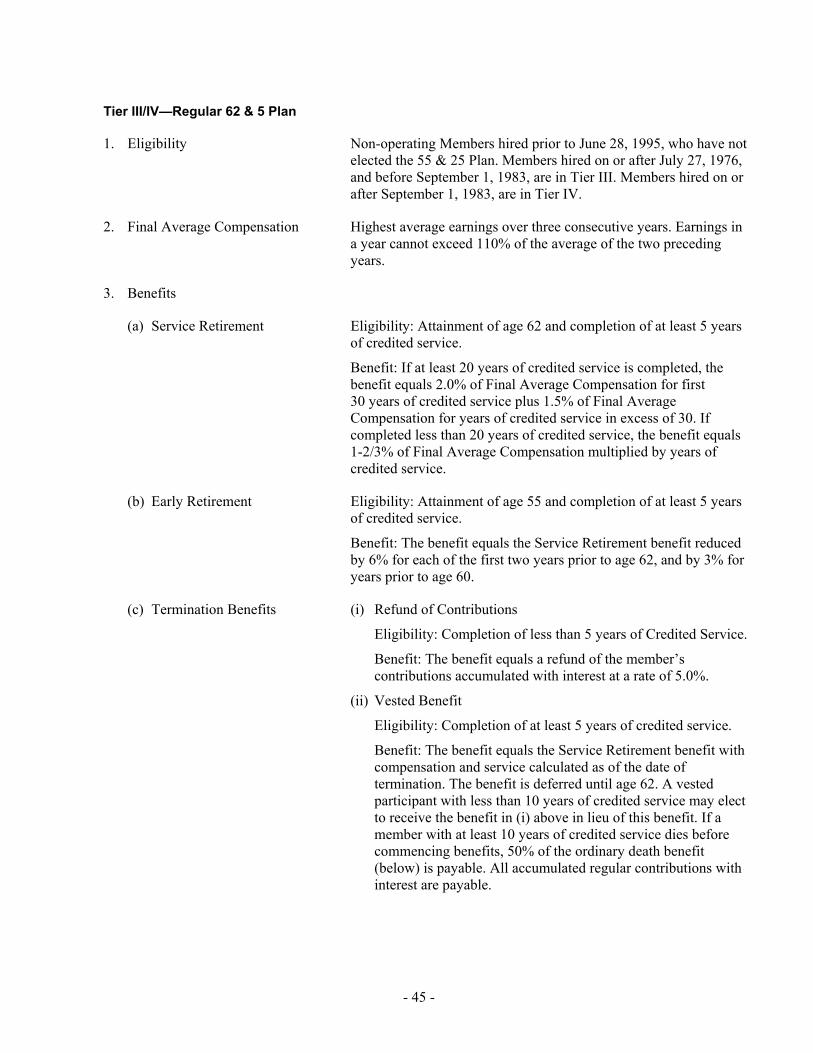
- 45 -
Tier III/IV—Regular 62 & 5 Plan
1. Eligibility Non-operating Members hired prior to June 28, 1995, who have not elected the 55 & 25 Plan. Members hired on or after July 27, 1976, and before September 1, 1983, are in Tier III. Members hired on or after September 1, 1983, are in Tier IV.
2. Final Average Compensation Highest average earnings over three consecutive years. Earnings in a year cannot exceed 110% of the average of the two preceding years.
3. Benefits
(a) Service Retirement Eligibility: Attainment of age 62 and completion of at least 5 years of credited service.
Benefit: If at least 20 years of credited service is completed, the benefit equals 2.0% of Final Average Compensation for first 30 years of credited service plus 1.5% of Final Average Compensation for years of credited service in excess of 30. If completed less than 20 years of credited service, the benefit equals 1-2/3% of Final Average Compensation multiplied by years of credited service.
(b) Early Retirement Eligibility: Attainment of age 55 and completion of at least 5 years of credited service.
Benefit: The benefit equals the Service Retirement benefit reduced by 6% for each of the first two years prior to age 62, and by 3% for years prior to age 60.
(c) Termination Benefits (i) Refund of Contributions
Eligibility: Completion of less than 5 years of Credited Service.
Benefit: The benefit equals a refund of the member’s contributions accumulated with interest at a rate of 5.0%.
(ii) Vested Benefit
Eligibility: Completion of at least 5 years of credited service.
Benefit: The benefit equals the Service Retirement benefit with compensation and service calculated as of the date of termination. The benefit is deferred until age 62. A vested participant with less than 10 years of credited service may elect to receive the benefit in (i) above in lieu of this benefit. If a member with at least 10 years of credited service dies before commencing benefits, 50% of the ordinary death benefit (below) is payable. All accumulated regular contributions with interest are payable.

- 46 -
Tier III/IV—Regular 62 & 5 Plan
(d) Ordinary Death Benefits Eligibility: all members.
Pre-retirement Benefit: The benefit equals a lump sum of annual salary times the lesser of completed years of credited service and 3. After age 60, the benefit is reduced 5% per year, to a maximum reduction of 50%. Accumulated regular member contributions with interest and one-half of accumulated additional member contributions with interest are also payable.
Post-retirement Benefit: Upon retirement the pre-retirement benefit shall be reduced by 50% and reduced an additional 25% after completion of one year of retirement. After completion of two years of retirement, the benefit equals 10% of the pre-retirement benefit in force at age 60.
Spouse Benefit (Tier III only)
Eligibility: Vested and spouse is beneficiary.
Benefit: In lieu of the ordinary death benefit above, the spouse may elect 1/3 of the ordinary death benefit plus an annuity of 1.0% of Final Average Compensation per year of credited service, payable for life, or until remarriage. If the surviving spouse is more than 10 years younger, the annuity is actuarially reduced. The total of all payments will at least equal the amount of the full lump sum benefit.
(e) Accidental Death Benefits Eligibility: Duty-related death.
Benefit: The benefit equals 50% of compensation paid to eligible beneficiary as defined by priority:
(i) Spouse, until remarriage
(ii) Children, to age 25
(iii) Dependent parents
(iv) Any other dependent survivors, to age 21.
Total of all payments will at least equal the amount of the full ordinary death lump sum benefit.
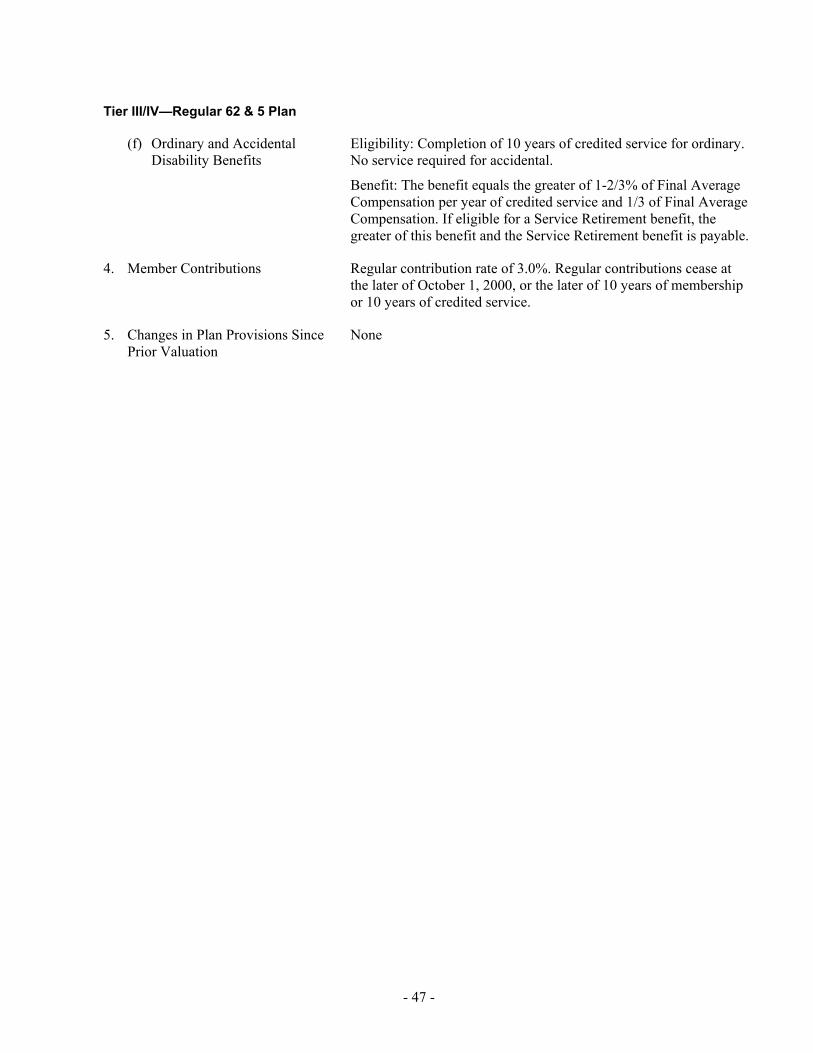
- 47 -
Tier III/IV—Regular 62 & 5 Plan
(f) Ordinary and Accidental Disability Benefits
Eligibility: Completion of 10 years of credited service for ordinary. No service required for accidental.
Benefit: The benefit equals the greater of 1-2/3% of Final Average Compensation per year of credited service and 1/3 of Final Average Compensation. If eligible for a Service Retirement benefit, the greater of this benefit and the Service Retirement benefit is payable.
4. Member Contributions Regular contribution rate of 3.0%. Regular contributions cease at the later of October 1, 2000, or the later of 10 years of membership or 10 years of credited service.
5. Changes in Plan Provisions Since Prior Valuation
None
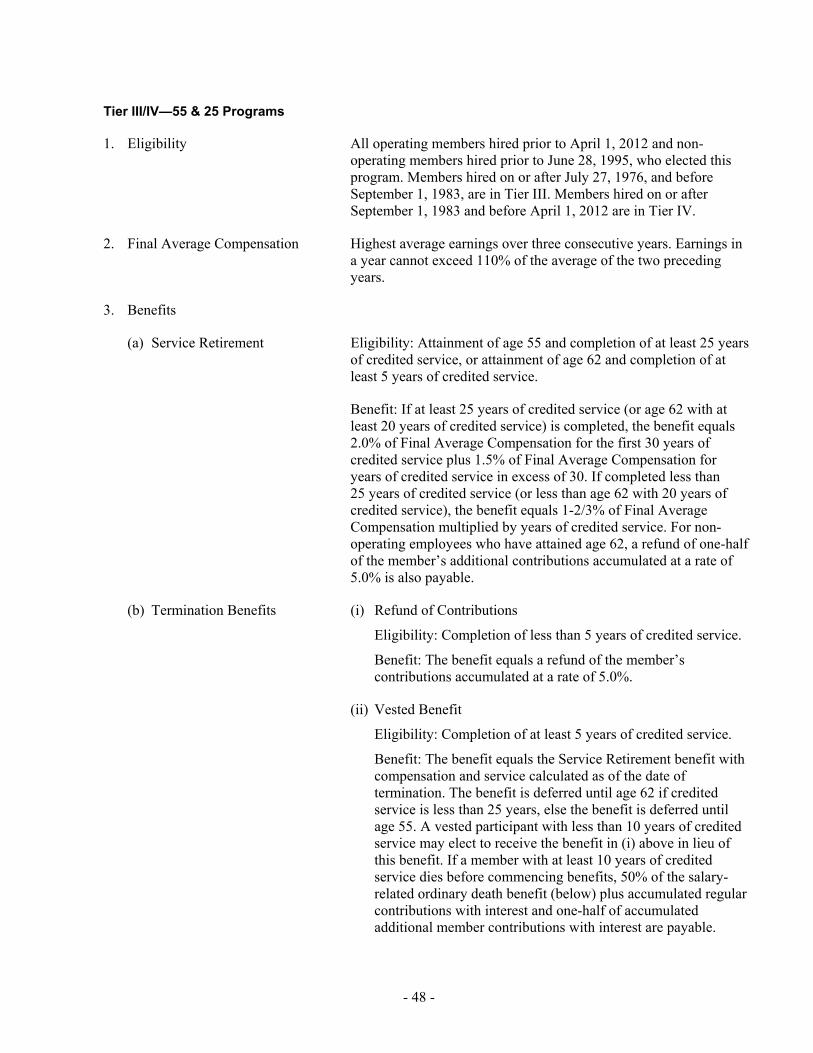
- 48 -
Tier III/IV—55 & 25 Programs
1. Eligibility All operating members hired prior to April 1, 2012 and non-operating members hired prior to June 28, 1995, who elected this program. Members hired on or after July 27, 1976, and before September 1, 1983, are in Tier III. Members hired on or after September 1, 1983 and before April 1, 2012 are in Tier IV.
2. Final Average Compensation Highest average earnings over three consecutive years. Earnings in a year cannot exceed 110% of the average of the two preceding years.
3. Benefits
(a) Service Retirement Eligibility: Attainment of age 55 and completion of at least 25 years of credited service, or attainment of age 62 and completion of at least 5 years of credited service.
Benefit: If at least 25 years of credited service (or age 62 with at least 20 years of credited service) is completed, the benefit equals 2.0% of Final Average Compensation for the first 30 years of credited service plus 1.5% of Final Average Compensation for years of credited service in excess of 30. If completed less than 25 years of credited service (or less than age 62 with 20 years of credited service), the benefit equals 1-2/3% of Final Average Compensation multiplied by years of credited service. For non-operating employees who have attained age 62, a refund of one-half of the member’s additional contributions accumulated at a rate of 5.0% is also payable.
(b) Termination Benefits (i) Refund of Contributions
Eligibility: Completion of less than 5 years of credited service.
Benefit: The benefit equals a refund of the member’s contributions accumulated at a rate of 5.0%.
(ii) Vested Benefit
Eligibility: Completion of at least 5 years of credited service.
Benefit: The benefit equals the Service Retirement benefit with compensation and service calculated as of the date of termination. The benefit is deferred until age 62 if credited service is less than 25 years, else the benefit is deferred until age 55. A vested participant with less than 10 years of credited service may elect to receive the benefit in (i) above in lieu of this benefit. If a member with at least 10 years of credited service dies before commencing benefits, 50% of the salary-related ordinary death benefit (below) plus accumulated regular contributions with interest and one-half of accumulated additional member contributions with interest are payable.

- 49 -
Tier III/IV—55 & 25 Programs
(c) Ordinary Death Benefits Eligibility: All members.
Pre-retirement Benefit: The benefit equals a lump sum of annual salary times the lesser of completed years of credited service and 3. After age 60, the benefit is reduced 5% per year, to a maximum reduction of 50%. Accumulated regular member contributions with interest and one-half of accumulated additional member contributions with interest are also payable.
Post-retirement Benefit: Upon retirement the pre-retirement benefit shall be reduced by 50% and reduced an additional 25% after completion of one year of retirement. After completion of two years of retirement, the benefit equals 10% of the pre-retirement benefit in force at age 60.
Spouse Benefit (Tier III only)
Eligibility: Vested and spouse is beneficiary.
Benefit: In lieu of the ordinary death benefit above, the spouse may elect 1/3 of the ordinary death benefit plus an annuity of 1.0% of Final Average Compensation per year of credited service, payable for life, or until remarriage. If the surviving spouse is more than 10 years younger, the annuity is actuarially reduced. The total of all payments will at least equal the amount of the full lump sum benefit.
(d) Accidental Death Benefits Eligibility: Duty-related death.
Benefit: The benefit equals 50% of compensation paid to eligible beneficiary as defined by priority:
(i) Spouse, until remarriage
(ii) Children, to age 25
(iii) Dependent parents
(iv) Any other dependent survivors, to age 21.
Total of all payments will at least equal the amount of the full ordinary death lump sum benefit.
(e) Ordinary and Accidental Disability Benefits
Eligibility: Completion of 10 years of credited service for ordinary. No service requirement for accidental.
Benefit: The benefit equals the greater of 1-2/3% of Final Average Compensation per year of credited service and 1/3 of Final Average Compensation. If eligible for a Service Retirement benefit, the greater of this benefit and the Service Retirement benefit is payable. For non-operating employees, a refund of one-half of the member’s additional contributions accumulated at a rate of 5.0% is also payable.
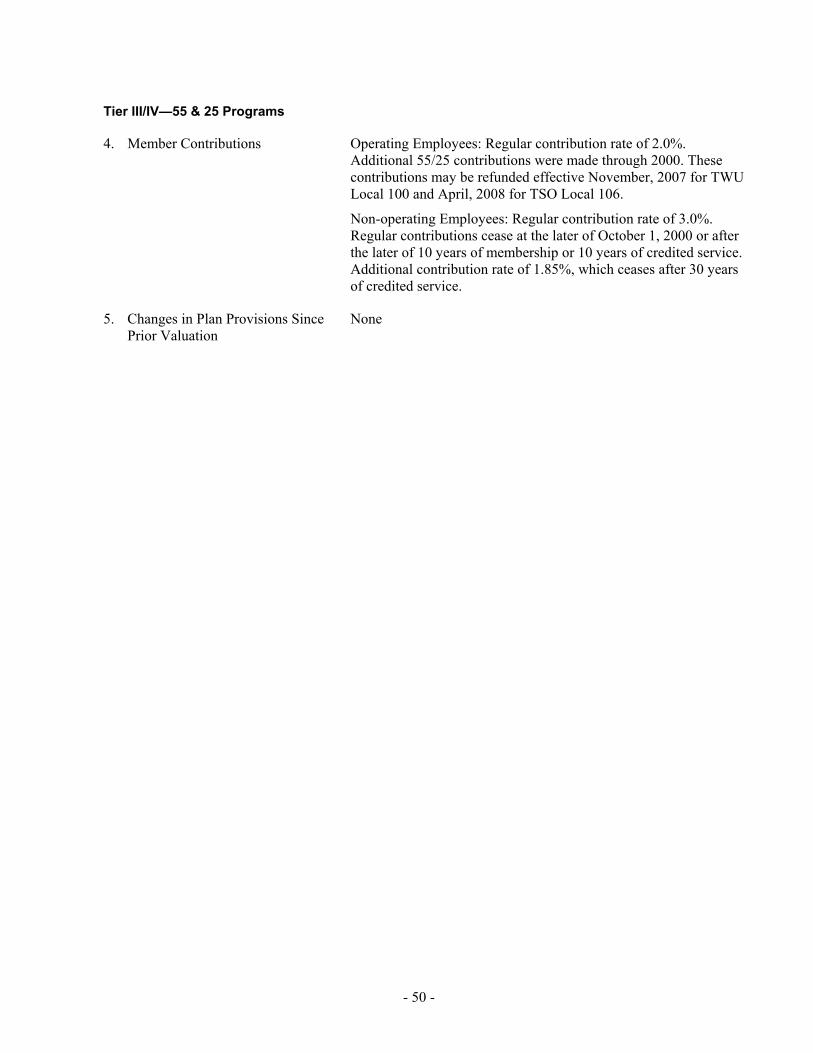
- 50 -
Tier III/IV—55 & 25 Programs
4. Member Contributions Operating Employees: Regular contribution rate of 2.0%. Additional 55/25 contributions were made through 2000. These contributions may be refunded effective November, 2007 for TWU Local 100 and April, 2008 for TSO Local 106.
Non-operating Employees: Regular contribution rate of 3.0%. Regular contributions cease at the later of October 1, 2000 or after the later of 10 years of membership or 10 years of credited service. Additional contribution rate of 1.85%, which ceases after 30 years of credited service.
5. Changes in Plan Provisions Since Prior Valuation
None
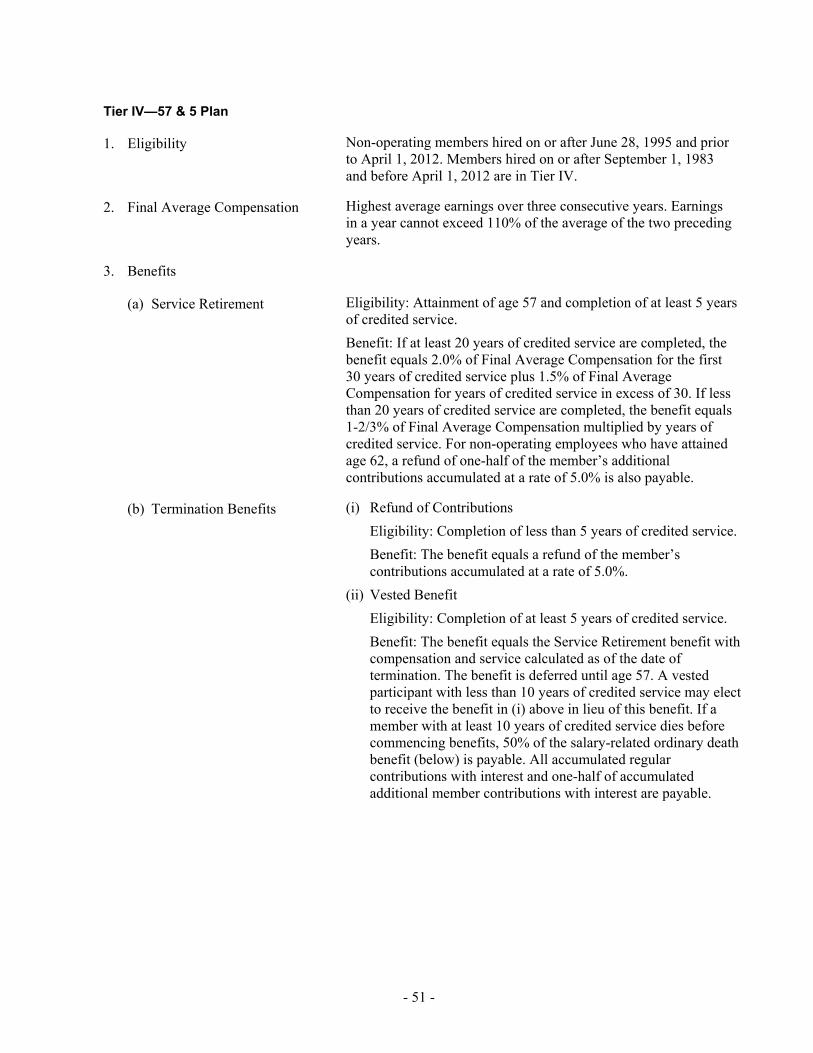
- 51 -
Tier IV—57 & 5 Plan
1. Eligibility Non-operating members hired on or after June 28, 1995 and prior to April 1, 2012. Members hired on or after September 1, 1983 and before April 1, 2012 are in Tier IV.
2. Final Average Compensation Highest average earnings over three consecutive years. Earnings in a year cannot exceed 110% of the average of the two preceding years.
3. Benefits
(a) Service Retirement Eligibility: Attainment of age 57 and completion of at least 5 years of credited service. Benefit: If at least 20 years of credited service are completed, the benefit equals 2.0% of Final Average Compensation for the first 30 years of credited service plus 1.5% of Final Average Compensation for years of credited service in excess of 30. If less than 20 years of credited service are completed, the benefit equals 1-2/3% of Final Average Compensation multiplied by years of credited service. For non-operating employees who have attained age 62, a refund of one-half of the member’s additional contributions accumulated at a rate of 5.0% is also payable.
(b) Termination Benefits (i) Refund of Contributions Eligibility: Completion of less than 5 years of credited service. Benefit: The benefit equals a refund of the member’s contributions accumulated at a rate of 5.0%.
(ii) Vested Benefit Eligibility: Completion of at least 5 years of credited service. Benefit: The benefit equals the Service Retirement benefit with compensation and service calculated as of the date of termination. The benefit is deferred until age 57. A vested participant with less than 10 years of credited service may elect to receive the benefit in (i) above in lieu of this benefit. If a member with at least 10 years of credited service dies before commencing benefits, 50% of the salary-related ordinary death benefit (below) is payable. All accumulated regular contributions with interest and one-half of accumulated additional member contributions with interest are payable.
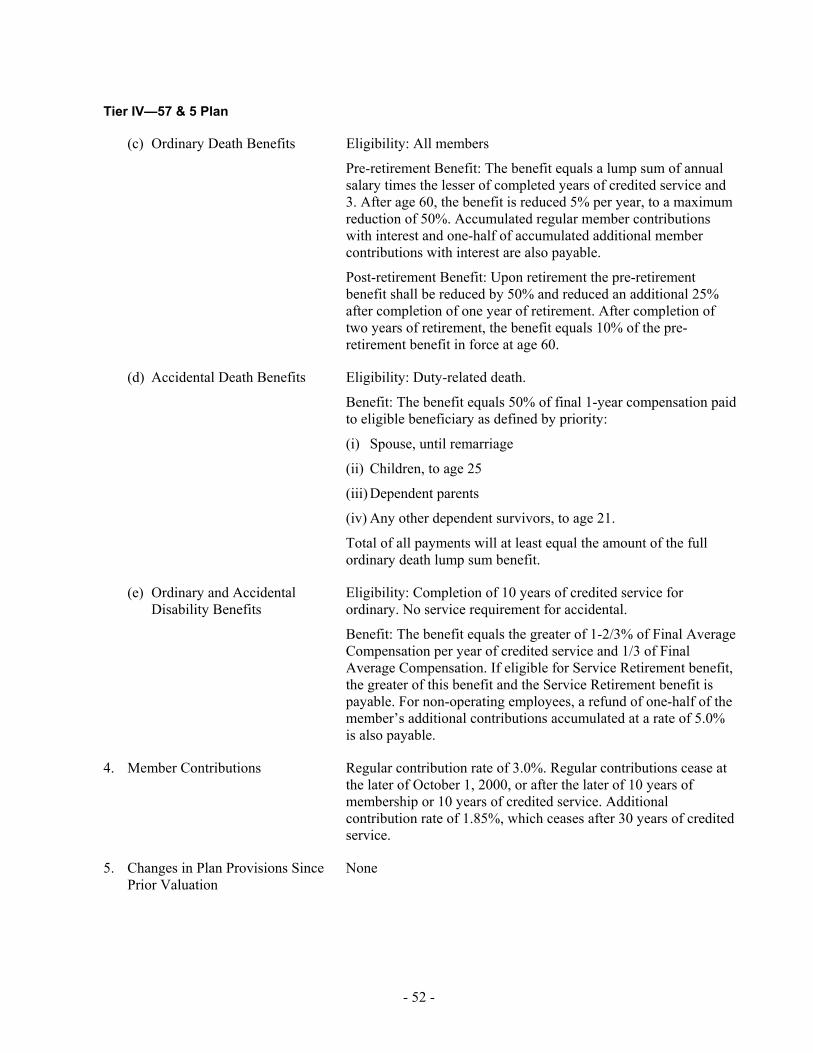
- 52 -
Tier IV—57 & 5 Plan
(c) Ordinary Death Benefits Eligibility: All members
Pre-retirement Benefit: The benefit equals a lump sum of annual salary times the lesser of completed years of credited service and 3. After age 60, the benefit is reduced 5% per year, to a maximum reduction of 50%. Accumulated regular member contributions with interest and one-half of accumulated additional member contributions with interest are also payable.
Post-retirement Benefit: Upon retirement the pre-retirement benefit shall be reduced by 50% and reduced an additional 25% after completion of one year of retirement. After completion of two years of retirement, the benefit equals 10% of the pre-retirement benefit in force at age 60.
(d) Accidental Death Benefits Eligibility: Duty-related death.
Benefit: The benefit equals 50% of final 1-year compensation paid to eligible beneficiary as defined by priority:
(i) Spouse, until remarriage
(ii) Children, to age 25
(iii) Dependent parents
(iv) Any other dependent survivors, to age 21.
Total of all payments will at least equal the amount of the full ordinary death lump sum benefit.
(e) Ordinary and Accidental Disability Benefits
Eligibility: Completion of 10 years of credited service for ordinary. No service requirement for accidental.
Benefit: The benefit equals the greater of 1-2/3% of Final Average Compensation per year of credited service and 1/3 of Final Average Compensation. If eligible for Service Retirement benefit, the greater of this benefit and the Service Retirement benefit is payable. For non-operating employees, a refund of one-half of the member’s additional contributions accumulated at a rate of 5.0% is also payable.
4. Member Contributions Regular contribution rate of 3.0%. Regular contributions cease at the later of October 1, 2000, or after the later of 10 years of membership or 10 years of credited service. Additional contribution rate of 1.85%, which ceases after 30 years of credited service.
5. Changes in Plan Provisions Since Prior Valuation
None
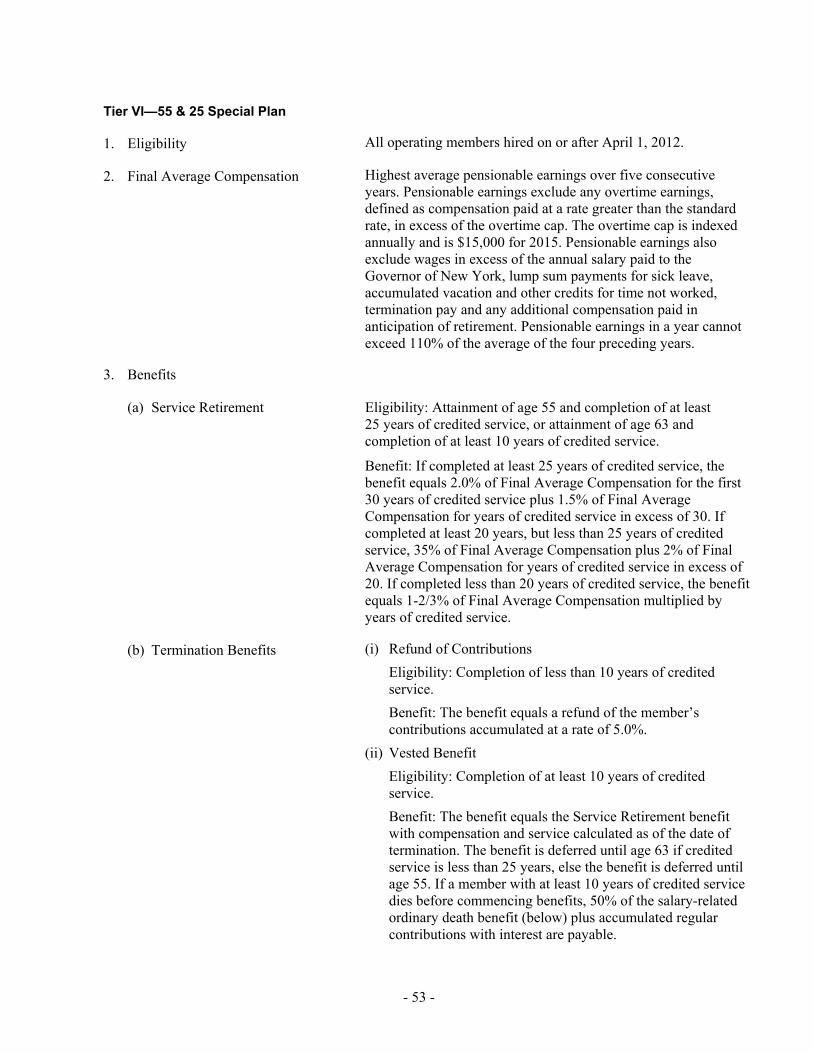
- 53 -
Tier VI—55 & 25 Special Plan
1. Eligibility All operating members hired on or after April 1, 2012.
2. Final Average Compensation Highest average pensionable earnings over five consecutive years. Pensionable earnings exclude any overtime earnings, defined as compensation paid at a rate greater than the standard rate, in excess of the overtime cap. The overtime cap is indexed annually and is $15,000 for 2015. Pensionable earnings also exclude wages in excess of the annual salary paid to the Governor of New York, lump sum payments for sick leave, accumulated vacation and other credits for time not worked, termination pay and any additional compensation paid in anticipation of retirement. Pensionable earnings in a year cannot exceed 110% of the average of the four preceding years.
3. Benefits
(a) Service Retirement Eligibility: Attainment of age 55 and completion of at least 25 years of credited service, or attainment of age 63 and completion of at least 10 years of credited service.
Benefit: If completed at least 25 years of credited service, the benefit equals 2.0% of Final Average Compensation for the first 30 years of credited service plus 1.5% of Final Average Compensation for years of credited service in excess of 30. If completed at least 20 years, but less than 25 years of credited service, 35% of Final Average Compensation plus 2% of Final Average Compensation for years of credited service in excess of 20. If completed less than 20 years of credited service, the benefit equals 1-2/3% of Final Average Compensation multiplied by years of credited service.
(b) Termination Benefits (i) Refund of Contributions Eligibility: Completion of less than 10 years of credited service. Benefit: The benefit equals a refund of the member’s contributions accumulated at a rate of 5.0%.
(ii) Vested Benefit Eligibility: Completion of at least 10 years of credited service. Benefit: The benefit equals the Service Retirement benefit with compensation and service calculated as of the date of termination. The benefit is deferred until age 63 if credited service is less than 25 years, else the benefit is deferred until age 55. If a member with at least 10 years of credited service dies before commencing benefits, 50% of the salary-related ordinary death benefit (below) plus accumulated regular contributions with interest are payable.

- 54 -
Tier VI—55 & 25 Special Plan
(c) Ordinary Death Benefits Eligibility: All members
Pre-retirement Benefit: The benefit equals a lump sum of annual salary times the lesser of completed years of credited service and 3. After age 60, the benefit is reduced 5% per year, to a maximum reduction of 50%. Accumulated regular member contributions with interest and one-half of accumulated additional member contributions with interest are also payable.
Post-retirement Benefit: Upon retirement the pre-retirement benefit shall be reduced by 50% and reduced an additional 25% after completion of one year of retirement. After completion of two years of retirement, the benefit equals 10% of the pre-retirement benefit in force at age 60.
(d) Accidental Death Benefits Eligibility: Duty-related death.
Benefit: The benefit equals 50% of compensation paid to eligible beneficiary as defined by priority:
(i) Spouse, until remarriage
(ii) Children, to age 25
(iii) Dependent parents
(iv) Any other dependent survivors, to age 21.
Total of all payments will at least equal the amount of the full ordinary death lump sum benefit.
(e) Ordinary and Accidental Disability Benefits
Eligibility: Completion of 10 years of credited service for ordinary. No service requirement for accidental.
Benefit: The benefit equals the greater of 1-2/3% of Final Average Compensation per year of credited service and 1/3 of Final Average Compensation. If eligible for a Service Retirement benefit, the greater of this benefit and the Service Retirement benefit is payable.
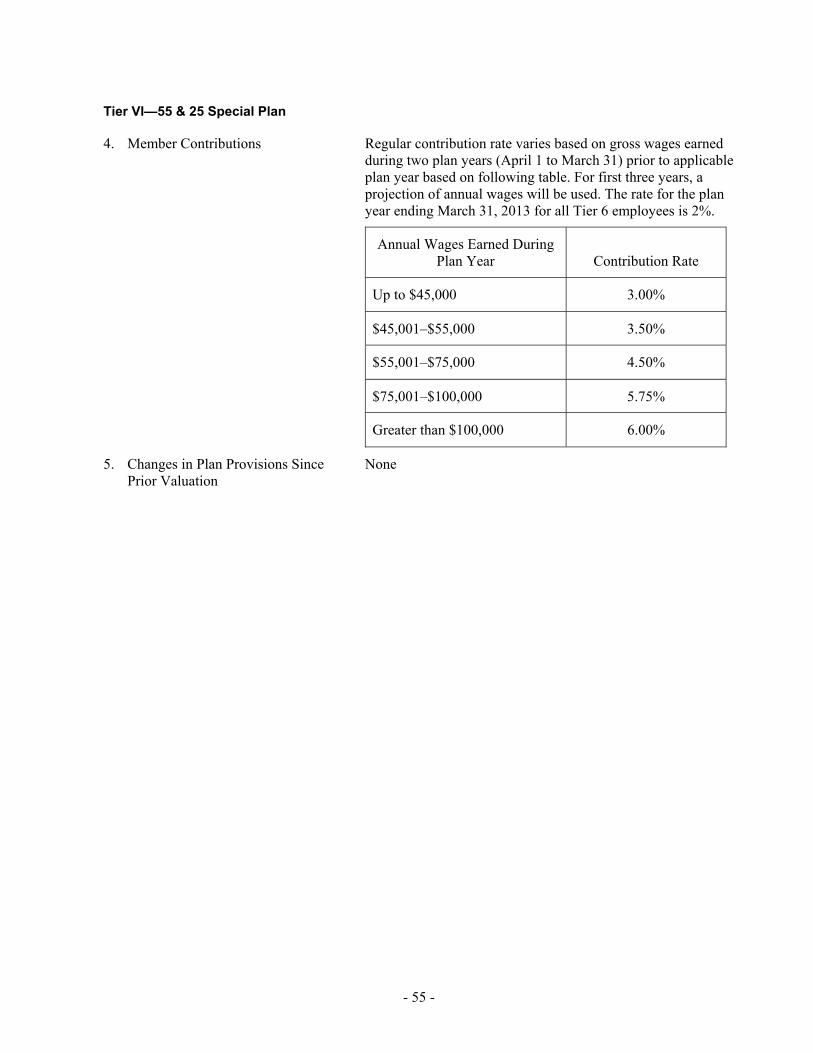
- 55 -
Tier VI—55 & 25 Special Plan
4. Member Contributions Regular contribution rate varies based on gross wages earned during two plan years (April 1 to March 31) prior to applicable plan year based on following table. For first three years, a projection of annual wages will be used. The rate for the plan year ending March 31, 2013 for all Tier 6 employees is 2%.
Annual Wages Earned During Plan Year
Contribution Rate
Up to $45,000 3.00%
$45,001–$55,000 3.50%
$55,001–$75,000 4.50%
$75,001–$100,000 5.75%
Greater than $100,000 6.00%
5. Changes in Plan Provisions Since Prior Valuation
None
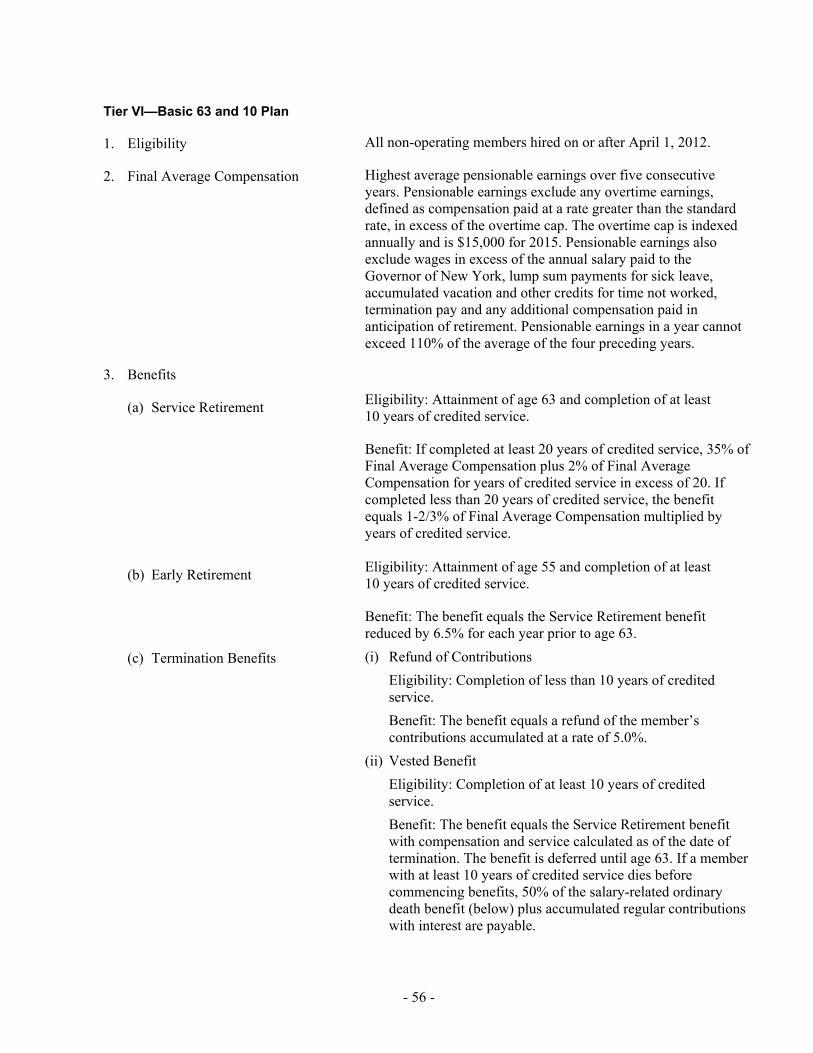
- 56 -
Tier VI—Basic 63 and 10 Plan
1. Eligibility All non-operating members hired on or after April 1, 2012.
2. Final Average Compensation Highest average pensionable earnings over five consecutive years. Pensionable earnings exclude any overtime earnings, defined as compensation paid at a rate greater than the standard rate, in excess of the overtime cap. The overtime cap is indexed annually and is $15,000 for 2015. Pensionable earnings also exclude wages in excess of the annual salary paid to the Governor of New York, lump sum payments for sick leave, accumulated vacation and other credits for time not worked, termination pay and any additional compensation paid in anticipation of retirement. Pensionable earnings in a year cannot exceed 110% of the average of the four preceding years.
3. Benefits
(a) Service Retirement Eligibility: Attainment of age 63 and completion of at least 10 years of credited service.
Benefit: If completed at least 20 years of credited service, 35% of Final Average Compensation plus 2% of Final Average Compensation for years of credited service in excess of 20. If completed less than 20 years of credited service, the benefit equals 1-2/3% of Final Average Compensation multiplied by years of credited service.
(b) Early Retirement Eligibility: Attainment of age 55 and completion of at least 10 years of credited service.
Benefit: The benefit equals the Service Retirement benefit reduced by 6.5% for each year prior to age 63.
(c) Termination Benefits (i) Refund of Contributions Eligibility: Completion of less than 10 years of credited service. Benefit: The benefit equals a refund of the member’s contributions accumulated at a rate of 5.0%.
(ii) Vested Benefit Eligibility: Completion of at least 10 years of credited service. Benefit: The benefit equals the Service Retirement benefit with compensation and service calculated as of the date of termination. The benefit is deferred until age 63. If a member with at least 10 years of credited service dies before commencing benefits, 50% of the salary-related ordinary death benefit (below) plus accumulated regular contributions with interest are payable.
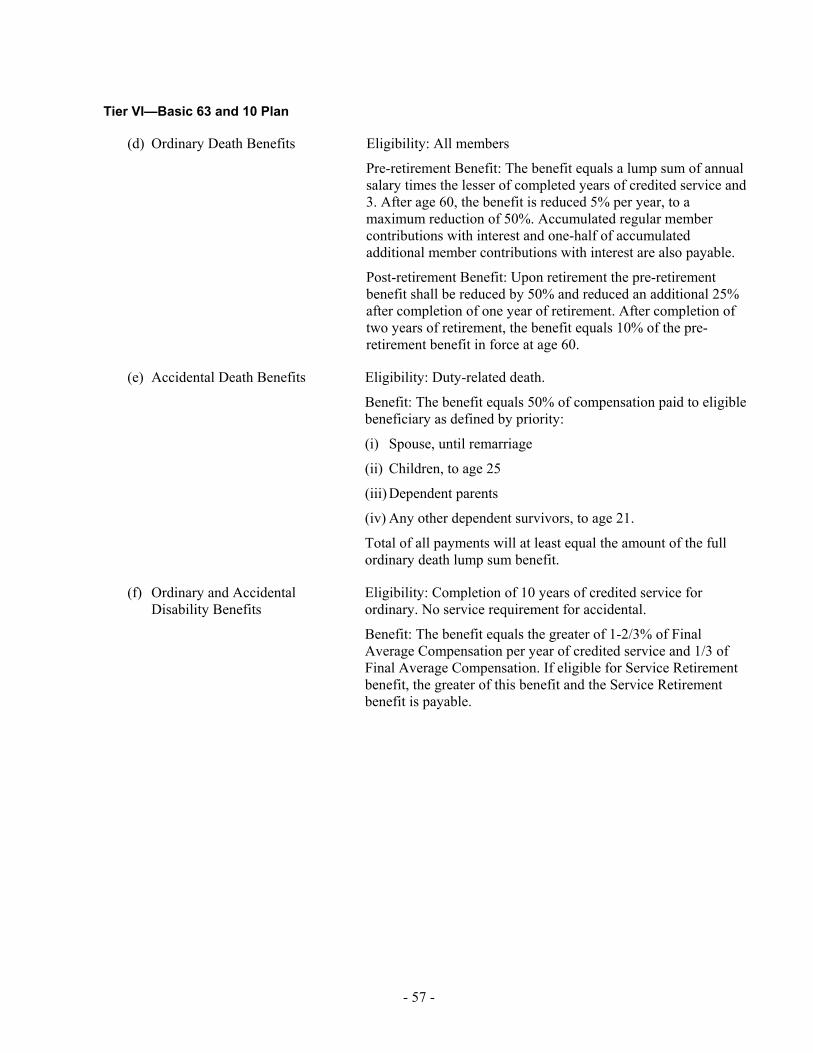
- 57 -
Tier VI—Basic 63 and 10 Plan
(d) Ordinary Death Benefits Eligibility: All members
Pre-retirement Benefit: The benefit equals a lump sum of annual salary times the lesser of completed years of credited service and 3. After age 60, the benefit is reduced 5% per year, to a maximum reduction of 50%. Accumulated regular member contributions with interest and one-half of accumulated additional member contributions with interest are also payable.
Post-retirement Benefit: Upon retirement the pre-retirement benefit shall be reduced by 50% and reduced an additional 25% after completion of one year of retirement. After completion of two years of retirement, the benefit equals 10% of the pre-retirement benefit in force at age 60.
(e) Accidental Death Benefits Eligibility: Duty-related death.
Benefit: The benefit equals 50% of compensation paid to eligible beneficiary as defined by priority:
(i) Spouse, until remarriage
(ii) Children, to age 25
(iii) Dependent parents
(iv) Any other dependent survivors, to age 21.
Total of all payments will at least equal the amount of the full ordinary death lump sum benefit.
(f) Ordinary and Accidental Disability Benefits
Eligibility: Completion of 10 years of credited service for ordinary. No service requirement for accidental.
Benefit: The benefit equals the greater of 1-2/3% of Final Average Compensation per year of credited service and 1/3 of Final Average Compensation. If eligible for Service Retirement benefit, the greater of this benefit and the Service Retirement benefit is payable.
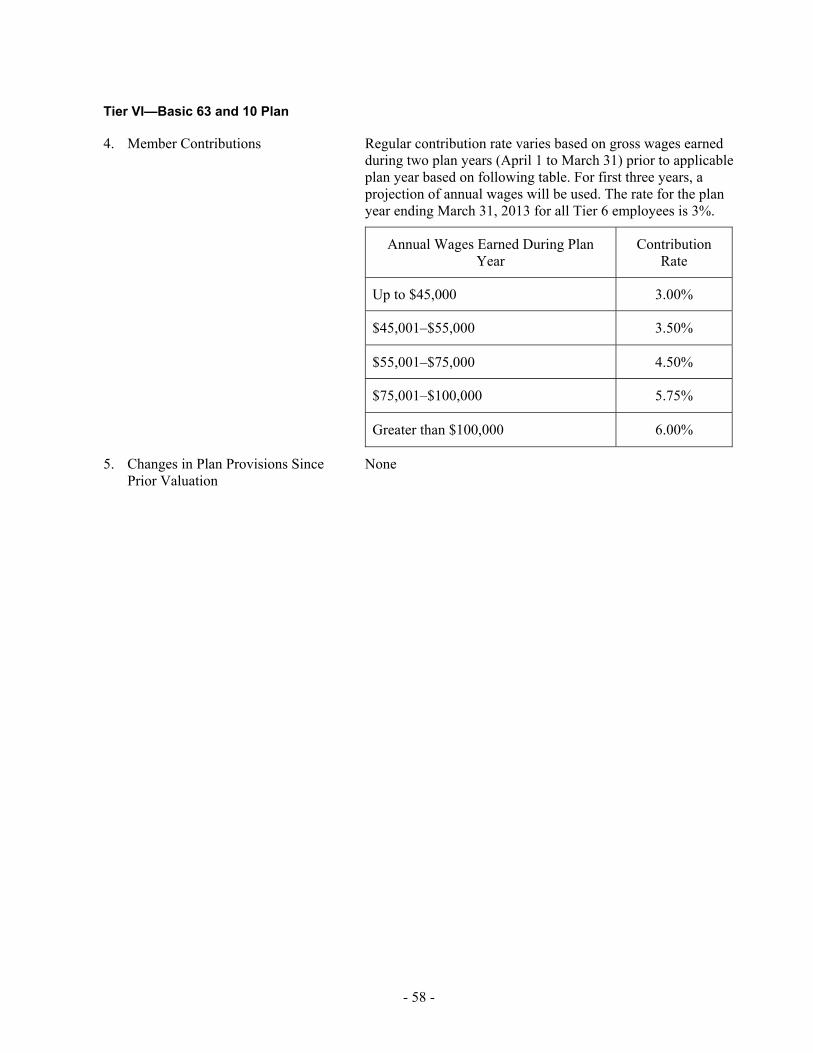
- 58 -
Tier VI—Basic 63 and 10 Plan
4. Member Contributions Regular contribution rate varies based on gross wages earned during two plan years (April 1 to March 31) prior to applicable plan year based on following table. For first three years, a projection of annual wages will be used. The rate for the plan year ending March 31, 2013 for all Tier 6 employees is 3%.
Annual Wages Earned During Plan Year
Contribution Rate
Up to $45,000 3.00%
$45,001–$55,000 3.50%
$55,001–$75,000 4.50%
$75,001–$100,000 5.75%
Greater than $100,000 6.00%
5. Changes in Plan Provisions Since Prior Valuation
None