Embed Size (px)
Citation preview
Mangoola Coal Environmental Noise Monitoring
Quarter 1 2010
Prepared for
Xstrata Mangoola Coal
Global Acoustics Pty Ltd
10021_R02.doc
Mangoola Coal
Environmental Noise Monitoring, Quarter 1 2010
Reference: 10021_R02.doc
Report date: 9 August 2010
Prepared for:
Xstrata Mangoola Coal
PO Box 495
Muswellbrook NSW 2333
Prepared by:
Global Acoustics Pty Ltd
PO Box 115
Thornton NSW 2322
Prepared: Katie Weekes
Environmental Scientist
QA review: Tony Welbourne
Director
Global Acoustics Pty Ltd ~ Environmental noise modelling and impact assessment ~
Sound power testing ~ Noise control advice ~ Noise and vibration monitoring ~ OHS
noise monitoring and advice ~ Expert evidence in Land and Environment and
Compensation Courts ~ Architectural acoustics ~ Blasting assessments and
monitoring ~ Noise management plans (NMP) ~ Sound level meter and noise logger
sales and hire
Global Acoustics Pty Ltd
10021_R02.doc Page i
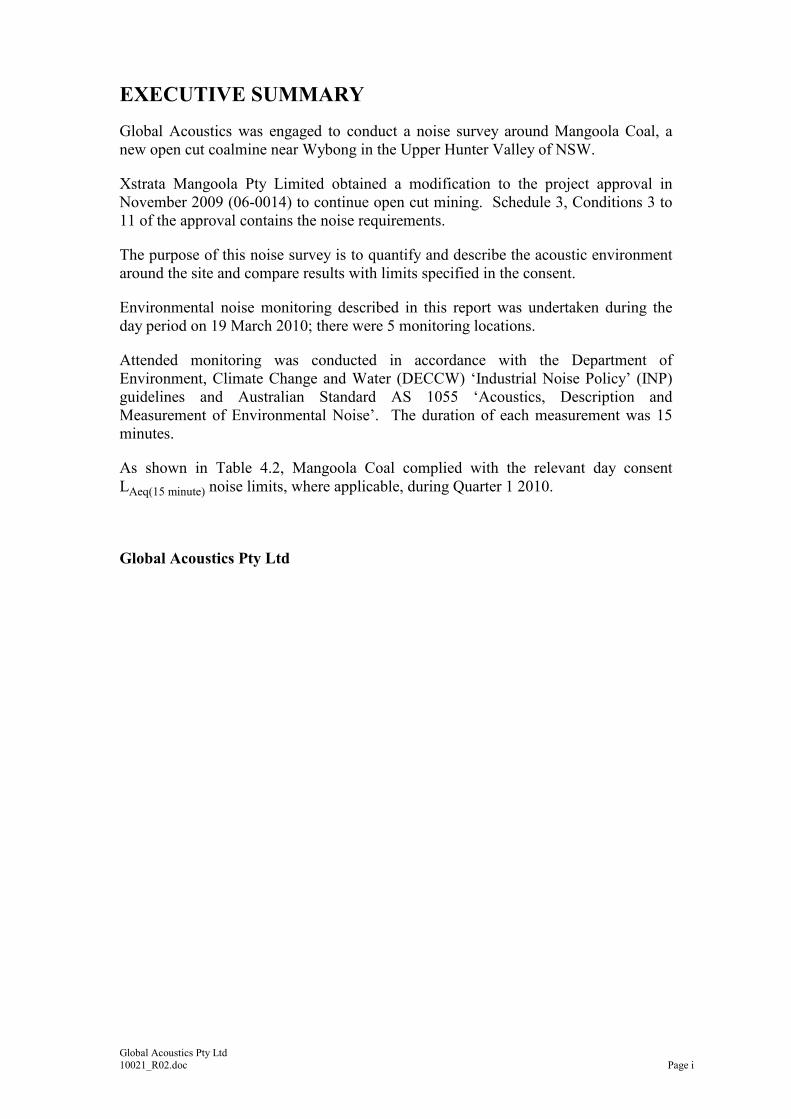
EXECUTIVE SUMMARY
Global Acoustics was engaged to conduct a noise survey around Mangoola Coal, a
new open cut coalmine near Wybong in the Upper Hunter Valley of NSW.
Xstrata Mangoola Pty Limited obtained a modification to the project approval in
November 2009 (06-0014) to continue open cut mining. Schedule 3, Conditions 3 to
11 of the approval contains the noise requirements.
The purpose of this noise survey is to quantify and describe the acoustic environment
around the site and compare results with limits specified in the consent.
Environmental noise monitoring described in this report was undertaken during the
day period on 19 March 2010; there were 5 monitoring locations.
Attended monitoring was conducted in accordance with the Department of
Environment, Climate Change and Water (DECCW) ‘Industrial Noise Policy’ (INP)
guidelines and Australian Standard AS 1055 ‘Acoustics, Description and
Measurement of Environmental Noise’. The duration of each measurement was 15
minutes.
As shown in Table 4.2, Mangoola Coal complied with the relevant day consent
LAeq(15 minute) noise limits, where applicable, during Quarter 1 2010.
Global Acoustics Pty Ltd
Global Acoustics Pty Ltd
10021_R02.doc
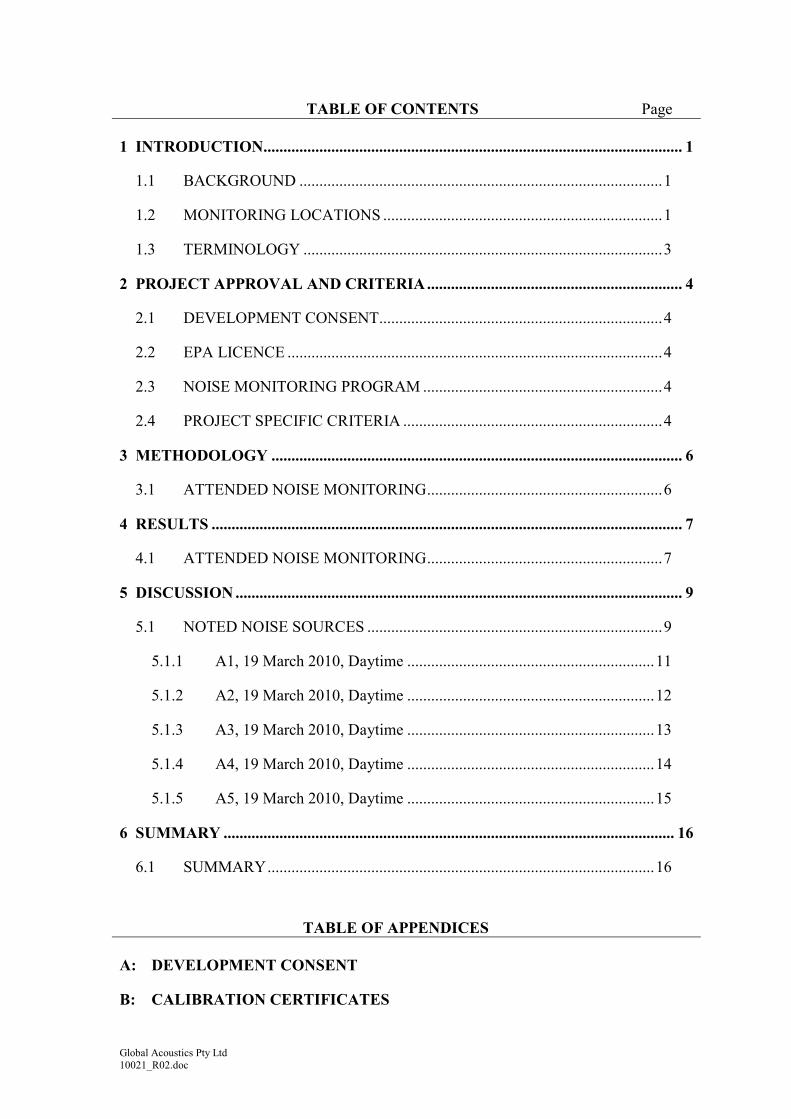
TABLE OF CONTENTS Page
1 INTRODUCTION......................................................................................................... 1
1.1 BACKGROUND ...........................................................................................1
1.2 MONITORING LOCATIONS ......................................................................1
1.3 TERMINOLOGY ..........................................................................................3
2 PROJECT APPROVAL AND CRITERIA................................................................ 4
2.1 DEVELOPMENT CONSENT.......................................................................4
2.2 EPA LICENCE ..............................................................................................4
2.3 NOISE MONITORING PROGRAM ............................................................4
2.4 PROJECT SPECIFIC CRITERIA .................................................................4
3 METHODOLOGY ....................................................................................................... 6
3.1 ATTENDED NOISE MONITORING...........................................................6
4 RESULTS ...................................................................................................................... 7
4.1 ATTENDED NOISE MONITORING...........................................................7
5 DISCUSSION................................................................................................................ 9
5.1 NOTED NOISE SOURCES ..........................................................................9
5.1.1 A1, 19 March 2010, Daytime ..............................................................11
5.1.2 A2, 19 March 2010, Daytime ..............................................................12
5.1.3 A3, 19 March 2010, Daytime ..............................................................13
5.1.4 A4, 19 March 2010, Daytime ..............................................................14
5.1.5 A5, 19 March 2010, Daytime ..............................................................15
6 SUMMARY ................................................................................................................. 16
6.1 SUMMARY.................................................................................................16
TABLE OF APPENDICES
A: DEVELOPMENT CONSENT
B: CALIBRATION CERTIFICATES
Global Acoustics Pty Ltd
10021_R02.doc Page 1
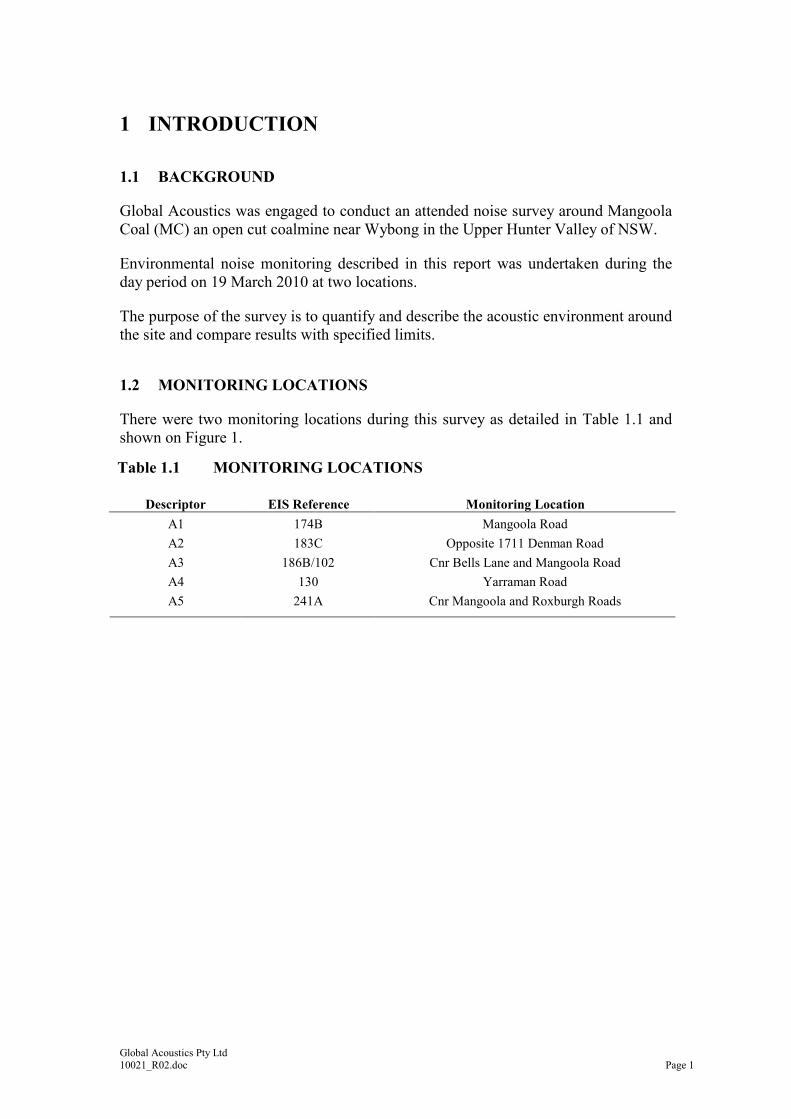
1 INTRODUCTION
1.1 BACKGROUND
Global Acoustics was engaged to conduct an attended noise survey around Mangoola
Coal (MC) an open cut coalmine near Wybong in the Upper Hunter Valley of NSW.
Environmental noise monitoring described in this report was undertaken during the
day period on 19 March 2010 at two locations.
The purpose of the survey is to quantify and describe the acoustic environment around
the site and compare results with specified limits.
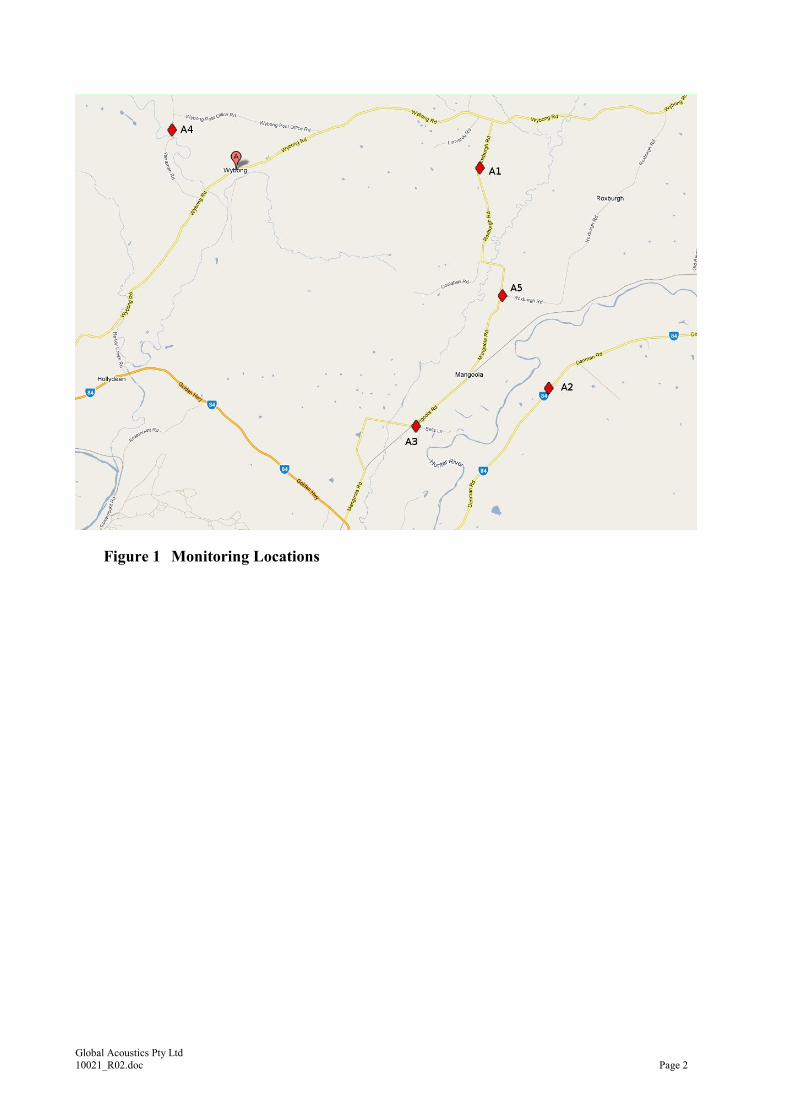
1.2 MONITORING LOCATIONS
There were two monitoring locations during this survey as detailed in Table 1.1 and
shown on Figure 1.
Table 1.1 MONITORING LOCATIONS
Descriptor EIS Reference Monitoring Location
A1 174B Mangoola Road
A2 183C Opposite 1711 Denman Road
A3 186B/102 Cnr Bells Lane and Mangoola Road
A4 130 Yarraman Road
A5 241A Cnr Mangoola and Roxburgh Roads
Global Acoustics Pty Ltd
10021_R02.doc Page 2
Figure 1 Monitoring Locations
Global Acoustics Pty Ltd
10021_R02.doc Page 3
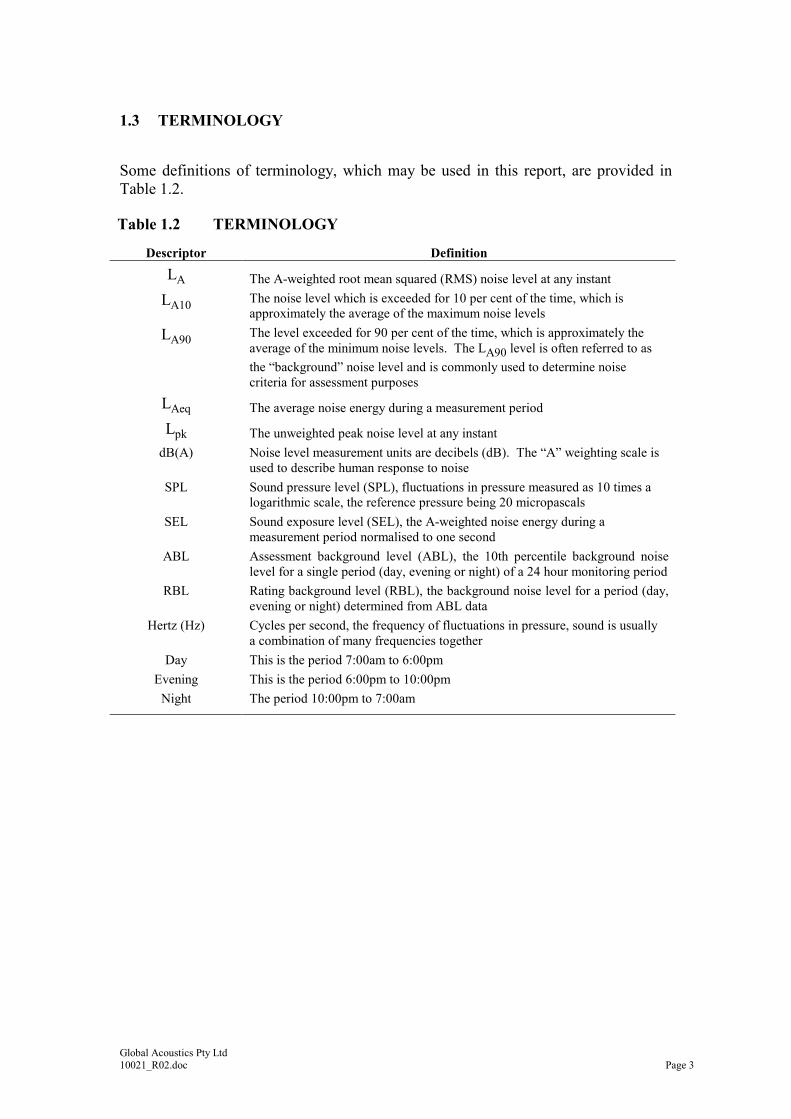
1.3 TERMINOLOGY
Some definitions of terminology, which may be used in this report, are provided in
Table 1.2.
Table 1.2 TERMINOLOGY
Descriptor Definition
LA The A-weighted root mean squared (RMS) noise level at any instant
LA10 The noise level which is exceeded for 10 per cent of the time, which is
approximately the average of the maximum noise levels
LA90 The level exceeded for 90 per cent of the time, which is approximately the
average of the minimum noise levels. The LA90 level is often referred to as
the “background” noise level and is commonly used to determine noise
criteria for assessment purposes
LAeq The average noise energy during a measurement period
Lpk The unweighted peak noise level at any instant
dB(A) Noise level measurement units are decibels (dB). The “A” weighting scale is
used to describe human response to noise
SPL Sound pressure level (SPL), fluctuations in pressure measured as 10 times a
logarithmic scale, the reference pressure being 20 micropascals
SEL Sound exposure level (SEL), the A-weighted noise energy during a
measurement period normalised to one second
ABL Assessment background level (ABL), the 10th percentile background noise
level for a single period (day, evening or night) of a 24 hour monitoring period
RBL Rating background level (RBL), the background noise level for a period (day,
evening or night) determined from ABL data
Hertz (Hz) Cycles per second, the frequency of fluctuations in pressure, sound is usually
a combination of many frequencies together
Day This is the period 7:00am to 6:00pm
Evening This is the period 6:00pm to 10:00pm
Night The period 10:00pm to 7:00am
Global Acoustics Pty Ltd
10021_R02.doc Page 4
2 PROJECT APPROVAL AND CRITERIA
A project approval and licence apply to the Mangoola Coal Project.
2.1 DEVELOPMENT CONSENT
Xstrata Mangoola Pty Limited obtained a modification to the project approval in
November 2009 (06-0014) to continue open cut mining. Schedule 3, Conditions 3 to
11 of the approval contains the noise requirements.
The noise sections of the approval are reproduced in Appendix A.
2.2 EPA LICENCE
Mangoola Coal holds Department of Environment, Climate Change and Water
(DECCW) Environment Protection Licence (EPL) No. 12894 for coal mining,
crushing, grinding and separating. Noise requirements are detailed in L6 of the
licence.
The noise sections of the licence are reproduced in Appendix A.
2.3 NOISE MONITORING PROGRAM
The Noise Monitoring Program (NMP) for Mangoola Coal was finalised in
September 2008 and last reviewed in September 2009.
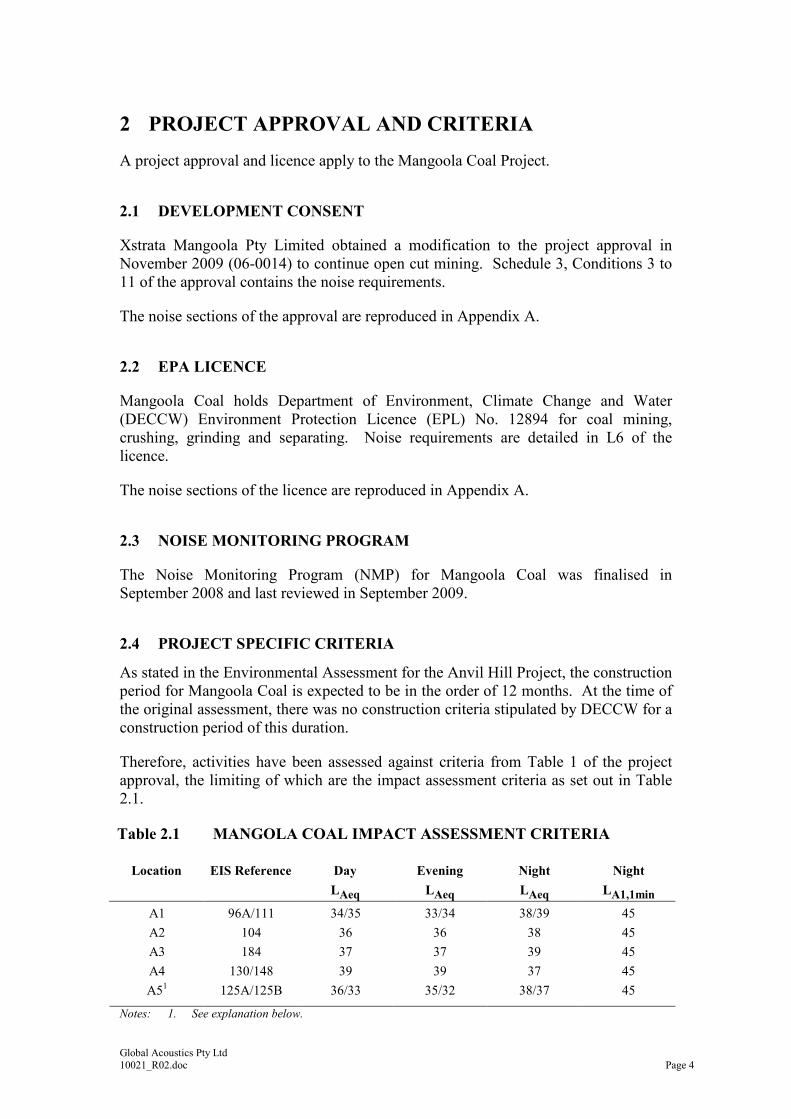
2.4 PROJECT SPECIFIC CRITERIA
As stated in the Environmental Assessment for the Anvil Hill Project, the construction
period for Mangoola Coal is expected to be in the order of 12 months. At the time of
the original assessment, there was no construction criteria stipulated by DECCW for a
construction period of this duration.
Therefore, activities have been assessed against criteria from Table 1 of the project
approval, the limiting of which are the impact assessment criteria as set out in Table
2.1.
Table 2.1 MANGOLA COAL IMPACT ASSESSMENT CRITERIA
Location EIS Reference Day
LAeq
Evening
LAeq
Night
LAeq
Night
LA1,1min
A1 96A/111 34/35 33/34 38/39 45
A2 104 36 36 38 45
A3 184 37 37 39 45
A4 130/148 39 39 37 45
A51 125A/125B 36/33 35/32 38/37 45
Notes: 1. See explanation below.
Global Acoustics Pty Ltd
10021_R02.doc Page 5
The monitoring location at the intersection of Mangoola and Roxburgh Roads (A5) is
at an elevated point with line of sight to Mangoola Coal. The nearest privately-owned
residences are 1.25 kilometres or more to the east of this monitoring location. A
ridgeline is between the residences and the operation, removing line of sight.
Therefore the criterion applied at this site is that for the nearest privately owned
residences (EIS Reference numbers 125A and 125B).
Mangoola Coal land acquisition criteria are set out in Table 2.2.
Table 2.2 MANGOLA COAL LAND ACQUISITION CRITERIA, LAeq dB
Location Day Evening Night
All privately owned land 40 40 40
Global Acoustics Pty Ltd
10021_R02.doc Page 6
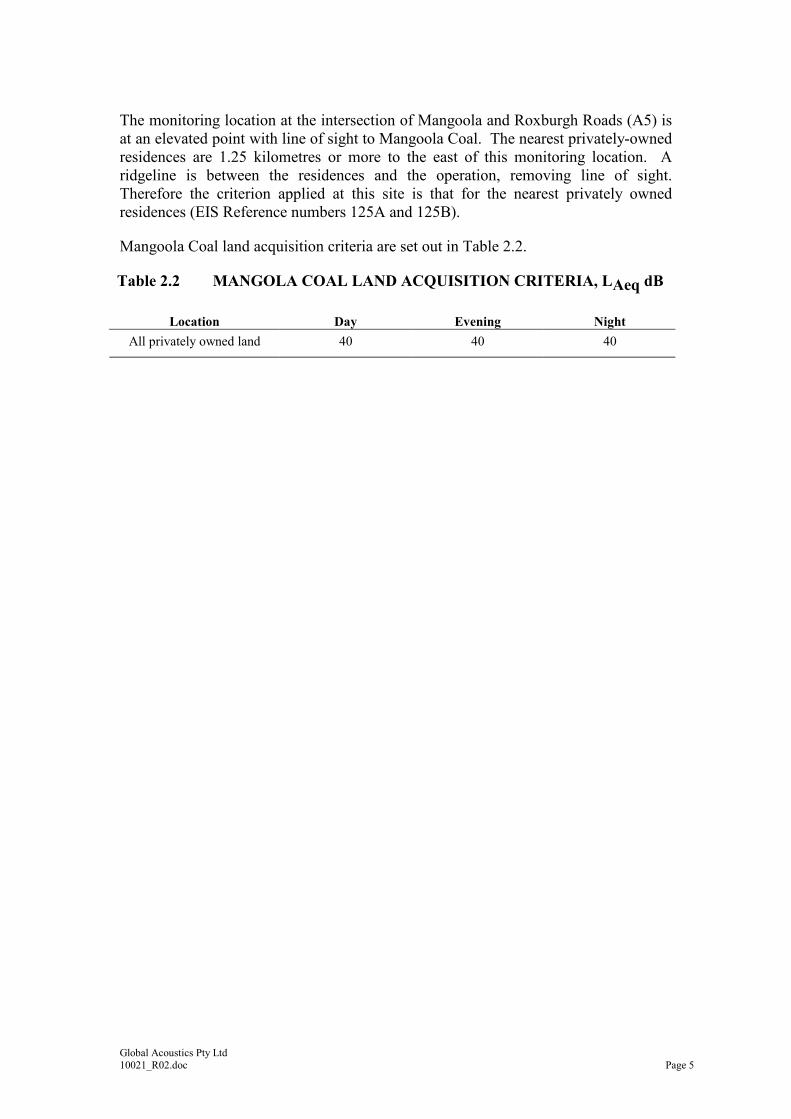
3 METHODOLOGY
3.1 ATTENDED NOISE MONITORING
Attended monitoring was conducted at five sites in accordance with DECCW
‘Industrial Noise Policy’ (INP) guidelines and Australian Standard AS 1055
‘Acoustics, Description and Measurement of Environmental Noise’. Atmospheric
condition measurement was also undertaken.
The duration of each measurement was 15 minutes. During this survey attended
monitoring was undertaken once at each measurement location during the day period
(0700 to 1800).
Attended monitoring is preferred to the use of noise loggers when determining
compliance with prescribed limits; it allows an accurate determination of the
contribution, if any, to measured noise levels by the source of interest (in this case
Mangoola Coal).
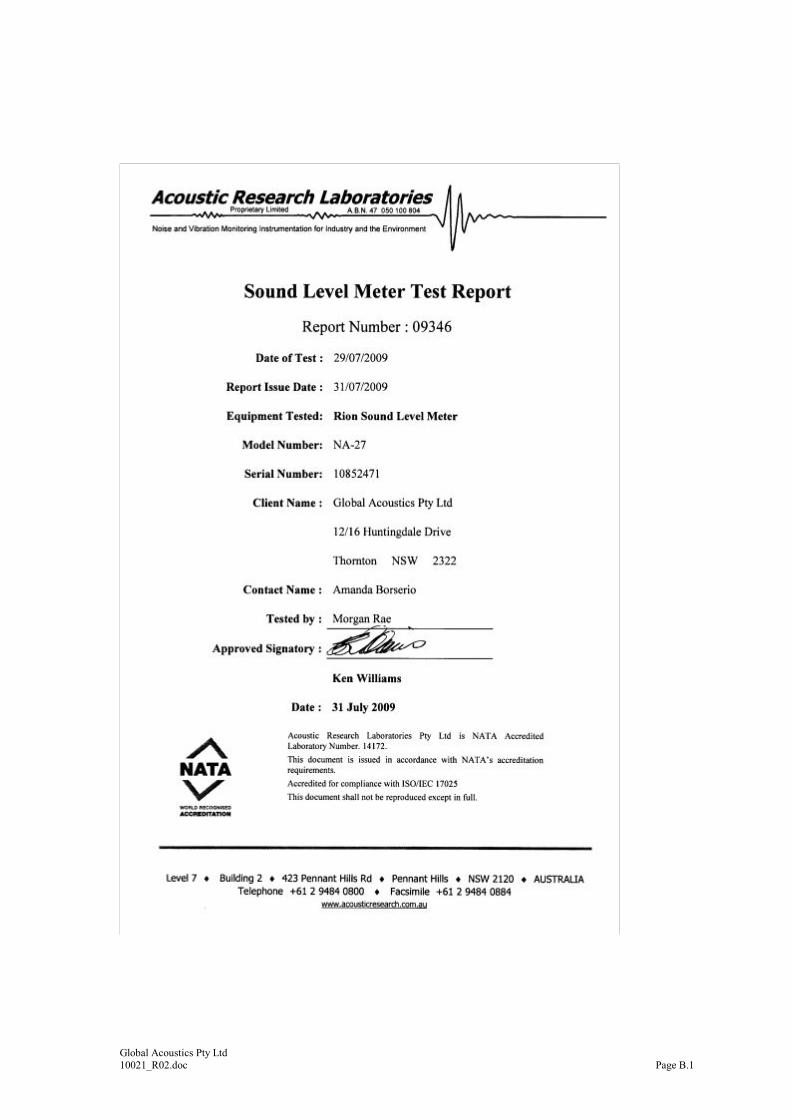
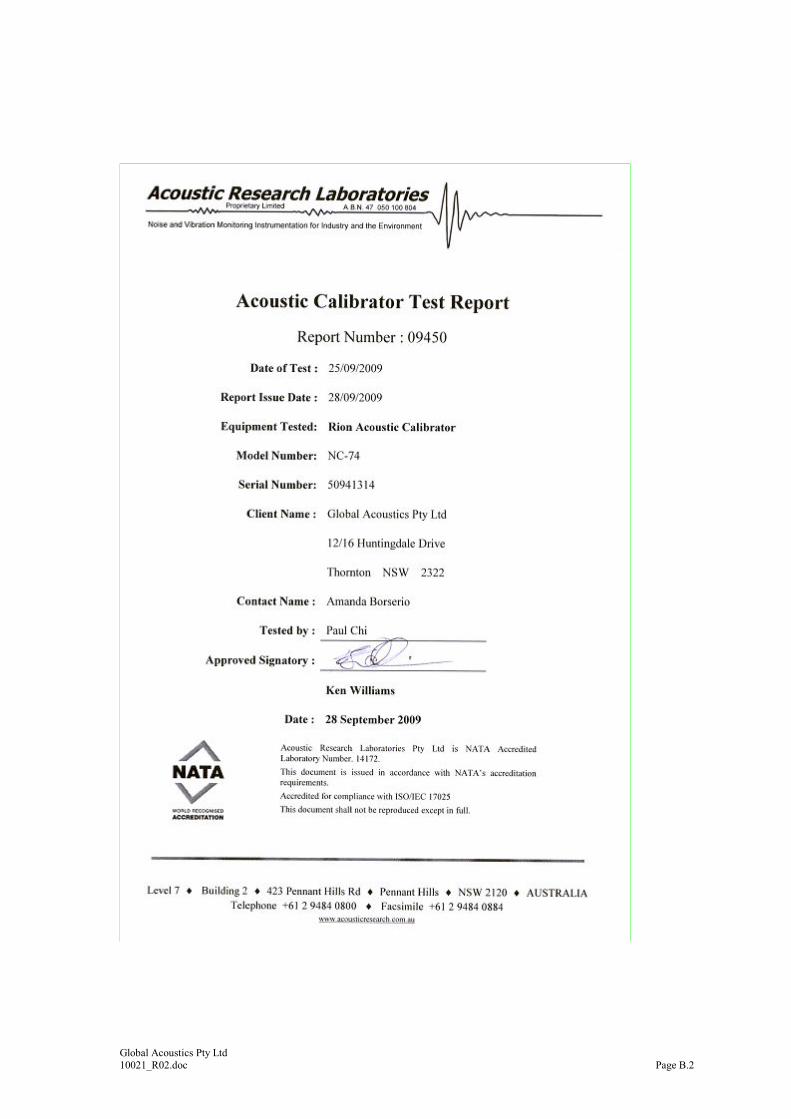
The following equipment was used to measure environmental noise levels:
Table 3.1 ATTENDED NOISE MONITORING EQUIPMENT
Model Serial Number Calibration Due Date
Rion NA-27 sound level analyser 10852471 29/07/2011
Rion NC-74 calibrator 50941314 25/09/2011
Calibration certificates are provided in Appendix B.
Meteorological data was obtained from a Mangoola Coal meteorological station. This
allowed correlation of atmospheric parameters and measured noise levels. Sigma
theta is used to calculate vertical temperature gradient (VTG) in accordance with
procedures detailed in the INP.
Global Acoustics Pty Ltd
10021_R02.doc Page 7
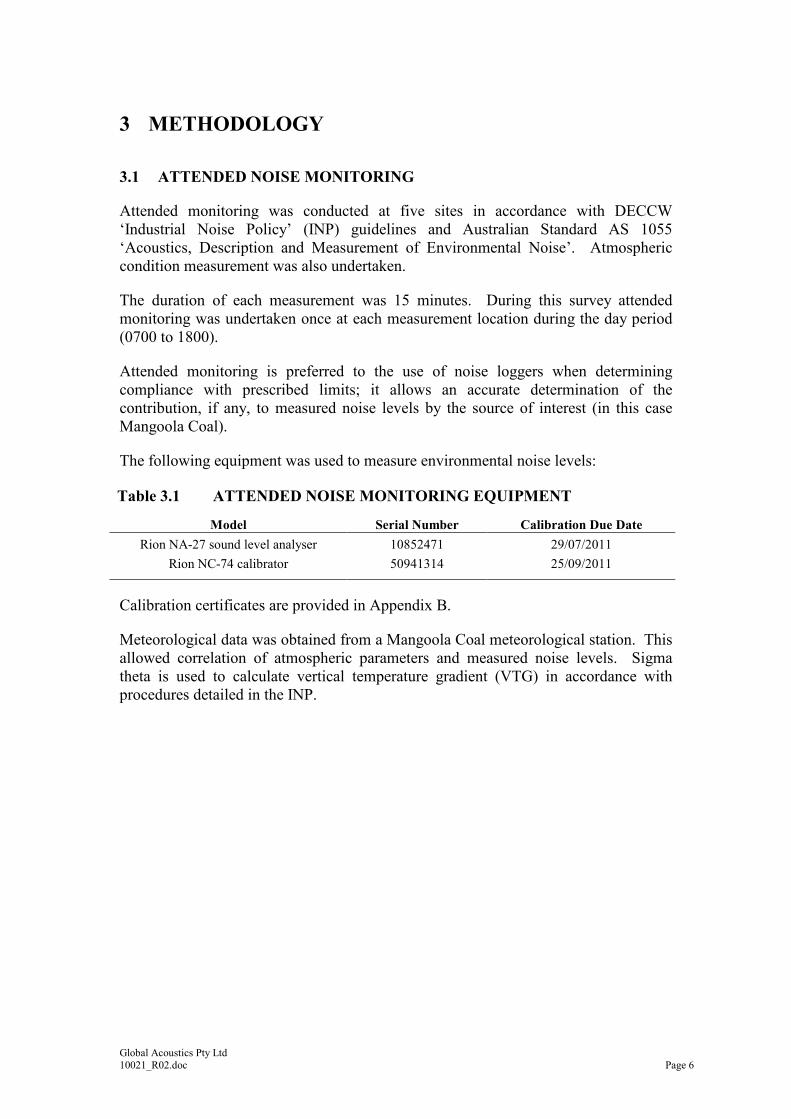
4 RESULTS
4.1 ATTENDED NOISE MONITORING
Overall noise levels measured at each location during attended measurement are
provided in Table 4.1.
Table 4.1 DAYTIME MEASURED NOISE LEVELS - 19 MARCH 2010
Location Start Date And Time LA1 dB LA10 dB LAeq dB LA90 dB
A1 19/03/2010 10:51 42 37 36 33
A2 19/03/2010 12:43 75 60 62 37
A3 19/03/2010 12:10 49 43 41 35
A4 19/03/2010 09:54 40 34 33 30
A5 19/03/2010 11:22 47 42 40 36
Note: Noise levels in this table are not necessarily the result of activities at Mangoola Coal.
Table 4.2 details LAeq noise levels from Mangoola Coal in the absence of other noise
sources. Criteria are then applied if weather conditions are in accordance with the
project approval. Discussion as to the noise sources responsible for these measured
levels is provided in Section 5 of this report.
Table 4.2 LAeq(15 min) GENERATED BY MANGOOLA COAL - 19 MARCH 2010
Location Date And Time Wind
Speed
(m/s) 7
VTG (o/C per
100m) 7
LAeq
Daytime
Criterion
dB 8
Criterion
Applies?1,5
MC
LAeq
dB 2,3
Exceedance4,6
A1 19/03/2010 10:51 3.6 3.0 34/35 N 32 NA
A2 19/03/2010 12:43 2.9 -1.0 36 Y IA Nil
A3 19/03/2010 12:10 2.7 0.5 37 N NM NA
A4 19/03/2010 09:54 3.6 3.0 39 N IA NA
A5 19/03/2010 11:22 2.8 -1.6 36/33 Y 319 Nil
Notes: 1. Noise emission limits apply for the following meteorological conditions:
• wind speeds of up to 3 m/s at 10 metres above ground level; or
• temperature inversion conditions of up to 3ºC/100m, and wind speeds of up to 2m/s at 10
metres above ground level
2. These are results for Mangoola Coal in the absence of all other noise sources;
3. NM denotes audible but not measurable, IA denotes inaudible;
4. Bolded results in red are those greater than the relevant criterion (if applicable);
5. Y denotes Yes, N denotes No;
6. NA in exceedance column means atmospheric conditions outside conditions specified in project
approval and so criterion is not applicable;
7. Wind speed and sigma theta data sourced from Mangoola Coal meteorological station. Sigma
theta data used to calculate Vertical Temperature Gradient (VTG) in accordance with procedures
detailed in the INP;
8. NA in criterion column means there is no criterion for this location as there is an agreement in
place or is owned by Mangoola Coal; and
9. In order to compare the monitored results with the relevant criterion, 5 dB has been taken off the
level measured at A5. This is a conservative result for the nearest residence to take account of
losses due to distance and intervening topography. See Section 2.4 of this report for further
explanation.
Global Acoustics Pty Ltd
10021_R02.doc Page 8
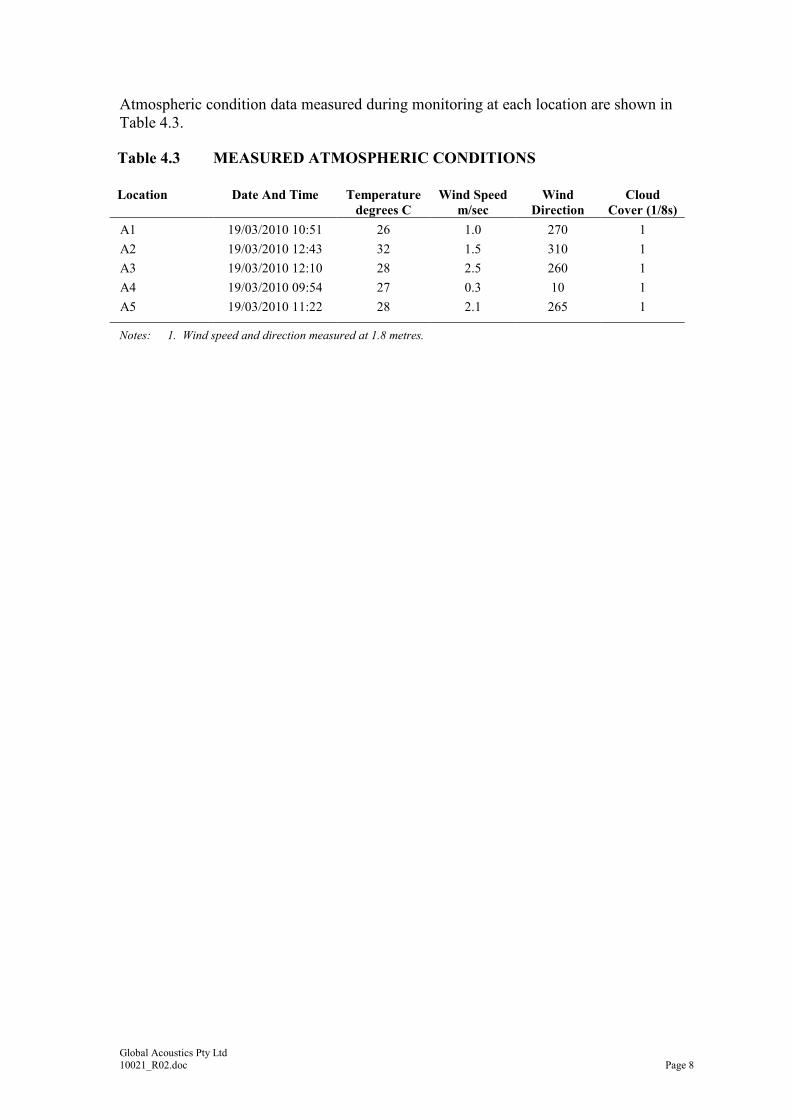
Atmospheric condition data measured during monitoring at each location are shown in
Table 4.3.
Table 4.3 MEASURED ATMOSPHERIC CONDITIONS
Location Date And Time Temperature
degrees C
Wind Speed
m/sec
Wind
Direction
Cloud
Cover (1/8s)
A1 19/03/2010 10:51 26 1.0 270 1
A2 19/03/2010 12:43 32 1.5 310 1
A3 19/03/2010 12:10 28 2.5 260 1
A4 19/03/2010 09:54 27 0.3 10 1
A5 19/03/2010 11:22 28 2.1 265 1
Notes: 1. Wind speed and direction measured at 1.8 metres.
Global Acoustics Pty Ltd
10021_R02.doc Page 9
5 DISCUSSION
5.1 NOTED NOISE SOURCES
Table 4.1 and Table 4.2 present data gathered during attended monitoring. These
noise levels are the result of many sounds reaching the sound level meter microphone
during monitoring. Received levels from various noise sources were noted during
attended monitoring and particular attention was paid to the extent of Mangoola
Coal’s contribution, if any, to measured levels. At each receptor location, Mangoola
Coal’s LAeq(15 minute) (in the absence of any other noise) was, where possible,
measured directly, or, determined by frequency analysis.
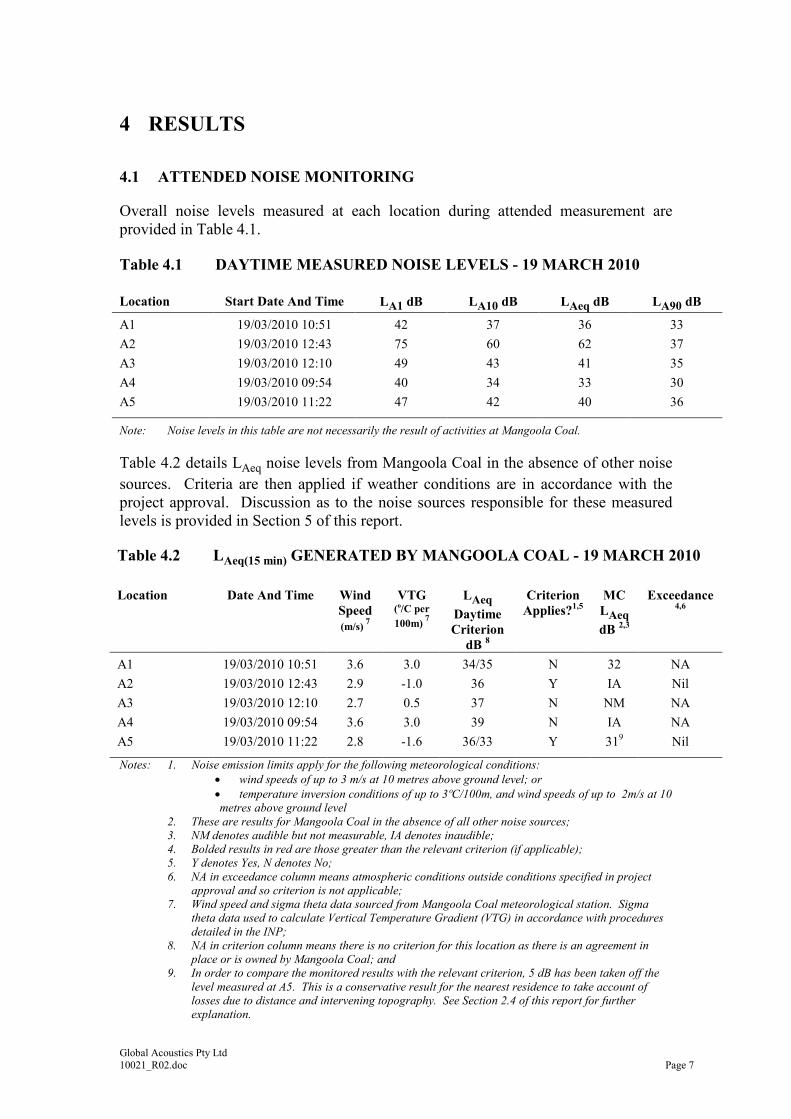
From these observations summaries have been derived for each location. The
following report sections provide these summaries. Statistical 1/3 octave band
analysis of environmental noise was undertaken, and the charts following in this
section display the frequency ranges for various noise sources at each location for
LA1, LA10, LA90, and LAeq. These figures also provide, graphically, statistical
information for these noise levels.
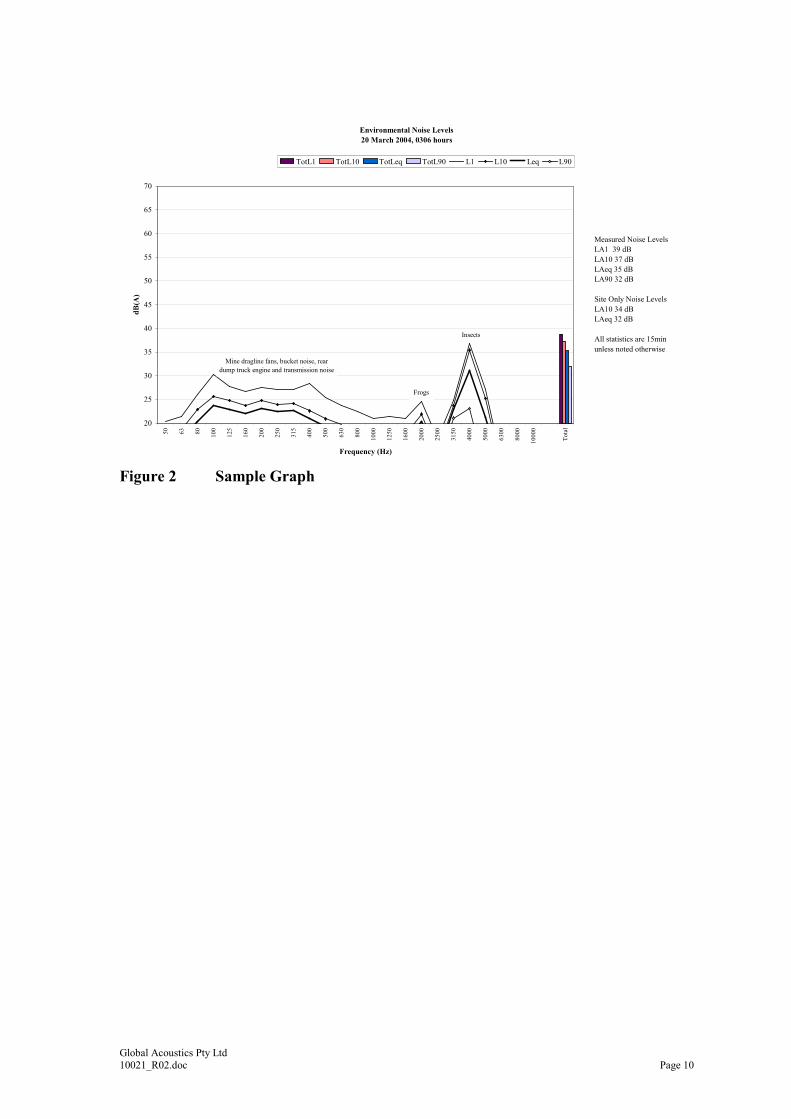
An example is provided as Figure 2 where it can be seen that frogs and insects are
generating noise at frequencies above 1000 Hz; mining noise is at frequencies less
than 1000 Hz (this is typical). Adding levels at frequencies that relate to mining only
allows separate statistical results to be calculated. This analysis cannot always be
performed if there are significant levels of other noise at the same frequencies as
mining; this can be dogs, cows, or, most commonly, road traffic.
It should be noted that the method of summing statistical values up to a cut-off
frequency can overstate the LA1 result by a small margin but is entirely accurate for
LAeq.
Global Acoustics Pty Ltd
10021_R02.doc Page 10
Figure 2 Sample Graph
Environmental Noise Levels
20 March 2004, 0306 hours
20
25
30
35
40
45
50
55
60
65
70
50
63
80
100
125
160
200
250
315
400
500
630
800
1000
1250
1600
2000
2500
3150
4000
5000
6300
8000
10000
Tota
l
Frequency (Hz)
dB(A)
TotL1 TotL10 TotLeq TotL90 L1 L10 Leq L90
Measured Noise Levels
LA1 39 dB
LA10 37 dB
LAeq 35 dB
LA90 32 dB
Site Only Noise Levels
LA10 34 dB
LAeq 32 dB
All statistics are 15min
unless noted otherwise
Insects
Frogs
Mine dragline fans, bucket noise, rear
dump truck engine and transmission noise
Global Acoustics Pty Ltd
10021_R02.doc Page 11
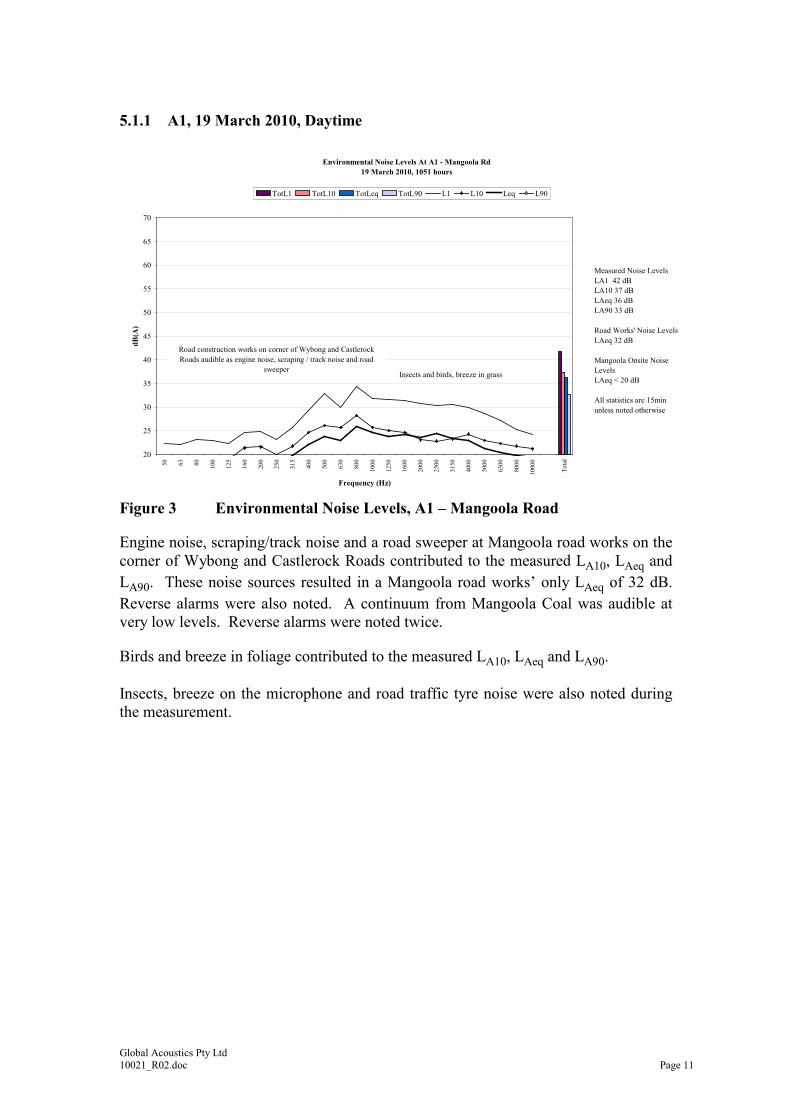
5.1.1 A1, 19 March 2010, Daytime
Figure 3 Environmental Noise Levels, A1 – Mangoola Road
Engine noise, scraping/track noise and a road sweeper at Mangoola road works on the
corner of Wybong and Castlerock Roads contributed to the measured LA10, LAeq and
LA90. These noise sources resulted in a Mangoola road works’ only LAeq of 32 dB.
Reverse alarms were also noted. A continuum from Mangoola Coal was audible at
very low levels. Reverse alarms were noted twice.
Birds and breeze in foliage contributed to the measured LA10, LAeq and LA90.
Insects, breeze on the microphone and road traffic tyre noise were also noted during
the measurement.
Environmental Noise Levels At A1 - Mangoola Rd
19 March 2010, 1051 hours
20
25
30
35
40
45
50
55
60
65
70
50
63
80
100
125
160
200
250
315
400
500
630
800
1000
1250
1600
2000
2500
3150
4000
5000
6300
8000
10000
Tota
l
Frequency (Hz)
dB(A)
TotL1 TotL10 TotLeq TotL90 L1 L10 Leq L90
Measured Noise Levels
LA1 42 dB
LA10 37 dB
LAeq 36 dB
LA90 33 dB
Road Works' Noise Levels
LAeq 32 dB
Mangoola Onsite Noise
Levels
LAeq < 20 dB
All statistics are 15min
unless noted otherwise
Road construction works on corner of Wybong and Castlerock
Roads audible as engine noise, scraping / track noise and road
sweeperInsects and birds, breeze in grass
Global Acoustics Pty Ltd
10021_R02.doc Page 12
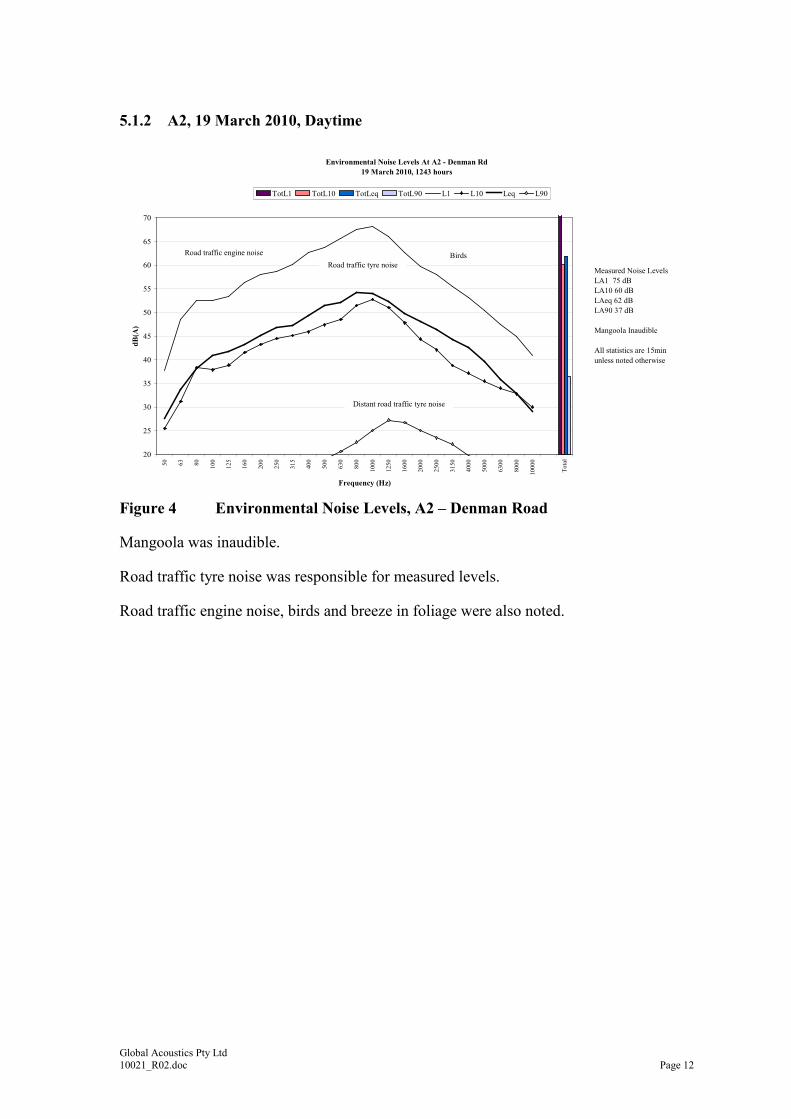
5.1.2 A2, 19 March 2010, Daytime
Figure 4 Environmental Noise Levels, A2 – Denman Road
Mangoola was inaudible.
Road traffic tyre noise was responsible for measured levels.
Road traffic engine noise, birds and breeze in foliage were also noted.
Environmental Noise Levels At A2 - Denman Rd
19 March 2010, 1243 hours
20
25
30
35
40
45
50
55
60
65
70
50
63
80
100
125
160
200
250
315
400
500
630
800
1000
1250
1600
2000
2500
3150
4000
5000
6300
8000
10000
Tota
l
Frequency (Hz)
dB(A)
TotL1 TotL10 TotLeq TotL90 L1 L10 Leq L90
Measured Noise Levels
LA1 75 dB
LA10 60 dB
LAeq 62 dB
LA90 37 dB
Mangoola Inaudible
All statistics are 15min
unless noted otherwise
BirdsRoad traffic engine noise
Road traffic tyre noise
Distant road traffic tyre noise
Global Acoustics Pty Ltd
10021_R02.doc Page 13
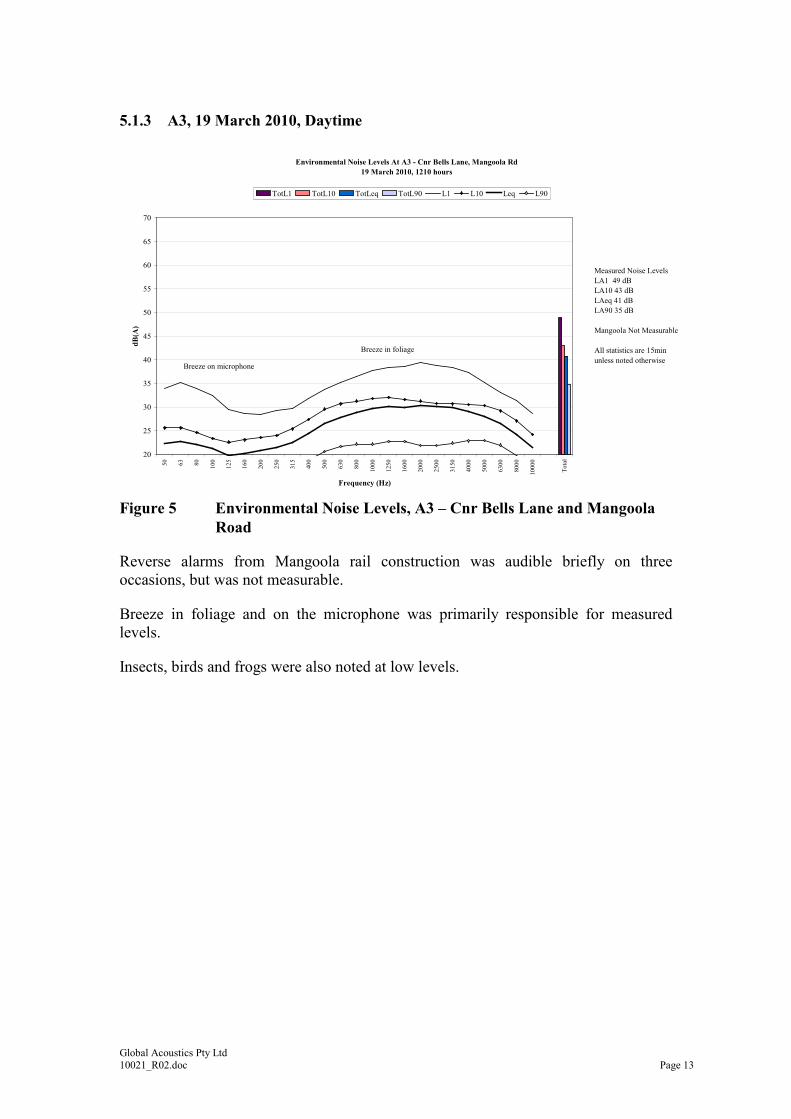
5.1.3 A3, 19 March 2010, Daytime
Figure 5 Environmental Noise Levels, A3 – Cnr Bells Lane and Mangoola
Road
Reverse alarms from Mangoola rail construction was audible briefly on three
occasions, but was not measurable.
Breeze in foliage and on the microphone was primarily responsible for measured
levels.
Insects, birds and frogs were also noted at low levels.
Environmental Noise Levels At A3 - Cnr Bells Lane, Mangoola Rd
19 March 2010, 1210 hours
20
25
30
35
40
45
50
55
60
65
70
50
63
80
100
125
160
200
250
315
400
500
630
800
1000
1250
1600
2000
2500
3150
4000
5000
6300
8000
10000
Tota
l
Frequency (Hz)
dB(A)
TotL1 TotL10 TotLeq TotL90 L1 L10 Leq L90
Measured Noise Levels
LA1 49 dB
LA10 43 dB
LAeq 41 dB
LA90 35 dB
Mangoola Not Measurable
All statistics are 15min
unless noted otherwiseBreeze on microphone
Breeze in foliage
Global Acoustics Pty Ltd
10021_R02.doc Page 14
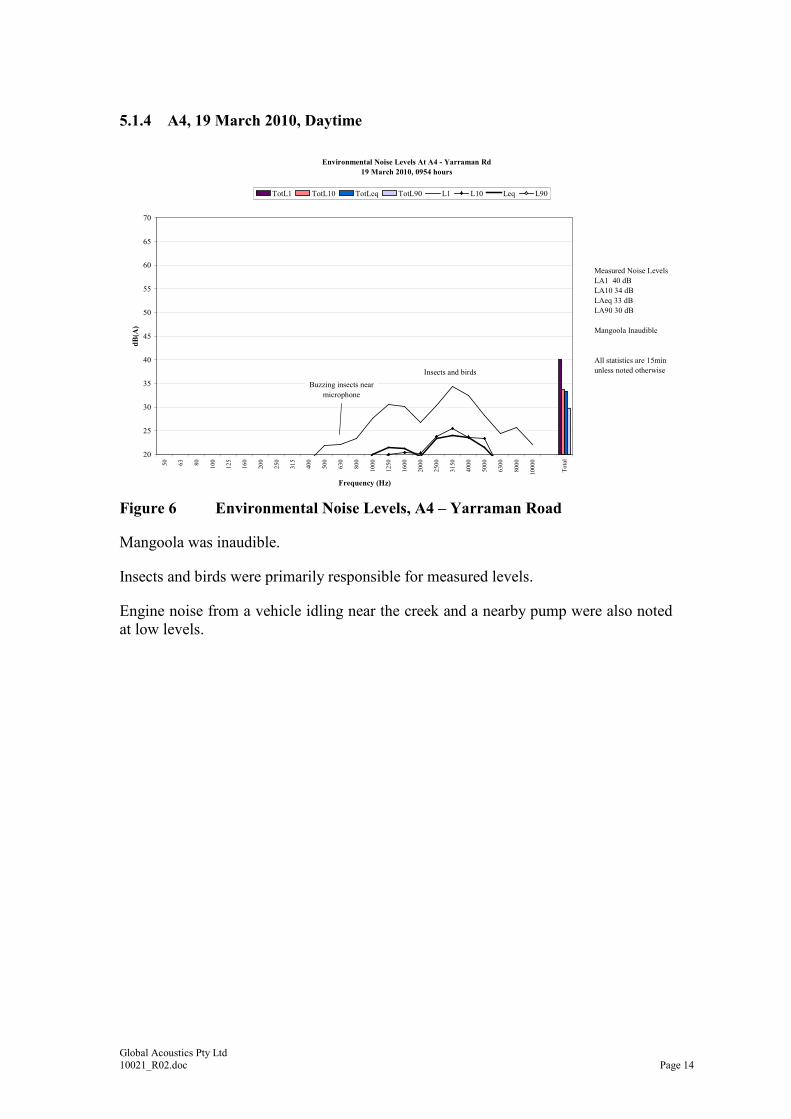
5.1.4 A4, 19 March 2010, Daytime
Figure 6 Environmental Noise Levels, A4 – Yarraman Road
Mangoola was inaudible.
Insects and birds were primarily responsible for measured levels.
Engine noise from a vehicle idling near the creek and a nearby pump were also noted
at low levels.
Environmental Noise Levels At A4 - Yarraman Rd
19 March 2010, 0954 hours
20
25
30
35
40
45
50
55
60
65
70
50
63
80
100
125
160
200
250
315
400
500
630
800
1000
1250
1600
2000
2500
3150
4000
5000
6300
8000
10000
Tota
l
Frequency (Hz)
dB(A)
TotL1 TotL10 TotLeq TotL90 L1 L10 Leq L90
Measured Noise Levels
LA1 40 dB
LA10 34 dB
LAeq 33 dB
LA90 30 dB
Mangoola Inaudible
All statistics are 15min
unless noted otherwiseInsects and birds
Buzzing insects near
microphone
Global Acoustics Pty Ltd
10021_R02.doc Page 15
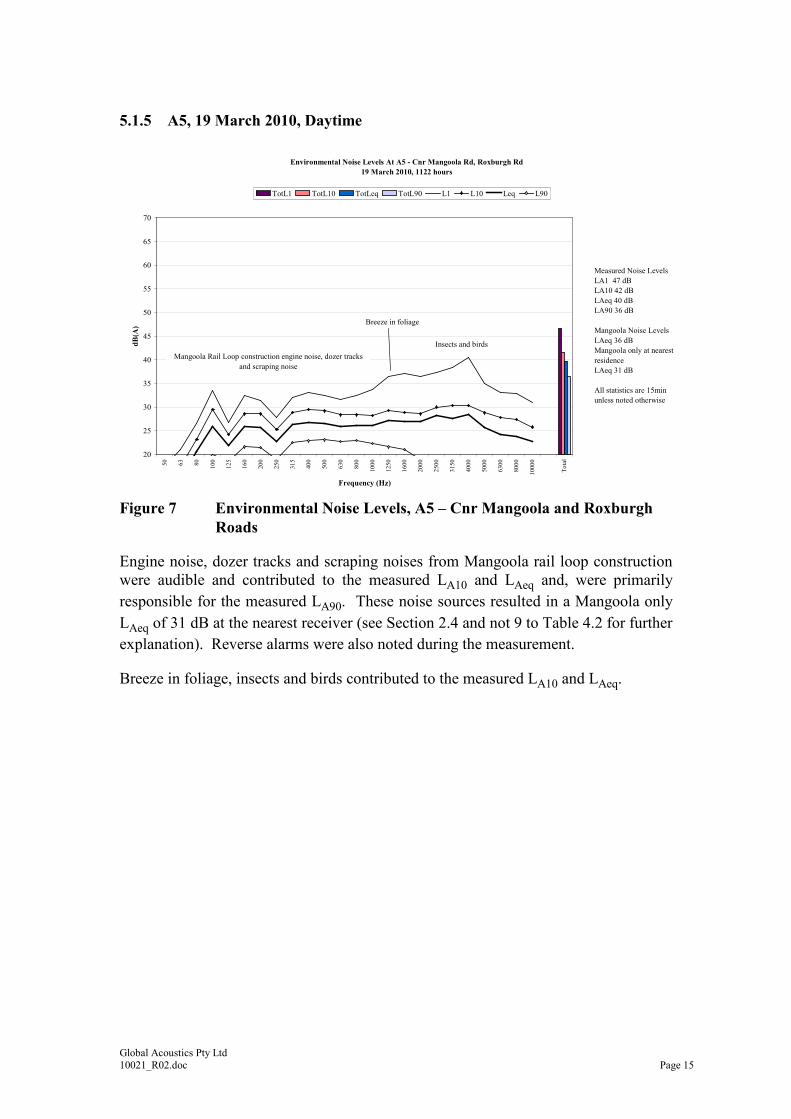
5.1.5 A5, 19 March 2010, Daytime
Figure 7 Environmental Noise Levels, A5 – Cnr Mangoola and Roxburgh
Roads
Engine noise, dozer tracks and scraping noises from Mangoola rail loop construction
were audible and contributed to the measured LA10 and LAeq and, were primarily
responsible for the measured LA90. These noise sources resulted in a Mangoola only
LAeq of 31 dB at the nearest receiver (see Section 2.4 and not 9 to Table 4.2 for further
explanation). Reverse alarms were also noted during the measurement.
Breeze in foliage, insects and birds contributed to the measured LA10 and LAeq.
Environmental Noise Levels At A5 - Cnr Mangoola Rd, Roxburgh Rd
19 March 2010, 1122 hours
20
25
30
35
40
45
50
55
60
65
70
50
63
80
100
125
160
200
250
315
400
500
630
800
1000
1250
1600
2000
2500
3150
4000
5000
6300
8000
10000
Tota
l
Frequency (Hz)
dB(A)
TotL1 TotL10 TotLeq TotL90 L1 L10 Leq L90
Measured Noise Levels
LA1 47 dB
LA10 42 dB
LAeq 40 dB
LA90 36 dB
Mangoola Noise Levels
LAeq 36 dB
Mangoola only at nearest
residence
LAeq 31 dB
All statistics are 15min
unless noted otherwise
Mangoola Rail Loop construction engine noise, dozer tracks
and scraping noise
Insects and birds
Breeze in foliage
Global Acoustics Pty Ltd
10021_R02.doc Page 16
6 SUMMARY
6.1 SUMMARY
A noise survey was conducted around Mangoola Coal during the day period of
19 March 2010. The purpose of the survey was to quantify and describe the acoustic
environment around the site and compare the results with development consent
conditions for the operations.
As shown in Table 4.2, Mangoola Coal complied with the relevant day consent
LAeq(15 minute) noise limits, where applicable, during Quarter 1 2010.
Global Acoustics Pty Ltd
Global Acoustics Pty Ltd
10021_R02.doc
Appendix
A: Development Consent
Global Acoustics Pty Ltd
10021_R02.doc Page A.1
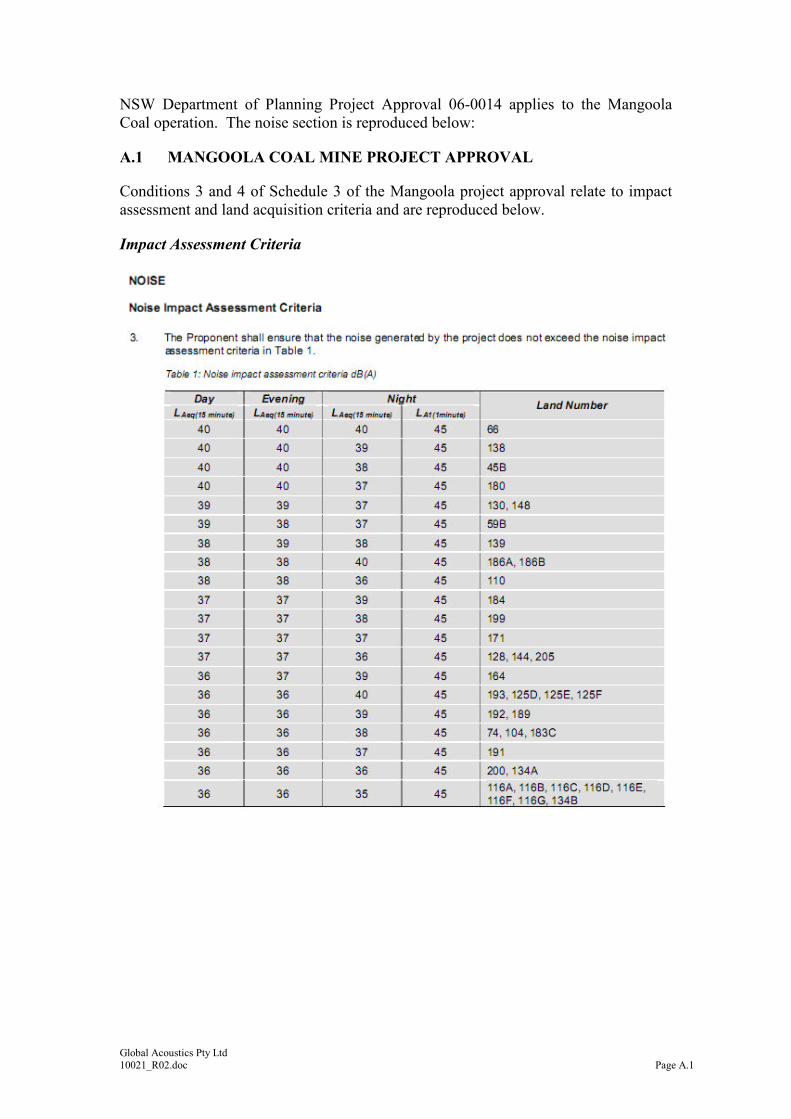
NSW Department of Planning Project Approval 06-0014 applies to the Mangoola
Coal operation. The noise section is reproduced below:
A.1 MANGOOLA COAL MINE PROJECT APPROVAL
Conditions 3 and 4 of Schedule 3 of the Mangoola project approval relate to impact
assessment and land acquisition criteria and are reproduced below.
Impact Assessment Criteria
Global Acoustics Pty Ltd
10021_R02.doc Page A.2
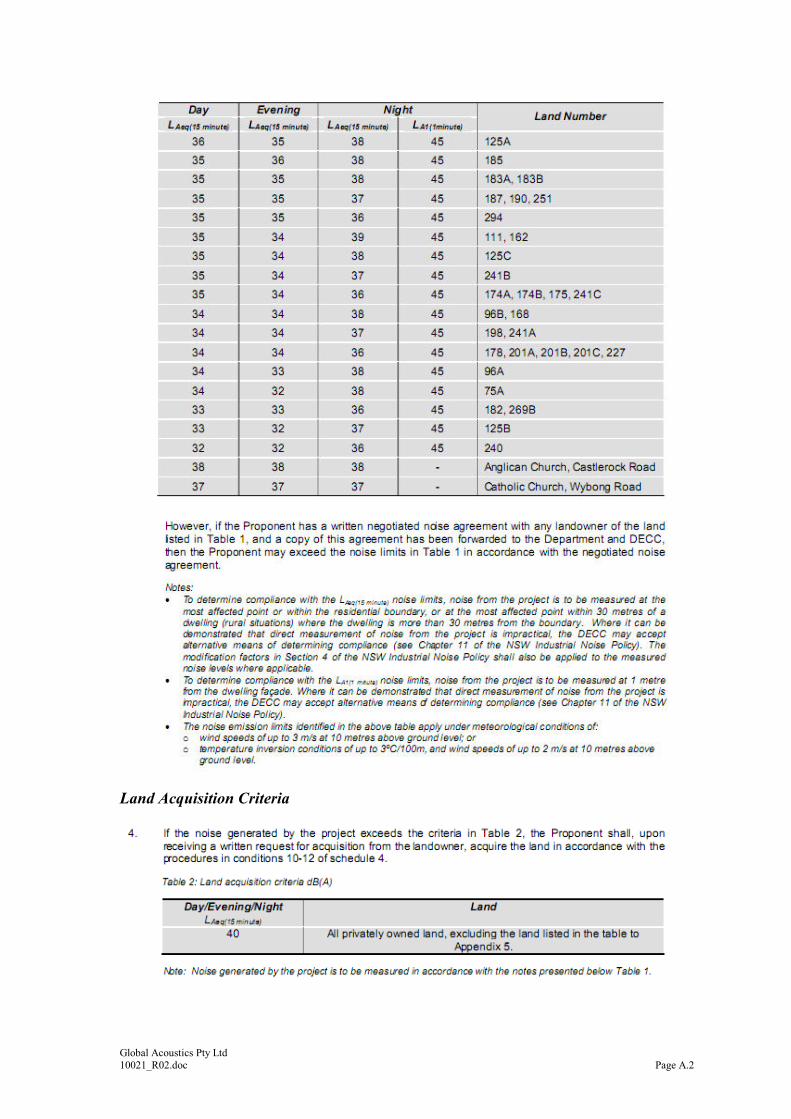
Land Acquisition Criteria
Global Acoustics Pty Ltd
10021_R02.doc Page A.3
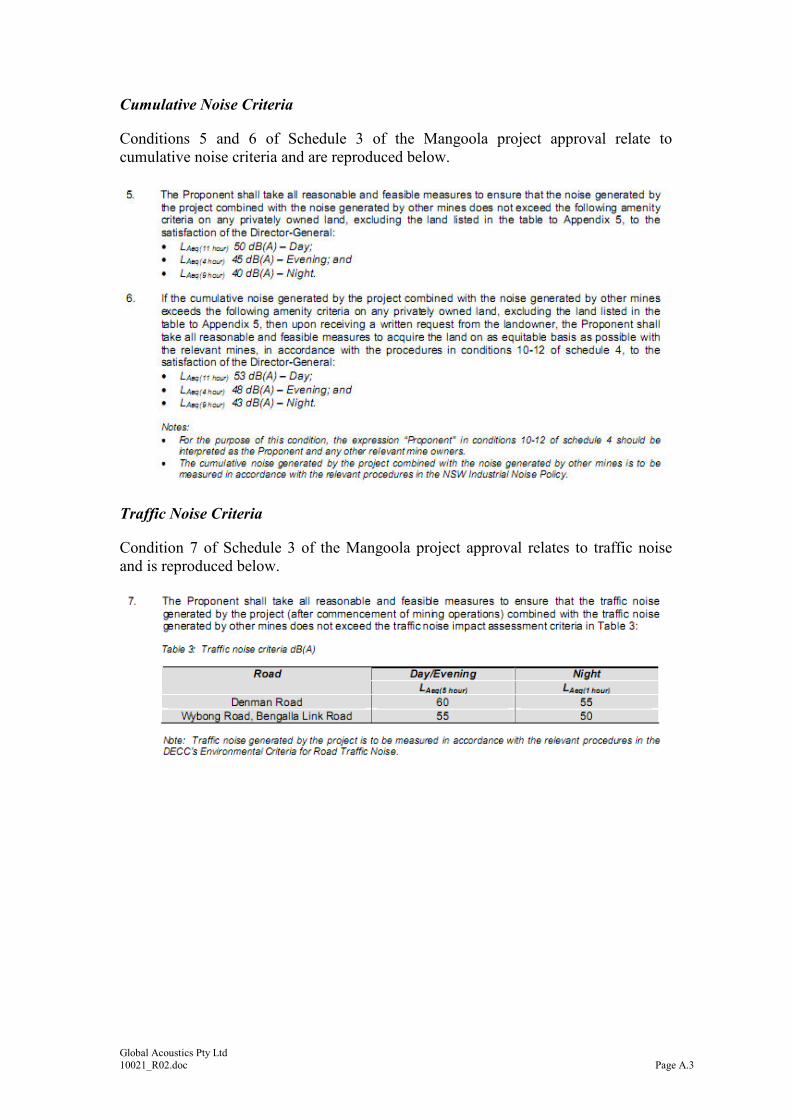
Cumulative Noise Criteria
Conditions 5 and 6 of Schedule 3 of the Mangoola project approval relate to
cumulative noise criteria and are reproduced below.
Traffic Noise Criteria
Condition 7 of Schedule 3 of the Mangoola project approval relates to traffic noise
and is reproduced below.
Global Acoustics Pty Ltd
10021_R02.doc Page A.4
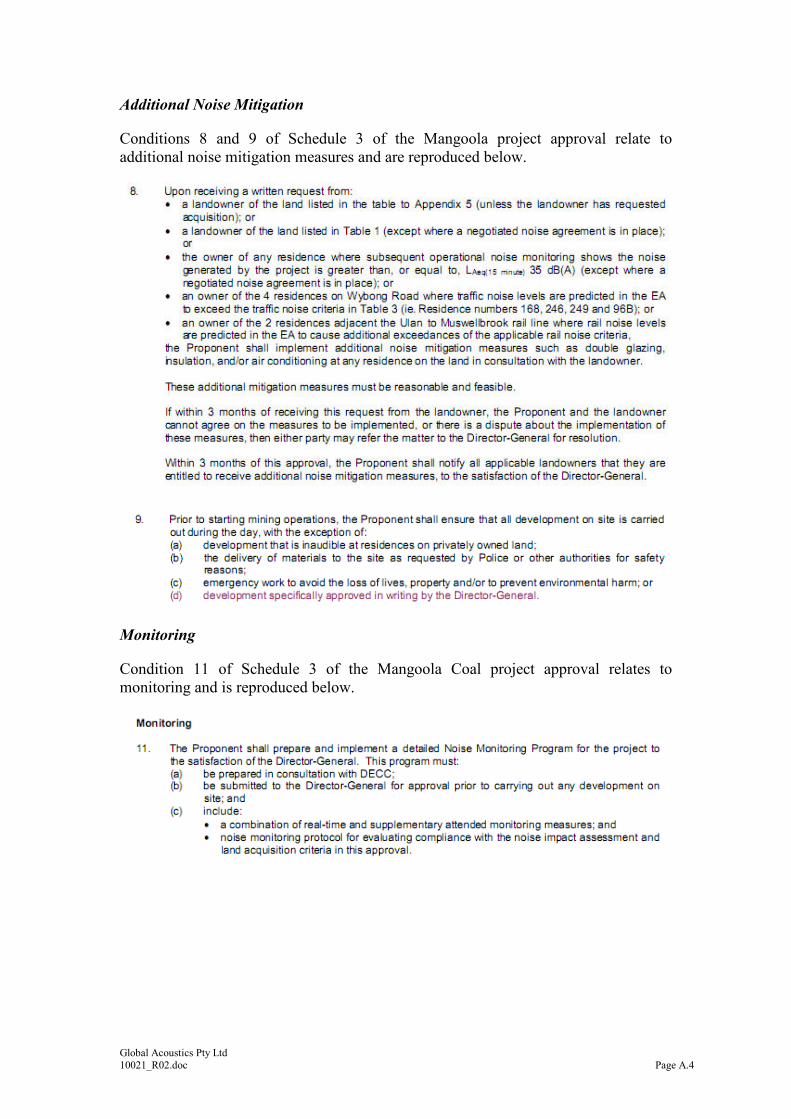
Additional Noise Mitigation
Conditions 8 and 9 of Schedule 3 of the Mangoola project approval relate to
additional noise mitigation measures and are reproduced below.
Monitoring
Condition 11 of Schedule 3 of the Mangoola Coal project approval relates to
monitoring and is reproduced below.
Global Acoustics Pty Ltd
10021_R02.doc Page A.5
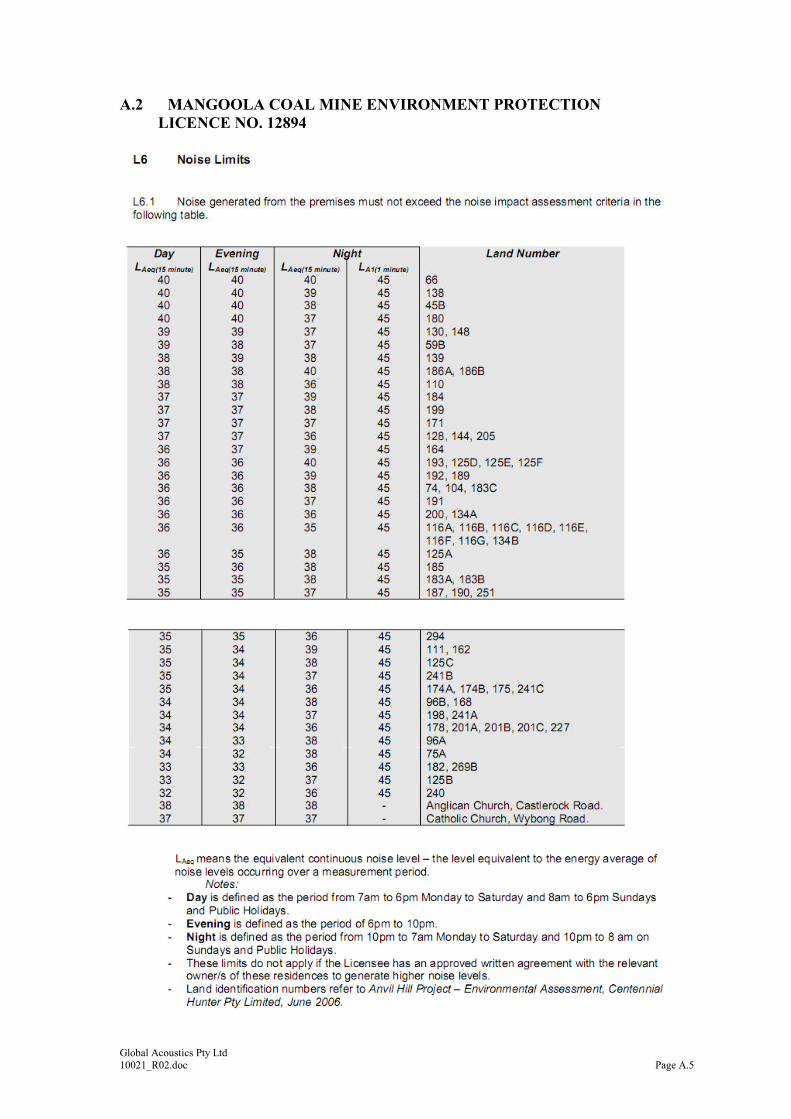
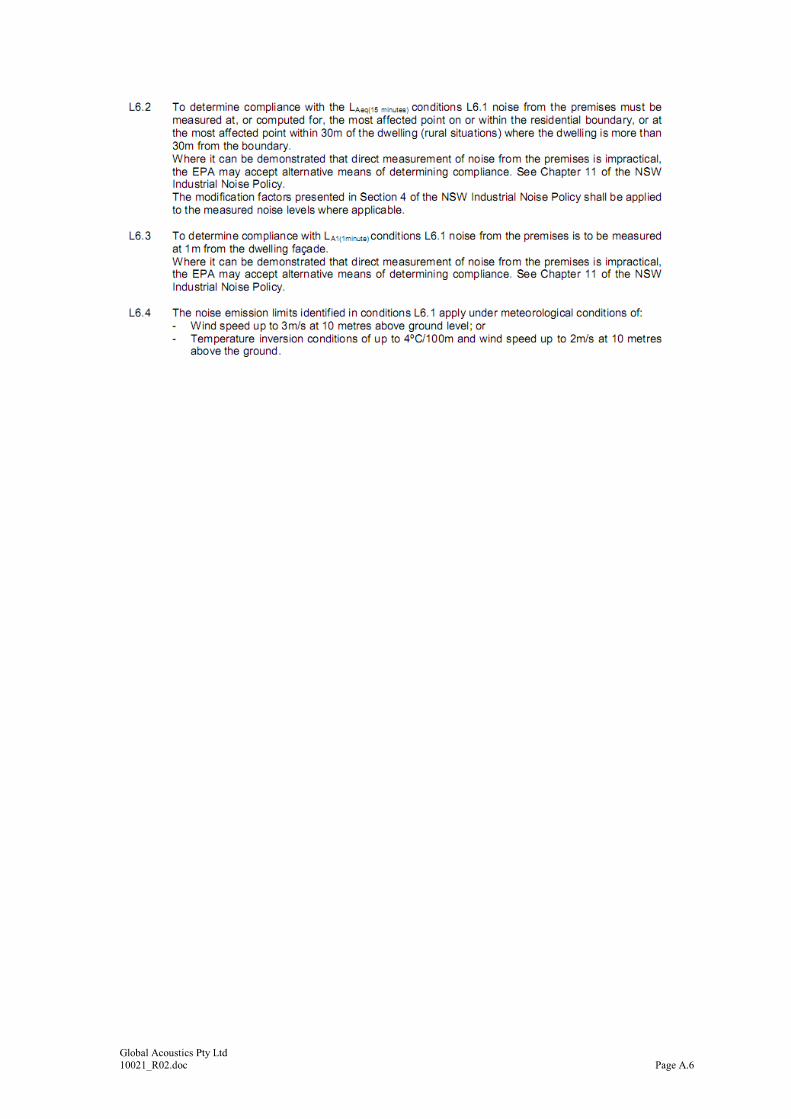
A.2 MANGOOLA COAL MINE ENVIRONMENT PROTECTION
LICENCE NO. 12894
Global Acoustics Pty Ltd
10021_R02.doc Page A.6
Global Acoustics Pty Ltd
10021_R02.doc
Appendix
B: Calibration Certificates
Global Acoustics Pty Ltd
10021_R02.doc Page B.1
Global Acoustics Pty Ltd
10021_R02.doc Page B.2