Embed Size (px)
Citation preview
RESEARCH ARTICLE Open Access
Mango (Mangifera indica L.) germplasmdiversity based on single nucleotidepolymorphisms derived from thetranscriptomeAmir Sherman1*, Mor Rubinstein1, Ravit Eshed1, Miri Benita1, Mazal Ish-Shalom1, Michal Sharabi-Schwager1,2,Ada Rozen1, David Saada1, Yuval Cohen1 and Ron Ophir1*
Abstract
Background: Germplasm collections are an important source for plant breeding, especially in fruit trees which havea long duration of juvenile period. Thus, efforts have been made to study the diversity of fruit tree collections. Eventhough mango is an economically important crop, most of the studies on diversity in mango collections have beenconducted with a small number of genetic markers.
Results: We describe a de novo transcriptome assembly from mango cultivar ‘Keitt’. Variation discovery was performedusing Illumina resequencing of ‘Keitt’ and ‘Tommy Atkins’ cultivars identified 332,016 single-nucleotide polymorphisms(SNPs) and 1903 simple-sequence repeats (SSRs). Most of the SSRs (70.1 %) were of trinucleotide with thepreponderance of motif (GGA/AAG)n and only 23.5 % were di-nucleotide SSRs with the mostly of (AT/AT)nmotif. Further investigation of the diversity in the Israeli mango collection was performed based on a subset of293 SNPs. Those markers have divided the Israeli mango collection into two major groups: one group includedmostly mango accessions from Southeast Asia (Malaysia, Thailand, Indonesia) and India and the other withmainly of Floridian and Israeli mango cultivars. The latter group was more polymorphic (FS = −0.1 on theaverage) and was more of an admixture than the former group. A slight population differentiation wasdetected (FST = 0.03), suggesting that if the mango accessions of the western world apparently was originated fromSoutheast Asia, as has been previously suggested, the duration of cultivation was not long enough to develop adistinct genetic background.
Conclusions: Whole-transcriptome reconstruction was used to significantly broaden the mango’s genetic variationresources, i.e., SNPs and SSRs. The set of SNP markers described in this study is novel. A subset of SNPs was sampled toexplore the Israeli mango collection and most of them were polymorphic in many mango accessions. Therefore, webelieve that these SNPs will be valuable as they recapitulate and strengthen the history of mango diversity.
Keywords: Mango, Genetic diversity, Transcriptome, SNP, SSR
* Correspondence: [email protected]; [email protected] of Fruit Trees Sciences, Institute of Plant Sciences, AgriculturalResearch Organization, Volcani Center, Rishon Lezion, IsraelFull list of author information is available at the end of the article
© 2015 Sherman et al. Open Access This article is distributed under the terms of the Creative Commons Attribution 4.0International License (http://creativecommons.org/licenses/by/4.0/), which permits unrestricted use, distribution, andreproduction in any medium, provided you give appropriate credit to the original author(s) and the source, provide a link tothe Creative Commons license, and indicate if changes were made. The Creative Commons Public Domain Dedication waiver(http://creativecommons.org/publicdomain/zero/1.0/) applies to the data made available in this article, unless otherwise stated.
Sherman et al. BMC Plant Biology (2015) 15:277 DOI 10.1186/s12870-015-0663-6
BackgroundThe origin of Mangifera indica L. species which includesall commercial cultivars is still undetermined. The genusMangifera has approximately 70 members which are lo-cated mostly on the Malay peninsula, in the Indonesianarchipelago, in Thailand and in the Philippines [1, 2].Some of these species have edible fruit which are locallycultivated. Mango cultivation began a few thousandyears ago in India. It first spread from Southeast Asia,only several hundred years ago, with the Portuguese andSpaniards to Africa, Central and South America. In re-cent years mango has become common in most tropicaland subtropical regions. India together with severalother countries in Southeast Asia is the main growingand production center for mango. Hundreds of knowncultivars has been isolated in the last few hundred yearsin several mango growing countries, mainly in India,and in the Pacific islands [2]. A secondary mango centerflourished in Florida during the late nineteenth centuryand early twentieth century, and many new Floridiancultivars were promoted [3]. These cultivars are adaptedto the taste of the Western consumer by breeding to ared blush coloration, mild taste and mild aroma idoe-type. However, there is still some demand for cultivarimprovement, and several breeding programs are activein Australia, South Africa, Brazil and Israel [4].Germplasm collections are important for genotypic and
phenotypic analyses, and as a genetic resource in breedingprograms. Knowledge of the diversity and the geneticstructure of these collections is a fundamental for associ-ation studies and controlled breeding [5]. Despite themango economic importance, the available genetic andgenomic resources for mango cannot support modernbreeding or the study of the molecular mechanisms under-lying mango’s physiology. A limited genetic map with verylow resolution has been created for mango [6]. A few stud-ies have attempted to decipher relationship among mangocultivar collections worldwide [7–14]. Twenty five Florid-ian accessions from the USDA collection were groupedinto two clusters based on 28 random amplified poly-morphic DNA (RAPD) markers [15]. One cluster wascomprised of a group of Floridian accessions that areclosely related to the Indian cultivar ‘Mulgoba’ whereas theother cluster contained a group of more distant accessions.A sample from the Floridian groups was also includedin a work on the relationship of 22 mango accessionsfrom the Thai mango collection. The variability of theThai accessions was high and they were not distin-guishable from the Floridian accessions, apparently be-cause most of them were seedlings [8]. The Pakistaniancollection mostly included Indian-originated mango acces-sions. Based on RAPD analysis of 44 loci due to high diver-sity in mango, only the southern Indian accessions couldbe separated from northern and eastern ones [10]. Two
other studies investigated the association between geneticdiversity and geographical properties of accessions in India[16, 17]. Those studies weakly separated the northern andeastern accessions from the southern and western ones. ASpanish research group showed that 16 simple-sequencerepeats (SSRs) can differentiate the Floridian cultivarsfrom the Indian and the Filipino ones in the 28 ac-cessions of a Spanish collection [18].Recently, the genetic diversity of mangoes originated
from Andhra Pradesh, the major mango breeding area inIndia, was studied based on 106 polymorphic SSRs. Ac-cessions of the same ideotype (juicy, pickle, table) weremore related to each other but did not show any significantdifferentiation [19]. Further support for the high diversity ofmango came from a study of six Colombian cultivar groupsshowing that the diversity within the six groups is as highas the diversity between them, which indicating very minorpopulation divergence [11]. A broader survey of mangocollection, including many geographical locations, wasperformed in Australia with the caveat of a low numberof markers (11 SSRs) [13, 20]. The mangoes were suc-cessfully classified into five geographical origins how-ever an attempt to classify the accessions by mono- orpolyembryonic phenotype was unsuccessful.Molecular efforts to create wide genomic and genetic
data for mango are in their initial stages. These effortshave included establishment of a leaf transcriptome [21]and fruit transcriptomes at different developmental andripening stages [22–25]. Next generation sequencing(NGS) technologies are excellent tools for genome-widemarker discovery and exposing genetic variation [26].De novotranscriptome sequencing is one solution for marker discov-ery, gene expression analysis and exposing genetic variabilityin organisms with no genomic infrastructure such as olives,Chinese chestnut, carrot and pomegranate [27–31]. Largescale sets of genetic markers can be used to establish geneticmaps. These maps can then be utilized for plant breeding andbe utilized for anchoring in de novo genome assemblies.Moreover, studying the genetic variation of the germplasmcollection can give insights into the historical basis of the di-versity and can additionally be used for genome wide associ-ation studies in order to identify markers linked withimportant horticultural traits for plant breeding [32].In the present work we describe our effort to broaden the
transcriptome resources for mango by sequencing RNA fromvarious tissues and fruit stages. Using 454-GS FLX Titaniumtechnology we reconstructed a large portion of the ‘Keitt’mango transcriptome and used it as a reference for aligningresequencing results. Resequencing of the ‘Keitt’ transcrip-tome itself as well as another mango accession,‘TommyAtkins’, by Illumina HiSeq 2000 was used to discover alarge set of genetic variation. A subset of that variationwas utilized in order to explore the Israeli mango collec-tion which comprises cultivars from several world regions.
Sherman et al. BMC Plant Biology (2015) 15:277 Page 2 of 11
Results and discussionGenic variation is a very useful resource for markerassisted selection (MAS) and association studies. There-fore RNA samples of two mango accessions, ‘TommyAtkins’ and ‘Keitt’, were obtained from a pool of tissues(young leaves, young inflorescences, young fruit, flesh andpeels of mature fruit) as a representative transcriptome(hereafter Pool transcriptome). By pooling we expected tocompensate for tissue-specific gene expression. Variationdiscovery in the transcriptome was performed in twosteps. First, de novo assembly of the whole transcriptomewas performed by 454-GS FLX Titanium sequencing of‘Keitt’. Second, resequencing of both mango cultivars,‘Tommy Atkins’ and ‘Keitt’, was aligned to ‘Keitt’ de novoassembly contigs to obtain high coverage and thereforehigh accuracy of allele identification [33].
Assembly and annotation of the reference transcriptomeThe sequencing of ‘Keitt’ using 454-GS FLX Titanium wasyielded 1,329,313 reads. After filtering out low quality andempty reads, de novo assembly was performed on 1,113,875reads resulting in 60,997 contigs. These contigs were thenreassembled into super-contigs using the CAP3 program [34].Ten percent of the contigs (6396) were assembled into super-contigs most (90 %) of which comprised 2 to 3 contigs.Altogether, the assembled ‘Keitt’ transcriptome contained47,956 singleton contigs and super-contigs (hereafter mangocontigs). We compared the results of the assembly in thiswork with two additional published assemblies that werebased on a different sequencing strategy [21, 23]. Those
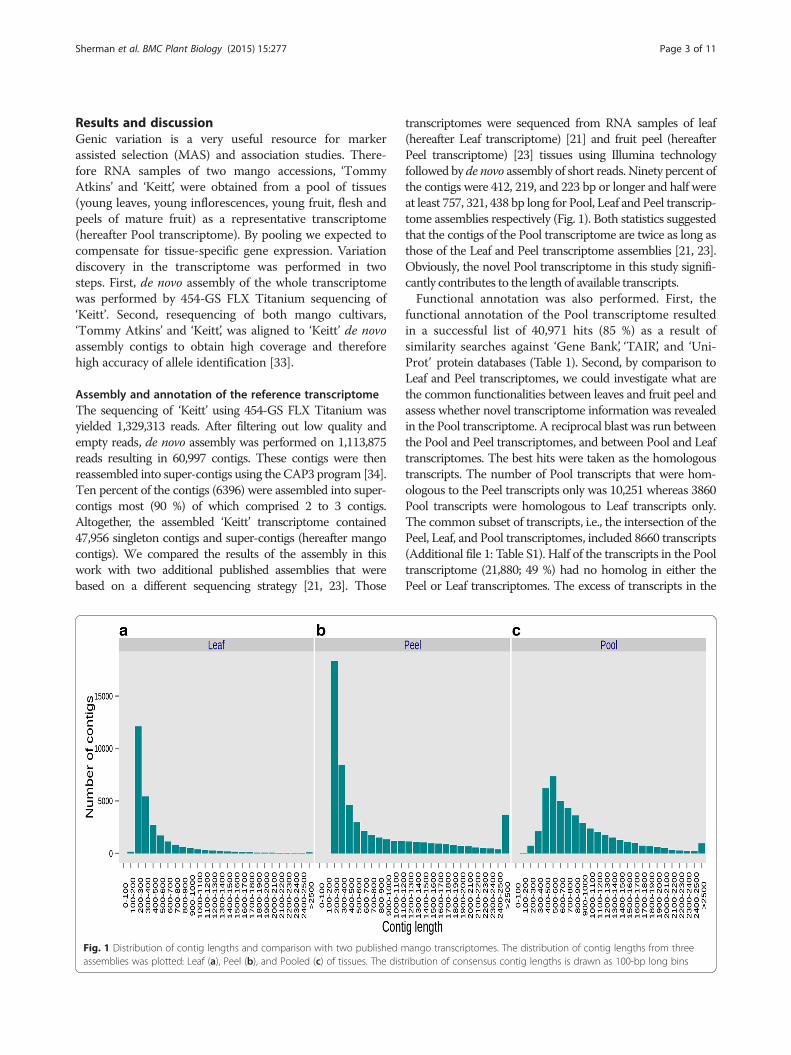
transcriptomes were sequenced from RNA samples of leaf(hereafter Leaf transcriptome) [21] and fruit peel (hereafterPeel transcriptome) [23] tissues using Illumina technologyfollowed by de novo assembly of short reads. Ninety percent ofthe contigs were 412, 219, and 223 bp or longer and half wereat least 757, 321, 438 bp long for Pool, Leaf and Peel transcrip-tome assemblies respectively (Fig. 1). Both statistics suggestedthat the contigs of the Pool transcriptome are twice as long asthose of the Leaf and Peel transcriptome assemblies [21, 23].Obviously, the novel Pool transcriptome in this study signifi-cantly contributes to the length of available transcripts.Functional annotation was also performed. First, the
functional annotation of the Pool transcriptome resultedin a successful list of 40,971 hits (85 %) as a result ofsimilarity searches against ‘Gene Bank’, ‘TAIR’, and ‘Uni-Prot’ protein databases (Table 1). Second, by comparison toLeaf and Peel transcriptomes, we could investigate what arethe common functionalities between leaves and fruit peel andassess whether novel transcriptome information was revealedin the Pool transcriptome. A reciprocal blast was run betweenthe Pool and Peel transcriptomes, and between Pool and Leaftranscriptomes. The best hits were taken as the homologoustranscripts. The number of Pool transcripts that were hom-ologous to the Peel transcripts only was 10,251 whereas 3860Pool transcripts were homologous to Leaf transcripts only.The common subset of transcripts, i.e., the intersection of thePeel, Leaf, and Pool transcriptomes, included 8660 transcripts(Additional file 1: Table S1). Half of the transcripts in the Pooltranscriptome (21,880; 49 %) had no homolog in either thePeel or Leaf transcriptomes. The excess of transcripts in the
Fig. 1 Distribution of contig lengths and comparison with two published mango transcriptomes. The distribution of contig lengths from threeassemblies was plotted: Leaf (a), Peel (b), and Pooled (c) of tissues. The distribution of consensus contig lengths is drawn as 100-bp long bins
Sherman et al. BMC Plant Biology (2015) 15:277 Page 3 of 11
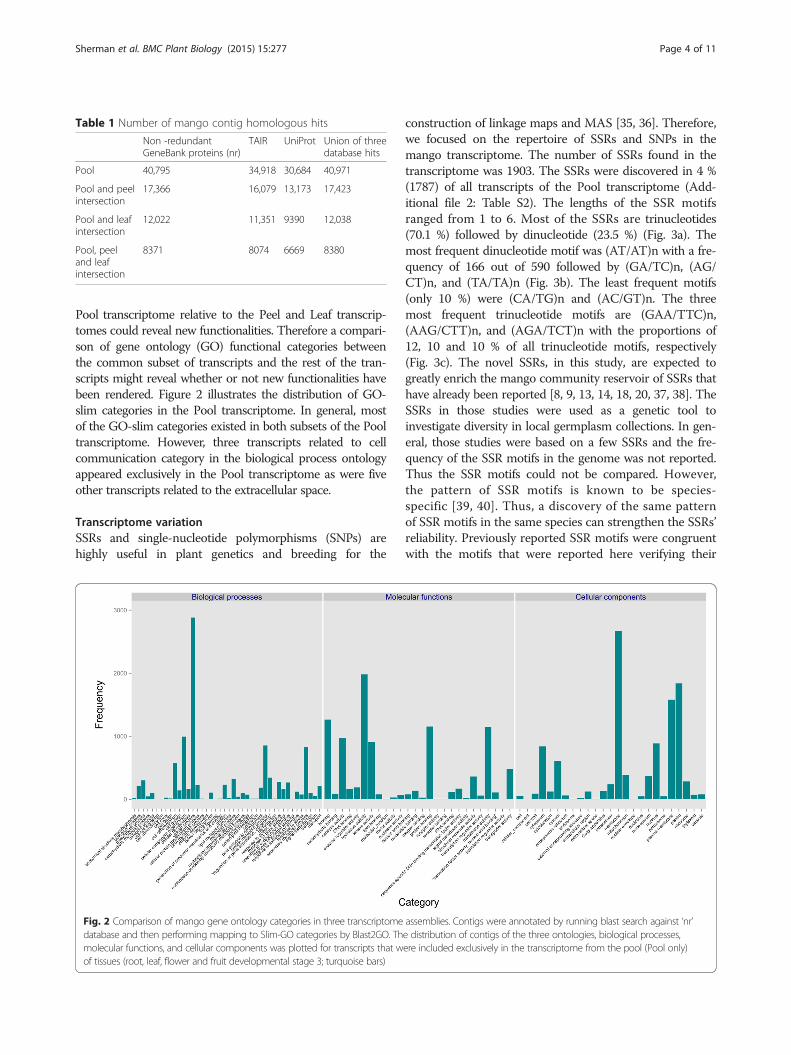
Pool transcriptome relative to the Peel and Leaf transcrip-tomes could reveal new functionalities. Therefore a compari-son of gene ontology (GO) functional categories betweenthe common subset of transcripts and the rest of the tran-scripts might reveal whether or not new functionalities havebeen rendered. Figure 2 illustrates the distribution of GO-slim categories in the Pool transcriptome. In general, mostof the GO-slim categories existed in both subsets of the Pooltranscriptome. However, three transcripts related to cellcommunication category in the biological process ontologyappeared exclusively in the Pool transcriptome as were fiveother transcripts related to the extracellular space.
Transcriptome variationSSRs and single-nucleotide polymorphisms (SNPs) arehighly useful in plant genetics and breeding for the
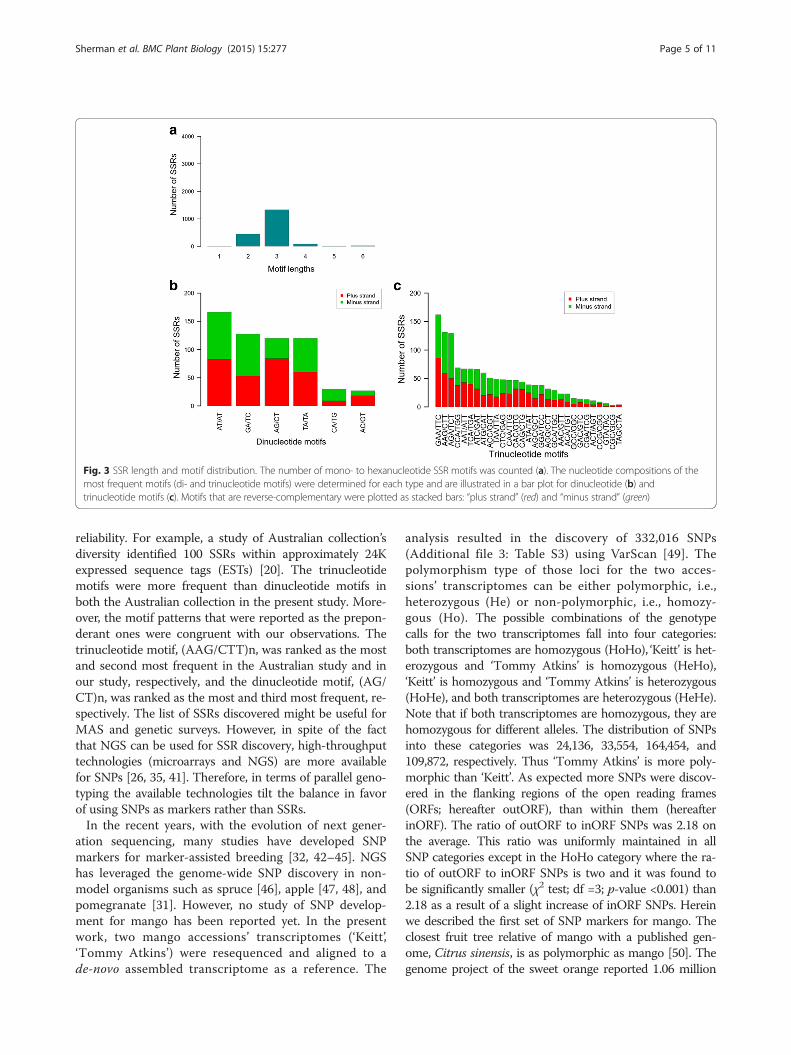
construction of linkage maps and MAS [35, 36]. Therefore,we focused on the repertoire of SSRs and SNPs in themango transcriptome. The number of SSRs found in thetranscriptome was 1903. The SSRs were discovered in 4 %(1787) of all transcripts of the Pool transcriptome (Add-itional file 2: Table S2). The lengths of the SSR motifsranged from 1 to 6. Most of the SSRs are trinucleotides(70.1 %) followed by dinucleotide (23.5 %) (Fig. 3a). Themost frequent dinucleotide motif was (AT/AT)n with a fre-quency of 166 out of 590 followed by (GA/TC)n, (AG/CT)n, and (TA/TA)n (Fig. 3b). The least frequent motifs(only 10 %) were (CA/TG)n and (AC/GT)n. The threemost frequent trinucleotide motifs are (GAA/TTC)n,(AAG/CTT)n, and (AGA/TCT)n with the proportions of12, 10 and 10 % of all trinucleotide motifs, respectively(Fig. 3c). The novel SSRs, in this study, are expected togreatly enrich the mango community reservoir of SSRs thathave already been reported [8, 9, 13, 14, 18, 20, 37, 38]. TheSSRs in those studies were used as a genetic tool toinvestigate diversity in local germplasm collections. In gen-eral, those studies were based on a few SSRs and the fre-quency of the SSR motifs in the genome was not reported.Thus the SSR motifs could not be compared. However,the pattern of SSR motifs is known to be species-specific [39, 40]. Thus, a discovery of the same patternof SSR motifs in the same species can strengthen the SSRs’reliability. Previously reported SSR motifs were congruentwith the motifs that were reported here verifying their
Table 1 Number of mango contig homologous hits
Non -redundantGeneBank proteins (nr)
TAIR UniProt Union of threedatabase hits
Pool 40,795 34,918 30,684 40,971
Pool and peelintersection
17,366 16,079 13,173 17,423
Pool and leafintersection
12,022 11,351 9390 12,038
Pool, peeland leafintersection
8371 8074 6669 8380
Fig. 2 Comparison of mango gene ontology categories in three transcriptome assemblies. Contigs were annotated by running blast search against ‘nr’database and then performing mapping to Slim-GO categories by Blast2GO. The distribution of contigs of the three ontologies, biological processes,molecular functions, and cellular components was plotted for transcripts that were included exclusively in the transcriptome from the pool (Pool only)of tissues (root, leaf, flower and fruit developmental stage 3; turquoise bars)
Sherman et al. BMC Plant Biology (2015) 15:277 Page 4 of 11
reliability. For example, a study of Australian collection’sdiversity identified 100 SSRs within approximately 24Kexpressed sequence tags (ESTs) [20]. The trinucleotidemotifs were more frequent than dinucleotide motifs inboth the Australian collection in the present study. More-over, the motif patterns that were reported as the prepon-derant ones were congruent with our observations. Thetrinucleotide motif, (AAG/CTT)n, was ranked as the mostand second most frequent in the Australian study and inour study, respectively, and the dinucleotide motif, (AG/CT)n, was ranked as the most and third most frequent, re-spectively. The list of SSRs discovered might be useful forMAS and genetic surveys. However, in spite of the factthat NGS can be used for SSR discovery, high-throughputtechnologies (microarrays and NGS) are more availablefor SNPs [26, 35, 41]. Therefore, in terms of parallel geno-typing the available technologies tilt the balance in favorof using SNPs as markers rather than SSRs.In the recent years, with the evolution of next gener-
ation sequencing, many studies have developed SNPmarkers for marker-assisted breeding [32, 42–45]. NGShas leveraged the genome-wide SNP discovery in non-model organisms such as spruce [46], apple [47, 48], andpomegranate [31]. However, no study of SNP develop-ment for mango has been reported yet. In the presentwork, two mango accessions’ transcriptomes (‘Keitt’,‘Tommy Atkins’) were resequenced and aligned to ade-novo assembled transcriptome as a reference. The
analysis resulted in the discovery of 332,016 SNPs(Additional file 3: Table S3) using VarScan [49]. Thepolymorphism type of those loci for the two acces-sions’ transcriptomes can be either polymorphic, i.e.,heterozygous (He) or non-polymorphic, i.e., homozy-gous (Ho). The possible combinations of the genotypecalls for the two transcriptomes fall into four categories:both transcriptomes are homozygous (HoHo), ‘Keitt’ is het-erozygous and ‘Tommy Atkins’ is homozygous (HeHo),‘Keitt’ is homozygous and ‘Tommy Atkins’ is heterozygous(HoHe), and both transcriptomes are heterozygous (HeHe).Note that if both transcriptomes are homozygous, they arehomozygous for different alleles. The distribution of SNPsinto these categories was 24,136, 33,554, 164,454, and109,872, respectively. Thus ‘Tommy Atkins’ is more poly-morphic than ‘Keitt’. As expected more SNPs were discov-ered in the flanking regions of the open reading frames(ORFs; hereafter outORF), than within them (hereafterinORF). The ratio of outORF to inORF SNPs was 2.18 onthe average. This ratio was uniformly maintained in allSNP categories except in the HoHo category where the ra-tio of outORF to inORF SNPs is two and it was found tobe significantly smaller (χ2 test; df =3; p-value <0.001) than2.18 as a result of a slight increase of inORF SNPs. Hereinwe described the first set of SNP markers for mango. Theclosest fruit tree relative of mango with a published gen-ome, Citrus sinensis, is as polymorphic as mango [50]. Thegenome project of the sweet orange reported 1.06 million
Fig. 3 SSR length and motif distribution. The number of mono- to hexanucleotide SSR motifs was counted (a). The nucleotide compositions of themost frequent motifs (di- and trinucleotide motifs) were determined for each type and are illustrated in a bar plot for dinucleotide (b) andtrinucleotide motifs (c). Motifs that are reverse-complementary were plotted as stacked bars: “plus strand” (red) and “minus strand” (green)
Sherman et al. BMC Plant Biology (2015) 15:277 Page 5 of 11

SNPs in the entire genome with one-third are in genic re-gions [51]. Like orange, 70 % of the transcripts included atleast one SNP while only 63 % included at least one SNP inthe exonic regions. Other studies of fruit trees reportedmuch less polymorphism in expressed regions: 6500,71,482 and 23,742 in pomegranate [31], apple [52], and eu-calyptus [27], respectively. These findings confirm previousresults that mango is a highly heterozygous (or poly-morphic) species [7, 12, 53].
Germplasm kinshipAn overwhelming number of SNPs derived from thegenic region of the genome may be useful in the futurefor genome-wide association studies (GWAS). Howeveras a preliminary step to such studies, a survey of the struc-ture and diversity of the mango collection is required [54].A subset of 239 high quality SNPs was used for genotyping74 accessions of the Israeli mango collection, one SNP percontig. The SNPs subset was not biased toward “inORF” or“outORF” types of SNPs (χ2-test; df = 1; p-value = 0.74) andwas therefore representative. As reported in previous stud-ies of collections, mangoes are highly polymorphic [13, 19].The median polymorphism information content (PIC) was0.4 whereas less than 1 % of the applicable SNPs were of
minor allele frequency (MAF) value <0.05. Thus most ofthe SNPs were polymorphic in the Israeli mango collectionalthough they were discovered in only two accessions, ‘Keitt’and ‘Tommy Atkins’. That is reasonable presuming thatmango is highly polymorphic.The Israeli germplasm collection comprises cultivars
that were originated from India, Southeast Asia, SouthAmerica and the Pacific islands, Florida, Australia, andfrom elite local hybrids. A dendrogram based on the pro-portion of shared alleles distance classified the accessionsin the mango collection into two genetic subgroups. Thedendrogram (Fig. 4a) split the mango collection into twomajor clusters: 1) a small one that comprises most of theIndian accessions clustered together with accessions fromSoutheast Asia (SP1), 2) and a larger one which comprisedof the Floridian, South African, Australian, local (Israeli)and South American accessions (SP2). This division sepa-rates Indian and Southeast Asian accessions from the rest.In other words, the mango accessions that are cultivatedin the western part of the world can be genetically sepa-rated from those that are cultivated in its eastern part ofthe world. Due to the fact that the origin of mango hasbeen suggested to be from the eastern part of the world[55], SP1 might be more related to the landrace mangoes.
Fig. 4 Dendrogram and genetic structure of 74 accessions in the Israeli mango germplasm collection. Genotyping of 74 mango accessions fromthe Israeli mango collection was performed with 239 SNPs. The genotyping results were used to classify the accessions into sub-populations and revealtheir genetic structure. a Classification was performed by drawing a dendrogram based on 1- proportion of shared alleles (PSA) as a genetic distance. Onlyconfident branches with bootstrap values ≥90 were assigned. The two major groups are notated as subpopulation 1 (SP1) and as subpopulation 2(SP2). b Genetic structure was revealed by STRUCTURE program with K = 2 as found by simulation and ΔK likelihood method. The division ofSTRUCTURE’s Q-value bar plot into two (vertical blue line) corresponds to the two major significant clusters in the dendrogram. Note that theY-axis (not plotted) scale is between 0 and 1 and represents proportion
Sherman et al. BMC Plant Biology (2015) 15:277 Page 6 of 11
Three accessions from India fell within the Floridian-Israeli (SP2) cluster. ‘Mulgoba’ was reported as the parentof the Floridian cultivar ‘Haden’ and as a putative parentof other Floridian variants [3]. Moreover, ‘Haden’ has beensuggested to be the parent of many other Floridian acces-sions [3]. Thus, ‘Mulgoba’ is the ancestor of most Floridianaccessions. Recently a new study was published and re-ported about 387 mango accessions from all over India. Inthat study, the cultivar ‘Suvarnarekha’ was reported fromSouth India as was ‘Mulgoba’ and they both were clusteredtogether in a dendrogram by their geographical origin[14]. To the best of our knowledge no record exists of theorigin and the genetic similarity of the third Indian acces-sion, ‘Sendura’. Moreover, the number of subpopulationsestimated by Evanno’s method [56] was K = 2. Most of theaccessions from India which were clustered together weregenetically homogeneous (Fig. 4b; mostly red bars), whilethe three accessions from India that were included in thecluster with the Floridian and Israeli accessions are highlyadmixed (Fig. 4b; red/green bars). Ravishankar et al. [14]showed that the Indian collection can be divided into twosubpopulations corresponding to the geographical classifi-cation of south/west and north/east. Moreover, the south/west can be further divided into two sub-populations. It isnot clear whether the additional genetic division is corre-lated with south and west geographical regions. Howeverassuming this correlation would explain the fact that in theSP1 cluster, the Indian accessions were from north, east,and two from west, while the Indian accessions from thesouth were included separately in the SP2 cluster (Fig. 4a).In contrast to the mango accessions’ origin, there was
no clear division observed between poly- and monoem-bryonic accessions in the SP1 and SP2 clusters. SP1comprised 13 and five mono- and polyembryonic acces-sions respectively (one was undefined). SP2 comprised40 and 11 mono- and polyembryonic accessions respect-ively (four were undefined). No significant difference(Fisher’s exact test; p-value = 0.47) was observed betweenthe proportions of poly- and monoembryonic accessionsin the two clusters.
Mango diversityThe two major clusters in the dendrogram were com-pared for their genetic diversity. The expected heterozy-gosity of SP1 (median = 0.28) is significantly smaller(Wilcoxon test, p-value <0.001) than the expected hetero-zygosity of SP2 (median = 0.43). The accessions in SP1 arein Hardy-Weinberg equilibrium (HWE) with a median FSof -0.05 (Wilcoxon test, p-value = 0.13). In contrast, slightoutbreeding was estimated for the accessions in SP2 witha median of FS = -0.1 (Wilcoxon-test; p-value <0.001).Both FS values were close to zero and slightly negative,suggesting that mango accessions in these clusters are notprone to inbreeding. The SP1 cluster that was enriched in
accessions from Southeast Asia and India, i.e., suggestedmango’s origin [55], and its accessions had probably beenunder cultivation longer duration than the accessions inSP2. Therefore the result that they were in HWE is ac-ceptable. In contrast the SP2 cluster deviated from theHWE. One explanation is that as a group, the accessionsin the cluster as a group appeared to be under shorterduration of cultivation. Alternatively, one might suggestthat SP1 is comprised of accessions that are more relatedto landraces (note that non-indica mangoes are included).The SP2 cluster comprises of accessions that were sub-jected to breeding efforts. This may be one of the reasonsthat SP1 is under HWE while SP2 deviates from it. A sup-portive evidence that SP2 is a young subpopulation lies inthe estimation of a FST value that is only slightly greaterthan zero (median = 0.03; Wilcoxon-test; p-value <0.001)which suggests that SP2 is only in the beginning of its dif-ferentiation. Small FST values, such as the one shown inthis study, were previously suggested by three otherstudies [11, 18, 57] of the Indian and Colombianmango collections using SSR and RAPD markers re-spectively. The SP2 cluster is also more diverse thanthe SP1 cluster. The genetic structure analysis (Fig. 4b)illustrated that accessions in the SP1 cluster havecome from a narrow genetic background whereas theIndian-originated accessions in the SP2 cluster aremore admixed. An optional explanation for this might re-late to the possibility that the founder of the SP2 subpop-ulation (‘Mulgoba’) was probably a hybrid of the twosubpopulations described in Ravishankar and col-leagues’ study [14] and therefore heterozygous.Finally, two non-indica species of the genus Mangifera
were included in this study (Mangifera laurina andMangifera odorata); they clustered together with SP1subpopulation that contained mainly accessions that arecultivated in Southeast Asia and India. This supports theclaim that the Southeast Asia and India is the origin ofMangifera indica [55] and that the accessions in SP1 arecloser to landraces than the ones in SP2.
ConclusionsWe have established a sequence for the mango tran-scriptome from a pool of tissues. This transcriptome wasnot reconstructed to study expression but rather servedas a reduction in complexity for variation discovery. Itwas used as a reference to align resequencing of twocommercially important mango accessions, ‘Keitt’ and‘Tommy Atkins’, constituting a resource for genetic vari-ation discovery. The annotation and the SSR motifs werecongruent with the existing knowledge in the literature.The discovered SNPs established a large pool geneticvariation in mango. A subset of this pool was shown tobe applicable for studying diversity in the Israeli mangocollection and for dividing it into two subpopulations,
Sherman et al. BMC Plant Biology (2015) 15:277 Page 7 of 11
i.e., two genetic groups. The SP1 cluster comprised aSoutheast Asian and Indian accessions and was sug-gested to arise from a narrow genetic background. Yet itwas found to be in HWE, probably due to a long dur-ation of cultivation. In contrast the SP2 cluster com-prised mainly accessions cultivated in the western worldexcept for three Indian accessions, one of which hadbeen reported to be the ancestor of many Floridian man-goes. The structure analysis based on the SNP markerssuggested that the three Indian mango accessions are anadmixture. Consequently, most of the descendent culti-vars are admixtures as well. In contrast to SP1 acces-sions, those in SP2 were not in HWE. We suggest thatthe different results are probably due to difference induration of cultivation, although this was not stronglysupported by the results. We believe that the novel setof SNPs is valuable for mango because that they havebeen polymorphic in the Israeli mango collection andthey enabled us to recapitulate the mango’s diversity.
MethodsPlant materialMango accessions from the Israeli mango germplasm col-lection were used in this study. The collection is com-prised of accessions from different regions of the world aswell as promising lines identified through the Israeli breed-ing program. A list of the accessions that were included inthis study is provided in (Additional file 4: Table S4). Allaccessions were 15–20 years old, grafted on the 13/1 root-stock. Trees were grown in sandy soil at the Volcani Ex-perimental Orchard in Volcani Center, Israel. All sampleswere collected, immediately frozen in liquid nitrogen andstored at −80 °C until use.
RNA isolationRNA was purified from several tissues of ‘Tommy Atkins’and ‘Keitt’ trees (young leaves, young inflorescences, fruit-lets, flesh and peel of mature fruit). Total RNA was isolatedusing a hexadecyltrimethyl ammonium bromide (CTAB)-based method [58]. Tissue (2–3 g) was ground in liquidnitrogen and extracted in 20 ml extraction buffer (0.1 MTris, 25 mM EDTA, 2 % (w/v) CTAB, 0.2 % polyvinylpyr-rolidone [PVP], 2 M NaCl, 0.2 % ß-mercaptoethanol,pH 8.0) pre-warmed to 65 °C. After two phenol:chloroformextractions, RNA was precipitated with 2.5 M LiCl, and re-suspended with 1 ml SSTE (0.5 % SDS, 1 M NaCl, 10 mMTris, pH 8, 1 mM EDTA, pH 8). RNA was re-extractedtwice with phenol:chloroform and precipitated in 70 %ethanol. Purified RNA was treated with RQ1 RNase-freeDNase I (Promega) according to the manufacturer’s in-structions, followed by another extraction and precipita-tion. The RNA was assessed for integrity and quantifiedon a NanoDrop spectrometer and by separation on a1.2 % agarose gel.
Isolation of genomic DNAGenomic DNA was isolated from young mango leaves(2 g) ground in liquid nitrogen and extracted with15 ml of extraction buffer (100 M Tris, pH 8.0, 1.5 MNaCL, 3 % CTAB, PVP, 1 % ß-mercaptoethanol) and15 ml of chloroform: isoamyl alcohol. Following a sec-ond extraction with chloroform: isoamyl alcohol, DNAwas ethanol-precipitated, treated with 20 units of ribo-nuclease A (Sigma), precipitated and resuspended inwater. The DNA was quantified in a NanoDrop spec-trometer and by separation on a 0.8 % agarose gel.
High throughput sequencing‘Keitt’ total RNA samples from the different tissues weremixed evenly and ran on one plate of the 454-Titaniumplatform. Construction of two cDNA libraries and 454 py-rosequencing were carried out at the W.M. Keck Centerfor Comparative and Functional Genomics, Roy J. CarverBiotechnology Center, University of Illinois at Urbana-Champaign. Briefly, mRNA was isolated from 20 μg oftotal RNA with the Oligotex kit (Qiagen, Valencia, CA).The mRNA-enriched fraction was converted to a primarycDNA library with adaptors compatible with the 454 sys-tem as previously published [59]. After library construc-tion, the library was quantified using a Qubit fluorimeter(Invitrogen, CA) and average fragment sizes were deter-mined by analyzing 1 μl of the samples on a Bioanalyzer(Agilent, CA) using a DNA 7500 chip. The libraries werediluted to 1 × 10⁶ molecules/μl and pooled. Emulsion-based clonal amplification and sequencing on a full plateof the ‘454 Genome Sequencer FLX+’ system were per-formed according to the manufacturer’s instructions (454Life Sciences, Branford, CT). Signal processing and basecalling were performed using the bundled 454 Data Ana-lysis Software v2.6. The read outcome was used to createa mango transcriptome as a reference for alignment ofresequenced ‘Keitt’ and ‘Tommy Atkins’ total RNA mix-ture isolated from several tissues in equal amounts. ThoseRNA samples were prepared with Illumina’s ‘TruSeqRNAseq Sample Prep kit’, quantified by qPCR, and se-quenced for 100 cycles on a HiSeq 2000 using a ‘TruSeq’SBS sequencing kit version 3. To get a lane-independentyields, ‘Keitt’ and ‘Tommy Atkins’ RNA samples were ini-tially tagged and then mixed evenly and were run on twoseparate lanes. The sequence reads from those lanes wereused for discovery of genetic variation.
De novo transcriptome assembly and functionalannotationRaw sequence reads of the 454-FLX GS Titanium plat-form were pre-processed by “SFF_extract” (http://bioinf.-comav.upv.es/sff_extract/) and arguments for removingthe adaptors and clipping the poly-A were applied. Readswere assembled by a stable version of MIRA, v3.2 [60].
Sherman et al. BMC Plant Biology (2015) 15:277 Page 8 of 11

For the MIRA run, we used the “Do-What-I-Mean”(DWIM) set of parameters as follows: “denovo, est, nor-mal, 454”, ‘assume_snp_instead_repeat’, ‘clip_polyat’ and‘force_nonIUPACconsensus_perseqtype’ options on, and‘min_reads_per_group’ = 8, ‘min_neighbour_qual’ = 25 and‘min_groupqual_for_rmb_tagging’ = 30. One of MIRA fea-tures involves splitting mRNA unigenes into splice variantsespecially for polymorphic variants. Therefore a second as-sembly run on MIRA’s contigs was performed by CAP3[34] to produce super-contigs. Both super-contigs and thesingletons, which are the MIRA’s contigs were designatedreference contigs. Contigs were deposited in the transcrip-tome shotgun assembly (TSA) sequence database [TSA:SAMN02905156, SAMN02947194].All contigs were searched for open reading frames (ORFs)
by the “getorf” program of the EMBOSS package [61]. Thelongest ORF with start and stop codons was chosen foreach contig with a minimum cutoff of 67 amino acids.A sequence-similarity search of contigs was run against
the non-redundant (nr) protein database using blastx with afilter of e-value <10−5. Best hits were further mapped toGO-slim by Blast2GO [62] and only hits with Blast2GO an-notation score >55 were scored (Additional file 2: Table S2).Mapping of the mango peel transcripts [23] to the tran-scripts of the pooled tissues in this study was performed byblast search for all transcripts of the peel against pool andvice versa, and selecting the reciprocal best hits. Similar butseparate mapping was performed with the transcripts ofmango leaves [21].
SNP and SSR discoveryRead results from ‘Keitt’ and ‘Tommy Atkins’ mRNA rese-quencing using Illumina HiSeq 2000 were mapped to the‘Keitt’ reference-transcriptome contigs using bowtie2(http://bowtie-bio.sourceforge.net/bowtie2/index.shtml).SNPs were discovered using Varscan [49].SSR scanning was performed on the 47,956 reference
contigs. MIcroSAtellite (MISA) identification tools (http://pgrc.ipk-gatersleben.de/misa/) and SciRoKo [63] were runwith default parameters.
Genotyping assaysA subset of 472 SNPs was chosen for further analysis bymaximizing sequence coverage of 1 SNP per contig.SNP assays for all 472 SNPs were developed by Fluidigmbased on the genetic variation that was found between‘Keitt’ and ‘Tommy Atkins’. The assays were run accord-ing to the manufacture’s instructions on an EP1 platformusing ‘96 × 96’ chips following standard Fluidigm protocols(http://www.fluidigm.com) with a minor modification offour no-template control (NTC) samples instead of one.The SNP assays were used to screen the 74 accessions’DNA samples by running on ‘FR96.96’ arrays of the EP1
Fluidigm platform according to the manufacturer’s in-structions (http://www.fluidigm.com).
Data analysis of mango diversityTo exclude bad samples and failed marker assays, sam-ples that had more than 10 % “No Call” and assays withmore than 30 % “No Call” were removed. The remainingsubset was submitted for the downstream analysis. ThePIC was calculated as [64].
PIC ¼ 1−X
p2i
where i is the i-th allele.
Germplasm accession classification and diversityTo assess the relationship between different mango ac-cessions, we estimated the genetic distance as D = 1-pro-portion of shared alleles (PSA). PSA was calculated as
PSA ¼XL
i¼1PSi
2 � Lwhere PS is the proportion of shared alleles for eachlocus and L is the total number of loci [65].Hierarchical clustering was performed on a pairwise D
distance matrix and the “ward” agglomerative method[66] was applied. The confidence limits of the tree top-ology were calculated by applying bootstrap method(1000 resampling of loci). To count the number of bi-partitions fitting the tree we used the “ape” R-package[67] and presented the bootstrap values as percentages.The subpopulation structure underlying the germ-
plasm collection was estimated by running a simulationof STRUCTURE software v2.3.3 [68] with 5000 burn-inperiods and 50,000 repetitions. The number of popula-tions, K, was inferred by running the simulation of K = 1to K = 10 (20 runs for each K) and using the likelihoodmethod of ΔK [56].The fixation indices FS and FST [69] were calculated as
Fs ¼ Hexp−Hobs
Hexp
where FS is the fixation index of each subpopulation,Hobs is the observed heterozygous types and Hexp is theestimated heteozygosity under HWE,
FST ¼ HS−HT
HT
where FST is the genetic differentiation of a subpopula-tion due to genetic drift, HS is the weighted average ofall subpopulations’ expected heterozygozity, and HT isthe expected heterozygosity in the entire population(germplasm collection).
Sherman et al. BMC Plant Biology (2015) 15:277 Page 9 of 11
Availability of supporting dataThe dataset supporting the results of this article is availablein the NCBI TSA (Transcriptome Shotgun Assembly Se-quence Database, http://www.ncbi.nlm.nih.gov/genbank/tsa) repository under the accession numbers of BioProject:PRJNA254771, BioSample: SAMN02947194, and BioSam-ple: SAMN02905156. These data can be found under asearch in the Nucleotide repository at the NCBI site.
Additional files
Additional file 1: Table S1. Mango transcriptome annotation.(XLSX 16205 kb)
Additional file 2: Table S2. Mango simple sequence repeats.(XLSX 102 kb)
Additional file 3: Table S3. Mango SNP list. (XLSX 14669 kb)
Additional file 4: Table S4. List of accessions in the Israeli germplasmcollection and metadata. (XLSX 11 kb)
AbbreviationsMAS: marker-assisted selection; NGS: next generation sequencing; ORF: openreading frame; PIC: polymorphism information content; PSA: proportion ofshared alleles.
Competing interestsThe authors declare that they have no competing interests.
Authors’ contributionsRO: wrote the paper RO, AS and YC: Conceived and designed the experimentsYC: contributed plant materials, manuscript discussion and review MR and MS:Analyzed the data – sequence annotations, clustering RO: Structure analysis andpopulation genetics statistics RE and AR: operated the Fluidigm platformto produce genotype calls MB and MI: Perform molecular experiments – RNAand DNA extractions. DS: Field experiments that were generating the mango’spopulations. All authors read and approved the final manuscript.
AcknowledgementsThis work was supported by the Chief Scientist of Ministry of Agriculture andRural Development [Grant No.: 203-0859-12].
Author details1Department of Fruit Trees Sciences, Institute of Plant Sciences, AgriculturalResearch Organization, Volcani Center, Rishon Lezion, Israel. 2The Robert H.Smith Institute of Plant Sciences and Genetics in Agriculture, Faculty ofAgriculture, Food and Environment, The Hebrew University of Jerusalem,Rehovot, Israel.
Received: 27 April 2015 Accepted: 4 November 2015
References1. Bompard J. Taxonomy and systematics. In: Litz RE, editor. The mango: Botany,
production and uses. Wallingford: CAB International; 2009. p. 19–41.2. Mukherjee S, Litz R. Introduction: botany and importance. In: Litz RE, editor.
The mango: Botany, production and uses. 2nd ed. Wallingford:CAB international; 2009. p. 1–18.
3. Olano CT, Schnell RJ, Quintanilla WE, Campbell RJ. Pedigree analysis ofFlorida mango cultivars. Proc Fla State Hort Soc. 2005;118:192–7.
4. Bally IE, Lu P, Johnson P. Mango breeding. In: Jain SM, Priyadarshan PM, editors.Breeding plantation tree crops: tropical species. New York: Springer;2009. p. 51–82.
5. Varshney RK, Graner A, Sorrells ME. Genomics-assisted breeding for cropimprovement. Trends Plant Sci. 2005;10:621–30 [Trends in Plant Science10th Anniversary Issue Feeding the World: Plant Biotechnology Milestones].
6. Kashkush K, Fang J, Tomer E, Hillel J, Lavi U. Cultivar identification andgenetic map of mango (Mangifera indica). Euphytica. 2001;122:129–36.
7. Adato A, Sharon D, Lavi U, Hillel J, Gazit S. Application of DNA fingerprintsfor identification and genetic analyses of mango (Mangifera indica)genotypes. J Am Soc Hortic Sci. 1995;120:259–64.
8. Eiadthong W, Yonemori K, Sugiura A, Utsunomiya N, Subhadrabandhu S.Identification of mango cultivars of Thailand and evaluation of their geneticvariation using the amplified fragments by simple sequence repeat-(SSR-)anchored primers. Sci Hortic. 1999;82:57–66.
9. Schnell RJ, Olano CT, Quintanilla WE, Meerow AW. Isolation and characterizationof 15 microsatellite loci from mango (Mangifera indica L.) and cross-speciesamplification in closely related taxa. Mol Ecol Notes. 2005;5:625–7.
10. Ahmad Rajwana I, Tabbasam N, Malik AU, Malik SA, Mehboob-ur-Rahman,Zafar Y. Assessment of genetic diversity among mango (Mangifera indica L.)genotypes using RAPD markers. Sci Hortic. 2008;117:297–301.
11. Díaz-Matallana M, Schuler-García I, Ruiz-García M, Hodson de Jaramillo E.Analysis of diversity among six populations of Colombian mango (Mangiferaindica L. cvar. Hilacha) using RAPDs markers. Electron J Biotechnol. 2009;12:1–2.
12. Hirano R, Htun Oo T, Watanabe KN. Myanmar mango landraces revealgenetic uniqueness over common cultivars from Florida, India, andSoutheast Asia. Genome. 2010;53:321–30.
13. Dillon NL, Bally ISE, Wright CL, Hucks L, Innes DJ, Dietzgen RG. Geneticdiversity of the Australian National Mango Genebank. Sci Hortic.2013;150:213–26.
14. Ravishankar KV, Bommisetty P, Bajpai A, Srivastava N, Mani BH, Vasugi C, et al.Genetic diversity and population structure analysis of mango (Mangiferaindica) cultivars assessed by microsatellite markers. Trees. 2015;1–9.
15. Schnell RJ, Ronning CM, Jr RJK. Identification of cultivars and validation ofgenetic relationships in Mangifera indica L. using RAPD markers. Theor ApplGenet. 1995;90:269–74.
16. Ravishankar KV, Anand L, Dinesh MR. Assessment of genetic relatednessamong mango cultivars of India using RAPD markers. J Hortic SciBiotechnol. 2000;75:198–201.
17. Karihaloo J, Dwivedi Y, Archak S, Gaikwad AB. Analysis of genetic diversity ofIndian mango cultivars using RAPD markers. J Hortic Sci Biotechnol.2003;78:285–9.
18. Viruel M, Escribano P, Barbieri M, Ferri M, Hormaza J. Fingerprinting, embryotype and geographic differentiation in mango (Mangifera indica L.,Anacardiaceae) with microsatellites. Mol Breed. 2005;15:383–93.
19. Surapaneni M, Vemireddy LR, Begum H, Reddy BP, Neetasri C, Nagaraju J, et al.Population structure and genetic analysis of different utility types of mango(Mangifera indica L.) germplasm of Andhra Pradesh state of India usingmicrosatellite markers. Plant Syst Evol. 2013;299:1215–29.
20. Dillon NL, Innes DJ, Bally IS, Wright CL, Devitt LC, Dietzgen RG. Expressedsequence tag-simple sequence repeat (EST-SSR) marker resources fordiversity analysis of mango (Mangifera indica L.). Diversity. 2014;6:72–87.
21. Azim MK, Khan IA, Zhang Y. Characterization of mango (Mangifera indica L.)transcriptome and chloroplast genome. Plant Mol Biol. 2014;85:193–208.
22. Pandit SS, Kulkarni RS, Giri AP, Köllner TG, Degenhardt J, Gershenzon J, et al.Expression profiling of various genes during the fruit development andripening of mango. Plant Physiol Biochem. 2010;48:426–33.
23. Luria N, Sela N, Yaari M, Feygenberg O, Kobiler I, Lers A, et al. De-novo assemblyof mango fruit peel transcriptome reveals mechanisms of mango response tohot water treatment. BMC Genomics. 2014;15:957.
24. Wu H, Jia H, Ma X, Wang S, Yao Q, Xu W, et al. Transcriptome and proteomicanalysis of mango (Mangifera indica Linn) fruits. J Proteomics. 2014;105:19–30.
25. Dautt-Castro M, Ochoa-Leyva A, Contreras-Vergara CA, Pacheco-Sanchez MA,Casas-Flores S, Sanchez-Flores A, et al. Mango (Mangifera indica L.) cv. Kentfruit mesocarp de novo transcriptome assembly identifies gene familiesimportant for ripening. Front Plant Sci. 2015;6:62 [Plant Genetics and Genomics].
26. Davey JW, Hohenlohe PA, Etter PD, Boone JQ, Catchen JM, Blaxter ML.Genome-wide genetic marker discovery and genotyping using next-generation sequencing. Nat Rev Genet. 2011;12:499–510.
27. Novaes E, Drost DR, Farmerie WG, Pappas Jr GJ, Grattapaglia D, Sederoff RR, et al.High-throughput gene and SNP discovery in Eucalyptus grandis, anuncharacterized genome. BMC Genomics. 2008;9:312.
28. Barakat A, DiLoreto DS, Zhang Y, Smith C, Baier K, Powell WA, et al. Comparisonof the transcriptomes of American chestnut (Castanea dentata) and Chinesechestnut (Castanea mollissima) in response to the chestnut blight infection.BMC Plant Biol. 2009;9:51.
29. Alagna F, Agostino ND’, Torchia L, Servili M, Rao R, Pietrella M, et al. Comparative454 pyrosequencing of transcripts from two olive genotypes during fruitdevelopment. BMC Genomics. 2009;10:399.
Sherman et al. BMC Plant Biology (2015) 15:277 Page 10 of 11
30. Iorizzo M, Senalik DA, Grzebelus D, Bowman M, Cavagnaro PF, Matvienko M, et al.De novo assembly and characterization of the carrot transcriptome reveals novelgenes, new markers, and genetic diversity. BMC Genomics. 2011;12:389.
31. Ophir R, Sherman A, Rubinstein M, Eshed R, Sharabi Schwager M, Harel-BejaR, et al. Single-nucleotide polymorphism markers from de-novo assembly ofthe pomegranate transcriptome reveal germplasm genetic diversity. PLoSONE. 2014;9:e88998.
32. Chen H, Xie W, He H, Yu H, Chen W, Li J, et al. A high-density SNP genotypingarray for rice biology and molecular breeding. Mol Plant. 2014;7:541–53.
33. Nielsen R, Paul JS, Albrechtsen A, Song YS. Genotype and SNP calling fromnext-generation sequencing data. Nat Rev Genet. 2011;12:443–51.
34. Huang X, Madan A. CAP3: A DNA sequence assembly program. GenomeRes. 1999;9:868–77.
35. McCouch SR, Zhao K, Wright M, Tung C-W, Ebana K, Thomson M, et al.Development of genome-wide SNP assays for rice. Breed Sci. 2010;60:524–35.
36. Zhang W-W, Pan J-S, He H-L, Zhang C, Li Z, Zhao J-L, et al. Construction ofa high density integrated genetic map for cucumber (Cucumis sativus L.).Theor Appl Genet. 2012;124:249–59.
37. Ravishankar KV, Mani BH-R, Anand L, Dinesh MR. Development of newmicrosatellite markers from Mango (Mangifera indica) and cross-speciesamplification. Am J Bot. 2011;98:e96–9.
38. Tsai C-C, Chen Y-KH, Chen C-H, Weng IS, Tsai C-M, Lee S-R, et al. Cultivaridentification and genetic relationship of mango (Mangifera indica) inTaiwan using 37 SSR markers. Sci Hortic. 2013;164:196–201.
39. von Stackelberg M, Rensing SA, Reski R. Identification of genic moss SSRmarkers and a comparative analysis of twenty-four algal and plant geneindices reveal species-specific rather than group-specific characteristics ofmicrosatellites. BMC Plant Biol. 2006;6:9.
40. Sharma PC, Grover A, Kahl G. Mining microsatellites in eukaryotic genomes.Trends Biotechnol. 2007;25:490–8.
41. Cutler DJ, Zwick ME, Carrasquillo MM, Yohn CT, Tobin KP, Kashuk C, et al.High-throughput variation detection and genotyping using microarrays.Genome Res. 2001;11:1913–25.
42. Edwards JD, Janda J, Sweeney MT, Gaikwad AB, Liu B, Leung H, et al.Development and evaluation of a high-throughput, low-cost genotypingplatform based on oligonucleotide microarrays in rice. Plant Methods.2008;4:13.
43. Verde I, Bassil N, Scalabrin S, Gilmore B, Lawley CT, Gasic K, et al. Developmentand evaluation of a 9K SNP array for peach by internationally coordinated SNPdetection and validation in breeding germplasm. PLoS ONE. 2012;7:e35668.
44. Xu Y, Lu Y, Xie C, Gao S, Wan J, Prasanna BM. Whole-genome strategies formarker-assisted plant breeding. Mol Breed. 2012;29:833–54.
45. Riedelsheimer C, Melchinger AE. Optimizing the allocation of resources forgenomic selection in one breeding cycle. Theor Appl Genet.2013;126:2835–48.
46. Pavy N, Gagnon F, Rigault P, Blais S, Deschênes A, Boyle B, et al. Developmentof high-density SNP genotyping arrays for white spruce (Picea glauca) andtransferability to subtropical and nordic congeners. Mol Ecol Resour.2013;13:324–36.
47. Chagné D, Crowhurst RN, Troggio M, Davey MW, Gilmore B, Lawley C, et al.Genome-wide SNP detection, validation, and development of an 8K SNParray for apple. PLoS ONE. 2012;7:e31745.
48. Troggio M, Gleave A, Salvi S, Chagné D, Cestaro A, Kumar S, et al. Apple,from genome to breeding. Tree Genet Genomes. 2012;8:509–29.
49. Koboldt DC, Chen K, Wylie T, Larson DE, McLellan MD, Mardis ER, et al.VarScan: variant detection in massively parallel sequencing of individualand pooled samples. Bioinformatics. 2009;25:2283–5.
50. Malik SK, Rohini MR, Kumar S, Choudhary R, Pal D, Chaudhury R. Assessmentof genetic diversity in sweet orange [Citrus sinensis (L.) Osbeck] cultivars ofIndia using morphological and RAPD markers. Agric Res. 2012;1:317–24.
51. Xu Q, Chen L-L, Ruan X, Chen D, Zhu A, Chen C, et al. The draft genome ofsweet orange (Citrus sinensis). Nat Genet. 2013;45:59–66.
52. Chagné D, Gasic K, Crowhurst RN, Han Y, Bassett HC, Bowatte DR, et al.Development of a set of SNP markers present in expressed genes of theapple. Genomics. 2008;92:353–8.
53. Chiang Y-C, Tsai C-M, Chen Y-KH, Lee S-R, Chen C-H, Lin Y-S, et al. Developmentand characterization of 20 new polymorphic microsatellite markers fromMangifera indica (Anacardiaceae). Am J Bot. 2012;99:e117–9.
54. Shriner D. Investigating population stratification and admixture usingeigenanalysis of dense genotypes. Heredity. 2011;107:413–20.
55. Mukherjee SK. Origin of mango (Mangifera indica). Econ Bot. 1972;26:260–4.
56. Evanno G, Regnaut S, Goudet J. Detecting the number of clusters ofindividuals using the software structure: a simulation study. Mol Ecol.2005;14:2611–20.
57. Singh S, Bhat KV. Molecular characterization and analysis of geographicaldifferentiation of Indian mango (Mangifera indica L.) germplasm.In: I International Symposium on Biotechnology of Fruit Species:BIOTECHFRUIT2008 839. 2008. p. 599–606.
58. Chang S, Puryear J, Cairney J. A simple and efficient method for isolatingRNA from pine trees. Plant Mol Biol Report. 1993;11:113–6.
59. Lambert JD, Chan XY, Spiecker B, Sweet HC. Characterizing the embryonictranscriptome of the snail Ilyanassa. Integr Comp Biol. 2010;50:768–77.
60. Chevreux B, Pfisterer T, Drescher B, Driesel AJ, Muller WE, Wetter T, et al.Using the miraEST assembler for reliable and automated mRNA transcriptassembly and SNP detection in sequenced ESTs. Genome Res.2004;14:1147–59.
61. Rice P, Longden I, Bleasby A. EMBOSS: the European molecular biologyopen software suite. Trends Genet. 2000;16:276–7.
62. Gotz S, Garcia-Gomez JM, Terol J, Williams TD, Nagaraj SH, Nueda MJ, et al.High-throughput functional annotation and data mining with the Blast2GOsuite. Nucleic Acids Res. 2008;36:3420–35.
63. Kofler R, Schlotterer C, Lelley T. SciRoKo: a new tool for whole genomemicrosatellite search and investigation. Bioinformatics. 2007;23:1683–5.
64. Weir BS. Genetic data analysis. Methods for discrete population geneticdata. Sunderland: Sinauer Associates, Inc. Publishers; 1990.
65. Bowcock AM, Ruiz-Linares A, Tomfohrde J, Minch E, Kidd JR, Cavalli-SforzaLL. High resolution of human evolutionary trees with polymorphicmicrosatellites. Nature. 1994;368:455–7.
66. Odong TL, van Heerwaarden J, Jansen J, van Hintum TJ, van Eeuwijk FA.Determination of genetic structure of germplasm collections: are traditionalhierarchical clustering methods appropriate for molecular marker data?Theor Appl Genet. 2011;123:195–205.
67. Paradis E, Claude J, Strimmer K. APE: analyses of phylogenetics and evolutionin R language. Bioinformatics. 2004;20:289–90.
68. Pritchard JK, Stephens M, Donnelly P. Inference of population structure usingmultilocus genotype data. Genetics. 2000;155:945–59.
69. Wright S. Genetical structure of populations. Nature. 1950;166:247–49.
Submit your next manuscript to BioMed Centraland take full advantage of:
• Convenient online submission
• Thorough peer review
• No space constraints or color figure charges
• Immediate publication on acceptance
• Inclusion in PubMed, CAS, Scopus and Google Scholar
• Research which is freely available for redistribution
Submit your manuscript at www.biomedcentral.com/submit
Sherman et al. BMC Plant Biology (2015) 15:277 Page 11 of 11