Embed Size (px)
Citation preview
Master’s degree thesis
LOG950 Logistics
A sustainable way for apparel retailers' development: converting the supply chain into closed-loop Case Study: MiN Boutique’s jeans-recycle Scheme
Chi Zhang, Wenjin Lin
Number of pages including this page: 64
Molde, 05.29.2011

Mandatory statement Each student is responsible for complying with rules and regulations that relate to
examinations and to academic work in general. The purpose of the mandatory statement is
to make students aware of their responsibility and the consequences of cheating. Failure to
complete the statement does not excuse students from their responsibility.
Please complete the mandatory statement by placing a mark in each box for statements 1-6
below.
1. I/we herby declare that my/our paper/assignment is my/our own
work, and that I/we have not used other sources or received
other help than is mentioned in the paper/assignment.
2. I/we herby declare that this paper
1. Has not been used in any other exam at another
department/university/university college
2. Is not referring to the work of others without
acknowledgement
3. Is not referring to my/our previous work without
acknowledgement
4. Has acknowledged all sources of literature in the text and in
the list of references
5. Is not a copy, duplicate or transcript of other work
Mark each
box:
1.
2.
3.
4.
5.
3.
I am/we are aware that any breach of the above will be considered as cheating, and may result in annulment of the examinaion and exclusion from all universities and university colleges in Norway for up to one year, according to the Act relating to Norwegian Universities and University Colleges, section 4-7 and 4-8 and Examination regulations section 14 and 15.
4. I am/we are aware that all papers/assignments may be checked
for plagiarism by a software assisted plagiarism check
5. I am/we are aware that Molde University college will handle all
cases of suspected cheating according to prevailing guidelines.
6. I/we are aware of the University College`s rules and regulation
for using sources
3
Publication agreement
ECTS credits: 30
Supervisor: Hajnalka Vaagen
Agreement on electronic publication of master thesis Author(s) have copyright to the thesis, including the exclusive right to publish the document (The
Copyright Act §2).
All theses fulfilling the requirements will be registered and published in Brage HiM, with the approval
of the author(s).
Theses with a confidentiality agreement will not be published.
I/we hereby give Molde University College the right to, free of
charge, make the thesis available for electronic publication: yes no
Is there an agreement of confidentiality? yes no (A supplementary confidentiality agreement must be filled in)
- If yes: Can the thesis be online published when the
period of confidentiality is expired? yes no
Date: 05.29.2011
4
SUPPLEMENTARY AGREEMENT/CONFIDENTIALITY AGREEMENT (Supplement to Point 5 of the Standard Agreement)
This agreement is between ………………………………………………………………………………(Student(s)). ……………………………………….. (Faculty Advisor at Molde University College), ………………………………………………………..…… (Company/Institution), and Molde University College/MSc logistics Program Manager. This is a supplement to the Standard Agreement, which defines the use of specifications and results reported in a Master’s degree thesis in accordance with the study plan for the Master’s degree program in Logistics at Molde University College. 1. As stated in Point 5 of the Standard Agreement the parties named above agree to
limit access to the Master’s degree thesis for …… years from the date of this agreement.
2. The reason for keeping the thesis results confidential is so that the
company/institution can avoid giving away information that would give others a competitive advantage.
3. The thesis must be submitted to Molde University College. It will be kept in a
secure room in the main archive at the College during the period agreed upon. The thesis can be borrowed during this period if a written request is submitted and the company/institution gives permission. After this period has ended the thesis will be placed in the library for general use.
4. Four copies of this agreement must be signed so that each party will have a copy.
The agreement is valid when it has been approved and signed by the program manager at Molde University College.
City………………………….. Date………………………….. _________________________ _________________________ Student(s) Faculty Advisor _________________________ Company/Institution Agreement approved by: _________________________ Program Manage
5
Preface
During past 15 years, the fashion apparel environment faced increasingly cut-throat
competition, with competitors copying one another and reacting sooner to industrial
innovations. Most fashion producers and retailers therefore focused on speed and low cost
despite fashion media were propagating about green, innovation, cost-effectiveness, and
waste-elimination. Fortunately, accompanying with the increasing awareness of the
importance of the environmental performance of products and their manufacturing
processes, more and more companies switch their attention to both economic and
environmental sustainability.
The owner of our case company, MIN Boutique (a Norwegian fashion apparel retailer with
its head office located in Molde), believes that a closed-loop supply chain including
recycling is a feasible way to realize the company’s target. Having discussed with our
supervisor, Hajnalka Vaagen, she indicates that only recycling that can make profit for the
whole supply chain would lead to both sustainability for the company.
We believe that economic and environmental sustainability are the ultimate goal for all
businesses in the future. Evaluating pricing strategies of the recycled goods to support
economic sustainability is therefore an important task, and the core subject of this master’s
thesis research. Based on these, we choose this topic as our master’s thesis. Here we would
like to thank our supervisor, Hajnalka Vaagen, for her help, trust and patience. In addition,
we also appreciate MIN Boutique for giving us such an opportunity to apply theory into
practice.
6
Content
Preface ............................................................................................................................... 5
Content ............................................................................................................................... 6
List of Figures .................................................................................................................... 8
List of Table ....................................................................................................................... 9
Abstract ............................................................................................................................ 10
1. Introduction .............................................................................................................. 11
2. Literature review....................................................................................................... 13
2.1 Sustainable development ........................................................................................ 13
2.2 Closed-loop supply chain ....................................................................................... 14
2.3 Pricing ................................................................................................................... 16
2.4 Philanthropy .......................................................................................................... 18
3. Brief Methodological Approach ................................................................................ 20
4. Introduction to the case company .............................................................................. 22
4.1 History of MiN Boutique Group AS ....................................................................... 22
4.2 Target market......................................................................................................... 23
4.3 Prospect of MiN Boutique...................................................................................... 25
5. The Case Study ......................................................................................................... 27
5.1 The Jeans-recycle Scheme ..................................................................................... 27
5.1 Disposition decision A: Sending to Garbage Station -- Environmental protection ... 29
5.1.1 Brief introduction of textile waste in Norway .................................................. 29
5.1.2 What could the company gain? ........................................................................ 30
5.2 Disposition Decision B: Sending to Africa -- Philanthropy ..................................... 31
5.3 Disposition Decision C: Remanufacturing in the UK – shoe production ................. 38
5.3.1 Environmental impact ..................................................................................... 38
5.3.2 Pricing strategies to support economic sustainability ....................................... 38
5.3.2.1 Short-term Pricing......................................................................... 39
5.3.2.2 Long-run pricing ........................................................................... 40
5.3.2.3 Competitors’ reaction .................................................................... 45
5.4 Disposition Decision D: Sending to vintage store ................................................... 47
5.5 Economic issues of the Scheme.............................................................................. 48
6. Conclusions .............................................................................................................. 52

7
References ........................................................................................................................ 53
Appendices ....................................................................................................................... 58
A: Waste in Norway, by material (1995-2009). 1 000 tons ............................................ 58
B: Waste in Norway, by source and material (2008), treatment and material (2008). 1
000 tons ........................................................................................................................ 59
C: Proof of the break-even equations ............................................................................ 60
D: Price list from Jan. 2011, Retura .............................................................................. 61
E: Corresponding Qn to each Pn from 876 to 1100 NOK ............................................... 62
8
List of Figures
Figure 1. Varying size apparel retailers’ market share in Norway...................................... 12
Figure 2. Sale amount of MiN BOUTIQU AS, 1969-2007 ................................................ 23
Figure 3. Brand positioning in the market ......................................................................... 24
Figure 4. Future Closed-loop chain of MiN Boutique ....................................................... 25
Figure 5. The extended supply chain in the scheme........................................................... 28
Figure 6. A Convergence of Interests ................................................................................ 32
Figure 7. The Four Elements of Competitive Context ....................................................... 33
Figure 8. Maximizing Philanthropy’s Value ..................................................................... 35
Figure 9. Profit maximization ........................................................................................... 41
Figure 10. Procedures of evaluating competitors’ capabilities and intentions .................... 47
9
List of Table
Table 1. Pricing objectives in service industry .................................................................. 17
Table 2. Pricing methods in service industry ..................................................................... 17
Table 3. The target markets of MiN Boutique’s concept stores ......................................... 23
Table 4. Textile Waste in Norway, 2008, Sorted by Treatment/Disposal ........................... 29
Table 5. List of Costs, Disposition Decision A .................................................................. 30
Table 6. List of Costs, Disposition Decision B .................................................................. 37
Table 7. List of Costs, Disposition Decision C .................................................................. 39
Table 8. List of Costs, Disposition Decision D .................................................................. 48
10
Abstract
Nowadays, sustainability issues have become the new focuses for contemporary businesses,
which are especially important to fashion apparel industry. A huge amount of literature has
elaborated benefits the sustainable development brings, the prospect it has and ideas it
inspires. In which there is a concept of closed-loop supply chain interests us. This paper
mainly focuses on making pricing strategies based on rational pricing models for recycled
goods in closed-loop supply chain to realize both economic and environmental
sustainability of a Norwegian fashion apparel retailer, MIN Boutique. In addition, some
other activities such as garbage treatment and philanthropy with respect to the performance
of corporate social responsibility are mentioned.
Key Words: closed-loop supply chain, sustainable development, pricing strategies,
corporate social responsibility.
11
1. Introduction
Demand for textile and apparel in the industrialized countries is increasing after the 1995
Uruguay Round of WTO. The demand is particularly strong among those countries -
Canada, EU, Norway, and the United States - whose importers are using Multi-Fiber
Arrangement (MFA) quotas (Vollrath, Gehlhar and MacDonald, 2004). In the wake of this,
fiercer competition generates. Meanwhile, the increasing demand of textile and apparel
also gives rise to the textile waste. For example, according to Statistics Norway’s report
(2010a), in 2009, 130 000 tons of textile waste was created in Norway. Compared with
textile waste in 1995, there is an 18% increase. In addition, fashion media today are
propagating about green, innovation, cost-effectiveness and waste-elimination so that more
and more sophisticated customers start to focus on clothing made out of recycled materials
(GlobalEDGE, 2011). In order to accommodate itself to these changes, apparel industry
had better modify its current supply chain and selling strategy.
Nowadays, fierce competitions are everywhere in the apparel industry. Sustainable
development, social responsibility and government legislation are three critical factors
which influence the apparel enterprises to innovate, promote ability of competition and
meet customers’ demand (St James Ethic Center, 2010). In order to benefit society, apparel
companies’ developments should stress on environmental and social issues and sustainable
operations. For short products life cycles apparel industry has, recycling of used clothing
seems a feasibly sustainable way to gain themselves a profit on economy and further
benefit the environment. A concept of closed-loop supply chain would thus be introduced
to extend apparel products’ life cycle. And further make apparel industry more sustainable.
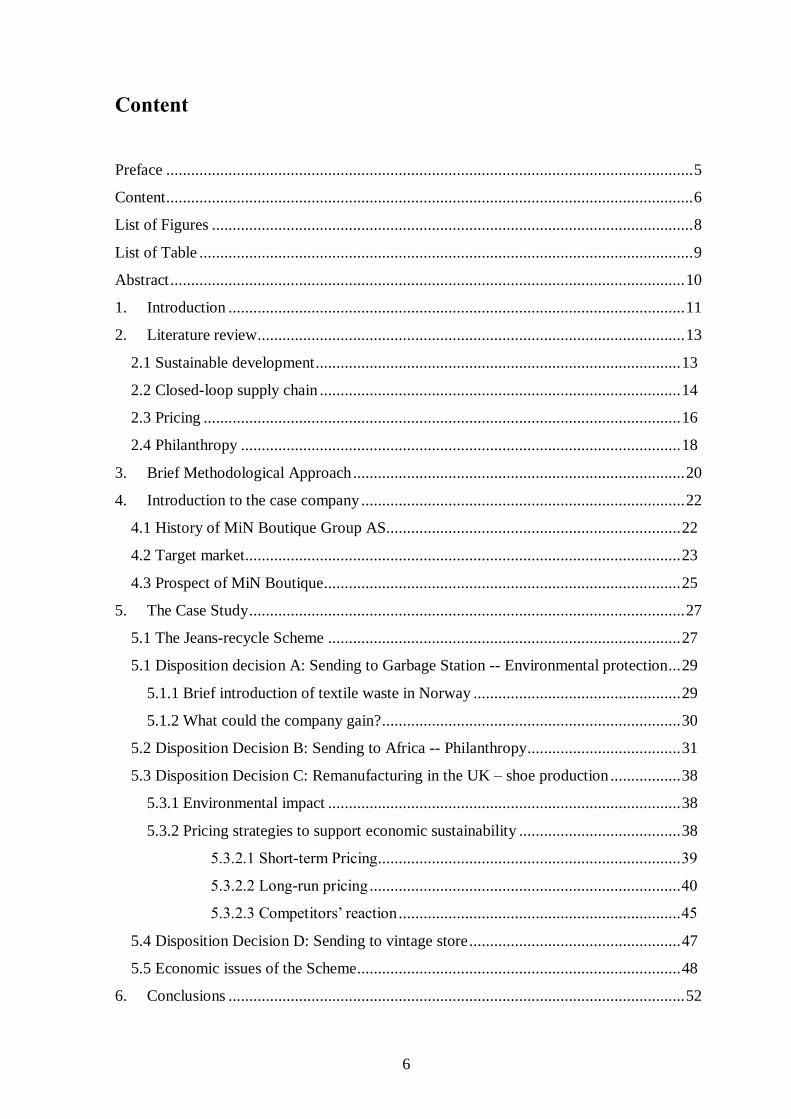
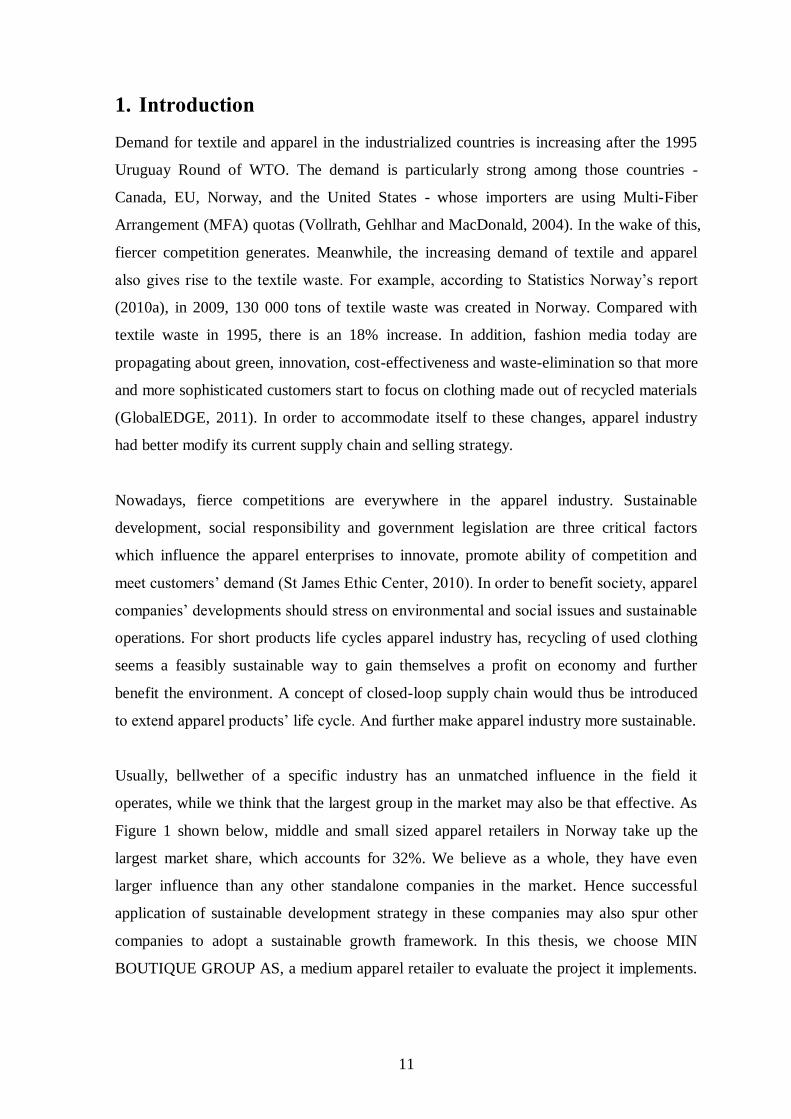
Usually, bellwether of a specific industry has an unmatched influence in the field it
operates, while we think that the largest group in the market may also be that effective. As
Figure 1 shown below, middle and small sized apparel retailers in Norway take up the
largest market share, which accounts for 32%. We believe as a whole, they have even
larger influence than any other standalone companies in the market. Hence successful
application of sustainable development strategy in these companies may also spur other
companies to adopt a sustainable growth framework. In this thesis, we choose MIN
BOUTIQUE GROUP AS, a medium apparel retailer to evaluate the project it implements.
12
We will research on environmental and social impacts that scheme brings. Moreover,
pricing methods to sustain the company’s project are concerned.
Figure 1. Varying size apparel retailers’ market share in Norway (MiN Boutique, 2011)
We organized the remained parts of the thesis as follows:
Section 2 is an overview of the existing literature related to our case. In section 3, a brief
methodology introduces the way that we are going to apply into the case. Section 4 is an
introduction to the case company, MiN Boutique, while section 5 is the case analysis based
on data provided by the case company. Conclusion is in section 6. The appendix contains
some relevant data from internet and the standard proof procedure of break-even equation.
13
2. Literature review
2.1 Sustainable development
As the World Commission on Environment and Development (WCED, 1987) proposed,
sustainable development refers not only to meet the contemporary people’s demand but
could also satisfy the needs of future generations without doing harm to theirs
development. Glodbach, Seuring and Back (2003) suggested that sustainability
development should keep the company’s operating competitively while let the operations
match social and environmental standards. And Andrews (2003 pp.2) also presented that
“maintaining ecologically sustainable natural systems, supplying significant social
conditions for all people, providing proper living conditions to all people and maintaining
a healthy and sustainable economy are four main aspects which sustainable development
covers”. The framework of sustainable development consists of three elements: economy,
environment and society (Brito et al., 2008). And for fashion retail supply chains, these
three elements are more critical (Brito et al., 2008).
Focusing on supply chain is a step of sustainable development for companies (Linton, et
al., 2007), and greening supply chain is a way to sustainability (Glodbach et al., 2003;
Brito et al., 2008; Rao, 2008, pp.xiv; Zhu and Cote, 2004). As Purba H. Rao (2008, pp.xiv)
proposed, greening supply chain refers to minimizing the environmental impacts of all
activities related to the different phases of the supply chain. He also pointed out that
greening supply chain could impact positively and significantly on health and safety, social
sustainability. Zhu and Cote (2004) also proposed the similar opinions on greening supply
chains. They described that improving economic and environmental performance is the
purpose for which greening supply chains are designed. These researches (Glodbach et al.,
2003; Brito et al., 2008; Rao, 2008, pp.xiv; Zhu and Cote, 2004) indicated that the areas
which sustainable development covers are almost the same areas on what greening supply
chain could impact. These findings supported that greening supply chain is a way of
sustainable development for a company. Besides focusing on supply chain management,
sustainable development must combine such issues: product design, manufacturing by-
products, by-products produced during product use, product life extension, product end-of
–life, and recovery processes at end-of-life (Linton, et al., 2007).
14
Because of enormous consumption of resources and emphasized delocalization of
manufacturing to developing countries, sustainable development is a key issue in fashion
industry (Brito et al., 2008). Some researches related to the fashion apparel industry have
been worked out. In Kogg’s (2003) case study, she pointed out that good comprehensions
of supply chains’ actors and the circumstance which companies encounter are advantages
for greening textile supply chain. RockBlocks Group (2008), a leader in global sourcing
and supply chain solution for apparel retailers, has announced a 6-step method for
greening retailers’ supply chain. These six steps are: (1).Evaluating environmental impacts;
(2).Setting up metrics for measurement; (3).Options determination; (4).Corporate social
responsibility initiatives; (5).Global environmental review; (6).Building a sustainable
brand. And some factors, such as waste generated from supply chain, energy utilization
rate, greenhouse gas emissions and environmental legislation should be thought over when
designing a green supply chain (Paksoy et al., 2011). With regard to customer behavior,
Cervellon et al. (2010) have surveyed the people from different countries, and found that
the people, especially the youth, from Europe would pay more attention to sustainability in
fashion industry than the people from North America do.
2.2 Closed-loop supply chain
Closed-loop supply chain, just as Mark E. Ferguson and Gilvan C. Souza (2010) defined,
refers to the supply chains in which there are backward flows of materials, from end
customers to manufacturers. Paksoy, Bektas and Ozceylan (2011) also proposed that a
closed-loop supply chain is the supply chain which combines a series of forward and
backward activities. Closed-loop supply chains normally include activities of product
acquisition, reverse logistics, testing and grading, making disposition decisions,
reconditioning, distributing and selling of the recovered products (Klose et al., 2002, pp.56;
Guide, et al., 2003). Guide and Wassenhove (2009) proposed business definition of closed-
loop supply chain management as “the design, control, and operation of a system to
maximize value creation over the entire life cycle of a product with dynamic recovery of
value from different types and volumes of returns over time”. They also summarized five
phases of evolution of closed-loop supply chain: “the golden age of remanufacturing”,
“from remanufacturing to valuing the reverse-logistics process”, “coordinating the reverse
supply chain”, “closing the loop”, “prices and markets”. And they also stated that the
15
importance of closed-loop supply chain is gradually unveiled in diverse industries,
however, academic research of industry practice in such area is scarce.
Products return from end customer play a crucial role in closed-loop supply chain (Morana
and Seuring, 2007). Generally speaking, there are three typical types of product acquisition
in the closed-loop chain: consumer returns, end-of-use returns, end-of-life returns
(Ferguson and Souza, 2010). Identification of the form of products return is absolutely
necessary in closed-loop chain (Rao, 2008, pp.119). Based on Morana and Seuring’s (2007)
research, most customers are willing to return products at the end of the products’ life
cycle. There are two basic factors should be concerned in product acquisition section: one
is the uncertainty related to the recovery process in terms of quality, quantity and
packaging, and another one is the way of collecting such products and the way of
transporting collected products (Linton, et al., 2007).
According to the cases analyses in Rao’s (2008, pp.120-128) book, products acquisition
from end-customers in closed-loop supply chain are totally different in varied industries.
For instance, return rate of high-fashion garment could be 15% higher than that of high-
tech product (Dekker, et al., 2004). Moreover, proper product design is an essential in
closed-loop supply chain in all industries. Product design which facilitates backward
logistics always has positive impact on product recycling (Rao, 2008, pp.126). And in
terms of closed-loop supply chain management, the design which promotes the process of
reuse, recycling and recovery is crucial (Zhu, Sarkis and Lai, 2008).
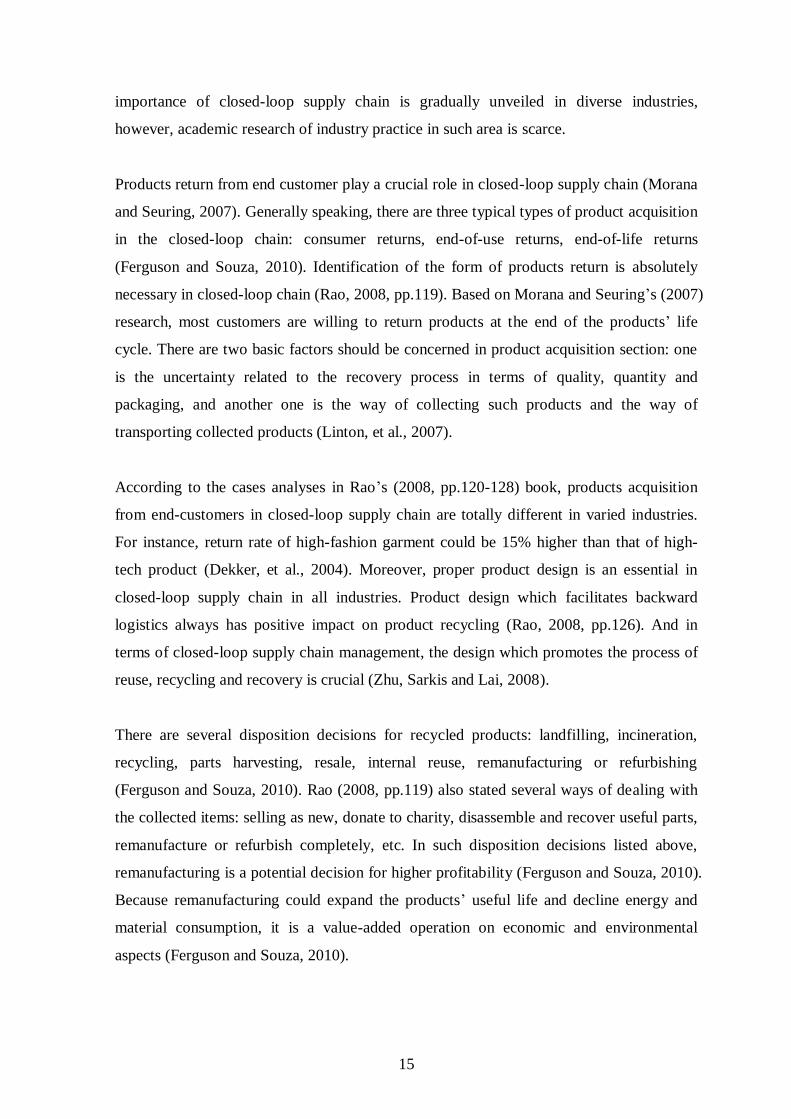
There are several disposition decisions for recycled products: landfilling, incineration,
recycling, parts harvesting, resale, internal reuse, remanufacturing or refurbishing
(Ferguson and Souza, 2010). Rao (2008, pp.119) also stated several ways of dealing with
the collected items: selling as new, donate to charity, disassemble and recover useful parts,
remanufacture or refurbish completely, etc. In such disposition decisions listed above,
remanufacturing is a potential decision for higher profitability (Ferguson and Souza, 2010).
Because remanufacturing could expand the products’ useful life and decline energy and
material consumption, it is a value-added operation on economic and environmental
aspects (Ferguson and Souza, 2010).
16
Market which closed-loop chain highly concentrates on has two segments: one is return of
used products, and another one is sale of remanufactured products (Rao, 2008, pp.119).
Market of remanufactured products can be allocated in two categories: perfect substitution
which is complete cannibalization market and secondary markets which have no
cannibalization. Market cannibalization deters remanufactured products from re-entering
the market (Guide and Wassenhove, 2009). In the remanufactured products market, most
economic values are generated by retailer while very little of them are created by
manufacturer (Guide and Wassenhove, 2009).
In apparel industry, recycled clothing can be treated as raw material (Young et al., 2004).
And remanufactured product from closed-loop chain can be treated as a kind of eco-
clothing (Cervellon et al., 2010). Cervellon (et al., 2010) has launched a survey of people’s
responses on eco-clothing. According to their report, environment, health and ethics are
three most significant criteria for customers when they are purchasing organic garments.
But there is an ironical phenomenon also stated in the report. Customers reckon
environmental protection as a significant essential when they are going to choose garments;
however, most of them do not treat this seriously when purchasing clothes in fashion stores
(Cervellon et al., 2010). In addition, reputation of seller is a criterion which is more critical
for customer to buy a remanufactured item than to purchase a new one (Subramanian,
2010).
2.3 Pricing
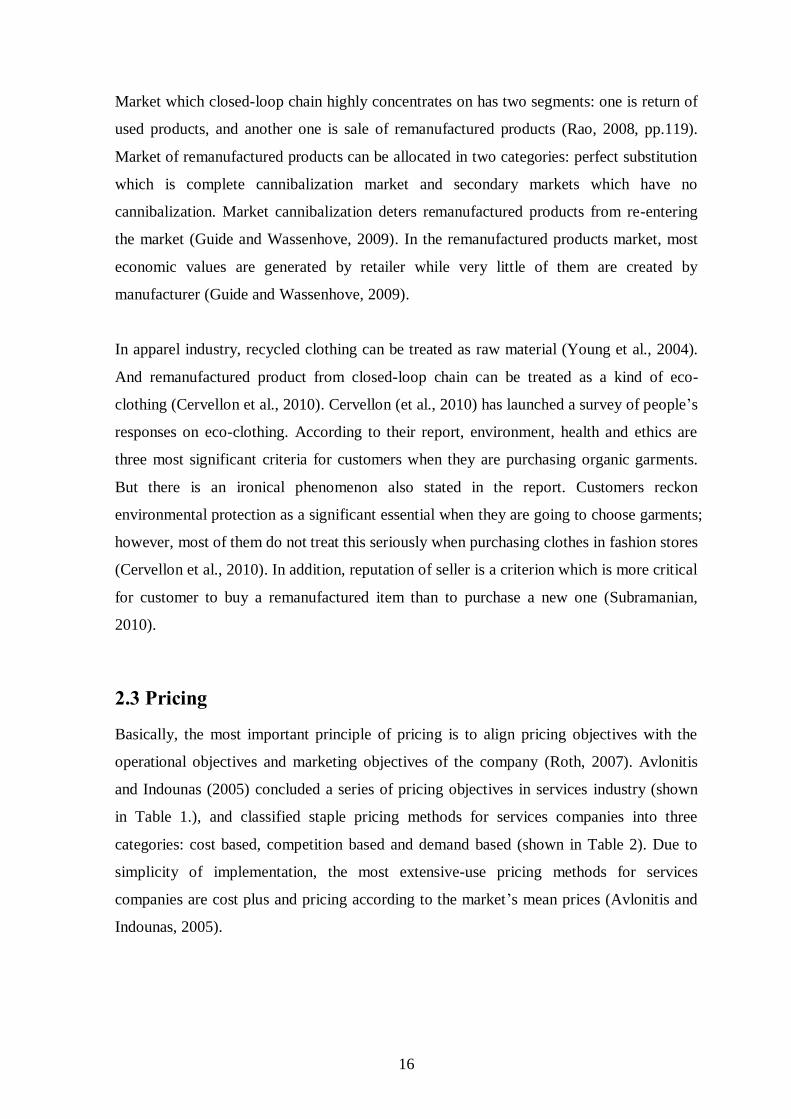
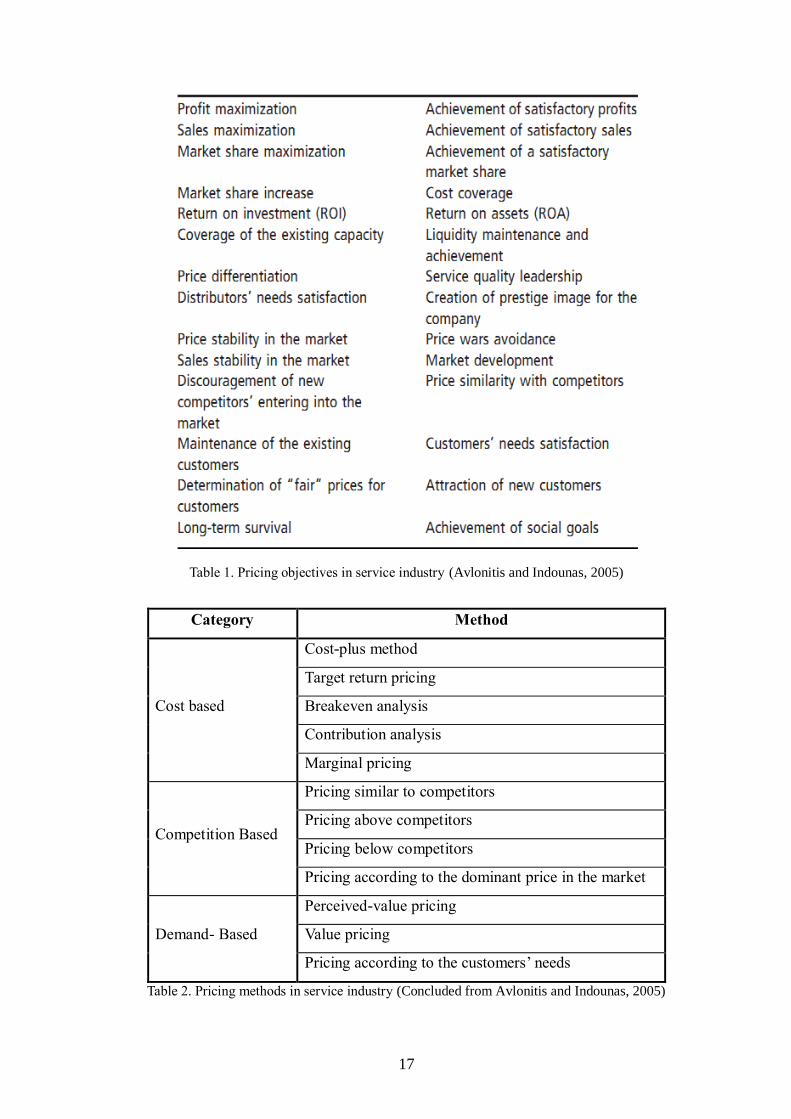
Basically, the most important principle of pricing is to align pricing objectives with the
operational objectives and marketing objectives of the company (Roth, 2007). Avlonitis
and Indounas (2005) concluded a series of pricing objectives in services industry (shown
in Table 1.), and classified staple pricing methods for services companies into three
categories: cost based, competition based and demand based (shown in Table 2). Due to
simplicity of implementation, the most extensive-use pricing methods for services
companies are cost plus and pricing according to the market’s mean prices (Avlonitis and
Indounas, 2005).
17
Table 1. Pricing objectives in service industry (Avlonitis and Indounas, 2005)
Category Method
Cost based
Cost-plus method
Target return pricing
Breakeven analysis
Contribution analysis
Marginal pricing
Competition Based
Pricing similar to competitors
Pricing above competitors
Pricing below competitors
Pricing according to the dominant price in the market
Demand- Based
Perceived-value pricing
Value pricing
Pricing according to the customers’ needs
Table 2. Pricing methods in service industry (Concluded from Avlonitis and Indounas, 2005)
18
To find out an appropriate pricing strategy for the remanufactured product is a crucial
challenge in closed-loop supply chain (Guide and Wassenhove, 2009). With the premise
that there is no difference in quality, pressure for pricing a remanufactured product is less
than pricing a new product as remanufacturing cost normally accounts for 40%-60% of
that of a new one only (Mitra, 2007). However, how to set a fair price for attracting
potential customers to buy the remanufactured products still remains as a difficulty that
needs to be resolved (Subramanian, 2010). In Ferguson and Souza’s book, they also made
some advices of remanufactured products’ pricing strategy. They pointed out that some
simple pricing strategies could be applied on remanufactured products, such as cost plus,
or a certain percent below the price of new.
Customer preference and competitors’ reactions also need to be taken into consideration.
Otherwise, an inappropriate pricing strategy may lead to the company’s failure (Mao and
Ostaszewski, 2007). According to the definition of game theory, pricing is a game (Mao
and Ostaszewski, 2007). As Mao and Ostaszewski (2007) defined,
Game theory is an area of applied mathematics that studies strategic
interactions among game participants, where players choose different
actions in an attempt to maximize their returns.
It is the study of how interdependent decision makers make choices, and a game must
consist of players, actions, information, strategies, payoffs, outcomes and equilibrium
(Waldman and Jensen, 2007, pp.207). Traditionally, implementations of game theory
attempt to locate equilibrium in the game. Many equilibrium concepts have been
developed such as Nash equilibrium in order to find out the decisions. Waldman and
Jensen also mentioned that game theory has been frequently used by economists to analyze
a wide variety of economic interactions in the last two decades.
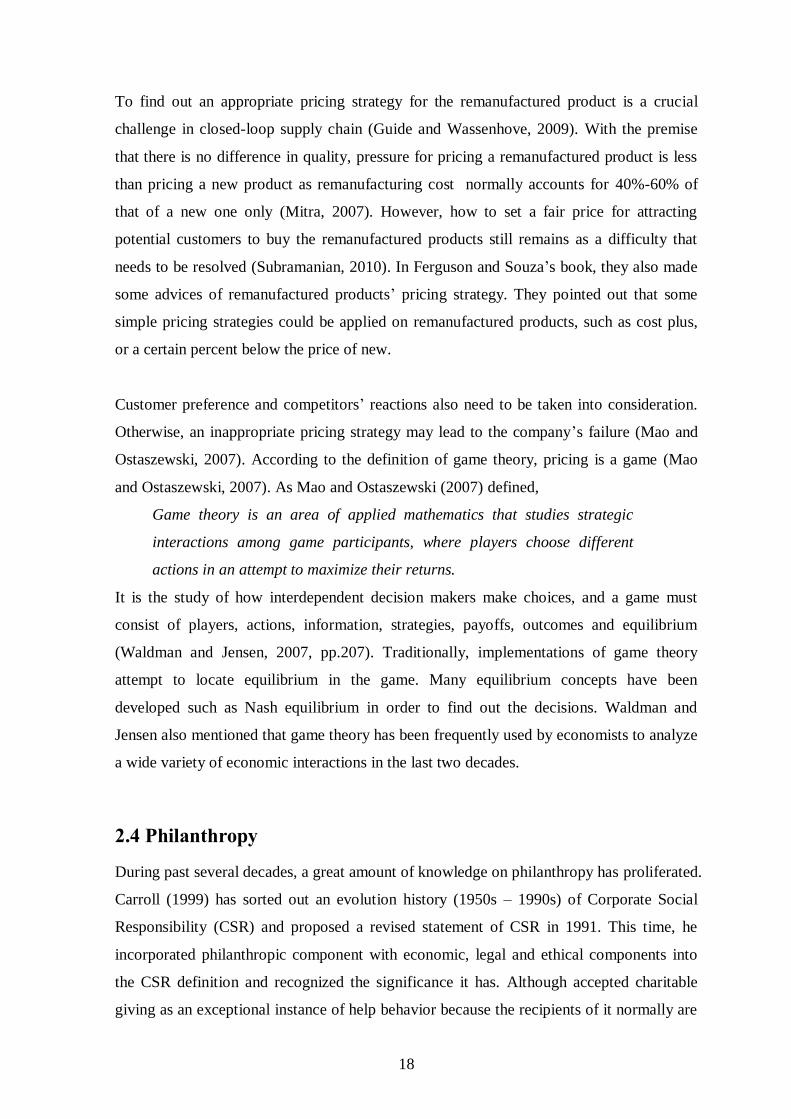
2.4 Philanthropy
During past several decades, a great amount of knowledge on philanthropy has proliferated.
Carroll (1999) has sorted out an evolution history (1950s – 1990s) of Corporate Social
Responsibility (CSR) and proposed a revised statement of CSR in 1991. This time, he
incorporated philanthropic component with economic, legal and ethical components into
the CSR definition and recognized the significance it has. Although accepted charitable
giving as an exceptional instance of help behavior because the recipients of it normally are
19
not located in the context where donations are made, Bekkers and Wiepking (2010)
defined philanthropy as the donation of money to a non-profit organization which would
finally benefit grantees. Some companies provide goods, services or assist to the charity as
an alternative of monetary donations (Campbell et al., 1999).
In 1970, Milton Friedman argued that “corporate philanthropy is an unjust tax on
stockholders” to answer to increasing calls for better performance of CSR. However, many
companies examined their overall profit after philanthropy has applied and the outcome let
them believe that “firms can actually do better by doing good” (Campbell et al. 1999).
Porter and Kramer (1999, 2002) have systematically elaborated the approaches and the
goals to do corporate philanthropy. Benefits of philanthropic giving were then mentioned
in several articles (Porter, 2006; Gardberg and Fombrun, 2006; Chen et al., 2008).
20
3. Brief Methodological Approach
Our thesis is based on a specific jeans-recycle scheme that a Norwegian fashion apparel
retailer, MiN Boutique Group AS, works on. What the company expects is to determine the
scheme’s sustainability. To approach the company’s aim, we will analyze the scheme’s
sustainability in terms of environment, society and economy.
As for environment, we will first analyze the Norway-based statistical data to find out
current situation of discarded textile. Then we are going to assess the possible
environmental impacts brought by running this project and the cost that the company needs
to pay.
With regard to economic impacts, our main task is to evaluate pricing strategies and to
come up with appropriate pricing models that would help the case company set a fair price
for the recycled shoes to sustain this scheme. Several pricing methods will be presented in
the relevant parts of our thesis. Because new pricing strategies interact with customer
demand, we need to identify the changes in demand which companies’ need to cope with.
Some concepts and methods will be introduced to measure the demand changes, such as
Price Elasticity of Demand (PED), breakeven sales analysis.
When it comes to social issues, we are talking about the philanthropy given in the project,
a branch of Corporate Social Responsibility (CSR). We will introduce the type of
philanthropy that can benefit both the company itself and the society. After that, how a
company could give meaningful and successful philanthropy will be discussed based on
relevant literature. At last, effects of charitable giving will be evaluated practically and
theoretically.
Since our thesis is based on real company’s specific case, primary data such as expected
sales volume, purchasing price of recycled shoes etc. are provided by the case company
weighs heavily in our research. In order to fully understand the case company’s ideas, we
had several meetings with the company’s contact person, Ms. Stenseth. She provided us
with full range and depth of information we need in the research.

21
The secondary data which is used for establishing an appropriate theoretical framework in
this thesis should be collected as well. We need to search relevant data relating to apparel
industry, environment, pricing model, and philanthropy etc. And most of the data sources
are from internet, such as online scientific databases in our college library, Norwegian
Statistics and Google.
22
4. Introduction to the case company
4.1 History of MiN Boutique Group AS
MiN Boutique Group AS (MiN Boutique) is a Norwegian fashion and sports apparel
retailer established in 1969. In 1988, it opened the second store, a Vero Moda concept
store, in Norway. In 1990, MiN Boutique cooperated with Bestseller AS (Denmark) and
started another three Vero Moda stores in Tønsberg, Kristiansund and Molde, respectively.
The agreement with Bestseller ceased in 1st
March 2007 and Miles Ahead (MAH)
continued operating based on the x-Vero Moda premises.
In the period 1979-2002, MiN Boutique was a member of the procurement chain Samtex
(now it is called “the Match”). Through the membership for 22 years, the company’s
management has considerable expertise and experience in chain operations. MiN Boutique
went out of the chain in 2002 when the Match was sold to the Voice, and MiN Boutique
remained a standalone multi-brand shop. MiN Boutique expanded in 2002 to Oslo through
the acquisition of two stores, Paleet and Glass Magasinet.
Since 1999 MiN Boutique has expanded its business to Møre and Romsdal, with additional
stores in Kristiansund, Ålesund, Sunndal, Elnesvågen and Åndalsnes. Centralization of
Oslo and Tønsberg has also been successful.
MiN Boutique strengthened its management. Until July 2007, it has been a business
manager of seven Bertoni shops in Norway. These are sold back to the franchise owner
Bertoni Denmark. Now, Molde Fashion Forum, B-Young Molde, is also under the
administration of MiN Boutique.
Separate stand-alone concept, the company operated from 1969. MiN Boutique has spent
20 years in learning and 10 years in full-load operating. 2007 - 2010 is a period of
consolidation and great changes for the company. Cooperation with Vero Moda and
Bestseller Group has ceased and then started cooperation with B-Young. And all Vero
Moda stores were closed, sold and/or changed the profile. The shops in Oslo, Tønsberg and
Kristiansund are no longer in the portfolio. A top-heavy organization slimmed down.
During 2006 and 2007, two concept stores have been set up, Mia Bao and Miles Ahead
23
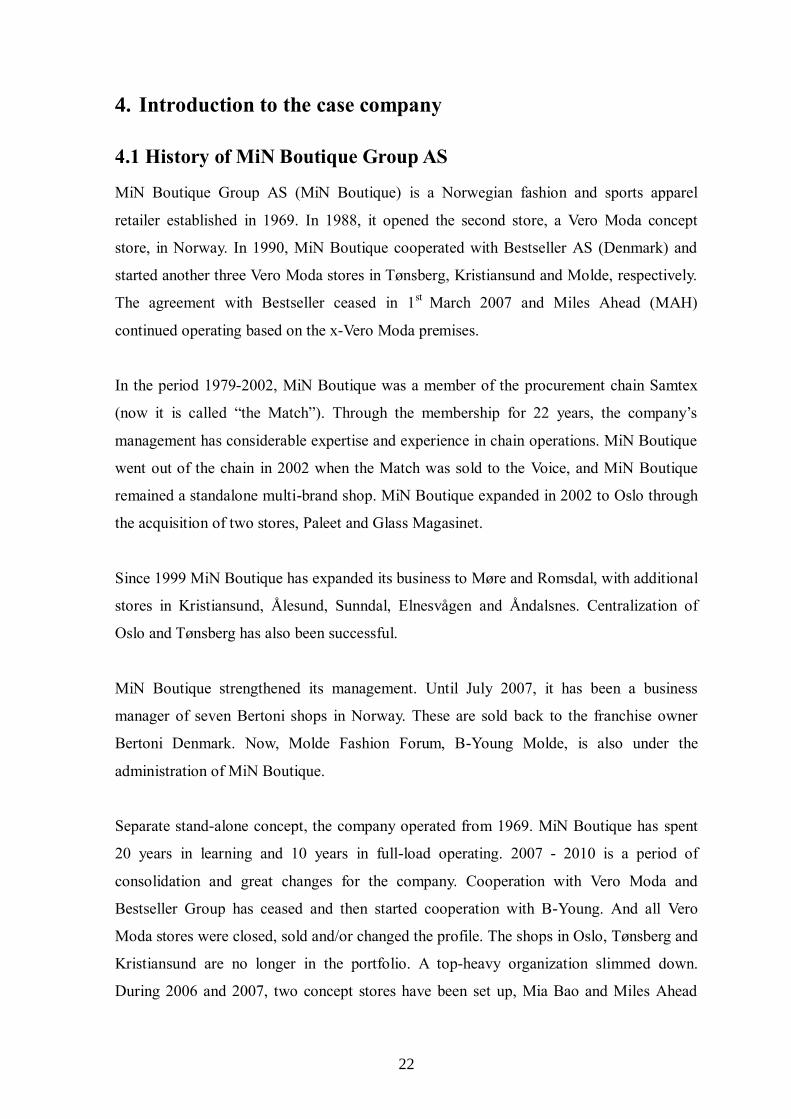
(MAH). And during this period, MiN B Boutique’s development could also match the
market. Figure 2 shows the company’s turnover from 1969 to 2007. In the first two
decades, the sale amount was growing slowly. The turnover was booming in the third
decade of the company’s development. In 2007, the turnover was over 1 200 000 NOK.
Figure 2. Sale amount of MiN BOUTIQU AS, 1969-2007
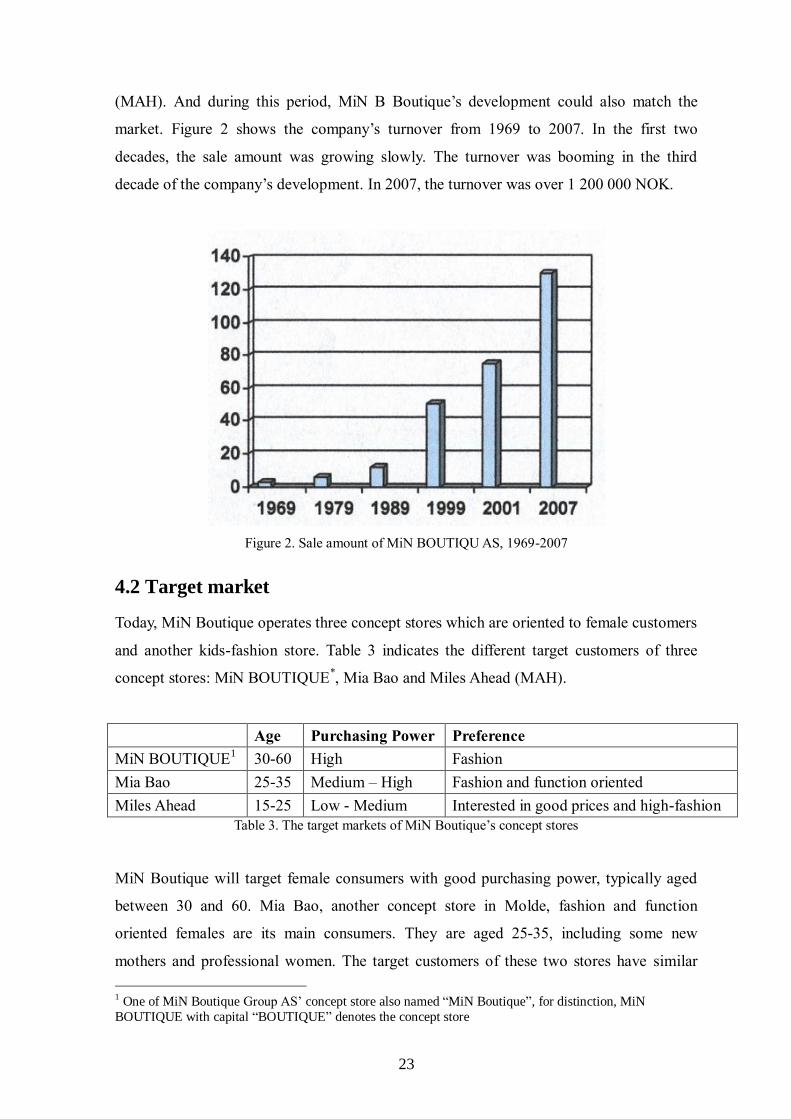
4.2 Target market
Today, MiN Boutique operates three concept stores which are oriented to female customers
and another kids-fashion store. Table 3 indicates the different target customers of three
concept stores: MiN BOUTIQUE*, Mia Bao and Miles Ahead (MAH).
Age Purchasing Power Preference
MiN BOUTIQUE1 30-60 High Fashion
Mia Bao 25-35 Medium – High Fashion and function oriented
Miles Ahead 15-25 Low - Medium Interested in good prices and high-fashion
Table 3. The target markets of MiN Boutique’s concept stores
MiN Boutique will target female consumers with good purchasing power, typically aged
between 30 and 60. Mia Bao, another concept store in Molde, fashion and function
oriented females are its main consumers. They are aged 25-35, including some new
mothers and professional women. The target customers of these two stores have similar
1 One of MiN Boutique Group AS’ concept store also named “MiN Boutique”, for distinction, MiN
BOUTIQUE with capital “BOUTIQUE” denotes the concept store
24
characteristic with medium/high-end incomes. Based on such an economic foundation,
they do not take too much price factor into consideration when they are choosing garment.
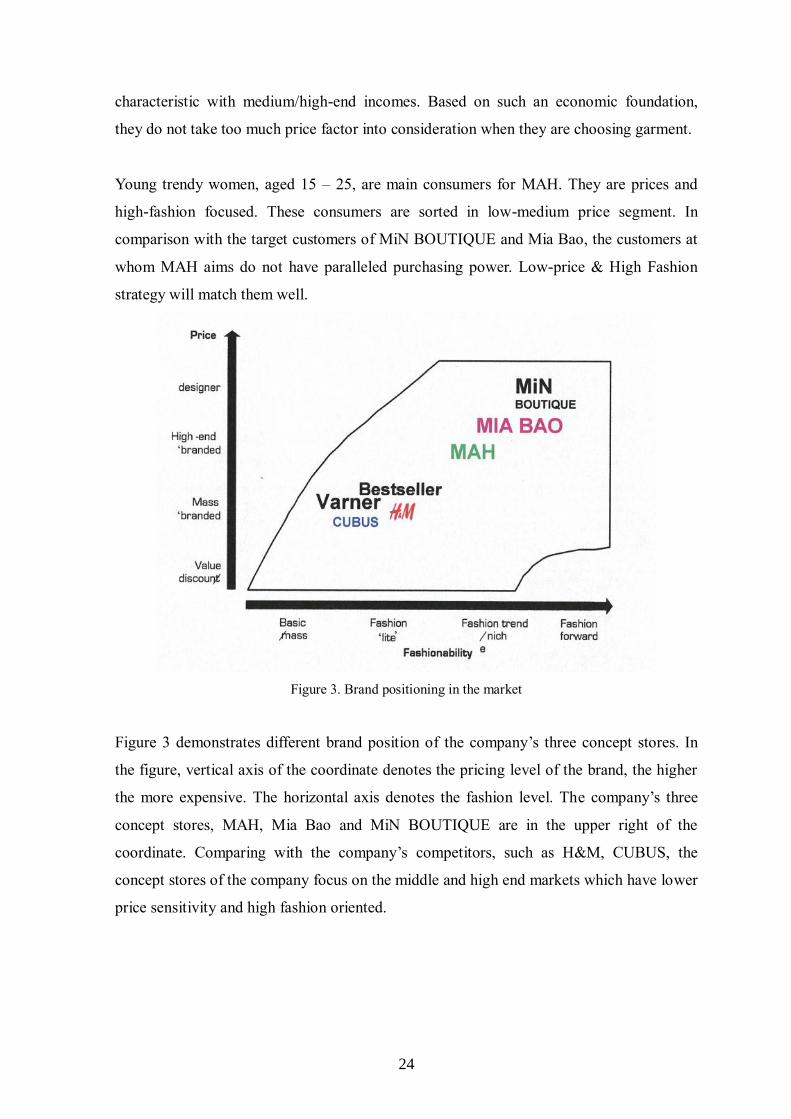
Young trendy women, aged 15 – 25, are main consumers for MAH. They are prices and
high-fashion focused. These consumers are sorted in low-medium price segment. In
comparison with the target customers of MiN BOUTIQUE and Mia Bao, the customers at
whom MAH aims do not have paralleled purchasing power. Low-price & High Fashion
strategy will match them well.
Figure 3. Brand positioning in the market
Figure 3 demonstrates different brand position of the company’s three concept stores. In
the figure, vertical axis of the coordinate denotes the pricing level of the brand, the higher
the more expensive. The horizontal axis denotes the fashion level. The company’s three
concept stores, MAH, Mia Bao and MiN BOUTIQUE are in the upper right of the
coordinate. Comparing with the company’s competitors, such as H&M, CUBUS, the
concept stores of the company focus on the middle and high end markets which have lower
price sensitivity and high fashion oriented.
25
4.3 Prospect of MiN Boutique
Archie B. Carroll (1999) concluded that “the Corporate Social Responsibility (CSR) would
remain as an essential part of business practice” since the public requires the business
community today to be social responsible. In other words, the performance of CSR
becomes a new measurement to evaluate the business. Through the discussion with Inger
Mette Stenseth, the owner of MIN Boutique, we find that she is a philanthropic, ambitious
and provident leader with well understanding of public concerns. She would like to
contribute towards philanthropy and environmental protection as long as such a business is
economic sustainable.
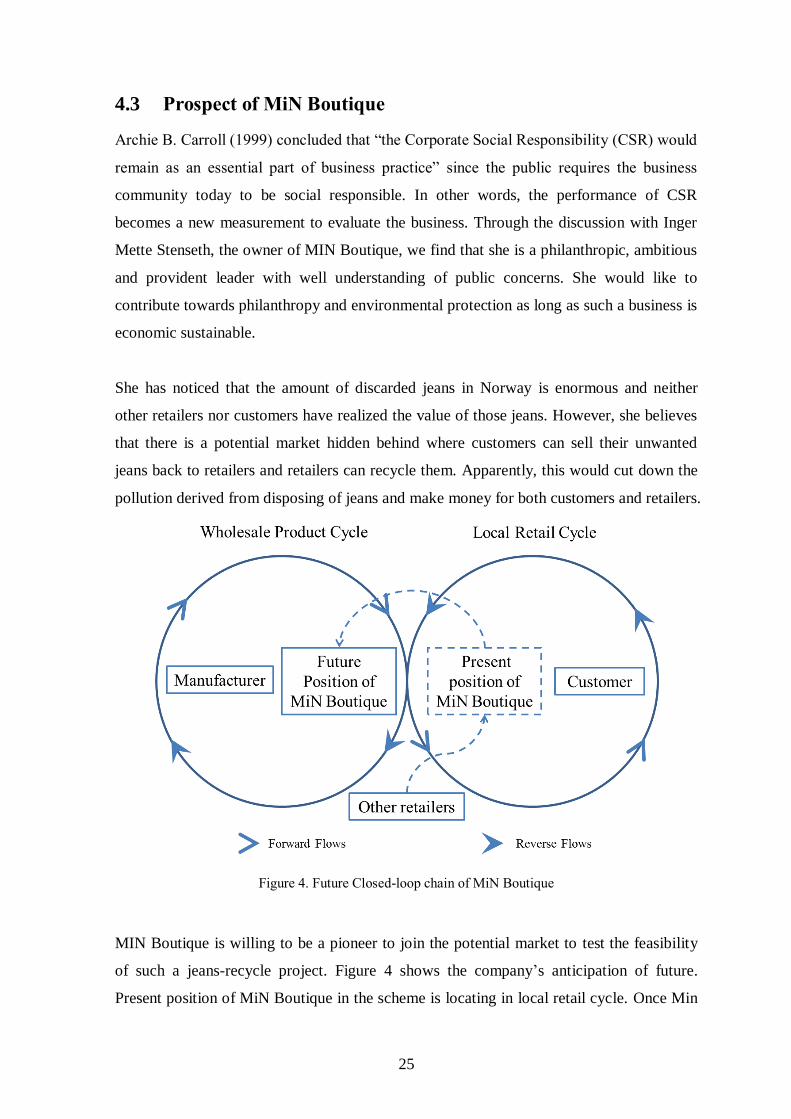
She has noticed that the amount of discarded jeans in Norway is enormous and neither
other retailers nor customers have realized the value of those jeans. However, she believes
that there is a potential market hidden behind where customers can sell their unwanted
jeans back to retailers and retailers can recycle them. Apparently, this would cut down the
pollution derived from disposing of jeans and make money for both customers and retailers.
Figure 4. Future Closed-loop chain of MiN Boutique
MIN Boutique is willing to be a pioneer to join the potential market to test the feasibility
of such a jeans-recycle project. Figure 4 shows the company’s anticipation of future.
Present position of MiN Boutique in the scheme is locating in local retail cycle. Once Min

26
Boutique finds that a robust closed-loop chain has been formed, the concept will be
introduced to other retailers. At that time, Min Boutique will shift its position from local
retail cycle to wholesale product cycle, and other retailers will enter the market to take the
place of MiN Boutique in local retail cycle. Meanwhile, MiN Boutique will play as an
agency connecting manufacturer with other retailers and will further expand its business to
all over Norway.
27
5. The Case Study
In this part, we are going to analyze sustainability of each disposition decision in the case.
Generally, we will concentrate in three main aspects of the sustainability: environmental
sustainability, economic sustainability and social sustainability.
5.1 The Jeans-recycle Scheme
Now, MiN Boutique has its first move, to carry out a jeans-recycle scheme. According to
the information provided by the company, the scheme can be described as the following 3
steps.
The first step is to collect jeans from customers. Customers of MiN Boutique can take their
wore jeans which are outmoded or damaged to any MiN Boutique branch store to get a
price-off coupon. One coupon can be used on a 300NOK purchase or ten coupons can be
used as a whole to buy anything in the stores. From existing cases, compared with the
traditional utilization of coupon, the customers taking part in such a scheme are more
inclined to bring the coupon back to stores (Cooper, 2009).
The second step, here sorting operation will be carried out. The company will sort out
those jeans according to the quality and style and brand. This phase is the pre-condition of
the third step of the scheme.
The third step is to send the sorted jeans to appropriate destinations. Four places are there.
The highly damaged jeans will be sent to the garbage station. Some classic jeans with no
functional problem will be sent to African countries for charitable causes. Some of the rest
will be sent to the factory in the UK to re-manufacture into eco-sandals. The jeans with
special value, for instance, worn or signed by celebrities will be sent to vintage stores in
Oslo for resale.
28
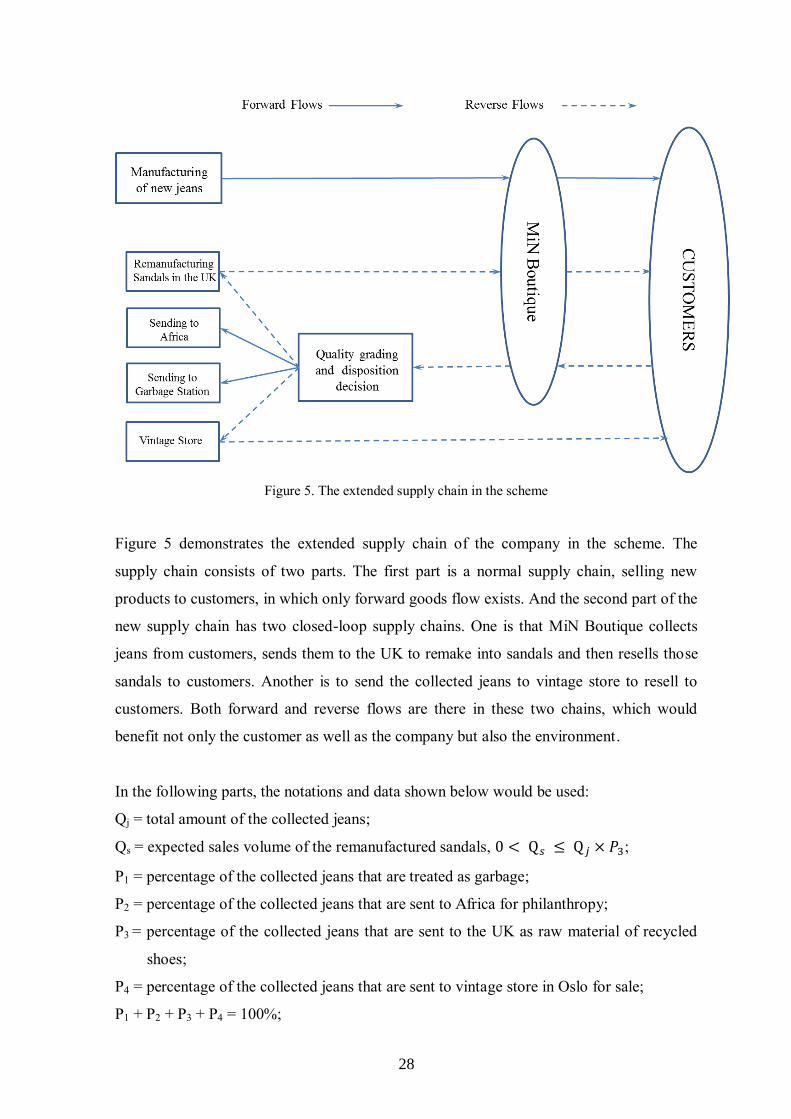
Figure 5. The extended supply chain in the scheme
Figure 5 demonstrates the extended supply chain of the company in the scheme. The
supply chain consists of two parts. The first part is a normal supply chain, selling new
products to customers, in which only forward goods flow exists. And the second part of the
new supply chain has two closed-loop supply chains. One is that MiN Boutique collects
jeans from customers, sends them to the UK to remake into sandals and then resells those
sandals to customers. Another is to send the collected jeans to vintage store to resell to
customers. Both forward and reverse flows are there in these two chains, which would
benefit not only the customer as well as the company but also the environment.
In the following parts, the notations and data shown below would be used:
Qj = total amount of the collected jeans;
Qs = expected sales volume of the remanufactured sandals, 0 < Q𝑠 ≤ Q𝑗 × 𝑃3;
P1 = percentage of the collected jeans that are treated as garbage;
P2 = percentage of the collected jeans that are sent to Africa for philanthropy;
P3 = percentage of the collected jeans that are sent to the UK as raw material of recycled
shoes;
P4 = percentage of the collected jeans that are sent to vintage store in Oslo for sale;
P1 + P2 + P3 + P4 = 100%;
29
Cc = price of the coupon used in jean’s collection stage, in NOK/unit;
Cg = Unit disposal cost of the collected jeans that are treated as garbage, in NOK/unit;
Cr = unit cost of remanufactured sandal, in NOK/pair;
PS = price of selling remanufactured sandal to customers.
The specific figure of these notations will be introduced in section 5.5.
5.1 Disposition decision A: Sending to Garbage Station --
Environmental protection
5.1.1 Brief introduction of textile waste in Norway
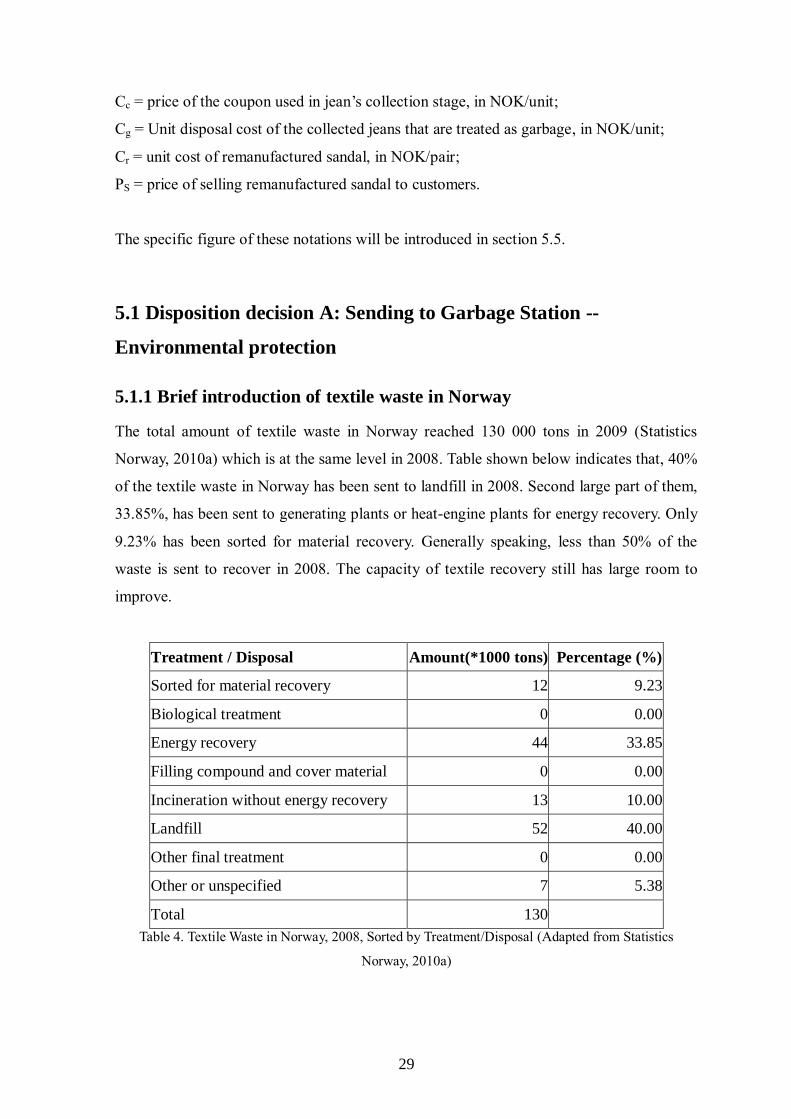
The total amount of textile waste in Norway reached 130 000 tons in 2009 (Statistics
Norway, 2010a) which is at the same level in 2008. Table shown below indicates that, 40%
of the textile waste in Norway has been sent to landfill in 2008. Second large part of them,
33.85%, has been sent to generating plants or heat-engine plants for energy recovery. Only
9.23% has been sorted for material recovery. Generally speaking, less than 50% of the
waste is sent to recover in 2008. The capacity of textile recovery still has large room to
improve.
Treatment / Disposal Amount(*1000 tons) Percentage (%)
Sorted for material recovery 12 9.23
Biological treatment 0 0.00
Energy recovery 44 33.85
Filling compound and cover material 0 0.00
Incineration without energy recovery 13 10.00
Landfill 52 40.00
Other final treatment 0 0.00
Other or unspecified 7 5.38
Total 130
Table 4. Textile Waste in Norway, 2008, Sorted by Treatment/Disposal (Adapted from Statistics
Norway, 2010a)
30
Recovery of garbage is a general meaning of waste reuse. The definition can be expressed
in two aspects, material recovery and energy recovery. Material recovery is the utilization
of waste which material is both partly and entirely kept. Energy recoveries are incineration
with energy utilization and composting (Statistics Norway, 2010b). From environmental
aspect, material recovery is more environmentally friendly than energy recovery.
Incineration always emits greenhouse gas, such as CO2, N2O and CH4 etc. which will
heighten the temperature and harm the environment eventually. In addition, residues from
incineration are landfilled again in Norway (Statistics Norway, 2010c), however, landfills
or incinerators is not sustainable (Ferguson and Souza, 2010).
5.1.2 What could the company gain?
In terms of economic aspect, sending sorted jeans to garbage station gives negative impact
on the company. The company could not benefit in terms of monetary value by taking such
proposition decision. Nevertheless, with regard to environmental consideration, positive
impact will arise.
In 2008, two fifths of textile waste, 52 000 tons, were generated from households
(Statistics Norway, 2010a), only 13 000 tons (Statistics Norway, 2010d) of them have been
used to recovery. On the one hand the company’s jeans collection scheme could increase
the recovery rate of households’ textile waste. Utilization of the end-of-life jeans will be
improved, both from material recovery and energy recovery. On the other hand, because
most of collected jeans will be sent to material recovery in the scheme, the way jeans
treated in the scheme could be more environmentally friendly than treating them by
householders themselves. MiN Boutique is providing a 50 NOK coupon in exchange for a
pair of jeans; hence, people can get economic benefits from returning jeans to the
company. This will stimulate local residents to send back their unused jeans to recycle.
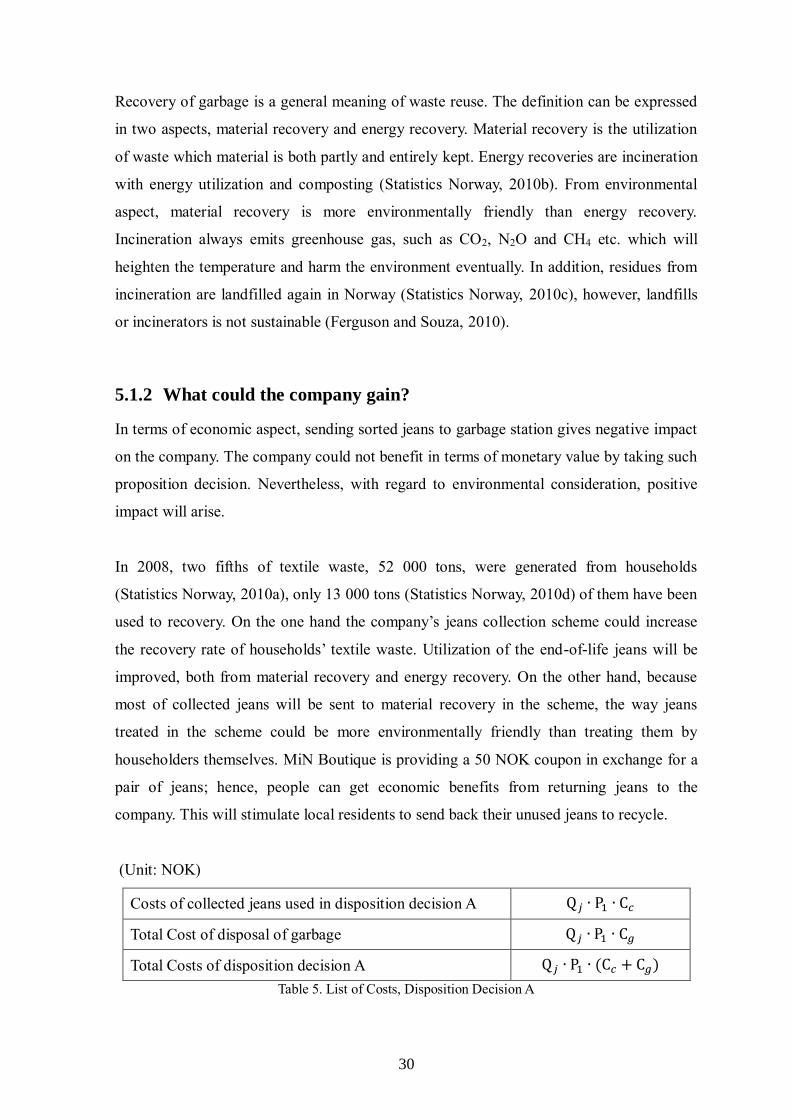
(Unit: NOK)
Costs of collected jeans used in disposition decision A Q𝑗 ∙ P1 ∙ C𝑐
Total Cost of disposal of garbage Q𝑗 ∙ P1 ∙ C𝑔
Total Costs of disposition decision A Q𝑗 ∙ P1 ∙ (C𝑐 + C𝑔)
Table 5. List of Costs, Disposition Decision A
31
Table 5. is the list of cost in disposition decision A. According to the price list provided by
Retura (a waste services company in Møre and Romsdal), Retura charges 1840 NOK for
business organizations to dispose one ton of textile waste. And as MiN Boutique estimated,
125 pieces of jeans weight 100 kilograms. Then we can calculate unit disposal cost of the
collected jeans,
C𝑔 184
125 1.472 𝑁𝑂𝐾
5.2 Disposition Decision B: Sending to Africa -- Philanthropy
Since 1990s, accompanying with economic globalization, the performance of Corporate
Social Responsibility (CSR) has become a significant measurement of a certain company’s
reputation. Archie B. Carroll (1999) further elaborated his previous definition of CSR
written in 1979, saying “In my view, CSR involves the conduct of a business so that it is
economically profitable, law abiding, ethical and socially supportive.” From his point,
CSR has four components: economic, legal, ethical and philanthropic. In this paper, we
will however only talk about the charitable responsibility.
In 1970, reacting to the increasing calls of greater social responsibility of business, the
economist Milton Friedman argued in an article published in New York Times Magazine
that the only CSR was to increase corporate profits. Actions like philanthropy which
would cut off profits were unfair to stockholders. Although his argument is proved to be
right by the profits-focused companies in most of the time, Michael E. Porter and Mark R.
Kramer, in 2002, figured out that Friedman’s argument was based on two implicit
assumptions:
1. Social and economic objectives are separate and distinct so that a corporation’s social
spending comes at the expense of its economic results.
2. The assumption that corporations, when they address social objectives, provide no
greater benefit than is provided by individual donors.
Hence, they came up with a more reasonable way to think about corporation philanthropy.
They stated that doing philanthropy does increase the corporation’s expenditure and thus
lowers its profits in the short run. However, it will improve a corporation’s competitive
context and align its social goal with its economic goal in the long run. Moreover, the
32
corporation can not only give money but also use other methods to help do charitable
causes, and it provides greater social benefit than individual donors providing. This
statement contradicted Friedman’s two assumptions and was proved by a few companies.
Cisco Systems is a typical example.
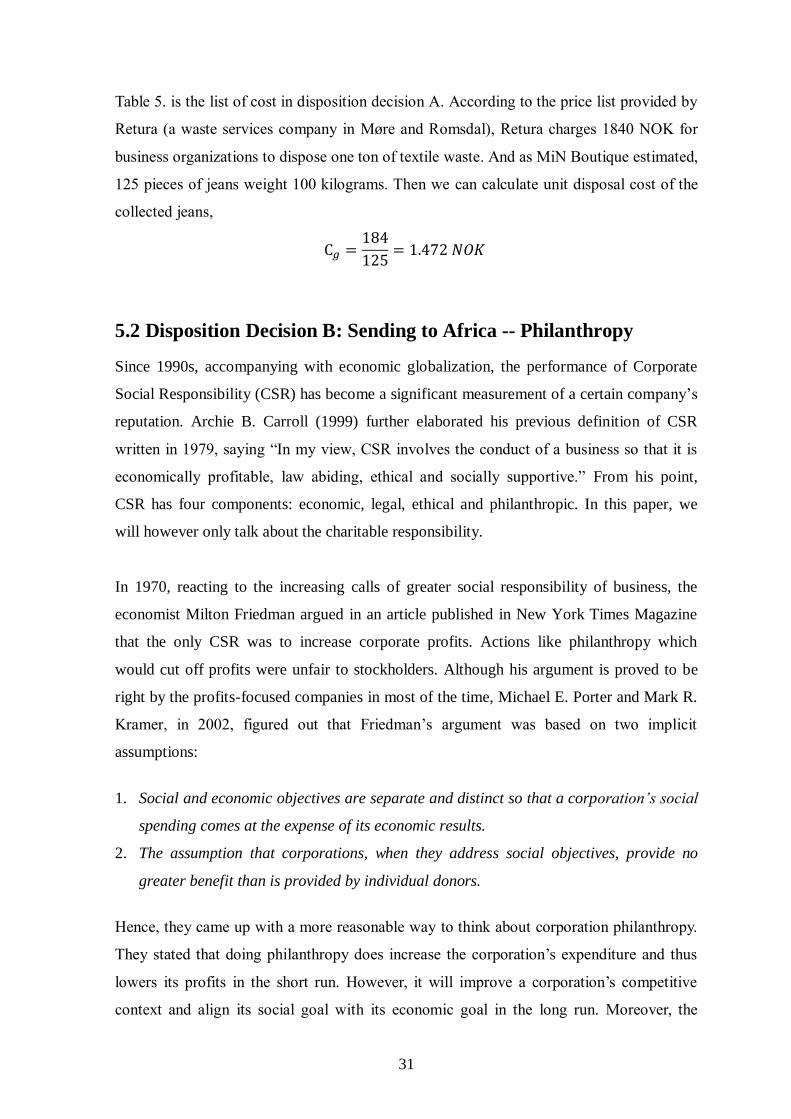
“In the long run, social and economic goals are not inherently conflicting but integrally
connected,” saying Michael E. Porter and Mark R. Kramer (2002). They believed that the
competitiveness depends heavily on the certain company’s productivity, which is restricted
by the company itself as well as its business environment. Therefore, we note that only the
philanthropy that will bring the company combined social and economic benefit would
increase the company’s productivity and further enhance its competitiveness.
Figure 6. A Convergence of Interests (Porter and Kramer, 2002)
The shaded area in the above exhibit is where philanthropy makes sense and stockholders
are interested in.
As mentioned before, corporation philanthropy will improve the corporation’s competitive
context in the long run. Competitive context is the quality of the business environment
where the company locates and/or operates. (Porter and Kramer, 2002) The characteristics
of the competitive context are considered as determinants that can somehow influence the
33
company’s strategy and profitability. (Depperu and Gnan, 2003) Thus, the importance of
competitive context is obvious.
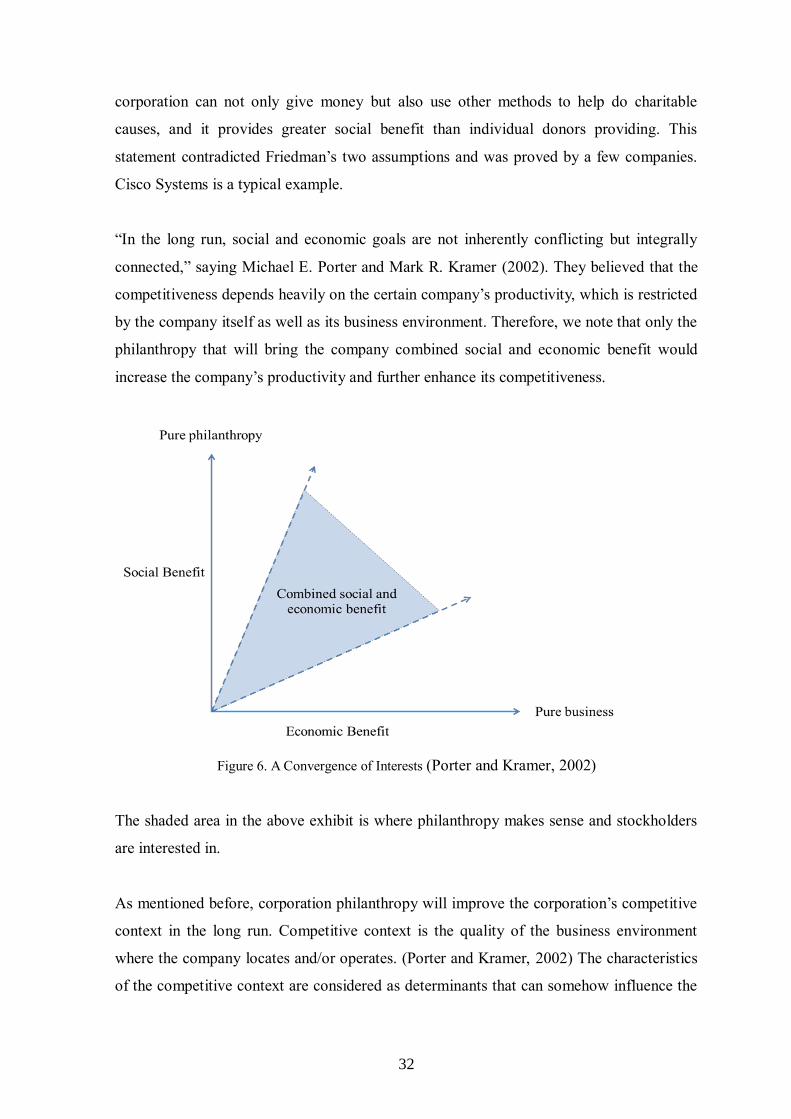
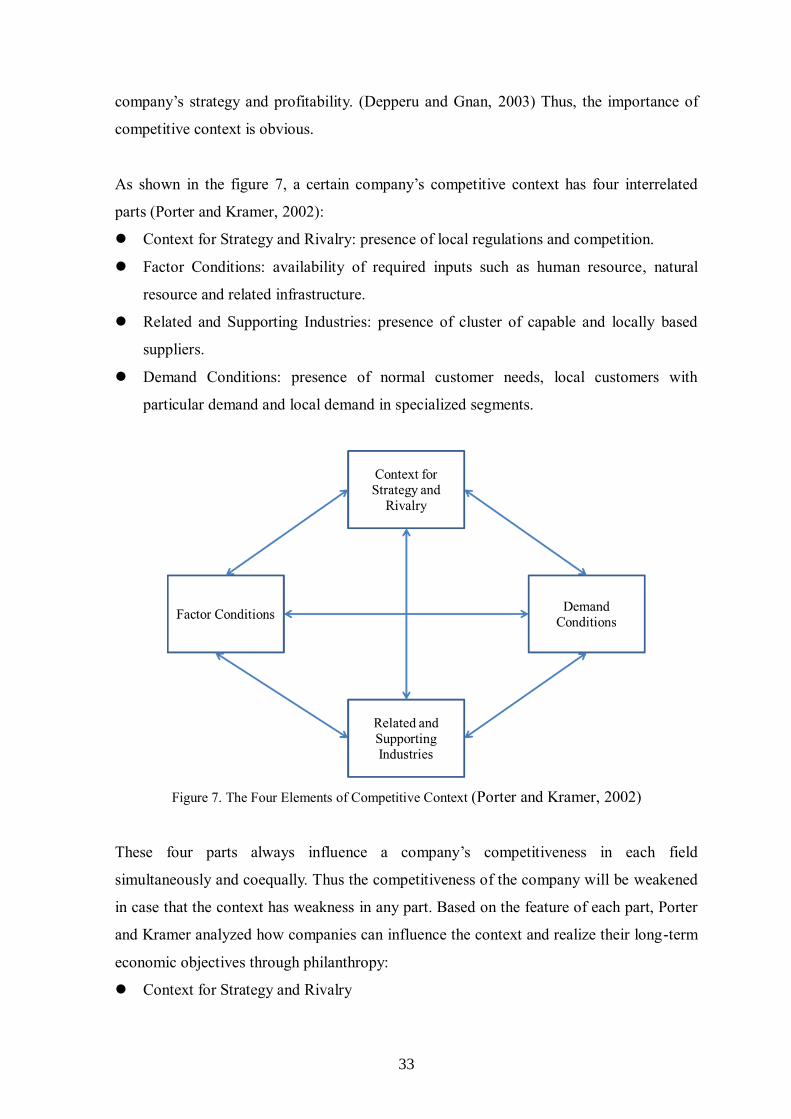
As shown in the figure 7, a certain company’s competitive context has four interrelated
parts (Porter and Kramer, 2002):
Context for Strategy and Rivalry: presence of local regulations and competition.
Factor Conditions: availability of required inputs such as human resource, natural
resource and related infrastructure.
Related and Supporting Industries: presence of cluster of capable and locally based
suppliers.
Demand Conditions: presence of normal customer needs, local customers with
particular demand and local demand in specialized segments.
Figure 7. The Four Elements of Competitive Context (Porter and Kramer, 2002)
These four parts always influence a company’s competitiveness in each field
simultaneously and coequally. Thus the competitiveness of the company will be weakened
in case that the context has weakness in any part. Based on the feature of each part, Porter
and Kramer analyzed how companies can influence the context and realize their long-term
economic objectives through philanthropy:
Context for Strategy and Rivalry
34
The local policies that help build a fair, reliable and robust market for competition
have positive influence on productivity. “Philanthropy can have a strong influence on
creating a more productive and transparent environment for competition,” said Porter
and Kramer, 2002. They used the Transparency International case in which 64
corporations from all over the world had joined together to focus public attention on
disclosing and deterring corruption to create an environment for higher productivity
and fair competition
Factor Conditions
The presence of human resource, adequate related infrastructure, available natural
resources and transparent and efficient administrative procedure can all be affected by
doing charitable giving (Porter and Kramer, 2002). For example, a company can create
a special and free program to train low-income local residents and/or poor students in
cooperation with local government. And normally people who benefit from this
training would give priority to this company when they are in job hunting. Also, SC
Johnson launched a so-called Sustainable Racine project to better serve its home city,
resulting in water saving and pollution reducing. ExxonMobil, the world's largest
publicly traded international oil and gas company, has spent a lot of resources in
improving roads conditions in the places where it operates.
Related and Supporting Industries
A company’s productivity highly depends on its related and supporting industries to
which it outsources. And usually, the company would like to choose its partners
nearby rather than distant. This is because proximity not only enhances the
convenience but also lowers the transportation cost and inventory cost. Philanthropy
can improve the quality as well as the quantity of associated industries. For instance, a
travel agency’s business depends on attractions such as hotels, restaurants where it
operates. In order to strengthen them, the travel agency can start a gratis training
course in high schools and colleges. After students who have studied in this course
graduate, some of them will take jobs in the travel-related industry. American Express
is a successful pioneer of doing this.
Demand Conditions
Philanthropy can impact on demand conditions in a region which include the size of
the customer needs, the standards of products and the sophistication of the customer
there. Apple Computer, for instance, has donated its computers to schools. This brings
35
obvious social benefits to the schools while students and staff are gradually turned into
sophisticated potential customers of Apple Computer.
Finally, Porter and Kramer had concluded that “philanthropy can often be the most cost-
effective way - and sometimes the only way - to improve competitive context.”
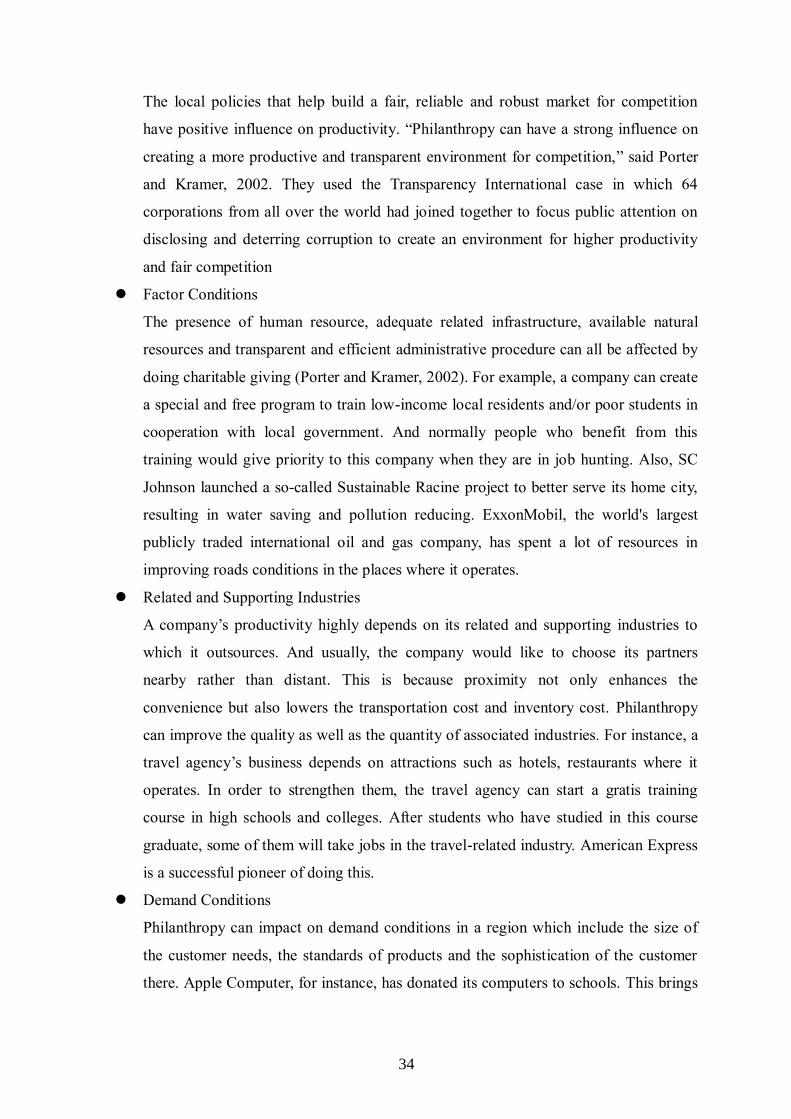
After charitable causes have been successfully implemented, other companies, even
competitors will benefit from the improved competitive context. At this time, how to create
the greatest social and economic value to gain an advantage in the competition is the
problem we are facing.
Figure 8. Maximizing Philanthropy’s Value (Michael E. Porter and Mark R. Kramer, 2002)
As illustrated in exhibit above, Porter and Kramer outlined four stages describing how
philanthropy creates social value:
1. Selecting the best grantees
Foundations have experienced expertise to choose grantees that are the most cost-
effective and/or that are in urgent need to deal with serious problems to channel
resources to. Hence, each dollar provided by specialized foundations will earn a higher
social value than the dollar given by non-professional donors.
36
2. Signaling other funders
This is an extension of the first step. If a foundation is good at selecting procedure, it
can magnify the created value by attracting other funders by offering additional
education or suitable grant.
3. Improve the performance of grant recipients
Foundations can offer specialized assets to help grantees improve their capabilities
and improve their performance and thus increase the return on their total budget.
4. Advancing knowledge and practice
“The most powerful way to create social value is by developing new means to address
social problems and putting them into widespread practice,” said Porter and Kramer in
2002.
The former stage is the foundation of latter stage. They also argued that these four
principles are the guarantee that corporate philanthropy has larger impact than individual
donations. But later, they realized that four forms of value creation are not that complete.
They proposed a new five-step approach where the CEO and the entire management team
of the company should participate in:
1. Examine competitive context of all the company’s locations to find out the key
constraint which limits its competitiveness and growth.
2. Shift the company’s philanthropy from communal obligation performing and goodwill
building to strategic giving, i.e. focusing on improving competitive context.
3. “Assess existing and potential corporate giving initiatives against the four forms of
value creation.”
4. Seek partners to cooperate with.
5. Monitor and evaluate the achievements.
Inger Mette Stenseth, the owner of our case company, MiN Boutique Group AS, has a new
plan this year. She wants to do a jean’s collection and send part of collected jeans to Africa
for philanthropy. Since she thinks now it is the good time to expand her company’s
business to Africa and doing charitable causes is a good way to explore African market and
establishing good reputation as well as relationships there.
Having understood the social and economic value creating procedure, MiN Boutique
chooses a professional and experienced social-aid agency, Norad. Norad (the Norwegian
37
Agency for Development Cooperation) is a directorate under the Norwegian Ministry of
Foreign Affairs (MFA). It will ensure that grant and support provided through international
and Norwegian partners contributes effectively to grantees (Norad, 2010). What MiN
Boutique needs to do here is to transport those collected jeans to Norad’s collecting center.
According to the agreement between Norad and MiN Boutique, Norad will pay the
expenses of delivering the donated jeans to its collecting center. And handling such
donated jeans is free for MiN Boutique.
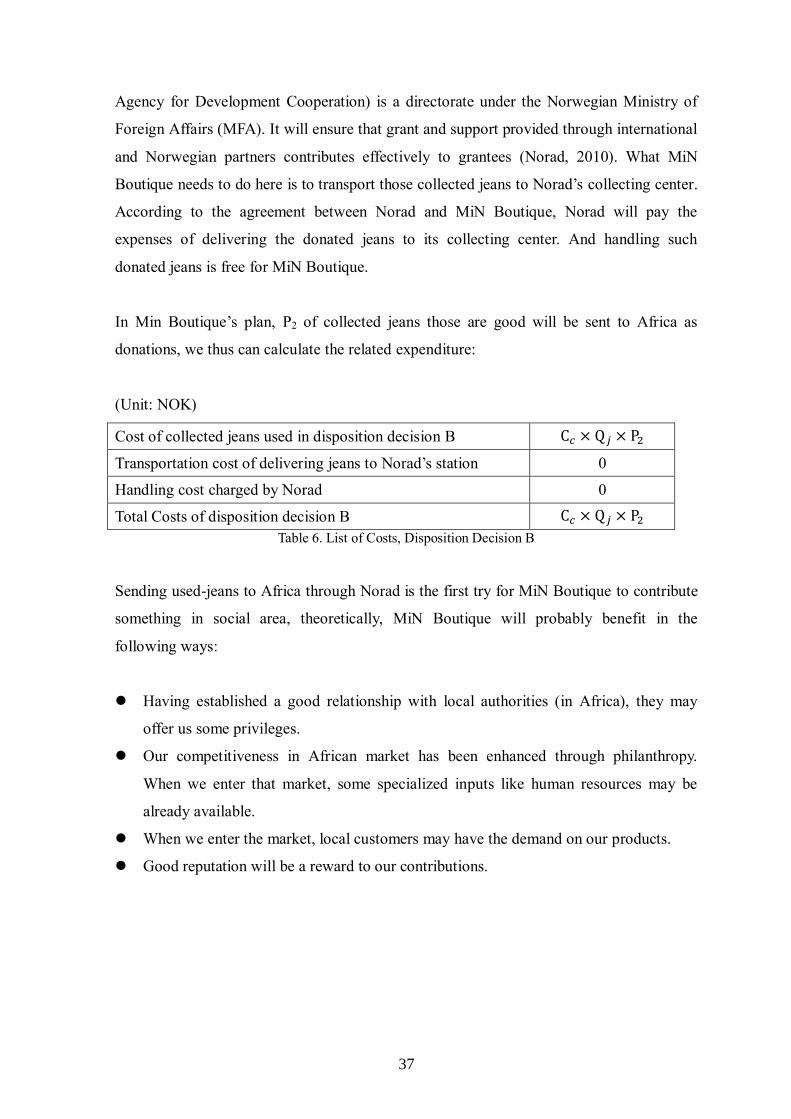
In Min Boutique’s plan, P2 of collected jeans those are good will be sent to Africa as
donations, we thus can calculate the related expenditure:
(Unit: NOK)
Cost of collected jeans used in disposition decision B C𝑐 × Q𝑗 × P2
Transportation cost of delivering jeans to Norad’s station 0
Handling cost charged by Norad 0
Total Costs of disposition decision B C𝑐 × Q𝑗 × P2
Table 6. List of Costs, Disposition Decision B
Sending used-jeans to Africa through Norad is the first try for MiN Boutique to contribute
something in social area, theoretically, MiN Boutique will probably benefit in the
following ways:
Having established a good relationship with local authorities (in Africa), they may
offer us some privileges.
Our competitiveness in African market has been enhanced through philanthropy.
When we enter that market, some specialized inputs like human resources may be
already available.
When we enter the market, local customers may have the demand on our products.
Good reputation will be a reward to our contributions.
38
5.3 Disposition Decision C: Remanufacturing in the UK – shoe
production
As illustrated in Figure 5, customers bring their unwanted jeans to MIN Boutique’s stores
in Molde. Jeans are collected and sorted there, and then are shipped to the factory in the
UK. Once the sandals are made, they will then be sent back to MIN Boutique for sale.
5.3.1 Environmental impact
As mentioned before, this year MIN Boutique intends to use some of the collected jeans as
raw material of a new type of shoes because they think this project is environmentally
friendly and it is a great way to do their bit for the environment. Fortunately, they have
found a company in the UK which is able to make their dream come true. The company,
Softwalker, says that the eco-sandals which are made of jeans in its plant have the lowest
carbon footprint among all recycled footwear all over the world (Softwalker Official
Website, 2011). Moreover, compared with normal shoes, these shoes save substantial on
processing chemicals during the manufacture.
5.3.2 Pricing strategies to support economic sustainability
So as to survive, MIN Boutique must ensure that this plan is economic sustainable in the
long run. That is to say, MIN Boutique needs to set a “fair” price for this new product that
can make profit at least. In this section, we are going to present several pricing methods to
support MiN Boutique’s objective. And the way to avoid pricing war generated by pricing
strategy will also be proposed.
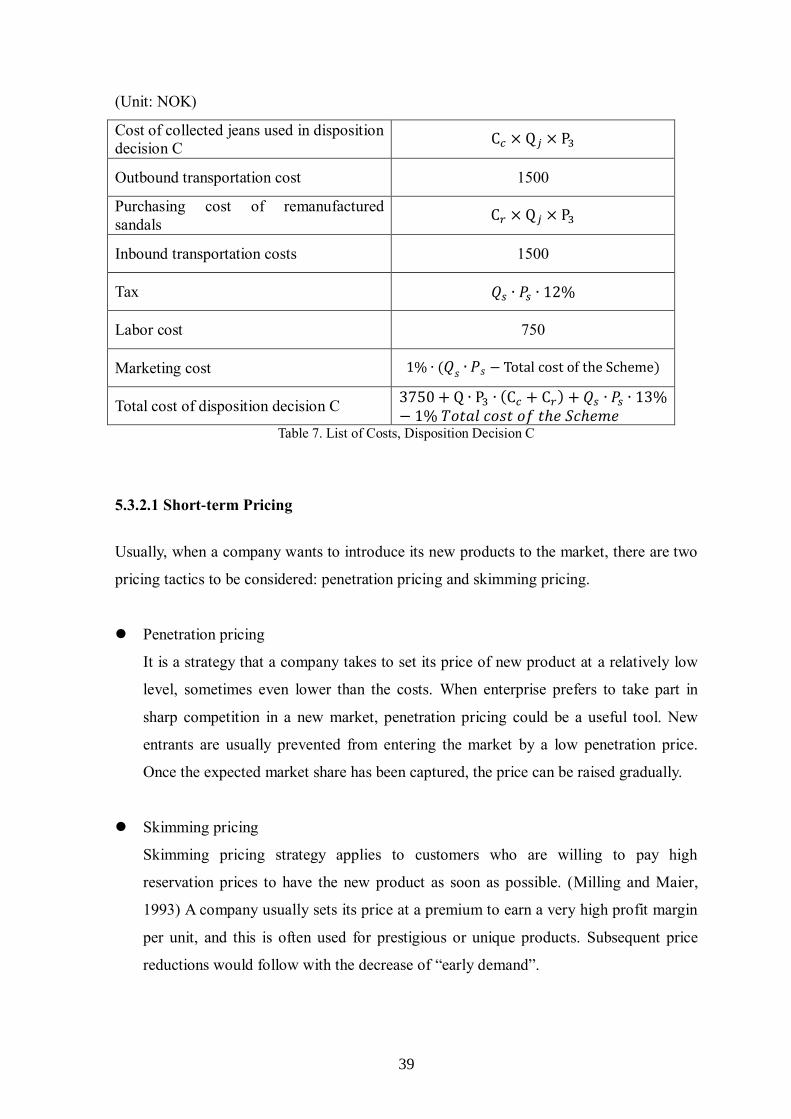
Table 7. indicates different costs in Disposition Decision C. Besides the costs of collected
jeans used to recycle and purchasing costs of remanufactured sandals (assume that one
jeans to recycle can get one pair of shoes back), outbound and inbound transportation
costs, labor cost and tax are included. In addition, MiN Boutique also takes marketing cost
into account. The company decided that 1% of profits from the scheme will be used to
cover the expenses of marketing.
39
(Unit: NOK)
Cost of collected jeans used in disposition
decision C C𝑐 × Q𝑗 × P3
Outbound transportation cost 1500
Purchasing cost of remanufactured
sandals C𝑟 × Q𝑗 × P3
Inbound transportation costs 1500
Tax 𝑄𝑠 ∙ 𝑃𝑠 ∙ 12%
Labor cost 750
Marketing cost 1% ∙ (𝑄𝑠 ∙ 𝑃𝑠 − Total cost of the Scheme)
Total cost of disposition decision C 3750 + Q ∙ P3 ∙ (C𝑐 + C𝑟) + 𝑄𝑠 ∙ 𝑃𝑠 ∙ 13%− 1% 𝑇𝑜𝑡𝑎𝑙 𝑐𝑜𝑠𝑡 𝑜𝑓 𝑡ℎ𝑒 𝑆𝑐ℎ𝑒𝑚𝑒
Table 7. List of Costs, Disposition Decision C
5.3.2.1 Short-term Pricing
Usually, when a company wants to introduce its new products to the market, there are two
pricing tactics to be considered: penetration pricing and skimming pricing.
Penetration pricing
It is a strategy that a company takes to set its price of new product at a relatively low
level, sometimes even lower than the costs. When enterprise prefers to take part in
sharp competition in a new market, penetration pricing could be a useful tool. New
entrants are usually prevented from entering the market by a low penetration price.
Once the expected market share has been captured, the price can be raised gradually.
Skimming pricing
Skimming pricing strategy applies to customers who are willing to pay high
reservation prices to have the new product as soon as possible. (Milling and Maier,
1993) A company usually sets its price at a premium to earn a very high profit margin
per unit, and this is often used for prestigious or unique products. Subsequent price
reductions would follow with the decrease of “early demand”.
40
To adopt which pricing strategy depends on the expectations of the company. Penetration
pricing results in a faster acceptance of a new product, but lower unit profits while
skimming pricing comes out higher unit profits but smaller initial sales volume (Pandey,
2007, pp.27). Because MiN Boutique wants to be the pioneer to the recycled products’
market and the recycled sandals are first sold in Molde, quick acceptance of them is rather
important. So we suggest a penetration pricing to apply.
Before we set the specific price for the product, we also need to know what the minimum
price is. John Sloman in his book Economics (pp.70, 2006) defines that “minimum price is
a price floor set by the government or some other agency. The price is not allowed to fall
below this level (although it is allowed to rise above it).” That is to say, the minimum price
is the lower bound of penetration price.
In our case, we also define a minimal unit price as the breakeven point of our company,
which equals to the unit costs of a sold item.
Minimal unit price unit costs total costs
expected sales volume
Note: We assume that there is no leftover inventory of sandals.
Based on minimal unit price, we can then set the price suited the pricing tactic we choose.
Note that price can be changed soon after that the company thinks it needs.
5.3.2.2 Long-run pricing
PED-based pricing:
After the sandal has been well introduced to the market, we then can change the price to
satisfy the company’s long-run target and/or to deal with latent competitors. As Nagel
(1987, pp.30) mentioned in his book “The strategy and tactics of pricing”, pricing decision
involves evaluating the consequence of a price change or a price difference. Price
Elasticity of Demand (PED) - a measure of the sensitivity of the quantity demanded of a
good to a change in its price, other things remaining the same - is usually negative since
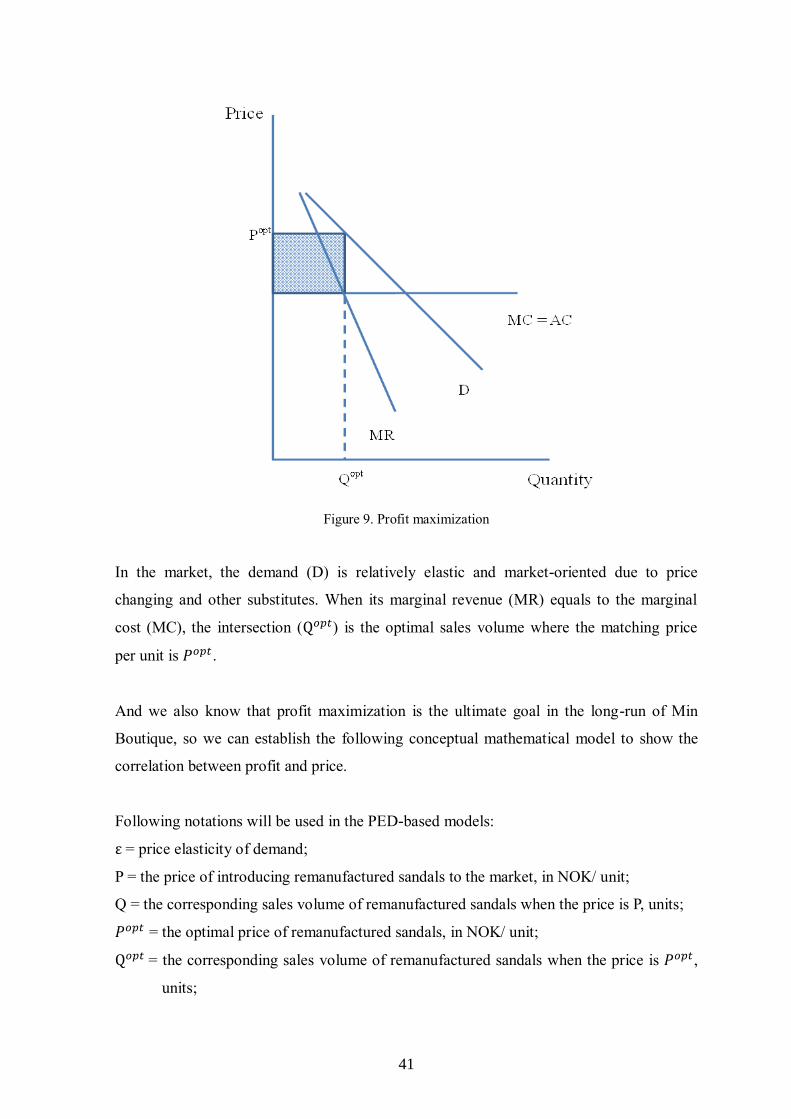
the demand increases along with the decrease of price. Figure 9. shows the change.
41
Figure 9. Profit maximization
In the market, the demand (D) is relatively elastic and market-oriented due to price
changing and other substitutes. When its marginal revenue (MR) equals to the marginal
cost (MC), the intersection (Q𝑜𝑝𝑡) is the optimal sales volume where the matching price
per unit is 𝑃𝑜𝑝𝑡.
And we also know that profit maximization is the ultimate goal in the long-run of Min
Boutique, so we can establish the following conceptual mathematical model to show the
correlation between profit and price.
Following notations will be used in the PED-based models:
ε = price elasticity of demand;
P = the price of introducing remanufactured sandals to the market, in NOK/ unit;
Q = the corresponding sales volume of remanufactured sandals when the price is P, units;
𝑃𝑜𝑝𝑡 = the optimal price of remanufactured sandals, in NOK/ unit;
Q𝑜𝑝𝑡 = the corresponding sales volume of remanufactured sandals when the price is 𝑃𝑜𝑝𝑡,
units;
42
π = the total profit of selling remanufactured sandals, NOK;
Vc = the unit variable cost of selling remanufactured sandals, in NOK/ unit;
Fc = the total fixed cost of selling remanufactured sandals, NOK.
ε
∆𝑄𝑄∆𝑃𝑃
Q𝑜𝑝𝑡 − 𝑄𝑄
𝑃𝑜𝑝𝑡 − 𝑃𝑃
(5.1)
ε ∙ (𝑃𝑜𝑝𝑡 − 𝑃)
𝑃 Q𝑜𝑝𝑡 −𝑄
𝑄
Q
𝑃∙ ε ∙ (𝑃𝑜𝑝𝑡 − 𝑃) Q𝑜𝑝𝑡 − 𝑄
Q
𝑃∙ ε ∙ (𝑃𝑜𝑝𝑡 − 𝑃) + 𝑄 Q𝑜𝑝𝑡 (5.2)
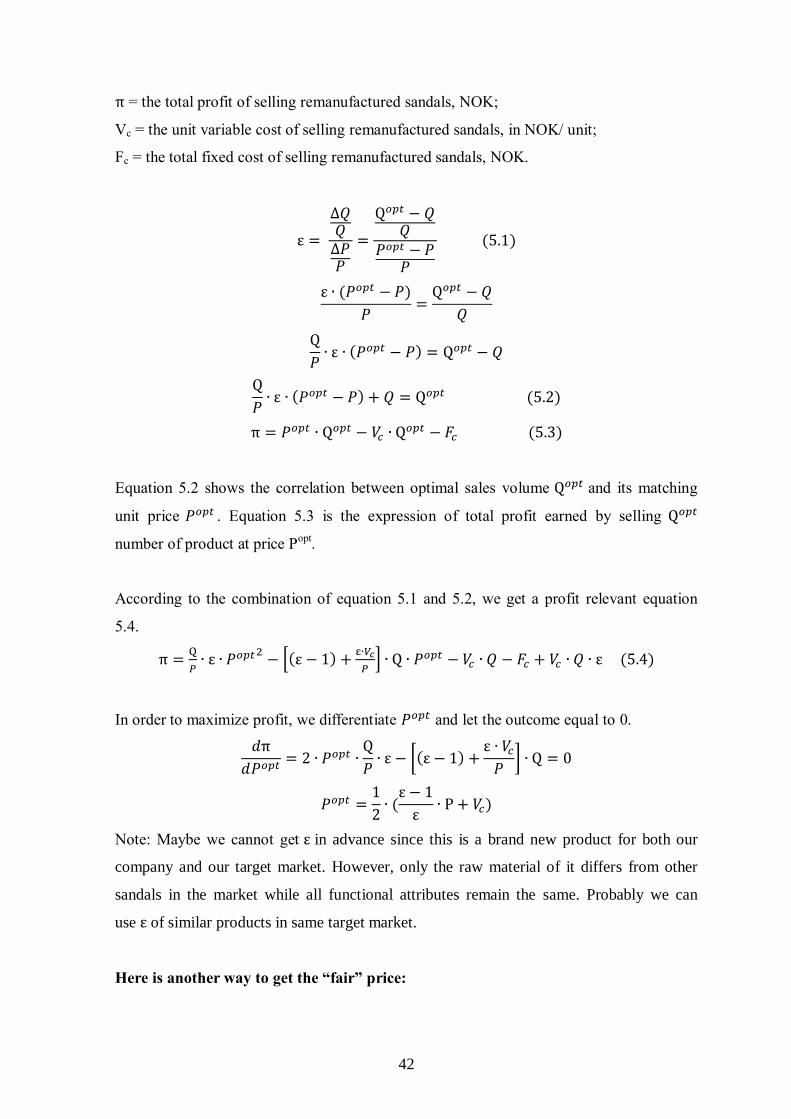
π 𝑃𝑜𝑝𝑡 ∙ Q𝑜𝑝𝑡 − 𝑉𝑐 ∙ Q𝑜𝑝𝑡 − 𝐹𝑐 (5.3)
Equation 5.2 shows the correlation between optimal sales volume Q𝑜𝑝𝑡 and its matching
unit price 𝑃𝑜𝑝𝑡 . Equation 5.3 is the expression of total profit earned by selling Q𝑜𝑝𝑡
number of product at price Popt
.
According to the combination of equation 5.1 and 5.2, we get a profit relevant equation
5.4.
π Q
𝑃∙ ε ∙ 𝑃𝑜𝑝𝑡
2− [(ε − 1) +
∙𝑉𝑐
𝑃] ∙ Q ∙ 𝑃𝑜𝑝𝑡 − 𝑉𝑐 ∙ 𝑄 − 𝐹𝑐 + 𝑉𝑐 ∙ 𝑄 ∙ ε (5.4)
In order to maximize profit, we differentiate 𝑃𝑜𝑝𝑡 and let the outcome equal to 0.
𝑑π
𝑑𝑃𝑜𝑝𝑡 2 ∙ 𝑃𝑜𝑝𝑡 ∙
Q
𝑃∙ ε − [(ε − 1) +
ε ∙ 𝑉𝑐𝑃] ∙ Q 0
𝑃𝑜𝑝𝑡 1
2∙ (ε − 1
ε∙ P + 𝑉𝑐)
Note: Maybe we cannot get ε in advance since this is a brand new product for both our
company and our target market. However, only the raw material of it differs from other
sandals in the market while all functional attributes remain the same. Probably we can
use ε of similar products in same target market.
Here is another way to get the “fair” price:
43
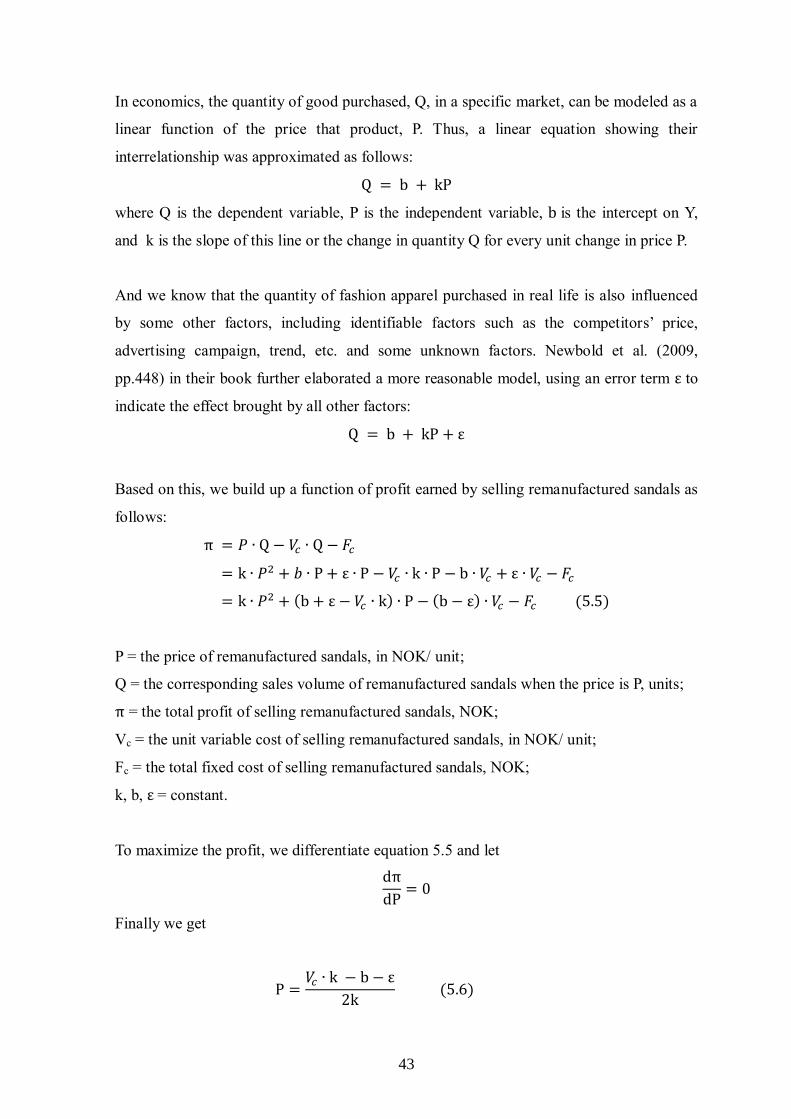
In economics, the quantity of good purchased, Q, in a specific market, can be modeled as a
linear function of the price that product, P. Thus, a linear equation showing their
interrelationship was approximated as follows:
Q b + kP
where Q is the dependent variable, P is the independent variable, b is the intercept on Y,
and k is the slope of this line or the change in quantity Q for every unit change in price P.
And we know that the quantity of fashion apparel purchased in real life is also influenced
by some other factors, including identifiable factors such as the competitors’ price,
advertising campaign, trend, etc. and some unknown factors. Newbold et al. (2009,
pp.448) in their book further elaborated a more reasonable model, using an error term ε to
indicate the effect brought by all other factors:
Q b + kP + ε
Based on this, we build up a function of profit earned by selling remanufactured sandals as
follows:
π 𝑃 ∙ Q − 𝑉𝑐 ∙ Q − 𝐹𝑐
k ∙ 𝑃2 + 𝑏 ∙ P + ε ∙ P − 𝑉𝑐 ∙ k ∙ P − b ∙ 𝑉𝑐 + ε ∙ 𝑉𝑐 − 𝐹𝑐
k ∙ 𝑃2 + (b + ε − 𝑉𝑐 ∙ k) ∙ P − (b − ε) ∙ 𝑉𝑐 − 𝐹𝑐 (5.5)
P = the price of remanufactured sandals, in NOK/ unit;
Q = the corresponding sales volume of remanufactured sandals when the price is P, units;
π = the total profit of selling remanufactured sandals, NOK;
Vc = the unit variable cost of selling remanufactured sandals, in NOK/ unit;
Fc = the total fixed cost of selling remanufactured sandals, NOK;
k, b, ε = constant.
To maximize the profit, we differentiate equation 5.5 and let
dπ
dP 0
Finally we get
P 𝑉𝑐 ∙ k − b − ε
2k (5.6)
44
And after we get enough data (usually the data sample size is no smaller than 50) of price
P and sales volume Q, we can do a regression to get k and b and ε by using SPSS.
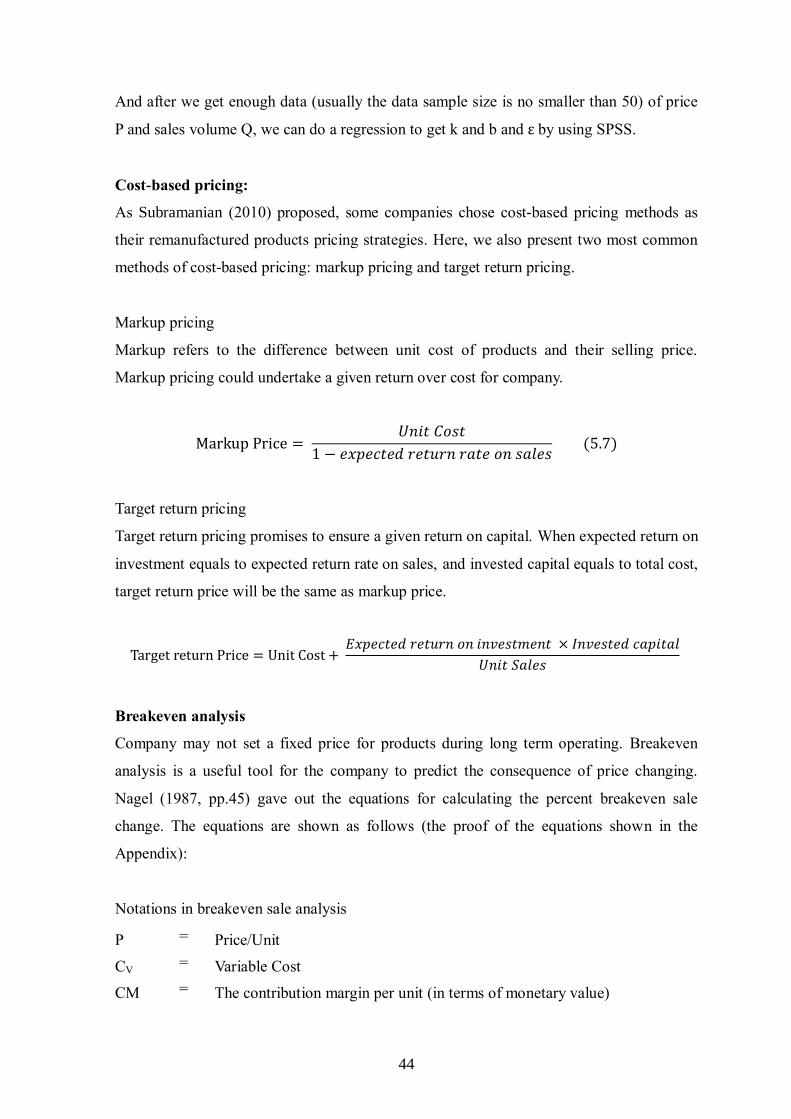
Cost-based pricing:
As Subramanian (2010) proposed, some companies chose cost-based pricing methods as
their remanufactured products pricing strategies. Here, we also present two most common
methods of cost-based pricing: markup pricing and target return pricing.
Markup pricing
Markup refers to the difference between unit cost of products and their selling price.
Markup pricing could undertake a given return over cost for company.
Markup Price 𝑈𝑛𝑖𝑡 𝐶𝑜𝑠𝑡
1 − 𝑒𝑥𝑝𝑒𝑐𝑡𝑒𝑑 𝑟𝑒𝑡𝑢𝑟𝑛 𝑟𝑎𝑡𝑒 𝑜𝑛 𝑠𝑎𝑙𝑒𝑠 (5.7)
Target return pricing
Target return pricing promises to ensure a given return on capital. When expected return on
investment equals to expected return rate on sales, and invested capital equals to total cost,
target return price will be the same as markup price.
Target return Price Unit Cost + 𝐸𝑥𝑝𝑒𝑐𝑡𝑒𝑑 𝑟𝑒𝑡𝑢𝑟𝑛 𝑜𝑛 𝑖𝑛𝑣𝑒𝑠𝑡𝑚𝑒𝑛𝑡 × 𝐼𝑛𝑣𝑒𝑠𝑡𝑒𝑑 𝑐𝑎𝑝𝑖𝑡𝑎𝑙
𝑈𝑛𝑖𝑡 𝑆𝑎𝑙𝑒𝑠
Breakeven analysis
Company may not set a fixed price for products during long term operating. Breakeven
analysis is a useful tool for the company to predict the consequence of price changing.
Nagel (1987, pp.45) gave out the equations for calculating the percent breakeven sale
change. The equations are shown as follows (the proof of the equations shown in the
Appendix):
Notations in breakeven sale analysis
P = Price/Unit
CV = Variable Cost
CM = The contribution margin per unit (in terms of monetary value)
45
△P% = Percentage of price change
CM P − C𝑉
CM% CM
P
Breakeven sales change% − △ P%
𝐶𝑀%+△ P%× 100%
Unit Breakeven sales change Breakeven sales change% × 𝑆𝑎𝑙𝑒𝑠
Assuming that the company is considering a △P% price cut which the company believes
would increase its sales, the final results got from the equations shows that only if the sales
would increase by more than Breakeven sales change%, or Unit Breakeven sales change,
the company could keep its profits in current level.
5.3.2.3 Competitors’ reaction
To determine long-term pricing strategy, the company should also take consumers’ and
competitors’ responses into consideration. After appropriate pricing strategy has been
decided, competitors will react to the consequences incurred by the pricing strategy. Both
the company and the competitors may take part in the price competition. When the
competition becomes cut-throat, both of them will be trapped into “lose-lose” situation. To
prevent the company from destructive price competition, the following principles could be
implementing (Dunne, 1998):
Choose your game.
Not every competitive game is proper, worthy and compulsory to enter for. To avoid
price war, company’s decision maker should come up with pricing strategies which
could reduce competitors’ aggression on price.
Understand each player’s role.
The company should distinguish who is the current rival and who is the potential
competitor and care about both of them.
Understand what strategies are available to the competitors.
46
The company should attempt to find out its competitors’ weaknesses and take
appropriate tactics to defeat them.
Understand what information is available.
Cut-throat price competitions usually begin with one’s misunderstanding of others’
intentions (Dunne, 1998). In order to predict competitors’ reactions, a company needs
to know what information about itself is reachable for them.
Learn the competitors’ payoffs.
To understand what will the competitors gain or lose in the game is also important.
Understand what drives your competitors’ behaviour.
So as to early prepare for the rival’s movement, one needs to examine what incentives
they have and how they responded to past strategic changes.
Provide incentives for co-operation and penalties for defection.
It is critical to clearly show your competitors your intentions to achieve a “win-win”
situation.
Cooperative pricing means that the company makes price changes cooperatively with its
competitors (Nagel, 1981, pp. 86). No matter how price changes, the price set by each
company in the market should keep in the same level in such strategy. In opportunistic
pricing strategy, in order to increase company’s market share, the company postpones
relevant reactions when its competitors raise price. But when the competitors lower the
price, under such pricing strategy, the company should take the reaction immediately to
seize the expanded market which is created by the price cut (Nagel, 1981, pp. 89).
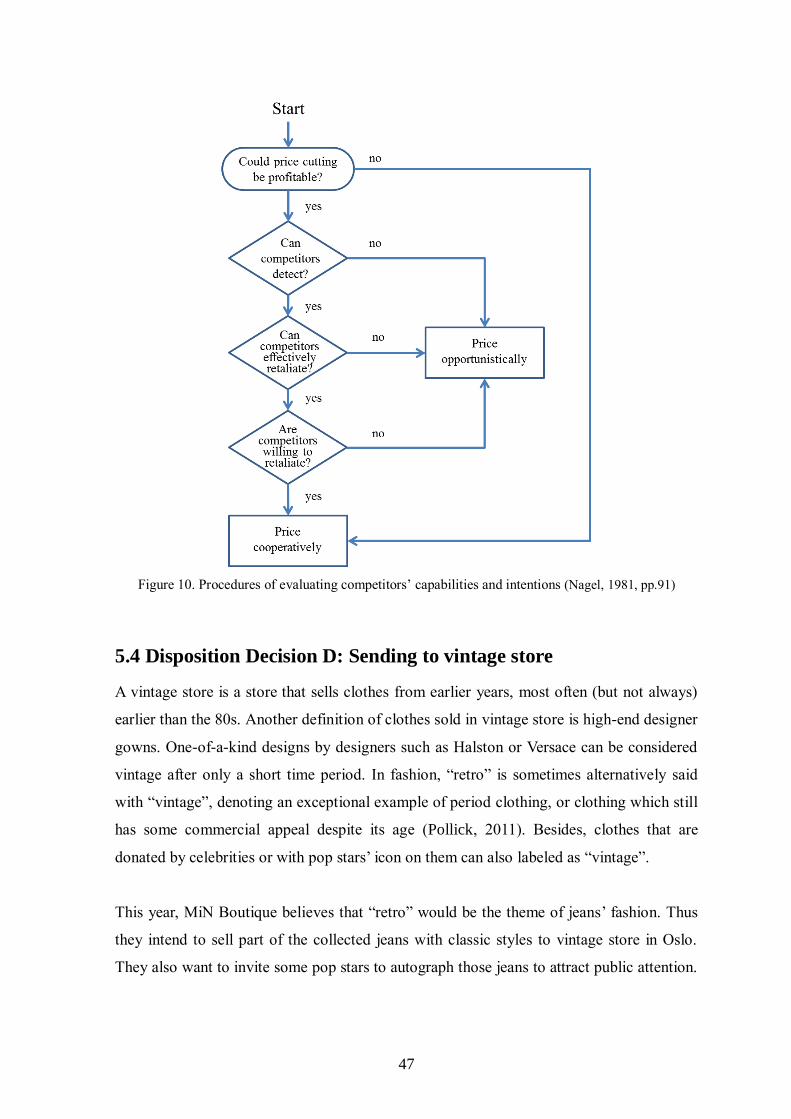
Nagel (1981, pp. 91) recommend a series of evaluating process to avoid “lose-lose”
dilemma. The steps of evaluations start from company’s self-evaluation, through
recognizing competitor’s abilities and willingness to identify the company’s pricing
strategy. Figure 10. demonstrates the evaluation procedure which leads to either
cooperative or opportunistic pricing.
47
Figure 10. Procedures of evaluating competitors’ capabilities and intentions (Nagel, 1981, pp.91)
5.4 Disposition Decision D: Sending to vintage store
A vintage store is a store that sells clothes from earlier years, most often (but not always)
earlier than the 80s. Another definition of clothes sold in vintage store is high-end designer
gowns. One-of-a-kind designs by designers such as Halston or Versace can be considered
vintage after only a short time period. In fashion, “retro” is sometimes alternatively said
with “vintage”, denoting an exceptional example of period clothing, or clothing which still
has some commercial appeal despite its age (Pollick, 2011). Besides, clothes that are
donated by celebrities or with pop stars’ icon on them can also labeled as “vintage”.
This year, MiN Boutique believes that “retro” would be the theme of jeans’ fashion. Thus
they intend to sell part of the collected jeans with classic styles to vintage store in Oslo.
They also want to invite some pop stars to autograph those jeans to attract public attention.
48
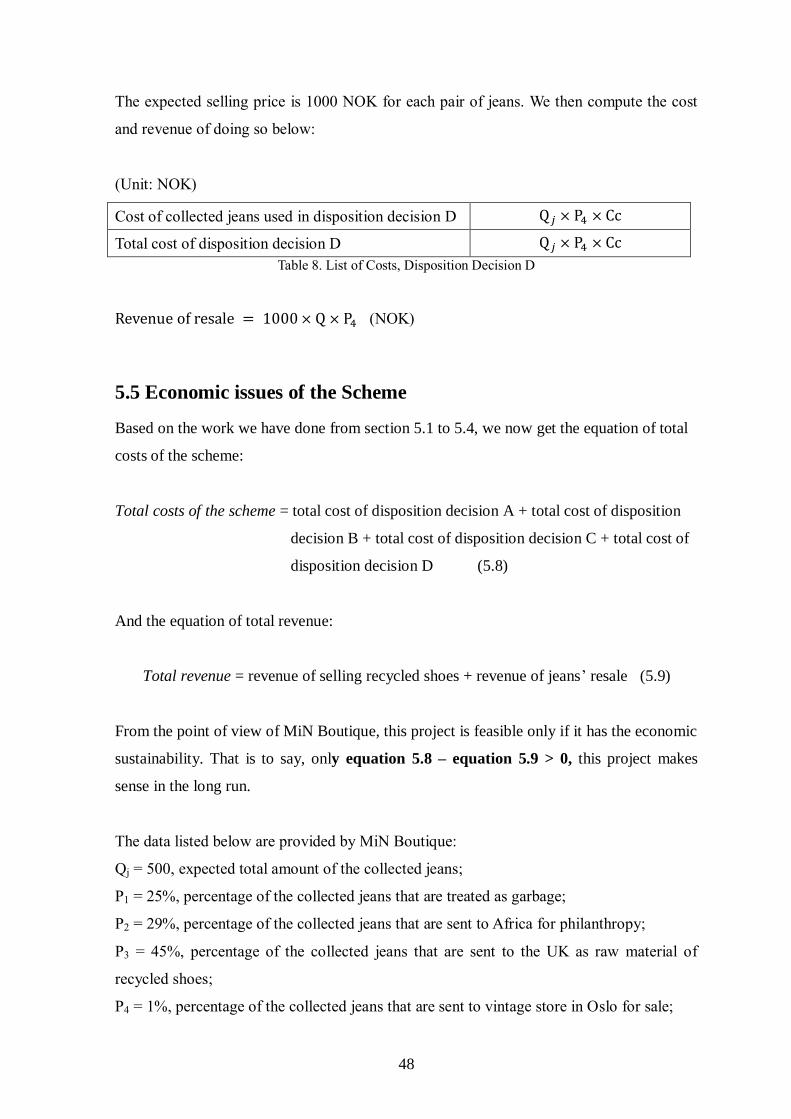
The expected selling price is 1000 NOK for each pair of jeans. We then compute the cost
and revenue of doing so below:
(Unit: NOK)
Cost of collected jeans used in disposition decision D Q𝑗 × P4 × Cc
Total cost of disposition decision D Q𝑗 × P4 × Cc
Table 8. List of Costs, Disposition Decision D
Revenue of resale 1000× Q × P4 (NOK)
5.5 Economic issues of the Scheme
Based on the work we have done from section 5.1 to 5.4, we now get the equation of total
costs of the scheme:
Total costs of the scheme = total cost of disposition decision A + total cost of disposition
decision B + total cost of disposition decision C + total cost of
disposition decision D (5.8)
And the equation of total revenue:
Total revenue = revenue of selling recycled shoes + revenue of jeans’ resale (5.9)
From the point of view of MiN Boutique, this project is feasible only if it has the economic
sustainability. That is to say, only equation 5.8 – equation 5.9 > 0, this project makes
sense in the long run.
The data listed below are provided by MiN Boutique:
Qj = 500, expected total amount of the collected jeans;
P1 = 25%, percentage of the collected jeans that are treated as garbage;
P2 = 29%, percentage of the collected jeans that are sent to Africa for philanthropy;
P3 = 45%, percentage of the collected jeans that are sent to the UK as raw material of
recycled shoes;
P4 = 1%, percentage of the collected jeans that are sent to vintage store in Oslo for sale;
49
Cc = 50 NOK, price of the coupon used in jean’s collection stage;
Cg = 1.472 NOK, unit disposal cost of the collected jeans that are treated as garbage;
Cr = 200 NOK/Pair, unit cost of remanufactured sandal.
Total Cost of Disposition decision A Q𝑗 ∙ P1 ∙ (C𝑐 + C𝑔)
500 × 25%× (50 + 1.472) 6434 𝑁𝑂𝐾
Total Cost of Disposition decision B Q𝑗 × P2 × C𝑐
500 × 29%× 50 7250 𝑁𝑂𝐾
Total Cost of Disposition decision C
3750+Q ∙ P3 ∙ (C𝑐 +C𝑟)+ 13% ∙ 𝑄𝑠 ∙ 𝑃𝑠 −1%
∙ 𝑇𝑜𝑡𝑎𝑙 𝑐𝑜𝑠𝑡 𝑜𝑓 𝑡ℎ𝑒 𝑆𝑐ℎ𝑒𝑚𝑒
3750 + 500 × 45% × (50 + 200) + 13% ∙ 𝑄𝑠 ∙ 𝑃𝑠 − 1%
∙ 𝑇𝑜𝑡𝑎𝑙 𝑐𝑜𝑠𝑡 𝑜𝑓 𝑡ℎ𝑒 𝑆𝑐ℎ𝑒𝑚𝑒
60000 + 13% ∙ 𝑄𝑠 ∙ 𝑃𝑠 − 1% ∙ 𝑇𝑜𝑡𝑎𝑙 𝑐𝑜𝑠𝑡 𝑜𝑓 𝑡ℎ𝑒 𝑆𝑐ℎ𝑒𝑚𝑒
Total Cost of Disposition decision D Q𝑗 × P4 × 𝐶𝑐 500 × 1%× 50 250 𝑁𝑂𝐾
Now we plus all four disposition decisions’ cost together, get,
Total Cost of the Scheme 73934+ 13% ∙ 𝑄𝑠 ∙ 𝑃𝑠
1.01
Pricing
Among the all four decisions the company takes, Disposition Decision C is the one which
could give the company most positive economic impact. As MiN Boutique required, sales
amount of all remanufactured sandals should cover all costs in the scheme. In other words,
all cost should be averagely apportioned to each pair of shoes sold. We denote Pb and Qb as
the breakeven price of each pair sold and breakeven sales of the sandals respectively.
When Qb = Qs and the company is selling the sandals in price Pb, the sandals’ sales amount
equals to total costs of the scheme, then we get the equation below.
50
Total Cost of the Scheme 73934 + 13% ∙ 𝑄 ∙ 𝑃𝑠
1.01 𝑄 ∙ 𝑃
𝑃 73934+ 13% ∙ 𝑃𝑠 ∙ 𝑄
1.01 × 𝑄
As expected return rate on sales for MiN Boutique is 50%, we are going to apply markup
pricing to calculate the selling price of remanufactured sandals. We apply equation 5.7, let
Ps = Markup price, and Pb = Unit Cost, then get,
𝑃 73934 + 13% ∙ 𝑃𝑠 ∙ 𝑄
1.01 × 𝑄 𝑃𝑠 × (1 − 50%) (5.10)
The company also anticipates that the sandals purchased from the UK are sold out in the
scheme, so𝑄 𝑄𝑗 × 𝑃3 225,
𝑃 73934 + 13% ∙ 𝑃𝑠 ∙ 225
1.01 × 225 𝑃𝑠 × (1 − 50%)
Solving this equation, then get
𝑃𝑠 591472
675 876 𝑁𝑂𝐾
If the unit price of remanufactured sandal is 876 NOK, and after all the sandals are sold
out, MiN boutique will meet its anticipation.
Put Ps into equation 5.10, we get
𝑃 295736
675 438 𝑁𝑂𝐾
This means that if selling price of each remanufactured sandal is 438 NOK, and after all
the sandals are sold out, MiN boutique could keep breakeven of implementing the scheme.
As we suggested before, penetration pricing is our short-term pricing strategy when
introducing the sandals to the market. Current prices of similar products from competitors
range from 699 NOK to 1100 NOK. To efficiently enter the market, we suggest MiN
Boutique price its sandals at between 438 NOK and 699 NOK in the introduction stage. In
this way our price will be very competitive and can also maintain some profitability. In
MiN Boutique’s plan, at most 5% of the remanufactured sandals could be recognized as
give away. That means Qs will be smaller than 225. To pursue the expected total profits,
51
MiN Boutique needs to change the sandals price in long term.
We denote Pn and Qn as new price and sales volume of the sandals respectively in the
company’s long term running. And for easy calculation, we further assume that MiN
Boutique does not gain or lose in money during short run when applying penetration
pricing strategy. Since the company’s expected return rate of the scheme does not change,
50% still, then we get,
𝑃 ∙ 𝑄 − Total Cost of the Scheme 𝑃 ∙ 𝑄 −73934 + 13% ∙ 𝑃 ∙ 𝑄
1.01 𝑃 ∙ 𝑄 ∙ 50%
To simplify the equation above, we get,
𝑄 73934
0.375 × 𝑃 (5.11)
As equation 5.11 indicates, relationship between Qn and Pn is inverse, which means
decreasing in Qn will result in Pn’s increasing. To maintain the total profits of the scheme
in the company’s expected level, 876 will be the lower bound of the price interval in the
long term. And in order to keep the price of the sandals fluctuating in the normal range, the
upper bound of the Pn could not be greater than 1100 NOK. By using excel, we calculated
corresponding Qn to each Pn from 876 to 1100. Detailed results are shown in the appendix
D. We note that setting price around 920 NOK can 100% ensure MiN Boutique a 50%
profit.
52
6. Conclusions
From the research on the case, we have following findings:
1. Collecting jeans that are to be disposed of from households, we could not only increase
the recovery rate of textile waste but are very friendly to the environment.
2. On the surface, philanthropy may not bring direct economic benefits to MiN Boutique.
However, benefits like enhanced competitiveness, fame and reputation derived from
charitable donations can help us attract more potential buyers. Thus if we factor this
into account, doing philanthropy, will, on the whole, contribute to MiN Boutique's
success.
3. Based on our assumptions and the data from our case company, the results presented in
section 5.5 indicate that MiN Boutique could realize its economic expectation if it is to
price the remanufactured sandal within the range of 915 NOK and 923 NOK.
We hope that what we have done in this thesis could to some extent help MiN Boutique in
practice. And we would be more than happy if our conclusion is useful to any further
research. Because MiN Boutique intends to act as an intermediary between
remanufacturers and retailers in the future through propagating its “recycling” idea, we
suggest a further research on as an agency, how to price varied products in consideration
of retailers’ reaction.
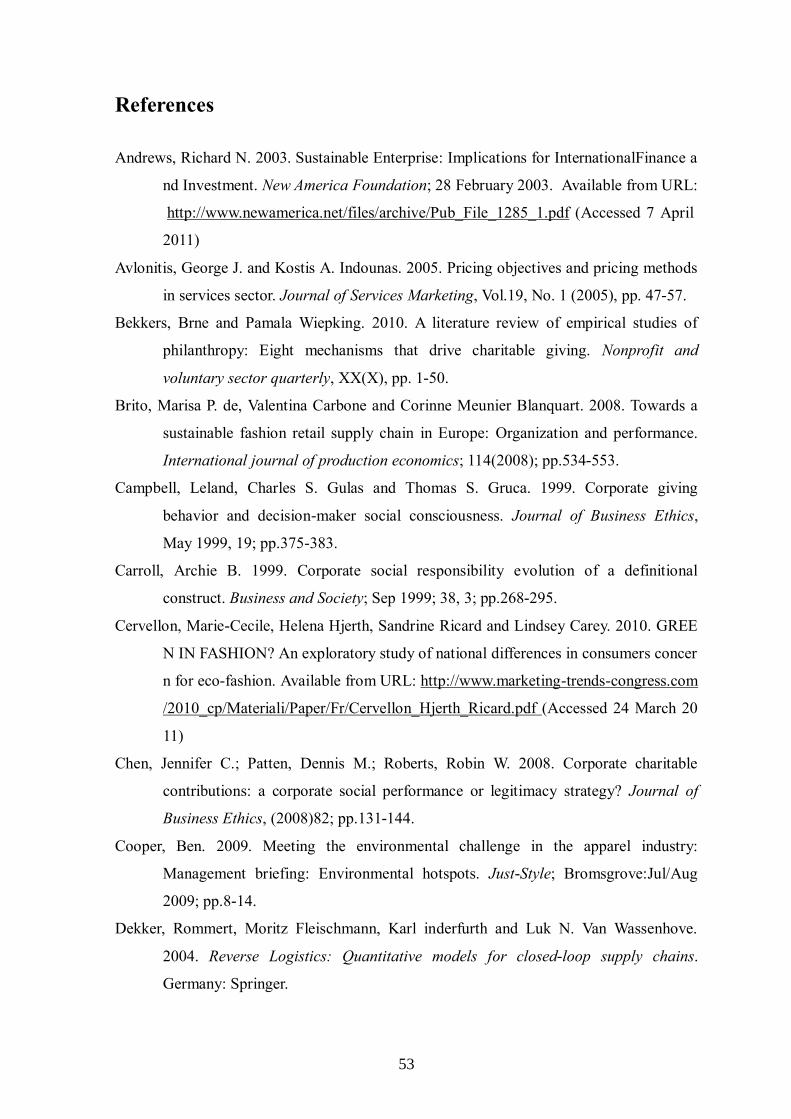
53
References
Andrews, Richard N. 2003. Sustainable Enterprise: Implications for InternationalFinance a
nd Investment. New America Foundation; 28 February 2003. Available from URL:
http://www.newamerica.net/files/archive/Pub_File_1285_1.pdf (Accessed 7 April
2011)
Avlonitis, George J. and Kostis A. Indounas. 2005. Pricing objectives and pricing methods
in services sector. Journal of Services Marketing, Vol.19, No. 1 (2005), pp. 47-57.
Bekkers, Brne and Pamala Wiepking. 2010. A literature review of empirical studies of
philanthropy: Eight mechanisms that drive charitable giving. Nonprofit and
voluntary sector quarterly, XX(X), pp. 1-50.
Brito, Marisa P. de, Valentina Carbone and Corinne Meunier Blanquart. 2008. Towards a
sustainable fashion retail supply chain in Europe: Organization and performance.
International journal of production economics; 114(2008); pp.534-553.
Campbell, Leland, Charles S. Gulas and Thomas S. Gruca. 1999. Corporate giving
behavior and decision-maker social consciousness. Journal of Business Ethics,
May 1999, 19; pp.375-383.
Carroll, Archie B. 1999. Corporate social responsibility evolution of a definitional
construct. Business and Society; Sep 1999; 38, 3; pp.268-295.
Cervellon, Marie-Cecile, Helena Hjerth, Sandrine Ricard and Lindsey Carey. 2010. GREE
N IN FASHION? An exploratory study of national differences in consumers concer
n for eco-fashion. Available from URL: http://www.marketing-trends-congress.com
/2010_cp/Materiali/Paper/Fr/Cervellon_Hjerth_Ricard.pdf (Accessed 24 March 20
11)
Chen, Jennifer C.; Patten, Dennis M.; Roberts, Robin W. 2008. Corporate charitable
contributions: a corporate social performance or legitimacy strategy? Journal of
Business Ethics, (2008)82; pp.131-144.
Cooper, Ben. 2009. Meeting the environmental challenge in the apparel industry:
Management briefing: Environmental hotspots. Just-Style; Bromsgrove:Jul/Aug
2009; pp.8-14.
Dekker, Rommert, Moritz Fleischmann, Karl inderfurth and Luk N. Van Wassenhove.
2004. Reverse Logistics: Quantitative models for closed-loop supply chains.
Germany: Springer.
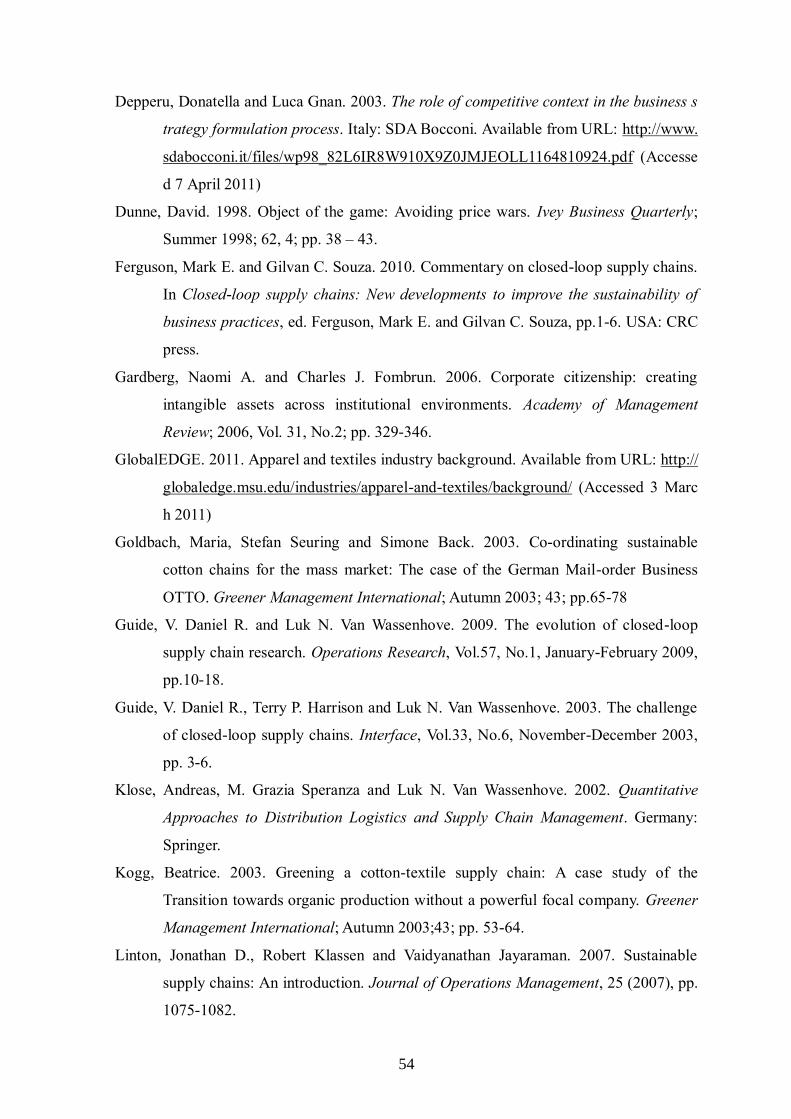
54
Depperu, Donatella and Luca Gnan. 2003. The role of competitive context in the business s
trategy formulation process. Italy: SDA Bocconi. Available from URL: http://www.
sdabocconi.it/files/wp98_82L6IR8W910X9Z0JMJEOLL1164810924.pdf (Accesse
d 7 April 2011)
Dunne, David. 1998. Object of the game: Avoiding price wars. Ivey Business Quarterly;
Summer 1998; 62, 4; pp. 38 – 43.
Ferguson, Mark E. and Gilvan C. Souza. 2010. Commentary on closed-loop supply chains.
In Closed-loop supply chains: New developments to improve the sustainability of
business practices, ed. Ferguson, Mark E. and Gilvan C. Souza, pp.1-6. USA: CRC
press.
Gardberg, Naomi A. and Charles J. Fombrun. 2006. Corporate citizenship: creating
intangible assets across institutional environments. Academy of Management
Review; 2006, Vol. 31, No.2; pp. 329-346.
GlobalEDGE. 2011. Apparel and textiles industry background. Available from URL: http://
globaledge.msu.edu/industries/apparel-and-textiles/background/ (Accessed 3 Marc
h 2011)
Goldbach, Maria, Stefan Seuring and Simone Back. 2003. Co-ordinating sustainable
cotton chains for the mass market: The case of the German Mail-order Business
OTTO. Greener Management International; Autumn 2003; 43; pp.65-78
Guide, V. Daniel R. and Luk N. Van Wassenhove. 2009. The evolution of closed-loop
supply chain research. Operations Research, Vol.57, No.1, January-February 2009,
pp.10-18.
Guide, V. Daniel R., Terry P. Harrison and Luk N. Van Wassenhove. 2003. The challenge
of closed-loop supply chains. Interface, Vol.33, No.6, November-December 2003,
pp. 3-6.
Klose, Andreas, M. Grazia Speranza and Luk N. Van Wassenhove. 2002. Quantitative
Approaches to Distribution Logistics and Supply Chain Management. Germany:
Springer.
Kogg, Beatrice. 2003. Greening a cotton-textile supply chain: A case study of the
Transition towards organic production without a powerful focal company. Greener
Management International; Autumn 2003;43; pp. 53-64.
Linton, Jonathan D., Robert Klassen and Vaidyanathan Jayaraman. 2007. Sustainable
supply chains: An introduction. Journal of Operations Management, 25 (2007), pp.
1075-1082.
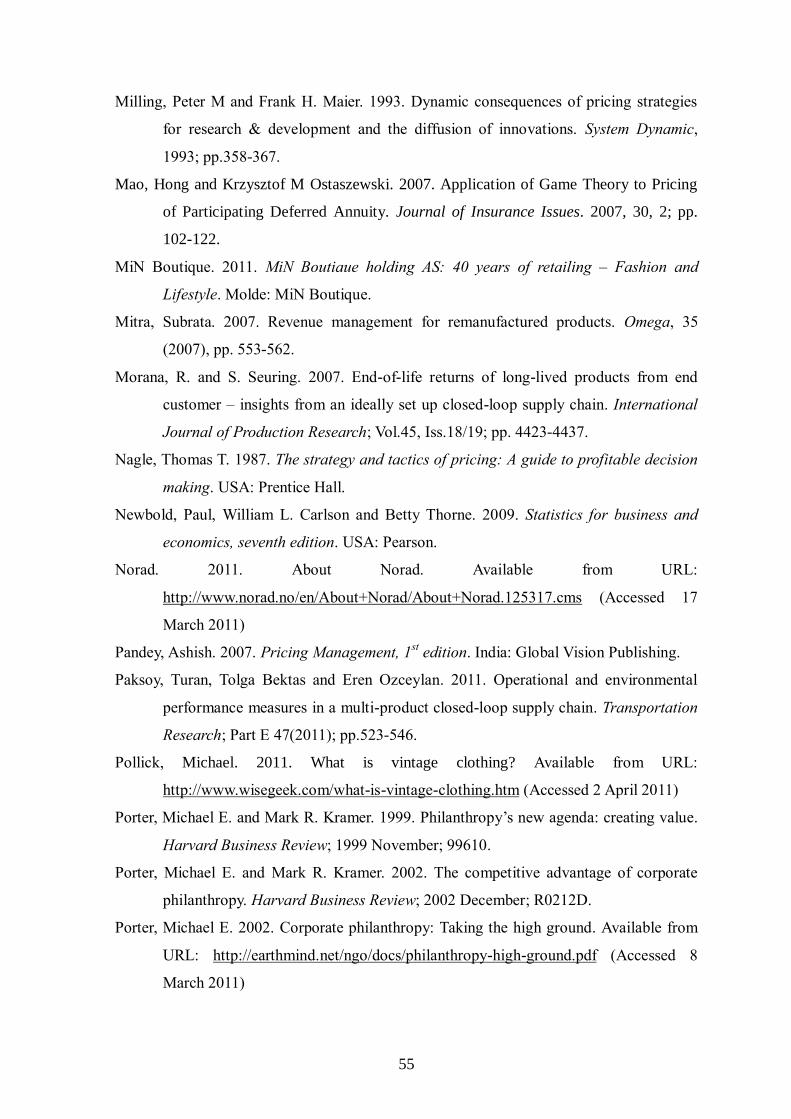
55
Milling, Peter M and Frank H. Maier. 1993. Dynamic consequences of pricing strategies
for research & development and the diffusion of innovations. System Dynamic,
1993; pp.358-367.
Mao, Hong and Krzysztof M Ostaszewski. 2007. Application of Game Theory to Pricing
of Participating Deferred Annuity. Journal of Insurance Issues. 2007, 30, 2; pp.
102-122.
MiN Boutique. 2011. MiN Boutiaue holding AS: 40 years of retailing – Fashion and
Lifestyle. Molde: MiN Boutique.
Mitra, Subrata. 2007. Revenue management for remanufactured products. Omega, 35
(2007), pp. 553-562.
Morana, R. and S. Seuring. 2007. End-of-life returns of long-lived products from end
customer – insights from an ideally set up closed-loop supply chain. International
Journal of Production Research; Vol.45, Iss.18/19; pp. 4423-4437.
Nagle, Thomas T. 1987. The strategy and tactics of pricing: A guide to profitable decision
making. USA: Prentice Hall.
Newbold, Paul, William L. Carlson and Betty Thorne. 2009. Statistics for business and
economics, seventh edition. USA: Pearson.
Norad. 2011. About Norad. Available from URL:
http://www.norad.no/en/About+Norad/About+Norad.125317.cms (Accessed 17
March 2011)
Pandey, Ashish. 2007. Pricing Management, 1st edition. India: Global Vision Publishing.
Paksoy, Turan, Tolga Bektas and Eren Ozceylan. 2011. Operational and environmental
performance measures in a multi-product closed-loop supply chain. Transportation
Research; Part E 47(2011); pp.523-546.
Pollick, Michael. 2011. What is vintage clothing? Available from URL:
http://www.wisegeek.com/what-is-vintage-clothing.htm (Accessed 2 April 2011)
Porter, Michael E. and Mark R. Kramer. 1999. Philanthropy’s new agenda: creating value.
Harvard Business Review; 1999 November; 99610.
Porter, Michael E. and Mark R. Kramer. 2002. The competitive advantage of corporate
philanthropy. Harvard Business Review; 2002 December; R0212D.
Porter, Michael E. 2002. Corporate philanthropy: Taking the high ground. Available from
URL: http://earthmind.net/ngo/docs/philanthropy-high-ground.pdf (Accessed 8
March 2011)
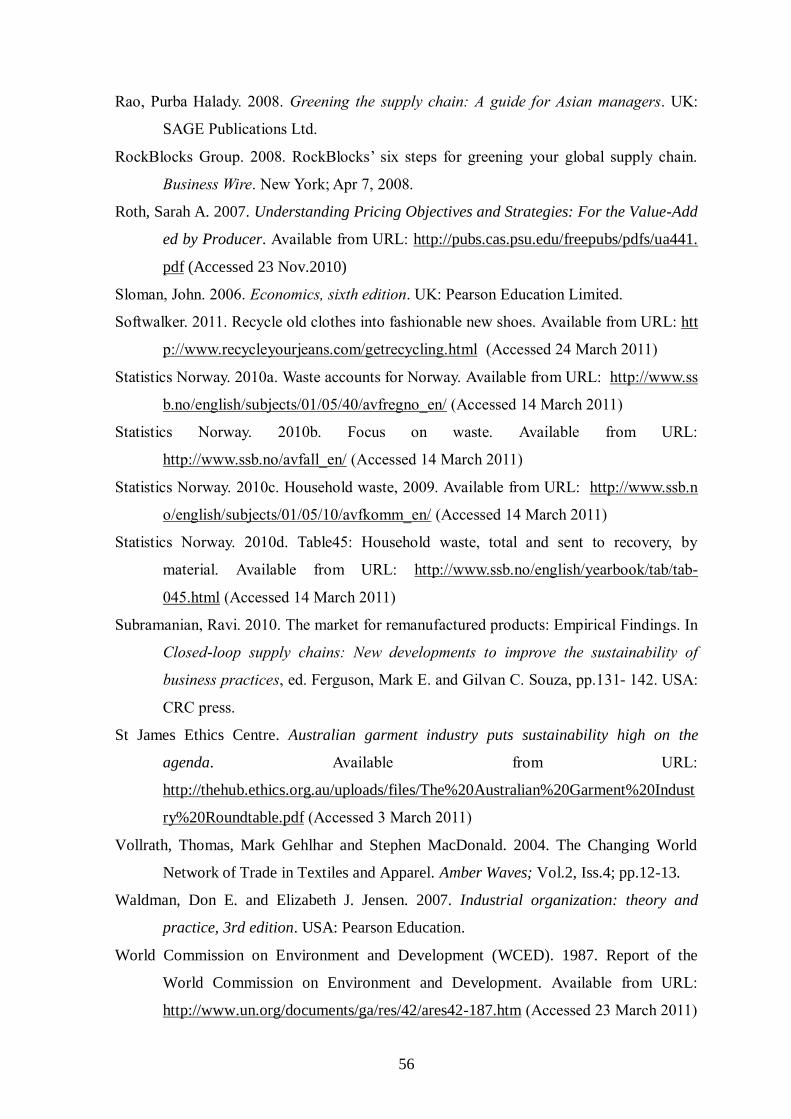
56
Rao, Purba Halady. 2008. Greening the supply chain: A guide for Asian managers. UK:
SAGE Publications Ltd.
RockBlocks Group. 2008. RockBlocks’ six steps for greening your global supply chain.
Business Wire. New York; Apr 7, 2008.
Roth, Sarah A. 2007. Understanding Pricing Objectives and Strategies: For the Value-Add
ed by Producer. Available from URL: http://pubs.cas.psu.edu/freepubs/pdfs/ua441.
pdf (Accessed 23 Nov.2010)
Sloman, John. 2006. Economics, sixth edition. UK: Pearson Education Limited.
Softwalker. 2011. Recycle old clothes into fashionable new shoes. Available from URL: htt
p://www.recycleyourjeans.com/getrecycling.html (Accessed 24 March 2011)
Statistics Norway. 2010a. Waste accounts for Norway. Available from URL: http://www.ss
b.no/english/subjects/01/05/40/avfregno_en/ (Accessed 14 March 2011)
Statistics Norway. 2010b. Focus on waste. Available from URL:
http://www.ssb.no/avfall_en/ (Accessed 14 March 2011)
Statistics Norway. 2010c. Household waste, 2009. Available from URL: http://www.ssb.n
o/english/subjects/01/05/10/avfkomm_en/ (Accessed 14 March 2011)
Statistics Norway. 2010d. Table45: Household waste, total and sent to recovery, by
material. Available from URL: http://www.ssb.no/english/yearbook/tab/tab-
045.html (Accessed 14 March 2011)
Subramanian, Ravi. 2010. The market for remanufactured products: Empirical Findings. In
Closed-loop supply chains: New developments to improve the sustainability of
business practices, ed. Ferguson, Mark E. and Gilvan C. Souza, pp.131- 142. USA:
CRC press.
St James Ethics Centre. Australian garment industry puts sustainability high on the
agenda. Available from URL:
http://thehub.ethics.org.au/uploads/files/The%20Australian%20Garment%20Indust
ry%20Roundtable.pdf (Accessed 3 March 2011)
Vollrath, Thomas, Mark Gehlhar and Stephen MacDonald. 2004. The Changing World
Network of Trade in Textiles and Apparel. Amber Waves; Vol.2, Iss.4; pp.12-13.
Waldman, Don E. and Elizabeth J. Jensen. 2007. Industrial organization: theory and
practice, 3rd edition. USA: Pearson Education.
World Commission on Environment and Development (WCED). 1987. Report of the
World Commission on Environment and Development. Available from URL:
http://www.un.org/documents/ga/res/42/ares42-187.htm (Accessed 23 March 2011)

57
Young, Carol, Charlotte Jirousek and Susan Ashdown. 2004. Undesigned: A Study in
Sustainable Design of Apparel Using Post-Consumer Recycled Clothing. Clothing
and Textiles Research Journal; Jan/Mar 2004, vol.22 no. 1-2; pp.61-68.
Zhu, Qinghua and Raymond P Cote. 2004. Integrating green supply chain management in
to embryonic eco-industrial development: a case study of the Guitang Group.
Journal of Cleaner Production; Volume 12, Issues 8-10; pp. 1025-1035.
Zhu, Qinghua, Joseph Sarkis and Kee-hung Lai. 2008. Green supply chain management
implications for “closing the loop”. Transportation Research Part E, 44(2008),
pp.1-18.
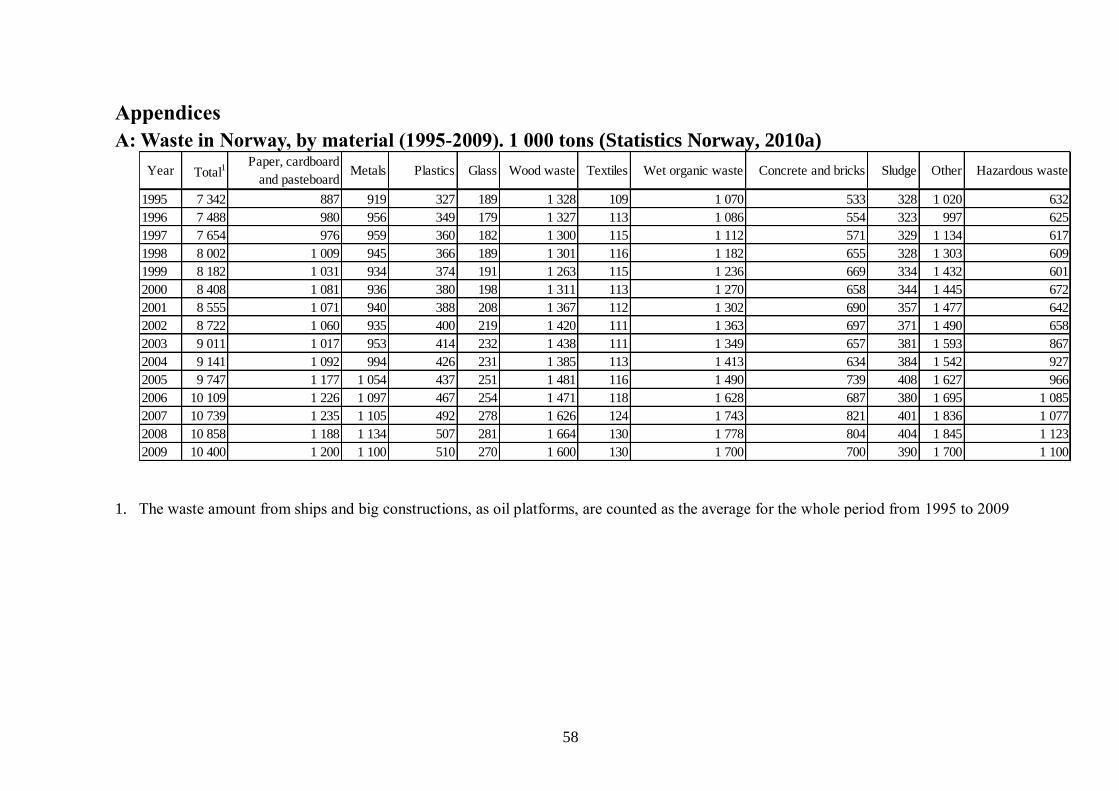
58
Appendices
A: Waste in Norway, by material (1995-2009). 1 000 tons (Statistics Norway, 2010a)
1. The waste amount from ships and big constructions, as oil platforms, are counted as the average for the whole period from 1995 to 2009
1995 7 342 887 919 327 189 1 328 109 1 070 533 328 1 020 632
1996 7 488 980 956 349 179 1 327 113 1 086 554 323 997 625
1997 7 654 976 959 360 182 1 300 115 1 112 571 329 1 134 617
1998 8 002 1 009 945 366 189 1 301 116 1 182 655 328 1 303 609
1999 8 182 1 031 934 374 191 1 263 115 1 236 669 334 1 432 601
2000 8 408 1 081 936 380 198 1 311 113 1 270 658 344 1 445 672
2001 8 555 1 071 940 388 208 1 367 112 1 302 690 357 1 477 642
2002 8 722 1 060 935 400 219 1 420 111 1 363 697 371 1 490 658
2003 9 011 1 017 953 414 232 1 438 111 1 349 657 381 1 593 867
2004 9 141 1 092 994 426 231 1 385 113 1 413 634 384 1 542 927
2005 9 747 1 177 1 054 437 251 1 481 116 1 490 739 408 1 627 966
2006 10 109 1 226 1 097 467 254 1 471 118 1 628 687 380 1 695 1 085
2007 10 739 1 235 1 105 492 278 1 626 124 1 743 821 401 1 836 1 077
2008 10 858 1 188 1 134 507 281 1 664 130 1 778 804 404 1 845 1 123
2009 10 400 1 200 1 100 510 270 1 600 130 1 700 700 390 1 700 1 100
Year Total1
Paper, cardboard
and pasteboardMetals Concrete and bricks Sludge Other Hazardous wastePlastics Glass Wood waste Textiles Wet organic waste
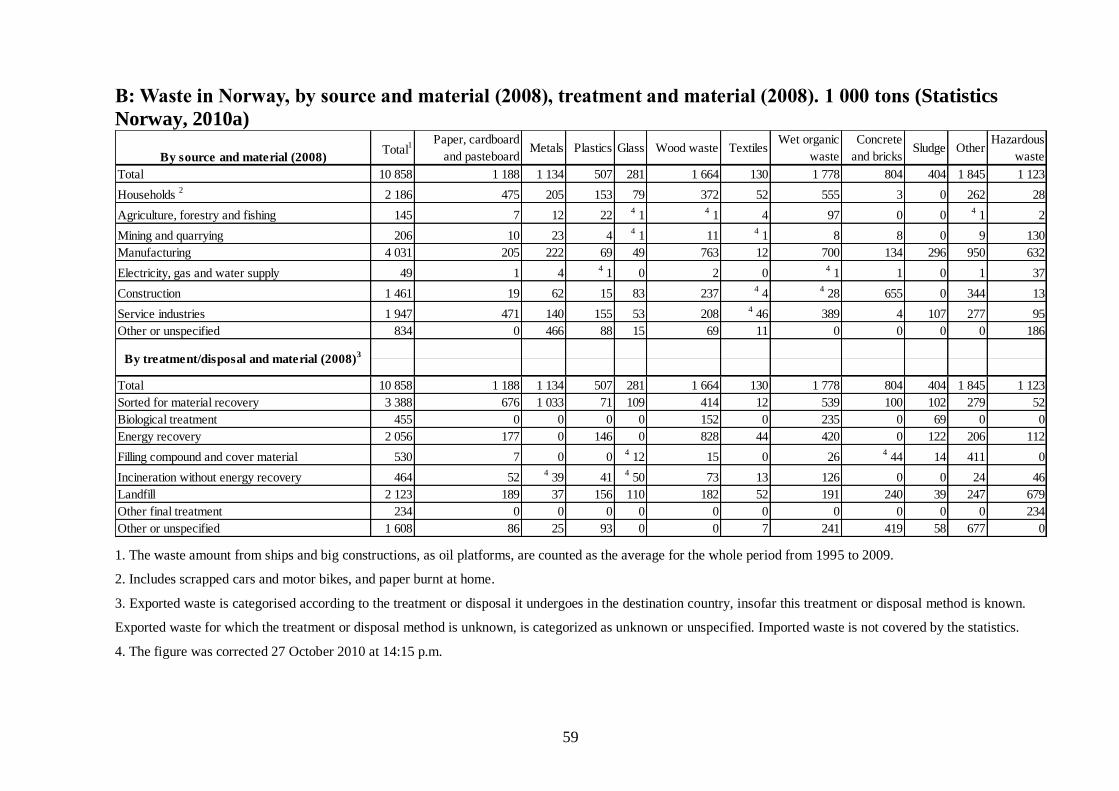
59
B: Waste in Norway, by source and material (2008), treatment and material (2008). 1 000 tons (Statistics
Norway, 2010a)
1. The waste amount from ships and big constructions, as oil platforms, are counted as the average for the whole period from 1995 to 2009.
2. Includes scrapped cars and motor bikes, and paper burnt at home.
3. Exported waste is categorised according to the treatment or disposal it undergoes in the destination country, insofar this treatment or disposal method is known.
Exported waste for which the treatment or disposal method is unknown, is categorized as unknown or unspecified. Imported waste is not covered by the statistics.
4. The figure was corrected 27 October 2010 at 14:15 p.m.
Total 10 858 1 188 1 134 507 281 1 664 130 1 778 804 404 1 845 1 123
Households 2
2 186 475 205 153 79 372 52 555 3 0 262 28
Agriculture, forestry and fishing 145 7 12 224a
14a
1 4 97 0 04a
1 2
Mining and quarrying 206 10 23 44a
1 114a
1 8 8 0 9 130
Manufacturing 4 031 205 222 69 49 763 12 700 134 296 950 632
Electricity, gas and water supply 49 1 44a
1 0 2 04a
1 1 0 1 37
Construction 1 461 19 62 15 83 2374a
44a
28 655 0 344 13
Service industries 1 947 471 140 155 53 2084a
46 389 4 107 277 95
Other or unspecified 834 0 466 88 15 69 11 0 0 0 0 186
Total 10 858 1 188 1 134 507 281 1 664 130 1 778 804 404 1 845 1 123
Sorted for material recovery 3 388 676 1 033 71 109 414 12 539 100 102 279 52
Biological treatment 455 0 0 0 0 152 0 235 0 69 0 0
Energy recovery 2 056 177 0 146 0 828 44 420 0 122 206 112
Filling compound and cover material 530 7 0 04a
12 15 0 264a
44 14 411 0
Incineration without energy recovery 464 524a
39 414a
50 73 13 126 0 0 24 46
Landfill 2 123 189 37 156 110 182 52 191 240 39 247 679
Other final treatment 234 0 0 0 0 0 0 0 0 0 0 234
Other or unspecified 1 608 86 25 93 0 0 7 241 419 58 677 0
Concrete
and bricksSludge Other
Hazardous
waste
By treatment/disposal and material (2008)3
By source and material (2008)Total
1Paper, cardboard
and pasteboardMetals Plastics Glass Wood waste Textiles
Wet organic
waste
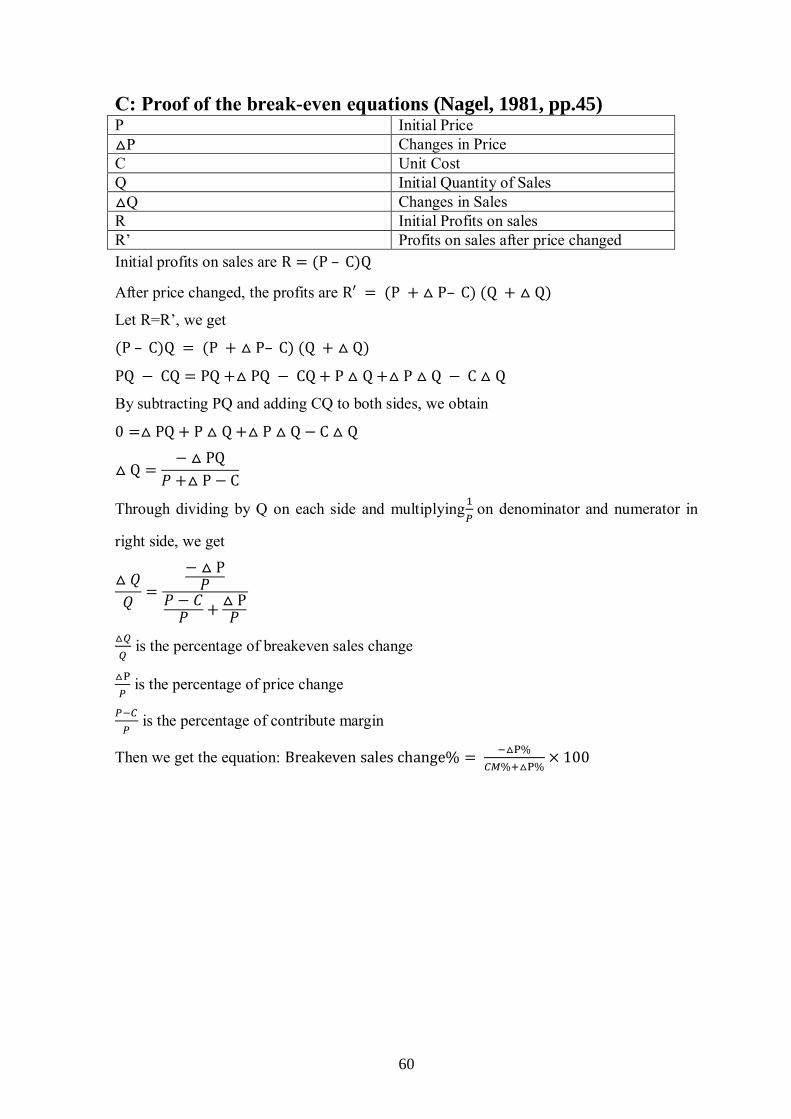
60
C: Proof of the break-even equations (Nagel, 1981, pp.45)
P Initial Price
△P Changes in Price
C Unit Cost
Q Initial Quantity of Sales
△Q Changes in Sales
R Initial Profits on sales
R’ Profits on sales after price changed
Initial profits on sales are R (P – C)Q
After price changed, the profits are R′ (P + △ P– C) (Q + △ Q)
Let R=R’, we get
(P – C)Q (P + △ P– C) (Q + △ Q)
PQ − CQ PQ +△ PQ − CQ + P △ Q+△ P △ Q − C △ Q
By subtracting PQ and adding CQ to both sides, we obtain
0 △ PQ + P △ Q+△ P △ Q − C △ Q
△ Q −△ PQ
𝑃 +△ P − C
Through dividing by Q on each side and multiplying1
𝑃 on denominator and numerator in
right side, we get
△ 𝑄
𝑄
− △ P𝑃
𝑃 − 𝐶𝑃 +
△ P𝑃
△𝑄
𝑄 is the percentage of breakeven sales change
△P
𝑃 is the percentage of price change
𝑃−𝐶
𝑃 is the percentage of contribute margin
Then we get the equation: Breakeven sales change% −△P%
𝐶𝑀%+△P%× 100
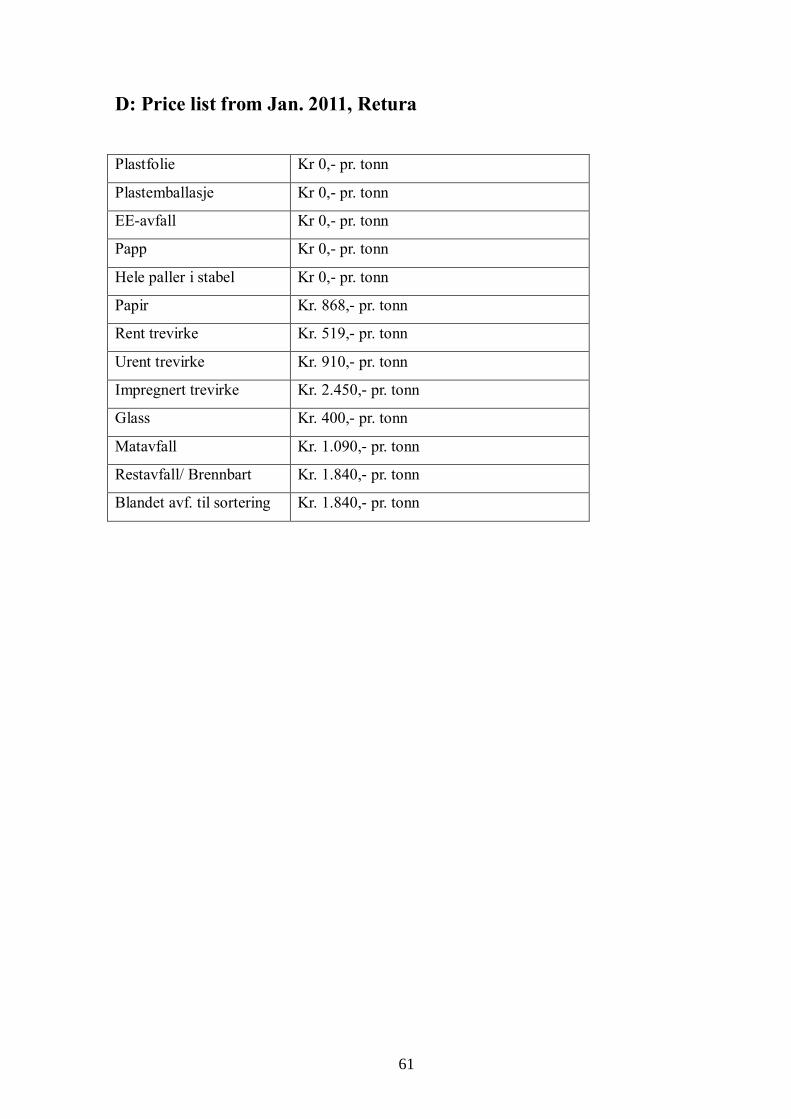
61
D: Price list from Jan. 2011, Retura
Plastfolie Kr 0,- pr. tonn
Plastemballasje Kr 0,- pr. tonn
EE-avfall Kr 0,- pr. tonn
Papp Kr 0,- pr. tonn
Hele paller i stabel Kr 0,- pr. tonn
Papir Kr. 868,- pr. tonn
Rent trevirke Kr. 519,- pr. tonn
Urent trevirke Kr. 910,- pr. tonn
Impregnert trevirke Kr. 2.450,- pr. tonn
Glass Kr. 400,- pr. tonn
Matavfall Kr. 1.090,- pr. tonn
Restavfall/ Brennbart Kr. 1.840,- pr. tonn
Blandet avf. til sortering Kr. 1.840,- pr. tonn
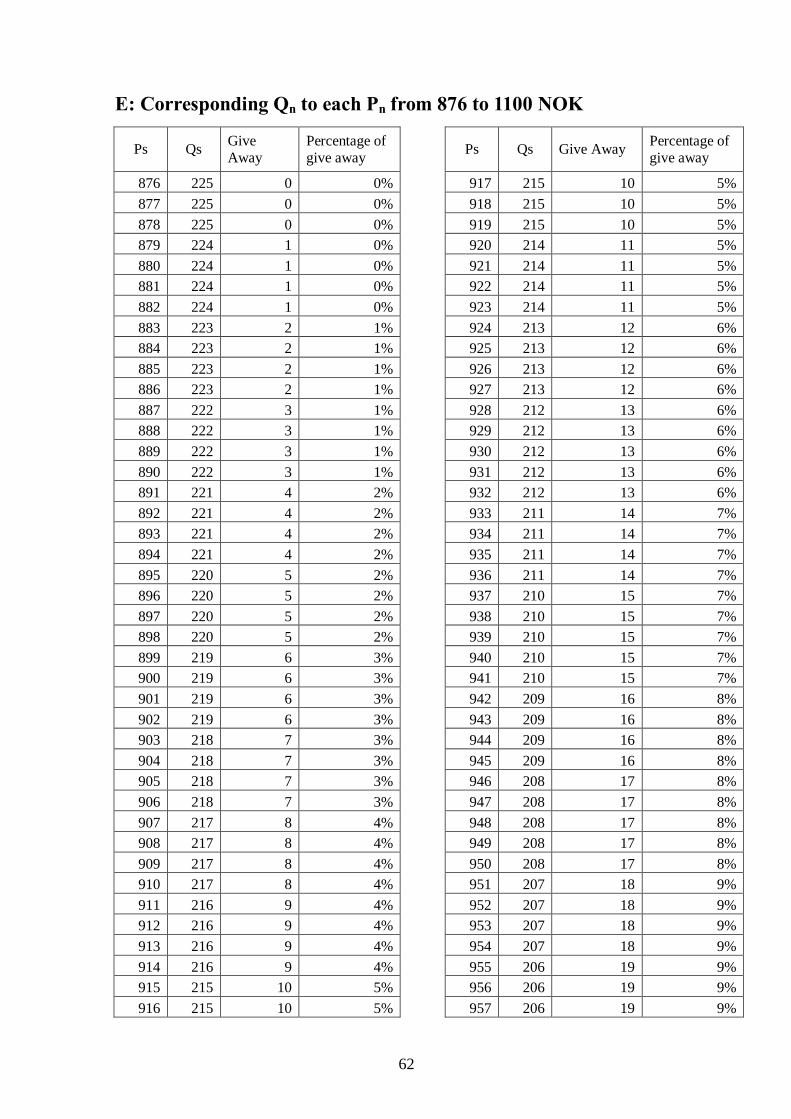
62
E: Corresponding Qn to each Pn from 876 to 1100 NOK
Ps Qs Give
Away
Percentage of
give away Ps Qs Give Away
Percentage of
give away
876 225 0 0% 917 215 10 5%
877 225 0 0% 918 215 10 5%
878 225 0 0% 919 215 10 5%
879 224 1 0% 920 214 11 5%
880 224 1 0% 921 214 11 5%
881 224 1 0% 922 214 11 5%
882 224 1 0% 923 214 11 5%
883 223 2 1% 924 213 12 6%
884 223 2 1% 925 213 12 6%
885 223 2 1% 926 213 12 6%
886 223 2 1% 927 213 12 6%
887 222 3 1% 928 212 13 6%
888 222 3 1% 929 212 13 6%
889 222 3 1% 930 212 13 6%
890 222 3 1% 931 212 13 6%
891 221 4 2% 932 212 13 6%
892 221 4 2% 933 211 14 7%
893 221 4 2% 934 211 14 7%
894 221 4 2% 935 211 14 7%
895 220 5 2% 936 211 14 7%
896 220 5 2% 937 210 15 7%
897 220 5 2% 938 210 15 7%
898 220 5 2% 939 210 15 7%
899 219 6 3% 940 210 15 7%
900 219 6 3% 941 210 15 7%
901 219 6 3% 942 209 16 8%
902 219 6 3% 943 209 16 8%
903 218 7 3% 944 209 16 8%
904 218 7 3% 945 209 16 8%
905 218 7 3% 946 208 17 8%
906 218 7 3% 947 208 17 8%
907 217 8 4% 948 208 17 8%
908 217 8 4% 949 208 17 8%
909 217 8 4% 950 208 17 8%
910 217 8 4% 951 207 18 9%
911 216 9 4% 952 207 18 9%
912 216 9 4% 953 207 18 9%
913 216 9 4% 954 207 18 9%
914 216 9 4% 955 206 19 9%
915 215 10 5% 956 206 19 9%
916 215 10 5% 957 206 19 9%
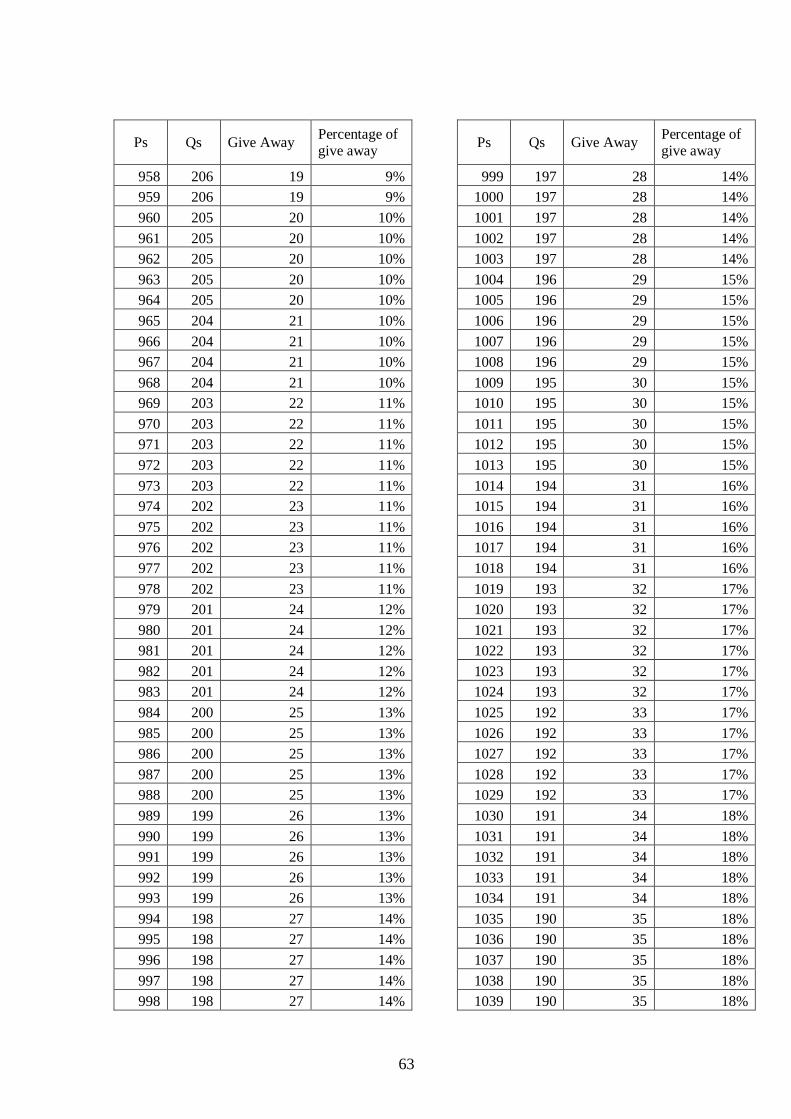
63
Ps Qs Give Away Percentage of give away
Ps Qs Give Away Percentage of give away
958 206 19 9% 999 197 28 14%
959 206 19 9% 1000 197 28 14%
960 205 20 10% 1001 197 28 14%
961 205 20 10% 1002 197 28 14%
962 205 20 10% 1003 197 28 14%
963 205 20 10% 1004 196 29 15%
964 205 20 10% 1005 196 29 15%
965 204 21 10% 1006 196 29 15%
966 204 21 10% 1007 196 29 15%
967 204 21 10% 1008 196 29 15%
968 204 21 10% 1009 195 30 15%
969 203 22 11% 1010 195 30 15%
970 203 22 11% 1011 195 30 15%
971 203 22 11% 1012 195 30 15%
972 203 22 11% 1013 195 30 15%
973 203 22 11% 1014 194 31 16%
974 202 23 11% 1015 194 31 16%
975 202 23 11% 1016 194 31 16%
976 202 23 11% 1017 194 31 16%
977 202 23 11% 1018 194 31 16%
978 202 23 11% 1019 193 32 17%
979 201 24 12% 1020 193 32 17%
980 201 24 12% 1021 193 32 17%
981 201 24 12% 1022 193 32 17%
982 201 24 12% 1023 193 32 17%
983 201 24 12% 1024 193 32 17%
984 200 25 13% 1025 192 33 17%
985 200 25 13% 1026 192 33 17%
986 200 25 13% 1027 192 33 17%
987 200 25 13% 1028 192 33 17%
988 200 25 13% 1029 192 33 17%
989 199 26 13% 1030 191 34 18%
990 199 26 13% 1031 191 34 18%
991 199 26 13% 1032 191 34 18%
992 199 26 13% 1033 191 34 18%
993 199 26 13% 1034 191 34 18%
994 198 27 14% 1035 190 35 18%
995 198 27 14% 1036 190 35 18%
996 198 27 14% 1037 190 35 18%
997 198 27 14% 1038 190 35 18%
998 198 27 14% 1039 190 35 18%
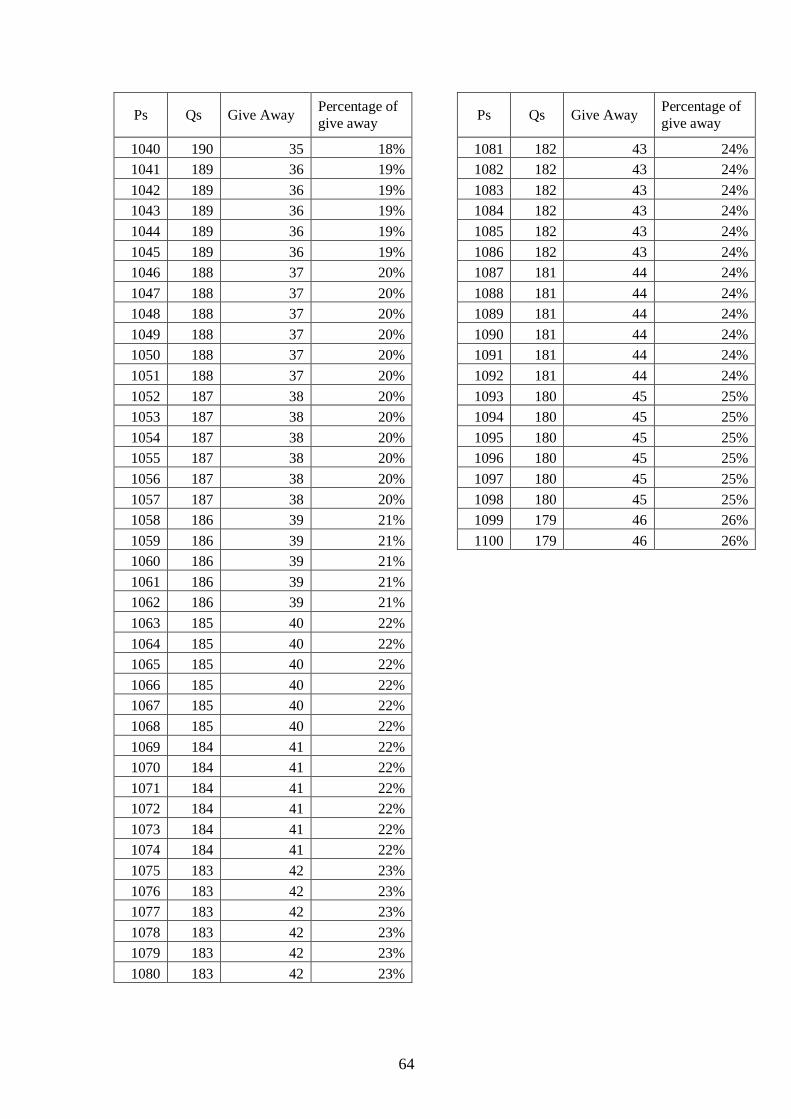
64
Ps Qs Give Away Percentage of
give away Ps Qs Give Away
Percentage of
give away
1040 190 35 18% 1081 182 43 24%
1041 189 36 19% 1082 182 43 24%
1042 189 36 19% 1083 182 43 24%
1043 189 36 19% 1084 182 43 24%
1044 189 36 19% 1085 182 43 24%
1045 189 36 19% 1086 182 43 24%
1046 188 37 20% 1087 181 44 24%
1047 188 37 20% 1088 181 44 24%
1048 188 37 20% 1089 181 44 24%
1049 188 37 20% 1090 181 44 24%
1050 188 37 20% 1091 181 44 24%
1051 188 37 20% 1092 181 44 24%
1052 187 38 20% 1093 180 45 25%
1053 187 38 20% 1094 180 45 25%
1054 187 38 20% 1095 180 45 25%
1055 187 38 20% 1096 180 45 25%
1056 187 38 20% 1097 180 45 25%
1057 187 38 20% 1098 180 45 25%
1058 186 39 21% 1099 179 46 26%
1059 186 39 21% 1100 179 46 26%
1060 186 39 21%
1061 186 39 21%
1062 186 39 21%
1063 185 40 22%
1064 185 40 22% 1065 185 40 22%
1066 185 40 22%
1067 185 40 22%
1068 185 40 22%
1069 184 41 22% 1070 184 41 22%
1071 184 41 22% 1072 184 41 22%
1073 184 41 22%
1074 184 41 22%
1075 183 42 23%
1076 183 42 23% 1077 183 42 23%
1078 183 42 23%
1079 183 42 23%
1080 183 42 23%