Embed Size (px)
DESCRIPTION
CLOSUP working paper investigating early implementation of the Michigan Merit Curriculum
Citation preview

CLOSUP Working Paper Series Number 29
June 2010
Mandating Change: Assessing the Implementation
of the Michigan Merit Curriculum
Steven Byrd and Kasia Langer, University of Michigan
This paper is available online at http://closup.umich.edu
Any opinions, findings, conclusions, or recommendations expressed in this material are those of the author(s) and do not necessarily reflect the view of the Center for Local, State, and Urban Policy or any sponsoring agency
Center for Local, State, and Urban Policy Gerald R. Ford School of Public Policy
University of Michigan

GERALD R. FORD SCHOOL OF PUBLIC POLICY | UNIVERSITY OF MICHIGAN
Mandating Change: Assessing the Implementation of the Michigan Merit
Curriculum
Steven Byrd & Kasia Langer
12/18/2009
This report was compiled for the Citizens’ Research Council of Michigan and in partial fulfillment of the requirements for PubPol 632: Policy Analysis Practicum.

1
Table of Contents Introduction ............................................................................................................................................................... 3
Background ................................................................................................................................................................ 4
The Michigan Merit Curriculum ............................................................................................................................ 4
National Graduation Requirements ...................................................................................................................... 6
Academic Course‐Taking in Michigan .................................................................................................................... 8
Math Requirements at Post‐Secondary Level ..................................................................................................... 10
Literature Review ................................................................................................................................................ 11
Impact of Raising Mid‐Level Requirements: A High School Transcript Study ................................................. 11
High Stakes Graduation Requirements: Effects of Accountability Standards ................................................. 12
Impact of Increased Course‐Taking: Student Achievement Effects ................................................................ 13
Benefits of a Constrained Curriculum: NAEP and the 1990 High School Transcript Study ............................. 14
Long‐Term Benefits of Additional Coursework: Labor Market Effects............................................................ 15
Potential Lack of Implementation at the School Level .................................................................................... 16
Methods .................................................................................................................................................................. 16
In‐Person Interviews ............................................................................................................................................ 17
Online Survey Instrument .................................................................................................................................... 17
Findings .................................................................................................................................................................... 19
Effects of Implementation ................................................................................................................................... 20
Changes in Course‐Taking Patterns ................................................................................................................. 20
Failure Rates .................................................................................................................................................... 21
Challenges to Implementation ............................................................................................................................ 22
Meeting State Standards ................................................................................................................................. 22
Changes in Staffing .......................................................................................................................................... 25
Student Preparation ........................................................................................................................................ 26
School Resources ............................................................................................................................................. 27
Local Policy Concerns ...................................................................................................................................... 28
Responses to MMC Pressures ............................................................................................................................. 30
Scheduling Changes ......................................................................................................................................... 30
New and Modified Courses ............................................................................................................................. 31
Online Learning ............................................................................................................................................... 32
Additional Support for At‐Risk Students ......................................................................................................... 32

2
Student and Parent Outreach ......................................................................................................................... 33
Teacher Support and Changes in Teaching Methods ...................................................................................... 33
Preemptive Application of Standards .............................................................................................................. 34
New Textbooks ................................................................................................................................................ 34
Administrator Attitudes Toward the Michigan Merit Curriculum ....................................................................... 34
Conclusion ............................................................................................................................................................... 35
Works Cited ............................................................................................................................................................. 37
Appendix A. In‐Person Interview Questionnaire ..................................................................................................... 39
Appendix B. Online Survey Questionnaire .............................................................................................................. 40
3
Introduction On April 20, 2006, Michigan governor Jennifer Granholm signed into law the Michigan Merit Curriculum – a set
of core graduation requirements that are among the highest in the nation. The Michigan Merit Curriculum
(MMC) requires all students in the graduating class of 2011 and beyond to obtain four credits in English, four
credits in math (including Algebra I, Algebra II, and geometry), three credits in science, three credits in social
studies, and one credit each in physical education, visual or performing arts, and an online learning experience
(See Table 1). The MMC was initially touted as a way to ensure that every student graduating from a Michigan
high school would be ready for a college level curriculum. Proponents of the measure also argued that the new
MMC requirements would prepare students for the workforce, helping the state’s transformation into a 21st
century economy (Michigan Department of Education, 2006b).
However, as opposed to the state‐level reforms in the mid‐1980s across the country which seemed to follow
pre‐existing local trends (Clune & White, 1992), this transition actually made many substantive changes to local
requirements. It has mandated a dramatic change in course taking by students across the state, not only
requiring students to take more challenging courses, but also to take more of them in order to graduate. As a
result, schools must offer more classes in all core subject areas and ensure that students pass even the most
rigorous courses in order to obtain a high school diploma. Therefore, tensions arise about hiring enough
teachers to staff these new courses and providing enough resources to help students pass them. Normally, this
would theoretically necessitate an increase in financial resources for schools. However, with the state’s recent
budget crises, school funding levels have either remained stagnant or decreased, placing even greater pressure
on schools and districts to meet the demands of the Michigan Merit Curriculum.
In addition to these prima facie challenges to implementation (staffing and resources), there are also multiple
policy challenges presented at the local level including, but not limited to, student attendance requirements,
length of the school year, student discipline, and the calculation of student GPA. While these policies are
typically under local control, the Michigan Merit Curriculum is placing pressure on local officials to re‐examine
many of these long‐standing decisions.
Finally, the graduating class of 2011 will be the first group of Michigan students subject to the new
requirements, and as such, the state does not have data about the impacts of the MMC on test results or
graduation rates – the class of 2011 will not take the Michigan Merit Examination until the spring of 2010.
Perhaps more disconcerting is the fact that without the possibility of earning Michigan Promise Scholarships for
taking the exam, there will be little incentive for students to complete the test, causing a potential bias in any
data that is collected from the spring 2010 administration.
This report seeks to identify and quantify some of the challenges faced by districts as they push their students to
higher academic levels in a time of fiscal hardship. We have conducted surveys and interviews of school and
district level personnel from across the state to determine the major roadblocks to fully implementing the MMC
as well as strategies that have been successful so that they may be replicated on a large scale.
In the pages that follow, we will first provide background information on national graduation requirements,
course‐taking patterns of students not subject to the MMC, and studies conducted over the past twenty‐five
years which attempt to draw connections between graduation requirements, academic course‐taking, high

4
school graduation, student achievement, and future earnings. We will then discuss the methods of the study,
including in‐depth interviews with key informants at the district and intermediate school district level and an
online survey instrument distributed to high school principals across the state. We will also discuss the sampling
methods and response rates, including any possible biases in the responses. We will then turn to a discussion of
the results of our surveys, with a prioritized list of challenges faced by school leaders as they try to meet the
requirements of the MMC. Finally, we will discuss both the largest challenges and successes across the state
from a policy perspective – analyzing possible solutions and supports from the state level.
Table 1. MMC Graduation Requirements
Michigan Merit Curriculum High School Graduation Requirements
Mathematics – 4 credits Algebra I Algebra II
Geometry One math course in final year of HS
English Language Arts – 4 credits English Language Arts 9 English Language Arts 10
English Language Arts 11 English Language Arts 12
Science – 3 credits Biology
Chemistry or Physics One additional science credit
Social Studies – 3 credits ½ credit in Civics
U.S. History and Geography ½ credit in Economics
World History and Geography Physical Education & Health – 1 credit
Visual, Performing and Applied Arts – 1 credit Online Learning Experience
World Language – 2 credits (Class of 2016)
Background Before determining whether or not the implementation of the Michigan Merit Curriculum has been a success, it
is important to ground our understanding of the requirements in both a national and state‐specific context.
Herein, we divide state‐level graduation requirements into three distinct categories – low‐level, mid‐level, and
high‐level – based on the level of state mandates placed on the conferral of a degree. We then analyze results
from the ACT for the class of 2009 to provide some baseline data on course‐taking patterns among Michigan
students and begin to estimate the effects of mandating certain course patterns for all students. Finally, we
review a significant body of academic research on the topic of graduation requirements to provide a context for
the prior impacts of increasing requirements elsewhere.
The Michigan Merit Curriculum The Michigan Merit Curriculum was signed into law on April 20, 2006 and enacted some of the highest
graduation requirements in the nation (Education Commission of the States, 2007). These new requirements
required students to take four English Language Arts (ELA) courses, four math courses, three science courses,
three social studies courses, one visual/performing art, one physical education course, and complete an “online
learning experience.” The curriculum, in this form, was approved by the legislature. When the MMC was initially

5
presented to the State Board of Education, a world languages requirement was added, effective with the class of
2016. In all, the MMC will eventually require all students obtaining a high school diploma from the state of
Michigan to complete no less than eighteen courses.
This curriculum was devised by a panel of state and local education officials, college deans, and representatives
from industry, who analyzed scholarly research on curriculum reform and studied reforms in Singapore, Indiana,
Oregon, and Arkansas (Steptoe, 2006). Two of the main goals of this curriculum was to double the college
graduation rate in the state of Michigan and, in so doing, expedite the state’s transition to a “21st century
economy” (Michigan Department of Education, 2006b; Michigan Department of Education, 2006c).
All of these courses are required to be aligned to the Michigan High School Content Expectations (HSCEs), which
were developed concurrently with this curriculum. The HSCEs cover all core courses at the high school level and
were enacted to provide some measure of uniformity in courses across the state (Michigan Department of
Education, 2006a). All districts and schools are also required to base a student’s grade in a course on
assessments of content material. However, how much these assessments count, what content they cover, and
when they are given are all left to local control.
While graduation requirements had largely been determined locally until the passage of the MMC,1 the new
curriculum is notable for the sheer number of required courses relative to prior state mandate. The additional
courses can put a strain on what electives (non‐required classes) students can feasibly take during their high
school career. School schedules are determined locally and can range from six courses per day for an entire year
to four courses per day for one semester, followed by four different courses for the next semester, resulting in a
typical range of six to eight courses (Carnegie units) per year per student. With this range, the MMC dictates
between fifty‐five and seventy‐five percent of the courses students take during their high school careers, leaving
room for one to three electives per year. Here, “electives” refers to any course not specifically outlined in the
MMC, including, but not limited to, additional visual arts courses, band, orchestra, choir, debate, theater,
psychology, sociology, creative writing courses, trigonometry, calculus, statistics, earth science, marine biology,
oceanography, and any AP courses.
Due, in part, to the specificity and rigor of the courses required, the legislation allowed for the creation of a
“personal curriculum” (PC) for students who may have trouble completing the requirements of the curriculum.
A PC can be created by a parent in conjunction with a teacher and principal to meet the needs of individual
students, but only beginning in their junior year. Until that time, all students are required to persist in the core
courses. However, to avoid students using the PC as a way to not pass basic courses, the legislature was very
specific in regards to which courses can be waived and how (See Table 2).
The ELA, science, world language, and online learning experience requirements cannot be amended unless the
student has an Individualized Education Program (IEP) under the Individuals with Disabilities Education Act, or
the student has transferred from another state and has already completed two years of high school. For the
math requirements, all students must complete Algebra I and geometry, and can lower their Algebra II
requirement to only ½ credit. All students still must complete a “math‐related” course in their senior year. In
social studies, all students must complete Civics and at least 2 social studies credits prior to modification. They
1 The only state requirement for graduation prior to the Class of 2011 was a state government/civics credit.

6
may then substitute the final social studies requirement for another ELA, science, math, or world languages
credit. Students may also substitute their physical education and visual/performing arts credits for an ELA,
science, math, or world languages credit.
Additionally, students who can demonstrate knowledge of a particular subject area must have the opportunity
to do so for course credit. That is, students have the option of taking a test, determined by the district/school,
to demonstrate that they understand the content of a course. If the student passes the exam, she may receive
the credit without taking the course.
Finally, schools can teach integrated curricula, particularly in math, that give students credit for obtaining the
knowledge and skills in another setting, such as a Career/Technical Education course. If a student takes a shop
class in which they cover the content of geometry in an applied manner, they can receive credit for geometry
under the MMC. What particular courses qualify for this exemption is at the discretion of the local school
district.
Table 2. Personal Curriculum Modifications
Subject Area Requirements Personal Curriculum Modifications
4 English Language Arts (ELA) Credits No Modification
4 Mathematics Credits Minimum of 2 credits prior to any modification 1 credit of Algebra II may be modified to ½ credit
3 Science Credits No modification
3 Social Studies Credits
No modification of Civics Minimum of 2 credits prior to any modification
1 credit may be exchanged for additional ELA/math/science/world language
1 Physical Education and Health Credit Credit can be exchanged for an additional ELA/math/science/world languages credit
1 Visual, Performing, and Applied Arts Credit Credit can be exchanged for an additional ELA/math/science/world languages credit
2 World Languages Credits No Modification Online Learning Experience No Modification
National Graduation Requirements Nationally, forty‐two states currently have requirements for graduation, with twenty‐five offering a “college
preparatory” diploma (Education Commission of the States, 2007). However, requirements from state to state
can vary widely, with some states (such as North Dakota) requiring students to only complete a certain number
of Carnegie units, some (such as Missouri) requiring a certain number of units in each core content area, and
others (such as Texas) requiring students to complete a large number of specific courses (See Table 3).
Given the variety of graduation requirements across the nation, it may be helpful to think of state level
requirements in terms of three “levels” of mandate. States with “low level” graduation requirements set no
specific state‐level course mandates. Instead, the states may set a base number of credit hours that students
must meet in order to graduate. Other decisions, such as which courses students must take and how credits are
determined for those courses, are left up to the local educational agencies (LEAs) within the state. This broad
7
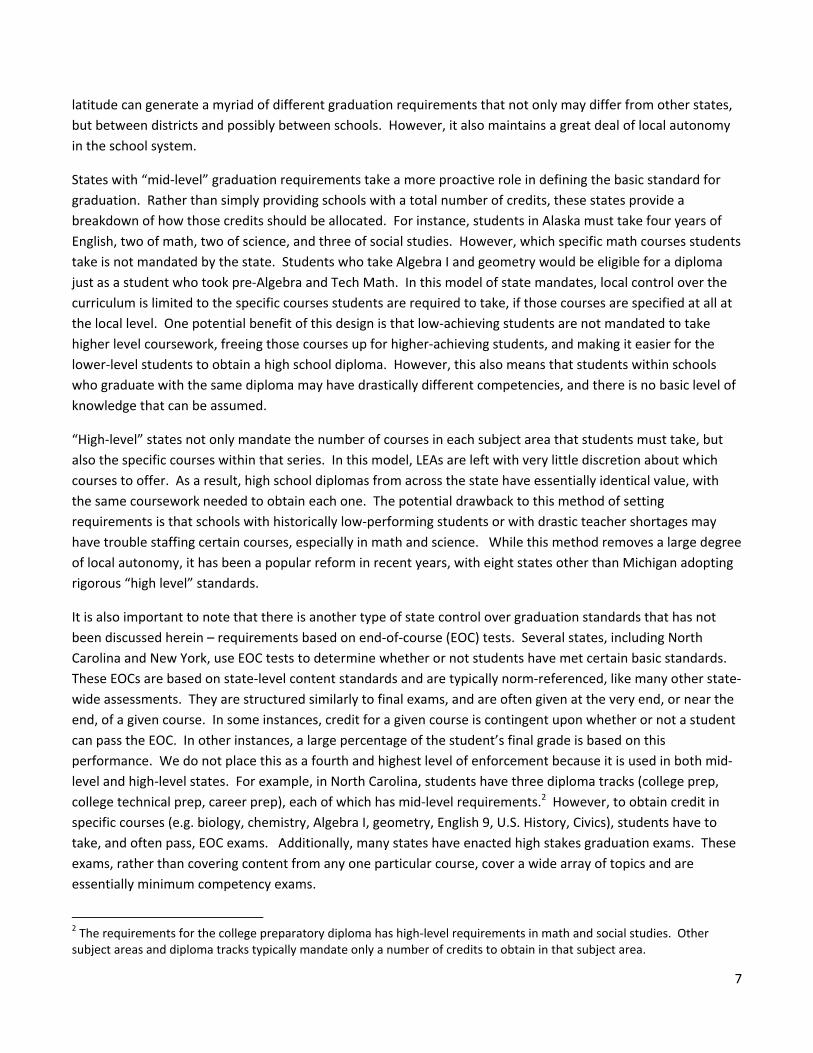
latitude can generate a myriad of different graduation requirements that not only may differ from other states,
but between districts and possibly between schools. However, it also maintains a great deal of local autonomy
in the school system.
States with “mid‐level” graduation requirements take a more proactive role in defining the basic standard for
graduation. Rather than simply providing schools with a total number of credits, these states provide a
breakdown of how those credits should be allocated. For instance, students in Alaska must take four years of
English, two of math, two of science, and three of social studies. However, which specific math courses students
take is not mandated by the state. Students who take Algebra I and geometry would be eligible for a diploma
just as a student who took pre‐Algebra and Tech Math. In this model of state mandates, local control over the
curriculum is limited to the specific courses students are required to take, if those courses are specified at all at
the local level. One potential benefit of this design is that low‐achieving students are not mandated to take
higher level coursework, freeing those courses up for higher‐achieving students, and making it easier for the
lower‐level students to obtain a high school diploma. However, this also means that students within schools
who graduate with the same diploma may have drastically different competencies, and there is no basic level of
knowledge that can be assumed.
“High‐level” states not only mandate the number of courses in each subject area that students must take, but
also the specific courses within that series. In this model, LEAs are left with very little discretion about which
courses to offer. As a result, high school diplomas from across the state have essentially identical value, with
the same coursework needed to obtain each one. The potential drawback to this method of setting
requirements is that schools with historically low‐performing students or with drastic teacher shortages may
have trouble staffing certain courses, especially in math and science. While this method removes a large degree
of local autonomy, it has been a popular reform in recent years, with eight states other than Michigan adopting
rigorous “high level” standards.
It is also important to note that there is another type of state control over graduation standards that has not
been discussed herein – requirements based on end‐of‐course (EOC) tests. Several states, including North
Carolina and New York, use EOC tests to determine whether or not students have met certain basic standards.
These EOCs are based on state‐level content standards and are typically norm‐referenced, like many other state‐
wide assessments. They are structured similarly to final exams, and are often given at the very end, or near the
end, of a given course. In some instances, credit for a given course is contingent upon whether or not a student
can pass the EOC. In other instances, a large percentage of the student’s final grade is based on this
performance. We do not place this as a fourth and highest level of enforcement because it is used in both mid‐
level and high‐level states. For example, in North Carolina, students have three diploma tracks (college prep,
college technical prep, career prep), each of which has mid‐level requirements.2 However, to obtain credit in
specific courses (e.g. biology, chemistry, Algebra I, geometry, English 9, U.S. History, Civics), students have to
take, and often pass, EOC exams. Additionally, many states have enacted high stakes graduation exams. These
exams, rather than covering content from any one particular course, cover a wide array of topics and are
essentially minimum competency exams.
2 The requirements for the college preparatory diploma has high‐level requirements in math and social studies. Other subject areas and diploma tracks typically mandate only a number of credits to obtain in that subject area.

8
Table 3. Example Graduation Requirements
Subject Area Low‐Level Mid‐Level High‐Level
English ‐‐ 4 ELA 9, ELA 10, ELA 11, ELA 12Math ‐‐ 2 Alg. I & II, Geom., one otherScience ‐‐ 2 Biology, Chem., one otherSocial Studies ‐‐ 3 US Hist, Civ. & Econ., World HistPhysical Education ‐‐ 1 1 Arts ‐‐ 0 1 Foreign Language ‐‐ 0 2
ExAMPLE STATE Nebraska Alaska Michigan
Academic Course‐Taking in Michigan Even though the state of Michigan does not maintain public records at a state level about which courses
students are enrolling in and how many complete each course series, this information can be obtained using
data released from the ACT. Since 2007, every eleventh‐grader in the state of Michigan has been required to
take the ACT as part of the Michigan Merit Examination. While completing the ACT, students fill out an
informational section about which classes they have taken and expect to complete by the time they graduate.
By examining the results for the graduating class of 2009, we can begin to develop a baseline understanding of
how many students in the state of Michigan are already meeting the requirements of the Michigan Merit
Curriculum. It is important to note, however, that many of these results come from 11th grade students in the
spring, and ask about what courses they expect to complete by the time they graduate. As a result, some
students may have expected to take particular course sequences that they did not complete, and other students
may have completed course sequences that they did not intend to take. We should therefore take these results
as a preliminary and cursory view of academic course‐taking, rather than an exact measure which would require
detailed transcript studies.
The ACT defines a “core” level of coursework as four years of English, three years of math, three years of
science, and three years of social studies by the end of a student’s high school career. Among the graduating
class of 2009, only 54% of Michigan students had completed a 4‐3‐3‐3 curriculum (ACT, 2009). However, a
larger percentage of students had completed the core level of coursework in each subject area (81% English,
79% math, 84% social studies, 72% science). Although a large majority of students had taken the core level in
each subject area, there were fewer students who met the core requirements in all four subject areas.
However, Michigan’s new graduation requirements are “high level,” and as such, we should look to specific
courses rather than the total number of courses taken.
Among the class of 2009, 56% of students had taken the minimum of four years of English as mandated under
the MMC with another 25% taking more than the new requirements – 81% of total students meeting the
requirements (See Table 4). Under the new requirements, 100% of students will be required to take these
courses, amounting to a 23 percentage point increase over current levels in the number of students completing
four English courses. However, given that one quarter of students had taken more than the minimum number
of English credits, it appears as though staffing may not be a major concern in this field.

9
Table 4. Student Self‐Reported Course Paths, Class of 2009
Math
Total Met Michigan Merit Curriculum Requirements 31%
Algebra I, Algebra II, Geometry, 1 Other 10% Algebra I, Algebra II, Geometry, Trigonometry 8% Algebra I, Algebra II, Geometry, Trigonometry, 1 Other 8% Algebra I, Algebra II, Geometry, Trigonometry, Calculus 5%
Total Did Not Meet Michigan Merit Curriculum Requirements 66%
Algebra I, Algebra II, Geometry 19% 4 years Math (Other) 24% 3 years Math (Other) 5% <3 years Math (Other) 18%
Total Reporting 94%
Science
Total Met Michigan Merit Curriculum Requirements 68%
Biology, Chemistry, 1 Other 29% Biology, Chemistry, Physics 7% Biology, Chemistry, Physics, 1 Other 32%
Total Did Not Meet Michigan Merit Curriculum Requirements 29%
3 years Science (Other) 4% <3 years Science (Other) 25%
Total Reporting 97%
Social Studies
Total Met Michigan Merit Curriculum Requirements 6%
U.S. History, World History, Government 4% U.S. History, World History, Government, 1 Other 2%
Total Did Not Meet Michigan Merit Curriculum Requirements 91%
4 years Social Studies (Other) 44% 3 years Social Studies (Other) 34% <3 years Social Studies (Other) 13%
Total Reporting 97%
In math, only 55% of students in the class of 2009 took four or more years of courses. Perhaps even more
worrisome, almost half of those students (24% of the total) took a math series that did not include Algebra I, II,
and geometry. Out of the total graduating class of 2009, only 31% of students expected to have met the
requirements of the MMC by the time they graduated. Perhaps more promising is that 19% of the total
students took only Algebra I, II, and geometry, requiring only one additional math or “math‐related” course.
Nonetheless, Michigan schools will have to more than triple the number of students taking Algebra I, II,
geometry, and another math in order to meet the requirements of the MMC. With a quarter of the total class of
2009 taking a 4‐year math series that did not fulfill the MMC requirements, there will potentially need to be a
redistribution of faculty into the mandated courses, while hiring of new teachers in these subject areas.

10
In science, 72% of students took three years worth of courses. 36% of students took biology, chemistry, and one
other science, with an additional 32% taking biology, chemistry, physics, and another science. Overall, of the
graduating class of 2009, 68% would have met the Michigan Merit Curriculum requirements for science,
requiring schools to increase student enrollment in these course sequences by a third.
In social studies, 84% of students took three years or more of content matter. 46% of the class took four years
of social studies, with 38% taking three years of coursework. However, out of the graduating class of 2009, only
6% would have met the MMC requirements. This would require schools to increase the number of students
taking the MMC core by a factor of 16 over its current levels. Perhaps more comforting than in other subject
areas, there are a large number of students in the state of Michigan taking more courses than required, so
staffing may not be as much of a concern as it is with other subject areas. Rather, schools will need to
redistribute social studies teachers into the MMC core courses.
Math Requirements at Post‐Secondary Level As noted above, one of the major impetuses for the passage of the Michigan Merit Curriculum was a desire to
increase the preparation of high school graduates for a college‐level curriculum. To that end, we were
interested in determining to what degree the Michigan Merit Curriculum requirements align with expectations
in state colleges and universities. To simplify this process, we examined only math requirements as content
covered in English, social studies, or the sciences is highly variable and has a less defined progression of content.
Additionally, we examined the requirements at a handful of community colleges. This decision was made
because the expectations of prior content knowledge are typically lower at local community colleges than at
large research universities. Additionally, many students use community colleges as a cheaper avenue for
earning credits before eventually attending larger, four‐year colleges.
Upon examining the course sequences outlined in math programs at several community colleges (as an example,
see Figure 1), we found that the math requirements of the Michigan Merit Curriculum strongly aligned with, and
even overlapped, the courses at the beginning of the math sequence. At both Washtenaw Community College
and Henry Ford Community College, successful completion of Algebra II in high school has the potential to allow
students to bypass two “remedial” math courses and one 100‐level course, moving directly into college algebra
or a similar course. Depending on the content covered in the high school course, the student may also be
prepared to bypass their college algebra class as well, depending on the results of their math placement exams.
While placing out of multiple math classes can dramatically increase the likelihood that a student will be
successful in the college environment, it also reduces the financial burden on a student. Bypassing three courses
at Washtenaw Community College (Foundations of Mathematics, Foundations of Algebra, and Intermediate
Algebra), will save an in‐state student between $960 and $1,572, depending on the location of their home. If a
student also bypasses College Algebra, the potential savings increases to between $1,280 and $2,096. For low‐
income students, these savings are significant and could potentially make the difference between a decision to
attend post‐secondary school or not.

11
Figure 1. Math Course Sequence at Washtenaw Community College (** Content covered by Michigan Merit Curriculum Requirements)
Literature Review For more than two decades, researchers have been examining the impact of higher standards on student
achievement. On average, much of this research indicates that students on the margins may benefit the most
from higher requirements (Chaney, Burgdorf, & Atash, 1997). These students typically take more courses than
they did before (Clune & White, 1992; Teitelbaum, 2003), and this additional coursework has the potential to
increase their achievement in a given subject area (Jones, Davenport, Bryson, Bekhuis, & Zwick, 1986; Sebring,
1987).
Impact of Raising Mid‐Level Requirements: A High School Transcript Study
Until recently, very few states had ever enacted high‐level graduation requirements. In the mid‐1980s and early
1990s, many of the changes in state‐level requirements involved either enacting mid‐level requirements or
increasing the number of courses required under such requirements. As a result, academic course‐taking was
not greatly impacted at the upper levels (Clune & White, 1992).
Clune and White conducted a transcript study in four states (California, Missouri, Pennsylvania, and Florida) to
determine the impact of increased graduation requirements on student course‐taking. The reforms they were
examining focused heavily on increasing the number of required courses in each subject area. Among these four
states, the authors admit that only Florida could be viewed as a “high‐change” state, thereby limiting the study’s
application to analyzing large state‐level changes. Within these states, the authors purposively selected four
Foundations of Mathematics**
Foundations of Algebra**
Intermediate Algebra**
College AlgebraGeneral
TrigonometryPrecalculus
Calculus I
Calculus II
Calculus III
Differential Equations
Linear Algebra
Mathematical Analysis I
Functional Math for Elementary Teachers I & II
Basic Statistics
Technical Algebra

12
schools located in two to three districts. At least one of the schools in each state was an urban high school, and
one other was rural. All schools had to be four year high schools in the lowest quartile of district achievement
which did not undergo any major changes between 1980 and 1989. Within these high schools, the authors
selected twenty‐five transcripts at each of three time periods for analysis.
Clune and White found that the greatest effects were on low‐achieving students who tended to take more
courses than they did before. However, the courses that they took were largely at the beginning of course
sequences rather than at the end (more students taking pre‐Algebra rather than trigonometry). However, the
authors themselves indicated that the sampling was non‐random and non‐representative of schools as a whole.
In conjunction with the small sample sizes at each time period and the unique policy questions they were
analyzing, the external validity of this research is small, particularly as it applies to the MMC. More than
anything else, this study should serve as an indicator of possible effects of only modestly increasing graduation
requirements – they influence students who are not yet meeting minimum requirements to obtain the basic
standard, but rarely incite higher‐level course‐taking. Other studies have also shown that even though more
students take more courses in mathematics and science with more stringent graduation requirements, not all
students take advanced courses (Teitelbaum, 2003).
High Stakes Graduation Requirements: Effects of Accountability Standards
As school systems adopt greater accountability standards, it is important to understand the differential effects
of varying requirements. A study by Schiller and Muller (2003) attempted to answer this very question. Using
data from the National Education Longitudinal Survey of 1998‐1992 and data collected from the National
Cooperative Education Statistics System, the authors compared student course‐taking with various levels of
state requirements, including raising the number of courses required for graduation, instituting a more
extensive testing system, and creating consequences for schools and/or students. Using a sample of over
10,000 students across all fifty states and the District of Columbia, Schiller and Muller analyzed how these
requirements affected the freshman mathematics course taken by students and the number of advanced
courses they took during their high school career (defined as geometry and above). Even after controlling for
socioeconomic status, they found that increased graduation requirements did increase the average level of
course taken in the freshman year, with an effect size similar to all family indicators. Increased graduation
requirements also decreased the impact of racial/ethnic background on student course‐taking. In contrast, the
extensiveness of testing reduced the average level of course taken in the freshman year and increased the effect
of socioeconomic status, indicating that states with high levels of testing also tended to have larger gaps
between high‐ and low‐SES students.
Schiller and Muller also investigated the impact of changing requirements on the number of advanced courses
taken in high school. They found that when a state increased the number of courses required to graduate,
students actually took fewer advanced courses in high school, potentially because they were also taking more
advanced courses in ninth grade. That is, even though students started high school at a higher level of
coursework (e.g. completing Geometry in ninth grade instead of Algebra I), they did not complete more courses
overall, generally ending the course sequence where they would have in the absence of the intervention (e.g.
trigonometry as a final course in both instances, despite additional time to complete other courses). In contrast,
school‐level consequences had a positive effect on the number of advanced courses taken by students. In short,
adopting certain policies can and does have an impact at the student level on course‐taking. Students who must

13
complete more credits to graduate tend to start high school at a higher level of mathematics, but also tend to
take fewer advanced courses during their high school career. Students subject to extensive testing tend to start
high school at a lower level, but take approximately the same number of advanced courses in high school.
States with higher consequences for schools also tend to have students taking more advanced courses. Finally,
most graduation policies (except for extensive testing) tend to mitigate the impact of racial/ethnic background
of a student, a finding that has been discovered elsewhere as well (Schiller & Muller, 2000).
Impact of Increased Course‐Taking: Student Achievement Effects
With that being said, research has also indicated that increasing the number of courses that students take,
especially in math above the Algebra I level, has an impact on student achievement in that subject area (Jones,
Davenport, Bryson, Bekhuis, & Zwick, 1986). Such links were also found in science courses, but the relationship
was weaker. Jones, et al. used data from the 1980 High School and Beyond study that examined the math,
science, and verbal aptitudes of almost 10,000 high school students who were sophomores in 1980. Many of
these students were then retested in 1982. The authors analyzed the relationship between the number of
advanced math and science courses students took (both self‐reported and on their transcripts) and correlated it
with their achievement on the 1982 series of tests. Advanced math courses were defined as those at the
Algebra I level and above, with a low of zero and a top‐code value of five. Before conducting their analysis, the
authors also saw fit to control for home environment (including factors of socioeconomic status), achievement
on the 1980 series of tests (to parse out any effects from middle school or earlier), and achievement on the
verbal section of tests (to separate out any effects that may arise from “more intelligent” students taking more
courses). These controls take into account all student achievement measures available and many factors of
socioeconomic status. If any improvements were to be made, we may have liked to include some measure of
school fixed effects, understanding that the quality of a school is likely associated with both the number of
advanced courses students take and their achievement, and not all of these factors may be included in a
measure of home environment. Leaving out this variable may create a positive bias in the results, providing too
strong of an effect of additional coursework on achievement tests.
After controlling for these factors, the authors found that an increased number of courses at the Algebra I level
or above had a strong and statistically significant impact on student achievement. The correlation between
these coefficients increased as the number of advanced courses increased, dropping off slightly at M=5 due to
ceiling effects. In this study, the difference between students who had completed no advanced math courses
and those who were top‐coded was more than two standard deviations in test score, indicating an extremely
large impact of additional math courses on student achievement. In science, increased course‐taking was
associated with increased achievement, but when Jones, et al. controlled for achievement on the 1980 test, less
than 2% of the total variance was explained by additional coursework. The authors attribute this difference to
the shorter science test and the variation in content covered by “biology,” “chemistry,” or “physics” in
classrooms across the nation (especially when compared to the much smaller variation in “Algebra I”). If we ake
into account the potential omitted variable bias introduced by excluding school level fixed effects, science
effects may completely disappear.
The only analytical concern of this study beyond the omitted variable bias (OVB) is a disconnect between the
self‐reported course‐taking of students and the transcript records. In fact, using students’ transcripts rather
than self‐reports results in a decrease in the predictive ability of the model. The authors attribute this

14
disconnect to errors in transcript coding or students’ reporting course content (e.g. Calculus) that was taught in
other courses (e.g. Algebra II). Nonetheless, the predictive model is strong in math, indicating that more math
coursework increases student achievement in the subject, even after controlling for home environment, prior
achievement, and student intellectual capability.
However, the relationships between course‐taking and student achievement are not limited only to math and
science (given that the OVB does not mitigate any science effects). Using information from the High School and
Beyond survey and the College Entrance Examination Board, Sebring (1987) studied course‐taking patterns and
achievement in additional subjects among 1980 high school seniors in New York, Pennsylvania, Ohio, Illinois,
Washington and California and 1982 high school seniors in New York and California. She found that after
controlling for verbal and mathematics aptitude, performance on achievement tests in American History,
French, Math 2, and Chemistry was positively associated with students having taken more coursework in social
studies, language, mathematics, and physical science, respectively. However, these findings must be taken with
an important caveat—students taking the SAT were self‐selecting. Nevertheless, because she found that the
relationship between course‐taking and achievement held across most aptitude levels, she argues that it is
possible to extrapolate these findings to non‐college bound students.
Despite these promising findings, other research has shown little or no change in student test scores related to
higher graduation requirements directly (Teitelbaum, 2003). In 2003, Teitelbaum conducted a study using
information from 5,586 public high school graduates with transcript and test score information from 732 schools
which was gathered as part of the National Educational Longitudinal Study. The purpose of his study was to
examine the effects of more stringent graduation requirements. He found that after controlling for race, sex,
socioeconomic status (at the school and individual student levels), eighth grade test scores, and vocational or
general path, stricter standards did not have a statistically significant effect on student test scores. His findings
did not indicate that this was because of the dilution of curricula. A hypothesis that higher graduation
requirements leads to higher student test scores requires an intermediate process, namely that those higher
requirements lead students to take more classes. The ultimate explanation advanced by Teitelbaum and other
studies (Clune & White, 1992) is that increased requirements did not directly influence students to take more
advanced coursework, which minimized any potential effects of graduation requirements on test scores.
Benefits of a Constrained Curriculum: NAEP and the 1990 High School Transcript Study
A constrained curriculum is one which offers fewer choices to students in the courses that they take and
increases the number of academic courses in which they enroll. Using data available from the 1990 High School
Transcript Study and the National Assessment of Educational Progress (NAEP), Lee, Croninger, and Smith (1997)
examined the impact of a constrained mathematics curriculum on the math performance of students. Drawing
a sample of over 3,000 students from 123 schools, the authors used hierarchical linear modeling to determine
the impact of a constrained curriculum on student test scores. In their analysis, the authors controlled for
student, school, and community characteristics, including, but not limited to, demographics, socioeconomic
status, variability in graduation rate, ninth grade GPA, and parents’ educational status. Lee, et al. found that
schools whose math curriculum is more than 75% academic courses had the highest average proficiency on the
12th grade NAEP. Those whose math curriculum was less than 50% academic courses had the lowest average
proficiency. Both results were significantly different (p=.001), from schools with 50‐75% academic courses.

15
Even more interestingly, the authors also found that schools with lower levels of academic courses also tended
to have lower socioeconomic status3, more minority students, more female students, and a lower 9th grade GPA2
than other schools. Since higher socioeconomic status is negatively associated with minority status and
positively associated with prior achievement, we cannot necessarily disentangle these effects from one another,
i.e. develop a causal relationship, from this analysis. However, using HLM, the authors did find that, at the
student level, social class and ninth grade GPA are positively correlated with 12th grade achievement and gender
(female) and minority status are negatively correlated with 12th grade achievement. At the school level, every
indicator of a constrained curriculum was positively associated4 with average achievement, controlling for other
factors. In short, Lee, et al. found that a more constrained, more academic curriculum was positively associated
with overall achievement holding constant factors such as socioeconomic status, demographics, and entering
achievement levels.
Long‐Term Benefits of Additional Coursework: Labor Market Effects
Higher curriculum standards are rarely end goals in and of themselves; such policies are often intended to have
long term consequences. Goodman found that there are fairly significant labor market effects associated with
increased math coursework (Goodman, 2009). For his study, he compiled a nationally representative time series
of high school transcripts that contained detailed information about completed coursework. This information
came from two data sources: Census data and high school transcripts collected by the National Center for
Education Statistics in 1982, 1987, 1990, and 1994. In an effort to mitigate selection bias, he also used an
instrumental variable: differentially timed state‐level reforms of high school graduation requirements.
Using two‐sample instrumental variable estimates, Goodman found that reforms had a particularly strong
impact on the course‐taking and earnings of black males. After reforms, black males completed .40 more math
courses (roughly evenly split between basic and advanced), and black females completed .28 more math courses
(mainly more advanced coursework). Among whites, reforms were associated with a .19 course increase among
males and a statistically insignificant increase of .10 among females. Furthermore, he found that each additional
year of math raised blacks’ earnings by 5‐9%, which is a large part of the value of a year of schooling. Much of
this effect came from blacks who attended schools that were less than 80% white and who will not attend
college. Thus, the reforms close one fifth of the earnings gap between black and white males. While there also
appeared to be an effect on whites, this effect was less clear and was somewhat masked by the smaller impact
of reforms on white students’ coursework. He summarizes his findings by concluding that math coursework is
important for earnings, less rigorous requirements benefit lower‐achieving students, and more rigorous
requirements may be necessary to improve the earning outcomes of higher‐achieving students.
However, there are some important caveats to this study. Because only information about graduates was
available for the 1990 and 1994 waves of transcript collection, Goodman excluded information about dropouts
from the 1982 and 1987 studies. Thus, he cannot comment on the effects of higher requirements on high
school completion. In addition, because Goodman used state of birth as a proxy for state of high school
completion in the Census data, he also excluded Hispanics from the study since many were born outside of the
United States. Therefore, an important demographic is thus not present in this study. Furthermore, he
3 Significant at the p=.05 level 4 Significant at the p=.001 level
16
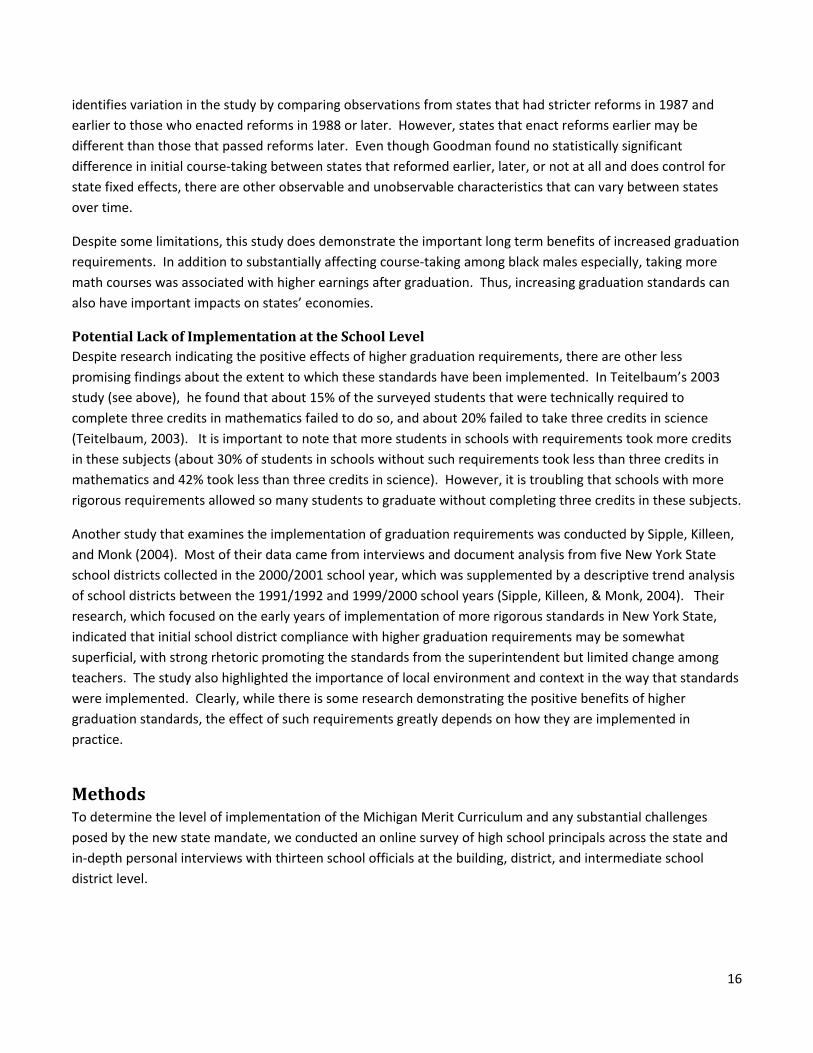
identifies variation in the study by comparing observations from states that had stricter reforms in 1987 and
earlier to those who enacted reforms in 1988 or later. However, states that enact reforms earlier may be
different than those that passed reforms later. Even though Goodman found no statistically significant
difference in initial course‐taking between states that reformed earlier, later, or not at all and does control for
state fixed effects, there are other observable and unobservable characteristics that can vary between states
over time.
Despite some limitations, this study does demonstrate the important long term benefits of increased graduation
requirements. In addition to substantially affecting course‐taking among black males especially, taking more
math courses was associated with higher earnings after graduation. Thus, increasing graduation standards can
also have important impacts on states’ economies.
Potential Lack of Implementation at the School Level
Despite research indicating the positive effects of higher graduation requirements, there are other less
promising findings about the extent to which these standards have been implemented. In Teitelbaum’s 2003
study (see above), he found that about 15% of the surveyed students that were technically required to
complete three credits in mathematics failed to do so, and about 20% failed to take three credits in science
(Teitelbaum, 2003). It is important to note that more students in schools with requirements took more credits
in these subjects (about 30% of students in schools without such requirements took less than three credits in
mathematics and 42% took less than three credits in science). However, it is troubling that schools with more
rigorous requirements allowed so many students to graduate without completing three credits in these subjects.
Another study that examines the implementation of graduation requirements was conducted by Sipple, Killeen,
and Monk (2004). Most of their data came from interviews and document analysis from five New York State
school districts collected in the 2000/2001 school year, which was supplemented by a descriptive trend analysis
of school districts between the 1991/1992 and 1999/2000 school years (Sipple, Killeen, & Monk, 2004). Their
research, which focused on the early years of implementation of more rigorous standards in New York State,
indicated that initial school district compliance with higher graduation requirements may be somewhat
superficial, with strong rhetoric promoting the standards from the superintendent but limited change among
teachers. The study also highlighted the importance of local environment and context in the way that standards
were implemented. Clearly, while there is some research demonstrating the positive benefits of higher
graduation standards, the effect of such requirements greatly depends on how they are implemented in
practice.
Methods To determine the level of implementation of the Michigan Merit Curriculum and any substantial challenges
posed by the new state mandate, we conducted an online survey of high school principals across the state and
in‐depth personal interviews with thirteen school officials at the building, district, and intermediate school
district level.

17
In‐Person Interviews In order to assess the level of implementation of the Michigan Merit Curriculum, we surveyed school officials at
the school, district, and intermediate school district (ISD) level. These stakeholders included principals, district
curriculum coordinators, and superintendents. One‐on‐one interviews were conducted with both current and
former school officials either in their offices or via video conference. All interviews were conducted in October
and November of 2009 and covered many of the same questions as the survey instrument while allowing a more
in‐depth conversation about the issues surrounding implementation. Interviews ranged in length from 25 to 75
minutes and provided interview subjects the ability to comment on both their personal successes and
challenges, and responses from the larger online survey instrument. No interview subjects also completed the
online survey instrument.
Subjects for in‐person interviews were identified both through convenience and snowball sampling. That is,
initial contacts were made with school leaders who were either close in proximity to the University of Michigan
or who had personal connections with UM faculty or staff (convenience sampling). These initial contacts then
provided us with links to other stakeholders who potentially would provide additional pertinent information for
our study (snowball). Subjects included ISD superintendents and curriculum coordinators, district
superintendents and staff, and school level principals and teachers. For privacy concerns, their names and
specific positions are withheld.
All of the interviews included basic questions regarding school or district level response to the MMC (see
Appendix A), but allowed the official substantial leeway in guiding the conversation to particular issues they felt
needed to be addressed with the plan. Specific issues that arose in these discussions are outlined in the
“Findings” section below.
Online Survey Instrument We also surveyed high school principals in Michigan using the online survey software Qualtrics. In order to
maximize the number of responses, the survey was distributed to all 604 principals for whom we had accurate
contact information rather than using a random sampling method. According to Keesler et al., there are a total
of 892 public high school principals in Michigan (Keesler, Wyse, Jones, & Schneider, 2008, p. 2). Principals were
given fourteen days to respond to the survey before it was closed. In total, we received 238 responses to the
instrument – a response rate of 39.4%. This response rate is high for email‐based surveys (Sheehan, 2001), likely
because of the salience of the issue and the number of follow‐up communications sent to non‐respondents.
However, by providing the survey instrument to all available administrators and allowing them to decide
whether or not to participate, we potentially introduced bias into any results as principals who have particularly
strong emotions about the MMC may self‐select into taking the survey. In short, these principals may be in
some way substantively different than the general population of principals. Principals who are more apathetic
or who have done less to implement the new standards may be among those that did not respond. Additionally,
those who have particularly struggled with the new standards or are more opposed to the standards may be
more likely to respond. To determine whether respondents and non‐respondents differed substantively, we
solicited school identifiers from each survey respondent and compared the school characteristics of respondents
against the characteristics of the entire population of Michigan high schools, specifically focusing on such factors
18
as percent of the population qualifying for free or reduced price lunch, size of the school, racial/ethnic
composition, and prior test results.
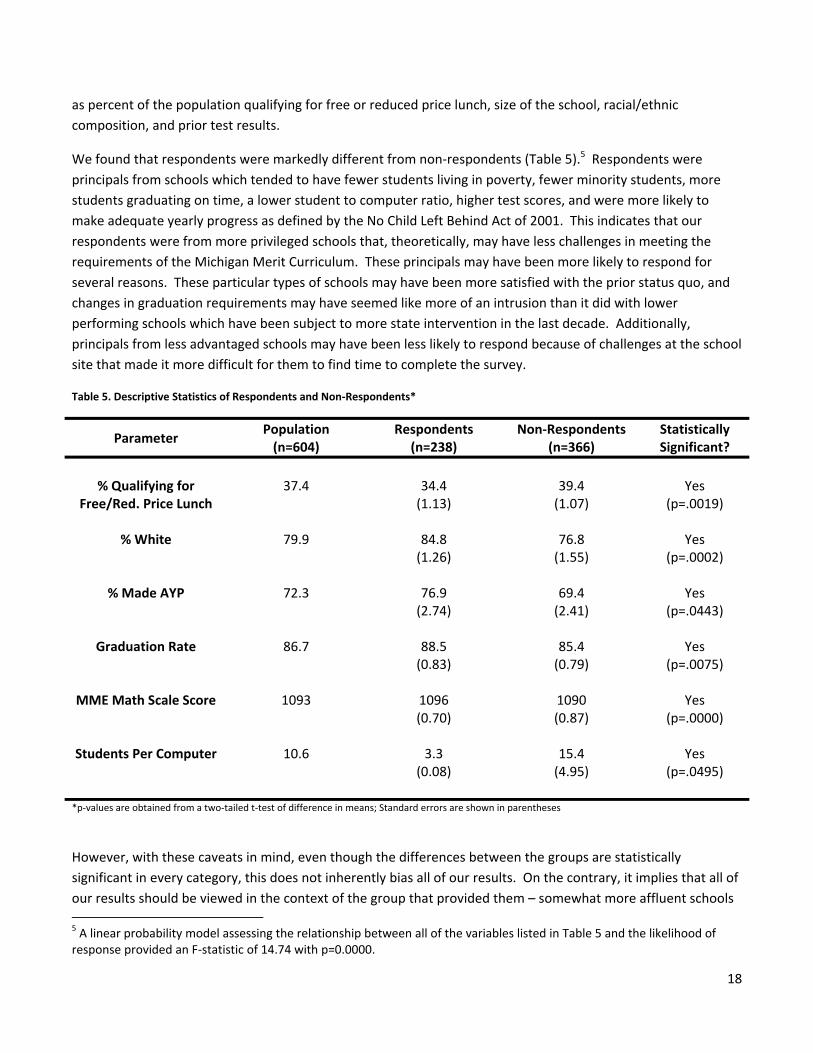
We found that respondents were markedly different from non‐respondents (Table 5).5 Respondents were
principals from schools which tended to have fewer students living in poverty, fewer minority students, more
students graduating on time, a lower student to computer ratio, higher test scores, and were more likely to
make adequate yearly progress as defined by the No Child Left Behind Act of 2001. This indicates that our
respondents were from more privileged schools that, theoretically, may have less challenges in meeting the
requirements of the Michigan Merit Curriculum. These principals may have been more likely to respond for
several reasons. These particular types of schools may have been more satisfied with the prior status quo, and
changes in graduation requirements may have seemed like more of an intrusion than it did with lower
performing schools which have been subject to more state intervention in the last decade. Additionally,
principals from less advantaged schools may have been less likely to respond because of challenges at the school
site that made it more difficult for them to find time to complete the survey.
Table 5. Descriptive Statistics of Respondents and Non‐Respondents*
Parameter Population (n=604)
Respondents (n=238)
Non‐Respondents (n=366)
Statistically Significant?
% Qualifying for
Free/Red. Price Lunch 37.4 34.4
(1.13) 39.4 (1.07)
Yes (p=.0019)
% White 79.9 84.8
(1.26) 76.8 (1.55)
Yes (p=.0002)
% Made AYP 72.3 76.9
(2.74) 69.4 (2.41)
Yes (p=.0443)
Graduation Rate 86.7 88.5
(0.83) 85.4 (0.79)
Yes (p=.0075)
MME Math Scale Score 1093 1096
(0.70) 1090 (0.87)
Yes (p=.0000)
Students Per Computer 10.6 3.3
(0.08) 15.4 (4.95)
Yes (p=.0495)
*p‐values are obtained from a two‐tailed t‐test of difference in means; Standard errors are shown in parentheses
However, with these caveats in mind, even though the differences between the groups are statistically
significant in every category, this does not inherently bias all of our results. On the contrary, it implies that all of
our results should be viewed in the context of the group that provided them – somewhat more affluent schools 5 A linear probability model assessing the relationship between all of the variables listed in Table 5 and the likelihood of response provided an F‐statistic of 14.74 with p=0.0000.

19
with fewer minority students, higher graduation rates, and higher test scores. For this group, we may have a
large measure of external validity. Whether these results can effectively be extrapolated to all principals is a
more complex issue and one that could be resolved at a later date.
Findings We found that the majority of schools added new courses to their curriculum in response to the MMC and
almost 40% of schools had to add additional sections of existing courses to meet the new requirements (See
Table 6). More than a third of principals reported that significantly more students were taking more challenging
courses in response to the new curriculum. The majority of teachers have not had difficulty aligning their
courses to state standards. More than any other challenge, 55% of schools indicated that poor student
preparation was a major challenge to full implementation of the curriculum.
Table 6. Raw Percentages from Survey Instrument
Location of School
Urban 8.8 Suburban 31.5 Rural 55.5
New Classes Offered?*
No 21.4 New Classes 55.0 New Sections, Existing Classes 39.1
Course‐Taking Effects
Significantly more students taking more challenging courses
37.4
Some more students taking more challenging courses
45.0
No change 14.3
Have teachers had difficulty aligning their courses?
No 52.1 Somewhat 37.0 Yes 6.7
What implementation challenges have you faced?*
Not enough qualified teachers 15.1 Poorly prepared students 55.0 Classroom Space 14.3 Online Learning Experience 6.3 Other 29.4 *Totals do not sum to 100% as respondents could select more than one response

20
Effects of Implementation
Changes in Course‐Taking Patterns
Course‐taking patterns also changed among students as a result of the Michigan Merit Curriculum. Of the 235
high school principals that responded, 37% stated that significantly more students were taking more challenging
classes, 45% stated that some students were taking more challenging classes, and 14% stated that students had
already been taking classes now required by the Michigan Merit Curriculum (Figure 2). None of the respondents
indicated that there was no change in course‐taking patterns due to insufficient classes being offered for
students to fulfill the Michigan Merit Curriculum requirements. These results demonstrate that the new
Michigan Merit Curriculum did have a substantial effect on student course enrollment.
Figure 2. Have course‐taking patterns changed as a result of the Michigan Merit Curriculum?
Changes in course‐taking patterns do not seem to be strongly related to school poverty levels. In our initial
analysis, we found that schools in which significantly more students were taking more challenging courses had
slightly more students living in poverty than other schools, and those schools that indicated no change in
student course‐taking patterns tended to have fewer students living in poverty.6 To further examine the
relationship between poverty and survey results, we divided schools into four quartiles based on the proportion
of students qualifying for free or reduced price lunch in the last year. Schools in the 1st quartile thereby had the
smallest proportion of students living in poverty and those in the 4th had the most. We received a higher
response rate from principals whose schools are in the first and second quartile, and had a lower response rate
from principals whose schools are in the third and fourth quartile.
In this analysis (presented in Table 7), we noted that schools in the 1st quartile were less likely to indicate that
students were taking significantly more courses and more likely to indicate that students were taking some
more challenging courses or have no change. Schools in the fourth quartile were the least likely to indicate no
6 Differences were not statistically significant at the 5% level (p=.0795 and p=.0681, respectively)
37.4%
45.0%
14.3%
Significantly More Students Taking More Challenging Courses
Some Students Taking More Challenging Courses
No Changes‐Most Students Were Already Taking Classes Now Required By the MMC

21
change in course‐taking behavior, and more likely to indicate either some more or significantly more challenging
courses. Schools in the second and third quartiles were more likely to indicate that some more or significantly
more students were taking more challenging courses. However, overall the relationship between school‐wide
poverty level and the change in course‐taking patterns was weak and not statistically‐significant.
Table 7. Course‐Taking Changes by Poverty Level of School*
Impact on Student Course‐taking
Quartiles of Proportion Qualifying for Free/Reduced Price Lunch
1st
(Fewest) 2nd
3rd 4th
(Greatest) All
Significantly more
students taking more challenging courses
19 26.03%
34 46.58%
27 44.26%
9 40.91%
89 38.86%
Some more students
taking more challenging courses
40 54.79%
30 41.10%
26 42.62%
11 50.00%
107 46.72%
No Change 14
19.18% 9
12.33% 8
13.11% 2
9.09% 33
14.41%
Total 73
100.0% 73
100.0% 61
100.0% 22
100.0% 229
100.0%
*Whole numbers represent numbers of respondents. Percentages are column percentages. Differences are not statistically significant (p=0.214)
Failure Rates
Unfortunately, most counties in Michigan do not compile information about course failure rates. Thus, our
discussion is limited to examining changes in course‐taking and failure rates in Macomb County between the
2005‐2006 and 2008‐2009 academic years.7 As seen in Table 8 below, failure rates have not increased as
dramatically as was feared because more students would be taking more challenging classes. The percentage of
ninth graders that failed at least one class remained steady at 34%. Enrollment in Algebra I increased by 1735
students, or 22.8%, but the failure rate only increased by 4 percentage points. In Geometry, enrollment
increased by 21.3% and the failure rate increased by 6 percentage points. Even though enrollment in Algebra II
increased by 29.4%, the failure rate only increased by 1 percentage point. Thus, while failure rates are
increasing in classes that are now becoming mandatory, the increase in failure rates is much lower than the
increase in enrollment rates. These results are encouraging and suggest that many students that are now
required to take more challenging courses are capable of succeeding.
7 Data was provided by Dr. Gayle Green, Chief Academic Officer/Assistant Superintendant of Instruction for the Macomb Intermediate School District.

22
Table 8. Macomb County Course‐Taking and Failure Rates
2008‐2009 Academic Year 2005‐2006 Academic Year
Course N Failure Rate N Failure RateAlgebra I 9,348 27% 7,613 23%Geometry 10,359 19% 8,539 13%Algebra II 7,602 13% 5,873 12%Biology 13,048 15% 10,584 13%Chemistry 8,183 13% 6,055 7%Physics 3,659 7% 2,886 3%
All Ninth Graders 8,443 34% 8,239 34%
Challenges to Implementation
Meeting State Standards
Determining how much school course offerings had to change in response to the Michigan Merit Curriculum
must be assessed at two different levels. First, we must see if sufficient courses and classes are being offered
for students to complete the Michigan Merit Curriculum (i.e. if there are enough math courses and sections so
that students can complete four years of math). Second, we should examine how well each course meets
requirements (i.e. if Algebra I contains all of the skills required by state standards). While assessing how much
schools needed to change their course offerings, we will also discuss other factors that could have made
meeting the Michigan Merit Curriculum more challenging.
Changes in Course Offerings
One of the questions in the online survey asked whether the school had added more classes in order to fulfill
Michigan Merit Curriculum requirements. There were 231 responses, and out of those that answered the
question, 22% stated that enough classes had been offered already, 41% stated that new courses (i.e. Algebra II)
were offered, and 57% stated that new sections of existing classes were offered (respondents were allowed to
select more than one answer). Thus, most schools added more courses and/or course sections in order to meet
the requirements of the Michigan Merit Curriculum, as seen in Figure 3.
Figure 3. Did your school or district add new courses or sections in response to the Michigan Merit Curriculum?
0.0%
10.0%
20.0%
30.0%
40.0%
50.0%
60.0%
No‐Sufficient classes were offered already
Yes‐New courses (i.e. Algebra II) needed to
be added
Yes‐New sections of existing classes needed
to be added
23
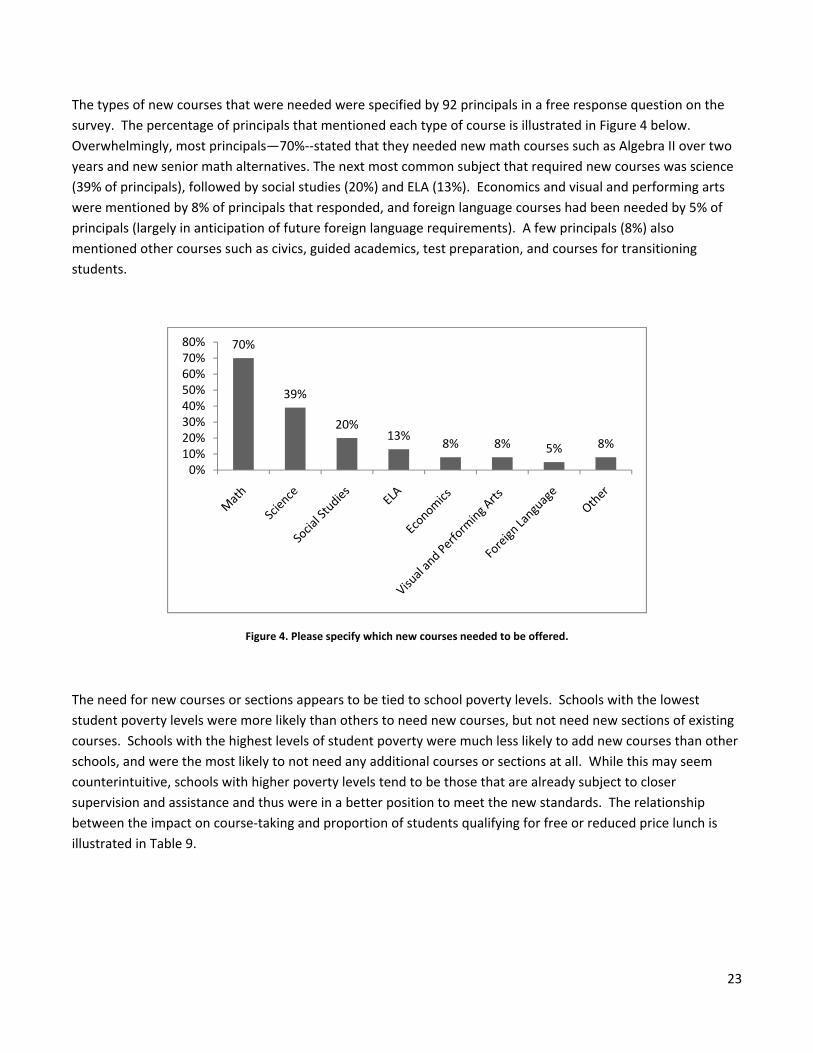
The types of new courses that were needed were specified by 92 principals in a free response question on the
survey. The percentage of principals that mentioned each type of course is illustrated in Figure 4 below.
Overwhelmingly, most principals—70%‐‐stated that they needed new math courses such as Algebra II over two
years and new senior math alternatives. The next most common subject that required new courses was science
(39% of principals), followed by social studies (20%) and ELA (13%). Economics and visual and performing arts
were mentioned by 8% of principals that responded, and foreign language courses had been needed by 5% of
principals (largely in anticipation of future foreign language requirements). A few principals (8%) also
mentioned other courses such as civics, guided academics, test preparation, and courses for transitioning
students.
Figure 4. Please specify which new courses needed to be offered.
The need for new courses or sections appears to be tied to school poverty levels. Schools with the lowest
student poverty levels were more likely than others to need new courses, but not need new sections of existing
courses. Schools with the highest levels of student poverty were much less likely to add new courses than other
schools, and were the most likely to not need any additional courses or sections at all. While this may seem
counterintuitive, schools with higher poverty levels tend to be those that are already subject to closer
supervision and assistance and thus were in a better position to meet the new standards. The relationship
between the impact on course‐taking and proportion of students qualifying for free or reduced price lunch is
illustrated in Table 9.
70%
39%
20%13%
8% 8% 5% 8%
0%10%20%30%40%50%60%70%80%

24
Table 9. Need for New Courses by Poverty Level of School*
Impact on Student Course‐taking
Quartiles of Proportion Qualifying for Free/Reduced Price Lunch
1st 2nd 3rd 4th All
No New Courses or Sections Needed
14 19.18
11 15.07
14 22.58
10 43.48
49 21.21
New Sections
Needed, No New Courses
12 16.44
18 24.66
15 24.19
6 26.09
51 22.08
New Courses Needed,
No New Sections 36
49.32 28
38.36 21
33.87 4
17.39 89
38.53
New Courses and New Sections Needed
11 15.07
16 21.92
12 19.35
3 13.04
42 18.18
Total 73
100.0 73
100.0 62
100.0 23
100.0 231 100.0
*Whole numbers represent numbers of respondents. Percentages are column percentages. Differences are statistically significant at the .09 level
Alignment to Standards One of our online survey questions was, “Have teachers had difficulty aligning their courses to state content standards?” We received standards?” We received 224 responses. Of the principals that answered that question, 54.0% said that teachers did not have teachers did not have difficulties aligning courses to state standards, 45.0% said that teachers had some difficulties, and 7.1% stated difficulties, and 7.1% stated that teachers were having difficulties. As seen in
Table 10, standard alignment was related to school location. While 71.4% of principals that self‐reported as
being in urban locations stated that teachers were not having difficulties aligning courses to standards, this
percentage was only 58.1% in suburban schools and 48.8% in rural schools. In addition, 23.8% of urban
principals, 32.4% of suburban principals, and 45.0% of rural principals reported some difficulties. Only 4.8% of
urban principals, 9.5% of suburban principals, and 6.2% of rural principals said that teachers had difficulties
aligning courses to state standards. There does appear to be variation in principal responses depending on
school location. Fewer urban teachers seem to have had difficulties, and rural teachers seem to have had the
most difficulties aligning courses to state standards.

25
Table 10. Alignment Issues by Geographical Area*
Have teachers had difficulty aligning courses to state standards?
No Somewhat Yes
Location
Urban (n=21)
71.4 23.8 4.8
Suburban (n=74)
58.1 32.4 9.5
Rural
(n=129) 48.8 45.0 6.2
All Locations
(n=224) 54.0 38.8 7.1
*Numbers represent row percentages
Changes in Staffing
Out of our survey respondents, 15.1% of administrators indicated that they were faced with the challenge of an
insufficient number of qualified teachers. Based on the free response answers to other questions in the survey
instrument, we concluded that principals interpreted this question in two distinct ways:
1. Did your school have enough existing teachers to staff all courses and sections required by the MMC?
2. Did your existing teachers have enough skill and content knowledge to adequately teach all courses
required by the MMC?
This difference complicates the analysis of the response to this question. Some schools may have had enough
teachers to staff all of the needed sections and courses, but those teachers were not highly skilled. Some
schools may have had highly qualified staffs, but not enough teachers for the new courses and sections they
needed to add. Judging by the weak relationship between an indicated challenge with staffing and the need to
add new sections of existing courses or new courses8, more principals may have interpreted the question in the
second manner. However, without directly re‐surveying the principals we cannot clearly identify the
8 A two‐tailed t‐test of the difference in means did not produce statistically significant differences. 19.3% of schools who needed to add new sections of existing courses indicated an insufficient number of teachers, compared with 12.4% of those who did not need new sections (p=0.1460). 13.7% of schools that needed to add new courses indicated an insufficient number of teachers, compared with 16.8% of those who did not need to add new courses (p=0.5112).

26
interpretation. Whatever the interpretation may have been, there was a strong indication that many schools
had to hire new teachers to respond to the pressures of the MMC.
Hiring new teachers can mean increased costs to the school if they find someone new to hire, or an inability to
teach required courses if they are unable to find qualified teachers to staff the courses. In interviews, ISD‐level
staff indicated that they were unaware of any difficulties finding qualified staff to teach courses, even in rural
locations. No school‐based staff indicated any hardship in finding teachers either. However, due to our
sampling method, we may have interviewed a non‐representative sample of administrators.
To test which schools indicated a challenge with staffing, we compared the poverty level of schools among the
different responses. We found that schools with higher concentrations of poverty were more likely to identify
an insufficient numbers of teachers (Table 11). These schools also tend to have a harder time hiring qualified
teachers (Jacob, 2007; Lankford, Loeb, & Wyckoff, 2002; Monk, 2007).
Table 11. Indicated Challenges by Poverty Level of School*
Challenge Quartiles of Proportion Qualifying for Free/Reduced Price Lunch
1st 2nd 3rd 4th All
Insufficient Numbers of Qual. Teachers**
4 5.26
11 14.86
14 21.54
7 30.43
36 15.13
Poor Student Preparation**
34 44.74
40 54.05
39 60.00
18 78.26
131 55.04
Classroom Space 11
14.47 11
14.86 7
10.77 5
21.74 34
14.29
Online Learning Experience
5 6.58
2 2.70
5 7.69
3 13.04
15 6.30
*Whole numbers represent numbers of respondents. Percentages are column percentages. **Differences are statistically significant at the p=0.05 level.
In addition to serving more impoverished communities, schools that indicated an insufficient number of
teachers also tended to be smaller (539 students v. 810 students; p=0.0039) and were slightly more likely to be
rural, though there was not a significant difference (p=0.3494).
A recent study by Keesler et al. (2008) indicated that up to 25% of schools in the state of Michigan could have a
potential undersupply of teachers in mathematics, compared with 7% in English, 5% in science, and 4% in social
studies given the new graduation requirements, and that these schools would tend to serve larger numbers of
students than the state average. Our data tend to suggest that smaller schools have had a greater challenge
with insufficient numbers of teachers, and that fewer schools faced the undersupply than was predicted.

27
Student Preparation
Over half of the principals surveyed (55%) indicated that one of the largest challenges they faced was in regards
to student preparation entering high school. These principals indicated that students entering their schools did
not have the prerequisite knowledge and skills to be immediately successful in the MMC without substantial
remediation and support. To test whether this assertion was based in fact, we compared the Michigan Merit
Examination scale scores in math between groups indicating various challenges (Table 12). We found that
schools who indicated an insufficient number of qualified teachers and poor student preparation had lower
average scale scores than those who did not.9 In short, schools who indicated poor student preparation as a
challenge have historically been lower‐performing. Additionally, students in these schools were more likely to
be living in poverty than students in other schools (Table 11).
Table 12. Indicated Challenges by Student Test Scores*
Challenge
MME Math Scale Score Statistically Significant? Indicated Challenge
Did Not Indicate Challenge
Insufficient Numbers of
Qualified Teachers 1091 (1.98)
1097 (0.73)
Yes (p=.0015)
Poor Student Preparation
1094 (0.95)
1099 (0.99)
Yes (p=.0003)
Classroom Space 1095
(1.65) 1096 (0.77)
No (p=.6188)
Online Learning Experience
1095 (4.19)
1096 (0.70)
No (p=.6322)
*p‐values are obtained from a two‐tailed t‐test of a difference in means; Standard errors are shown in parentheses.
Many principals also indicated that a longer period between passage of the legislation and enactment would
have been beneficial to students. When the MMC legislation was passed, the first group subject to its
requirements was already in eighth grade. As a result, while high schools had time to build higher level courses
into their curricula, middle schools had no opportunities to increase student proficiency in key areas, such as
math. These principals claimed that as the MMC continues and middle schools begin to feel pressure to reform,
student proficiency when entering high school will increase, making it easier to meet the requirements of the
curriculum. However, given the relatively small movement in student proficiency in the middle grades over the
last several years, it is difficult to discern whether this is possible without major interventions at the middle
school level.
9 Those schools that indicated that poor student preparation was not a challenge had 2009 MME Math performance in the 75th percentile. Schools that indicated it was a challenge had scores in the 56th percentile state‐wide.

28
School Resources
While at least some challenges were identified for the vast majority of schools, many principals consistently
pointed to variations in school resources as a barrier to effective implementation. In Tables 9 and 11, we
demonstrated that the poverty level of a school does have a significant impact on the challenges that school
might face. Schools with higher concentrations of poverty also tend to have lower test scores and schools with
lower‐performing students have a greater challenge meeting the requirements of the Michigan Merit
Curriculum. Higher concentrations of poverty are correlated with less state funding and a decreased ability to
generate revenue locally (Summers‐Coty, 2007). Students from lower socio‐economic backgrounds also are less
able to seek the support of supplementary education services, such as tutors and afterschool programs, which
might help offset a lack of resources at the school level.
However, aside from the effects of concentrated poverty on school resources, we were interested in the
differential impacts of school location on challenges to implementation. We compared the identified challenges
of schools to their self‐reported locations. In this analysis, we found that urban schools were significantly less
likely to have challenges with adequate classroom space than other types of schools, but significantly more likely
to have challenges meeting the requirements of the online learning experience (Table 13). Urban schools in our
sample had an average of 291 more students than other schools, and a higher concentration of poverty (a 14
percentage point increase). However, despite the concentration of poverty, these large schools tended not to
have problems finding space for their classes to meet. Additionally, urban schools tended to have more
computers per student than other types of schools, although not by a statistically significant margin. In contrast,
rural schools were significantly more likely to face challenges with classroom space than schools in other
settings. These schools tended to serve forty percent fewer students than other types of schools, and did not
face higher concentrations of poverty. As a result, it seems that smaller, rural schools are facing problems with
adequate classroom space, regardless of the poverty level of the students served. Additionally, larger, urban
schools do not have problems with adequate classroom space, but do tend to face problems with the online
learning experience requirement (despite a lower student to computer ratio).
While the issues cited here do not by any means constitute a holistic review of school resources, it does suggest
that school location and size do have an impact on the challenges an individual school faces when attempting to
implement the Michigan Merit Curriculum.
Table 13. Indicated Challenges by Geographic Area
Challenges to Implementation
Insufficient Teachers
Poor Student Preparation
Classroom Space
Online Learning Exp.
Location
Urban (n=21)
14.3 71.4 0.0* 23.8*
Suburban (n=75)
12.0 46.7 12.0 4.0
Rural
(n=132) 17.4 59.1 18.2* 4.6

29
All Locations
(n=228) 15.1 55.0 14.3 6.3
*Differences are statistically significant at p=0.05
Local Policy Concerns
Several local school officials that we spoke with indicated that the additional requirements of the MMC would
begin to place pressures on certain local policies including, but not limited to, those outlined in Table 14. While
none of our interview subjects noted that these were major concerns, they did state that they were issues that
local school boards and district offices would have to face in light of the new requirements. In many cases,
these issues have been either already discussed at the local level, or are being addressed currently. However,
since the Merit Curriculum’s implementation did have a substantive impact on these policies, they thought the
concerns were important to note in our report.
Table 14. Local Policy Concerns
Local Policy Issues
Attendance Policy
New requirements are based on mastery of content, and there is no longer time to fail a course, recover the credit, and graduate on time. If students can pass a course academically, how can LEAs fail students for not attending?
Length of School Year
With budgetary cuts, some districts have begun to offer teachers shorter school years in lieu of pay increases. With higher requirements for student mastery, how can we meet these goals in only 156 school days?
Student Discipline
Success in particular courses depends on student attendance. If students who represent behavior problems are given out of school suspension, how is a school supposed to support them in recovering the lost class time?
Local Graduation Requirements
Many local school districts have local graduation requirements that include students to complete additional work to graduate, e.g. a community service requirement. Is it still feasible for local school districts to require these additional feats from students in light of increased academic rigor?
Calculation of GPA
Students who complete Algebra I in eighth grade must receive credit for that course at their high school. However, due to variation in grading policies at middle schools and the availability of such courses, are high schools required to use eighth grade Algebra I scores in the calculation of GPAs?
Integrated Coursework The MMC allows students to receive credit for courses through integrated content in other, non‐academic courses, e.g. a CTE course. Since CTE teachers will be
30
potentially providing instruction in other content areas (math, science, etc.), do they need to meet the “highly qualified” NCLB standard for those subject areas too?
Other Issues
What qualifies as a “math‐related” course?
Is the personal curriculum a justifiably “alternative” option?
How does a high school grant credit for courses it does not control?
Responses to MMC Pressures Schools have tried different strategies to meet the requirements of the Michigan Merit Curriculum. While many
principals have stated that it is too early to see if these tactics were successful, we have summarized the various
responses that schools adopted.
Scheduling Changes
Given that the MMC placed much higher constraints on student schedules than previous curricula, many schools
have opted to simply provide more opportunities for students to earn credits by expanding the number of
courses they can complete in any given year.
Trimester System
Many high schools also adopted a trimester calendar in lieu of a semester system. This switch has several
benefits. First of all, one concern with the Michigan Merit Curriculum was its effect on electives. Because more
courses were now mandatory, students would have less freedom in choosing classes. Since the trimester
system allows students to take more classes than the semester system, switching to a trimester system can help
save room for electives in students’ schedules. One principal shared that the school now had “teachers create
new elective courses for the ‘fun’ things they may not be able to fit into the MMC.” As another principal pointed
out, trimesters “have allowed for not only more classes, but the opportunity for the struggling student to make
up failed classes within the same year to keep pace with their cohort.” In other words, if a student fails a course,
he or she would have the opportunity to retake that course in the same year and thus recover credits without
needing to spend an extra year (or years) in high school. At one high school, Algebra I is offered both as a two
trimester and a three trimester course, while Algebra II is offered either as a two trimester or a two year course.
Thus, struggling students would have the option of taking Algebra at a slower pace, while students who have
less difficulty with the coursework have more room for electives and other courses. However, not all courses at
that school offer the two or three trimester option: Advanced Placement classes remain full year courses. While
it is too early to see the impact of switching to a trimester system, this strategy does seem to allow room for
more electives and more credit recovery options.
Additional Class Periods Per Day
While switching to the trimester system was a more common strategy, a few schools adopted a seven‐hour day
instead. Like the trimester system, this tactic would allow students to take a greater number of courses,
including more electives or academic support classes.
31
Block Classes
A few schools have started block classes to help students meet Michigan Merit Curriculum standards. These
block classes are usually for ELA and math, especially Algebra. At some schools, only some of the students have
block classes. As one principal described, “We have created double block classes for students who struggle to
process new learning at the rate of their peers.” One school that adopted the Guided Academics program has
double blocks in math, ELA, or Science.
Changing Course Sequence and Timing
Some schools changed the sequence and timing of courses. For example, some schools offer geometry in 9th
grade and Algebra I in 10th grade. Other schools allow students to take Algebra I and Geometry simultaneously.
Another trend is to encourage students to take classes they would normally in high school when they are still in
middle school. For example, in one district, all students take Algebra I in 8th grade. Another district is
attempting to meet the World Language requirement at the 7th and 8th grade level so that elective classes can
still be offered in high school. Additionally, in one school environmental science shifted from being a 9th grade
required course to being integrated within the 8th grade curriculum so that all 9th graders could be enrolled in
biology. Furthermore, another district generally offers the opportunity to take high school classes in 8th grade
New and Modified Courses
Even though the goal of the MMC was to encourage students to take more rigorous courses already being
offered, many schools have created entirely new courses to support students as they complete the
requirements of the curriculum.
Two Year Algebra II
One frequent response to the Algebra II and four‐year math requirement was to offer Algebra II as a two year
course. Doing so makes the course slower‐paced, which can reduce the number of students struggling to meet
the new requirement. As one principal explained, “We have doubled the time devoted to Algebra for some
students. We restart students in the second semester who have struggled with Algebra II in the first semester.”
New Math and Science Courses
To help students meet the new requirements, many schools added new math and science course. Examples of
these courses include:
“A Personal Finance requirement for all seniors, which can count as a 4th year of math as long as the
Algebra II requirement is covered. “
“Algebra I Restart, and the creation of Conceptual Physics.”
“All freshmen now take an introductory physical science course.”
“Implementing a more basic Algebra II course and implementing Conceptual Physics to compliment the
regular (college‐bound) physics that we've offered in the past.”
“Essentials of Chemistry and Physics course in the ninth grade to help prepare students who normally
wouldn't take Chemistry or Physics”
“A senior financial strategies course as a option for senior math”

32
Alternatively, one principal shared, “Our Career Center did work to incorporate statistics into all courses so that
their senior math requirement is satisfied there. “ Such measures were in response to concerns that the math
and science class that had historically been offered would be too difficult for students that normally would not
have chosen to take additional math and science course prior to the adoption of the Michigan Merit Curriculum.
More Advanced Placement Classes
While less common than adding new math and science classes, some principals mentioned that their schools
Increased Advanced Placement course offerings, especially for junior and senior electives.
Integrating Online Learning Requirement
Though many schools mentioned the benefits of online classes, some tried to fulfill the online learning
experience requirement in other ways. For example, one school “Integrated the ‘online learning experience’
rather than having a one‐semester computer lit requirement.” Another principal shared, “We surveyed our
teachers 6‐12 re: online learning for students to ensure that all students were getting the hours required to
meet that requirement.” Thus, such schools made sure that students could complete the new online learning
standard without having to take a new course.
Online Learning
One of the requirements of the Michigan Merit Curriculum is the online learning experience. For this reason,
some schools have added classes such as “Computer 1” to help students fulfill the requirement. Other schools
have expanded their course offering using online courses so that students can fulfill all needed electives through
programs such as Apex or Nova Net. As one principal explained, the school started an “on‐line lab to expand
offerings without having to hire additional staff.” Online classes are also frequently used for credit recovery. A
popular program that many schools have adopted is E2020. At one school, there is “on‐line mastery content
recovery for just the content missed” rather than full classes. Principals also mentioned that online classes for
both electives and credit recovery are being offered both during the day and after school.
Additional Support for At‐Risk Students
A number of schools indicated that they were adjusting to the MMC requirements by offering extra support for
those students deemed most at‐risk of failure or dropouts. Specific strategies are outlined below:
Early Identification of At‐Risk Students
Some high schools are increasing communication with elementary and middle schools so that future incoming
high school students are more prepared to begin the Michigan Merit Curriculum and high school staff are more
aware of which students may need additional support. For example, one school worked with the middle school
to help identify students who are at‐risk and intervened with a summer program. One middle school also had
an at‐risk coordinator for 7th and 8th graders. Naturally, such communication is made easier at the middle and
high schools that share facilities and staff (i.e. junior/senior high schools).
Student Counseling, Mentoring, and Tutoring
Many schools offered additional student counseling, especially for at‐risk students. These interventions have
taken a few different forms:
Freshman Academy/Transition Programs

33
Guided Academics
Before and after‐school tutoring
Mandatory Math Labs for students failing math
Teacher/Student assistance program
AAI ‐ Academic and Attendance Intervention: Each week, for two hours on two different nights,
teachers facilitate tutorial sessions for students to get extra help. There are weekly "eligibility" checks
on all students, and AAI is encouraged for students that are failing.
Academic support time built into the end of the day for struggling students
Academic hold
Mentor program for at‐risk students
Seat time waiver for expelled or pregnant students
Remediation and re‐testing after‐school program
After‐school intervention program for students who are failing one or more classes on a weekly basis
Teachers “adopt” and mentor at‐risk students
Using Explore (8th grade), Explore (9th grade), and Plan (10th grade) results for early intervention and
curriculum revision
“Pyramid of intervention” approach to intervene with individual students
All of these strategies try to intervene early to help struggling students and provide academic support.
Special Classes for At‐Risk and Failing Students
Many principals also reported additional classes for at‐risk and failing students. These include academic support
classes, Guided Academic classes, remediation classes, credit recovery classes, and focus‐study skills classes.
Summer School
Several principals mentioned that summer school was another way that they were helping students adjust to
the Michigan Merit Curriculum. One noted that summer school was for math, while another said that the
number of summer school options had increased. A different principal stated, “Since our county is number 1 in
unemployment, there is no cost for summer school.”
Student and Parent Outreach
Outreach to Parents and Students
Several principals mentioned doing outreach with students and parents. For example, one school held a
Freshman Orientation, which was “a night for parents and students to learn about MMC among other things,
preparing them for high school.”
Letters Suggesting Alternative Education
As one principal described, “We have an Alt. ed. program (Pioneer High School) and we use it for students falling
behind to the extent that they cannot graduate with their peers. Letters urging parents to consider alt. ed. are
sent to those falling behind at end of each semester.” Thus, families are informed of educational opportunities
that might be better for their children.
34
Teacher Support and Changes in Teaching Methods
Test Preparation and Continuous Assessments
As part of the transition to the Michigan Merit Curriculum, many schools are developing common assessments,
and, in some cases, developing databases to better record student performances. Furthermore, assessments
are becoming more common—one principal reported “ACT and MME‐like assessments year‐round and on a
weekly basis.” Many school principals also shared that they have implemented more classes related to test
preparation, including some specifically targeted towards the ACT and MME.
Common Planning and Support
Many school principals have also reported more common planning of curricula, both within and across academic
disciplines. To facilitate common planning, districts and schools have helped allocate time for teachers to meet
and work together. Teachers have also generally begun to support each other more. As one principal shared,
“Teachers are also beginning to go into other teachers' classrooms during their own prep periods to assist. We
are building common planning time for our staff for data analysis and planning.” In addition, another principal
wrote, “I meet quarterly with all of my departments to look at the data and curriculum. We use student grades,
common assessments, etc.” There is also a trend towards adopting the “Professional Learning Communities”
model, which encourages teachers to share best practices.
Team Teaching
Many school principals also reported an increase in team‐teaching in order to help special education students.
This strategy usually involves teaming a general education teacher with a special education teacher for classes
that are a combination of general and special education students. As one principal shared, this practice “has
added a different dimension to the classes and to the expertise of our special education staff.” Another
principal whose school has a long history of team teaching wrote, “We have been involved with Co‐Teaching for
20 years. Our staff works hard to differentiate instruction to meet the needs of all learners on every level.“
Professional Development
Many principals reported additional teacher training in preparation for the Michigan Merit Curriculum. For
example, one principal shared, “ALL math teachers have completed Algebra I and Algebra II training to expose
them to new ways of teaching mathematics using technology and manipulatives ‐ this training was offered by
the Macomb Intermediate School District to all county teachers.”
Preemptive Application of Standards
A few schools preemptively applied the Michigan Merit Curriculum to earlier cohorts. As one principal shared,
“We required students in the year 2008‐2009 to follow the MMC. We then responded to potential problems in
scheduling and graduation credit issues.” Thus, this trial run helped the school anticipate any issues that could
arise when the Michigan Merit Curriculum actually became mandatory.
New Textbooks
Some schools also mentioned that they needed to invest in new textbooks to better implement the Michigan
Merit Curriculum. One principal shared that the school spent $250,000 on textbooks. Another principal
mentioned that when school staff were aligning curriculum, they also got new textbooks where necessary. In
particular, one principal mentioned that new high school math textbook series had been needed.

35
Administrator Attitudes Toward the Michigan Merit Curriculum The Michigan Merit Curriculum frequently led to strong feelings among administrators, but these reactions
varied across principals. Most reactions can be summarized by the following:
1. The Michigan Merit Curriculum was a very negative experience and was not a good policy.
“It is unrealistic to believe that the State can legislate students to pass Algebra II and other more
advanced classes. You cannot legislate student achievement!”
“The MMC had taken local control from school districts, and has created a "one size fits all" approach to
education in Michigan.”
2. The Michigan Merit Curriculum was a good idea and is working well.
“I fully support the higher course standards and see it as a way for all of our students to be successful at
some point in the future. Our culture has changed from a manufacturing base to an information/service
based economy. If we do not prepare our students for this kind of global economy, we are only
shortchanging them.”
“In general, I am very supportive of the new graduation requirements, and believe that they will have positive results for our students.”
3. The Michigan Merit Curriculum was a good idea, but there could be improvements in implementation.
“Stay consistent and develop different pathways, so students who have differing learning styles have the
ability to graduate from high school with a state endorsed diploma.”
“We need the State to provide quality end of the course assessments for every MMC class and it has to
be aligned to the ACT. If we had this, it would allow us to work backward to create proper pacing guides
and concept maps for each course. As it stands, Districts are creating their own assessments‐ many of
which are not of high quality and their results on the MME show it.”
“Too politically motivated ‐ decisions were made because lawmakers wanted Michigan to lead the
nation with respect to academic requirements, but the applying these requirements to all students is
not necessarily in the best interest of all students. The personal curriculum component is a mess. While
the idea behind it is a good one, the practicality of its implementation is not there.”
“For the most part, this is an excellent change for our kids and our state. We are struggling now, due to
the budget reductions, to provide electives for students. We are bound by the MMC, but our schedule
is changing next year to save money and freshmen will have difficult choices and few options outside of
the basic MMC. We lose out when students can't take art and music. Our state and our country suffer
because of lack of creativity and innovation, yet we are weakening our position more than ever because
of the choices we are forced to make in this budget crisis.”
“I don't have a problem with the state asking for a tougher curriculum. The only item I would like to see
removed is Algebra II. Otherwise no problem of what is being asked.”

36
Conclusion Our survey findings suggest that the Michigan Merit Curriculum has led to widespread changes in high school
course offerings and student course‐taking. Based on data from Macomb County, it appears that while these
new standards have led to increased course failure rates, the enrollment rates in more challenging courses have
grown substantially more than the increases in failure rates. Thus, while the new curriculum is detrimental to
some students, most students that are now taking more challenging classes are doing relatively well.
Schools have encountered a number of challenges when attempting to implement the Michigan Merit
Curriculum, such as insufficient qualified teachers, poor student preparation, and inadequate funding and
resources. These are often partly tied to other factors, such as poverty rates and geographic location. To meet
the challenges of the Michigan Merit Curriculum, schools have tried several strategies, including altering
scheduling, adding and modifying courses, providing additional support to at‐risk students, conducting outreach
to students and teachers, providing additional teacher support, and changing teaching methods.
Administrator attitudes to the Michigan Merit Curriculum have been mixed. While some administrators are
frustrated with the new standards, others have expressed support. By far, most administrators indicated
support for more stringent graduation requirements, but suggested changes in implementation such as better
funding, removing the Algebra II requirement, and the addition of other curriculum and certification tracks.

37
Works Cited ACT. (2009). ACT Profile Report ‐ State. Retrieved October 1, 2009, from ACT.org:
http://www.act.org/news/data/09/pdf/states/Michigan.pdf
Chaney, B., Burgdorf, K., & Atash, N. (1997). Influencing achievement through high school graduation
requirements. Educational Evaluation and Policy Analysis , 19 (3), 229‐244.
Clune, W. (1989). The implementation and effects of high school graduation requirements: First steps toward
curriculum reform. New Brunswick, NJ: Rutgers University, Center for Policy Research in Education.
Clune, W., & White, P. (1992). Education reform in the trenches: Increased academic course taking in high
schools with lower achieving students in states with higher graduation requirements. Educational Evaluation
and Policy Analysis , 14 (1), 2‐20.
Education Commission of the States. (2007, March 23). Standard High School Graduation Requirements (50‐
state). Retrieved October 12, 2009, from Education Commission of the States:
http://mb2.ecs.org/reports/Report.aspx?id=735
Goodman, J. (2009). The Labor of Division: Returns to Compulsery Math Coursework.
Jacob, B. A. (2001). Getting tough? The impact of high school graduation exams. Educational Evaluation and
Policy Analysis , 23 (2), 99‐121.
Jacob, B. A. (2007). The Challenges of Staffing Urban Schools with Effective Teachers. The Future of Children , 17
(1), 129‐153.
Johnson, R. (1995). How to: A high school fine arts graduation requirement. Art Education , 48 (4), 8‐10.
Jones, L., Davenport, E. J., Bryson, A., Bekhuis, T., & Zwick, R. (1986). Mathematics and science test scores as
related to courses taken in high school and other factors. Journal of Educational Measurement , 197‐208.
Keesler, V., Wyse, A., Jones, N., & Schneider, B. (2008). Calculating the ability of within‐school teacher supply to
meet the demands of new requirements: The example of the Michigan Merit Curriculum. Institute of Education
Sciences, Regional Education Laboratory Southwest. Washington, DC: U.S. Department of Education.
Lankford, H., Loeb, S., & Wyckoff, J. (2002). Teacher Sorting and the Plight of Urban Schools: A Descriptive
Analysis. Educational Evaluation and Policy Analysis , 24 (1), 37‐62.
Lee, V. E., Croninger, R. G., & Smith, J. B. (1997). Course‐taking, equity, and mathematics learning: Testing the
constrained curriculum hypothesis in U.S. secondary schools. Educational Evaluation and Policy Analysis , 19 (2),
99‐121.
Michigan Department of Education. (2006a). High school content expectations. Lansing: Author.
Michigan Department of Education. (2006b). New proposed graduation requirements will prepare students for
life in the 21st century. Leading Change , p. 1.

38
Michigan Department of Education. (2006c). Preparing Michigan students for work and college success. Lansing,
MI: Author.
Monk, D. H. (2007). Recruiting and retaining high‐quality teachers in rural areas. The Future of Children , 17 (1),
155‐174.
Office of Revenue and Tax Analysis. (2002). School finance reform in Michigan: Proposal A retrospective. Lansing:
Author.
Reinstadler, K. (2009, October 19). Granholm's school funding cuts harsher for some Michigan districts, more
reductions on horizon. Retrieved November 19, 2009, from MLive.com: http://www.mlive.com/news/grand‐
rapids/index.ssf/2009/10/granholms_school_funding_cut_h.html
Schiller, K., & Muller, C. (2000). External examinations and accountability, educational expectations, and high
school graduation. American Journal of Education , 108 (2), 73‐102.
Schiller, K., & Muller, C. (2003). Raising the bar and equity? Effects of state high school graduation requirements
and accountability policies on students' mathematics course taking. Educational Evaluation and Policy Analysis ,
25 (3), 299‐318.
Sebring, P. (1987). Consequences of differential amounts of high school course work: Will the new graduation
requirements help? Educational Evaluation and Policy Analysis , 258‐273.
Sevlin, M., Oakes, J., Hare, S., Ramsey, K., & Schoeff, D. (1990). Who gets what and why: Curriculum
decisionmaking at three comprehensive high schools. Santa Monica: The RAND Corporation.
Sheehan, K. (2001). E‐mail survey response rates: A review. Journal of Computer‐Mediated Communication , 6
(2).
Sipple, J., Killeen, K., & Monk, D. (2004). Adoption and adaptation: School district responses to state imposed
learning and graduation requirements. Educational Evaluation and Policy Analysis , 143‐168.
Spillane, J., & Jennings, N. (1997). Aligned instructional policy and ambitious pedagogy. Teachers College Record ,
449‐481.
Steptoe, S. (2006, December 12). Building a new student in Michigan. TIME Magazine .
Summers‐Coty, K. (2007). Per‐Pupil Funding Gaps and Equity in School Aid. Lansing: Michigan Senate Fiscal
Agency.
Teitelbaum, P. (2003). The influence of high school graduation requirement policies in mathematics and science.
Educational Evaluation and Policy Analysis , 31‐57.

39
Appendix A. In‐Person Interview Questionnaire
Part I. Implementation of the Curriculum
1. To what extent has the MMC changed the courses offered in schools?
2. Has the MMC changed course‐taking patterns in schools?
Part II. Alignment of the Curriculum
1. How closely do newly required courses mirror the state High School Content Expectations, especially in
advanced courses like Algebra II?
2. What local supplements have been put in place to help teachers align their course offerings to the state
standards?
3. Do you believe proper alignment is more/less of an issue in a(n) urban/suburban/rural district because
of the population being served?
Part III. Challenges to Implementation
1. What are the major challenges your school/district/ISD faced when implementing the MMC?
2. Did your school/district/ISD face challenges in any of the following areas when implementing the MMC?
a. Staffing subjects, especially math and science
b. Space constraints
c. Meeting the requirements of the online learning experience
d. Poor preparation in the early and middle grades for higher level content in high school
3. How has your school/district/ISD responded either proactively or retroactively to address/avoid those
challenges?
Part IV. Other Comments
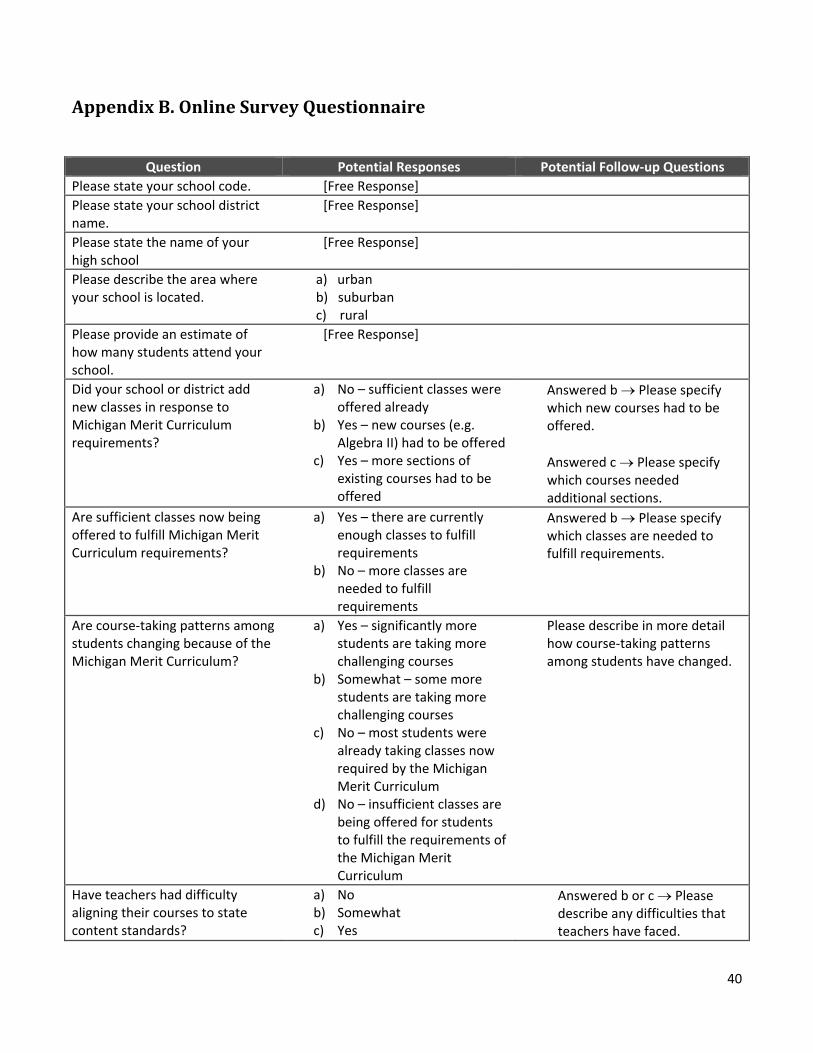
40
Appendix B. Online Survey Questionnaire
Question Potential Responses Potential Follow‐up Questions
Please state your school code. [Free Response]
Please state your school district name.
[Free Response]
Please state the name of your high school
[Free Response]
Please describe the area where your school is located.
a) urban b) suburban c) rural
Please provide an estimate of how many students attend your school.
[Free Response]
Did your school or district add new classes in response to Michigan Merit Curriculum requirements?
a) No – sufficient classes were offered already
b) Yes – new courses (e.g. Algebra II) had to be offered
c) Yes – more sections of existing courses had to be offered
Answered b Please specify which new courses had to be offered.
Answered c Please specify which courses needed additional sections.
Are sufficient classes now being offered to fulfill Michigan Merit Curriculum requirements?
a) Yes – there are currently enough classes to fulfill requirements
b) No – more classes are needed to fulfill requirements
Answered b Please specify which classes are needed to fulfill requirements.
Are course‐taking patterns among students changing because of the Michigan Merit Curriculum?
a) Yes – significantly more students are taking more challenging courses
b) Somewhat – some more students are taking more challenging courses
c) No – most students were already taking classes now required by the Michigan Merit Curriculum
d) No – insufficient classes are being offered for students to fulfill the requirements of the Michigan Merit Curriculum
Please describe in more detail how course‐taking patterns among students have changed.
Have teachers had difficulty aligning their courses to state content standards?
a) No b) Somewhat c) Yes
Answered b or c Please describe any difficulties that teachers have faced.
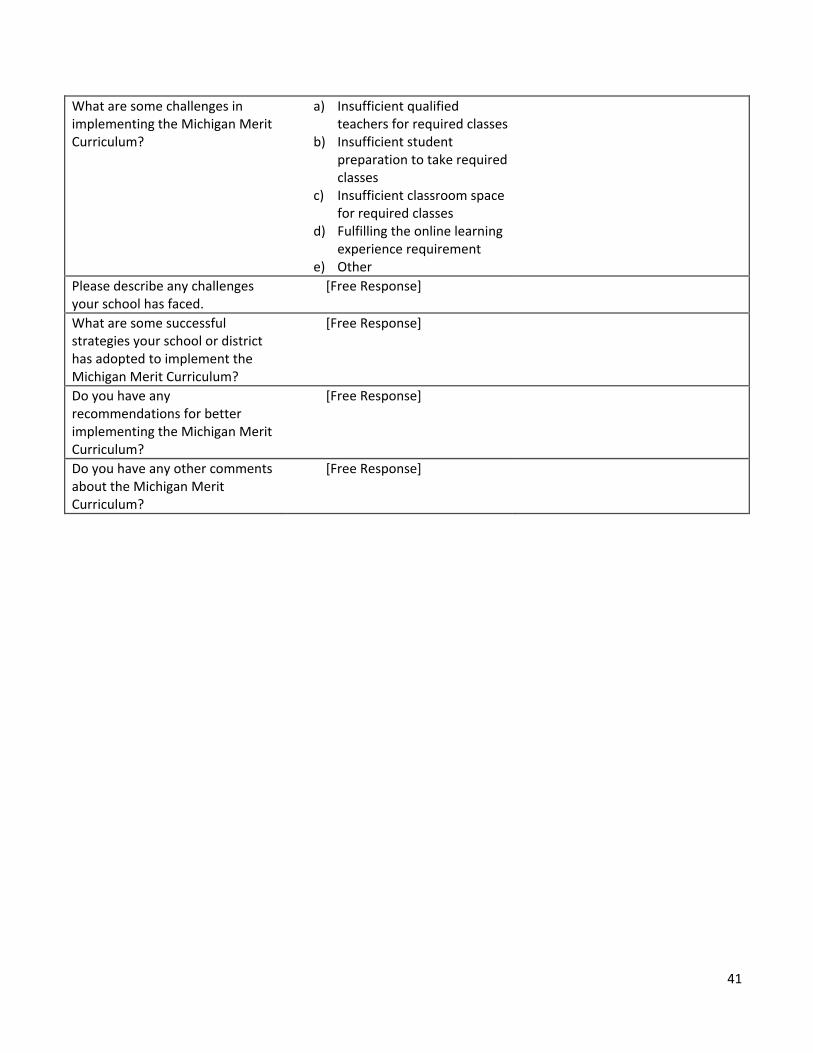
41
What are some challenges in implementing the Michigan Merit Curriculum?
a) Insufficient qualified teachers for required classes
b) Insufficient student preparation to take required classes
c) Insufficient classroom space for required classes
d) Fulfilling the online learning experience requirement
e) Other
Please describe any challenges your school has faced.
[Free Response]
What are some successful strategies your school or district has adopted to implement the Michigan Merit Curriculum?
[Free Response]
Do you have any recommendations for better implementing the Michigan Merit Curriculum?
[Free Response]
Do you have any other comments about the Michigan Merit Curriculum?
[Free Response]