Embed Size (px)
Citation preview
Mandated Disclosure and Stock Returns: Evidence from the Over-the-Counter Market
Allen Ferrell
2004
RPP-2004-04
Regulatory Policy Program
Center for Business and Government John F. Kennedy School of Government
79 John F. Kennedy Street, Weil Hall Cambridge, MA 02138
Citation This paper may be cited as: Ferrell, Allen. 2004. “Mandated Disclosure and Stock Returns: Evidence from the Over-the-Counter Market" Regulatory Policy Program Working Paper RPP-2004-04 Cambridge, MA: Center for Business and Government, John F. Kennedy School of Government, Harvard University. Comments may be directed to the authors.
Regulatory Policy Program The Regulatory Policy Program at the Center for Business and Government provides an environment in which to develop and test leading ideas on regulation and regulatory institutions. RPP’s research aims to improve the global society and economy by understanding the impacts of regulation and creating better decisions about the design and implementation of regulatory strategies around the world. RPP’s efforts are organized around the following three core areas: regulation, markets, and deregulation; regulatory instruments; and regulatory institutions and policymaking. The views expressed in this paper are those of the author and do not imply endorsement by the Regulatory Policy Program, the Center for Business and Government, the John F. Kennedy School of Government, or Harvard University.
For Further Information Further information on the Regulatory Policy Program can be obtained from the program’s director, Jennifer Nash, Center for Business and Government, John F. Kennedy School of Government, 79 JFK Street, Cambridge, MA 02138, telephone (617) 384-7325, telefax (617) 496-0063, Email [email protected].
1
MANDATED DISCLOSURE AND STOCK RETURNS:
EVIDENCE FROM THE OVER-THE-COUNTER MARKET
Allen Ferrell
Harvard Law School Cambridge, MA 02138
2
JEL: G18, G38, K22
MANDATED DISCLOSURE AND STOCK RETURNS:
EVIDENCE FROM THE OVER-THE-COUNTER MARKET
ALLEN FERRELL*
Abstract Mandated disclosure requirements placed on publicly-traded firms constitute the core of U.S. securities regulation. Despite their importance, few empirical studies have been done on the impact of mandated disclosure requirements on the capital markets. Using a unique database created for this study, this paper examines the impact the 1964 imposition of mandated disclosure requirements had on the over-the-counter market in terms of stock returns, volatility and stock price synchronicity. Despite this being the only fundamental change in the scope of mandated disclosure in the U.S. in the twentieth century – with the exception of the initial securities acts of the 1930s – this regulatory change has never been examined. This study finds that there was a dramatic reduction in the volatility of OTC stock returns associated with the imposition of mandated disclosure. At the same time, there was no change stock price synchronicity associated with mandated disclosure. The evidence on stock returns is inconclusive but suggestive of a positive abnormal associated with mandated disclosure.
* Assistant Professor of Law, Harvard Law School. I would like to thank Krishna Rao, Robert Schroeder and Rose Zhao for their outstanding research assistance, helpful comments from participants in the American Law and Economics Association Conference, Stanford/Yale Junior Faculty Conference, the Babson Business School Economics Workshop, the Boalt Law and Economics Workshop, the Kennedy School’s New Directions in Regulation Seminar, University of Michigan Law and Economics Workshop, the MIT finance lunch workshop and the Harvard Law and Economics Workshop and helpful comments and conversations from Lucian Bebchuk, Victor Chernozhukov, John C. Coffee, Cary Coglianese, Andrew Guzman, Henry Hansmann, Howell Jackson, Louis Kaplow, Elizabeth Keating and Paul Zarowin. I would also like to thank the Harvard Law School John M. Olin Center for Law, Economics and Business for its financial support.
3
MANDATED DISCLOSURE AND STOCK RETURNS:
EVIDENCE FROM THE OVER-THE-COUNTER MARKET
ALLEN FERRELL
@2003 Allen Ferrell. All Rights Reserved
I. INTRODUCTION
The organizing principle of U.S. securities regulation in the twentieth century is
the belief that mandated disclosure of firm-specific information enables capital markets
to function efficiently and in the interests of all investors. (Securities Act of 1933;
Exchange Act of 1934). The regulatory response to recent corporate scandals has been to
focus once again on the presumed importance of full, mandatory disclosure (Sarbanes-
Oxley Law, 2002). This regulatory stance, now widely emulated around the world, raises
the fundamental question of the role mandated disclosure should play in capital market
regulation. Surprisingly, there has been relatively little work attempting to answer this
question based on the actual effects of mandated disclosure on the capital markets.
The empirical work that has been done, most importantly the studies of the impact
of the Securities Act of 1933 and the Exchange Act of 1934 on the financial markets
(Stigler 1964; Benston 1973; Simon 1989), has been heavily relied upon by academics in
making policy recommendations on the desirability of mandated disclosure (Romano
1998). Unfortunately, these studies suffer from the need to control for changing market
conditions over the time period they study (notably the advent of the Great Depression).
Moreover, these studies use measures which might not adequately capture the effect
mandated disclosure has on how well the capital markets are functioning (Coffee 1984).
This paper presents empirical evidence, based on a unique database created for
this study, suggesting that mandated disclosure did have a measurable impact. We
measure the effect that the imposition of mandated disclosure on the over-the-counter
market (OTC), first required in 1964, had on the informational efficiency of that market.
Informational efficiency, as used in this paper, refers to the informational content of a
4
security market’s prices. An increase in informational efficiency represents an increase
in the informational content of securities prices, and, hence, helps ensure that capital
allocated based on stock prices is done so more efficiently.
It is fair to say that a shortcoming of the empirical literature on mandated
disclosure (Stigler 1964; Benston 1973; Simon 1989) has been its relative lack of theory
informing its choice of statistical testing. While there are a handful of serviceable
theoretical models, the theoretical justification for using particular tests has typically been
informal.1 As a result of this theoretical gap, this paper will use as many as of the proxies
for informational efficiency identified in the literature as possible to test the robustness of
any findings. In order to measure changes in the informational efficiency of the OTC
market, we employ several different proxies for informational efficiency that have been
developed in the financial econometric literature (Roll 1988; Simon 1989; Morck et al
2000; Durnev et al 2001a, Durnev et al 2001b).
The extension of mandated disclosure to the OTC market represented a
fundamental change in the scope of mandated disclosure under U.S. securities law. The
only other fundamental change in the scope of mandated disclosure in the twentieth
century was the original Securities Acts themselves: the Securities Act of 1933 and the
Exchange Act of 1934. These Acts placed extensive mandated disclosure requirements on
exchange-listed companies. There have been other changes in the coverage of mandated
disclosure requirements over the years, but none of the same fundamental importance as
these two. This imposition of mandated disclosure on non-exchange listed securities –
the OTC market – has never been studied.
This study has several advantages over earlier studies. First, and most
importantly, exchange-listed companies form a natural control group as they were subject
to the disclosure requirements of the Exchange Act of 1934 throughout the time period
studied (1962-1968). Second, the capital markets in the 1962-68 period did not suffer a
shock anywhere near as dramatic as that of the Great Depression. Third, there are
theoretical reasons, with empirical backing, for believing that if there were to be effects
caused by mandated disclosure on the capital markets, such effects would be most
1 See Bebchuk & Ferrell, Rational Pricing and the R2 of Stocks, Work in Progress (modeling relationship between informational efficiency and R2)
5
powerfully felt in the less-liquid, less-followed OTC market (Simon 1989). The private
market sources of financial information are likely to be less extensive in such a
marketplace. In contrast, the New York Stock Exchange in the 1920s, the time period
immediately prior to exchange-listed company mandated disclosure requirements, was a
well-developed marketplace with deep liquidity.
Part II of this paper will provide a brief discussion of the existing empirical
literature on mandated disclosure. Part III will then describe the imposition of mandated
disclosure by the Securities Acts Amendments of 1964 on the OTC market. The database
that was created to study the effect of mandated disclosure on the OTC market will be
described in Part IV. Some summary statistics describing OTC firms pre- and post-
mandated disclosure are provided in Part V.
Part VI then investigates the effect of mandated disclosure on the distribution of
abnormal returns both over time and cross-sectionally; two findings emerge from this
analysis. First, relative to the listed market, average OTC stock volatility both cross-
sectionally and over time fell substantially after the imposition of mandated disclosure.
Second, in the post-mandated disclosure period the OTC and listed market behaved in a
far more parallel manner than was the case in the pre-mandated disclosure period. A
variety of statistical techniques are used in this part to measure volatility, all of which
support these two basic findings.
The effect of mandated disclosure on stock return synchronicity measures are
discussed in Part VII. There was no discernable change in the overall average stock
return synchronicity attributable to mandated disclosure. However, the results suggest
that there are reasons to believe that average stock return synchronicity measures, which
have been used in cross-country studies, are an inappropriate proxy for informational
efficiency in this context. On the other hand, the results do indicate that in the post-
mandated disclosure period, the OTC and listed markets behaved in a more parallel
manner along the dimension of stock return synchronicity.
Finally, changes in average and median stock returns resulting from mandated
disclosure are examined in Part VIII. Using this measure, mandated disclosure had no
clear impact on the OTC market but there is suggestive evidence that there were
beneficial effects.
6
II. THE EXISTING EMPIRICAL LITERATURE
George Stigler’s 1964 study marked the first attempt to study the empirical impact
of the Securities Acts on the performance of the capital markets. Stigler examined two
groups of new share issues: a pre-mandated disclosure group of new share issues (1923-
28) and a post-mandated disclosure group of new share issues (1949-55). He found that
the returns on securities post-mandated disclosure was the same as that of the pre-
mandated disclosure group. Second, he found that the variance of the post-mandated
disclosure group’s stock returns fell by approximately half. Stigler interpreted these
findings as consistent with the view that mandated disclosure had no beneficial effect.
In his influential 1973 study, Benston divided New York Stock Exchange (NYSE)
companies pre-1934 (pre-mandated disclosure) into two groups: 193 companies which he
claims did not disclose sales information and a second group of 314 companies which did
disclose sales information even though there was no statutory obligation to do so in the
pre-mandated disclosure period. He found that there was little difference between the
two groups both pre- and post- mandated disclosure even when employing several
different measures. His main result was that the two groups of companies have virtually
the same average monthly stock price residuals – and the same distribution of stock price
residuals – throughout both the pre- and post-mandated disclosure period (p.146-147).2
Carol Simon subsequently reproduced Stigler’s result (and confirmed in Benston’s study)
that there was a substantial reduction in the variance of stock price residuals in the post-
mandated disclosure period (Simon 1989).3
The policy implications of the finding in both the Benston and Stigler study of
reduced variance of stock prices (or residuals) has been extensively debated (Seligman
1983; Coffee 1984; Romano 1998; Fox 1999). But there is the threshold question of
whether the reduction in variance was caused by the Securities Acts as defenders of
mandated disclosure contend (Friend & Westerfield 1975) or resulted from the impact of
the Great Depression, as Benston (1975) claims. It is extraordinarily difficult to
2 Residuals were calculated for each company’s stock in Benston’s study using a market model. 3 Residuals were calculated for each company’s stock in Simon’s study using a model more sophisticated than the market model, enabling her to take into account effects such as that of firm size on stock prices.
7
adjudicate this debate convincingly given the econometric evidence indicating that the
Great Depression did have a profound effect on the capital markets, including variance.
Simon found, for instance, that the market as a whole experienced a forty-five percent
reduction in variance during the Great Depression. (1989, p.309)
Conceivably the effects of the Great Depression and the Securities Acts could be
disentangled if a good control group were available. Benston’s group of 314 companies
which purportedly disclosed sales information voluntarily pre-mandated disclosure would
arguably serve this function. The problems with using this group as a control are serious
however. First, several commentators have noted that many firms in the non-disclosing
group of 193 companies did, in fact, disclose basic financial information, such as net
income and balance sheet data. (Friend & Westerfield 1975) Second, commentators have
argued that the important change wrought by the Securities Acts was primarily in the
liability imposed for fraud and non-disclosure given the arguably poor quality of
voluntary disclosures even when made (Fox 1999). The increased exposure to liability
for inadequate disclosure would have affected both groups of companies. Both these
criticisms raise the question of whether measuring the differential effect that the
disclosure requirements of the Securities Acts had on Benston’s two groups is a good
measure of the acts’ overall effect on the capital markets. If the two groups Benston uses
are not all that different, then the differential effect of the Securities Acts on these two
groups would not serve as a good measure of the Acts’ overall effect.
The question of how to measure the Securities Acts’ overall effect highlights the
fundamental problem that plagues all econometric studies (Stigler 1964; Benston 1973;
Jarrell 1984; Simon 1989) of the Securities Act of 1933 and the Exchange Act of 1934.
These studies need to disentangle the effects of the Great Depression on the capital
markets from any effect caused by the Securities Acts. It is difficult to do this in a
convincing manner.
This paper’s examination of the extension of mandated disclosure requirements to
the OTC market in 1964 does not suffer from this problem for the simple reason that
there exists a natural control group. The control group is simply the exchange-listed
companies which had been subject to the Exchange Act’s disclosure requirements for
some thirty years, beginning in 1934. Second, although less importantly, the time period
8
of this study – 1962-68 – does not contain a traumatic stock market event anywhere on
the same order as that of the Great Depression.
III. THE OTC MARKET AND THE SECURITIES ACTS AMENDMENTS OF 1964
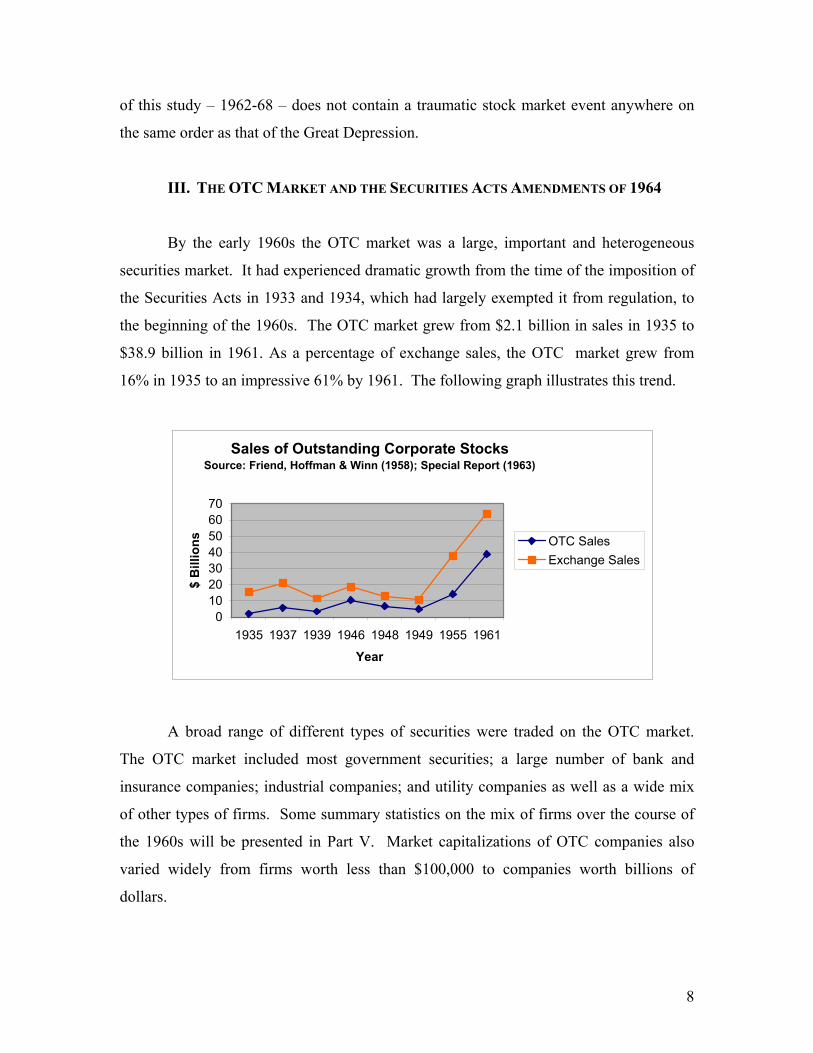
By the early 1960s the OTC market was a large, important and heterogeneous
securities market. It had experienced dramatic growth from the time of the imposition of
the Securities Acts in 1933 and 1934, which had largely exempted it from regulation, to
the beginning of the 1960s. The OTC market grew from $2.1 billion in sales in 1935 to
$38.9 billion in 1961. As a percentage of exchange sales, the OTC market grew from
16% in 1935 to an impressive 61% by 1961. The following graph illustrates this trend.
Sales of Outstanding Corporate StocksSource: Friend, Hoffman & Winn (1958); Special Report (1963)
010203040506070
1935 1937 1939 1946 1948 1949 1955 1961
Year
$ B
illio
ns OTC SalesExchange Sales
A broad range of different types of securities were traded on the OTC market.
The OTC market included most government securities; a large number of bank and
insurance companies; industrial companies; and utility companies as well as a wide mix
of other types of firms. Some summary statistics on the mix of firms over the course of
the 1960s will be presented in Part V. Market capitalizations of OTC companies also
varied widely from firms worth less than $100,000 to companies worth billions of
dollars.
9
In 1963, the REPORT OF SPECIAL STUDY OF SECURITIES MARKETS, a highly
influential and groundbreaking Securities and Exchange Commission (SEC) study of the
state of securities regulation, was completed. It reported that ninety-three percent of all
the cases of fraud reported by the SEC between January 1961 and July 1962 involved
companies that were not subject to the Exchange Act’s disclosure requirements. The
REPORT OF SPECIAL STUDY also examined approximately 20% of all OTC companies,
randomly selected from the OTC market, with an eye to their disclosure practices. It
found that twenty-five percent of OTC companies did not disseminate any financial
information to shareholders. Of those that did distribute financial data, forty-four percent
failed to provide any breakdown of their inventories into categories. Thirty-three percent
of firms failed to provide any explanatory notes detailing such important items as
depreciation methods, contingent liabilities or long-term contractual obligations. Finally,
twenty-three percent of OTC companies did not certify their financial reports.
Based on these findings, the REPORT OF SPECIAL STUDY concluded that most OTC
companies “either make no reports to shareholders at all or their reports are meager and
inadequate.” (p.10, Part III). The REPORT found this to be true despite the fact that there
were a minority of OTC companies, some of whom were included in its survey of
disclosure practices, which had some reporting requirements pursuant to Section 15(d) of
the Exchange Act.4 The REPORT recommended that the Exchange Act’s disclosure
requirements be extended to the vast majority of OTC companies. Legislative action
quickly followed. On August 20, 1964, the 1964 Securities Acts Amendments were
signed into law. The purpose of the amendments, reflecting the analysis and
recommendations of the REPORT, was to “afford investors in publicly-held companies
whose securities are traded over-the-counter the same fundamental disclosure protections
as have been provided to investors in companies whose securities are listed on an
exchange” (SEC 1964).
The 1964 amendments placed on OTC companies the same extensive mandated
disclosure requirements as those placed on exchange-listed companies. The amendments
added section 12(g) to the Exchange Act of 1934. This section requires OTC companies
4 Section 15(d) requires disclosures of companies that issued securities after 1936 assuming that the firm’s market capitalization exceeded a certain threshold.
10
with more than $1 million in assets and held by more than 750 shareholders to comply
with the Exchange Act’s periodic disclosure requirements. Section 12(g) does exempt
certain types of OTC companies from these requirements. These include “investment
companies,” such as mutual funds, section 12(g)(2)(B), and insurance companies subject
to comparable state regulation, section 12(g)(2)(G). “Investment companies,” although
exempt from section 12(g), already had, by 1964, substantial disclosure requirements
under the Investment Company Act of 1940. Banks are not exempted from the Exchange
Act’s requirements, but the administration and enforcement of the disclosure
requirements are vested in the federal banking agencies rather than the SEC.
The Exchange Act’s periodic disclosure requirements, to which OTC companies
were subject after the 1964 amendments, include the need to file, pursuant to section 13
of the Exchange Act, the now-familiar panoply of periodic reports: the annual report
(form 10-K), quarterly reports (form 10-Q) and when certain specified events occur, a
current report (form 8-K). The information contained in these reports includes such items
as certified annual balance sheets, acquisition or sale of a significant amount of assets,
quarterly cash flow statements and semiannual profit and loss statements. Under section
18 of the Exchange Act, any person who makes a statement in an Exchange Act
disclosure document that is “false or misleading with respect to any material fact” is
liable to any person who buys or sells securities in reliance on such a statement and at a
price affected by such a statement. In addition to periodic disclosure requirements, the
Exchange Act’s proxy solicitation and trading regulations were extended to non-exempt
OTC companies meeting the threshold requirements of $1 million in assets and a
shareholder base of 750.
The effective date specified in the statute of the new reporting requirements
contained depended on the OTC company’s fiscal year. Companies had to comply with
the new disclosure requirements within one hundred and twenty days after the last day of
its first fiscal year ending after July 1, 1964. Accordingly, the earliest point at which an
OTC company was subject to the new disclosure requirements under the statute was
November 1, 1964. The SEC, however, granted a reprieve from the statutory deadline
allowing companies to file as late as April, 1965 if they so choose. If an OTC company’s
fiscal year began at the start of the calendar year, that company would be subject to the
11
new disclosure requirements as of May 1, 1965. This study will assume (as was in fact
the case) that throughout 1965 the reports required by the Securities Acts Amendments
were first filed by OTC firms. The empirical results, however, do not hinge on using this
particular date. The results remain the same whether one uses a somewhat different
starting point.
IV. THE DATABASE
The Center for Research in Securities Prices’ database (CRSP) does not include
information on the OTC market pre-NASDAQ. As a result, it was necessary to construct
a database containing the necessary information on OTC companies. The database
contains a number of pieces of information on OTC companies from January 1, 1962 to
January 1, 1968. This period covers three years prior to the imposition of mandated
disclosure on the OTC market (January 1, 1962 to January 1, 1965) and three years after
their imposition (January 1, 1965 to January 1, 1968).
The database contains information on companies that were either “primary” or
“Eastern” OTC companies as of January 1, 1962. The “primary” and “Eastern” OTC
companies, as designated by the Barron’s Statistical Section, were OTC stocks in which
there was relatively active trading and had at least 500 shareholders. In contrast, OTC
companies in the “supplemental” section of the Barron’s Statistical Section were not as
actively traded and did not need to meet the 500 shareholder threshold. Based on data
gathered by the REPORT OF SPECIAL STUDY, which counted the number of OTC
companies with different shareholder bases (Table IX-C, Part III), approximately 85% of
the “primary” and “Eastern” companies met the Exchange Act’s 750 shareholder
threshold with the other 15% having somewhere between 500 and 750 shareholders.
It is worth emphasizing that the companies on these two lists are actively traded
suggesting that even if a company, at a particular point of time, has somewhere between
500 and 750 shareholders, there is the real possibility that at some other point in time
(whether earlier or later) the 750 shareholder threshold would be, at least temporarily,
crossed. Once that threshold is crossed, a company is subject to the Exchange Act’s
disclosure requirements regardless of whether the company knows it crossed the
12
shareholder threshold. Once a company has more than 750 shareholders at a particular
point in time, that company is subject to the Exchange Act’s requirements unless its
shareholder base falls below 300 shareholders. As a result, it would be highly unlikely
for a company with actively traded securities and more than 500 shareholders not to
comply with the Exchange Act’s disclosure requirements and thereby risk running afoul
of the Exchange Act. It is therefore reasonable to assume that the remaining 15% of
OTC companies would, in reality, be placed under the ambit of the Exchange Act’s
disclosure requirements.
“Supplemental” OTC companies in the Barron’s Statistical Section, in contrast to
the “primary” and “Eastern” companies, were not included in the database given the lack
of any shareholder threshold for qualification on this list. In addition, there are concerns
about the accuracy and reliability of the supplemental quotations for these inactively
traded securities.
The “primary” and “Eastern” OTC insurance companies, investment companies
and banks were dropped from the database. OTC insurance companies were excluded
given their exemption under section 12(g). Investment companies were excluded given
their extensive regulation, including mandated disclosure, under the Investment Company
Act of 1940. Banks were dropped because of their unique regulatory regime. In
addition, all companies which had six or fewer months of returns were also dropped due
to the fact that the regression results rapidly lose meaning with so few observations.
There were a total of 762 OTC companies as of January 1, 1962 that were neither
insurance companies, investment companies or banks and had more than six return
observations. For each one of these 762 companies, the following pieces of information
was collected for the time period January 1, 1962 to January 1, 1965 (the pre-mandated
disclosure period): (1) monthly stock quotations; (2) each company’s market
capitalization as of January 1, 1962; (3) their standard industrial classification (SIC)
code; (4) annual sales; (5) any stock or cash dividends; (6) stock splits; (7) liquidation
values for any company that was dissolved; (8) whether (and when) the OTC company
became listed on an exchange; (9) identity of any company acquiring (or merging with)
an OTC company and whether that company was an OTC or exchange-listed company;
13
(10) quotation, dividend and stock split information on any OTC company that acquired
(or merged with) one of the original 762 OTC companies; and (11) bankruptcies.
The same information was collected for all “primary” and “Eastern” OTC
companies that existed as of January 1, 1965 for the time period January 1, 1965 to
January 1, 1968 (the post-mandated disclosure period). Excluding insurance companies,
investment companies, banks and companies with six or fewer return observations, there
were a total of 731 OTC companies as of January 1, 1965. The market capitalization of
these OTC companies was measured as of January 1, 1965.
The quotation information throughout this time period (1962-1968) was gathered
primarily from Barron’s Statistical Section. Barron’s, in turn, received their quotations
from the National Association of Securities Dealers’ Quotation Bureau. On a few
occasions, quotations for a particular company for a specific month would not appear in
Barron’s “primary” or “Eastern” OTC quotation section but a quotation would be
provided in its “supplemental” quotation section. In those cases, the database would
include this quotation as the quotation for the stock for that month. A number of OTC
companies became listed companies at some point, either through a change in their
company’s listing or through being acquired by a listed company. These companies’
returns are included in the database for the time they were traded on the OTC market.
In addition to Barron’s Statistical Section, quotations were also gathered (and
cross-checked) against the Bank and Quotation Record, published by the Commercial
and Financial Chronicle, the Standard and Poor’s Security Owner’s Stock Guide and the
Wall Street Journal. There were ten OTC companies in the 1962-65 time period for
which there were some missing quotations. There were twenty-one OTC companies in
the 1965-68 period for which there were missing quotations.
Dividend (cash and stock) and stock split information was gathered primarily
from Standard and Poor’s Annual Dividend Record. Information regarding name
changes, acquisitions/mergers, bankruptcies, liquidations and listings on an exchange
came from the Annual Guide to Stocks: Directory of Obsolete Securities.
Market capitalization information was available for approximately 90% of the
OTC companies and came primarily from the Standard and Poor’s Security Owner’s
Stock Guide. Some additional market capitalization data came from Moody’s Handbook
14
of (Widely Held) Common Stocks. Market capitalization was computed based on
outstanding common shares. For a minority of companies outstanding preferred share
information was available, but was not used given the small number of companies for
which this information was available.
Standard industrial classification (SIC) information and annual sales information
was available for 562 OTC companies in the 1962-65 period and 561 companies in the
1965-68 period. This constitutes approximately 75% of the OTC companies. This
information was gathered from Poor’s Registry of Directors, Executives and Officers for
the years 1962 to 1968.
Out of the 762 OTC companies as of January 1, 1962, three had market
capitalizations of less than $1 million. For the 731 OTC companies as of January 1,
1965, three companies also had market capitalizations of less than $1 million. Using
market capitalization as a proxy for the value of a firm’s assets, these six companies were
dropped from the database given the threshold requirement of $1 million in assets in
section 12(g) of the Exchange Act.
The control group consisted of all exchange-listed companies, excluding
insurance companies, investment companies, banks, and companies with six or less return
observations, that had price quotations as of January 1, 1962 and all exchange-listed
companies (again excluding insurance companies, investment companies, banks, and
companies with six or less return observations) that existed as of January 1, 1965. The
control group consists of 1,084 exchange-listed companies that had price quotations as of
January 1, 1962 and 1,982 exchange-listed companies that existed as of January 1, 1965.
Information for these companies was gathered from the CRSP datafiles.
The factor returns used in the Fama-French regressions and the value-weighted
market return are from Kenneth French’s datalibrary (which is the same as the CRSP
value-weighted index). Finally, the risk-free rates of return were provided by Ibbotson
Associates, which has computed this return for every month for the time period studied.
V. SUMMARY STATISTICS
15
Table I contains a breakdown of OTC companies in the pre- and post-mandated
disclosure periods along a couple of basic dimensions: the number of OTC companies;
the number of acquisitions; the liquidations and bankruptcies of OTC companies; the
number of OTC companies who change their listing to the listed market; and the average
and median market capitalizations of OTC companies. With the exception of market
capitalization, the pre- and post-mandated disclosure group of OTC companies look
approximately the same.
The number of OTC companies as of January 1, 1962 and January 1, 1965 are
quite similar: there were 31 more companies (approximately 4% more) in the January 1,
1962 OTC group. As is shown in Table I, there are also similar numbers of acquisitions
of OTC firms and liquidations/bankruptcies in the two time periods. Approximately
16.9% of OTC companies list on an exchange between 1962-65 compared to 16.1% for
OTC companies in the 1965-68 period. The percentage of OTC firms that became listed
firms, either through listing on an exchange or by being acquired by a listed firm, is
20.2% in the 1962-65 period and 20.6% in the 1965-68 period.
There is, however, a notable difference in both average and median market
capitalizations between the two groups. The average common stock market capitalization
of OTC firms as of January 1, 1962 was $39,187,000 and a median of $16,464,000. In
contrast, as of January 1, 1965, the average OTC common stock market capitalization
was $32,507,000 with a median value of $14,205,000. The same basic differences in
market capitalizations remain if one looks just at the group of companies that were OTC
companies as of January 1, 1962 and January 1, 1965, suggesting that these differences in
market capitalizations are not the result of a different mix of OTC firms in the two
periods.
The changes in the two-digit SIC industrial classifications of OTC and listed firms
are summarized in Table II. A SIC code was included in Table II only if at least 1% of
OTC firms were in that industry in either time periods. The SIC codes in Table II cover
approximately 90% of the OTC companies for which SIC information was available.
As can been seen in Table II, the mix of types of OTC and listed firms by industry
remained, on the whole, fairly stable between 1962-65 and 1965-68. The most noticeable
difference between the two periods occurred in the electrical and appliances industry
16
classification (SIC 36). While approximately 14% of all OTC firms fell into the
electrical and appliances industry classification group in the 1962-1965 period, this
percentage fell to approximately 9% in the 1965-68 period. At the same time, the
number of listed firms in the electrical and appliances industry classification increased
from approximately 6% in the 1962-1965 period to close to 9% in the 1965-1968 period.
Given the differences in the mix of industries and market capitalizations between
the pre-mandated and post-mandated disclosure period (and the OTC and listed market),
these differences will be taken into account in the statistical analysis.
VI. CHANGES IN THE DISTRIBUTION OF ABNORMAL RETURNS
This Part of the paper examines the effect of mandated disclosure on the
dispersion of abnormal returns both cross-sectionally and over time. Previous
econometric studies have looked at the cross-sectional variance of abnormal returns
(Simon 1989) and the volatility of stock returns over time (Stigler 1964; Benston 1973)
as proxies for informational efficiency. Reductions in the cross-sectional variance and
the volatility of stock returns over time have been assumed by researchers to indicate an
increase in informational efficiency. Accordingly, Section A will look at the effect of
mandated disclosure on the volatility of returns over time while Section B will examine
the effect of mandated disclosure on the cross-sectional variance of abnormal returns.
Finally, Section C will measure the volatility of the OTC market broken down into
above- and below-average performing stocks.
The intuitive justification for using the dispersion of returns as a proxy for
informational efficiency has essentially been the following: “The availability of quality
information will [ ] affect the riskiness of [stocks]. As such, the effects of legislation
aimed at increasing investor information should be reflected in changes in the dispersion
of market-adjusted returns.” (p.295).5 Fortunately, the intuition that the dispersion of
abnormal returns should tighten when more firm-specific information becomes available 5 Other scholars have had similar intuitions. Merritt Fox, for example, states, “Presumably everyone . . . accepts the theoretical proposition that any information that is of value to investors for predicting the future with greater accuracy will lead to less share price dispersion.” (1999). See Allen Ferell, If We Understand the Mechanisms Why Don’t We Understand the Output?, forthcoming Journal of Corporation Law (2003) for a discussion of these issues.
17
earlier – the assumed effect of mandated disclosure requirements – does enjoy theoretical
support in work by West (1988) and LeRoy and Porter (1981). In these models, the
earlier information is available – the presumed effect of mandated disclosure if it does
have an effect – the lower the return volatility as any information about future cash-
flows/profits of the firm are more heavily discounted than they would be if the
information were revealed later.
A. Stock Return Volatility
In examining the impact of the Securities Acts of 1933 and 1934 both Benston
(1973) and Stigler (1964) measured whether the volatility of monthly stock returns over
time decreased after the imposition of mandated disclosure. Accordingly, this section will
examine what happens to monthly (abnormal) stock return volatility in the pre- and post-
mandated disclosure period. The traditional hypothesis adopted in the literature has been
that a lower volatility of stock returns indicates increased informational content. See Fox
(1999); Coffee (1984); cf. West (1988); LeRoy & Porter (1981). This assumption about
stock return volatility will be revisited in Part VII.
The three factors important in explaining stock returns that have been identified
by Fama and French (Fama & French 1992; Fama & French 1993) will be used in the
course of calculating the abnormal returns of stocks. The three factors are market, book-
to-market, and size effects. Each factor represents a variable that has explanatory power
in accounting for the cross-section of stock returns. Whether these factors represent
sources of undiversifiable risk or market imperfections is an issue of considerable debate
(see, e.g., Griffin & Lemmon 2002; Fama & French 1995); one which it is unnecessary to
resolve for the purpose of calculating a stock’s abnormal return.
In addition to the three Fama-French factors, a fourth factor, following Simon
(1989), will also be used in calculating abnormal returns. To include the potential impact
of changes in the mix of industries on the change in the variance of abnormal returns in
the OTC and listed market, the independent variable, RINDt, representing the abnormal
return of SIC industry groups, will be used. Let RINDt − (Rm, t + Rf, t) represent the return
on an equally weighted portfolio of firms in a two-digit SIC classification at time t minus
18
the sum of the market return and the risk-free rate at time t. In effect, RINDt − (Rm, t + Rf,
t) captures the return enjoyed by an industry in time t in excess of the market return and
risk-free rate. It follows that for any given time period and industry RINDt could be
negative as well as positive. The equally weighted portfolio return of firms for an
industry was calculated using all the firms in the same market with the same two-digit
SIC code for the desired time period.
The abnormal return of each stock in each month will be calculated based on a
two-step procedure. First, estimates of the coefficients on the three Fama-French
independent risk factors – Rm, t − Rf, t, HmLt and SmBt – and the industry return variable,
RINDt − (Rm, t + Rf, t), will be calculated for each stock based on either the 1962-65 return
data or the 1965-68 return data.6 Second, these estimates will then be used to calculate an
abnormal return for each stock for each month using the estimated coefficients based on
the 1962-65 return data for months in this time period and the estimated coefficients
based on the 1965-68 return data for months in that period.7
For instance, the abnormal return for a stock in month t would be
Abnormal Returnt = (Rt − Rf, t) − β1 * (Rm, t − Rf, t) - β2 * HmLt - β3 * SmBt - β4 * (RINDt
− Rm, t − Rf, t) (1)
where Rt − Rf, t is the gross return for that stock in month t minus the risk-free rate. The
gross return for a stock includes any dividends (stock or cash) received and are adjusted
to take account of any stock splits that occurred during the time period studied. As noted
earlier, comprehensive dividend and stock split information was gathered for the OTC
stocks from 1962 to 1968. β1, β2, β3, β4 are the estimated coefficients based on that
stock’s return data for either 1962-65 or 1965-68 depending on which time period month
t is in.
6 For every regression in this paper using a four-factor model, we reran the regression using just the Fama-French three-factor model. These regressions have been left unreported, except for Section B.1 of Part VI. In no case did the choice between a three-factor model and a four-factor model affect the findings reported and, hence, are left unreported. 7 For every regression using the four or three-factor model, coefficient estimates were also calculated using the merged 1962-1968 database rather than estimating the coefficients on 1962-65 and 1965-68. The findings reported in this paper are the same when coefficients are estimated on the merged dataset.
19
Based on these abnormal return calculations, the variance of the monthly
abnormal returns for each OTC stock in the 1962-65 period was calculated and, then, an
average of these variances was taken. The average monthly abnormal return variance was
also taken for the post-mandated disclosure period and by year for both the OTC and
listed markets. The results are summarized in Table III.
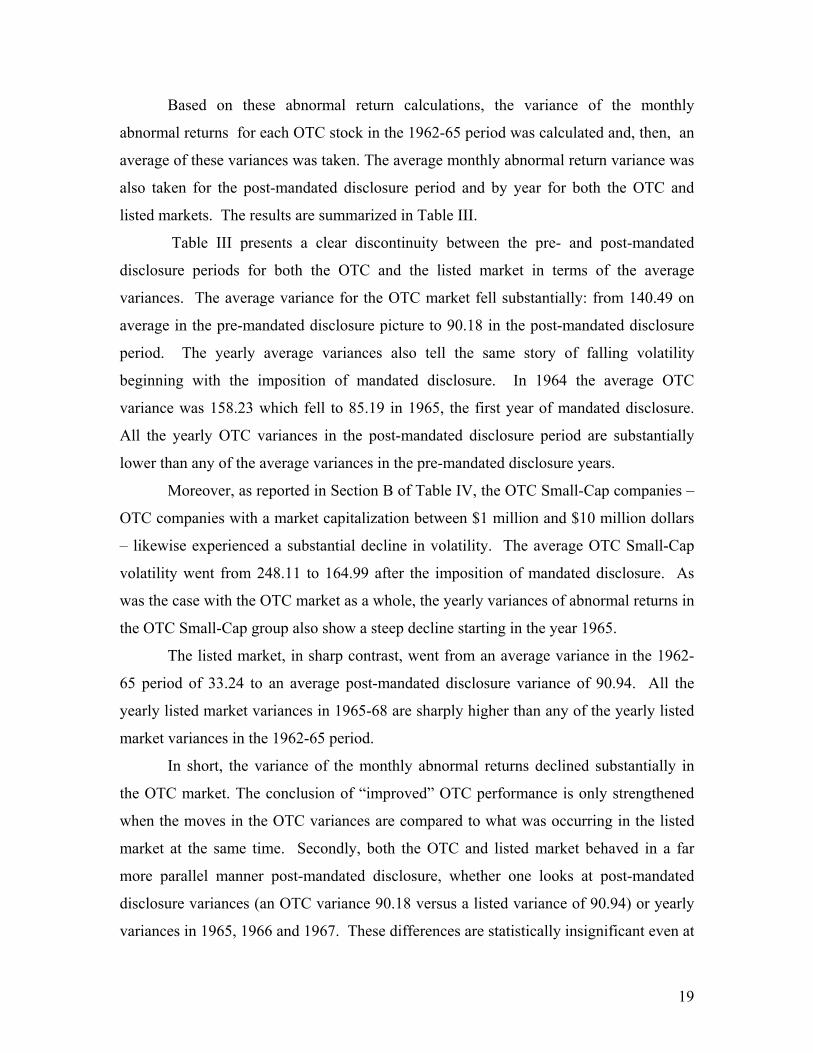
Table III presents a clear discontinuity between the pre- and post-mandated
disclosure periods for both the OTC and the listed market in terms of the average
variances. The average variance for the OTC market fell substantially: from 140.49 on
average in the pre-mandated disclosure picture to 90.18 in the post-mandated disclosure
period. The yearly average variances also tell the same story of falling volatility
beginning with the imposition of mandated disclosure. In 1964 the average OTC
variance was 158.23 which fell to 85.19 in 1965, the first year of mandated disclosure.
All the yearly OTC variances in the post-mandated disclosure period are substantially
lower than any of the average variances in the pre-mandated disclosure years.
Moreover, as reported in Section B of Table IV, the OTC Small-Cap companies –
OTC companies with a market capitalization between $1 million and $10 million dollars
– likewise experienced a substantial decline in volatility. The average OTC Small-Cap
volatility went from 248.11 to 164.99 after the imposition of mandated disclosure. As
was the case with the OTC market as a whole, the yearly variances of abnormal returns in
the OTC Small-Cap group also show a steep decline starting in the year 1965.
The listed market, in sharp contrast, went from an average variance in the 1962-
65 period of 33.24 to an average post-mandated disclosure variance of 90.94. All the
yearly listed market variances in 1965-68 are sharply higher than any of the yearly listed
market variances in the 1962-65 period.
In short, the variance of the monthly abnormal returns declined substantially in
the OTC market. The conclusion of “improved” OTC performance is only strengthened
when the moves in the OTC variances are compared to what was occurring in the listed
market at the same time. Secondly, both the OTC and listed market behaved in a far
more parallel manner post-mandated disclosure, whether one looks at post-mandated
disclosure variances (an OTC variance 90.18 versus a listed variance of 90.94) or yearly
variances in 1965, 1966 and 1967. These differences are statistically insignificant even at
20
the 10% level. These two conclusions are illustrated in the graph provided below where
the yearly average variances for the two markets over time have been plotted.
Variance of Monthly Abnormal Returns
0
20
40
60
80
100
120
140
160
180
1962 1963 1964 1965 1966 1967
Varia
nce
OTCMarket
ListedMarket
Two robustness checks were used to confirm these findings on individual stock
volatility. First, an alternative method of calculated abnormal returns was used. Stephen
Brown and Jerold Warner (1980) have shown that net-of-market returns (stock return
minus the market return) often accurately capture abnormal returns in a wide set of
circumstances. Accordingly, for each stock in every month, the difference in the stock’s
return minus the overall market return is treated as the abnormal return for that stock in
that month. The value-weighted market index is used as the market return. The average
variances, by period and year, are reported in Section B of Table III. The net-of-market
calculations confirm the preceding analysis based on the four-factor model.
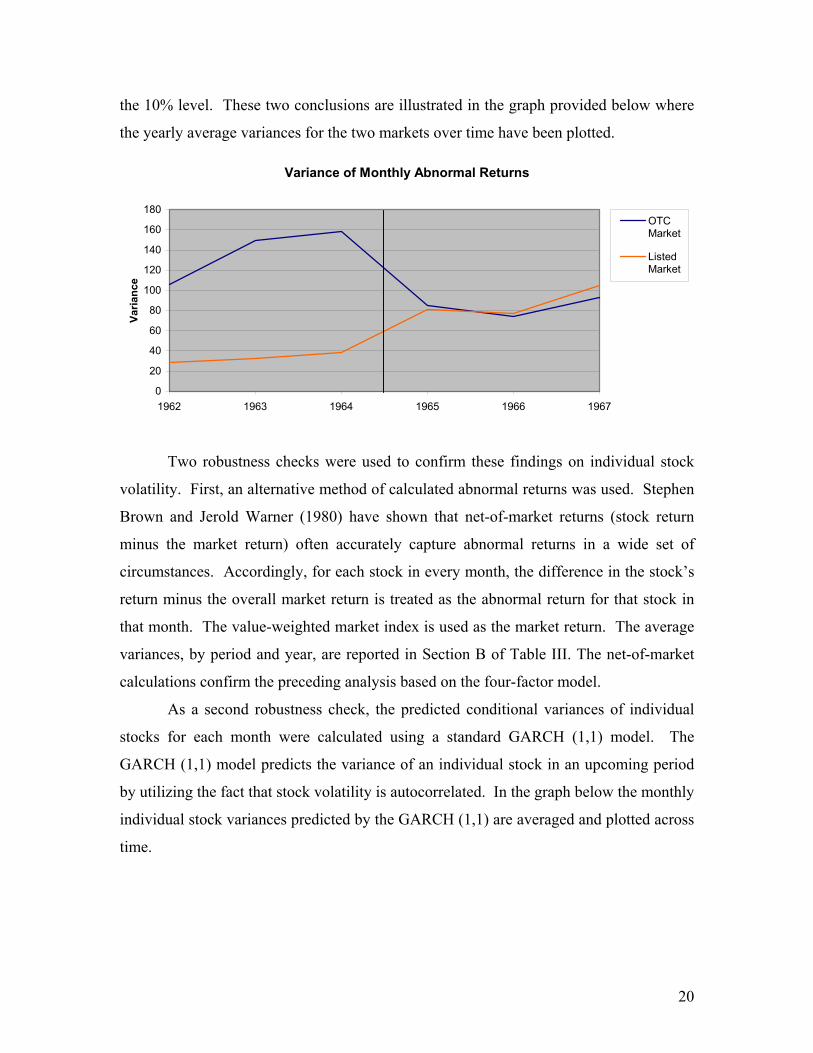
As a second robustness check, the predicted conditional variances of individual
stocks for each month were calculated using a standard GARCH (1,1) model. The
GARCH (1,1) model predicts the variance of an individual stock in an upcoming period
by utilizing the fact that stock volatility is autocorrelated. In the graph below the monthly
individual stock variances predicted by the GARCH (1,1) are averaged and plotted across
time.
21
GARCH (1,1) Predicted Conditional Variances
0
50
100
150
200
250
300
350
400
Jan-62 Aug-62 Mar-63 Oct-63 Jun-64 Jan-65 Aug-65 Mar-66 Oct-66 Jun-67 Jan-68
Pred
icte
d C
ondi
tiona
l Var
ianc
e
OTC Market Variance
Listed Market Variance
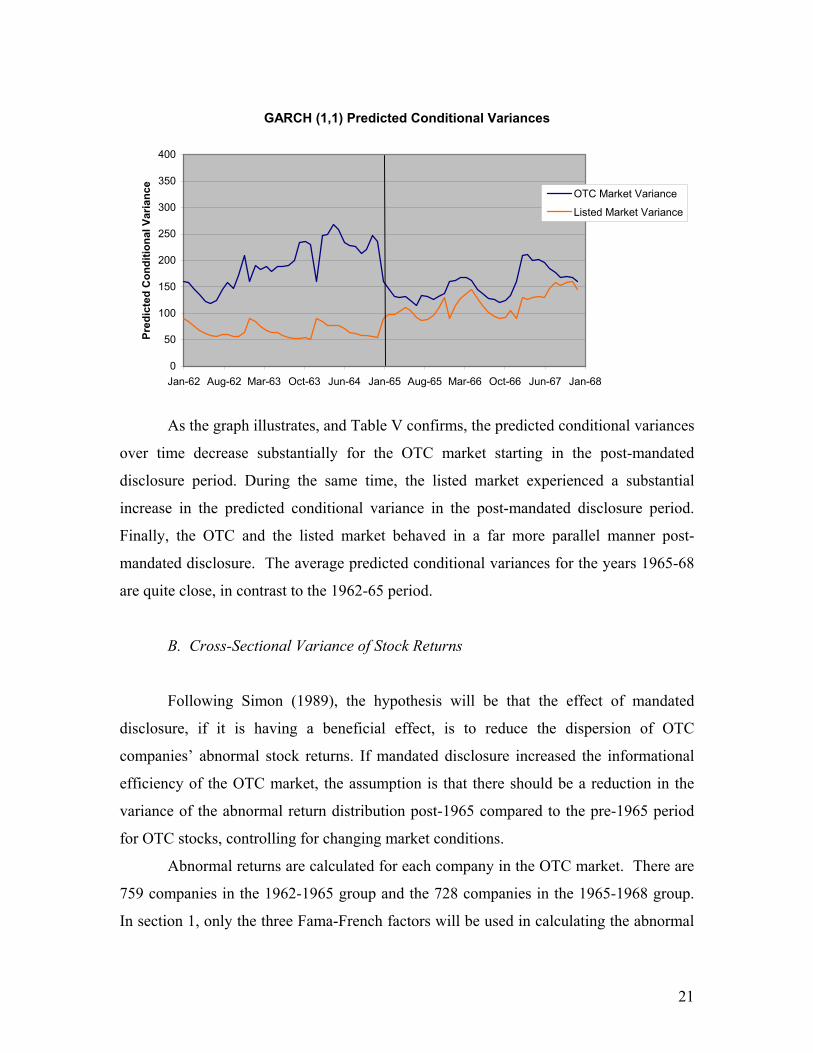
As the graph illustrates, and Table V confirms, the predicted conditional variances
over time decrease substantially for the OTC market starting in the post-mandated
disclosure period. During the same time, the listed market experienced a substantial
increase in the predicted conditional variance in the post-mandated disclosure period.
Finally, the OTC and the listed market behaved in a far more parallel manner post-
mandated disclosure. The average predicted conditional variances for the years 1965-68
are quite close, in contrast to the 1962-65 period.
B. Cross-Sectional Variance of Stock Returns
Following Simon (1989), the hypothesis will be that the effect of mandated
disclosure, if it is having a beneficial effect, is to reduce the dispersion of OTC
companies’ abnormal stock returns. If mandated disclosure increased the informational
efficiency of the OTC market, the assumption is that there should be a reduction in the
variance of the abnormal return distribution post-1965 compared to the pre-1965 period
for OTC stocks, controlling for changing market conditions.
Abnormal returns are calculated for each company in the OTC market. There are
759 companies in the 1962-1965 group and the 728 companies in the 1965-1968 group.
In section 1, only the three Fama-French factors will be used in calculating the abnormal
22
returns. In section 2, the industry return variable and yearly time dummies will be
introduced.
Changing market conditions over the time period studied, 1962-1968, will be
controlled for using a control group. The control group consists of 1,084 exchange-listed
companies for the 1962-65 period and 1,982 exchange-listed companies for the 1965-68
period. Listed companies were subject, throughout this period, to the Exchange Act’s
disclosure requirements.
1. Fama-French Three-Factor Model
The three-factor model for a stock is estimated by:
(Rt − Rf, t) = α + β1 * (Rm, t − Rf, t) + β2 * HmLt + β3 * SmBt + εt (2)
where Rt − Rf, t is the gross return to a stock in month t minus the risk-free rate, and the
independent variables – Rm, t − Rf, t, HmLt, SmBt – are, as before, the month t returns to
zero-investment factor-mimicking portfolios designed to capture risk-adjusted market
return, book-to-market ratio, and firm size effects on stock returns. The abnormal return
– the deviation of the stock’s performance from the three-factor model – is the intercept
term α – for the time-period in question.
After calculating the abnormal returns using the three-factor model, the variance
of abnormal returns for the OTC and listed market were computed for both the pre- and
post-mandated disclosure periods. In the pre-mandated disclosure period, the variance of
abnormal returns in the OTC market was 16.57, while the variance in the post-mandated
disclosure period was 14.01. The difference between these two variances, using a
Goldfeld-Quandt test, was statistically insignificant even at the 10% level. At the same
time, however, the variance of abnormal returns increased dramatically in the listed
market between the 1962-65 and the 1965-68 time periods: from 4.67 to a variance of
10.32. This change in the listed market’s variance of abnormal returns is significant at
the 1% level. The difference-in-difference estimator of the relative changes in the listed
and OTC market is 8.21. Finally, the difference in variances between the OTC and listed
23
market’s variances in the pre-mandated disclosure period was highly statistically
significant (at the 1% level) while the differences in variances between the OTC and
listed market in the 1965-68 period was far smaller and significant only at the 10% level.
There are two interesting aspects to these findings: First, using the listed market
as a control group, mandated disclosure appears to be associated with variances in the
OTC market that are lower than would have otherwise occurred. Second, the variances
of abnormal returns in the OTC and listed market appear to behave in a far more parallel
fashion after the imposition of mandated disclosure. These findings, however, do not
take into account the differences in the mix of industries between the listed and OTC
market and over time. The next section will now do so.
2. Effect of Industry Mix on Abnormal Returns
Although the mix of OTC and listed companies by industry remains, on the
whole, relatively stable between the two time periods, the breakdown by SIC
classification is not identical. For the approximately 75% of OTC companies for which
SIC information was available – 562 out of 759 OTC firms in 1962-1965 and 561 out of
728 OTC firms in 1965-1968 – the regression using the industry return variable, as well
as the three Fama-French factors as independent variables, was run. In addition,
following Simon (1989), yearly time dummies are also included to capture the effect of
the time-specific component of returns. The four-factor model with yearly time dummies
is:
(Rt − Rf, t) = α + β1 * (Rm, t − Rf, t) + β2 * HmLt + β3 * SmBt + β4 * (RINDt − Rm, t − Rf, t) +
∑32 (γj,t * Dj, t) + εt (3)
As before Rm, t − Rf, t, HmLt ,SmBt are the Fama-French factor returns, while Dj,t are yearly
time dummies where j equals 2 when t equals months 12 to 24 (year 2) and j equals 3
when t equals months 24 to 36 (year 3). The first year is the baseline year in the model.
Accordingly, the abnormal return for a given year for a particular firm is the intercept
term α plus the time dummy coefficient for that year.
24
Likewise for the listed companies the independent variable RINDt and yearly time
dummies were included as independent variables in addition to the three Fama-French
factors in calculating abnormal returns. As can be seen from Table II the mix of
industries among listed companies also changes over the 1962-1968 time period although
not dramatically.
The results using the four-factor model with yearly time dummies are summarized
in Section A of Table VI. Once industry effects are controlled for, the variance of
abnormal returns is substantially lower than that found using the three-factor model for
the OTC market in both the pre- and post-mandated disclosure period. As can be seen
from Table VI, the OTC market’s pre-mandated disclosure variance is 11.48 (compared
to 16.57 estimated earlier) and its post-mandated disclosure variance is 9.31 (compared to
14.01 estimated earlier). This reduction in variances in the OTC market is statistically
significant at only the 10% level. The listed market’s variances are also lower than the
ones found earlier, although only modestly so: 4.56 for the 1962-65 period and 9.80 for
the 1965-68 period.
While the variances are lower when industry effects and time dummies are
included in the regressions, the same two basic findings found before using the three-
factor model remain. First, relative to the listed market, the OTC market performs better
in the post-mandated disclosure period; the difference-in-difference estimator is 7.40.
Second, the two markets perform in a far more parallel fashion in the post-mandated
disclosure period; the variances between the OTC and listed market in the post-mandated
disclosure period are statistically indistinguishable (even at the 10% level).
These two basic findings are confirmed if one looks at the yearly estimated
variances of the two markets summarized in Section B of Table VI. There is no obvious
trend in the yearly variances of the OTC market over the 1962-68 period. On the other
hand, all the yearly variances of the listed market in the 1965-68 period are substantially
higher than any of the yearly variances in the 1962-65 period. In other words, relative to
the listed market, the OTC market performed “better” in the post-mandated disclosure
period. Secondly, the yearly variances of the OTC and listed market in the 1965-68
period are, on the whole, quite similar. The same cannot be said for the 1962-65 period.
25
3. Effect of Market Capitalization on Abnormal Returns
It is possible that the imposition of mandated disclosure had a distinct and
especially powerful effect on the smallest OTC companies. These are companies for
which there might have been very limited private market sources of information.
Moreover, only companies with $10 million or more in assets, during this time period,
were eligible for listing on the New York Stock Exchange. OTC Small-Cap companies
had no choice but to trade on the OTC market. Accordingly, the OTC market was
subdivided into those companies with market capitalizations of less than $10 million
(OTC Small-Cap). There were 181 OTC Small-Cap in the 1962-65 period and 205 OTC
Small-Cap for which there was two-digit SIC information available in the Security and
Poor’s Security Owner’s Stock Guide or Moody’s Handbook of (Widely Held) Common
Stock.
Section A of Table IV summarizes the findings concerning the variance of OTC
Small-Cap firms by year and by pre- and post-mandated disclosure using the four-factor
model. As can be seen from this Table, limiting one’s attention to the OTC Small-Cap
companies does not change the findings concerning the variance of abnormal returns
discussed earlier. While the period variances are higher for the OTC Small-Cap group in
both the pre- and post-mandated disclosure period (15.93 and 13.97, respectively) than
was found for the OTC market as a whole (11.48 and 9.31, respectively), there is no
statistically significant difference in the variance of abnormal returns for the OTC Small-
Cap group pre- and post-mandated disclosure replicating the result found for the OTC
market as whole. Nor do any differences appear between the pre- and post-mandated
period when one looks at the variance of OTC Small-Cap abnormal returns by year. And
as before, relative to the listed market, the OTC Small-Cap firms performed significantly
better and more closely paralleled the listed market in the post-mandated disclosure
period.
C. Volatility of the Market
26
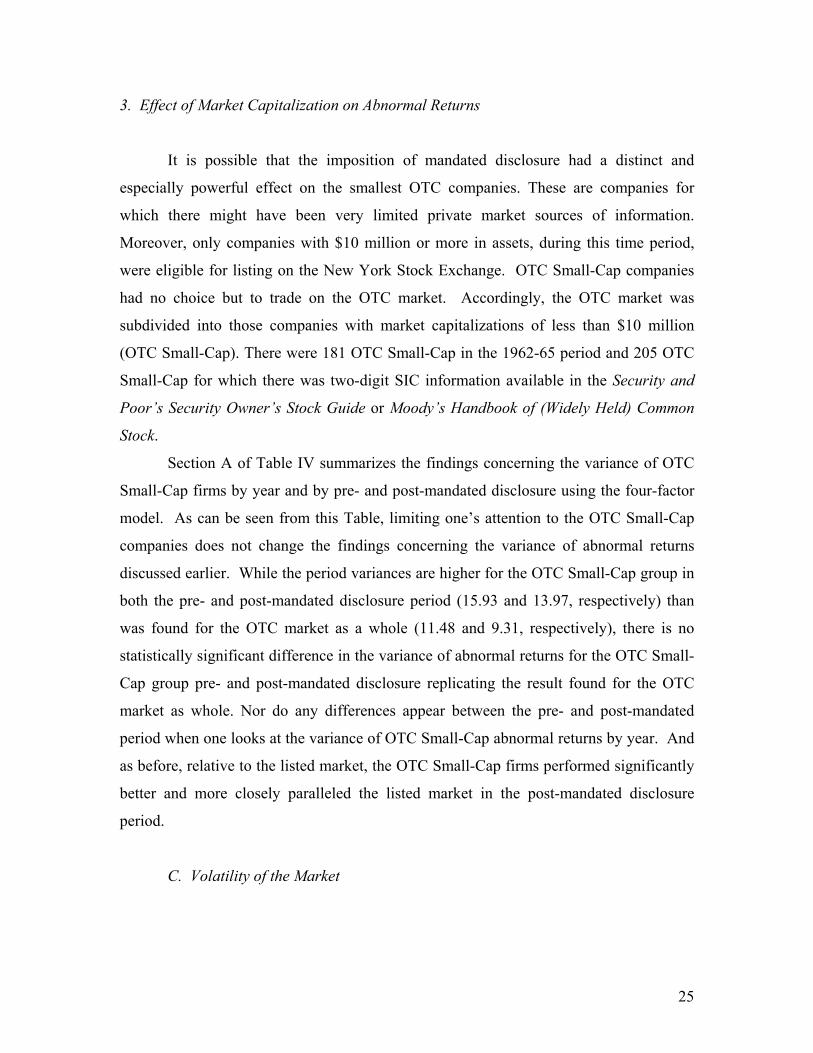
Average individual return volatility (Section A) and the overall cross-sectional
variance of abnormal returns (Section B) might not capture satisfactorily what is
occurring in terms of how the overall distribution of abnormal returns in the OTC and
listed market are changing over time. Accordingly, for each month, the abnormal returns
were divided into one of seven groups based on their relative size: the bottom 5%, 10%,
25% of abnormal returns, the median return, and the top 5%, 10% and 25% of abnormal
returns. The values of the abnormal returns at these percentile cut-offs for the OTC
market for each month from 1962 to 1968 is summarized in the chart below. For
example, the value for the 5th percentile in the OTC market for January, 1962 is the
abnormal return of the company that has only five percent of OTC firms with larger
negative abnormal returns in that month. The black line represents the beginning of the
mandated disclosure period in the OTC market.
OTC Market Distribution of Monthly Abnormal Returns
-25-20-15-10-505
1015202530
Jan-62 Aug-62 Mar-63 Oct-63 Jun-64 Jan-65 Aug-65 Mar-66 Oct-66 Jun-67 Jan-68
Abn
orm
al R
etur
n (%
) 95th Percentile
90th Percentile
75th Percentile
50th Percentile
25th Percentile
10th Percentile
5th Percentile
As the graph indicates, the behavior of the different percentile groups appears to
be roughly the same over time with the possible except of the 5th percentile (the bottom
five percent of companies) and the 10th percentile group (the bottom ten percent of
companies). The 5th and 10th percentile groups appear, on average, to move closer to
zero in the post-mandated disclosure period. In other words, there are fewer stock “blow-
ups” in the OTC market post-mandated disclosure.
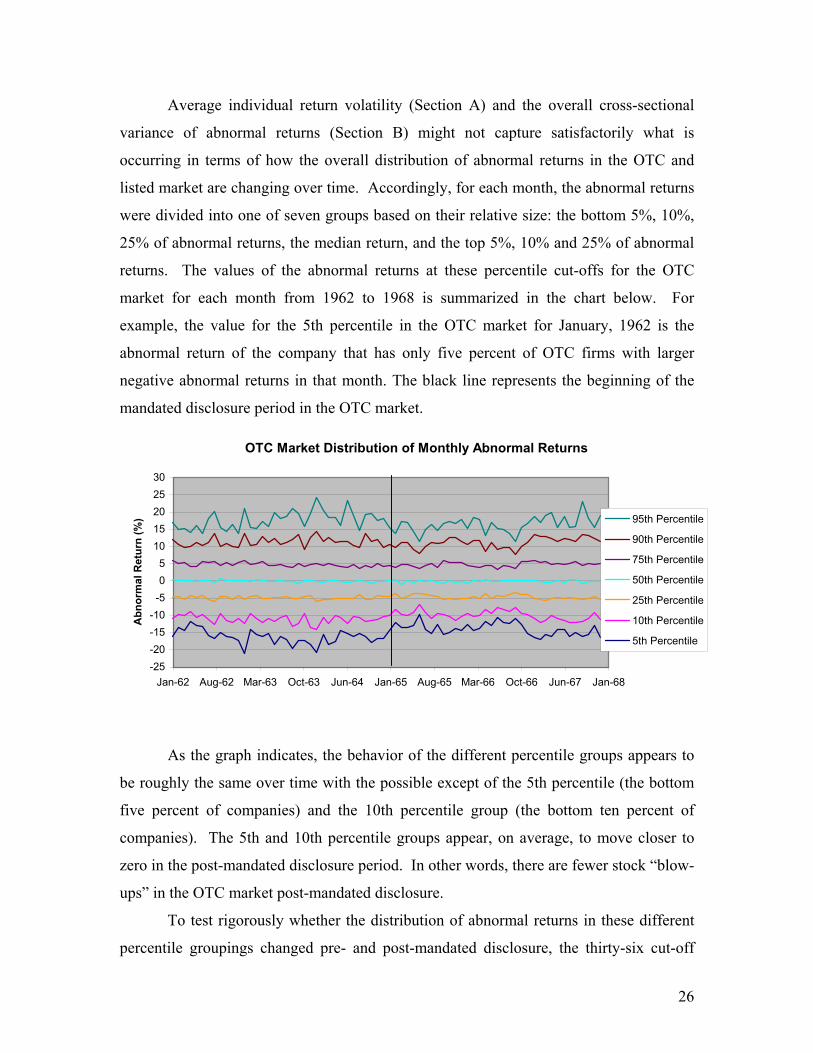
To test rigorously whether the distribution of abnormal returns in these different
percentile groupings changed pre- and post-mandated disclosure, the thirty-six cut-off
27
values of each percentile group in the pre-mandated disclosure period where compared to
the thirty-six cut-off values of the same percentile group in the post-mandated disclosure
period. Given the relatively small sample size (72 observations for each percentile group
over the 1962-1968 period), a non-parametric K-sample test on the equality of medians
was used to determine whether the median value of a percentile group’s thirty-six cut-off
values in the pre-mandated disclosure period was statistically different from that
percentile group’s median value of cut-off values in the post-mandated disclosure period.
The results of this analysis are summarized in Section A of Table VII. There
were two statistically significant changes, at the 1% level, in the median values in the
post-mandated disclosure period: the OTC companies at the bottom 5% and the OTC
companies in the bottom 10%. In both groups, the median abnormal returns were closer
to zero than in the pre-mandated disclosure period. All the rest of the median values of
the percentile groups remained statistically identical, even at the 10% level, in the pre-
and post-mandated disclosure period including, interestingly, the median abnormal return
for the OTC market.
It is useful at this point to compare the OTC market to what was happening in the
listed market contemporaneously based on the breakdown of firms into the same
percentile groups. As before, the four-factor model – the three Fama-French factors and
the industry return variable – with yearly time dummies will be used to calculate
abnormal returns. The results of such an analysis are graphically represented below.
Listed Market Distribution of Monthly Abnormal Returns
-25-20-15-10-505
1015202530
Jan-62 Aug-62 Mar-63 Oct-63 Jun-64 Jan-65 Aug-65 Mar-66 Oct-66 Jun-67 Jan-68
Abn
orm
al R
etur
n (%
) 95th Percentile
90th Percentile
75th Percentile
50th Percentile
25th Percentile
10th Percentile
5th Percentile
28
In contrast to the OTC market, there is a noticeable change in the distribution of
abnormal returns in the post-mandated disclosure period for all the percentile groups with
the lone exception of the overall median value. This impression is confirmed when the
median values of the cut-off values of the different percentile groups are compared pre-
and post- mandated disclosure. Using, as before, a non-parametric K-sample test on the
equality of medians, the median values of all percentile groups, except the overall median
value, were different in the post-mandated disclosure period with statistical significance
at the 1% level.
All values were significantly further away from zero than they were in the pre-
mandated disclosure period. Prior to 1965 most abnormal returns, as captured by these
percentile groupings, varied somewhere between –10% and +10%. After 1965, abnormal
returns varied in the significantly broader range of roughly –15% to +15%. As a look at
the OTC graph and Table VII will confirm, the listed market in the post-mandated
disclosure period started performing more like the OTC market in which abnormal
returns typically vary somewhere between –15% and +15% throughout the 1962-1968
time period.
In short, even after controlling for differences in firm size, industry, book-to-
market ratios and overall market fluctuations, the OTC market after the imposition of
mandated disclosure experienced some tightening of the distribution with respect to the
worst performers, the bottom 5% and bottom 10%. At the same time, the listed market
was experiencing a significant, and systematic, increase in the dispersion of abnormal
returns, rendering it more like the OTC market.
VII. CHANGES IN STOCK RETURN SYNCHRONICITY
Research by Morck et al (2000) suggests that the informational content of security
prices is inversely related to the degree to which stocks move together (the degree of
stock return synchronicity). If mandated disclosure improved the informational content
of OTC stock prices, then the hypothesis is that the stock return synchronicity of the OTC
market should fall. On a related note, firm-level volatility – volatility not explained by
broader market fluctuations – should increase if mandated disclosure improves stock
29
price accuracy (Durnev et al 2001b). This Part will use the two stock return synchronicity
measures employed by Morck et al (2000): the co-movement of stocks and the R2
(explanatory power) of asset pricing models. Moreover, this Part will also provide
estimates of the average firm-level volatility (volatility not attributable to broader market
movements) in the listed and OTC market pre- and post-mandated disclosure.
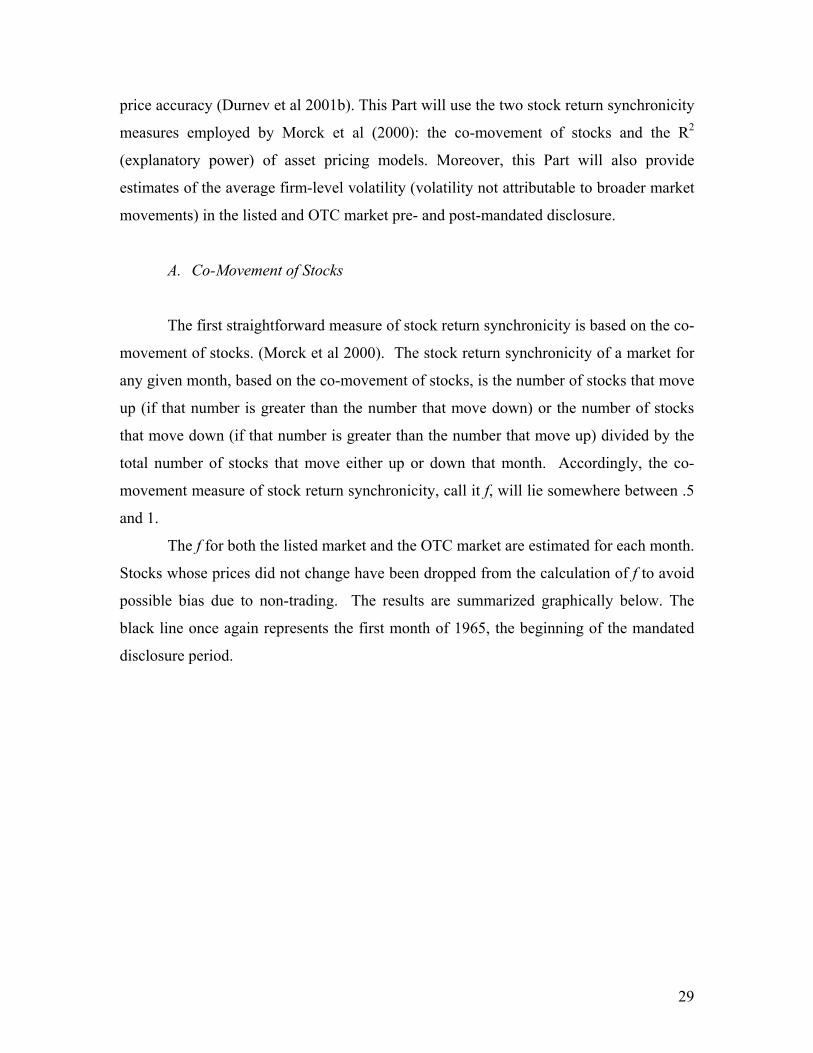
A. Co-Movement of Stocks
The first straightforward measure of stock return synchronicity is based on the co-
movement of stocks. (Morck et al 2000). The stock return synchronicity of a market for
any given month, based on the co-movement of stocks, is the number of stocks that move
up (if that number is greater than the number that move down) or the number of stocks
that move down (if that number is greater than the number that move up) divided by the
total number of stocks that move either up or down that month. Accordingly, the co-
movement measure of stock return synchronicity, call it f, will lie somewhere between .5
and 1.
The f for both the listed market and the OTC market are estimated for each month.
Stocks whose prices did not change have been dropped from the calculation of f to avoid
possible bias due to non-trading. The results are summarized graphically below. The
black line once again represents the first month of 1965, the beginning of the mandated
disclosure period.
30
Return Synchronicity in the OTC and Listed Stock Markets
0
0.2
0.4
0.6
0.8
1
1.2
Jan-62 Aug-62 Mar-63 Oct-63 Jun-64 Jan-65 Aug-65 Mar-66 Oct-66 Jun-67 Jan-68
Ret
urn
Sync
hron
icity
OTC Market
Listed Market
If one confines one’s attention to the period immediately surrounding the
imposition of mandated disclosure, the changes in the OTC market’s co-movement
mirrors quite closely the changes in the co-movement of the listed market. In both the
listed and OTC market there was, in the immediate aftermath of the imposition of
mandated disclosure, a decrease in the co-movement of stocks. As the graph illustrates,
throughout the post-mandated disclosure period the OTC market mirrored more closely
the changes in co-movement experienced by the listed market than was the case in the
pre-mandated disclosure period. The correlation coefficient of the co-movement in the
OTC market and the co-movement in the listed market was .83 in the pre-mandated
disclosure and an impressive .92 in the post-mandated disclosure period.
Table VIII contains the average co-movement of stocks both by year and for
1962-65 and 1965-68 time periods. The average co-movement of stocks in the OTC
market in both the 1962-65 period and the 1965-68 period was .63. The listed market
experienced a slight decrease in co-movement, from .68 to .66. Accordingly, if one were
to use the co-movement of stocks as a proxy for informational efficiency, one could not
conclude that the OTC market became more informationally efficient as a result of
mandated disclosure. At the same time, given the substantial increase in the correlation
coefficient, the OTC market did mirror more closely the behavior of stocks in the listed
market.
31
B. R2 and Firm-specific Variation
The R2 measure of stock return synchronicity was originally explored by Roll
(1988) and developed by Morck et al (2000). The R2 measure calculates stock return
synchronicity by the extent to which the returns of a stock can be accounted for
(explained) by broader market fluctuations. Recent empirical research has indicated that
R2 is economically meaningful. Firms with high R2 stocks invest capital less efficiently
than their low R2 firm counterparts. (Wrugler 2000). On a related note, R2 is also
inversely related to a stock’s informational content. High R2 stocks impound less
information about the company’s future earnings than low R2 stocks. (Durnev et al
2001b). Finally, as the U.S. stockmarket has developed over the last forty years, there
has been a decline in the average R2 of U.S. stocks (Campbell et al 2001). The same
findings have also been found to hold true for stocks with high levels of firm-specific
variation; stock variation unexplained by broader market fluctuations (Durnev et al
2001b). Stocks with high levels of firm-specific variation have been found to have more
information impounded into their price than stocks with lower levels of firm-specific
variation.
The R2 measure of stock return synchronicity is based on the four-factor model
with time dummies used earlier (see equation 3). Following Morck et al (2000), the stock
return synchronicity of the OTC and listed markets based on R2 will be measured in two
ways: (1) the average (adjusted) R2 of stocks in the OTC or listed market for a given
period of time; (2) a weighted average of the (adjusted) R2 in the OTC or listed market
for a given period of time, where adjusted R2s are weighted by individual firm volatility.
In the second measure, the average will therefore be calculated in the following way:
∑
∑=
i iSSTi ixSSTiR
R2
2 (4)
where Ri2 and SSTi are, respectively, the (adjusted) Ri
2 and sum of squared total variation
of stock i. The higher the R2 the more stocks move together in a synchronized manner in
that market.
The average (unweighted and weighted) in the pre- and post-mandated disclosure
periods is reported in Table IX. As with the market co-movement measure of stock
32
return synchronicity, one cannot conclude that mandated disclosure improved the
informational efficiency of the OTC market vis-a-vis the listed market. While the
unweighted R2 of the OTC market decreased for .33 to .28 (statistically significant at the
1% level), the listed market also experienced a 1% statistically significant decline from
.41 to .31. The changes in the weighted R2 in both the OTC and listed market pre- and
post-mandated disclosure were statistically insignificant even at the 10% level. At the
same time, the estimates of the listed and OTC unweighted and weighted R2 are far closer
post-mandated disclosure.
The same pattern emerges when one looks at the average firm-specific variation
(variation left unexplained by the four-factor model). The average firm-specific variation
increased from .54 to .56 in the OTC market, while the average firm-specific variation in
the listed market increased from .48 to .56, although neither change is statistically
significant at even the 10% level. Post-mandated disclosure, the average levels of firm-
specific variation were identical in the OTC and listed market.
While the stock return synchronicity literature is clearly an important one, these
results do suggest that further refinement and investigation of the stock return
synchronicity measures (co-movement of stocks; weighted and unweighted R2s; firm-
specific variation) would be useful. For instance, the stock return synchronicity measures
all indicate that prior to mandated disclosure, the OTC was more informationally efficient
than the listed market – a result which is highly implausible and at odds with the findings
in Part VI.
VIII. CHANGES IN STOCK RETURNS
Both Stigler (1964) and Benston (1973) looked at stock returns pre- and post-
mandated disclosure as a test for the desirability of mandated disclosure. Stigler reasoned
that the purpose of mandated disclosure is to improve shareholder welfare, and, hence,
stock returns are a natural place to look to test whether this is, in fact, occurring. Using
similar reasoning, Benston argued that if managers were adequately disclosing pre-
mandated disclosure, then mandated disclosure might be viewed by investors as imposing
a net cost on the firm, which would manifest itself in lower stock returns.
33
The hypothesis in this section will be that if mandated disclosure had a beneficial
effect then the period immediately prior to the imposition of mandated disclosure, when
the market has already anticipated the change in legal regime, should enjoy positive
abnormal returns. The benefits of an improved disclosure regime will be capitalized into
stock prices.8
It is same to assume that such a capitalization would have occurred at some point
in the three years, 1962-65, leading up to the implementation of mandated disclosure.
Changes in both the median and average abnormal return pre- and post-mandated
disclosure were examined. The results discussed below are summarized in Table X.
Consider first the median abnormal return. The median value of the thirty-six
OTC monthly median abnormal returns in the pre-mandated period was -.01% while the
median value of the thirty-six monthly median abnormal returns in the post-mandated
disclosure period was actually a bit worse at -.07%. A non-parametric K-sample test of
the equality of medians shows that the pre- and post-mandated disclosure median values
are statistically identical even at the 10% level. The same equality of the median
abnormal returns pre- and post-mandated disclosure also held true for the listed market.
The 1962-65 median value of the monthly median abnormal returns in the listed market
was -.10% is statistically identical to –.25%, the 1965-68 median value of the monthly
median abnormal return even at the 10% level.
The average OTC abnormal return in the pre-mandated disclosure period was
calculated by calculating the average of the abnormal returns of the OTC stocks
estimated over the 1962-1965 period using the four-factor model. As before the abnormal
return for a firm is the intercept term in equation 3. The average pre-mandated disclosure
abnormal return in the OTC market was .26% while the average post-mandated
disclosure abnormal return in the OTC market .33%. In the listed market, the average
abnormal return in the 1962-1965 period, calculated in the same manner, was .26%, the
same as that in the OTC market, and .35% in the post-mandated disclosure period. Using
a t-test of averages (assuming unequal variances), the average abnormal return in the 8 When we looked at volatility and stock price synchronicity the fact that the market might have anticipated the imposition of mandated disclosure was unimportant in constructing the statistical tests. Even if the market anticipated that more firm-specific information would be reaching the market as a result of mandated disclosure prior to 1965, the informational content of securities prices would not have been improved until the firm-specific information was actually released.
34
OTC market and the listed market in both the pre- and post-mandated disclosure period
were statistically identical. The difference-in-difference estimator – .02 – is statistically
insignificant even at the 10% level.
These results, it should be noted, are not conclusive as the 1962-65 period might
be an insufficiently precise identification of when the market anticipated the change in
disclosure requirements. The Securities Acts Amendments became increasingly likely
throughout 1963 but was probably relatively unlikely for much of 1962. The average
value of the coefficient on the 1963 dummy variable in the three-factor regressions is
1.05 using 1962 as the baseline year. Using yearly dummy variables in the four-factor
regressions results in an average value of .19 for the coefficient on the 1963 dummy
variable with 1962 as the baseline year.9
This is suggestive of the fact that there might well have been a positive abnormal
return associated with market anticipation of the legal change. Overall, however, the
results are not as clear-cut as those regarding volatility.
IX. CONCLUSION
This paper has investigated, using a unique dataset created for this purpose, the
impact that the imposition of mandated disclosure in 1964 had on the OTC market.
Despite the fact that this change was arguably the most fundamental change in the scope
of mandated disclosure with the exception of the Securities Acts themselves, it has never
been studied. This study does not suffer from having to isolate the effects of the Great
Depression from the effects of mandated disclosure. Moreover, changing market
conditions can be controlled for as exchange-listed securities had long been subject to
mandated disclosure by the time mandated disclosure was first imposed on the OTC
market.
This paper tests a variety of hypotheses used in the econometric literature to study
the effects of mandated disclosure. Different researchers have utilized different
hypotheses in the course of analyzing mandated disclosure’s effects. This paper has
attempted to test as many of these hypotheses as is possible given the data available. 9 In both the four-factor and three-factor regression, the average coefficient value for the 1963 dummy value was actually slightly negative using 1962 as the baseline year.
35
In terms of stock return volatility, both cross-sectionally and over time, two
findings stand out. First, relative to the listed market, OTC stock volatility fell
substantially after the imposition of mandated disclosure. The findings with respect to
volatility over time are especially dramatic. Second, in the post-mandated disclosure
period the OTC and listed market behaved in a far more parallel manner than was the
case in the pre-mandated disclosure period. A variety of statistical techniques are used to
measure volatility, all of which support these two basic findings.
Turning to other proxies for improved informational efficiency, the results are not
clear-cut. There is no discernable change in the overall average stock return synchronicity
attributable to mandated disclosure. For reasons given in the paper, there are reasons for
questioning whether average stock return synchronicity in this context is a good proxy in
this setting. The stock return synchronicity findings do indicate, however, that in the
post-mandated disclosure period, the OTC and listed markets behaved in a more parallel
manner along this dimension.
Finally, changes in average and median stock returns resulting from mandated
disclosure are examined in Part IX. Using this particular measure, mandated disclosure
had no clear impact on the OTC market although there is suggestive evidence that
mandated disclosure might have had a beneficial impact.
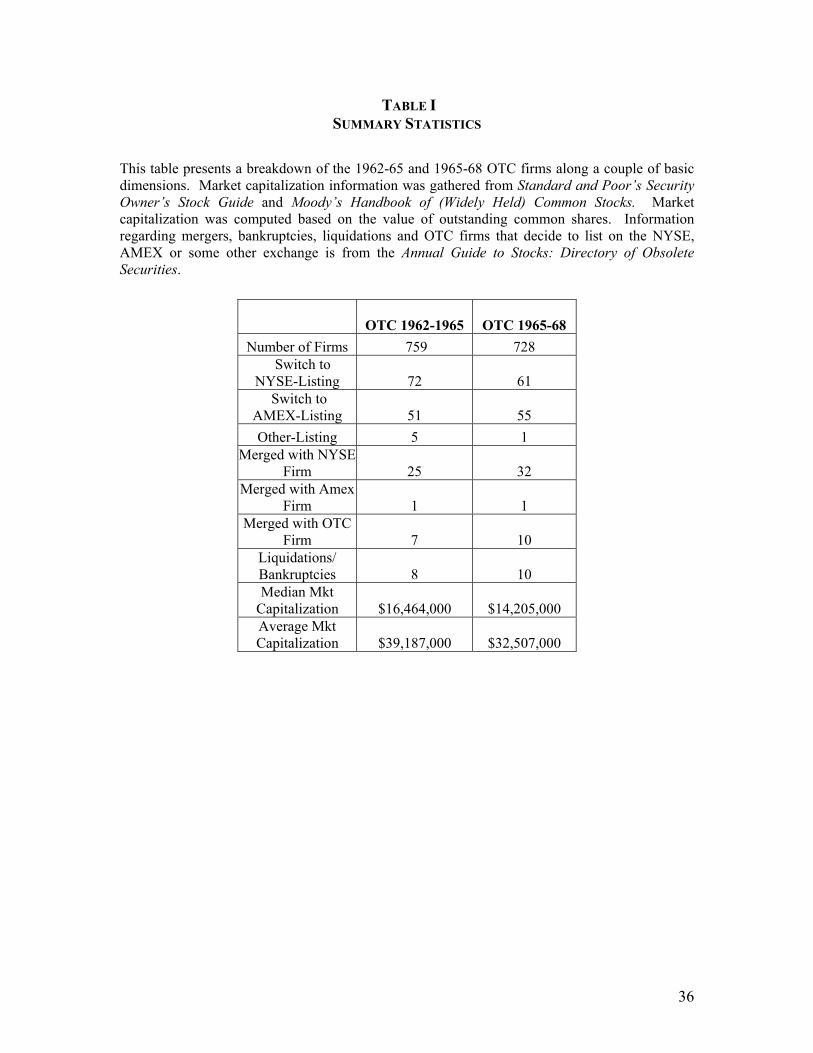
36
TABLE I SUMMARY STATISTICS
This table presents a breakdown of the 1962-65 and 1965-68 OTC firms along a couple of basic dimensions. Market capitalization information was gathered from Standard and Poor’s Security Owner’s Stock Guide and Moody’s Handbook of (Widely Held) Common Stocks. Market capitalization was computed based on the value of outstanding common shares. Information regarding mergers, bankruptcies, liquidations and OTC firms that decide to list on the NYSE, AMEX or some other exchange is from the Annual Guide to Stocks: Directory of Obsolete Securities.
OTC 1962-1965 OTC 1965-68
Number of Firms 759 728 Switch to
NYSE-Listing 72 61 Switch to
AMEX-Listing 51 55 Other-Listing 5 1
Merged with NYSE Firm 25 32
Merged with Amex Firm 1 1
Merged with OTC Firm 7 10
Liquidations/ Bankruptcies 8 10 Median Mkt
Capitalization $16,464,000 $14,205,000 Average Mkt Capitalization $39,187,000 $32,507,000
37
TABLE II SIC CLASSIFICATION
This table presents the percentage breakdown of OTC and exchange-listed firms by their two-digit standard industrial classification (SIC) as of January 1, 1962 and as of January 1, 1965. Companies with six or less observations and financial companies (SIC 60-64 & 67) were dropped. After these companies were dropped, there were 562 OTC companies for which there was SIC information as of January 1, 1962 and 561 OTC companies for which there was SIC information as of January 1, 1965. There were 1,084 exchange-listed companies with SIC information as of January 1, 1962 and 1,981 exchange-listed companies with SIC information as of January 1, 1965. SIC classifications for exchange-listed companies were obtained from the University of Chicago Center for Research in Security Price (CRSP) database. SIC classifications for OTC companies were obtained from Poor’s Registry of Directors, Executives and Officers. SIC classifications with less than 1% of the OTC and exchange-listed companies were dropped in this table. 1962 OTC Market Firms 1965 OTC Market Firms
SIC Percent SIC Percent SIC Percent SIC Percent 13 3.38% 36 14.24% 13 3.92% 36 9.27% 20 4.27% 37 3.03% 20 4.99% 37 2.85% 22 1.60% 38 3.38% 22 1.43% 38 3.39% 23 1.07% 39 2.31% 23 3.03% 39 2.50% 26 2.49% 42 1.78% 26 2.50% 42 1.78% 27 4.09% 48 1.25% 27 3.57% 48 1.07% 28 7.30% 49 10.50% 28 5.17% 49 11.05% 30 1.25% 50 3.20% 30 2.14% 50 3.21% 32 3.20% 54 1.78% 32 2.14% 54 1.78% 33 3.56% 65 1.25% 33 3.74% 65 2.50% 34 2.85% 73 1.42% 34 3.74% 73 2.32% 35 9.25% 89 0.72% 35 8.02% 89 1.07%
38
1962 Listed Market Firms 1965 Listed Market Firms
SIC Percent SIC Percent SIC Percent SIC Percent 10 1.77% 36 6.20% 10 2.37% 36 8.79% 13 1.08% 37 6.35% 13 3.59% 37 5.23% 20 7.09% 38 2.86% 20 5.73% 38 2.62% 21 1.14% 39 0.87% 21 1.00% 39 1.40% 22 2.03% 40 3.75% 22 2.23% 40 1.98% 23 1.56% 45 1.14% 23 2.38% 45 1.19% 26 3.00% 48 0.78% 26 2.44% 48 1.41% 27 1.38% 49 9.95% 27 1.40% 49 6.35% 28 7.41% 50 0.78% 28 6.76% 50 1.98% 29 3.02% 53 2.76% 29 2.14% 53 2.53% 30 1.37% 54 1.60% 30 1.72% 54 1.56% 32 3.31% 56 0.88% 32 2.75% 56 1.01% 33 5.95% 59 0.71% 33 4.57% 59 1.37% 34 3.64% 65 0.38% 34 4.02% 65 1.70% 35 8.97% 35 7.46%
39
TABLE III VARIANCE OF ABNORMAL AND NET-OF-MARKET RETURNS OVER TIME
This table summarizes the variances of abnormal and net-of-market returns. Abnormal returns are calculated from a four-factor model with yearly time dummies using book-to-market, firm size, market return in excess of the risk-free rate, and industry average return in excess of the risk-free and market return as explanatory factors using Newey-West (1987) autocorrelation- and heteroskedasticity-consistent standard errors. Based on the four-factor model with yearly time dummies, an abnormal return is calculated for each month for each stock. The variance of abnormal returns is then calculated for each stock by year and pre- and post-mandated disclosure periods. The average of these variances, by time period and market, is reported in Section A. Section B reports the average variance by year and pre- and post-mandated disclosure periods of net-of-market returns. Net-of-market return for a stock is its stock return minus the market return for a given month. The market return is a value-weighted market index as reported in Kenneth French’s datalibrary. Stocks with returns greater than ±250% were dropped as outliers (for a total of eleven observations).
A. Average Variance of Abnormal Returns over Time
Year Variance of OTC Market Abnormal Return
Variance of Listed Market Abnormal Return
1962 105.65 28.83 1963 149.76 32.36 1964 158.23 38.28 1965 85.19 81.33 1966 74.64 77.18 1967 92.68 104.59
1962-65 140.49 33.24 1965-68 90.18 90.94
B. Average Variance of Net-of-Market Returns over Time
Year Variance of OTC
Net-of-Market Returns
Variance of Listed Net-of-Market Abnormal
Returns 1962 178.88 50.42 1963 234.81 41.78 1964 240.77 47.49 1965 125.12 108.37 1966 129.57 121.70 1967 179.01 145.37
1962-65 226.29 47.32 1965-68 156.19 128.63
40
TABLE IV SMALL MARKET CAPITALIZATION RESULTS
This table displays the variance of abnormal returns for OTC firms with between one and ten million dollars in common stock market capitalization (OTC Small-Cap). Firms in this group had common stock market capitalizations between 1 and 10 million dollars in each period. Common stock market capitalization was collected from Security and Poor’s Security Owner’s Stock Guide and Moody’s Handbook of (Widely Held) Common Stock. There were 181 such companies in the pre-mandated disclosure period and 205 such companies in the post-mandated disclosure period with SIC information available from Poor’s Registry of Directors, Executives and Officers. Returns that exceeded ±250% were dropped from the data as outliers (for a total of eleven observations). Two types of variances are calculated below: the average cross-sectional variance of abnormal returns using a four-factor model by year (Section A) and the average variance of abnormal returns over time using a four-factor model with time dummies (Section B). Variances in Section B are averaged by year and the pre- and post-mandated disclosure periods. The four explanatory factors are book-to-market, firm size, value-weighted market return in excess of the risk-free rate of return, and the industry return in excess of the risk-free and market returns. All abnormal returns are calculated using Newey-West (1987) autocorrelation- and heteroskedasticity-consistent standard errors.
A. Variance of Abnormal Returns of OTC Small-Cap by Year
Time Elapsed Pre-Mandated
Disclosure Post-Mandated
Disclosure F-Statistic
(for difference) OTC 1-12 months 15.93 13.97 1.14
Market 13-24 months 17.65 16.45 1.07 25-36 months 18.58 22.32 1.20
B. Average Variance of Abnormal Returns of OTC Small-Cap over Time
Year Variance of Monthly Abnormal Returns
1962 184.70 1963 254.75 1964 297.44 1965 141.95 1966 133.23 1967 185.21
1962-65 248.11 1965-68 164.99
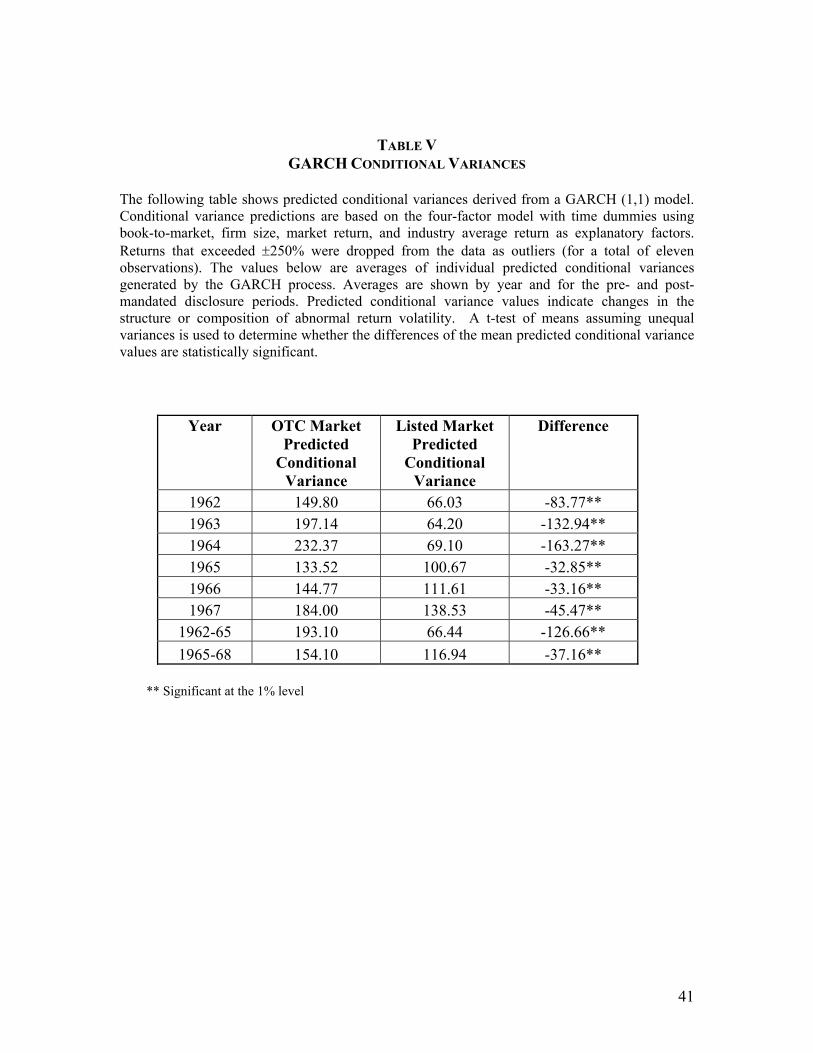
41
TABLE V GARCH CONDITIONAL VARIANCES
The following table shows predicted conditional variances derived from a GARCH (1,1) model. Conditional variance predictions are based on the four-factor model with time dummies using book-to-market, firm size, market return, and industry average return as explanatory factors. Returns that exceeded ±250% were dropped from the data as outliers (for a total of eleven observations). The values below are averages of individual predicted conditional variances generated by the GARCH process. Averages are shown by year and for the pre- and post-mandated disclosure periods. Predicted conditional variance values indicate changes in the structure or composition of abnormal return volatility. A t-test of means assuming unequal variances is used to determine whether the differences of the mean predicted conditional variance values are statistically significant.
Year OTC Market Predicted
Conditional Variance
Listed Market Predicted
Conditional Variance
Difference
1962 149.80 66.03 -83.77** 1963 197.14 64.20 -132.94** 1964 232.37 69.10 -163.27** 1965 133.52 100.67 -32.85** 1966 144.77 111.61 -33.16** 1967 184.00 138.53 -45.47**
1962-65 193.10 66.44 -126.66** 1965-68 154.10 116.94 -37.16**
** Significant at the 1% level
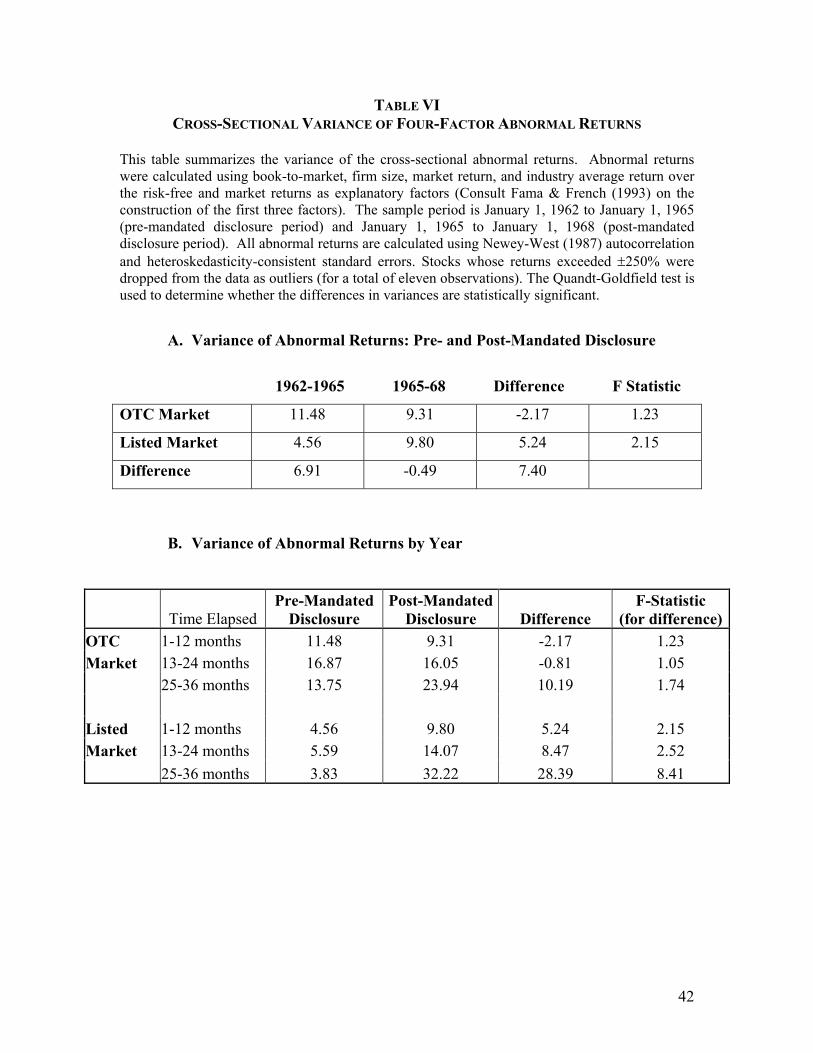
42
TABLE VI CROSS-SECTIONAL VARIANCE OF FOUR-FACTOR ABNORMAL RETURNS
This table summarizes the variance of the cross-sectional abnormal returns. Abnormal returns were calculated using book-to-market, firm size, market return, and industry average return over the risk-free and market returns as explanatory factors (Consult Fama & French (1993) on the construction of the first three factors). The sample period is January 1, 1962 to January 1, 1965 (pre-mandated disclosure period) and January 1, 1965 to January 1, 1968 (post-mandated disclosure period). All abnormal returns are calculated using Newey-West (1987) autocorrelation and heteroskedasticity-consistent standard errors. Stocks whose returns exceeded ±250% were dropped from the data as outliers (for a total of eleven observations). The Quandt-Goldfield test is used to determine whether the differences in variances are statistically significant.
A. Variance of Abnormal Returns: Pre- and Post-Mandated Disclosure
1962-1965 1965-68 Difference F Statistic
OTC Market 11.48 9.31 -2.17 1.23
Listed Market 4.56 9.80 5.24 2.15
Difference 6.91 -0.49 7.40
B. Variance of Abnormal Returns by Year
Time Elapsed Pre-Mandated
Disclosure Post-Mandated
Disclosure Difference F-Statistic
(for difference)OTC 1-12 months 11.48 9.31 -2.17 1.23 Market 13-24 months 16.87 16.05 -0.81 1.05 25-36 months 13.75 23.94 10.19 1.74 Listed 1-12 months 4.56 9.80 5.24 2.15 Market 13-24 months 5.59 14.07 8.47 2.52 25-36 months 3.83 32.22 28.39 8.41
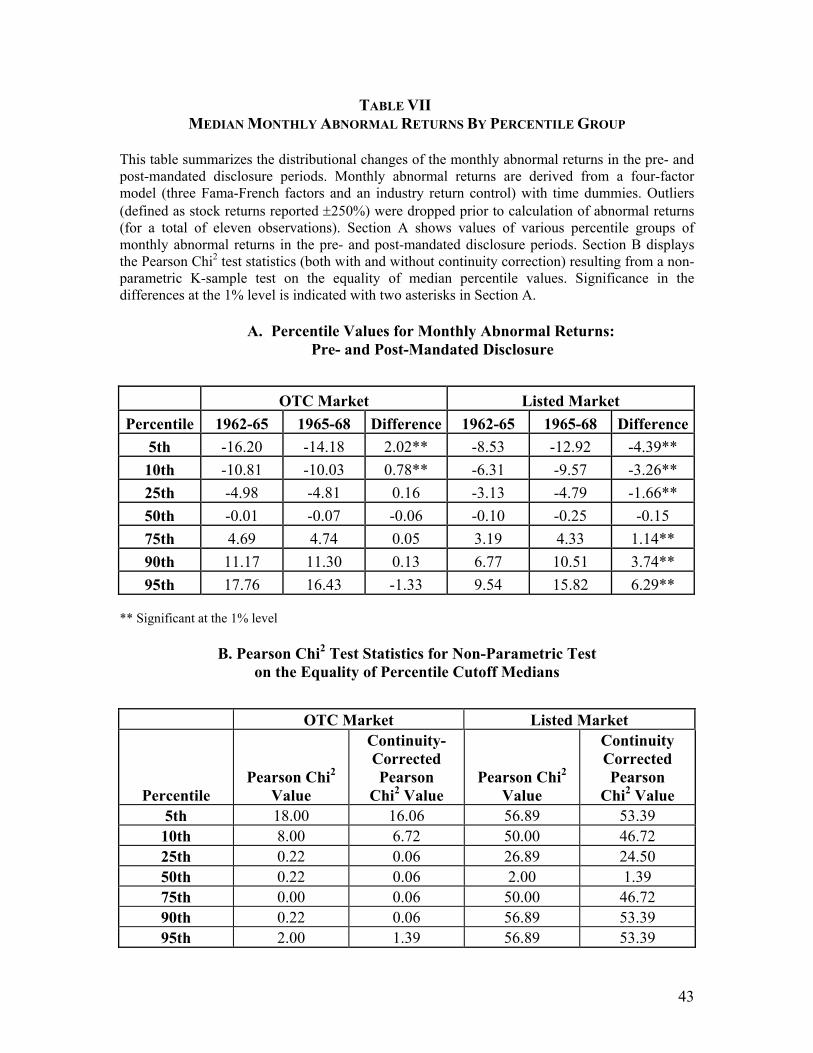
43
TABLE VII MEDIAN MONTHLY ABNORMAL RETURNS BY PERCENTILE GROUP
This table summarizes the distributional changes of the monthly abnormal returns in the pre- and post-mandated disclosure periods. Monthly abnormal returns are derived from a four-factor model (three Fama-French factors and an industry return control) with time dummies. Outliers (defined as stock returns reported ±250%) were dropped prior to calculation of abnormal returns (for a total of eleven observations). Section A shows values of various percentile groups of monthly abnormal returns in the pre- and post-mandated disclosure periods. Section B displays the Pearson Chi2 test statistics (both with and without continuity correction) resulting from a non-parametric K-sample test on the equality of median percentile values. Significance in the differences at the 1% level is indicated with two asterisks in Section A.
A. Percentile Values for Monthly Abnormal Returns:
Pre- and Post-Mandated Disclosure
OTC Market Listed Market Percentile 1962-65 1965-68 Difference 1962-65 1965-68 Difference
5th -16.20 -14.18 2.02** -8.53 -12.92 -4.39** 10th -10.81 -10.03 0.78** -6.31 -9.57 -3.26** 25th -4.98 -4.81 0.16 -3.13 -4.79 -1.66** 50th -0.01 -0.07 -0.06 -0.10 -0.25 -0.15 75th 4.69 4.74 0.05 3.19 4.33 1.14** 90th 11.17 11.30 0.13 6.77 10.51 3.74** 95th 17.76 16.43 -1.33 9.54 15.82 6.29**
** Significant at the 1% level
B. Pearson Chi2 Test Statistics for Non-Parametric Test
on the Equality of Percentile Cutoff Medians
OTC Market Listed Market
Percentile Pearson Chi2
Value
Continuity- Corrected Pearson
Chi2 Value Pearson Chi2
Value
Continuity Corrected Pearson
Chi2 Value 5th 18.00 16.06 56.89 53.39 10th 8.00 6.72 50.00 46.72 25th 0.22 0.06 26.89 24.50 50th 0.22 0.06 2.00 1.39 75th 0.00 0.06 50.00 46.72 90th 0.22 0.06 56.89 53.39 95th 2.00 1.39 56.89 53.39
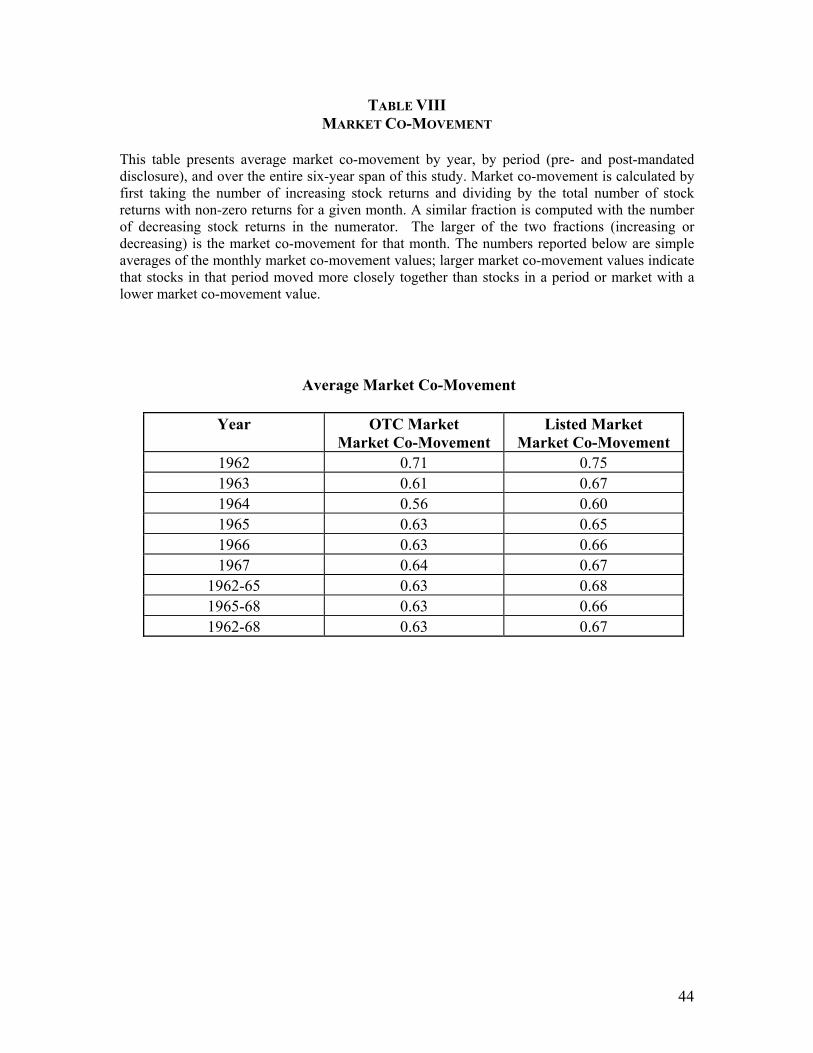
44
TABLE VIII MARKET CO-MOVEMENT
This table presents average market co-movement by year, by period (pre- and post-mandated disclosure), and over the entire six-year span of this study. Market co-movement is calculated by first taking the number of increasing stock returns and dividing by the total number of stock returns with non-zero returns for a given month. A similar fraction is computed with the number of decreasing stock returns in the numerator. The larger of the two fractions (increasing or decreasing) is the market co-movement for that month. The numbers reported below are simple averages of the monthly market co-movement values; larger market co-movement values indicate that stocks in that period moved more closely together than stocks in a period or market with a lower market co-movement value.
Average Market Co-Movement
Year OTC Market Market Co-Movement
Listed Market Market Co-Movement
1962 0.71 0.75 1963 0.61 0.67 1964 0.56 0.60 1965 0.63 0.65 1966 0.63 0.66 1967 0.64 0.67
1962-65 0.63 0.68 1965-68 0.63 0.66 1962-68 0.63 0.67
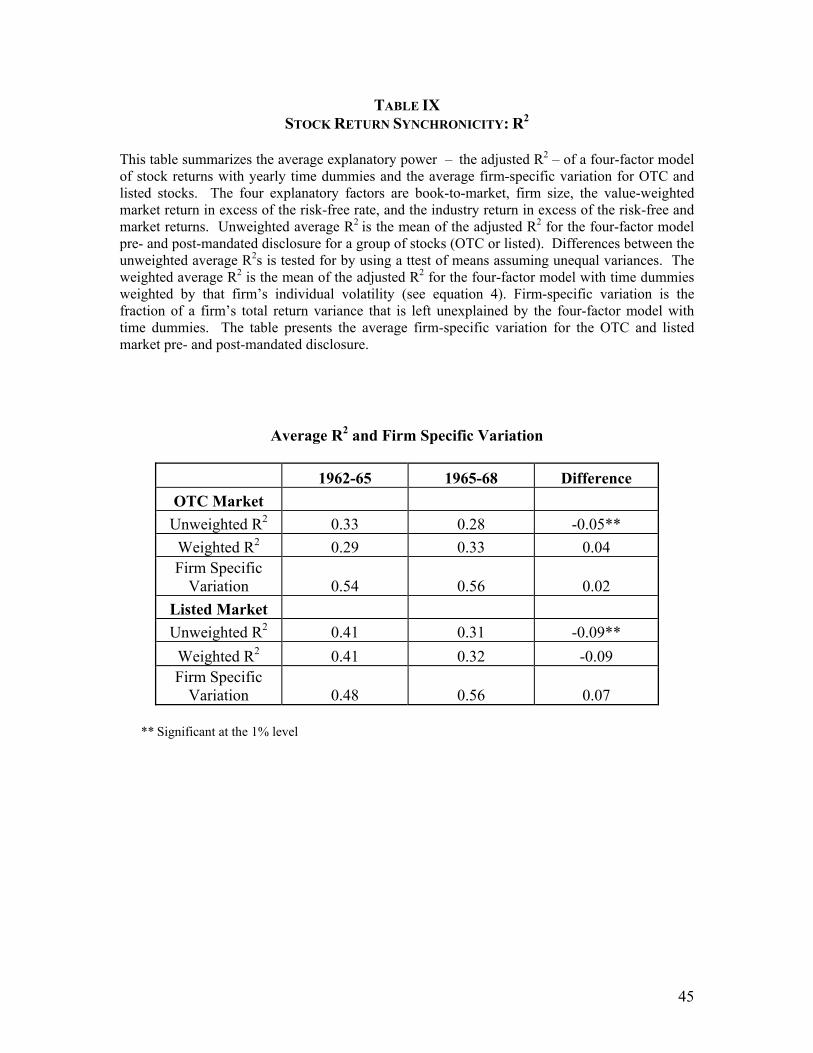
45
TABLE IX STOCK RETURN SYNCHRONICITY: R2
This table summarizes the average explanatory power – the adjusted R2 – of a four-factor model of stock returns with yearly time dummies and the average firm-specific variation for OTC and listed stocks. The four explanatory factors are book-to-market, firm size, the value-weighted market return in excess of the risk-free rate, and the industry return in excess of the risk-free and market returns. Unweighted average R2 is the mean of the adjusted R2 for the four-factor model pre- and post-mandated disclosure for a group of stocks (OTC or listed). Differences between the unweighted average R2s is tested for by using a ttest of means assuming unequal variances. The weighted average R2 is the mean of the adjusted R2 for the four-factor model with time dummies weighted by that firm’s individual volatility (see equation 4). Firm-specific variation is the fraction of a firm’s total return variance that is left unexplained by the four-factor model with time dummies. The table presents the average firm-specific variation for the OTC and listed market pre- and post-mandated disclosure.
Average R2 and Firm Specific Variation
1962-65 1965-68 Difference OTC Market Unweighted R2 0.33 0.28 -0.05** Weighted R2 0.29 0.33 0.04 Firm Specific
Variation 0.54 0.56 0.02 Listed Market Unweighted R2 0.41 0.31 -0.09** Weighted R2 0.41 0.32 -0.09 Firm Specific
Variation 0.48 0.56 0.07 ** Significant at the 1% level

46
TABLE X MEDIAN AND AVERAGE ABNORMAL RETURNS
This table shows the median values of monthly abnormal returns (part A) and the mean values of abnormal returns (part B) for each market in the pre- and post-mandated disclosure periods. The table also shows the appropriate difference values as well as their significance (note that none of the values below are significant at the 10% levels). Significance of the median values is determined by a K-sample nonparametric test on the equality of medians; significance of the average abnormal return is computed using a two-sample t-test of means assuming unequal variances, with standard errors reported in parentheses. Both abnormal returns are based on a four-factor model with yearly time dummies using book-to-market, firm size, market return in excess of the risk-free rate, and industry average return in excess of the risk-free and market returns as explanatory factors. Return values that exceeded ± 250% were dropped as outliers (for a total of eleven observations).
A. Median Monthly Abnormal Return
OTC Market 1962-1965 1965-1968 Difference Median -0.01 -0.07 -0.06
Listed Market 1962-1965 1965-1968 Difference Median -0.1 -0.25 -0.15
B. Average Abnormal Returns
OTC Market 1962-1965 1965-1968 Difference Average 0.26
(0.024) 0.33
(0.021) 0.07
(0.032) Listed Market 1962-1965 1965-1968 Difference
Average 0.26 (0.010)
0.35 (0.012)
0.09 (0.015)
Difference-in-
Difference Difference 0.00
(0.026) -0.02 (0.024)
0.02 (0.036)

47
Benston, George, 1973, Required Disclosure and the Stock Market: An Evaluation of the Securities Exchange Act of 1934, 63 American Economic Review 132
Benston, George, 1975, Required Disclosure and the Stock Market: Rejoinder, 65
American Economic Review 473
Brown, Stephen & Warner, Jerold, 1980, Measuring Security Price Performance, 8 Journal of Financial Economics 205
Campbell, John, Lettau, Martin, Malkiel, Burton, and Xu, Yexiao, 2001, Have Individual Stocks Become More Volatile? An Empirical Exploration of Idiosyncratic Risk, 56 Journal of Finance.
Coffee, John, 1984, Market Failure and the Economic Case for a Mandatory Disclosure System, 70 Va. L.Rev. 717.
Durnev, Artyom, Fox, Merritt, Morck, Randall, & Yeung, Bernard, 2001a, Law, Share Price Accuracy and Economic Performance: The New Evidence, working paper
Durnev, Artyom, Morck, Randall, Yeung, Bernard, and Zarown, 2001b, Does Greater Firm-Specific Return Variation Mean More or Less Informed Stock Pricing?, working paper
Fama, Eugene, and French, Kenneth, 1992, The Cross-Section of Expected Stock Returns, 47 Journal of Finance 427
Fama, Eugene, and French, Kenneth, 1993, Common Risk Factors on the Returns of Stocks and Bonds, Journal of Financial Economics
Fame, Eugene and French, Kenneth, 1995, Size and Book-to-Market factors in earnings and returns, 50 Journal of Finance 131 (1995).
Fox, Merritt, Retaining Mandatory Securities Disclosure: Why Issuer Choice is Not Investor Empowerment, 85 Virginia Law Review 1371 (1999).
Friend, Hoffman, Winn, 1958, THE OVER-THE-COUNTER SECURITIES MARKETS.
Friend, Irwin and Herman, E.S., Professor Stigler on Securities Regulation: A Further Comment, 38 Journal of Business 106 (1965)
48
Friend, Irwin and Westerfield, Randolph, Required Disclosure and the Stock Market: Comment, American Economic Review 467 (1975)
Goldfeld, Stephen & Quandt, Richard, Some Tests for Homoscedasticity, 1965, 60 Journal of The American Statistical Association 539
Griffin, John and Lemmon, Michael, Book-to-Market Equity, Distress Risk, and Stock Returns, 57 Journal of Finance 2317 (2002)
Jarrell, Gregg, The Economic Effects of Federal Regulation of the Market for New Security Issues, 24 Journal of Law and Economics 613 (1984)
Leroy, Stephen, and Porter, Richard, 1981, The Present-Value Relation: Tests Based on Implied Variance Bounds, 49 Econometrica 555-574
Morck, Randall, Yeung, Bernard, and Yu, Wayne, 2000, Informational Content of Stock Markets: Why do Emerging Markets have Synchronous Stock Price Movements?, 58 Journal of Financial Economics 215
Roll, Richard, 1988, R-Squared, 43 Journal of Finance 541
Romano, Roberta, 1998, Empowering Investors: A Market Approach to Securities Regulation, 107 Yale L.J. 2359.
Securities and Exchange Commission, THE REPORT OF SPECIAL STUDY OF SECURITIES MARKETS (1963)
Securities and Exchange Commission, Summary of the Security Acts Amendments of 1964, 1964 LEXIS 101 (September 15, 1964).
Seligman, Joel, The Historical Need for a Mandatory Corporate Disclosure System, 9 J.Corp. L. 1 (1983).
Simon, Carol, 1989, The Effect of the 1933 Securities Act on Investor Information and the Performance of New Issues, 79 American Economic Review 295
Stigler, George, 1964, Public Regulation of the Securities Markets, 37 Journal of Business 117.

49
West, Kenneth, 1988, Dividend Innovations and Stock Price Volatility, 56 Econometrica 37-61.
Wurgler, Jeffrey, 2000, Financial Markets and the Allocation of Capital, Journal of Financial Economics