Embed Size (px)
Citation preview

7/31/2019 Managment of Cash Flow
http://slidepdf.com/reader/full/managment-of-cash-flow 1/27
CASH FLOW MANAGEMENT INCONSTRUCTION PROJECTS

7/31/2019 Managment of Cash Flow
http://slidepdf.com/reader/full/managment-of-cash-flow 2/27
Contents
Abstract ........................................................................................................................................................ 5Introduction ................................................................................................................................................. 6
Type of Contracts ........................................................................................................................................ 6
Analyzing of the cash flow .......................................................................................................................... 7
Determination of the required funding. .................................................................................................... 9
Reducing of the required funding. ........................................................................................................... 10
Risk Factor ................................................................................................................................................ 15
Effect of risk on the cash flow .................................................................................................................. 16Expected Monetary Value (EMV) ........................................................................................................... 17
List of references
Bibliography
Acknowledgment
Appendix I

7/31/2019 Managment of Cash Flow
http://slidepdf.com/reader/full/managment-of-cash-flow 3/27
List of Figures
Figure 1a: Cash flow in & Out For Reimbursable & (T&M) Contract .......................................... 8Figure 1b: Cash flow in & Out For Lump sum Contract ................................................................ 8
Figure 2: Workshop Factory .......................................................... Error! Bookmark not defined.Figure 3: Cash Flow In&Out for Scenario "A" ............................. Error! Bookmark not defined.Figure 4: Cash Flow In&Out for Scenario "C" ............................................................................. 12Figure 5: Cash Flow In&Out for Scenario "B" ............................................................................. 12

7/31/2019 Managment of Cash Flow
http://slidepdf.com/reader/full/managment-of-cash-flow 4/27
List of Tables
Table 1: Payment Schedule for Workshop Factory ....................................................................................... 9
Table 2: Cash In & Out for Scenario "A" ................................................................................................... 11
Table 3: Cash In & Out for Scenario "B" ................................................................................................... 11Table 4:Cash In & Out for Scenario "C" .................................................................................................... 11
7/31/2019 Managment of Cash Flow
http://slidepdf.com/reader/full/managment-of-cash-flow 5/27
Abstract
The cash flow is a major factor should be considered during the process of developing the project
execution management plan. The importance of cash flow management is in determining therequired amount of money to be funded by the contractor and also the time when this money will
be required. The payment method by which the contractor will receive his money from the client
is a key item in the analysis of cash flow and it should be determined in the contract. Actually it
depends on the type of contract if it is lump sum or reimbursed contract. Another key item
should be considered in the cash flow analysis is the risk, whether it is an opportunity or a threat,
especially the one which is related to the procurement procedures, in order to determine the time
for purchasing the required material, mainly for the long lead items. The purpose of this study is
describing a simple way to develop more than one scenario for the execution plan and how to
compare between these scenarios to decide the best scenario which will obtain the maximum
benefit for the contractor with a minimum required funding.
7/31/2019 Managment of Cash Flow
http://slidepdf.com/reader/full/managment-of-cash-flow 6/27
Introduction
The ability of developing alternate scenarios for the project execution plan requires a very
experienced team to study the type of contracts, payment method, procurement procedures andrisk with any other factors to analyze the cash liquidity and the required funding for each
scenario then decide the best scenario to execute the project.
Types of Contracts
Type of contracts is an important item in the management procedures of the construction
projects. This importance comes from determination of the payment method which the contractor
will be reimbursed for his completed works and how the final contract amount will be calculated.
There are three main types of contracts can be used:
1. Fixed Price Contract (Lump Sum )
In this type of contract the total value of work is known before signing the contract and the
contractor will be entitled for invoices according to agreed payment schedule created against the
completion of a certain work stage.
The contractor abides to complete the whole required works within the contract against the
agreed amount so he will take the full responsibility of risk except for the force majeure.
There are three different ways can be used to formulate this type of contract.
1.1. Firm Fixed Price contract.
3
1.2. Fixed price with incentive fee.
1.3. Fixed price with economic adjusted price.
2. Reimbursable Contract.
7/31/2019 Managment of Cash Flow
http://slidepdf.com/reader/full/managment-of-cash-flow 7/27
There are three different ways can be used to formulate this type of contract.
2.1. Cost plus Fixed Fee contract.
3
2.2. Cost plus Incentive Fee.
2.3. Cost plus Award Fee.
3. Time and Material Contract (T&M) or Remeasured Contract.
This contract is a mix between the lump sum contract and reimbursable contract where the actual
rate for the works is known but the actual quantity is unknown. So the contractor will be entitled
for payments by measuring the actual completed quantity and calculate the cost according the
agreed rate for each item.
In this type of contract the risk responsibility will be shered between the owner and contractor
Analyzing of the cash flow
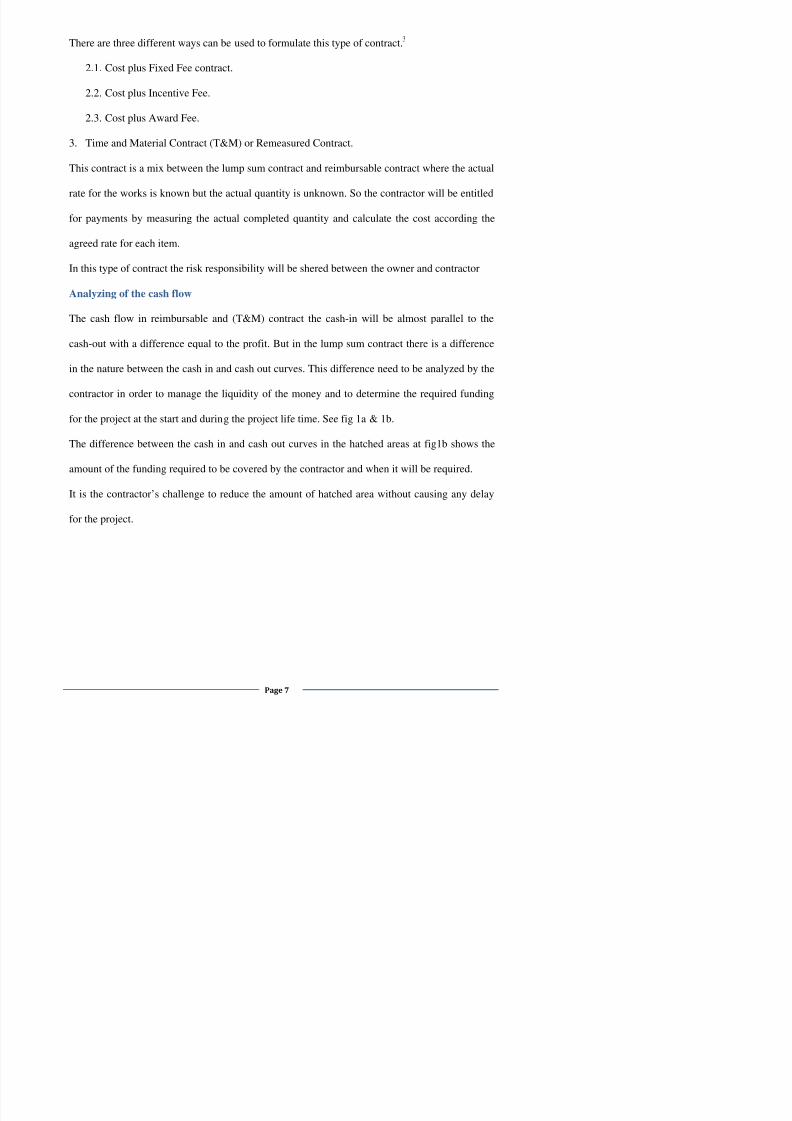
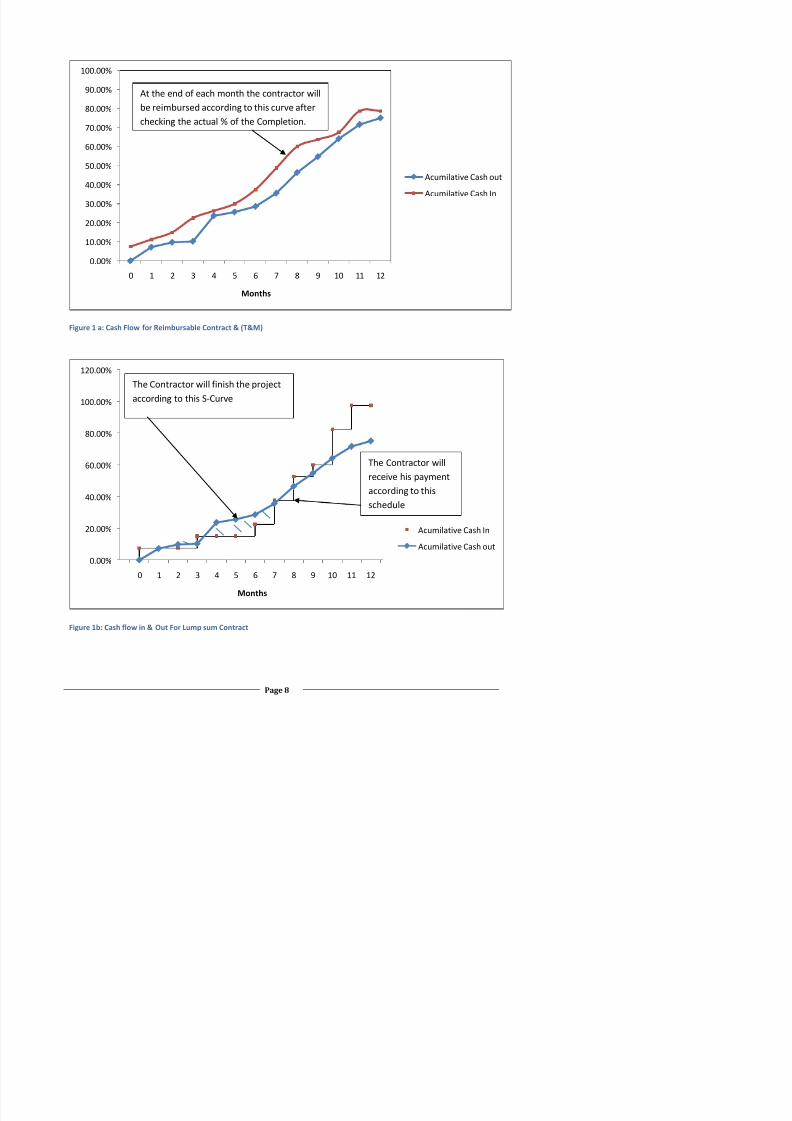
The cash flow in reimbursable and (T&M) contract the cash-in will be almost parallel to the
cash-out with a difference equal to the profit. But in the lump sum contract there is a difference
in the nature between the cash in and cash out curves. This difference need to be analyzed by the
contractor in order to manage the liquidity of the money and to determine the required funding
for the project at the start and during the project life time. See fig 1a & 1b.
The difference between the cash in and cash out curves in the hatched areas at fig1b shows the
amount of the funding required to be covered by the contractor and when it will be required.
It is the contractor’s challenge to reduce the amount of hatched area without causing any delay
for the project.
7/31/2019 Managment of Cash Flow
http://slidepdf.com/reader/full/managment-of-cash-flow 8/27
Figure 1 a: Cash Flow for Reimbursable Contract & (T&M)
0.00%
10.00%
20.00%
30.00%
40.00%
50.00%
60.00%
70.00%
80.00%
90.00%
100.00%
0 1 2 3 4 5 6 7 8 9 10 11 12
Months
Acumilative Cash out
Acumilative Cash In
20.00%
40.00%
60.00%
80.00%
100.00%
120.00%
Acumilative Cash In
Acumilative Cash out
At the end of each month the contractor willbe reimbursed according to this curve afterchecking the actual % of the Completion.
The Contractor will finish the project
according to this S-Curve
The Contractor willreceive his payment
according to thisschedule
7/31/2019 Managment of Cash Flow
http://slidepdf.com/reader/full/managment-of-cash-flow 9/27
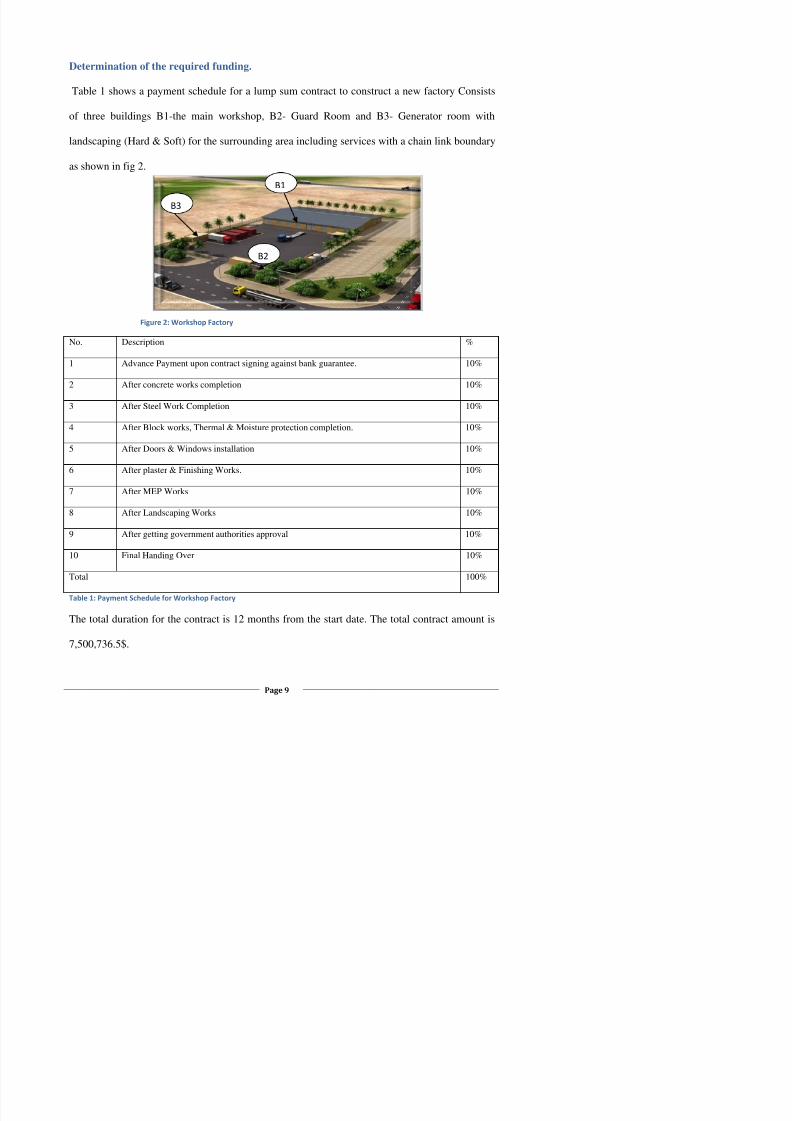
Determination of the required funding.
Table 1 shows a payment schedule for a lump sum contract to construct a new factory Consists
of three buildings B1-the main workshop, B2- Guard Room and B3- Generator room with
landscaping (Hard & Soft) for the surrounding area including services with a chain link boundary
as shown in fig 2.
No. Description %
1 Advance Payment upon contract signing against bank guarantee. 10%
2 After concrete works completion 10%
3 After Steel Work Completion 10%
4 After Block works, Thermal & Moisture protection completion. 10%
5 After Doors & Windows installation 10%
6 After plaster & Finishing Works. 10%
7 After MEP Works 10%
8 After Landscaping Works 10%
9 After getting government authorities approval 10%
10 Final Handing Over 10%
Figure 2: Workshop Factory
B2
B3
B1
7/31/2019 Managment of Cash Flow
http://slidepdf.com/reader/full/managment-of-cash-flow 10/27
In order to determine the required funding for this project the contractor has to go through the
following procedures:
1. Define precisely the required scope of works according to drawings, specifications, contract
and all related documents.
2. The result from the previous procedure is the WBS “Work Break Down Structure”
3. By analyzing the WBS the contractor will have the list of activities and can start the
estimation of cost and time required to finish each activity.
4. Assume the relationship between activities. Then develop the project time schedule and
budget (S-Curve) accordingly.
5. Draw the s-Curve and the payment schedule on the same curve in order to determine the
required funding for the project.
6. The result should be something like the chart in fig1b.
Reducing of the required funding.
To reduce the required funding the contractor will need to develop more than one scenario then
compare between the cash flow in & out for each of them. There are many methods to develop
these alternative scenarios some of them are
- Resource leveling by moving the non critical activity within the float in order to reduce
the overtime expenses.
- Adjust the schedule for the subcontractor and supplier payments.
- Study the schedule of procurement taking into consideration all risk which will be
associated with it (some item may not be available later or the risk related to the long
7/31/2019 Managment of Cash Flow
http://slidepdf.com/reader/full/managment-of-cash-flow 11/27
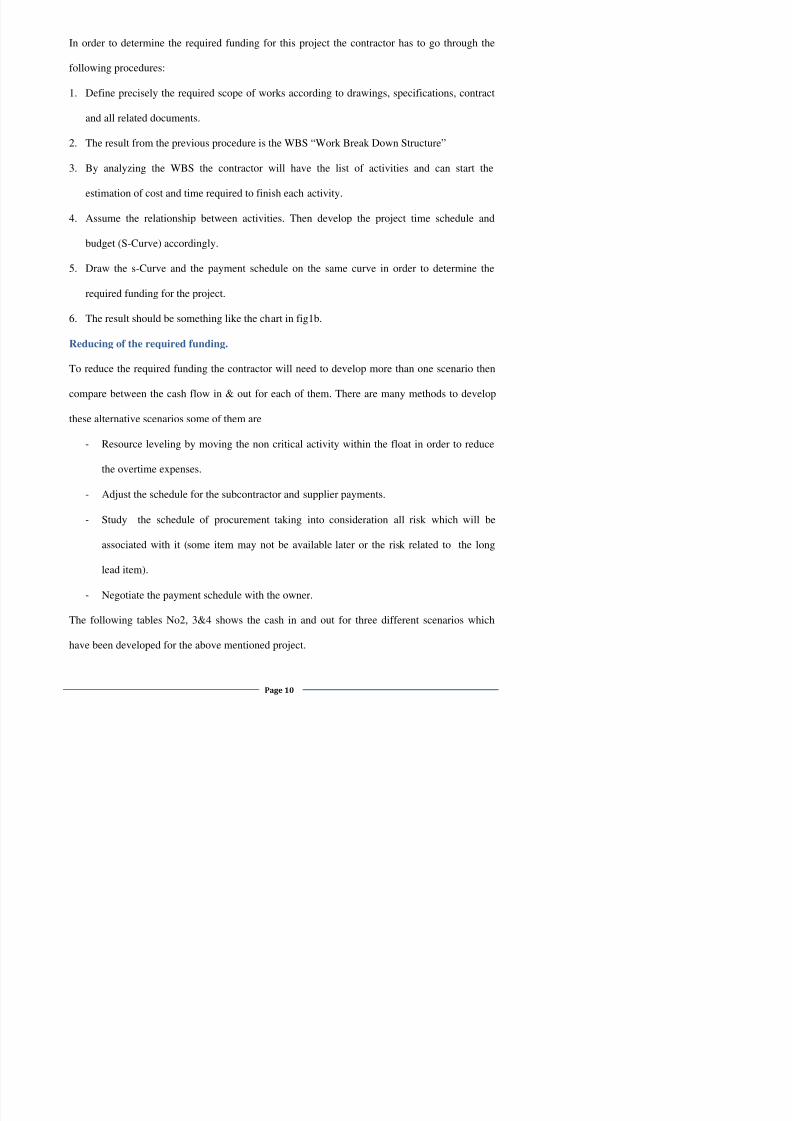
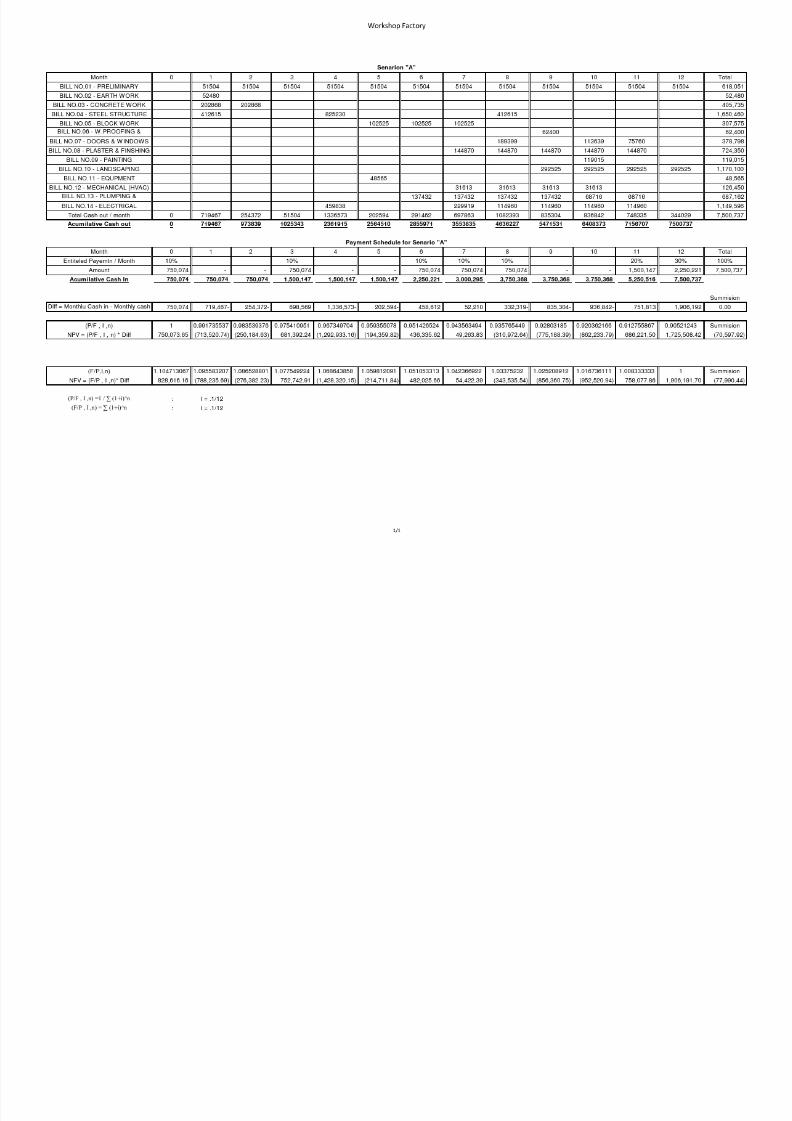
Duration
(Months)
0 1 2 3 4 5 6 7 8 9 10 11 12
Cash out 0% 10% 3% 1% 18% 3% 4% 9% 14% 11% 12% 10% 5%
Cash in 10% 0% 0% 10% 0% 0% 10% 10% 10% 0% 0% 20% 30%
Difference 10% -10% -3% 9% -18% -3% 6% 1% -4% -11% -12% 10% 25%
Table 2: Cash In & Out for Scenario "A"
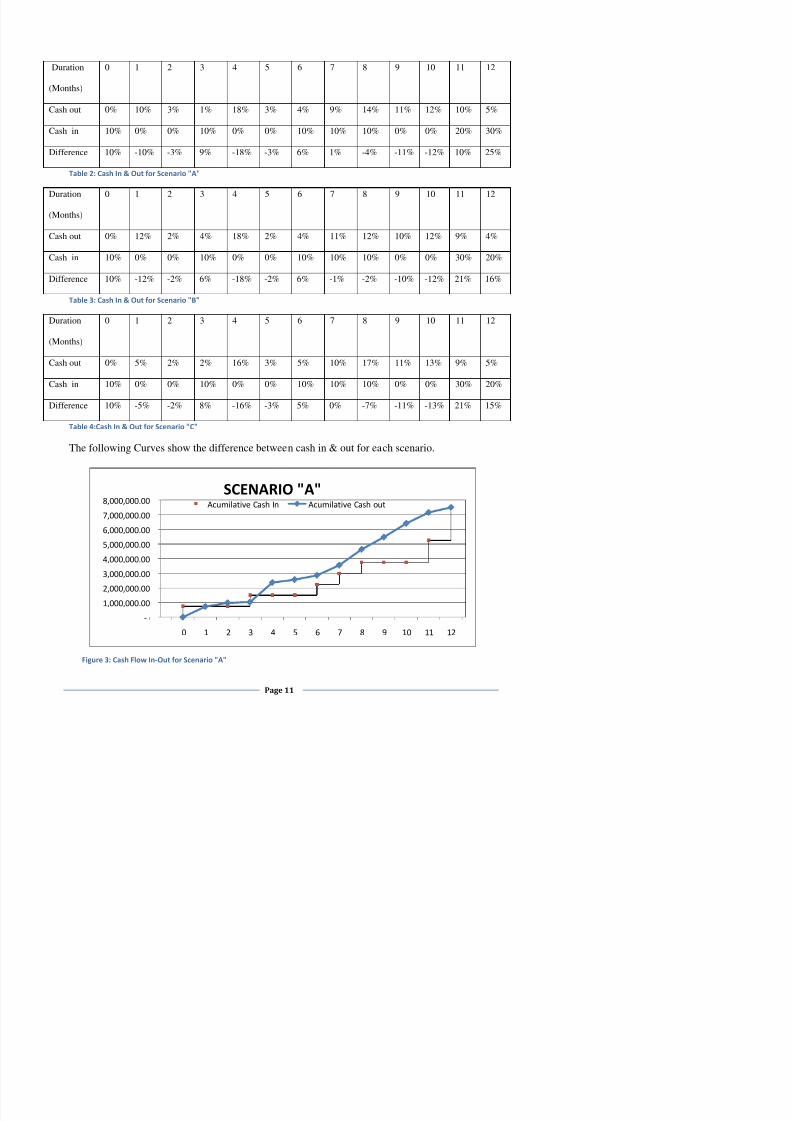
Duration
(Months)
0 1 2 3 4 5 6 7 8 9 10 11 12
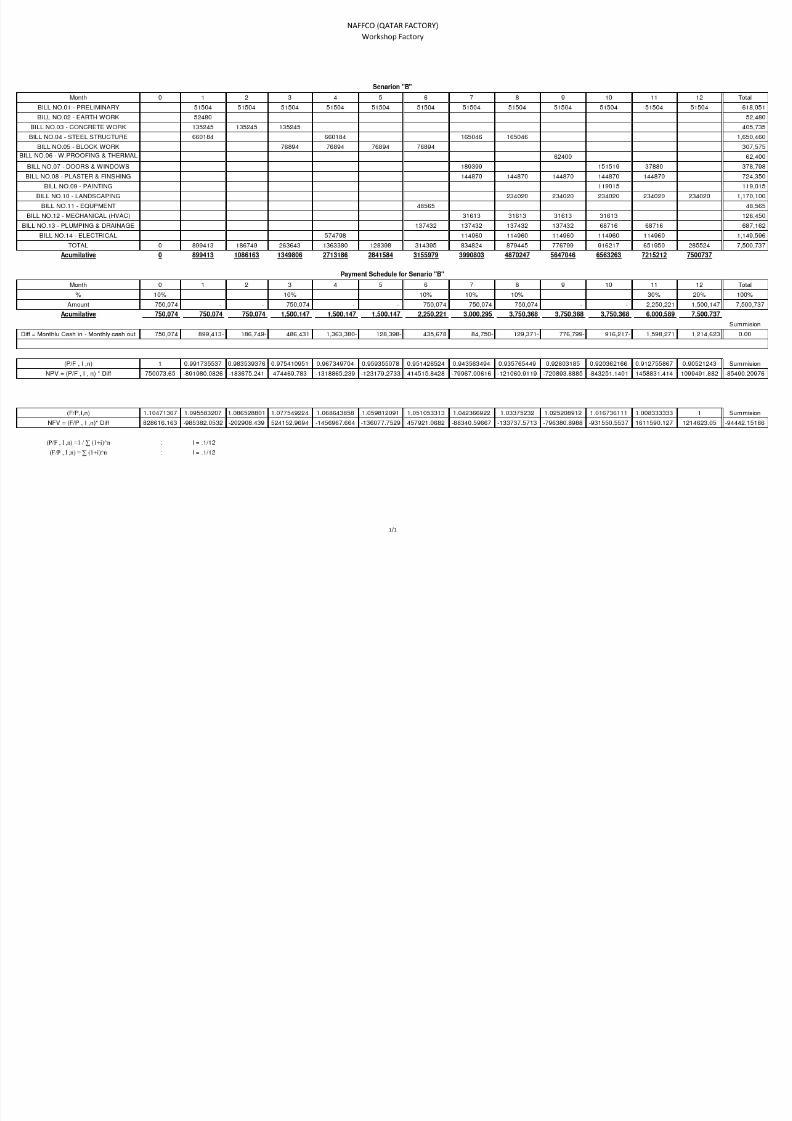
Cash out 0% 12% 2% 4% 18% 2% 4% 11% 12% 10% 12% 9% 4%
Cash in 10% 0% 0% 10% 0% 0% 10% 10% 10% 0% 0% 30% 20%
Difference 10% -12% -2% 6% -18% -2% 6% -1% -2% -10% -12% 21% 16%
Table 3: Cash In & Out for Scenario "B"
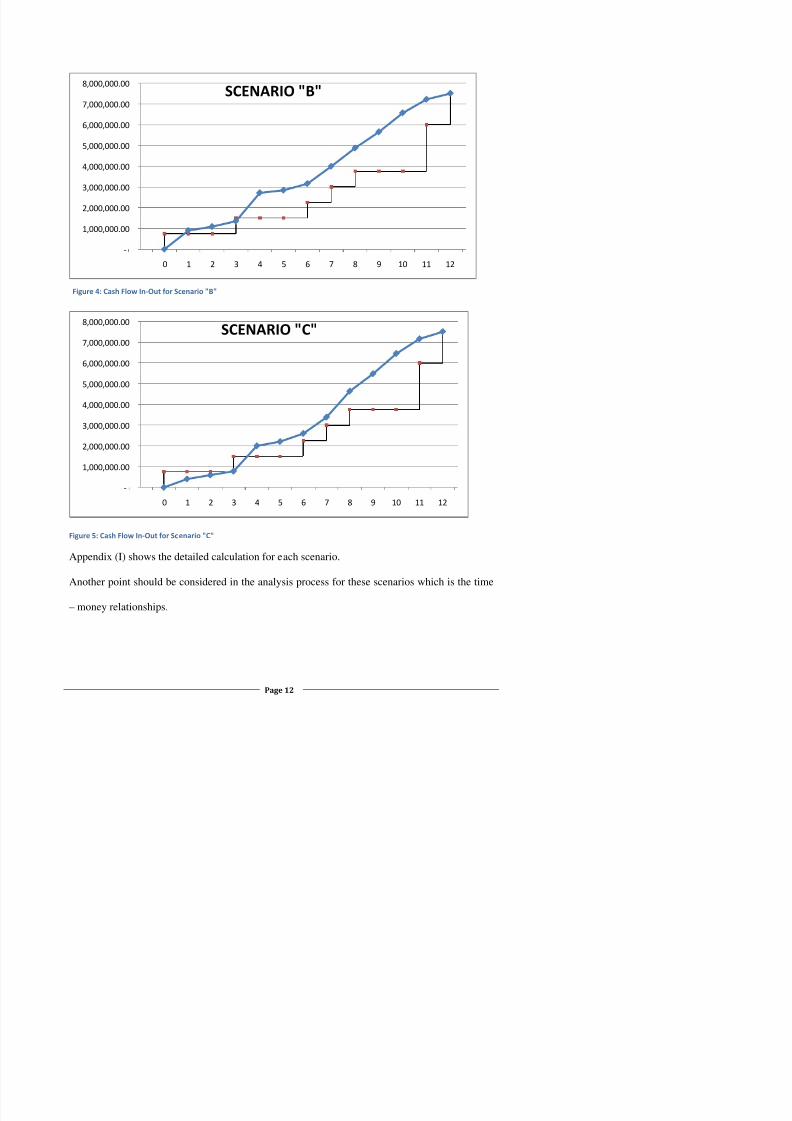
Duration
(Months)
0 1 2 3 4 5 6 7 8 9 10 11 12
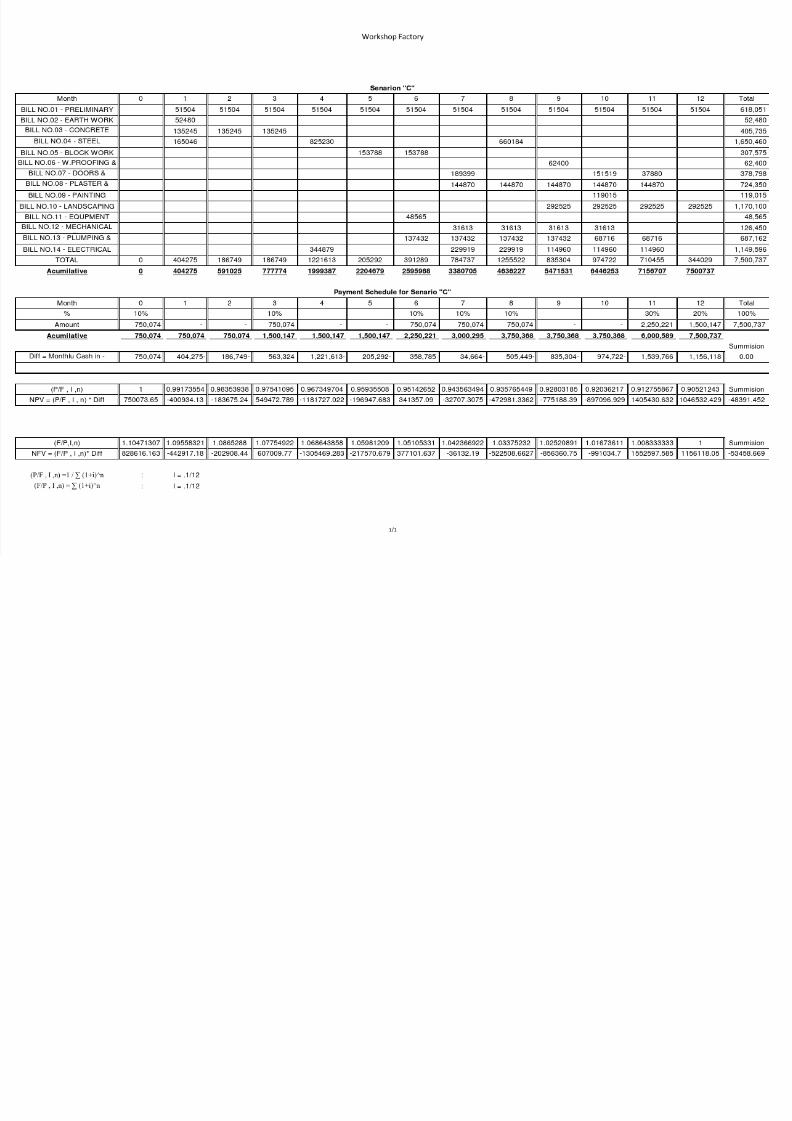
Cash out 0% 5% 2% 2% 16% 3% 5% 10% 17% 11% 13% 9% 5%
Cash in 10% 0% 0% 10% 0% 0% 10% 10% 10% 0% 0% 30% 20%
Difference 10% -5% -2% 8% -16% -3% 5% 0% -7% -11% -13% 21% 15%
Table 4:Cash In & Out for Scenario "C"
The following Curves show the difference between cash in & out for each scenario.
5,000,000.00
6,000,000.00
7,000,000.00
8,000,000.00 SCENARIO "A"Acumilative Cash In Acumilative Cash out
7/31/2019 Managment of Cash Flow
http://slidepdf.com/reader/full/managment-of-cash-flow 12/27
Figure 5: Cash Flow In-Out for Scenario "C"
A di (I) h th d t il d l l ti f h i
-
1,000,000.00
2,000,000.00
3,000,000.00
4,000,000.00
5,000,000.00
6,000,000.00
7,000,000.00
8,000,000.00
0 1 2 3 4 5 6 7 8 9 10 11 12
SCENARIO "C"
-
1,000,000.00
2,000,000.00
3,000,000.00
4,000,000.00
5,000,000.00
6,000,000.00
7,000,000.00
8,000,000.00
0 1 2 3 4 5 6 7 8 9 10 11 12
SCENARIO "B"
Figure 4: Cash Flow In-Out for Scenario "B"
7/31/2019 Managment of Cash Flow
http://slidepdf.com/reader/full/managment-of-cash-flow 13/27
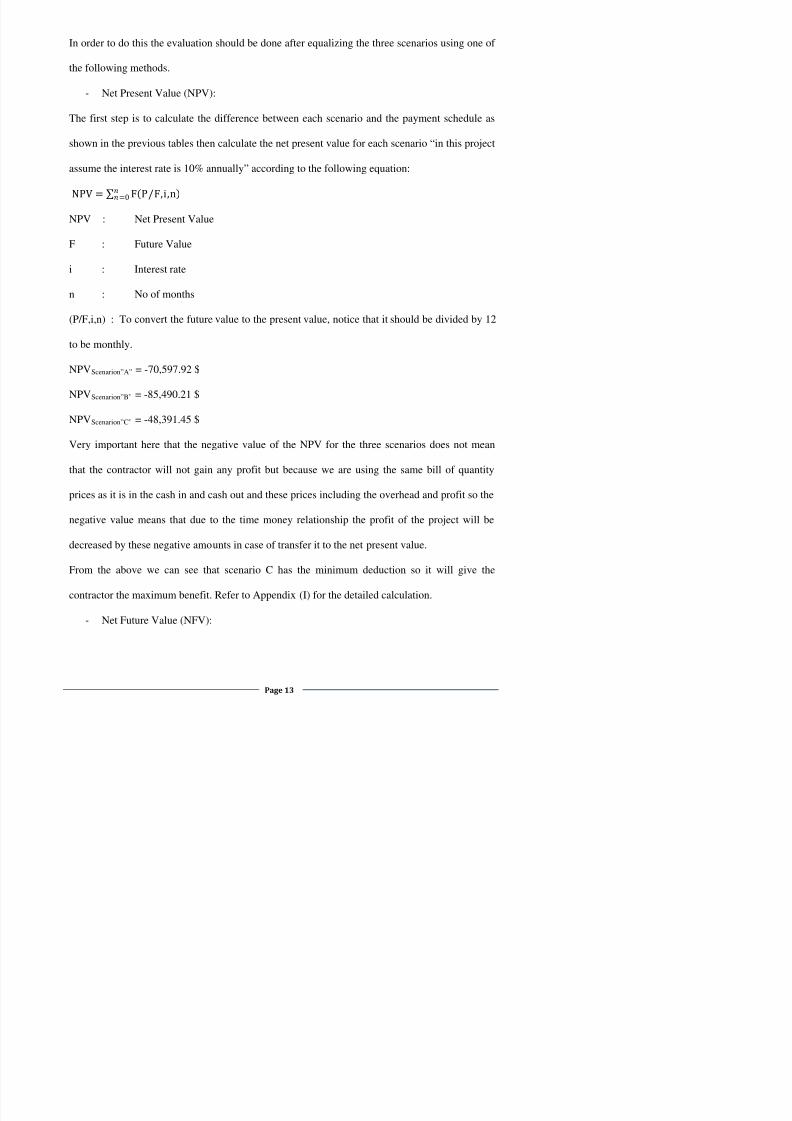
In order to do this the evaluation should be done after equalizing the three scenarios using one of
the following methods.
- Net Present Value (NPV):
The first step is to calculate the difference between each scenario and the payment schedule as
shown in the previous tables then calculate the net present value for each scenario “in this project
assume the interest rate is 10% annually” according to the following equation:
NPV = ∑ F(P/F,i,n )=0
NPV : Net Present Value
F : Future Value
i : Interest rate
n : No of months
(P/F,i,n) : To convert the future value to the present value, notice that it should be divided by 12
to be monthly.
NPV Scenarion”A” = -70,597.92 $
NPV Scenarion”B” = -85,490.21 $
NPV Scenarion”C” = -48,391.45 $
Very important here that the negative value of the NPV for the three scenarios does not mean
that the contractor will not gain any profit but because we are using the same bill of quantity
prices as it is in the cash in and cash out and these prices including the overhead and profit so the
negative value means that due to the time money relationship the profit of the project will be
decreased by these negative amounts in case of transfer it to the net present value.
7/31/2019 Managment of Cash Flow
http://slidepdf.com/reader/full/managment-of-cash-flow 14/27
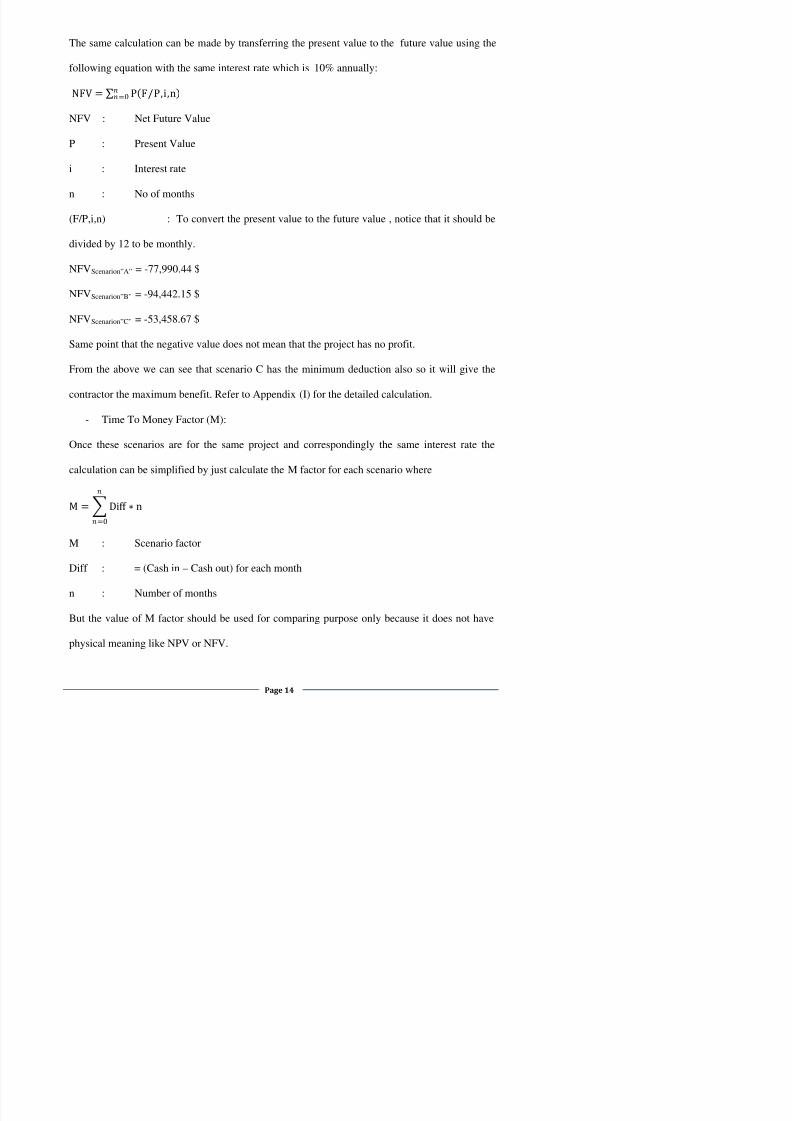
The same calculation can be made by transferring the present value to the future value using the
following equation with the same interest rate which is 10% annually:
NFV =
∑P(F/P,i,n )
=0
NFV : Net Future Value
P : Present Value
i : Interest rate
n : No of months(F/P,i,n) : To convert the present value to the future value , notice that it should be
divided by 12 to be monthly.
NFV Scenarion”A” = -77,990.44 $
NFV Scenarion”B” = -94,442.15 $
NFV Scenarion”C”
- Time To Money Factor (M):
= -53,458.67 $
Same point that the negative value does not mean that the project has no profit.
From the above we can see that scenario C has the minimum deduction also so it will give the
contractor the maximum benefit. Refer to Appendix (I) for the detailed calculation.
Once these scenarios are for the same project and correspondingly the same interest rate the
calculation can be simplified by just calculate the M factor for each scenario where
M = �Diff ∗n=0
M : Scenario factor
7/31/2019 Managment of Cash Flow
http://slidepdf.com/reader/full/managment-of-cash-flow 15/27
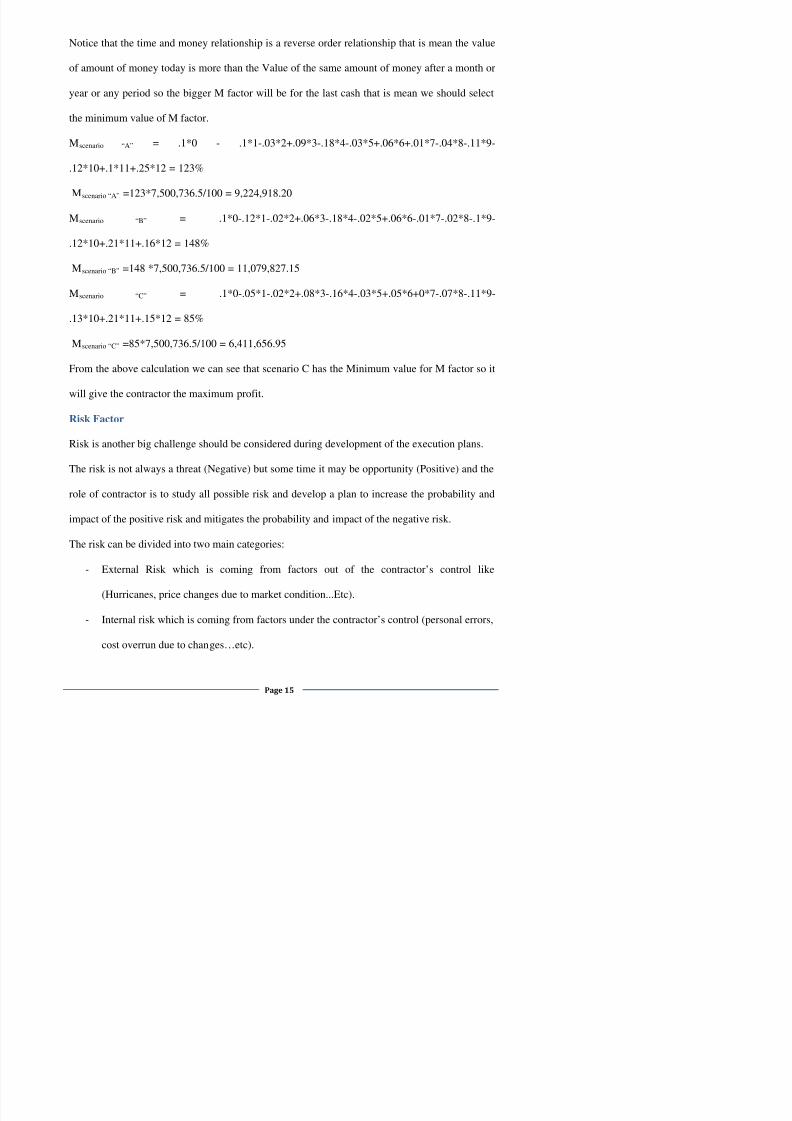
Notice that the time and money relationship is a reverse order relationship that is mean the value
of amount of money today is more than the Value of the same amount of money after a month or
year or any period so the bigger M factor will be for the last cash that is mean we should select
the minimum value of M factor.
M scenario “A” = .1*0 - .1*1-.03*2+.09*3-.18*4-.03*5+.06*6+.01*7-.04*8-.11*9-
.12*10+.1*11+.25*12 = 123%
M scenario “A” =123*7,500,736.5/100 = 9,224,918.20M scenario “B” = .1*0-.12*1-.02*2+.06*3-.18*4-.02*5+.06*6-.01*7-.02*8-.1*9-
.12*10+.21*11+.16*12 = 148%
M scenario “B” =148 *7,500,736.5/100 = 11,079,827.15
M scenario “C” = .1*0-.05*1-.02*2+.08*3-.16*4-.03*5+.05*6+0*7-.07*8-.11*9-
.13*10+.21*11+.15*12 = 85%
M scenario “C”
Risk Factor
=85*7,500,736.5/100 = 6,411,656.95
From the above calculation we can see that scenario C has the Minimum value for M factor so it
will give the contractor the maximum profit.
Risk is another big challenge should be considered during development of the execution plans.
The risk is not always a threat (Negative) but some time it may be opportunity (Positive) and the
role of contractor is to study all possible risk and develop a plan to increase the probability and
impact of the positive risk and mitigates the probability and impact of the negative risk.
The risk can be divided into two main categories:
7/31/2019 Managment of Cash Flow
http://slidepdf.com/reader/full/managment-of-cash-flow 16/27
In order to develop a risk management plan the contractor has to go through the following steps:
- Identification of risk
The objective from this procedure is to gather the information about all the expected risks
and this could be done by project team experience, the recorded lessons learned from theprevious projects, brainstorming sessions, the market conditions and many other methods.
The result will be a risk list contains the description of each risk and the affected activities by
each one.
- Risk Assessment
Here the contractor should analyze each risk separately. Analyzing should be quantitative and
qualitative.
Quantitative analysis is to study the impact of the risk on the project and qualitative is to study
the probability of the risk to be occurred.
- Risk Management plan.
Establish the procedure to mitigate the effect of negative risks and increase the effect of positive
risk and determine the authorized person to perform these procedures and follow up the risk
situation.
Effect of risk on the cash flow
The previous analysis for the three different scenarios in the workshop factory project did not
7/31/2019 Managment of Cash Flow
http://slidepdf.com/reader/full/managment-of-cash-flow 17/27
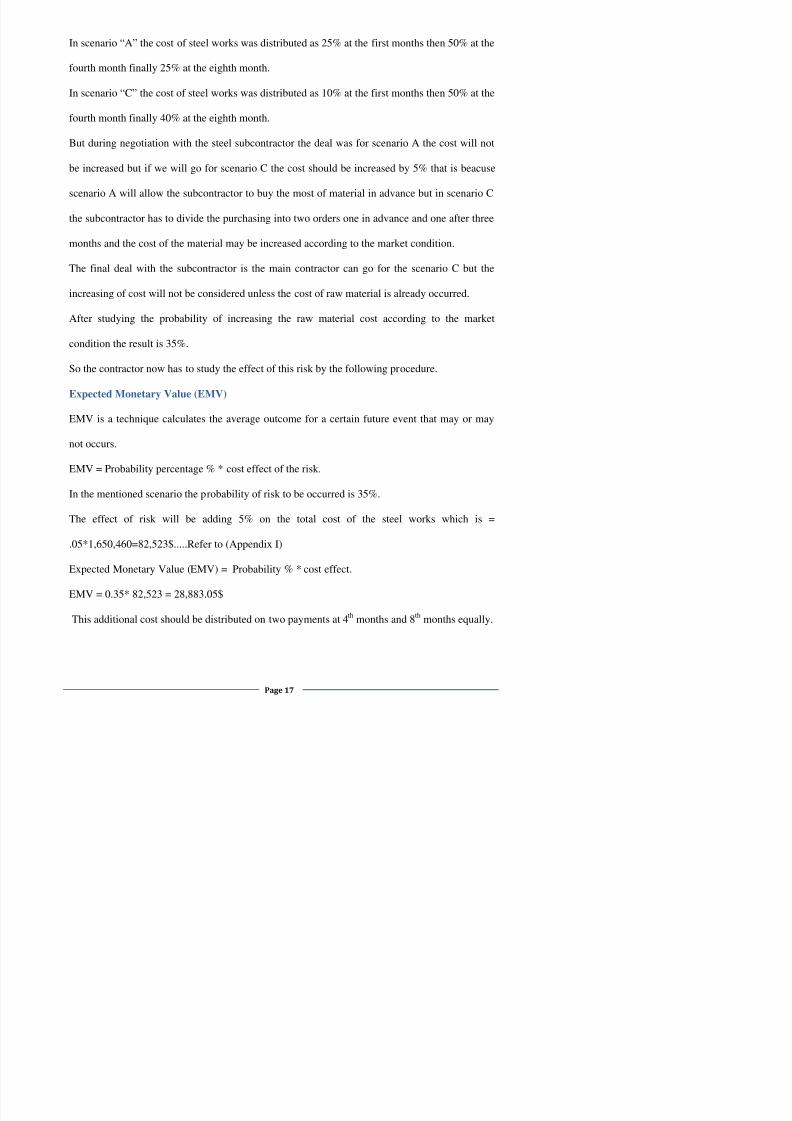
In scenario “A” the cost of steel works was distributed as 25% at the first months then 50% at the
fourth month finally 25% at the eighth month.
In scenario “C” the cost of steel works was distributed as 10% at the first months then 50% at the
fourth month finally 40% at the eighth month.
But during negotiation with the steel subcontractor the deal was for scenario A the cost will not
be increased but if we will go for scenario C the cost should be increased by 5% that is beacuse
scenario A will allow the subcontractor to buy the most of material in advance but in scenario Cthe subcontractor has to divide the purchasing into two orders one in advance and one after three
months and the cost of the material may be increased according to the market condition.
The final deal with the subcontractor is the main contractor can go for the scenario C but the
increasing of cost will not be considered unless the cost of raw material is already occurred.
After studying the probability of increasing the raw material cost according to the market
condition the result is 35%.
So the contractor now has to study the effect of this risk by the following procedure.
Expected Monetary Value (EMV)
EMV is a technique calculates the average outcome for a certain future event that may or may
not occurs.
EMV = Probability percentage % * cost effect of the risk.
In the mentioned scenario the probability of risk to be occurred is 35%.
The effect of risk will be adding 5% on the total cost of the steel works which is =
.05*1,650,460=82,523$.....Refer to (Appendix I)
7/31/2019 Managment of Cash Flow
http://slidepdf.com/reader/full/managment-of-cash-flow 18/27
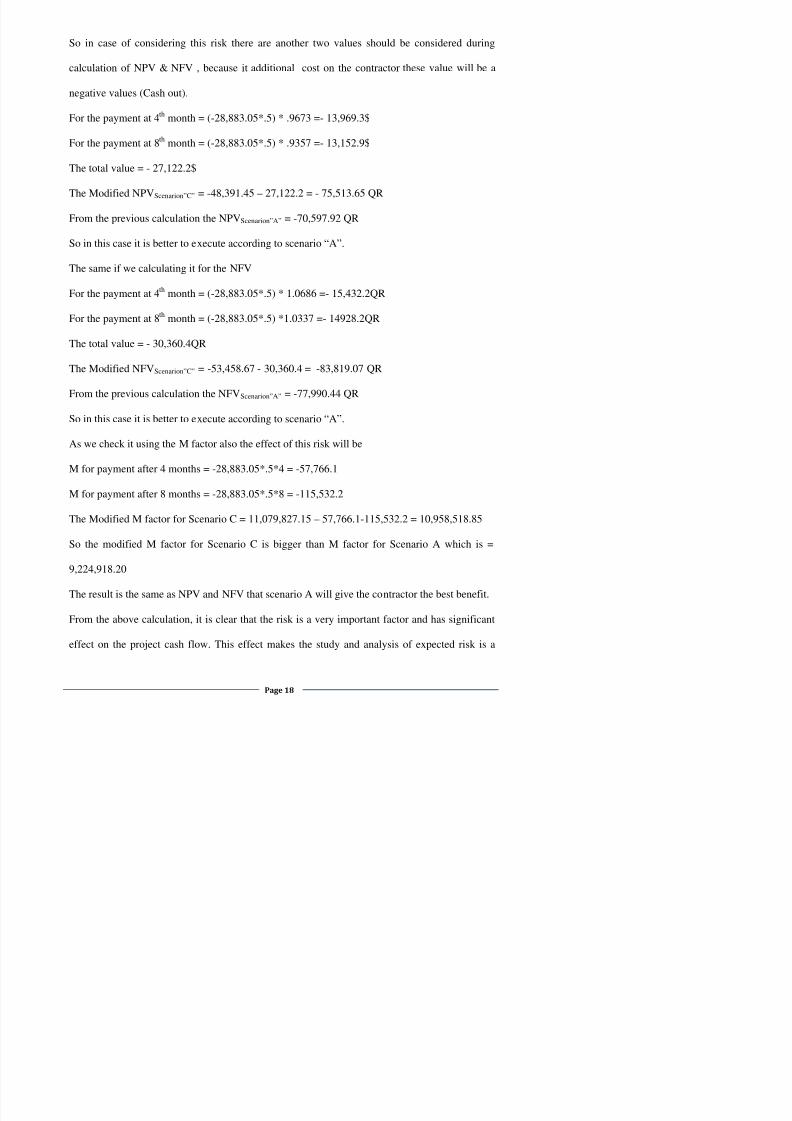
So in case of considering this risk there are another two values should be considered during
calculation of NPV & NFV , because it additional cost on the contractor these value will be a
negative values (Cash out).
For the payment at 4 th month = (-28,883.05*.5) * .9673 =- 13,969.3$
For the payment at 8 th month = (-28,883.05*.5) * .9357 =- 13,152.9$
The total value = - 27,122.2$
The Modified NPV Scenarion”C” = -48,391.45 – 27,122.2 = - 75,513.65 QRFrom the previous calculation the NPV Scenarion”A” = -70,597.92 QR
So in this case it is better to execute according to scenario “A”.
The same if we calculating it for the NFV
For the payment at 4th
month = (-28,883.05*.5) * 1.0686 =- 15,432.2QR
For the payment at 8 th month = (-28,883.05*.5) *1.0337 =- 14928.2QR
The total value = - 30,360.4QR
The Modified NFV Scenarion”C” = -53,458.67 - 30,360.4 = -83,819.07 QR
From the previous calculation the NFV Scenarion”A” = -77,990.44 QR
So in this case it is better to execute according to scenario “A”.
As we check it using the M factor also the effect of this risk will be
M for payment after 4 months = -28,883.05*.5*4 = -57,766.1
M for payment after 8 months = -28,883.05*.5*8 = -115,532.2
The Modified M factor for Scenario C = 11,079,827.15 – 57,766.1-115,532.2 = 10,958,518.85
So the modified M factor for Scenario C is bigger than M factor for Scenario A which is =

7/31/2019 Managment of Cash Flow
http://slidepdf.com/reader/full/managment-of-cash-flow 19/27
vital and essential process and it should be done by an expert team in order to assure the success
of completing project on time with the required quality and maximum profit.

7/31/2019 Managment of Cash Flow
http://slidepdf.com/reader/full/managment-of-cash-flow 20/27
List of References
1. AACE International. Economic Analysis . Skills and Knowledge of Cost Engineering
5 th
2. Sullivan, William. Bontadelli, James. Wicks, Elin. Chapter 5 Comparing Alternatives .
Engineering Economy 11th edition .2000.
edition . 2004.
3. Project Management Institute (PMI) USA. PMBOK-Guide 4th edition. 2008 .

7/31/2019 Managment of Cash Flow
http://slidepdf.com/reader/full/managment-of-cash-flow 21/27
Bibliography
EMV: Expected monetary value
I: Interest Rate
N: Number of time periods
NFV: Net Future Value
NPV: Net Present Value.

7/31/2019 Managment of Cash Flow
http://slidepdf.com/reader/full/managment-of-cash-flow 22/27
Acknowledgment
This paper would not have been possible without the great support from my superiors. In this
regard I am grateful to the following for their review and helpful suggestion:
- Eng M. Hendy, Head of Technical Department at James cubit & Partner Consultancy (Qatar).
- Eng M. Al-Gendy, Projects Manager at James cubit & Partner Consultancy (Qatar).
- Eng Elham Amer, Project Manager at Al-Goman Contracting (Qatar).
Last but not least, I am thankful to my wife for her understanding and continuing support which
saw me through the extended hours

7/31/2019 Managment of Cash Flow
http://slidepdf.com/reader/full/managment-of-cash-flow 23/27
APPENDIX I
WORKSHOP FACTORY
7/31/2019 Managment of Cash Flow
http://slidepdf.com/reader/full/managment-of-cash-flow 24/27
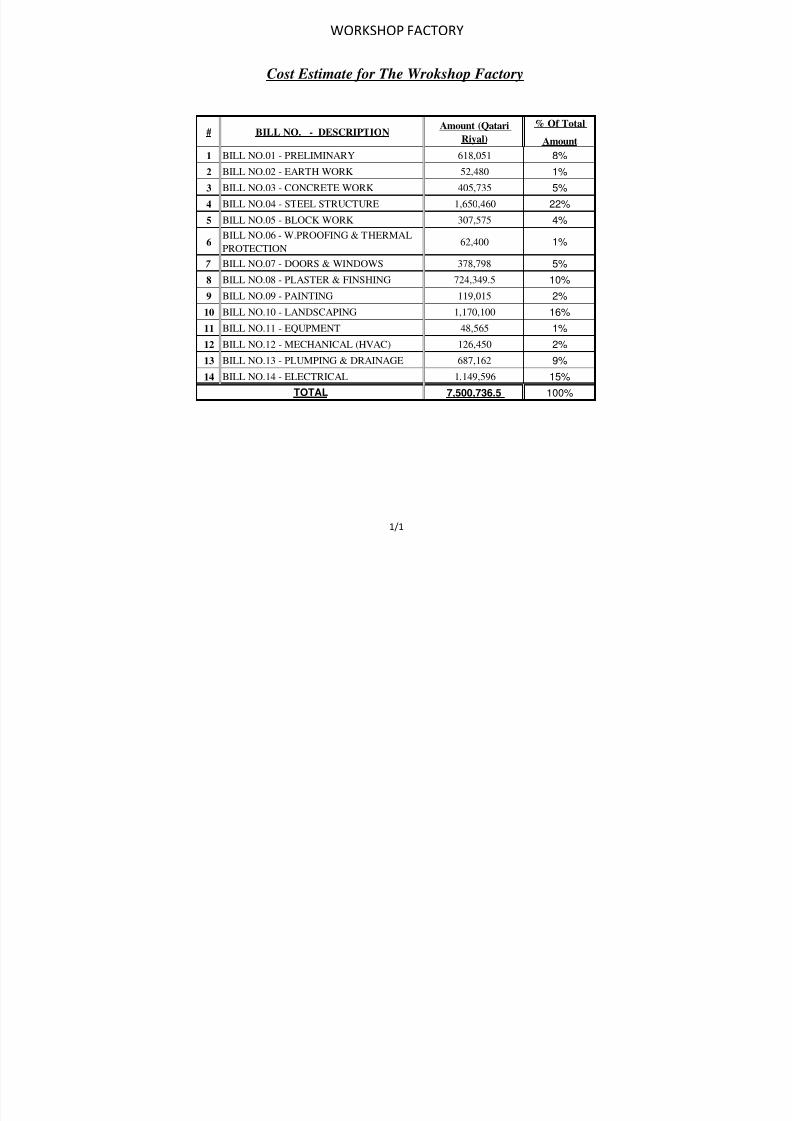
WORKSHOP FACTORY
# BILL NO. - DESCRIPTIONAmount (Qatari
Riyal)
% Of Total
Amount1 BILL NO.01 - PRELIMINARY 618,051 8%
2 BILL NO.02 - EARTH WORK 52,480 1%
3 BILL NO.03 - CONCRETE WORK 405,735 5%
4 BILL NO.04 - STEEL STRUCTURE 1,650,460 22%
5 BILL NO.05 - BLOCK WORK 307,575 4%
6BILL NO.06 - W.PROOFING & THERMALPROTECTION
62,400 1%
7 BILL NO.07 - DOORS & WINDOWS 378,798 5%
8 BILL NO.08 - PLASTER & FINSHING 724,349.5 10%
9 BILL NO.09 - PAINTING 119,015 2%10 BILL NO.10 - LANDSCAPING 1,170,100 16%
11 BILL NO.11 - EQUPMENT 48,565 1%
12 BILL NO.12 - MECHANICAL (HVAC) 126,450 2%
13 BILL NO.13 - PLUMPING & DRAINAGE 687,162 9%
14 BILL NO.14 - ELECTRICAL 1,149,596 15%
7,500,736.5 100%TOTAL
Cost Estimate for The Wrokshop Factory
1/1
7/31/2019 Managment of Cash Flow
http://slidepdf.com/reader/full/managment-of-cash-flow 25/27
7/31/2019 Managment of Cash Flow
http://slidepdf.com/reader/full/managment-of-cash-flow 26/27
7/31/2019 Managment of Cash Flow
http://slidepdf.com/reader/full/managment-of-cash-flow 27/27