Embed Size (px)
Citation preview
Managing Watersheds with WMOST (Watershed Management Optimization Support Tool)
Dr. Naomi Detenbeck
US EPA ORD/NHEERL/Atlantic Ecology Division
Interstate Water Policy Council DC Roundtable
April 1, 2014
1
Office of Research and Development
19 April 2012
Topic 4 Maintaining and Improving Natural
and Engineered Water Systems
Green Infrastructure (GI) for Stormwater
Management
2
Overview
Why did we develop WMOST?
How did we engage stakeholders?
What are the fundamental components of WMOST?
What does a basic model run look like?
What did we find in our initial case studies?
What are the future development needs identified by
stakeholders?
How can you obtain a copy of WMOST?
3
4
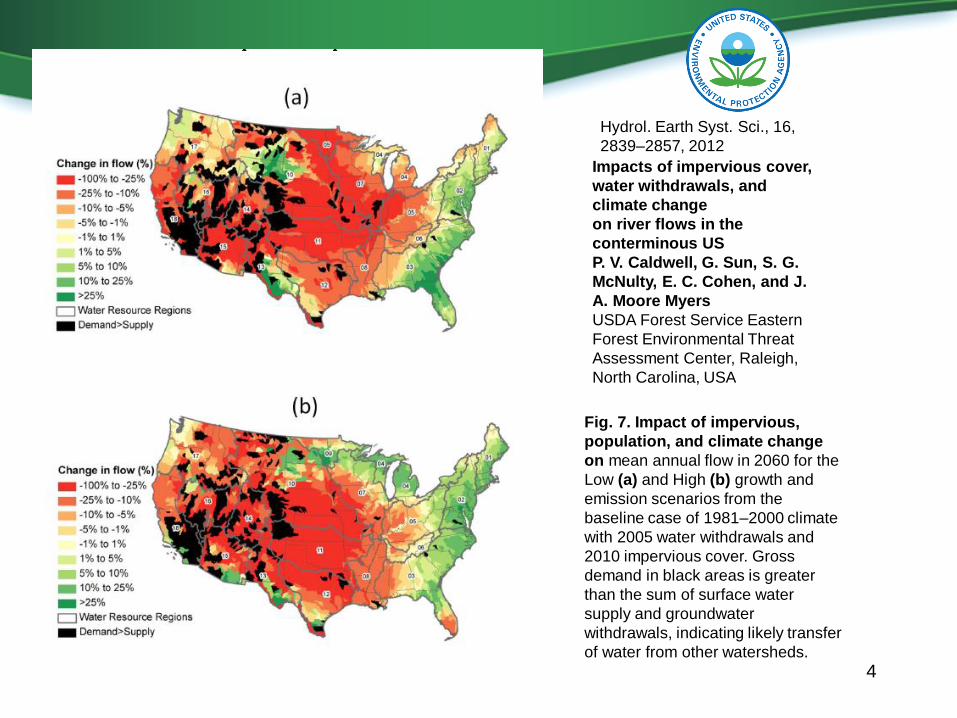
Fig. 7. Impact of impervious,
population, and climate change
on mean annual flow in 2060 for the
Low (a) and High (b) growth and
emission scenarios from the
baseline case of 1981–2000 climate
with 2005 water withdrawals and
2010 impervious cover. Gross
demand in black areas is greater
than the sum of surface water
supply and groundwater
withdrawals, indicating likely transfer
of water from other watersheds.
Impacts of impervious cover,
water withdrawals, and
climate change
on river flows in the
conterminous US
P. V. Caldwell, G. Sun, S. G.
McNulty, E. C. Cohen, and J.
A. Moore Myers
USDA Forest Service Eastern
Forest Environmental Threat
Assessment Center, Raleigh,
North Carolina, USA
Hydrol. Earth Syst. Sci., 16,
2839–2857, 2012
Impetus for WMOST
EPA Office of Water support for GI and Integrated
Planning (stormwater, wastewater)
At municipal scale, opportunities for application of
green infrastructure to solve water resource problems
are under-utilized (ARRA, SRF)
States face challenge of developing balanced
approaches for equitable and predictable distribution of
water resources to meet both human and aquatic life
needs
– MA Sustainable Water Management Initiative (SWMI)
– RI Water Resources Board Strategic Planning
5
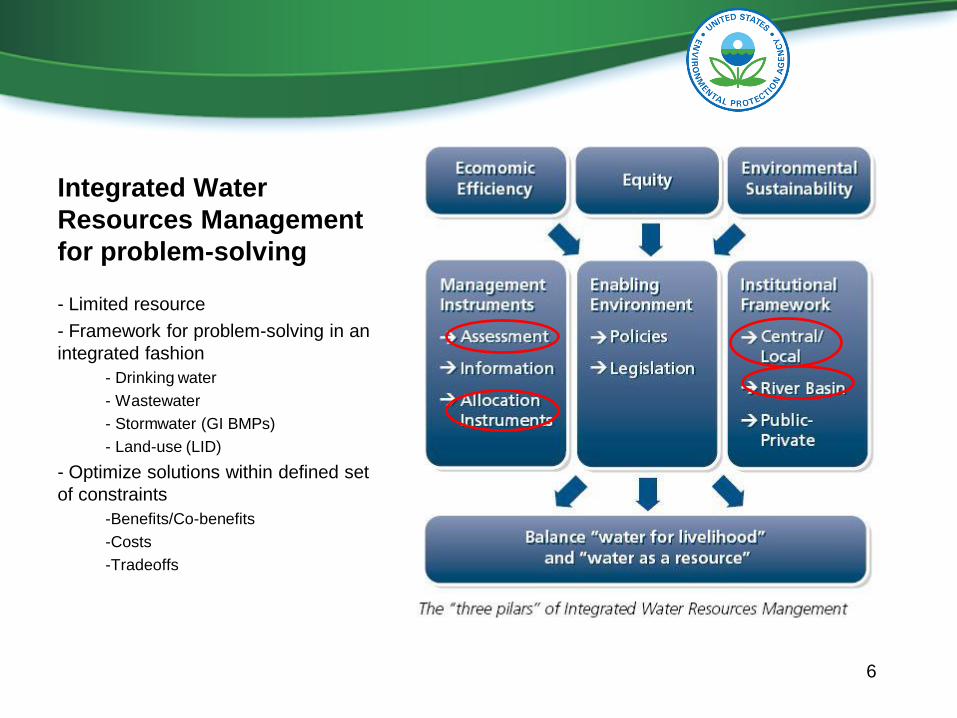
Integrated Water
Resources Management
for problem-solving
- Limited resource
- Framework for problem-solving in an
integrated fashion
- Drinking water
- Wastewater
- Stormwater (GI BMPs)
- Land-use (LID)
- Optimize solutions within defined set
of constraints
-Benefits/Co-benefits
-Costs
-Tradeoffs
6
WMOST Development Team
Tool Developers
Abt Associates, Inc.
– Viktoria Zoltay, Lauren Parker, Becky Wildner, Isabelle Morin
Subcontractors
– Nigel Pickering (Horsley Witten Group), Richard Vogel (Tufts University)
Development Team
US EPA NHEERL Atlantic Ecology Division
– Naomi Detenbeck, Marilyn ten Brink, Alisa Morrison (student contractor)
US EPA Region 1
– Ralph Abele, Jackie LeClair
US EPA NERL Ecosystems Research Division
– Yusuf Mohamoud 7
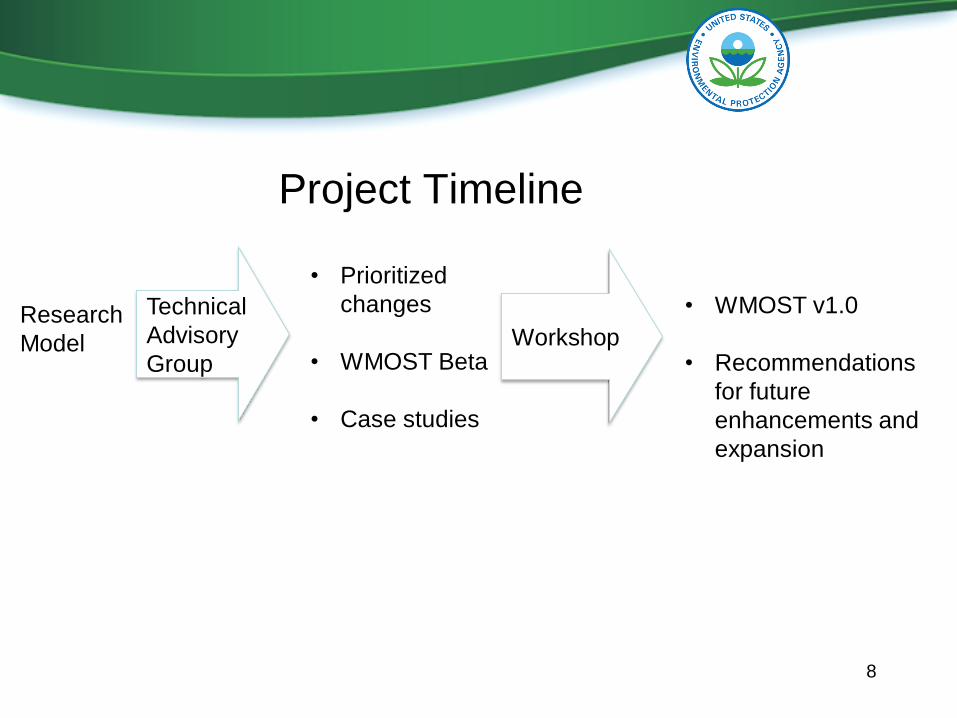
Project Timeline
Research
Model
Technical
Advisory
Group
• Prioritized
changes
• WMOST Beta
• Case studies
Workshop
• WMOST v1.0
• Recommendations
for future
enhancements and
expansion
8
Technical Advisory Group
– Kathy Baskin / MA EOEEA
– Mark Clark / North Reading,
MA
– Steven Estes-Smargiassi /
MWRA
– Scott Horsley / Horsley &
Witten
– Greg Krom / Topsfield, MA
– James Limbrunner /
HydroLogics
– Jay Lund/ UC Davis
– Yusuf Mohamoud / EPA
– Rosemary Monahan / EPA
– Nigel Pickering / Horsley &
Witten
– Dave Sharples /
Somersworth, NH
– Hale Thurston / EPA
– Richard Vogel / Tufts
University
– Peter Weiskel / USGS
– Kirk Westphal / CDM Smith
9
WMOST Development Objectives
Refine an existing tool to facilitate integrated watershed management at the municipality scale
– Screen management practices for water and water-related resources within a watershed context for an optimal mix
– Water supply, wastewater, stormwater, in-stream conditions, groundwater, land use
– Provide insight on costs, benefits and trade-offs
Special considerations
– New England municipalities (and beyond)
– Low impact development (LID)/green infrastructure(GI)
– Support evaluation of GI/LID use and provide information for SRF application to implement GI/LID
10
Existing WMOST Model Objective
What is the optimal set of actions to achieve water
quantity related management goals at least cost?
– Meet demand for water or wastewater services
– Achieve minimum and/or maximum in-stream flows to
protect aquatic life use
Considers only costs and revenues, therefore, shadow
prices reflect ‘replacement cost’
Does not yet include valuation of in-stream flow benefits,
i.e., ecosystem services
11
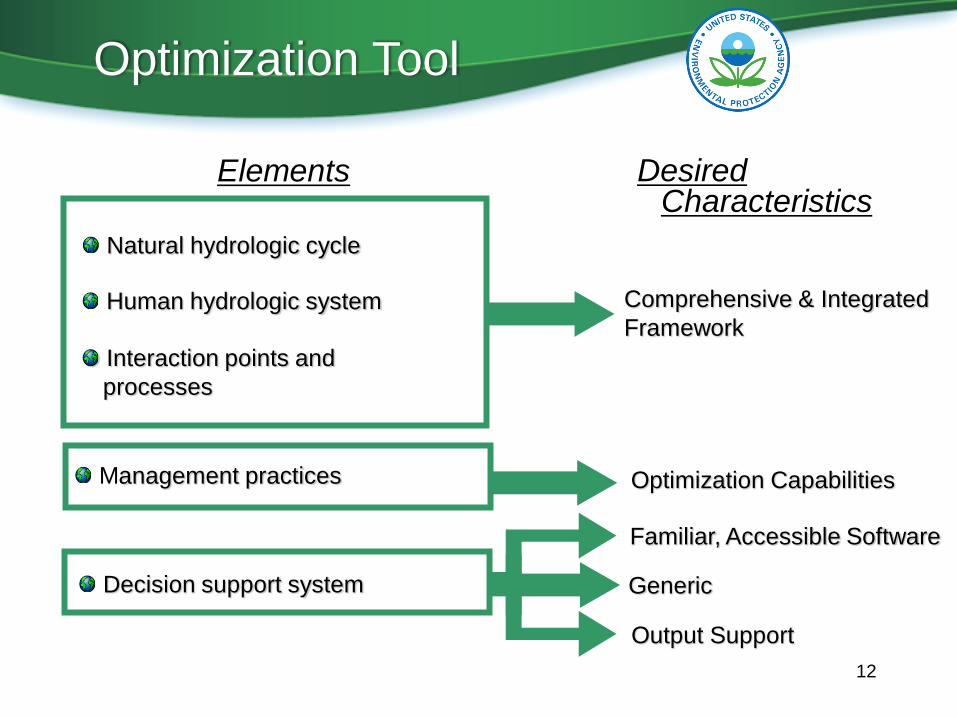
Optimization Tool
Optimization Capabilities
Output Support
Desired Characteristics
Elements
Generic
Familiar, Accessible Software
Natural hydrologic cycle
Human hydrologic system
Interaction points and
processes
Management practices
Decision support system
Comprehensive & Integrated
Framework
12
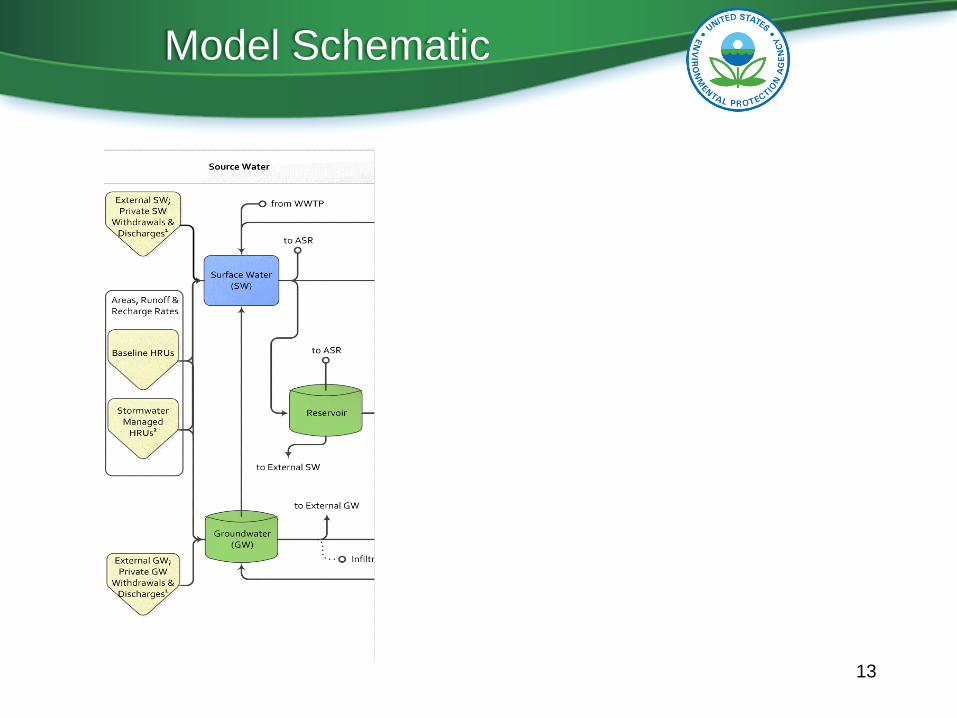
Model Schematic
13
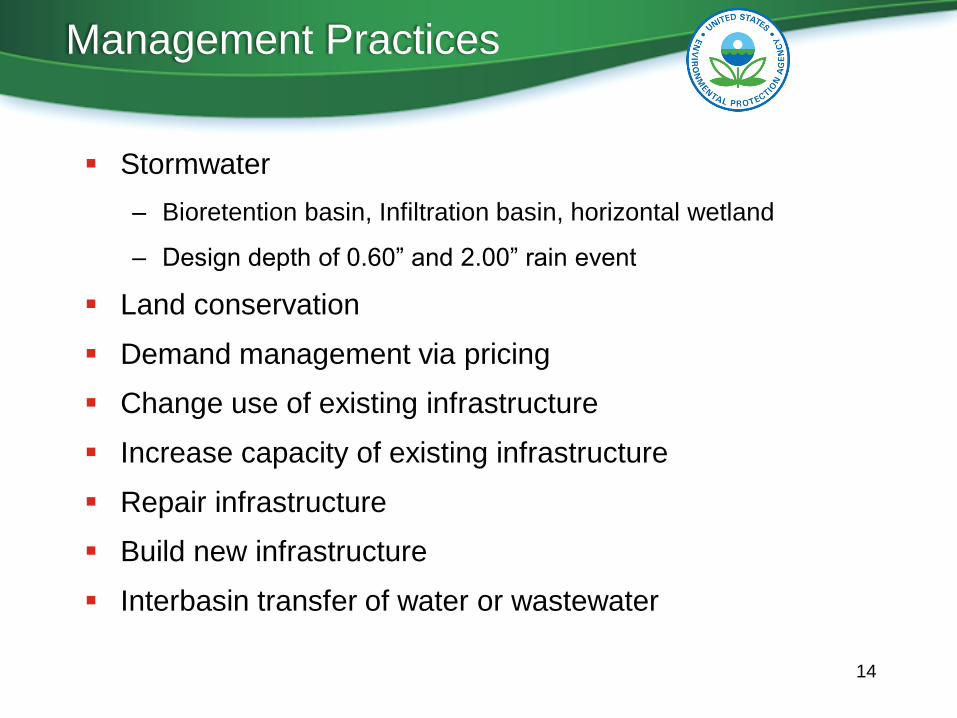
Stormwater
– Bioretention basin, Infiltration basin, horizontal wetland
– Design depth of 0.60” and 2.00” rain event
Land conservation
Demand management via pricing
Change use of existing infrastructure
Increase capacity of existing infrastructure
Repair infrastructure
Build new infrastructure
Interbasin transfer of water or wastewater
Management Practices
14
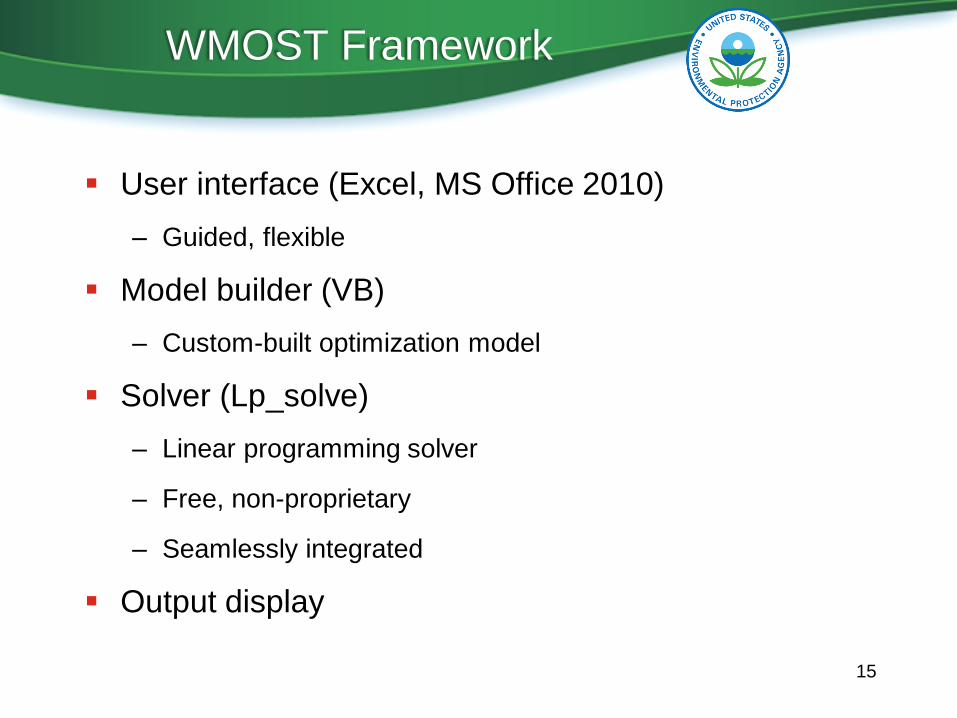
WMOST Framework
User interface (Excel, MS Office 2010)
– Guided, flexible
Model builder (VB)
– Custom-built optimization model
Solver (Lp_solve)
– Linear programming solver
– Free, non-proprietary
– Seamlessly integrated
Output display
15
Case Study Example
Danvers-Middleton, MA
(MA SWMI* Pilot)
* Sustainable Water Management Initiative
16
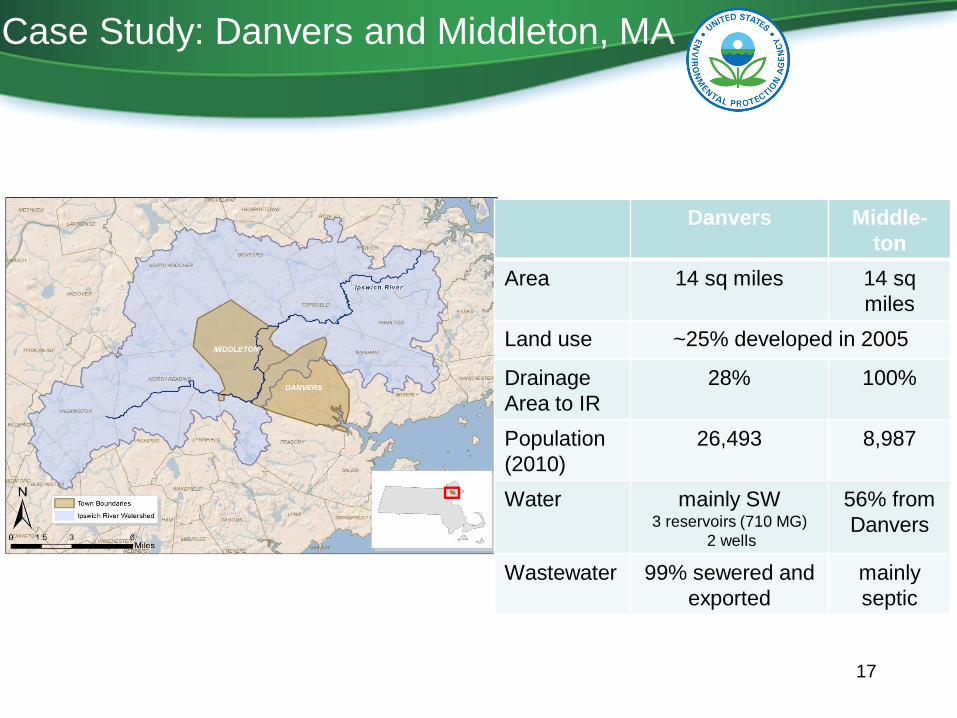
Case Study: Danvers and Middleton, MA
Danvers Middle-
ton
Area 14 sq miles 14 sq
miles
Land use ~25% developed in 2005
Drainage
Area to IR
28% 100%
Population
(2010)
26,493 8,987
Water
mainly SW 3 reservoirs (710 MG)
2 wells
56% from
Danvers
Wastewater 99% sewered and
exported
mainly
septic
17
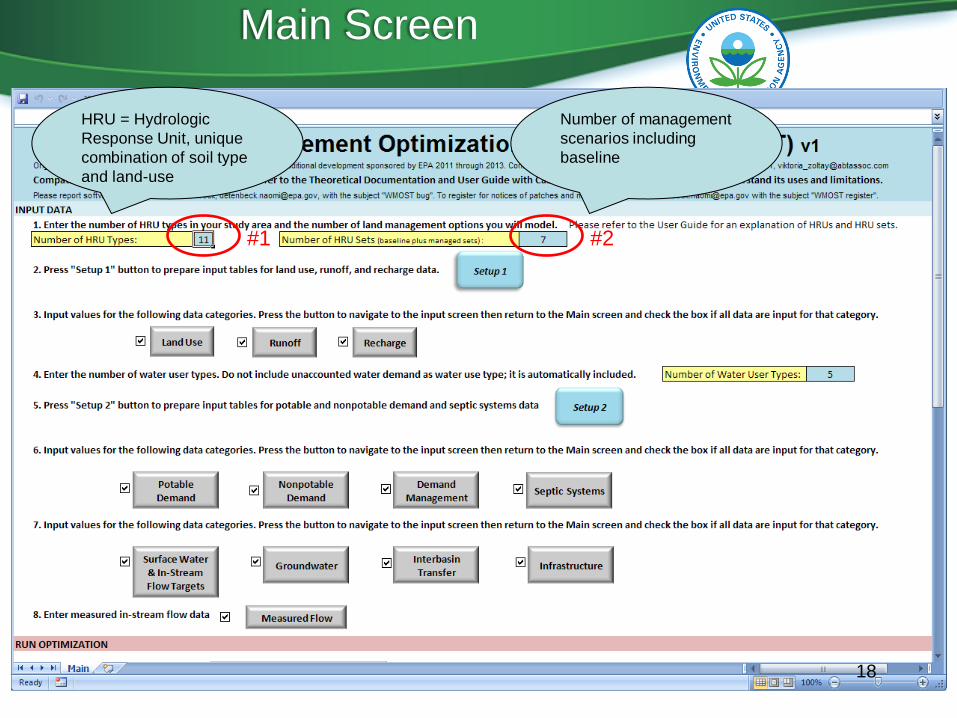
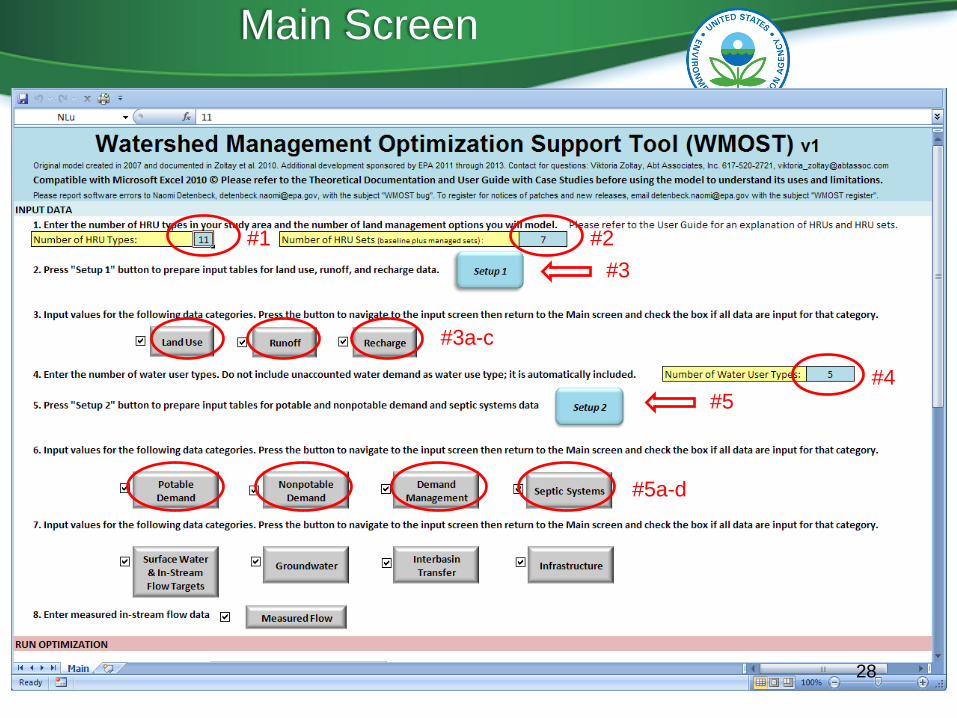
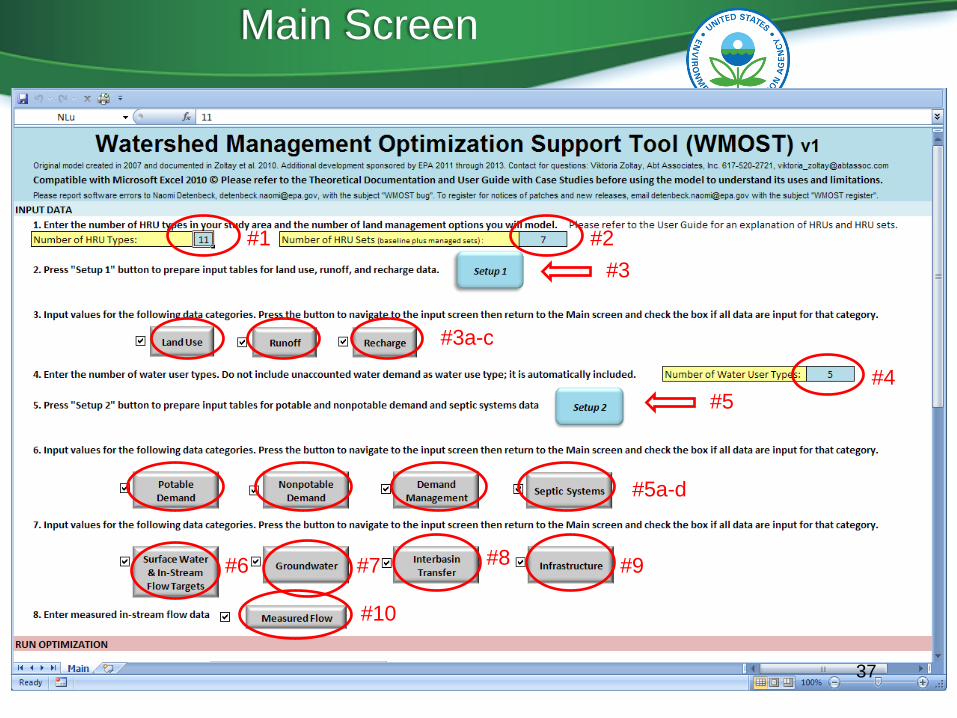
Main Screen
#1 #2
HRU = Hydrologic
Response Unit, unique
combination of soil type
and land-use
Number of management
scenarios including
baseline
18
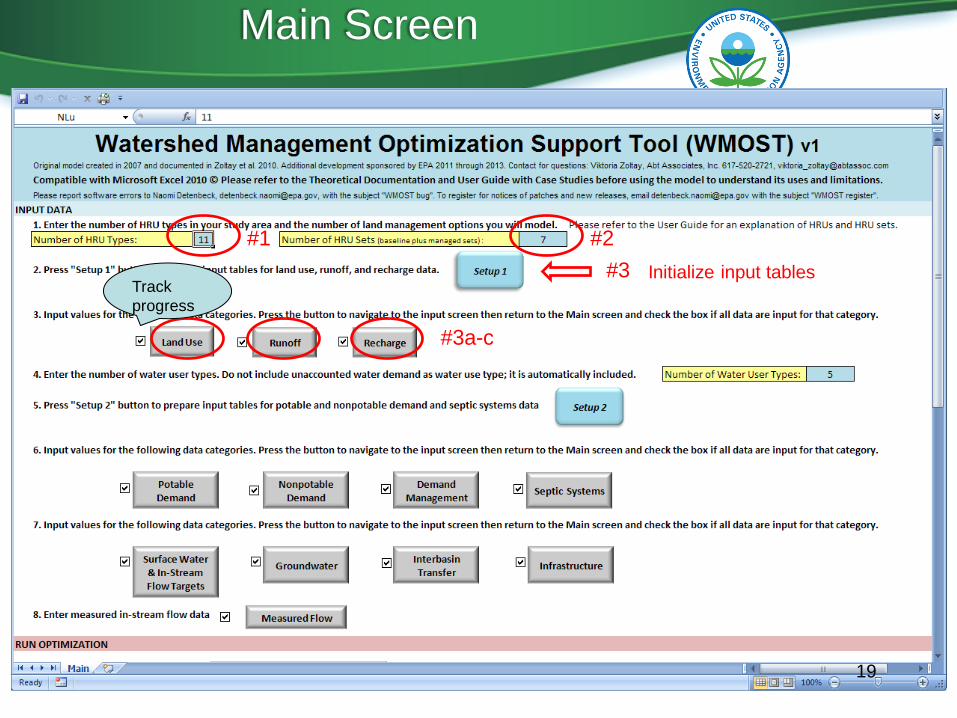
Main Screen
#1 #2
#3
#3a-c
Initialize input tables Track
progress
19
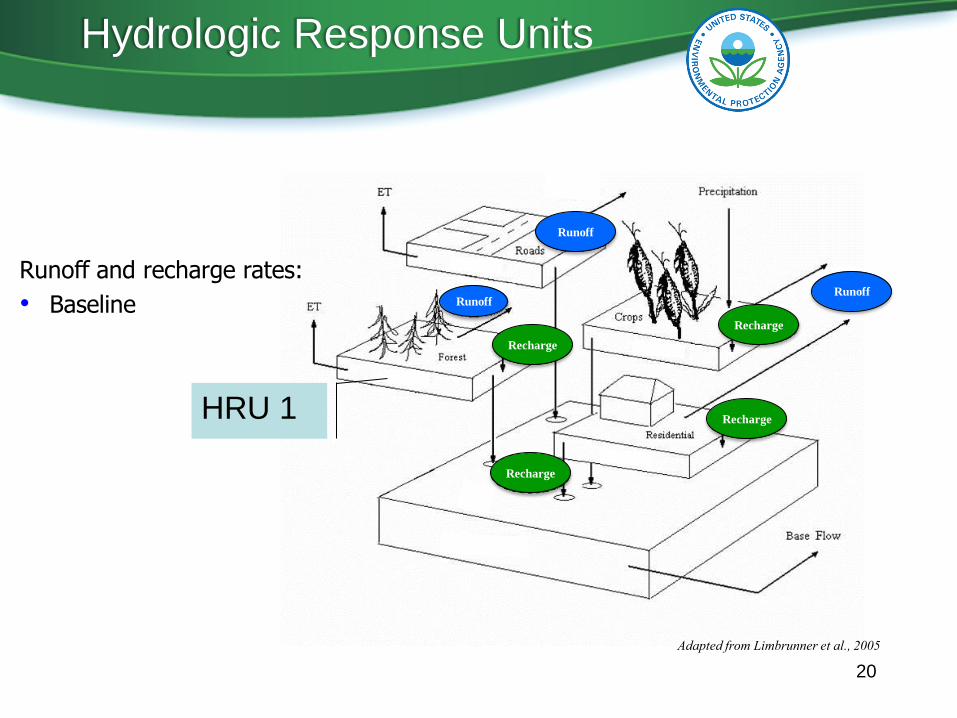
Adapted from Limbrunner et al., 2005
Recharge
Recharge
Recharge
Runoff
Recharge
Runoff
Runoff
Runoff and recharge rates:
• Baseline
Hydrologic Response Units
HRU 1
20
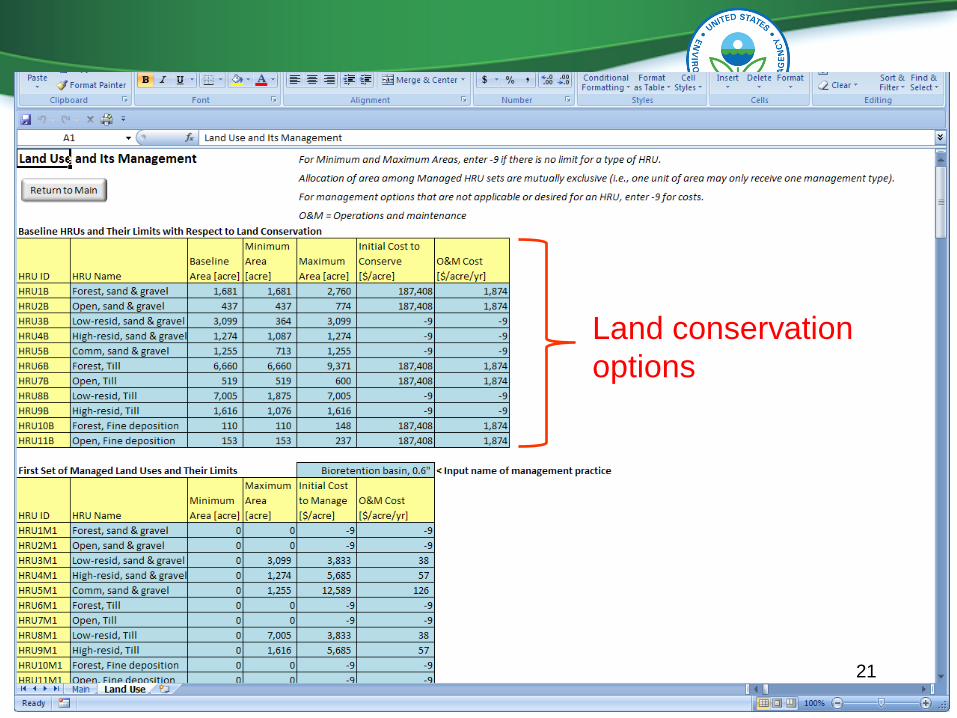
Land conservation
options
21
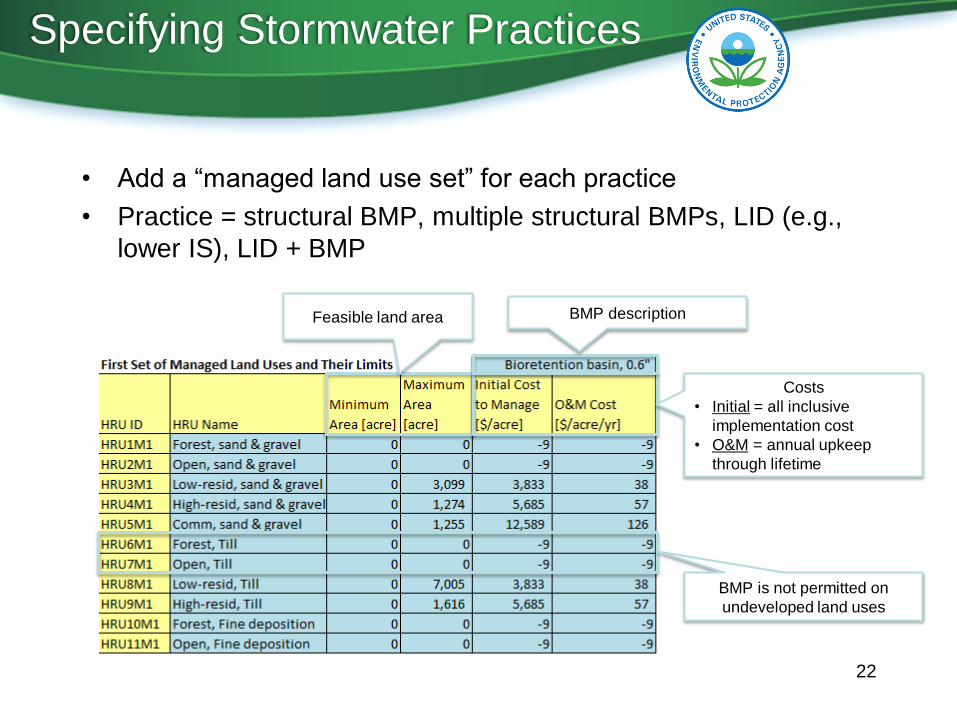
Specifying Stormwater Practices
• Add a “managed land use set” for each practice
• Practice = structural BMP, multiple structural BMPs, LID (e.g.,
lower IS), LID + BMP
Feasible land area
Costs
• Initial = all inclusive
implementation cost
• O&M = annual upkeep
through lifetime
BMP description
BMP is not permitted on
undeveloped land uses
22
Adapted from Limbrunner et al., 2005
Recharge
Recharge
Recharge
Runoff
Recharge
Runoff
Runoff
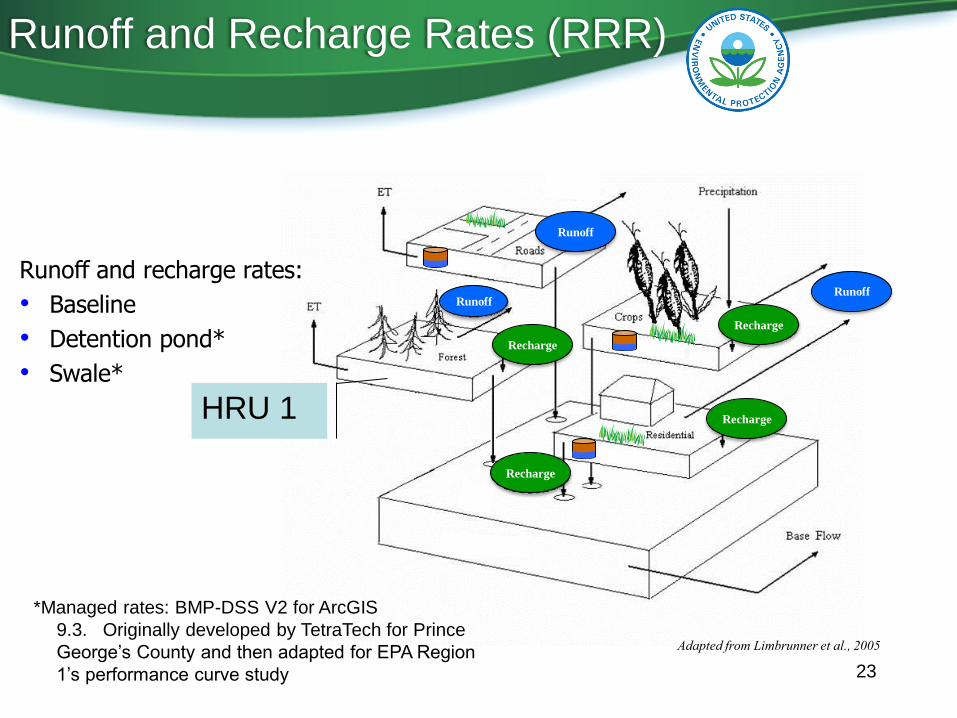
Runoff and recharge rates:
• Baseline
• Detention pond*
• Swale*
Runoff and Recharge Rates (RRR)
HRU 1
*Managed rates: BMP-DSS V2 for ArcGIS
9.3. Originally developed by TetraTech for Prince
George’s County and then adapted for EPA Region
1’s performance curve study 23
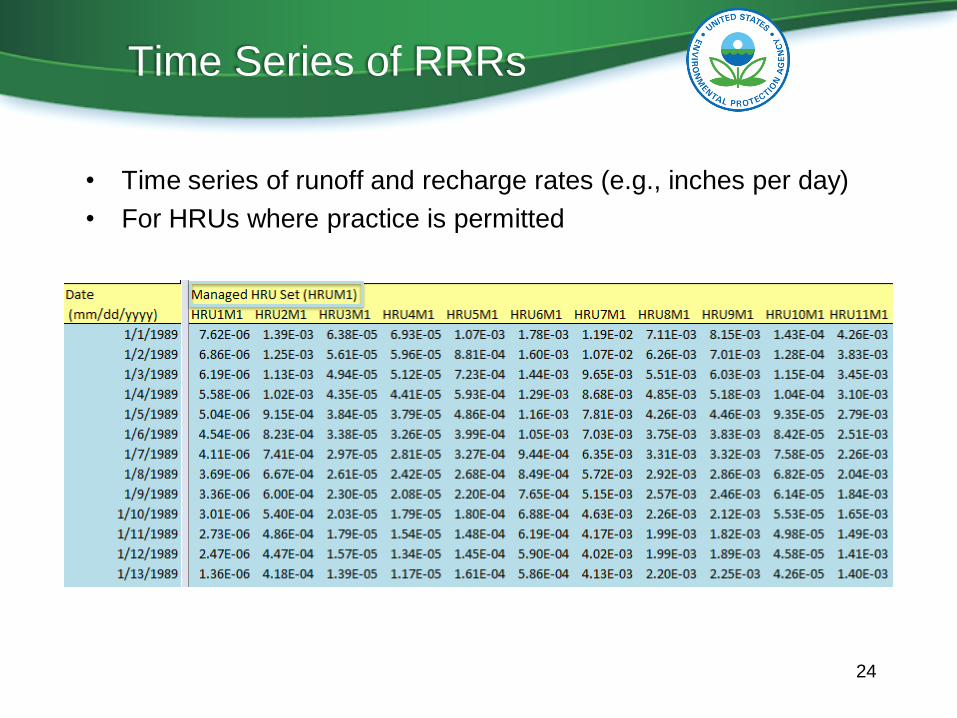
Time Series of RRRs
• Time series of runoff and recharge rates (e.g., inches per day)
• For HRUs where practice is permitted
24
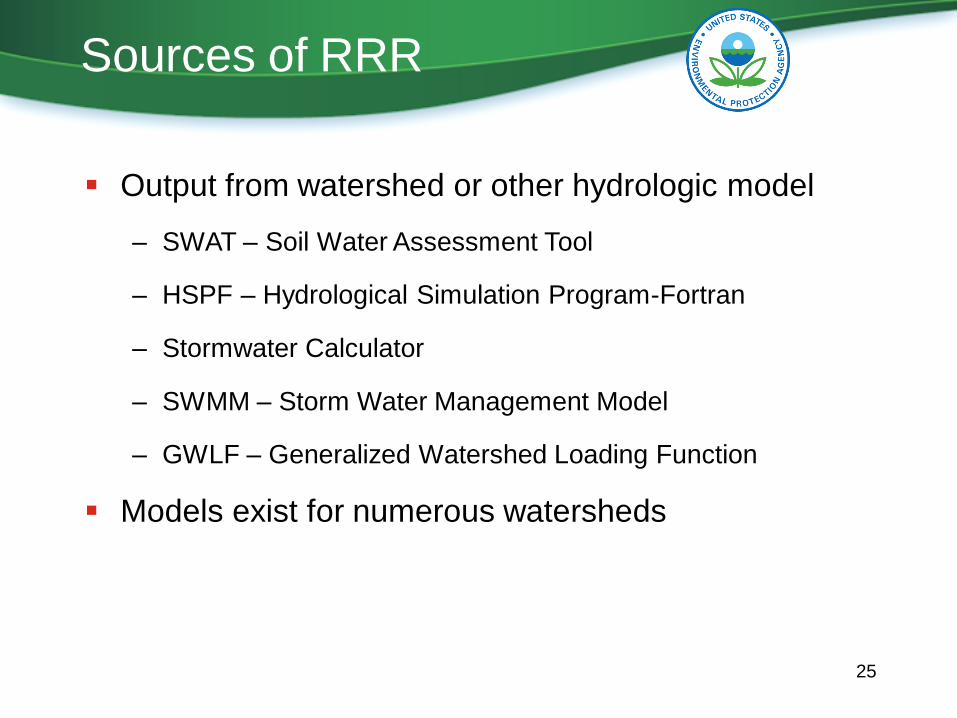
Sources of RRR
Output from watershed or other hydrologic model
– SWAT – Soil Water Assessment Tool
– HSPF – Hydrological Simulation Program-Fortran
– Stormwater Calculator
– SWMM – Storm Water Management Model
– GWLF – Generalized Watershed Loading Function
Models exist for numerous watersheds
25
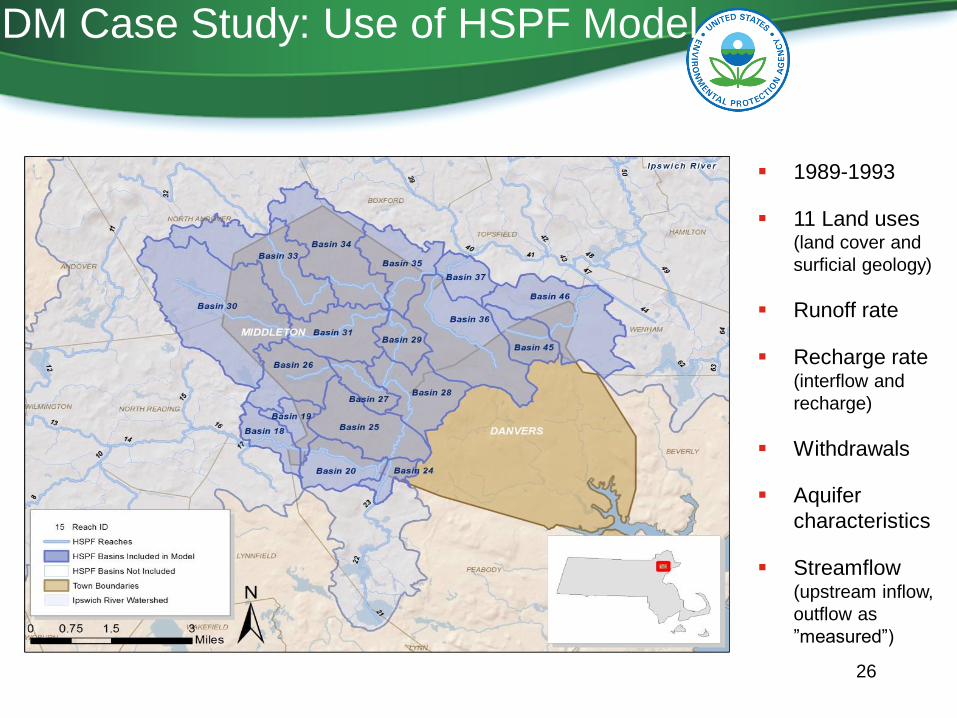
DM Case Study: Use of HSPF Model
1989-1993
11 Land uses (land cover and
surficial geology)
Runoff rate
Recharge rate (interflow and
recharge)
Withdrawals
Aquifer
characteristics
Streamflow (upstream inflow,
outflow as
”measured”)
26
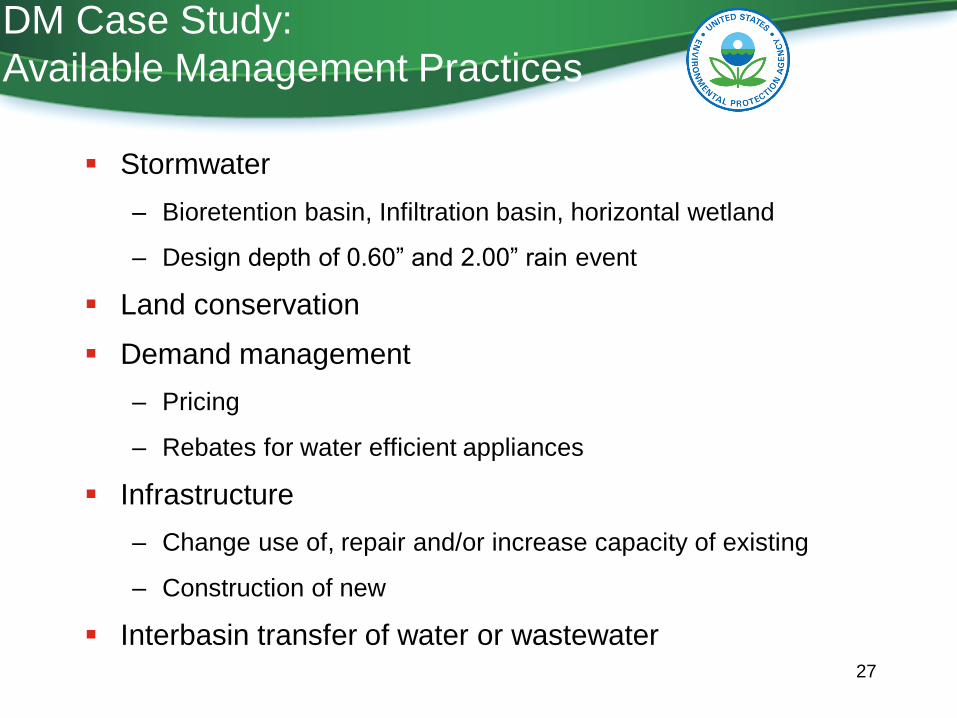
Stormwater
– Bioretention basin, Infiltration basin, horizontal wetland
– Design depth of 0.60” and 2.00” rain event
Land conservation
Demand management
– Pricing
– Rebates for water efficient appliances
Infrastructure
– Change use of, repair and/or increase capacity of existing
– Construction of new
Interbasin transfer of water or wastewater
DM Case Study:
Available Management Practices
27
Main Screen
#1 #2
#3
#3a-c
#5 #4
#5a-d
28
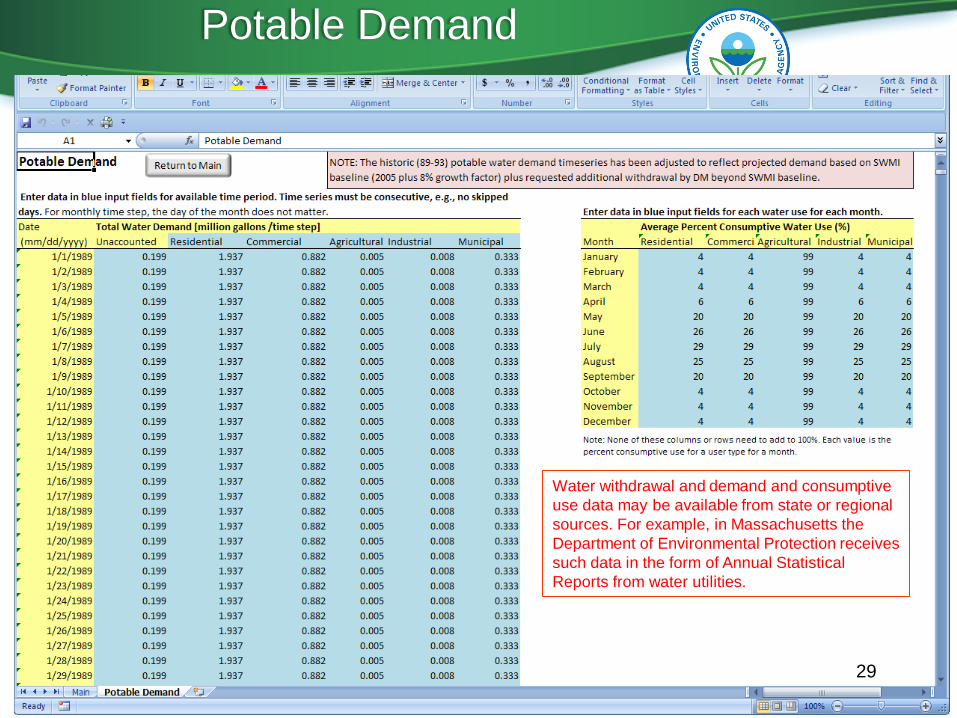
Water withdrawal and demand and consumptive
use data may be available from state or regional
sources. For example, in Massachusetts the
Department of Environmental Protection receives
such data in the form of Annual Statistical
Reports from water utilities.
Potable Demand
29
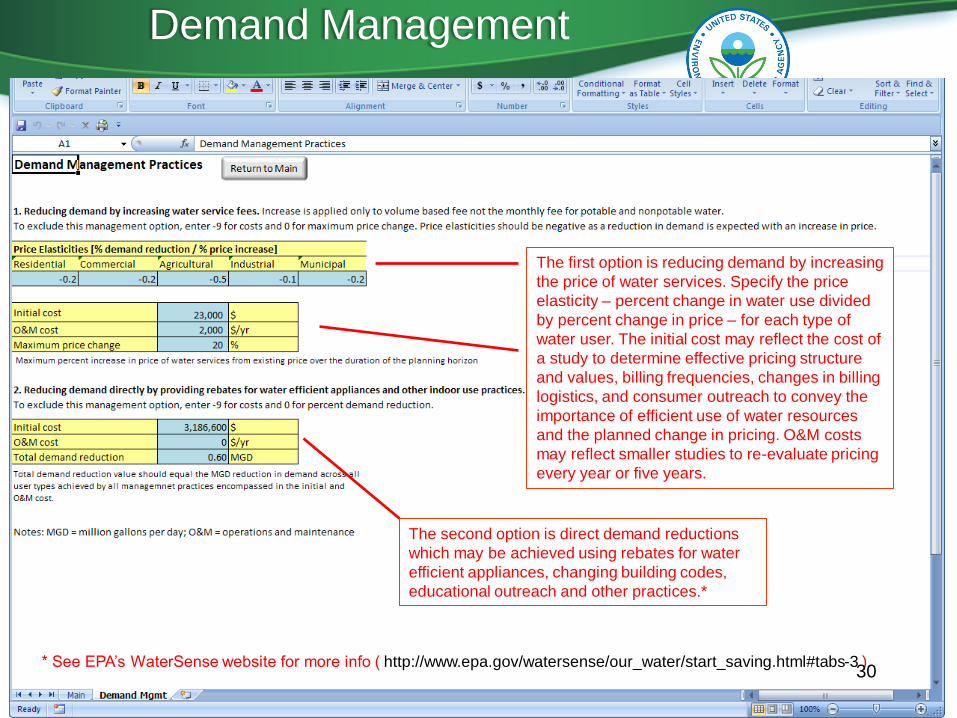
The first option is reducing demand by increasing
the price of water services. Specify the price
elasticity – percent change in water use divided
by percent change in price – for each type of
water user. The initial cost may reflect the cost of
a study to determine effective pricing structure
and values, billing frequencies, changes in billing
logistics, and consumer outreach to convey the
importance of efficient use of water resources
and the planned change in pricing. O&M costs
may reflect smaller studies to re-evaluate pricing
every year or five years.
The second option is direct demand reductions
which may be achieved using rebates for water
efficient appliances, changing building codes,
educational outreach and other practices.*
* See EPA’s WaterSense website for more info ( http://www.epa.gov/watersense/our_water/start_saving.html#tabs-3 ).
Demand Management
30
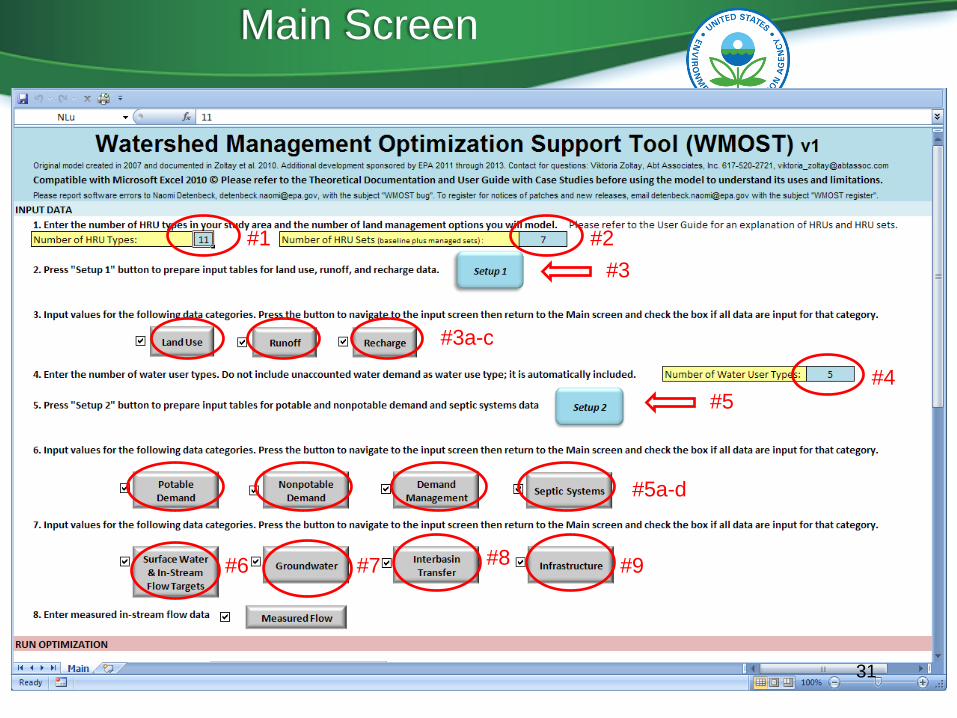
Main Screen
#1 #2
#3
#3a-c
#5 #4
#5a-d
#6 #7 #8 #9
31
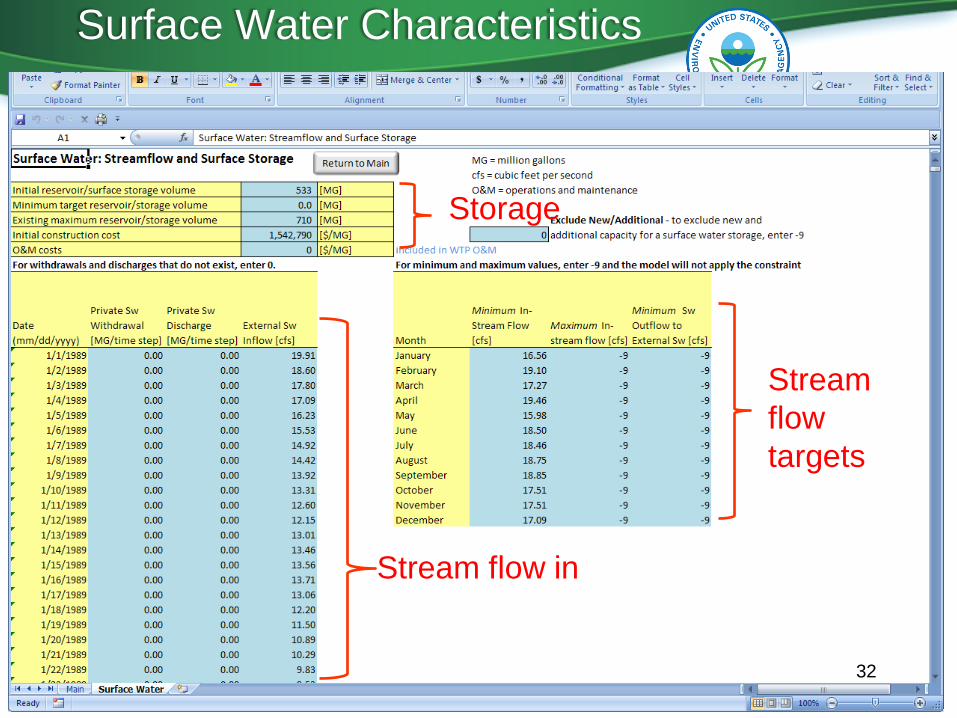
Storage
Stream flow in
Stream
flow
targets
Surface Water Characteristics
32
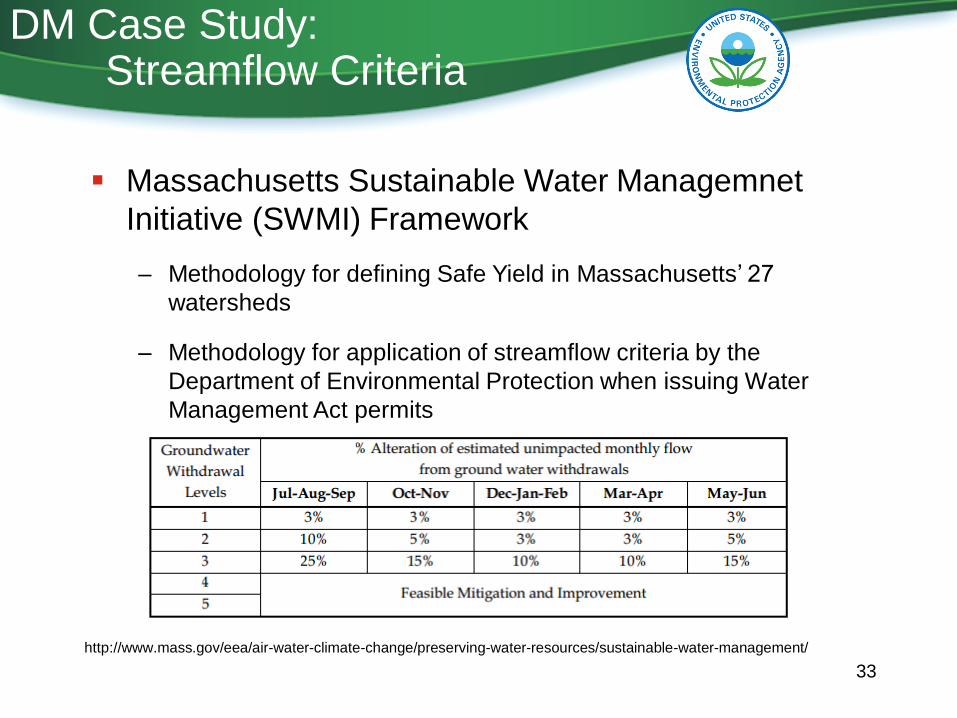
Massachusetts Sustainable Water Managemnet
Initiative (SWMI) Framework
– Methodology for defining Safe Yield in Massachusetts’ 27
watersheds
– Methodology for application of streamflow criteria by the
Department of Environmental Protection when issuing Water
Management Act permits
http://www.mass.gov/eea/air-water-climate-change/preserving-water-resources/sustainable-water-management/
DM Case Study: Streamflow Criteria
33
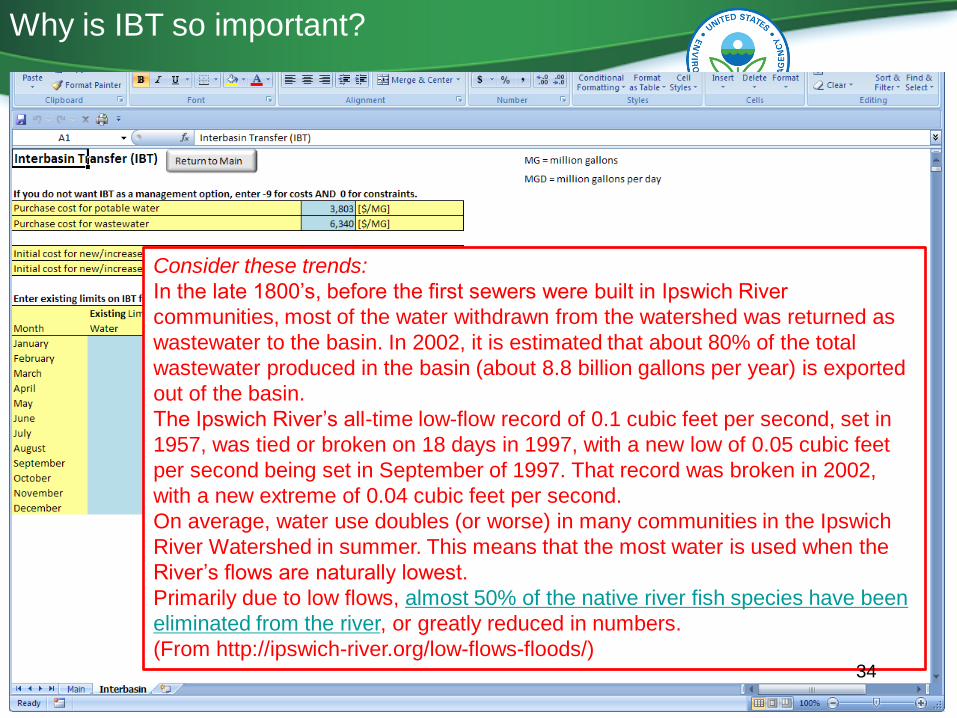
Consider these trends:
In the late 1800’s, before the first sewers were built in Ipswich River
communities, most of the water withdrawn from the watershed was returned as
wastewater to the basin. In 2002, it is estimated that about 80% of the total
wastewater produced in the basin (about 8.8 billion gallons per year) is exported
out of the basin.
The Ipswich River’s all-time low-flow record of 0.1 cubic feet per second, set in
1957, was tied or broken on 18 days in 1997, with a new low of 0.05 cubic feet
per second being set in September of 1997. That record was broken in 2002,
with a new extreme of 0.04 cubic feet per second.
On average, water use doubles (or worse) in many communities in the Ipswich
River Watershed in summer. This means that the most water is used when the
River’s flows are naturally lowest.
Primarily due to low flows, almost 50% of the native river fish species have been
eliminated from the river, or greatly reduced in numbers.
(From http://ipswich-river.org/low-flows-floods/)
Why is IBT so important?
34
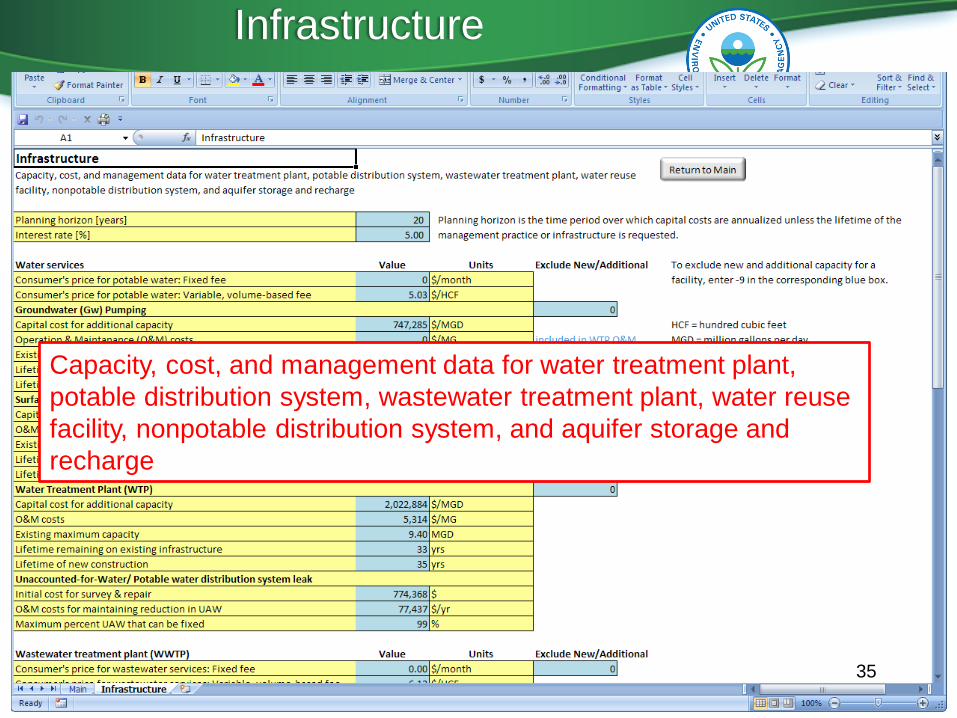
Capacity, cost, and management data for water treatment plant,
potable distribution system, wastewater treatment plant, water reuse
facility, nonpotable distribution system, and aquifer storage and
recharge
Infrastructure
35
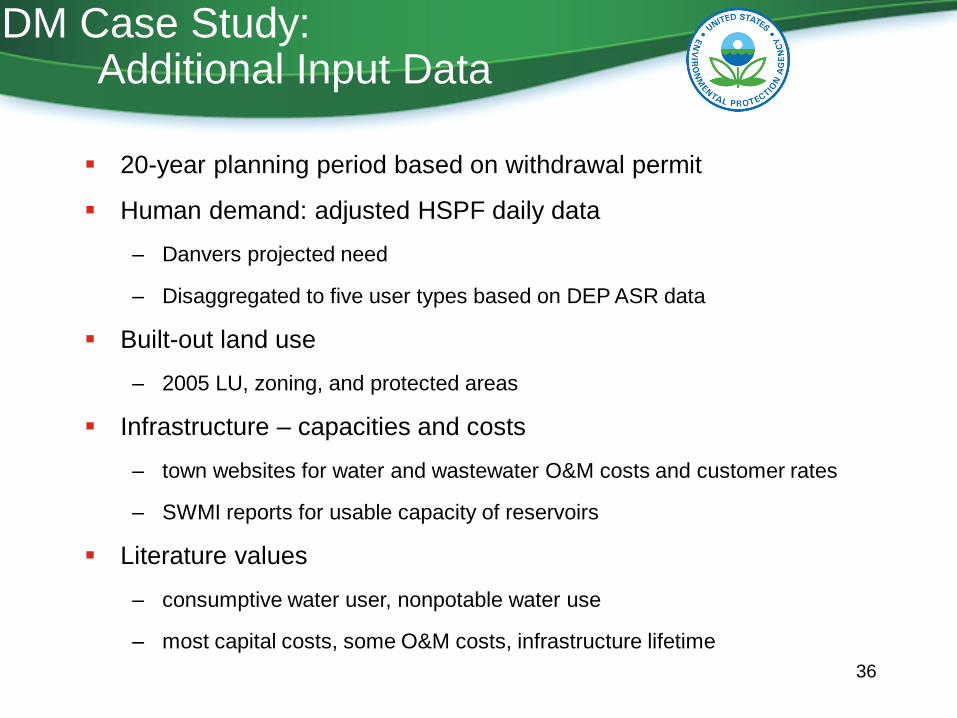
20-year planning period based on withdrawal permit
Human demand: adjusted HSPF daily data
– Danvers projected need
– Disaggregated to five user types based on DEP ASR data
Built-out land use
– 2005 LU, zoning, and protected areas
Infrastructure – capacities and costs
– town websites for water and wastewater O&M costs and customer rates
– SWMI reports for usable capacity of reservoirs
Literature values
– consumptive water user, nonpotable water use
– most capital costs, some O&M costs, infrastructure lifetime
DM Case Study: Additional Input Data
36
Main Screen
#1 #2
#3
#3a-c
#5 #4
#5a-d
#6 #7 #8 #9
#10
37
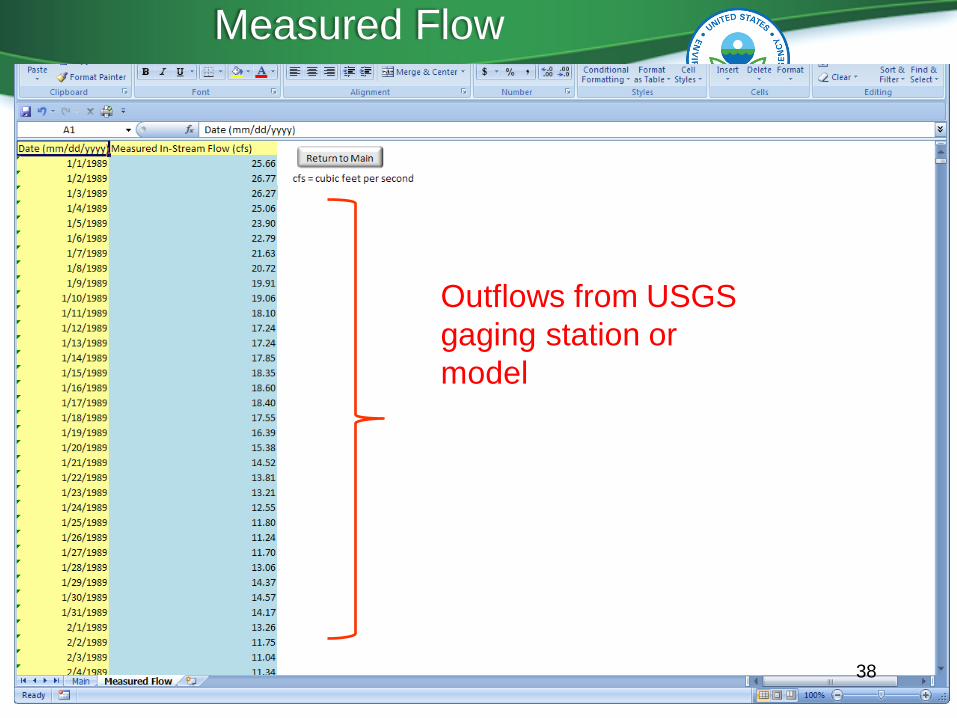
Outflows from USGS
gaging station or
model
Measured Flow
38
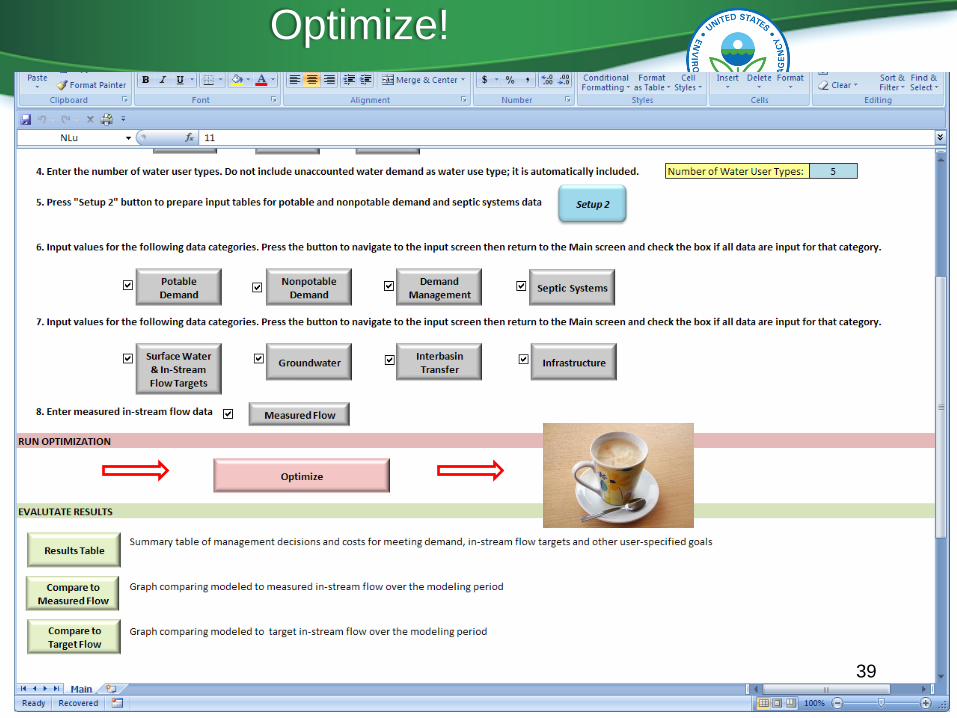
Optimize!
39
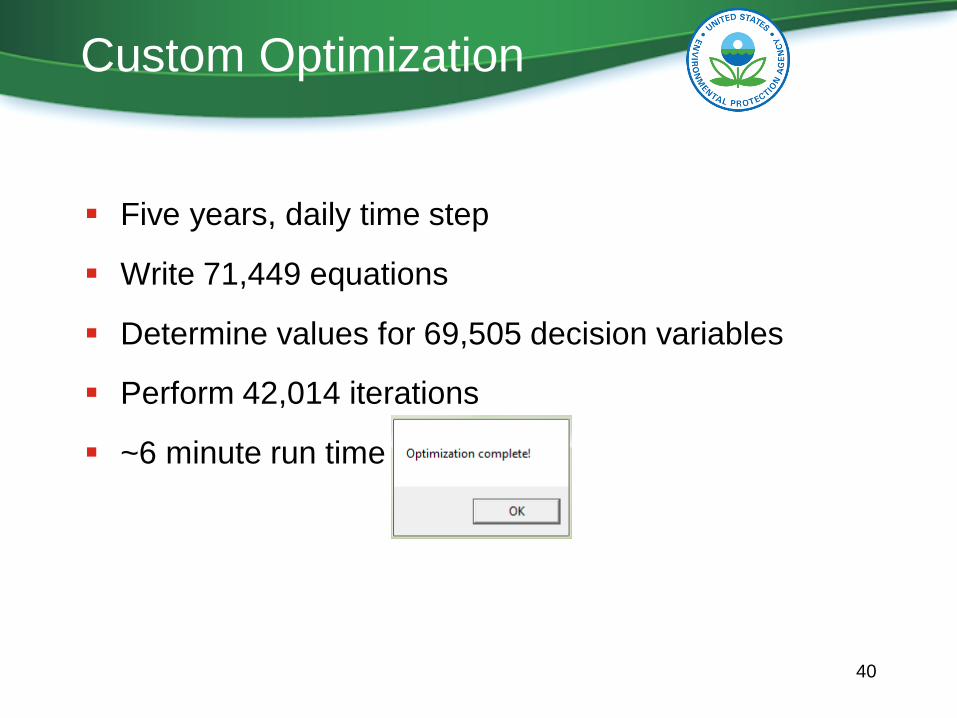
Five years, daily time step
Write 71,449 equations
Determine values for 69,505 decision variables
Perform 42,014 iterations
~6 minute run time
Custom Optimization
40
Objective: Minimize cost to meet projected human
demand and in-stream flow criteria
– Human demand: projected need for 20 new year permit
– In-stream flow criteria: adjusted MA SWMI Category 3
DM Case Study: Optimization
41
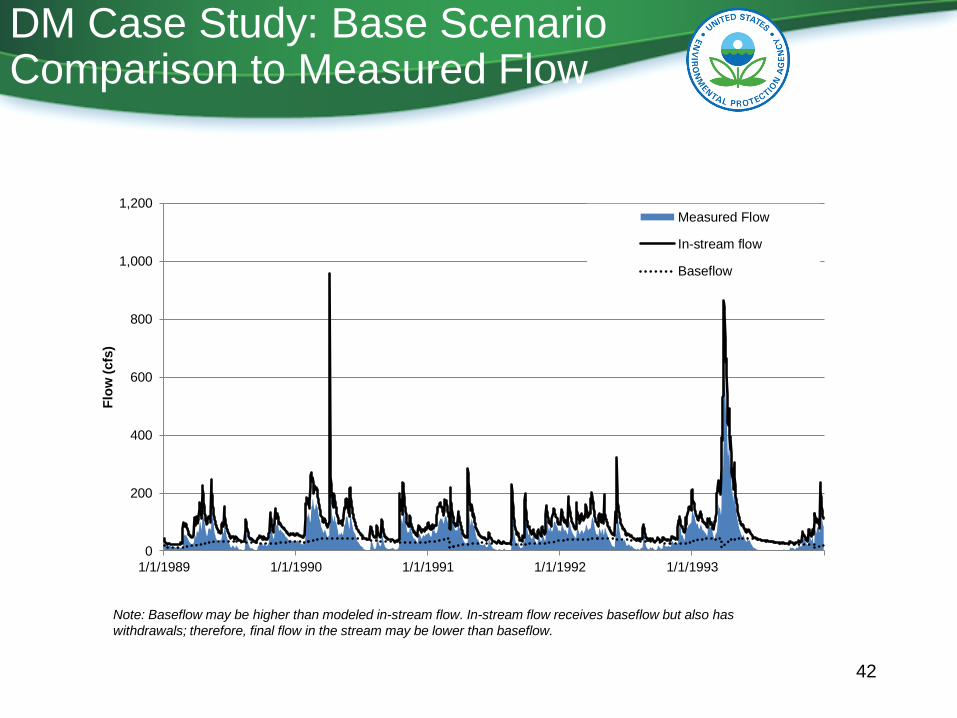
DM Case Study: Base Scenario Comparison to Measured Flow
0
200
400
600
800
1,000
1,200
1/1/1989 1/1/1990 1/1/1991 1/1/1992 1/1/1993
Flo
w (
cfs
)
Measured Flow
In-stream flow
Baseflow
Note: Baseflow may be higher than modeled in-stream flow. In-stream flow receives baseflow but also has
withdrawals; therefore, final flow in the stream may be lower than baseflow.
42
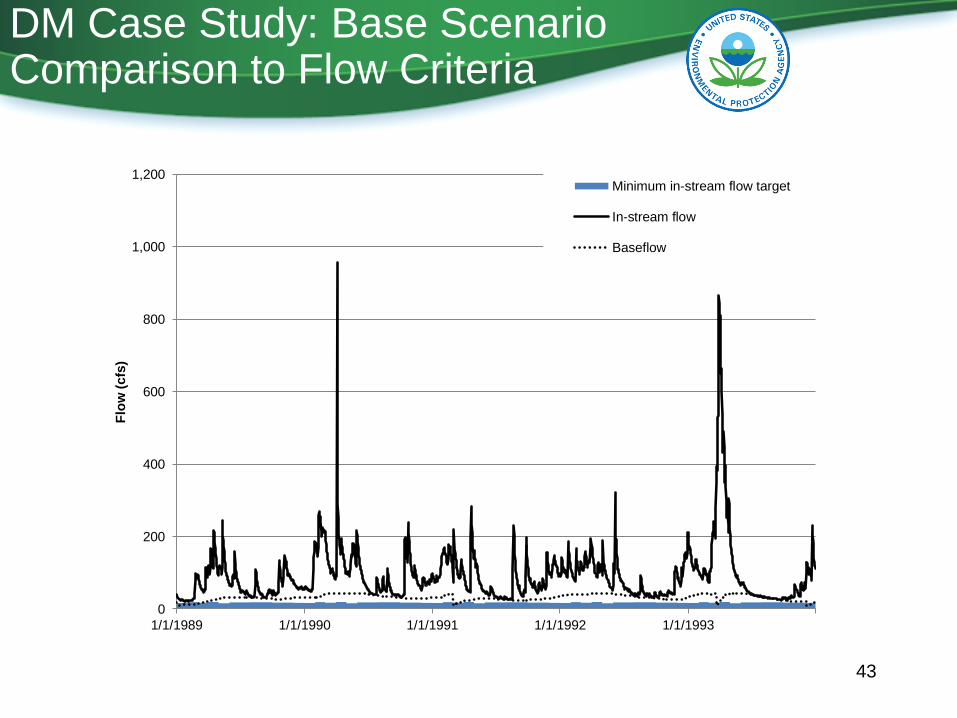
DM Case Study: Base Scenario Comparison to Flow Criteria
0
200
400
600
800
1,000
1,200
1/1/1989 1/1/1990 1/1/1991 1/1/1992 1/1/1993
Flo
w (
cfs
)
Minimum in-stream flow target
In-stream flow
Baseflow
43
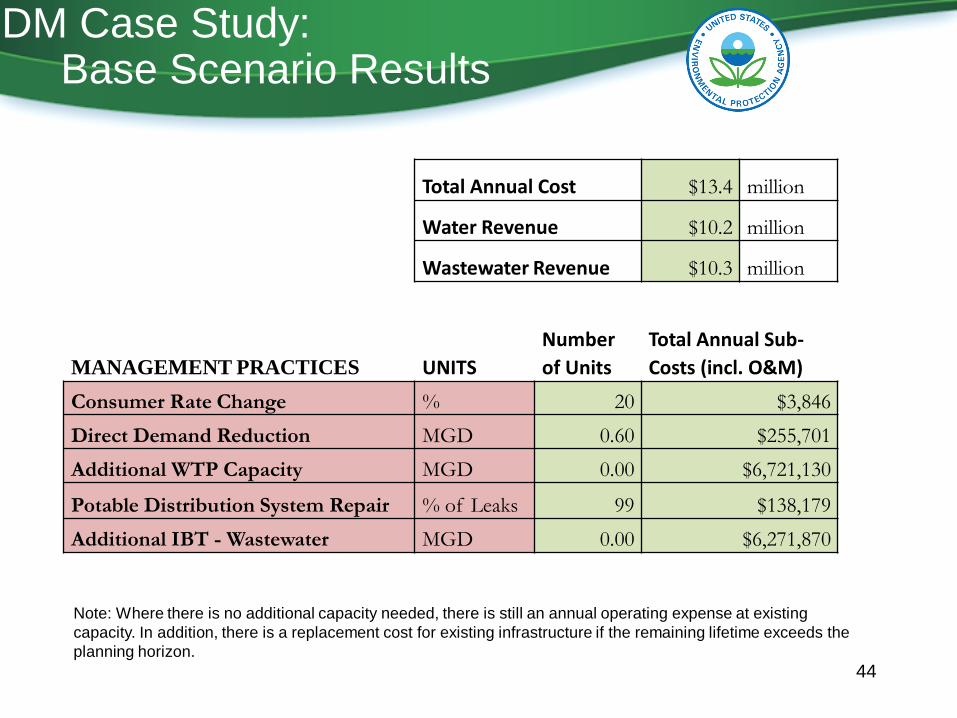
DM Case Study: Base Scenario Results
Note: Where there is no additional capacity needed, there is still an annual operating expense at existing
capacity. In addition, there is a replacement cost for existing infrastructure if the remaining lifetime exceeds the
planning horizon.
Total Annual Cost $13.4 million
Water Revenue $10.2 million
Wastewater Revenue $10.3 million
MANAGEMENT PRACTICES UNITS
Number
of Units
Total Annual Sub-
Costs (incl. O&M)
Consumer Rate Change % 20 $3,846
Direct Demand Reduction MGD 0.60 $255,701
Additional WTP Capacity MGD 0.00 $6,721,130
Potable Distribution System Repair % of Leaks 99 $138,179
Additional IBT - Wastewater MGD 0.00 $6,271,870
44
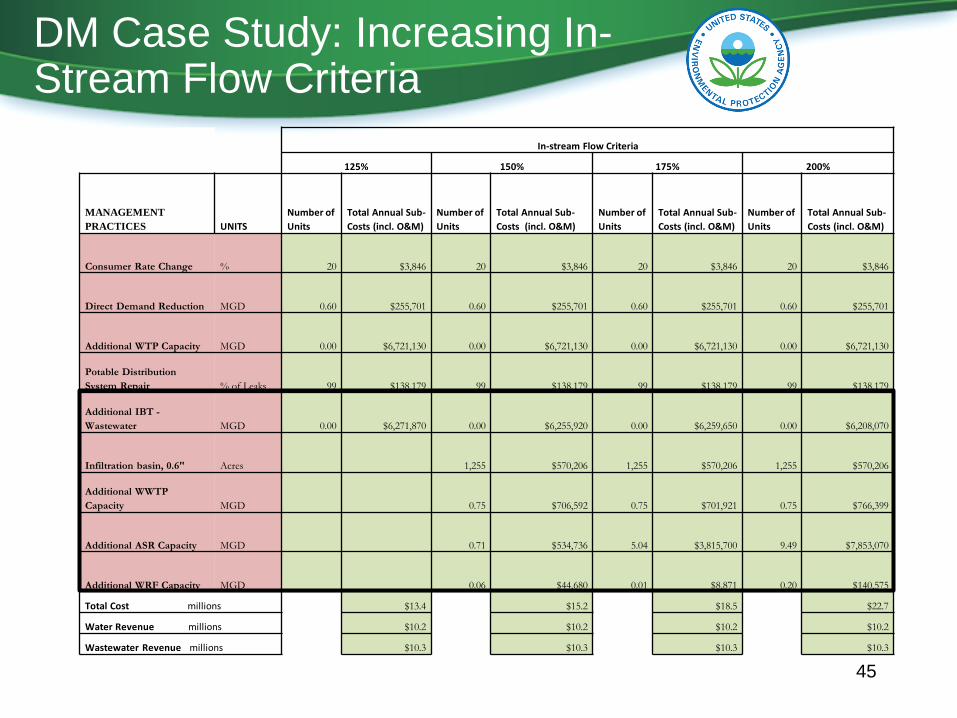
DM Case Study: Increasing In-Stream Flow Criteria
In-stream Flow Criteria
125% 150% 175% 200%
MANAGEMENT
PRACTICES UNITS
Number of
Units
Total Annual Sub-
Costs (incl. O&M)
Number of
Units
Total Annual Sub-
Costs (incl. O&M)
Number of
Units
Total Annual Sub-
Costs (incl. O&M)
Number of
Units
Total Annual Sub-
Costs (incl. O&M)
Consumer Rate Change % 20 $3,846 20 $3,846 20 $3,846 20 $3,846
Direct Demand Reduction MGD 0.60 $255,701 0.60 $255,701 0.60 $255,701 0.60 $255,701
Additional WTP Capacity MGD 0.00 $6,721,130 0.00 $6,721,130 0.00 $6,721,130 0.00 $6,721,130
Potable Distribution
System Repair % of Leaks 99 $138,179 99 $138,179 99 $138,179 99 $138,179
Additional IBT -
Wastewater MGD 0.00 $6,271,870 0.00 $6,255,920 0.00 $6,259,650 0.00 $6,208,070
Infiltration basin, 0.6" Acres 1,255 $570,206 1,255 $570,206 1,255 $570,206
Additional WWTP
Capacity MGD 0.75 $706,592 0.75 $701,921 0.75 $766,399
Additional ASR Capacity MGD 0.71 $534,736 5.04 $3,815,700 9.49 $7,853,070
Additional WRF Capacity MGD 0.06 $44,680 0.01 $8,871 0.20 $140,575
Total Cost millions $13.4 $15.2 $18.5 $22.7
Water Revenue millions $10.2 $10.2 $10.2 $10.2
Wastewater Revenue millions $10.3 $10.3 $10.3 $10.3
45
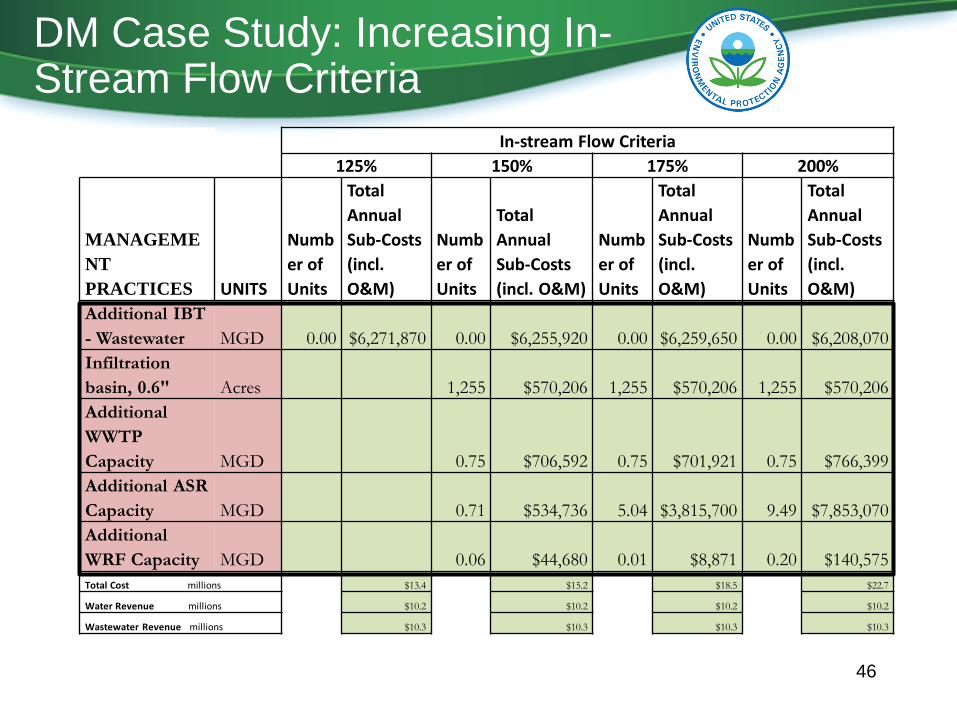
DM Case Study: Increasing In-Stream Flow Criteria
In-stream Flow Criteria
125% 150% 175% 200%
MANAGEME
NT
PRACTICES UNITS
Numb
er of
Units
Total
Annual
Sub-Costs
(incl.
O&M)
Numb
er of
Units
Total
Annual
Sub-Costs
(incl. O&M)
Numb
er of
Units
Total
Annual
Sub-Costs
(incl.
O&M)
Numb
er of
Units
Total
Annual
Sub-Costs
(incl.
O&M)
Additional IBT
- Wastewater MGD 0.00 $6,271,870 0.00 $6,255,920 0.00 $6,259,650 0.00 $6,208,070
Infiltration
basin, 0.6" Acres 1,255 $570,206 1,255 $570,206 1,255 $570,206
Additional
WWTP
Capacity MGD 0.75 $706,592 0.75 $701,921 0.75 $766,399
Additional ASR
Capacity MGD 0.71 $534,736 5.04 $3,815,700 9.49 $7,853,070
Additional
WRF Capacity MGD 0.06 $44,680 0.01 $8,871 0.20 $140,575
Total Cost millions $13.4 $15.2 $18.5 $22.7
Water Revenue millions $10.2 $10.2 $10.2 $10.2
Wastewater Revenue millions $10.3 $10.3 $10.3 $10.3
46
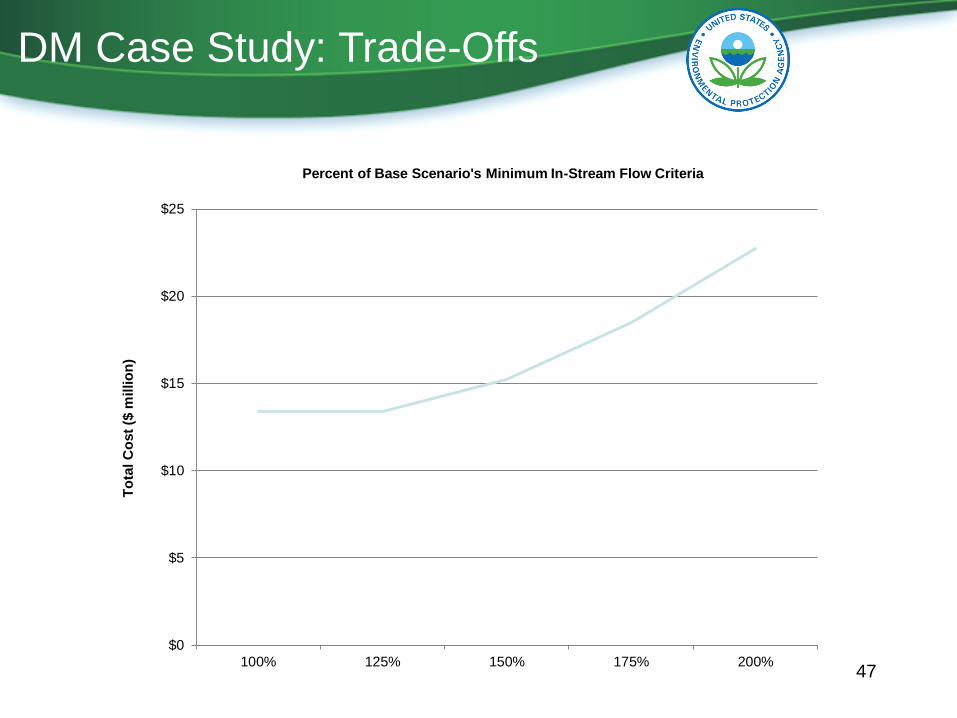
DM Case Study: Trade-Offs
$0
$5
$10
$15
$20
$25
100% 125% 150% 175% 200%
To
tal C
ost
($ m
illio
n)
Percent of Base Scenario's Minimum In-Stream Flow Criteria
47
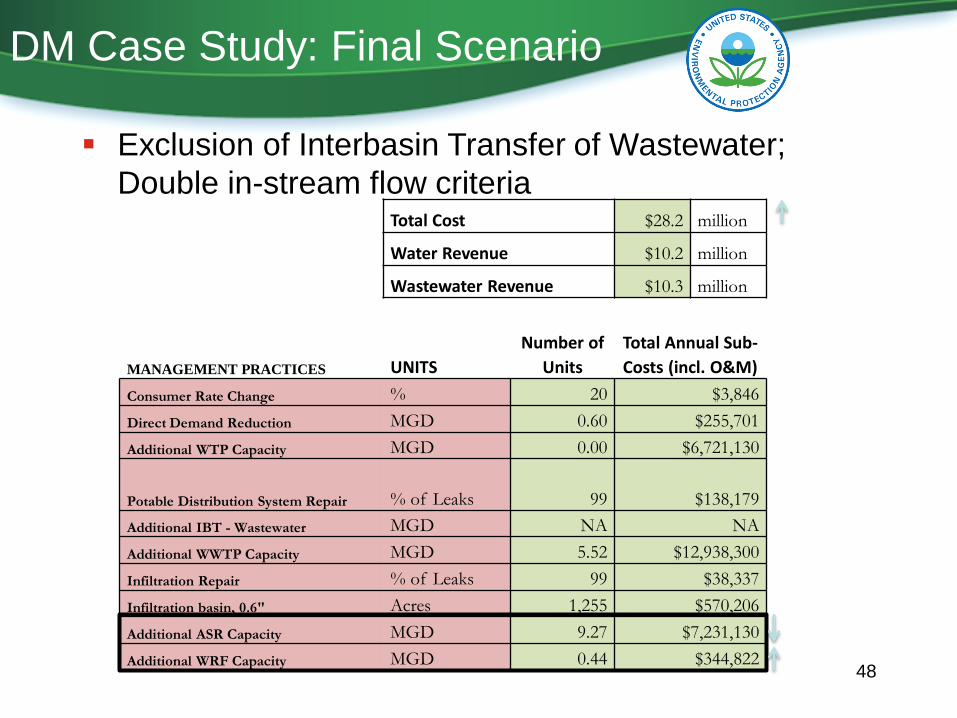
DM Case Study: Final Scenario
Exclusion of Interbasin Transfer of Wastewater;
Double in-stream flow criteria
Total Cost $28.2 million
Water Revenue $10.2 million
Wastewater Revenue $10.3 million
MANAGEMENT PRACTICES UNITS
Number of
Units
Total Annual Sub-
Costs (incl. O&M)
Consumer Rate Change % 20 $3,846
Direct Demand Reduction MGD 0.60 $255,701
Additional WTP Capacity MGD 0.00 $6,721,130
Potable Distribution System Repair % of Leaks 99 $138,179
Additional IBT - Wastewater MGD NA NA
Additional WWTP Capacity MGD 5.52 $12,938,300
Infiltration Repair % of Leaks 99 $38,337
Infiltration basin, 0.6" Acres 1,255 $570,206
Additional ASR Capacity MGD 9.27 $7,231,130
Additional WRF Capacity MGD 0.44 $344,822 48
Highest priority/ most cost effective
– Demand management via pricing
– Direct demand reduction via rebates
– Repair of leakage from potable distribution system
– Repair of I/I to sewer collection system
Selected as in-stream flow requirements increased
– Stormwater management, local wastewater treatment and discharge, ASR and WRF
Never selected
– Nonpotable use, purchase of water from MWRA (MWRA becomes cost effective practice when reduce capital cost by more than 75%)
DM Case Study: Specific Lessons Learned
49
Refinement of input data
– Use of HSPF data to represent wetlands
– Maximum feasible capacity for ASR
– O&M costs for water and wastewater
Additional WMOST capabilities needed
– I/I even if interbasin transfer rather than local WWTP
– Sensitivity module especially for costs
– Simple calibration module for few, key parameters
– Module to simplify simulation
– Output table of all flows
DM Case Study: General Lessons Learned
50
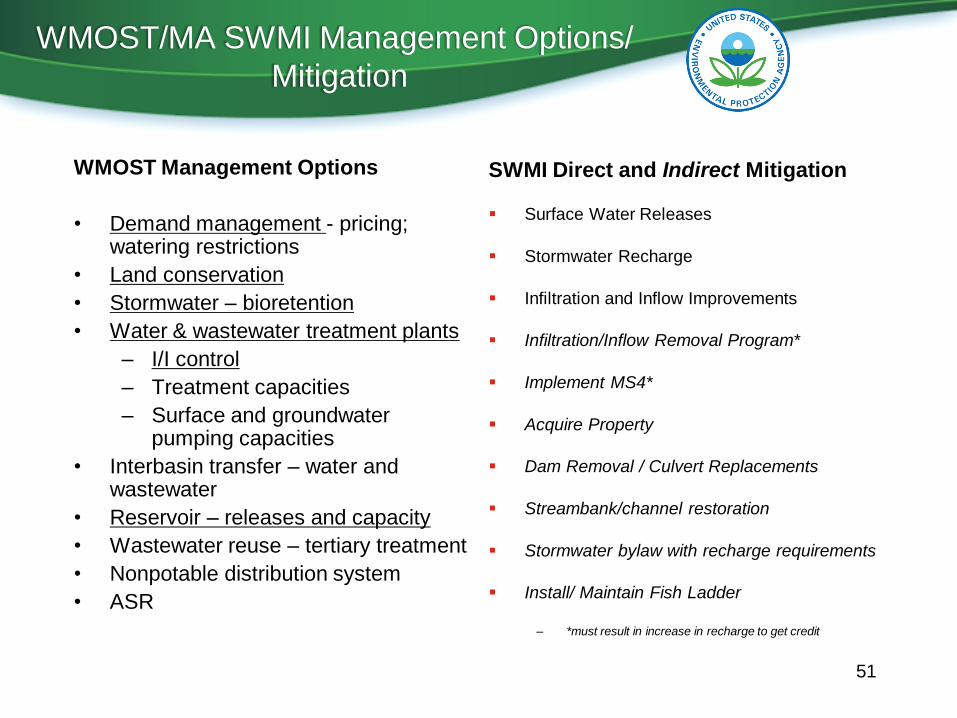
WMOST/MA SWMI Management Options/
Mitigation
WMOST Management Options
• Demand management - pricing; watering restrictions
• Land conservation
• Stormwater – bioretention
• Water & wastewater treatment plants
– I/I control
– Treatment capacities
– Surface and groundwater pumping capacities
• Interbasin transfer – water and wastewater
• Reservoir – releases and capacity
• Wastewater reuse – tertiary treatment
• Nonpotable distribution system
• ASR
SWMI Direct and Indirect Mitigation
Surface Water Releases
Stormwater Recharge
Infiltration and Inflow Improvements
Infiltration/Inflow Removal Program*
Implement MS4*
Acquire Property
Dam Removal / Culvert Replacements
Streambank/channel restoration
Stormwater bylaw with recharge requirements
Install/ Maintain Fish Ladder
– *must result in increase in recharge to get credit
51
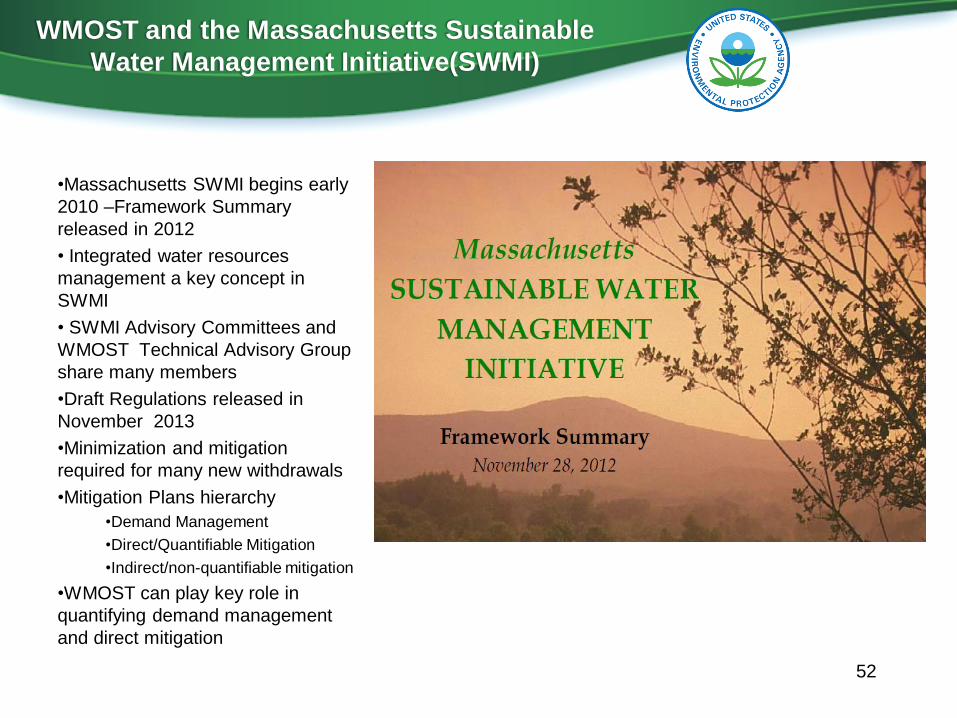
WMOST and the Massachusetts Sustainable
Water Management Initiative(SWMI)
•Massachusetts SWMI begins early
2010 –Framework Summary
released in 2012
• Integrated water resources
management a key concept in
SWMI
• SWMI Advisory Committees and
WMOST Technical Advisory Group
share many members
•Draft Regulations released in
November 2013
•Minimization and mitigation
required for many new withdrawals
•Mitigation Plans hierarchy
•Demand Management
•Direct/Quantifiable Mitigation
•Indirect/non-quantifiable mitigation
•WMOST can play key role in
quantifying demand management
and direct mitigation
52
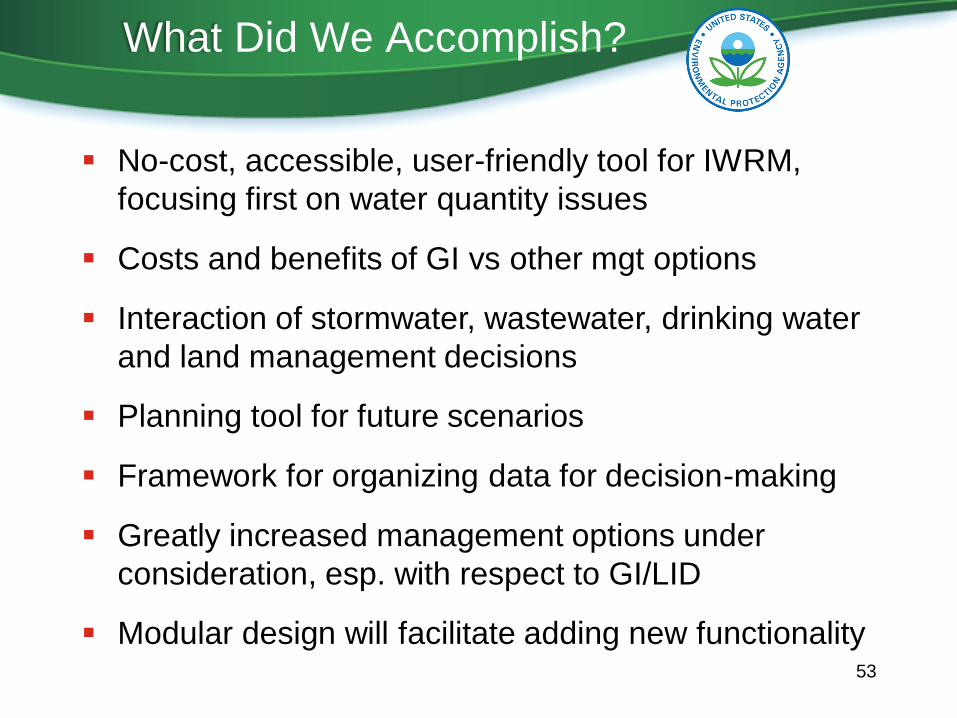
What Did We Accomplish?
No-cost, accessible, user-friendly tool for IWRM,
focusing first on water quantity issues
Costs and benefits of GI vs other mgt options
Interaction of stormwater, wastewater, drinking water
and land management decisions
Planning tool for future scenarios
Framework for organizing data for decision-making
Greatly increased management options under
consideration, esp. with respect to GI/LID
Modular design will facilitate adding new functionality 53
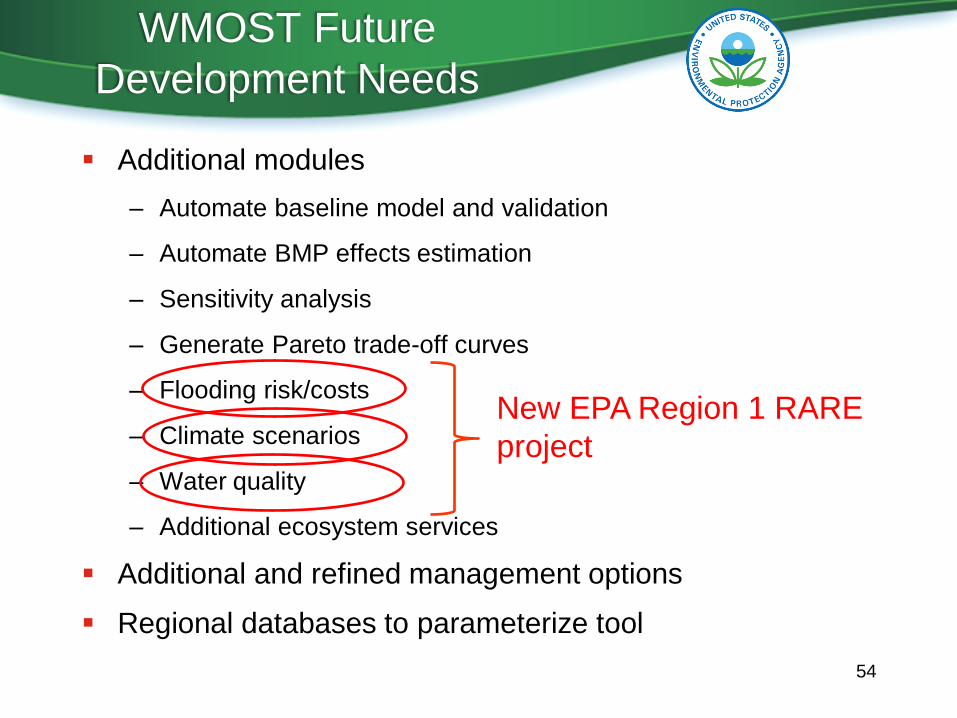
WMOST Future
Development Needs
Additional modules
– Automate baseline model and validation
– Automate BMP effects estimation
– Sensitivity analysis
– Generate Pareto trade-off curves
– Flooding risk/costs
– Climate scenarios
– Water quality
– Additional ecosystem services
Additional and refined management options
Regional databases to parameterize tool
54
New EPA Region 1 RARE
project
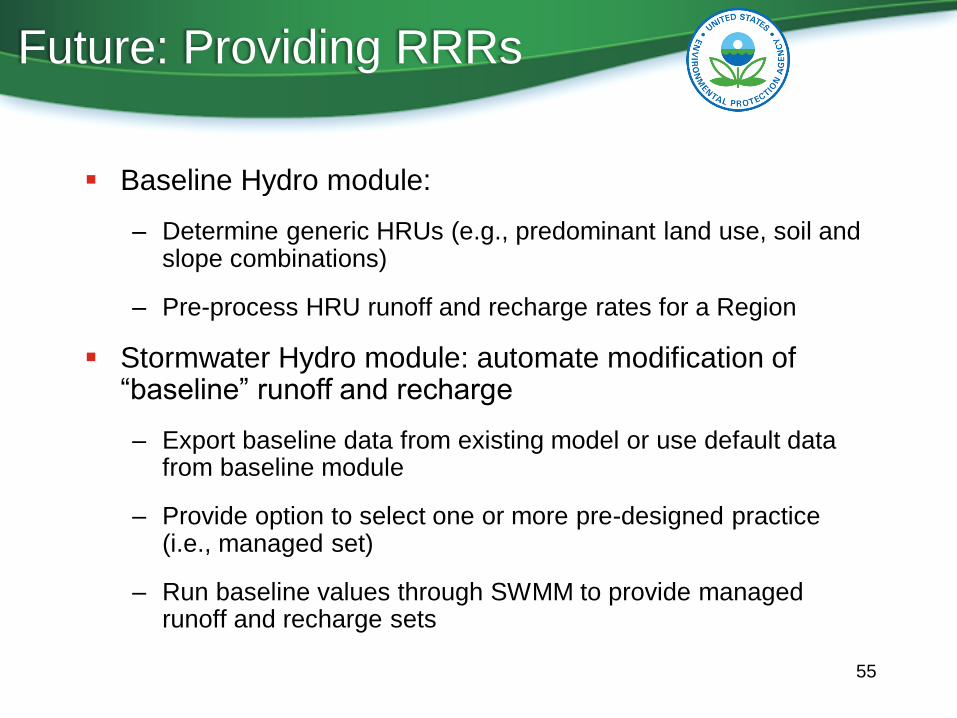
Future: Providing RRRs
Baseline Hydro module:
– Determine generic HRUs (e.g., predominant land use, soil and slope combinations)
– Pre-process HRU runoff and recharge rates for a Region
Stormwater Hydro module: automate modification of “baseline” runoff and recharge
– Export baseline data from existing model or use default data from baseline module
– Provide option to select one or more pre-designed practice (i.e., managed set)
– Run baseline values through SWMM to provide managed runoff and recharge sets
55
Obtaining WMOST
EPA’s Science Inventory
– U.S. EPA. 2013a. Watershed Management Optimization Support Tool (WMOST) v1: Theoretical Documentation. US EPA Office of Research and Development, Washington, DC, EPA/600/R-13/151 (http://cfpub.epa.gov/si/si_public_record_report.cfm?dirEntryId=261780)
– U.S. EPA. 2013b. Watershed Management Optimization Support Tool (WMOST) v1: User Manual and Case Study Examples. US EPA Office of Research and Development, Washington, DC, EPA/600/R-13/174 (http://cfpub.epa.gov/si/si_public_record_report.cfm?dirEntryId=262280)
Or EPA CEAM web site
http://www2.epa.gov/exposure-assessment-models/wmost-10-download-page
56
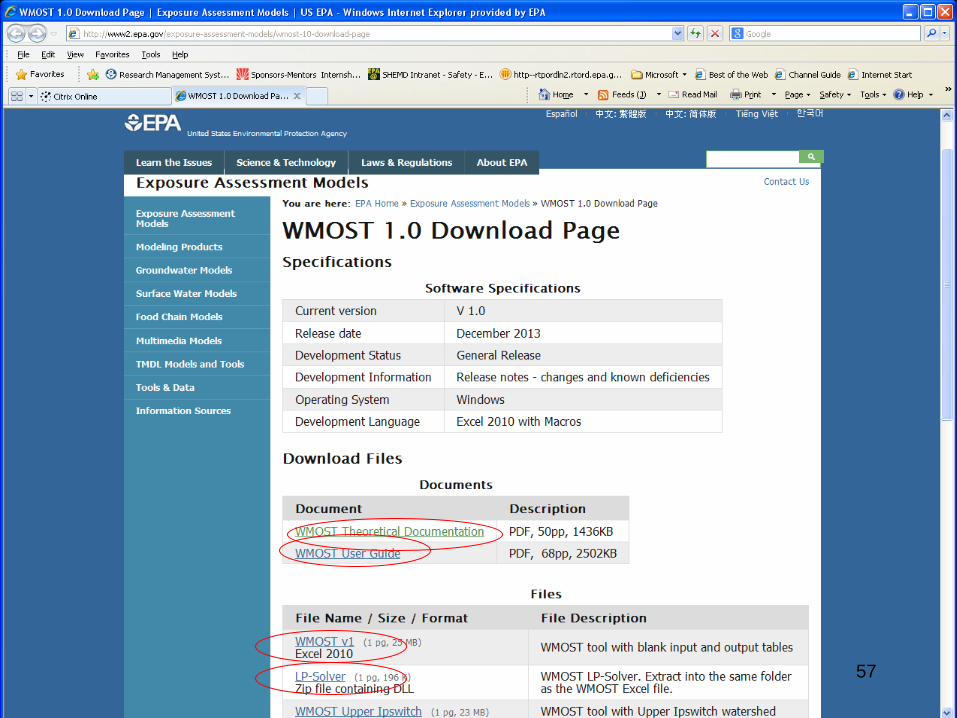
57
Communications
Copy of webinar: http://cfpub.epa.gov/si/si_public_record_report.cfm?dirEntryId=267481 (or search on EPA Science Inventory, WMOST)
To report bugs or to be added to a user list for WMOST updates, send an email to [email protected]
Put in subject line either
– WMOST Bugs
– WMOST Register
58