Embed Size (px)
Citation preview
University of Arkansas, FayettevilleScholarWorks@UARK
Theses and Dissertations
12-2014
Managing Warehouse Utilization: An Analysis ofKey Warehouse ResourcesVitaly BrazhkinUniversity of Arkansas, Fayetteville
Follow this and additional works at: http://scholarworks.uark.edu/etd
Part of the Business Administration, Management, and Operations Commons, and theOperations and Supply Chain Management Commons
This Dissertation is brought to you for free and open access by ScholarWorks@UARK. It has been accepted for inclusion in Theses and Dissertations byan authorized administrator of ScholarWorks@UARK. For more information, please contact [email protected], [email protected].
Recommended CitationBrazhkin, Vitaly, "Managing Warehouse Utilization: An Analysis of Key Warehouse Resources" (2014). Theses and Dissertations. 2136.http://scholarworks.uark.edu/etd/2136
Managing Warehouse Utilization: An Analysis of Key Warehouse Resources
Managing Warehouse Utilization: An Analysis of Key Warehouse Resources
A dissertation submitted in partial fulfillment of the requirements for the degree of
Doctor of Philosophy in Supply Chain Management
by
Vitaly Brazhkin Moscow State Pedagogical College of Foreign Languages
Diploma Degree in Foreign Languages, 1987 University of Arkansas
Master of Business Administration in Business Administration, 1995
December 2014 University of Arkansas
This dissertation is approved for recommendation to the Graduate Council. ______________________________________ Dr. John Ozment Dissertation Director ______________________________________ ____________________________________ Dr. Matthew A. Waller Dr. Terry L. Esper Committee Member Committee Member
ABSTRACT
The warehousing industry is extremely important to businesses and the economy as a
whole, and while there is a great deal of literature exploring individual operations within
warehouses, such as warehouse layout and design, order picking, etc., there is very little
literature exploring warehouse operations from a systems approach.
This study uses the Theory of Constraints (TOC) to develop a focused resource
management approach to increasing warehouse capacity and throughput, and thus overall
warehouse performance, in an environment of limited warehouse resources. While TOC was
originally developed for reducing operational bottlenecks in manufacturing, it has allowed
companies in other industries, such as banking, health care, and the military, to save millions of
dollars (Watson et al., 2007; Polito et al., 2006; Bramorski et al., 1997; Gardiner et al., 1994;
Demmy and Petrini, 1992). However, the use of TOC has been limited to case studies and
individual situations, which typically are not generalizable. Since the basic steps of TOC are
iterative in nature and were not designed for survey research, modifications to the original theory
are necessary in order to provide insight into industry-wide problems.
This study further develops TOC’s logistics paradigm and modifies it for use with survey
data, which was collected from a sample of warehouse managers. Additionally, it provides a
process for identifying potentially constrained key warehouse resources, which served as a
foundation of this study. The findings of the study confirm that TOC’s methods of focused
resource capacity management and goods flow scheduling coordination with supply chain
partners can be an important approach for warehouse managers to use in overcoming resource
capacity constraints to increase warehouse performance.
ACKNOWLEDGEMENTS
This work would not have come to fruition if it had not been for the many individuals
whose efforts I would like to recognize here.
I would like to thank the members of my dissertation committee: Dr. John Ozment, Dr.
Matt Waller, and Dr. Terry Esper. Dr. Ozment, my committee chairperson, has spent countless
hours guiding me in this journey from beginning to end in a way that only he can master: hearing
me out, letting me play on my own at times and then gently pushing me in the right direction,
offering his ideas, experience and guidance, and caring about my motivation by providing
numerous examples and stories from his experience and an occasional lunch – thank you for
that! I could not have wished for a better adviser and friend.
Dr. Matt Waller’s support has been the cornerstone of this research effort. Thank you for
suggesting this research area as a dissertation topic, finding sources of financial support for it and
believing in me.
I am very grateful to Dr. Terry Esper, whose quick grasp of the matter and to-the-point
advice has made this study better.
A number of individuals not on my dissertation committee have contributed to making
this thesis a reality. I would like to thank Dr. Christian Hofer for trying to keep me on track. Dr.
Adriana Rossiter-Hofer’s passion for theories was my inspiration in developing the theory for
this study. Dr. Dub Ashton’s attitude to stand strong despite incredible odds gave me the strength
to brave any challenges along the way. Invariably, in many small ways, I have always felt the
encouragement from all the faculty and doctoral students in the department, the staff of the
college and the supportive Dean Dr. Eli Jones.

There is a group of people who went beyond support; they made a true sacrifice. This is
my family. My wife Irina and my daughter Olga abruptly changed the regular course of their
lives and their lifestyles, left their relatives and friends behind and came here to join me. I am
forever indebted to them for their love and faith in me. Writing a dissertation took long hours,
the time that I would have loved to spend with them and my daughter Masha. I am grateful to
you all for your understanding and ability to make every short moment we were together count
as the happiest time an eternity cannot compare with.
By defending the dissertation I am following in the footsteps of my father Boris and I am
proud to be his son. If my mother Talina had lived to this moment, I know she would have been
very happy.

DEDICATIONS
To the loving memory of my Mother
and
To my Father
TABLE OF CONTENTS
Page
I. INTRODUCTION ……………………………………………………… 1
Importance of the Study………………………………………….…. 1
Focus of the Study ..………………………………………………… 3
Research Questions and Model………………………….……...…… 5
Contributions to Theory and Practice..………………….…………… 8
Plan of the Dissertation .…………………………………………….. 9
II. LITERATURE REVIEW ………………………………………………. 11
Introduction …………………………………………………………. 11
Warehouse Design and Operations………………………………….. 11
Theory of Constraints .………………………………………………. 24
III. THEORY DEVELOPMENT …………………………………………… 29
Adapting TOC to the Warehousing Context .……………………….. 29
Need for modifications ………………………………. 29
Applicability to warehousing in principle …………… 29
Processes vs. resources ……………………………… 32
Key Warehouse Resources…………………………………………… 34
Definition and tests …………………………………… 34
Relation to RBV and RMT …………………………… 35
Typology ……………………………………………… 37
Development of Conceptual Model…………………………………... 43
Introduction…………………………………………… 43
Page
The notion of a constraint and model development……. 44
TOC elements: five focusing steps……………………… 45
TOC elements: buffering and scheduling ……………… 50
TOC outcomes………………………………………….. 51
Warehouse performance……………………………….. 52
Initial Model Validation ...…………..…………………………………. 54
Hypotheses ……………………………………………………..……… 60
IV. METHOD ………………………………………………………………….. 63
The Survey Instrument Design and Administration …………………… 63
Data collection ………………………………………… 63
Data screening …………………………………………. 65
Addressing Potential Bias ……………………………………………… 66
General considerations ………………………………… 66
Remedies against bias used in this study ………………. 68
Behavioral issues in data validation …………………… 70
Construct Measures Development ……………………………………… 75
General considerations …………………………………. 75
Scale structure analysis and purification ………………. 76
Validity and reliability of scaled variables …………….. 77
Scaled variables construction ………………………….. 79
Formative constructs …………………………………… 79
Control variables ……………………………………….. 81
Page
Choice of an Estimation Technique …………………………………… 84
V. RESULTS …………………………………………………………………. 86
Sample Overview ……………………………………………………… 86
Scales ………………………………………………………………….. 92
Tests of Hypotheses …………………………………………………… 95
Hypotheses 1a and 1b …………………………………. 95
Hypotheses 2a and 2b …………………………………. 96
Hypothesis 3 …………………………………………… 97
Hypothesis 4 …………………………………………… 98
Summary of Findings ………………………………………………….. 99
VI. CONCLUSIONS ………………………………………………………….. 101
Contributions Made By This Study……………………………………. 101
Contributions to theory ………………………………… 101
Contributions to applied research ……………………… 102
Contributions to methodology ………………………….. 104
Contributions to practice ………………………………. 105
Conclusion ……………………………………………… 108
Limitations ……………………………………………………………… 108
Future Research ………………………………………………………… 109
REFERENCES ………………………………………………………………………… 111
APPENDICES …………………………………………………………………………. 123
A. Survey (Online Version) ………………………………………………. 123
Page
B. Research Protocol Approval Letter ……………………………………. 132
C. Full Regression Tables for Multiple Regression Analysis …………….. 133
D. Estimates Validation by PLS …………………………………………... 144
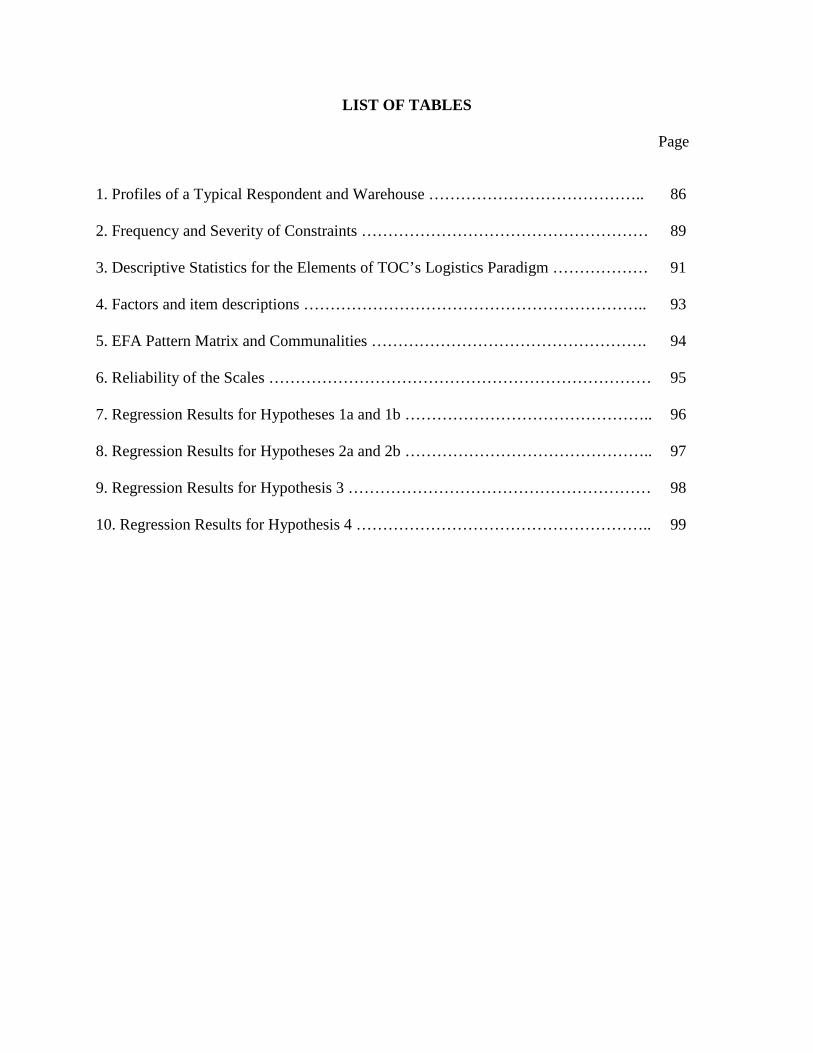
LIST OF TABLES
Page
1. Profiles of a Typical Respondent and Warehouse ………………………………….. 86
2. Frequency and Severity of Constraints ……………………………………………… 89
3. Descriptive Statistics for the Elements of TOC’s Logistics Paradigm ……………… 91
4. Factors and item descriptions ……………………………………………………….. 93
5. EFA Pattern Matrix and Communalities ……………………………………………. 94
6. Reliability of the Scales ……………………………………………………………… 95
7. Regression Results for Hypotheses 1a and 1b ……………………………………….. 96
8. Regression Results for Hypotheses 2a and 2b ……………………………………….. 97
9. Regression Results for Hypothesis 3 ………………………………………………… 98
10. Regression Results for Hypothesis 4 ……………………………………………….. 99
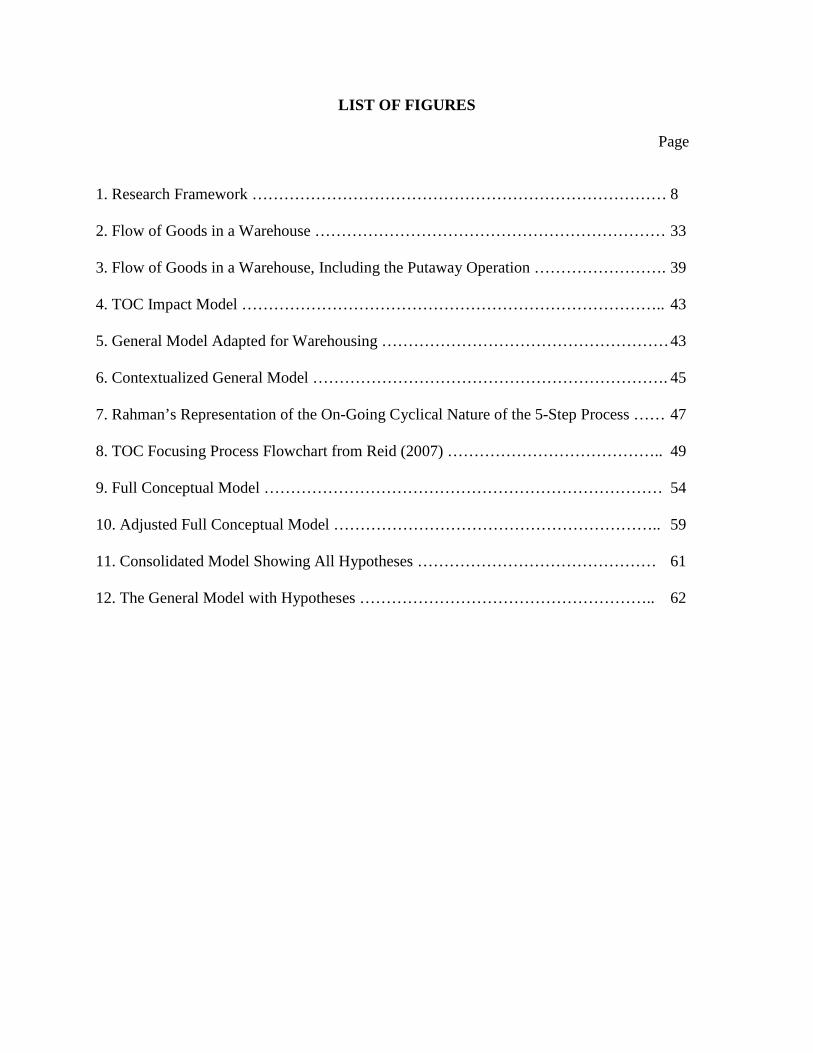
LIST OF FIGURES
Page
1. Research Framework …………………………………………………………………… 8
2. Flow of Goods in a Warehouse ………………………………………………………… 33
3. Flow of Goods in a Warehouse, Including the Putaway Operation ……………………. 39
4. TOC Impact Model …………………………………………………………………….. 43
5. General Model Adapted for Warehousing ……………………………………………… 43
6. Contextualized General Model …………………………………………………………. 45
7. Rahman’s Representation of the On-Going Cyclical Nature of the 5-Step Process …… 47
8. TOC Focusing Process Flowchart from Reid (2007) ………………………………….. 49
9. Full Conceptual Model ………………………………………………………………… 54
10. Adjusted Full Conceptual Model …………………………………………………….. 59
11. Consolidated Model Showing All Hypotheses ……………………………………… 61
12. The General Model with Hypotheses ……………………………………………….. 62
1
CHAPTER I
INTRODUCTION
Importance of the study
The importance of this study stems from the importance of warehousing. Warehouses are
an integral part of the modern supply chain of a firm as well as a major industry by itself. Thus,
warehousing can be looked at from the macroeconomic perspective of the national economy and
the microeconomic perspective of a firm. The North American Industry Classification System
(NAICS) groups establishments whose primary activity is warehousing and storage of goods into
the Warehousing and Storage subsector, NAICS code 4931. In 2013, there were approximately
16,000 establishments in this category, employing approximately 710,000 employees (Bureau of
Labor Statistics, 2014). Many more warehouses are auxiliary parts of companies that fall under
different NAICS codes based on their primary activities.
Private warehousing or purchased warehousing services are a part of logistics cost in
many industries. In 2012, the total cost of business logistics in the United States was $1.33
trillion, 8.5% of the GDP. The total cost of warehousing was $130 billion, about 10% of the total
logistics costs (CSCMP’s Annual State of Logistics Report, 2013). Two decades before, this
amount was close to $60 billion (Delaney, 1992). Obviously, warehouses are an important and
growing part of the US economy.
In addition to the government statistics, the importance of warehousing is also borne out
by recent academic research within the supply chain management domain. In an empirical study
using social network analysis of archival panel data for two decades, Iyengar et al. (2012)
demonstrated that, “over time, logistics and warehousing have not only become more powerful,
2
but have gone from being peripheral activities to being increasingly central and important in the
larger economy” (p. 373).
Private (i.e., company-owned) warehouses were an overwhelming part of the business
model throughout the end of the 20th century (Maltz, 1994). They accounted for over 85% of all
domestic warehousing services in the early 1990s (LaLonde and Maltz, 1992; Maltz, 1994).
Traditionally, private warehouses were viewed as logistics cost centers (Murphy and Poist,
1992). Firms emphasized the facility and equipment side of warehousing with little regard for
human resources and information technology (Murphy and Poist, 1992; Faber et al., 2002).
Private warehouse investment decisions were based on a combination of analysis (such as formal
capital budgeting) and intuition or just on intuition (McGinnis et al., 1990). Outsourcing of
warehousing was not popular because third-party warehouses were perceived to be lacking on
the service side (Maltz, 1994).
However, since the 1990s, warehousing has gone through fundamental changes driven by
rising costs of money and labor, rapid development of technology and information technology in
particular, fierce global competition and rising customer expectations (Dadzie and Johnston,
1991; Raney and Walter, 1992; Faber et al, 2002). Warehouses have experienced a dramatic
increase in productivity and throughput rate, level of automation, reliance on information
technology systems, expanded menus of services, improved service quality, and reduction of
lead times and order processing costs (Dadzie and Johnston, 1991; Stank et al., 1994; Faber et al,
2002). However, the most important changes were at the strategic level.
After the influential work of Porter (1985) on competitive advantage of firms and
business strategies and its adaptation to warehousing by McGinnis et al. (1987) and McGinnis
and Kohn (1988), warehousing started to be viewed as a part of a broader business strategy, both
3
in business and in research (Murphy and Poist, 1992). It has been recognized that warehouses are
not merely cost centers but they are part of the value creation chain and can contribute to the cost
leadership strategy through advantages in operating costs and the differentiation strategy through
improved service quality (McGinnis and Kohn, 1988; Murphy and Poist, 1992; Stank et al.,
1994).
In summary, warehousing has been getting higher prominence in the US economy, in
business strategies of firms seeking competitive advantage, and in academic research. Recent
academic literature has emphasized the need for further research focusing on management of
warehouse processes as an integrated system (Rouwenhorst et al., 2000; Gu et al., 2007) and on,
“identifying the antecedents and consequences of managerial performance in obtaining financial,
market, and logistics goals” (Stank et al., 2011). Thus, the importance of this study is established
by its addressing a matter of high economic significance to the society and business community
and by answering the specific calls for academic research.
Focus of the study
The primary role of warehouses is to serve as buffers in the flow of inventory along the
supply chain (Baker, 2007; Gu et al., 2007). During the 21st century, total US business
inventories have been growing consistently and reached $2.269 trillion in 2012 (CSCMP, 2013).
The growth of inventories demands an increase in the warehouse capacities. However, capacity
increases can only occur in much higher increments than inventory changes and result in a
substantial cost. In 2012, the total logistics costs in the US and the total inventory carrying costs
grew by 3.4% and 4%, respectively, while the cost of warehousing, a part of inventory carrying
costs, increased by 7.6% (CSCMP, 2013).
4
Just as volume of product flow through the supply chain has grown over the years, so has
its velocity, driven by the development of e-commerce, globalization, quick response, value-
added activities and ever increasing consumer expectations (Ackerman, 1999; Frazell, 2002).
The cycle times from order to delivery for consumer products have become particularly short.
Retailers involved in e-commerce, such as Walmart and Amazon, are paving the way for the
same-day delivery market (CSCMP, 2014). This puts the resources of warehouses to the test:
they need to cope with the growing speed of the goods flow as well as the overall increasing
level of inventory.
Thus, modern warehouses face a double-sided challenge of accommodating the ever-
increasing demands on capacity and throughput, especially during periods of peak demand.
Failure to meet these challenges will mean imposing constraints on the ability of the warehouse
to store the required volume of goods, or handle the required goods flow, or both. In the long
term, a single warehouse firm can address the growth of operations through planned warehouse
expansion, such as moving to larger premises or renting adjacent or remote warehousing space to
complement the existing facility. Larger multi-warehouse firms may have an additional option of
redistributing finished goods flows based on changing the product mix or geographical areas
served by individual warehouses. Warehouses of raw materials for manufacturing firms may lack
this option.
Moving to a larger facility or constructing a new warehouse is a major decision likely to
be made by senior management since it involves substantial capital resources and coordination
across the departments of the organization beyond warehousing. It is also one that takes
considerable planning and time. It is rare that this long-term process can be precisely
synchronized with the dynamic changes in modern high-paced warehouse operations. In other
5
words, the warehouse may reach limits in its storage capacity or throughput well before the long-
term solution arrives. In situations like this, managers often are plagued with problems such as
overflowing product in storage, long lines of trucks waiting for loading and unloading,
complaints from customers and/or managers in other departments within their own organizations,
or countless other challenges arising at times of limited or inadequate capacity of warehouse
resources.
Naturally, this can lead to service failures and/or increasing costs as managers struggle to
find on-the-fly solutions. It is the decision processes of managers in situations where warehouse
resources are inadequate during periods of peak demand or are being strained due to the
increasing overall volume of goods moving through the warehouse that is the focus of this study.
More specifically, this study explores warehouse utilization problems and solutions under
constrained capacity or throughput.
Research questions and model
Current academic literature on warehousing looks at warehouses as systems comprised of
processes, resources and organization (e.g. Rouwenhorst et al., 2000). The basic processes are
receiving, storage, order picking, and shipping (Gu et al., 2007). Warehouse resources are most
frequently understood to include personnel, material handling equipment, a computer system,
and a storage system (Hackman et al., 2001; Rouwenhorst et al., 2000). Storage and order
picking have received the most coverage, while research on other processes is clearly lacking
(Gu et al., 2007).
The inability of a warehouse manager to fully cope with increased storage and throughput
requirements is an indication of inadequate levels of one or more of its resources. However, there
6
is little agreement on what constitutes a warehouse resource. For example, some view bar code
scanners and carton boxes as resources (Rouwenhorst et al., 2000). The inclusion or exclusion of
resources from the warehouse resource lists seems to be arbitrary. An argument can easily be
made to consider as warehouse resources a pen and paper as well as the lighting and ventilation
systems. There does not appear to be a comprehensive definition of warehouse resources based
on attributes of the resources, which allows them to be grouped into a useful typology.
Academic literature has another division. Researchers tend to delineate problems of
warehouse design from warehouse operations (Gu et al., 2007; Gu et al., 2010). As a result, some
warehouse features that have a major impact on operations, such as doors and dock space, have
not been considered in the research domain of warehouse operations except for a specific case of
cross-docking operations (Gu et al., 2007).
Therefore, before an empirical study of the influence of warehouse resources on its
performance and factors that moderate that influence can be undertaken, a conceptual
understanding of what constitutes a warehouse resource must be developed. This study
undertakes a comprehensive review of warehouse resources with a goal to come up with
classification principles and a key warehouse resource typology that is useful in practical
operations and provides a more cogent basis for theoretical research. This was accomplished
through a comprehensive literature review and industry survey with a subsequent analysis. Thus,
the first research question of the study is:
RQ1. What are the key warehouse resources?
Despite a considerable body of literature on warehousing design and operations, there are
very few academic papers that addressed the problem of warehouse expansion. Most studies
have assumed that warehouse space is given and matches the required capacity, and these studies
7
typically focused on cost minimization by considering the warehouse storage layout, material
handling, or both. This literature is reviewed in Chapter II. The few studies that addressed
warehouse expansion (such as Cormier and Gunn, 1996, 1999) focused on optimization of a
capacity expansion schedule, assuming a given inventory policy and constant or arbitrary
demand growth.
It is evident that simulation techniques used in operations research are not very useful
tools for finding practical solutions for constrained resources capacity problems. A management
theory that specifically deals with constraint resources may offer a better insight. According to
the Theory of Constraints (TOC) originally proposed for manufacturing (Goldratt and Cox,
1986), every system has at least one resource constraint. Formally identifying it and
implementing measures to alleviate it has been shown to lead to higher performance (Gardiner et
al., 1994). The principles of TOC have been transferred to and tested in other fields, including
supply chain management (Gupta, 1997; Perez, 1997, Rahman, 2002). However, there does not
appear to be any research broadly applying these principles in a warehouse setting. To address
this gap, it is of interest to determine through which mechanisms the application of the TOC
logic could lead to increased performance in warehousing. Therefore, the second research
question of the proposed study is:
RQ2. How does the use of TOC logic to manage warehouse resources in order to
alleviate constraints in warehouse operations lead to better warehouse performance?
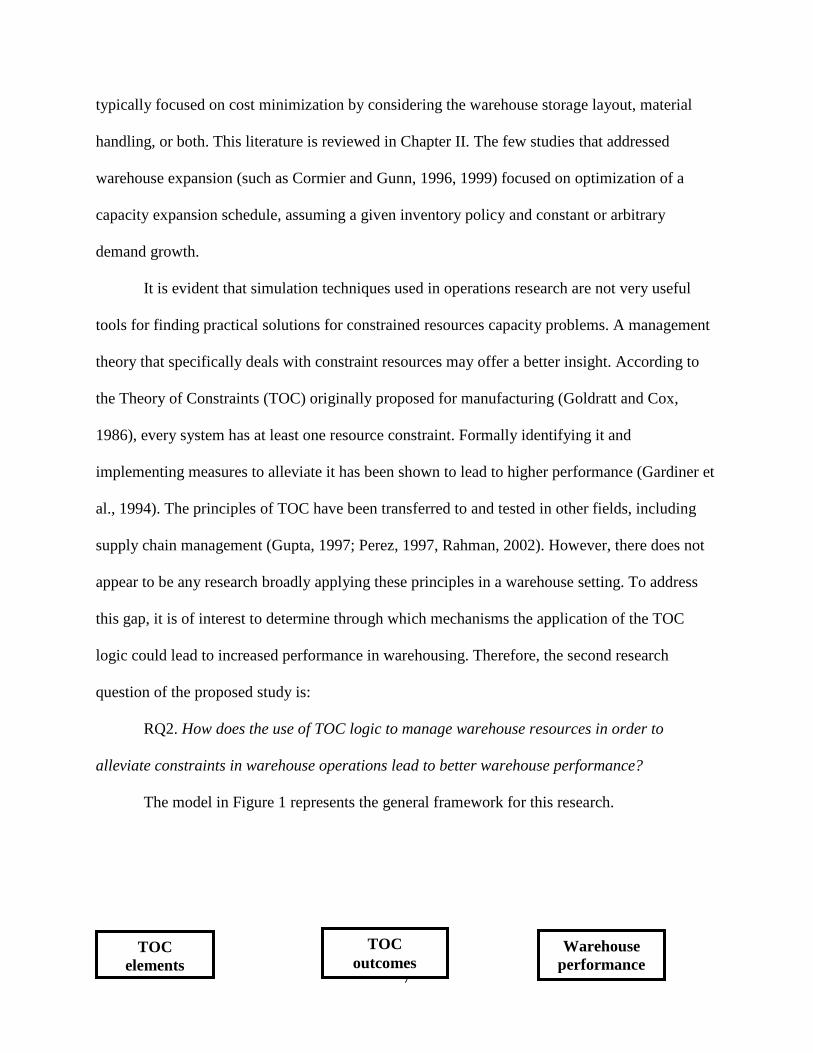
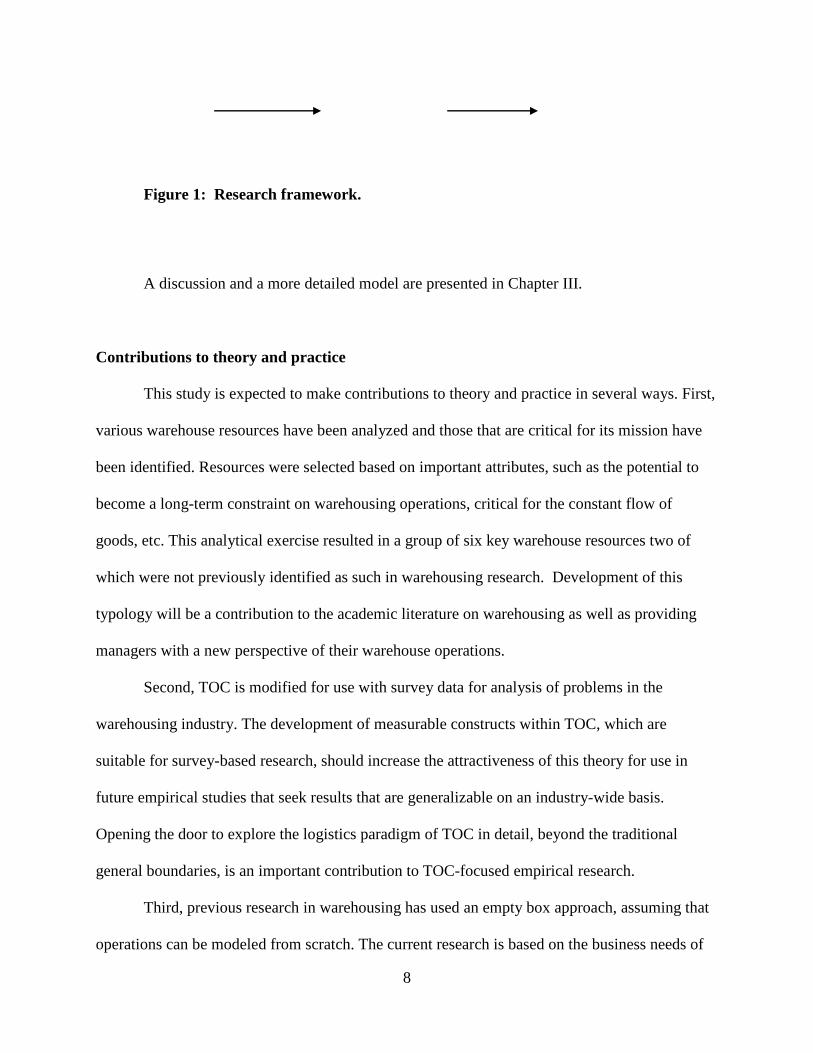
The model in Figure 1 represents the general framework for this research.
TOC outcomes
Warehouse performance
TOC elements
8
Figure 1: Research framework.
A discussion and a more detailed model are presented in Chapter III.
Contributions to theory and practice
This study is expected to make contributions to theory and practice in several ways. First,
various warehouse resources have been analyzed and those that are critical for its mission have
been identified. Resources were selected based on important attributes, such as the potential to
become a long-term constraint on warehousing operations, critical for the constant flow of
goods, etc. This analytical exercise resulted in a group of six key warehouse resources two of
which were not previously identified as such in warehousing research. Development of this
typology will be a contribution to the academic literature on warehousing as well as providing
managers with a new perspective of their warehouse operations.
Second, TOC is modified for use with survey data for analysis of problems in the
warehousing industry. The development of measurable constructs within TOC, which are
suitable for survey-based research, should increase the attractiveness of this theory for use in
future empirical studies that seek results that are generalizable on an industry-wide basis.
Opening the door to explore the logistics paradigm of TOC in detail, beyond the traditional
general boundaries, is an important contribution to TOC-focused empirical research.
Third, previous research in warehousing has used an empty box approach, assuming that
operations can be modeled from scratch. The current research is based on the business needs of
9
existing warehouses through which volumes have grown such that the initial capacity is no
longer sufficient, especially during periods of peak demand. This is a common situation in
industry but it has been overlooked by academic research due to negligible collaboration with
industry (Gu et al., 2007). To overcome this shortfall, warehouse managers are provided with an
evaluation of methods for dealing with constraints in existing warehouses, which is supported by
solid theory.
Lastly, the identification of key warehouse resources and TOC elements for the
warehouse will give managers a better understanding of their options in resource management
and will help managers to focus their efforts on improving existing operations, even if they
choose to act outside of the TOC paradigms.
Contributions of this study are discussed in more detail in Chapter VI.
Plan of the dissertation
Chapter I introduced the problem of warehouses reaching the full originally planned
capacity of their resources while trying to adjust to the growing volume of operations as the
focus of this study. It has also stressed the importance of this study for industry as well as
outlined the theoretical contributions it aspires to make.
Chapter II provides a review of relevant academic literature on the subjects of
warehousing and the theory of constraints and summarizes the conclusions that can be drawn
from previous studies to be used in this research.
Chapter III develops a detailed framework for the study. It applies TOC to the
warehousing context, discusses the notion of a key warehouse resource, and develops a model
and a set of hypotheses to be tested in the empirical part of the study.
10
Chapter IV discusses the methodology of the study. The operationalization of the
constructs, data collection and the method of analysis are be explained.
Chapter V provides the findings of the empirical research and conclusions that can be
drawn from them.
Chapter VI concludes this work with a detailed discussion of contributions of this study,
its limitations and suggestions for future research.
11
CHAPTER II
LITERATURE REVIEW
Introduction
In this section, the literature relevant to this research is reviewed. There is an abundance
of academic literature on warehousing, however, most papers deal with narrow well-defined
problems (Rouwenhorst et al., 2000), so general classifications of warehouse resources and
processes can only be found in practitioners’ handbooks, such as Frazell (2002) and Tompkins
(2003), or in academic papers whose main purpose is literature review, such as Gu et al. (2007),
Gu et al. (2010), Cormier and Gunn (1992), and Rouwenhorst et al. (2000).
Most literature reviews on warehousing separate design and operations into two different
frameworks. Warehouse resources largely fall under design, while warehouse processes are
covered in the warehouse operations research. There is also a large body of literature on the
theory of constraints, which will be modified for use in analyzing the management of warehouse
resources. Thus, for the purposes of this study, it is expedient to split the literature review into
two sections: warehouse design and operations, and the theory of constraints.
Warehouse design and operations
It has been noted that research on warehouse design is very disjointed, dealing with
specific problems, and that integrative methods of warehouse design have not been proposed
(Rouwenhorst et al., 2000; Goetschalckx et al., 2008). Gu et al. (2010) proposed a framework of
warehouse design that consists of five components: overall structure, sizing and dimensioning,
department layout, equipment selection, and operation strategy selection. However, there is a
considerable overlap in many papers dealing with these topics, and very few of them seem to fall
12
strictly within one of the five categories (e.g., Rosenblatt and Roll, 1984), which is
understandable, given how interconnected these categories are. For the purposes of this literature
review, the only research that was included dealt with the storage area (whether sizing or layout),
other areas (departments) of the warehouse, and/or equipment selection.
The layout of a storage area in conjunction with a particular storage system emerges as a
key focus area of warehouse design research. One direction of research was determining the
optimum size of the storage area with a view to minimize the total storage and handling cost.
One of the early works in this research stream was undertaken by Francis (1967). He developed
mathematical models that minimized the total annual costs of an item’s movement between an
outside point (a loading/unloading dock) and any point within a rectangular shaped storage area
containing one or multiple items. His models took into account costs associated with warehouse
perimeter construction and maintenance costs for a fixed warehouse dimensions (surface area
and height). However, the models were based on some restrictive assumptions which do not
reflect modern real-world warehouse operations. He assumed a single point of goods loading and
unloading (dock) and equal probability of an item movement between the dock and any point in
the warehouse.
Francis (1967) did not consider the inner structure of the storage area beyond its size and
rectangular shape. A key characteristic of storage is its capacity (Rouwenhorst et al., 2000). In
addition to its size and shape it depends on its internal layout and storage systems used. Three
types of storage systems are widely considered in the literature: floor storage (block stacking),
racks, and automated storage and retrieval systems (AS/AR). Storage of goods on the floor is the
simplest way of storing. It has its advantages (flexibility) and disadvantages (honey-combing and
poor utilization of the volume of the storage area). The AS/AR systems, as the name suggests, is
13
a combination of the two processes, storage and retrieval, performed with a certain degree of
automation. When automation is achieved through automatic storage and retrieval systems, the
rigid design of processes and capacity of automated warehouses does not allow much room for
maneuvering in terms of finding untapped reserves of warehouse resources, so we formally
control for this condition in this study.
Further research relaxed some of the simplifying assumptions of Francis (1967).
Following previous research, Berry (1968) equated the optimum efficiency of the warehousing
operation to the one that minimizes the total costs, which are made up of two categories: costs
associated with the storage area or volume occupied, and material handling costs. He
investigated in detail two layouts: a rectangular block with aisles parallel to the two walls and a
perpendicular connecting aisle along another wall; and a rectangular block with a single diagonal
aisle. He actually considered and rejected as inferior a number of other layouts: those with cross
aisles, multiple radial aisles and others. In addition to block storage on the floor, he considered
storage on racks of various height as well as different storage allocation policies (random and
dedicated) and fast and slow moving SKU’s. He proposed a number of recommendations to be
taken into account in warehouse design.
One of his main conclusions important for this study is that he explicitly stated the trade-
off between the space utilization and material handling costs in a warehouse: “The warehouse
layout which gives maximum utilization of space is different from one which minimizes
handling distance” (p.115). It should be noted that travel distance, as well as time, in the
warehouse are routinely used as a proxy for material handling costs (e.g., Rosenblatt and Roll,
1984: Goetschalckx and Ratliff, 1988; Ashayeri & de Booy, 2008; Ellis et al., 2008). In a
conventional warehouse, material handling costs are incurred through the use of personnel and
14
lift trucks. It is common knowledge that distance traveled is a product of time and speed of
travel. In, a warehouse setting, the typical travel speed of a person or a lift truck are perceived as
known since they are limited by the physical ability of a person, technical specifications of the
machine, and, often, safety rules. This makes the shortest travel time and distance
interchangeable objectives for cost minimization.
Bassan et al. (1980) incorporated the same material handling and warehouse perimeter
costs as Francis (1967) but considered two scenarios of aisles in a rectangular shaped storage
area: aisles going lengthwise (parallel to the long side of the storage area) and aisles going across
(parallel to the short side of the storage area). The authors developed an optimization model for
these parameters and proposed some guidelines to execute a warehouse layout for these
scenarios.
The stream of research concerned with the layout of the storage area has been very
potent. The most typical attributes of layout considered are: lane depth and orientation in block-
stacking pallet storage (e.g., Moder and Thornton, 1965; Berry, 1968; Marsh, 1979;
Goetschalckx and Ratliff, 1991), and number of aisles and their configuration (e.g., Berry, 1968;
Larson et al., 1997; Bassan et al., 1980; Pandit and Palekar, 1993). Most recently,
unconventional aisle configurations (flying V, fishbone, leaf, butterfly and chevron) were
explored by Gue and Meller (2006), and Öztürkoğlu et al. (2012). The details of particular
layouts considered by these and other papers in this stream are not important for our research and
are therefore not discussed here. However, we note as relevant for our research the explicit
conclusion that the reduction of retrieval travel time comes at a cost of a loss of storage space
utilization (Öztürkoğlu et al., 2012). Or in more general terms, there is a tradeoff between
15
storage capacity and material handling cost, a conclusion already stated by Berry (1968) and in
many research papers that followed.
Another problem of storage area design arises because of separating the area into picking
and reserve areas, also referred to as forward and reserve. One of the earliest studies of this type
was performed by Bozer (1985). He split the pallet rack horizontally into a lower picking area
and an upper reserve area. The forward picking area, whether it is lower or closer to the center of
the aisle, saves handling time, but requires periodic replenishment from the reserves. The
objective of his and many other studies that followed (e.g., Hackman and Rosenblatt, 1990; van
den Berg et al., 1998) was to minimize material handling cost (especially picking time), and thus
increase the throughput capacity of the storage area.
Starting from White and Francis (1971), researchers have recognized that there is a cost
of not having enough storage capacity. Consequently, they have incorporated this cost into their
optimization models. Rosenblatt and Roll (1984), who made an attempt at integrating several
warehouse design problems (size, layout and storage policy), also included a cost of load
rejection due to lack of storage space in their model. For a warehouse with pallet racks, they
considered a combination of two types of storage policies: zoning and degree of randomness.
The zoning of the storage area dictates that the whole incoming load of pallets must be stored
within the same zone. The degree of randomness of storage implies that under the grouped
storage policy all of the pallets of the incoming load must be stored together, while under the
random storage policy, it is not a requirement. The authors make an important conclusion that
there are trade-offs involved in the storage space utilization (and associated costs) and storage
policies. The best space utilization is achieved with no zoning and complete randomness of
16
storage; the worst (and higher level of load rejection due to capacity shortage) is likely to occur
in a storage area split into small zones combined with the grouped storage policy.
Their work described above is representative of the stream of research by these authors
exploring factors that affect storage capacity (e.g., Roll and Rosenblatt, 1983). In their later work
(Rosenblatt and Roll, 1988), they introduced the concept of service level in the determination of
capacity. The service level is defined as, “the proportion of days (or any other unit of time) for
which the given warehouse capacity is sufficient for accommodating the required replenishment
shipments” (p. 1847). They found that for a predetermined service level the required warehouse
capacity is affected by the number of SKUs stored, the demand characteristics (picking), and the
replenishment policy.
Previously reviewed work typically considers one storage area. In reality, available space
may be allocated to several competing activity areas (e.g., pallet racks, block stacking, receiving
buffer and shipping staging area). Pliskin and Dori (1982) compared seven suggested area
assignments for a tools warehouse, a part of a metal-cutting operation, by considering trade-offs
among four space categories. They proposed a method of multi-attribute value functions which
assigned a score and permits the ranking of options according to the decision maker’s
preferences. Of relevance to our research here is an explicit consideration of trade-offs among
several space categories.
Tradeoffs between allocating a limited resource (floor space) to two different storage
systems (a random access system and a rack system) were studied by Azadivar (1989). Under the
random storage system, the throughput is higher because every storage slot is immediately
accessible from the floor level but the storage capacity is lower (only one tier). The rack system
has the opposite characteristics: its throughput is lower but the storage capacity is higher (several
17
tiers). The objective of the study was to find the best tradeoff between the two systems that
balances the storage capacity and operational efficiency.
While Azadivar’s study was performed in the context of an automated storage and
retrieval system operating in the rack storage and a nonautomated material handling system
operating in the random access storage area, its principal tenet applies to completely
conventional warehouses as well. For example, the problem he solved for an automated storage
system warehouse is similar to deciding between the share of racks with narrow aisles, which
provide better storage capacity but slower pallet putaway and retrieval, and the share of racks
with regular (wide) aisles, where capacity is decreased due to more floor space taken by the
aisles but the operational efficiency is higher, in a conventional warehouse.
Park and Webster (1989) pursued an even more integrated approach to comparing three-
dimensional pallet storage systems. They proposed a model that, “simultaneously considered the
following factors: control procedures, handling equipment movement in an aisle, storage rules,
alternative handling equipment, input and output patterns for goods flow, storage rack structure,
component costs and the economics of each storage system” (p. 985) with appropriate
optimization targets.
Several studies reviewed above (e.g., Francis, 1967; Bassan et al., 1980) as well as others
have included assumptions about the location of doors relative to the storage area in their travel
time optimization models. However, there is practically no academic literature on warehouse
doors that considers their capacity and potential to constrain the goods flow or their potential to
relieve other constrained resources. The scarce cross-docking literature considers the optimum
door layout for truck assignments (Gue, 1999) or travel and waiting time minimization due to
congestion (Bartholdi and Gue, 2000). However, these works are not applicable to the door
18
capacity problem considered in our study. The number of doors can be a serious constraint or, in
some instances, can be used to relieve other constrained resources.
Selection of material handling equipment such as lift trucks is part of any warehouse
design. It is often considered together with the selection of the storage system. Baker and
Canessa (2007) reviewed the literature on individual steps in warehouse design from 1973
through 2006. Of the 14 studies reviewed only 5 list designing or selecting material handling
equipment as separate steps. Šraml et al. (2008) used discrete simulation to analyze the
efficiency of four principal warehouse transportation vehicles: a counterbalance lift truck, a
reach truck, a narrow-aisle lift truck, and a stacker crane. There is paucity of academic studies on
lift truck selection but advice to practitioners can be found in popular warehousing handbooks.
In Baker and Canessa’s (2007) review of research on warehousing design steps, only two
papers identify calculation of staffing needs as a step. Most studies consider personnel implicitly
when optimizing material handling costs. As Rowenhorst et al. (2000) observed, “minimizing
operational costs in particular often boils down to minimizing the required work force” (p. 522).
Ashayeri and de Booy (2008) looked at warehouse personnel from a different
perspective. They addressed the issue of workload balancing in order to reduce response time, an
increasingly important objective in modern warehousing operations. They proposed a three-
phased framework, the middle phase of which is workforce planning. They presented three
different models of workforce planning (capacity assignment, mean value analysis, and CAN-Q
approach) and evaluated them using simulation.
Outside of operations research, a considerable body of literature on warehouse human
resources management has been published in supply chain management journals. Most studies
recognize the critical importance of availability and effective management of human resources to
19
warehouse operations (e.g., Autry and Daugherty, 2003). There are also indications of problems
with employee job satisfaction and turnover in warehouses, with turnover exceeding 100% in the
worst cases (Murphy and Poist, 1992). However, smaller warehouses were found to do a better
job of attracting and retaining human resources (Min, 2007). Only two ways to match the
workload with the availability of personnel appear to be considered in the academic literature.
Some studies emphasized efficient labor scheduling and workload forecasting that, “minimizes
labor costs while maintaining service commitments” (Sheehan, 1989; Sanders and Ritzman,
2004), whereas most other work considered ways to simply attract more employees and do a
better job of retaining them, such as through higher job satisfaction (e.g., Murphy and Poist,
1993; Autry and Daugherty, 2003).
There does not appear to be literature that considered the possibility of operational
tradeoffs between warehouse labor and other resources. The closest to this was the study by
Sanders and Ritzman (2004) that considered the flexibility of warehouse personnel in itself (e.g.,
through cross-training) to be used as a tool to offset workload forecast errors. However, labor is
frequently the most flexible resource in the warehouse.
Academic supply chain literature also has focused on information technology in the
warehouse and tracked its evolution from humble beginnings as electronic data interchange
(EDI) between warehouses and customers (see for example, Raney and Walter, 1992) to the
modern “smart” warehouse management systems (WMS). WMS are information technology
systems used to “plan, optimize, and execute operations” (Autry et al., 2005, p. 167), the
definition we will use in this study.
Researchers have studied WMS from a variety of perspectives. The antecedents of WMS
have been examined, revealing that the introduction of information technology in the warehouse
20
was largely driven either by customers or by top management who saw it as a tool to gain a
competitive advantage (e.g., Raney and Walter, 1992; Rogers et al., 1996; Autry et al., 2005).
Best practices were reviewed in detail in case studies (e.g., Min, 2009) and “buy standard” vs.
“get one tailor-made” decisions were analyzed (e.g., Faber et al., 2002). More importantly, most
researchers who studied the link between the degree of WMS implementation (degree of
sophistication, level of investment, dedicated personnel, etc.) and organizational performance
appear to agree that there is a significant positive relationship between the two (e.g., Rogers et
al., 1996; Faber et al., 2002; Autry et al., 2005).
Another important finding is that a functionally inadequate WMS may be a constraint in
warehouse operations by forcing management to compromise, “…between the way a warehouse
wants to work and the way the system allows the warehouse to work” (Faber et al., 2002, p.
381).
Most warehouse design literature is concerned with planning new warehouse facilities.
There is very limited research on optimization of existing operations, and attributes of existing
facilities are usually considered to be static. This literature is largely limited to the relocation of
storage items (SKUs). For example, it may become necessary to relocate SKUs if changes in
demand cause former fast-moving items to become slow-movers, leading to longer picking
times. Two representative papers are briefly described below.
Christofides and Colloff (1973) solved the problem of movement cost minimization for
such transfer under assumptions of moving all items one at a time, using only one vehicle, and
that the time when an item is not located in a proper warehouse location is at its minimum.
Sadiq et al. (1995) studied the problem of periodically reassigning stock items to create a
dynamic stock mix that correlates with dynamically changing demand. They used cluster
21
analysis to develop a heuristic Dynamic Stock Location Assignment Algorithm which appeared
to be superior to the well-known cube-per-order index (Heskett, 1963; Kallina and Lynn, 1976;
Janea and Laihb, 2005) in dynamic environments.
A more radical approach to designing warehouses that are able to accommodate change
was presented by Ackerman (1999). He lists several trends that affect the function and operations
of warehouses: faster cycle times, high inventory turns, growth of cross-docking operations, and
increased use of information technology. These changes will impose new requirements on
warehouse design and operations: more dock doors, different door locations (close to each other
on one side of the building rather than on the opposite sides) and flexible door allocation (no
doors dedicated to a customer or particular operation); brighter lights to accommodate night
shifts; higher quality floors for high velocity operations; more office space and storage
flexibility. Information technology allows to constantly analyze the quickly changing 80/20 rule
of item velocity based slotting. To implement changes flexible storage systems are necessary.
They should replace the efficient but inflexible automated storage systems. Hence, the emphasis
should be on flexibility and not on efficiency or storage capacity.
Ackerman (1999) illustrates the right tradeoff (balance) between efficiency and flexibility
with an example of warehouse dock doors. Since dock doors are expensive, it is common to
design and build a warehouse with a limited number of doors sufficient to cover the present time
operation. However, flexibility dictates a higher number of doors. One practical way to balance
the costs and flexibility is to install just the required number of doors but prepare the foundation
and the walls for future door additions by depressing the building footer. This emphasis on
flexibility over cost minimization and efficiency is a dissonance from the traditional warehouse
operations research literature.
22
In summary, there are several important conclusions from the reviewed body of literature
on warehousing that are relevant for this research:
1. Storage capacity is important. It has been a primary focus of academic research on
warehouse design. Storage capacity is influenced by many factors of warehouse design
(storage area size, layout, storage system, separation into zones, storage policy and
others).
2. Academic literature recognizes a negative effect on performance when there is a shortage
of capacity. The capacity shortage results in a rejection of incoming loads. The sufficient
capacity can be expressed as a service level. Thus, it is expressly recognized that capacity
may be a major constraint in a warehouse.
3. There are trade-offs involved in optimizing storage capacity and minimizing costs
associated with other warehouse resources. Academic literature expressly recognizes that
it is impossible to maximize storage capacity and minimize material handling costs at the
same time. These costs are linearly proportional to the amount (quantity) of resources
used (such as labor hours of warehouse personnel and machine hours of lift trucks; the
needed work hours in turn largely determine the quantity of the required personnel and
machines in the warehouse).
4. The studies aimed at optimization of material handling costs implicitly consider
personnel and lift trucks. Behavioral human characteristics were not taken into account in
warehouse operations research. Supply chain literature raised a few issues relating to
human resources which are relevant to this study. In particular, the literature notes the
high importance of this resource, the need for its effective management, and ways to
increase its capacity. The literature also suggested warehouse size as a potential control
23
variable, since warehouses were found to differ on employee satisfaction and turnover
based on size. Flexibility was identified as a property of this resource with a cost savings
potential.
5. Other components of warehouse layout (doors, shipping and receiving areas) received
very little coverage in the academic literature.
6. Selection of warehousing equipment, specifically, lift trucks, did not receive much
attention from scholars either. However, there is a considerable body of research on
optimization of their use (costs, time, distance) within the framework of existing
operations by manipulating storage policies (which affects storage capacity) or picking
policies holding existing storage policies and picking area layout constant.
7. Information technology plays a prominent role in a modern warehouse in the form of a
WMS. Limited functionality of the WMS may lead to lower warehouse efficiency (act as
a constraint), whereas higher level of WMS implementation is positively associated with
warehouse performance.
8. Academic studies of warehousing design and operations are either concerned with initial
selection of warehouse parameters (such as storage area) or assume that they are already
given. There is little work on adjusting existing operations to accommodate changes in
demand, product types, etc.
9. Flexibility in warehouse design and operations is regarded by some as a contemporary
alternative to a traditional focus on efficiency in the academic operations research
literature.
These conclusions support the need to focus on basic warehouse resources: storage space;
personnel; equipment; doors; dock space; and information systems. They also suggest the need to
24
consider these resources as potential constraints in the flow of inventory through the warehouse,
which can lead to inefficient and ineffective warehouse operations. Finally, they suggest that
managers should understand that there are trade-offs among these resources, and that one
resource can be used to relieve a constraint created by another, effectively increasing the
capacity of the warehouse without adding physical expansion.
However, some gaps in this literature are evident. They refer to both the domain of the
research and the methods used. Supply chain literature addresses warehousing problems at a very
general level. It tends to use a firm as the smallest unit of an analysis and is usually not
concerned with the operations of a warehouse as an organizational unit of a firm. On the other
hand, operations research looks at warehousing problems very narrowly. The complexity
involved in the mathematical modeling and simulation, the traditional tools of operations
research, require imposition of very restrictive assumptions, which severely limits the practical
uses of the research results.
We hope that this study, which takes the tools of supply chain management research and
brings them down from the “30,000 feet level” of the whole organization to the “bird’s eye
view” of operations in a warehouse as one organizational unit of the firm, will pave the path to
eventually closing this literature gap.
Theory of constraints
One management theory that addresses bottlenecks in operations is the Theory of
Constraints (TOC). TOC was proposed by Eliyahu Goldratt in the 1980-s and popularized in a
number of books (Goldratt and Cox, 1986; Goldratt and Fox, 1986; Goldratt, 1994). TOC is
widely accepted in business and is extensively used in academic research.
25
The purpose of TOC is to make a firm more competitive by running its operations in a
more efficient way (Polito et al., 2006). TOC originally appeared as a scheduling algorithm for
manufacturing and was marketed as a software package. However, there was a need to explain to
the users how it works, so the book The Goal (Goldratt and Cox, 1986) was published.
According to it, the firm’s business is viewed as a combination of throughput (rate of
generating money through sales), inventory (everything purchased in order to be sold), and
operational expense (money spent on turning inventory into throughput). The underlying premise
is that the system will have at least one constraint, since infinite throughput is not possible. The
constraint slows down the whole system’s throughput and prevents the firm from achieving
higher financial performance. To rectify the situation it is first necessary to understand what
needs to be changed and the process for the change. Five focusing steps are proposed for the
purpose:
1. identify the constraint;
2. decide how to maximize the throughput through it;
3. subordinate the whole organization and processes to this decision;
4. implement measures that will relax this constraint;
5. repeat from the beginning (Goldratt and Cox, 1986).
The five focusing steps are an alternative method of continuous improvement. It is
different from other methods, such as total quality management in that it focuses on a single or
very limited number of constraints rather than attempting to improve quality everywhere
(Gardiner et al., 1994).
Based on the five focusing steps a specific production scheduling technique called drum-
buffer-rope (DBR) was proposed. The allusion is to a scout troop march illustrative example in
26
The Goal. The drum represents the constraint that sets the rate of output of the whole system. It
is critical to keep this resource operating at maximum capacity. For this reason, there is a buffer
of material for processing in front of the constrained resource and a space buffer for processed
inventory right behind it. This ensures that the constrained resource will keep operating during
temporary disruptions up or down the stream. The rope represents the fixed lead time of
releasing raw materials into the processing chain based on the rate of operation of the
constrained resource. This ensures that the resource is never starved for materials, but also that
no more materials are released than actually needed for the operation of that resource, even if
other resources may temporarily be idle. Under TOC, buffer management is the only production
control technique that is needed (Gardiner et al., 1994).
The specific methods discussed above are said to comprise the logistics paradigm of TOC
(Rahman, 1998). As physical constraints are overcome one by one, eventually the next constraint
will be found outside the production floor. The constraint may be nonphysical and completely
external, e.g., insufficient market demand to support the increased level of production of the
firm, or internal but elsewhere within the organization, e.g., managerial constraints in the form of
restrictive policies (Simatupang et al., 2004). In response, a thinking process (TP) was developed
to address any problems in general. Using a specific set of tools (current reality tree, evaporating
cloud, future reality tree, prerequisite tree and transition tree), managers should be able to find
answers to the three main questions of initiating change:
• what to change;
• what to change to;
• how to cause the change.
27
The problem solving paradigm of TP complements the logistics paradigm and is believed
to be the most lasting contribution of the TOC philosophy because it can be applied in a very
general way (Rahman, 2002).
TOC was compared to and in many cases was found superior to kanban, JIT, MRP, linear
programming and total quality management (Rahman, 1998; Gardiner et al., 1994; Luebbe and
Finch, 1992; Sale and Inman, 2003). In addition to manufacturing, the primary industry for
which it was originally designed, TOC was successfully applied in the airline industry, health
care, banking, military logistics and many others, where companies like Proctor and Gamble,
Ford, GM and others saved millions of dollars by implementing the logistics or problem solving
paradigms of TOC or both (Watson et al., 2007; Polito et al., 2006; Bramorski et al., 1997;
Gardiner et al., 1994; Demmy and Petrini, 1992).
Boyd and Gupta (2004) attempted to integrate TOC, along with JIT, economic order
quantity and a number of other theories, into a more general Constraint Management Theory.
They suggested for future empirical studies (but did not test empirically themselves) several
hypotheses based on TOC as part of Constraint Management Theory, including one whose parts
are in line with our treatment of TOC:
There is a significant positive relationship between the degree of throughput orientation and organizational performance. Process improvements … at a constraint will have significantly greater positive impact on performance than similar improvements at a non-constraint (p. 365). Instead of being currently recognized as consisting of the two main parts (the logistics
and problem solving paradigm), TOC was initially seen as a rather eclectic collection of smaller
components. Spencer (1993, p. 37) listed seven of them: “…the five focusing steps, V-A-T
analysis, effect-cause-effect analysis, drum-buffer-rope scheduling, buffer management, the
28
performance measurement system, and the thought process.” His illustrative paper appears to be
the only attempt to apply a part of TOC to warehousing. His work is based on an argument that a
warehouse is merely a type of a production facility, which allows us to apply automatically the
V-A-T logical structure analysis for manufacturing to warehousing (where the letters V-A-T
refer to three potential shapes of a logical structure of goods flow in a warehouse) (Spencer,
1993). Even though his paper concedes that, “warehouse operations may be less rigidly defined”
than in manufacturing (p. 37), the reader is left with an impression that the rigid production
structure is forced upon warehouse operations, particularly when the case of value-added
assembly activities is chosen as an illustration. The paper provides advice on identifying a
particular operation that constrains the whole output and assumes that creating a buffer of
materials and proper scheduling (i.e., using buffer management and DBR scheduling techniques
of TOC) will solve the problem, but it does not address the problems of severe resource
shortages or resource sharing between independent operations. The author concludes that,
“[d]ifferent warehouses have different processes and require different management” (p. 46). In
contrast, our study examines common approaches under TOC to management of warehouse
resources rather than processes and does not treat warehousing as a variety of manufacturing.
Kim et al. (2008) reports that TOC received much attention in academic literature in the
functional areas of supply chain management and human resources management. However, there
are very few empirical studies of TOC and there is no evidence of research involving the TOC
logistics paradigm in the context of traditional warehousing operations. Major survey-based
empirical work on TOC is absent from operations research (Gupta and Boyd, 2008).
29
CHAPTER III
THEORY DEVELOPMENT
Adapting TOC to the warehousing context
Need for modifications
In this study we seek better understanding of warehouse resources and their management
using the theory of constraints (TOC). TOC was originally suggested for the manufacturing
environment. In The Goal (Goldratt and Cox, 1986), the five-step focusing process was
introduced in a hypothetical but realistic manufacturing setting (Reid, 2007). The product flow
went through a fixed sequence of machines, one of which had a low capacity and constrained the
whole system’s throughput. Solutions offered by TOC were intended to be generalized to many
manufacturing enterprises.
The use of TOC to analyze warehousing resources on an industry-wide basis requires
some modifications to the basic theory. These modifications are necessary for several reasons.
First, warehousing is substantially different from manufacturing in many important respects.
Second, our study covers a period of three years that is not necessarily synchronous with a TOC
cycle at any particular warehouse. Third, the originally developed logistics paradigm of TOC is
not conducive to survey research, yet the survey method is a very important technique for
studying a variety of warehouses in such a diverse industry. In this chapter, we consider these
reasons for TOC modification and explain the ways we do it in detail.
Applicability to warehousing in principle
To decide whether TOC can automatically be extended to warehousing without
adaptation, we need to consider several arguments. On the one hand, in the previous chapter, we
30
have listed examples of other industries (airlines, banking, etc.) where TOC was successfully
applied. We have also reviewed what appears to be the sole academic paper attempting to apply
one TOC element to warehousing. This can be interpreted as an indication that TOC is not
limited to manufacturing and can in fact be used in different contexts, including warehousing.
On the other hand, there are arguments that appear to offer support to the opposing view.
First, the prevailing view is that warehousing is not manufacturing. Sanders and Ritzman (2004)
describe warehouses as, “service organizations whose ‘product’ is not the creation of tangible
goods, but the ability to efficiently mix and move goods at short notice” (p. 251). To determine if
TOC solutions for manufacturing can be automatically extended to warehousing, we need to
consider how similar these industries are for the TOC relevant characteristics. Specifically, we
need to establish if warehousing has the type of manufacturing throughput process described
above: a fixed set of machines and a continuous rigid sequence of inventory flow through the
system.
Warehouses do not have stationary machines like in manufacturing with the exception of
automated storage / automated retrieval systems (AS/AR), machines for value-added processing
(e.g., promotional sets packaging) and some auxiliary machines (e.g., to shrink-wrap a pallet). In
this research, we only consider traditional warehouse operations and disregard the manufacturing
functions of the warehouses. Any auxiliary equipment by definition is outside the primary
warehousing operations we are focusing on. Thus, the traditional warehouse operations are not
built around a set of stationary machines that processes raw materials into inventory of finished
goods and are more flexible.
The seeming similarity of presence of inventory and its flow in a manufacturing plant and
a warehouse is also deceptive. Inventory buffering options (a major part of TOC in
31
manufacturing) such as inventory safety stock for made-to-stock items are not available in
warehousing (Sanders and Ritzman, 2004). Warehouse buffers may be of a different nature (e.g.,
time buffers created by a queue of picking orders to process or trucks to unload) and may be
resource specific.
The product flow is different, too. The primary function of a traditional warehouse is
storage (Gu et al., 2007; Frazell, 2002). In the storage area, the flow of goods is broken. Vogt
and Pienaar (2007) clearly state that, “[t]he storage of the stock in the warehouse completely
segregates the inbound and outbound processes” (p. 87). The inventory placed in storage may
remain there for a long time and even become obsolete (Rouwenhorst et al., 2000). While this
will have a negative impact on the financial performance of a private warehouse, in case of a
public warehouse, the warehousing company will still receive revenue by providing this storage
service to its customers. This is in sharp contrast with manufacturing where an accumulation of
unsold finished inventory is definitely a negative factor (Goldratt and Cox, 1986).
In any case, the interruption of the goods flow in a warehouse makes treating the TOC
goal of increasing throughput in the same manner as for a manufacturing plant impossible: the
throughput of a warehouse is broken into the inflow and outflow, with storage separating the
two. The processes generating the incoming and outgoing flows may compete for the same
warehouse resources. Some literature (e.g., Elton and Roe, 1998; Steyn, 2002) suggests that TOC
may not be fully applicable to concurrent competing projects as they will compete for the same
resources, a situation that seems to fit the disjoint but concurrent warehouse flows.
The arguments above offer grounds to doubt TOC’s automatic applicability to
warehousing without modification. Given the contradictory evidence from literature and logical
analysis, empirical research is definitely warranted. Due to the differences between the two
32
contexts, some special tools need to be found to translate TOC for manufacturing into
warehousing for testing in empirical research. Manufacturing is the original but not the sole TOC
domain. In academic research, TOC has been used outside manufacturing, most often in a
service industry. However, most papers were case studies or general illustrative applications
(e.g., Bramorski et al., 1997; Olson, 1998; Roybal et al., 1999; Zadry and Yosuf, 2006; Polito et
al., 2006, Reid, 2007). Research that produced hypotheses and scales to test TOC empirically
(e.g., Boyd and Gupta, 2004; Moss, 2007; Inman et al., 2009) has not focused on the logistics
paradigm of TOC we are interested in and is still too general to be applied to warehousing as is.
Thus, we are unable to base TOC modification on prior research and must undertake the
complete task of adapting TOC to warehousing. This includes changes to some of its constructs
and relationships among them.
Processes vs. resources
As the initial step of TOC adaptation, we turn to the core of TOC. Reid (2007) suggested
that TOC’s single unique characteristic as a managerial philosophy is an emphasis on
identification of a single or a few factors, such as a resource or process, that actually limit the
performance of the whole system.
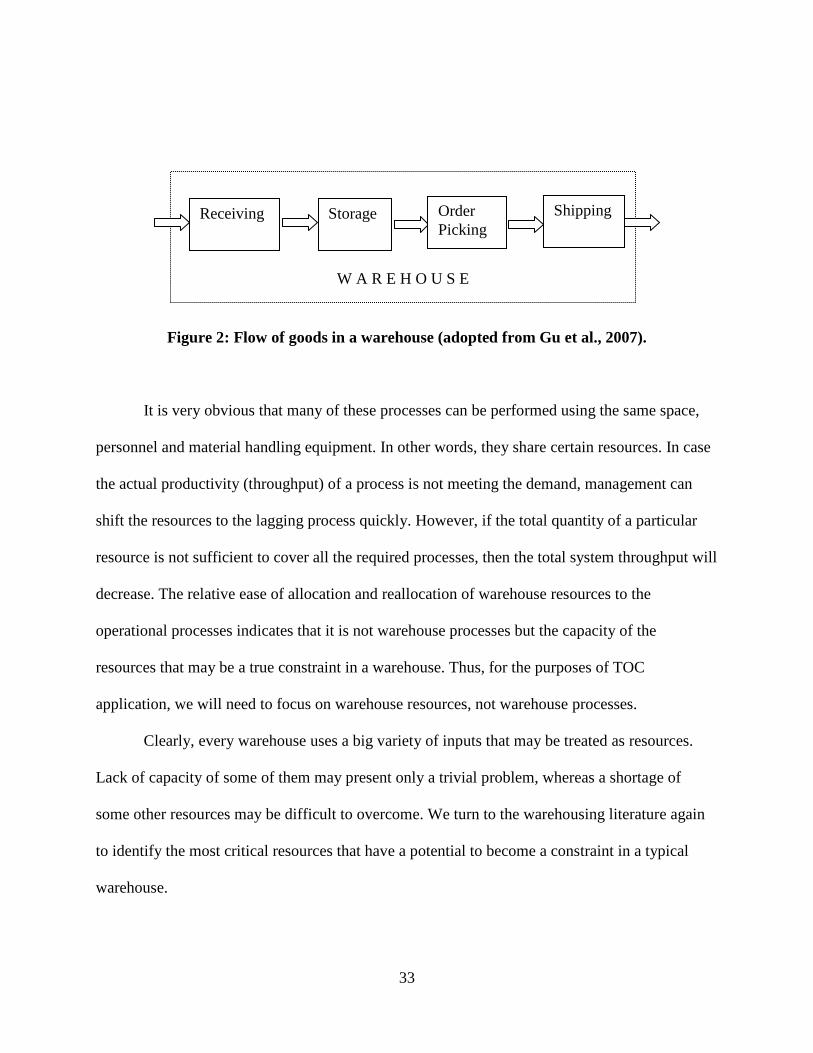
Let us consider the possibility of process constraints in the warehouse first. According to
Gu et al. (2007), a typical warehouse operation can be viewed as a flow of goods first entering
the warehouse then consecutively going through the processes of receiving, storage, order
picking and shipping and then physically leaving the warehouse, as shown in Figure 2.
Additional steps of inspection, sorting, packing and others are possible (Keller and Keller, 2014).
33
Figure 2: Flow of goods in a warehouse (adopted from Gu et al., 2007).
It is very obvious that many of these processes can be performed using the same space,
personnel and material handling equipment. In other words, they share certain resources. In case
the actual productivity (throughput) of a process is not meeting the demand, management can
shift the resources to the lagging process quickly. However, if the total quantity of a particular
resource is not sufficient to cover all the required processes, then the total system throughput will
decrease. The relative ease of allocation and reallocation of warehouse resources to the
operational processes indicates that it is not warehouse processes but the capacity of the
resources that may be a true constraint in a warehouse. Thus, for the purposes of TOC
application, we will need to focus on warehouse resources, not warehouse processes.
Clearly, every warehouse uses a big variety of inputs that may be treated as resources.
Lack of capacity of some of them may present only a trivial problem, whereas a shortage of
some other resources may be difficult to overcome. We turn to the warehousing literature again
to identify the most critical resources that have a potential to become a constraint in a typical
warehouse.
W A R E H O U S E
Order Picking
Storage Receiving Shipping
34
The following sections of this chapter discuss the concept of a key warehouse resource
and name specific attributes of a warehousing operation that qualify as key warehouse resources.
A more detailed model of hypothesized relationship between constructs is offered and
hypotheses are developed.
Key warehouse resources
Definition and tests
An important point of this research is a definition of a critical, or key, warehouse
resource. We offer the following definition: It is a component of a warehouse design or
operation that is critical to the mission of the warehouse, is not easily acquirable or modifiable,
and has a finite or limited capacity at least in the short term.
To clarify specific parts of the definition, the mission of the warehouse is commonly
understood as a combination of storage and throughput of products at a desired level of quality
and minimum resource cost (Gu et al., 2007; Frazell, 2002). It follows then that for a warehouse
resource to have a critical bottleneck potential it must affect the flow of goods or related
information directly and have an impact on quality and cost. We will refer to this statement as
the goods flow impact test.
In the definition of the key warehouse resource, “easily acquirable or modifiable” refers
to the fact that a change in the resource, such as an acquisition of additional quantity of this
resource or a modification of its characteristics, is not possible to accomplish within the routine
processes of the day-to-day operations. It requires substantial waiting time, or will incur a
substantial cost, or is subject to a hierarchical management review process, or is simply not
available (or no longer available) or any combination of the above. It is also not easily
35
substitutable within the routine processes of the day-to-day operations. For short, we will call
this the time-effort-cost test.
Finite capacity refers to the attribute of the key warehouse resource that cannot be
increased infinitely within the existing warehouse organization and process design. In other
words, a key warehouse resource has the potential to become a long-term bottleneck in the
warehouse operations if the demand for it has outgrown its capacity and management has not
been proactive to implement a plan to alleviate the problem, such as increasing the capacity of
the resource. A key warehouse resource may reach its maximum capacity, and then it will
become a permanent constraint until the existing warehouse design or process is changed.
It should be noted that this research concerns an increase of demand for the resource
capacity due to growth of the regular operations, not a one-time peak in demand and not a
situation when a resource is out of order or broken and just needs to be restored to its normal
capacity to stop being a bottleneck in the warehouse operations.
Relation to RBV and RMT
The Resource Based View (RBV), a popular management theory proposed by Barney
(1991), also deals with firm’s resources, so it is important to compare our treatment of the
concept of key warehouse resources to that of RBV.
RBV’s main original tenet is that a firm can gain a sustained competitive advantage over
other firms if it possesses resources that are valuable, rare, imperfectly imitable and
nonsubstitutable. On the surface, these resource attributes may seem close to the definition of the
key warehouse resources. However, there are substantial differences.
36
RBV considers resources of one firm as they relate to competitors, whereas this research
focuses on one firm and its internal warehouse operation. This makes inimitability, one of the
four resource attributes of RBV, not applicable since it implies taking into account other firms.
The other attributes do not apply either. This research looks at resources that are typically used in
non-automated warehouses, so they cannot be rare. We will specifically show that trade-offs are
possible to partially substitute for a shortage of a key warehouse resource, so the non-
substitutability cannot be an attribute of a key warehouse resource.
Finally, under RBV, a resource is valuable only if it underlies a firm’s strategy to
improve its efficiency and effectiveness. While key warehouse resources, or their specific
attributes, may become part of a particular strategy and thus generate extra value for competitive
positioning of the firm, Barney et al. (2001) stresses that the value of a resource is determined by
a specific market context. In other words, a valuable resource may stop being valuable if the
market conditions change. This is where the difference lies. Key warehouse resources, regardless
of the market context of the whole firm, are a critical necessity of a regular daily operation of the
warehouse as its organizational unit. Thus, the four resource attributes of the original RBV are
not generally applicable to the concept of key warehouse resources used in this research.
Over the years, several extensions of RBV have emerged. It has transitioned from
identifying resources of the firm to focusing on their use (Fawcett and Waller, 2011). In this
vein, one recent approach to resources that is on par with contemporary theoretical extensions of
RBV is resource management theory (RMT) (Esper and Crook, 2014). RMT contends that
possession of valuable, rare, inimitable and non-substitutable resources is important but not
sufficient for obtaining a competitive advantage over other firms (Sirmon et al., 2007). It is
critically important how resources are created, deployed, combined, managed and exchanged by
37
the management of the firm (Lippman and Rumelt, 2003). TOC, on which we base this study,
can be viewed under the general umbrella of RMT as a specific strategy of value creation from
resource manipulation.
Typology
Before we can discuss resource manipulation in a warehouse, it is necessary to clearly identify
which key resources are normally found in a warehouse. The academic literature on warehousing
provides several lists of various warehouse resources. The most succinct list is comprised of four
resources: labor, space, equipment, and warehouse management system (Hackman et al., 2001).
The most comprehensive list is found in Rouwenhorst et al. (2000):
1. Storage unit, e.g., pallets, carton boxes and plastic boxes;
2. Storage system, e.g., shelves;
3. Pick equipment, e.g., a reach truck;
4. Orderpick auxiliaries, e.g., bar code scanners;
5. Computer system, e.g., warehouse management system;
6. Material handling equipment for sorting, packing and loading into transportation
vehicles, e.g., sorter systems, palletizers and truck loaders;
7. Personnel.
Applying the time-effort-cost test of a key warehouse resource to the latter typology, we
can eliminate items 1 and 4 since their representative examples (pallets, boxes and bar code
scanners) can be acquired relatively easily and inexpensively. Items 3 and 6 represent material
handling equipment used for the picking operation and the steps following it. Separating it into
two different categories seems illogical for two reasons: (1) the same piece of equipment, such as
38
a counterbalance forklift can be used for both picking a pallet and loading it into a truck, even on
the same move; and (2) this division ignores operations preceding picking, such as goods
unloading and putaway, which, coincidentally, can also be performed by that same forklift. So it
makes sense to aggregate material handling equipment into one category. Finally, this research
emphasizes traditional warehousing operations that are less likely to use sorter systems and
palletizing machines found in high-velocity warehouses that rely on substantial automation.
Thus, we can replace the broader term of material handling equipment simply with lift trucks, a
general term for warehouse machines such as forklifts, reach trucks, order pickers, etc.
The arguments above reduce the list of warehouse resources to just four items: storage
system, lift trucks, personnel and warehouse management system. Each of them meets the goods
flow impact test in that the capacity of the resource directly affects the capacity and throughput
of the warehouse. In case of the warehouse management system, it is the information flow.
However, the flow of goods and information is synchronized at least periodically and a
warehouse management system lagging in speed or deficient in functionality negatively impacts
the flow of goods in the end.
The four identified resources also meet the time-effort-cost test. Adding more storage
racks, buying more lift trucks, hiring and training more warehouse workers or upgrading the
existing warehouse management system are projects that take months and substantial investment
or spending and are likely to be presented by warehouse managers to their superiors for approval
before any implementation is initiated. Moreover, all the four resources can be viewed as
potentially finite, the first three due to spatial limits (as well as possible others), and the
warehouse management system may not be modified to include new functionalities or increase
processing speed due to the internal limitations of the software.
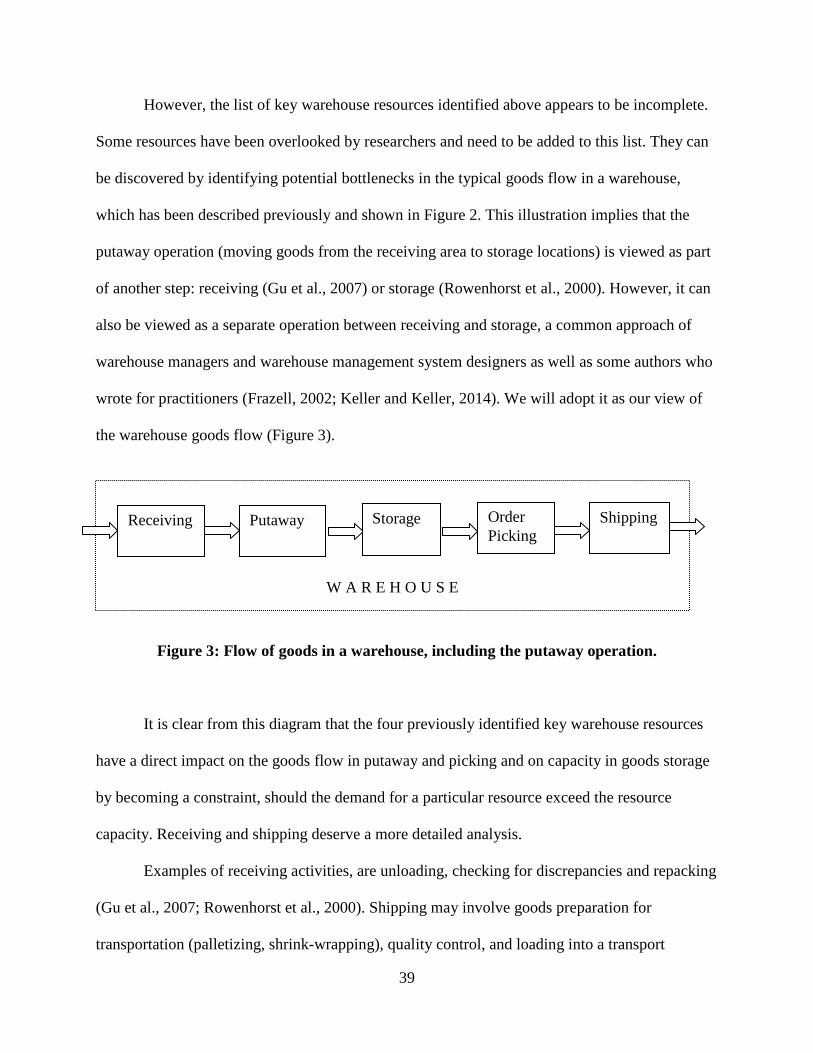
39
However, the list of key warehouse resources identified above appears to be incomplete.
Some resources have been overlooked by researchers and need to be added to this list. They can
be discovered by identifying potential bottlenecks in the typical goods flow in a warehouse,
which has been described previously and shown in Figure 2. This illustration implies that the
putaway operation (moving goods from the receiving area to storage locations) is viewed as part
of another step: receiving (Gu et al., 2007) or storage (Rowenhorst et al., 2000). However, it can
also be viewed as a separate operation between receiving and storage, a common approach of
warehouse managers and warehouse management system designers as well as some authors who
wrote for practitioners (Frazell, 2002; Keller and Keller, 2014). We will adopt it as our view of
the warehouse goods flow (Figure 3).
Figure 3: Flow of goods in a warehouse, including the putaway operation.
It is clear from this diagram that the four previously identified key warehouse resources
have a direct impact on the goods flow in putaway and picking and on capacity in goods storage
by becoming a constraint, should the demand for a particular resource exceed the resource
capacity. Receiving and shipping deserve a more detailed analysis.
Examples of receiving activities, are unloading, checking for discrepancies and repacking
(Gu et al., 2007; Rowenhorst et al., 2000). Shipping may involve goods preparation for
transportation (palletizing, shrink-wrapping), quality control, and loading into a transport
W A R E H O U S E
Storage Putaway Receiving Order
Picking Shipping
40
conveyance such as a truck or a railcar (Rowenhorst et al., 2007). Trucks carried 68.4% of
tonnage nationwide in 2012, five times more than rail (13.5%) (S&P Capital IQ, 2013) and are a
much more common mode of transportation serving warehouses. Ramps to unload railcars at
warehouses are designed differently from truck docks. For these two reasons, warehouse
shipping and receiving operations directly to or from railcars are not considered by this research.
In their comprehensive review of research on warehouse operations, Gu et al. (2007)
classify assigning trucks to docks (doors) and scheduling of loading and unloading trucks as part
of the receiving and shipping operation. They also note that research on receiving and shipping is
scarce (4 papers out of 124 they reviewed). Most work that deals with receiving and shipping
concerns cross-docking operations, particularly the truck-to-dock assignment problem, e.g., Tsui
and Chang (1990, 1992). Cross-docking is not a traditional warehouse operation. Cross-docking
is viewed as a strategy to reduce the time inventory spends in the supply chain (Galbreth et al.,
2008). In cross-docking, the function of the warehouse changes from inventory storage point to
inventory coordination point (Simchi-Levi et al., 2003). Consequently, some supply chain and
inventory management analysis research uses cross-docking setting as a direct alternative to the
traditional warehouse operation (Waller et al, 2006; Vogt, 2010). We control for the share of
cross-docking in operations by using a control variable.
Now that we have defined receiving and shipping for the purposes of this research, we
can consider the role of the four key warehouse resources. Labor, lift trucks and warehouse
management system are essential for receiving and shipping. However, storage system does not
apply: receiving and shipping occurs outside it. This means that we are missing an important
spatial component. It is clear that warehouse space is needed for receiving and shipping, given
the breakdown into specific operations described above, and the shortage of that space may
41
severely constrain the goods flow. This space is finite and cannot be easily added to within the
context of routine operations, i.e., keeping the existing warehouse organization and process
design fixed. We will use the term dock space to designate this key warehouse resource.
According to Gu et al. (2007), receiving and shipping are the two warehouse interfaces
for incoming and outgoing material flow. However, a careful look at Figure 1 will reveal that the
goods have to pass through the warehouse wall twice: first, to get into the receiving area and
second, when leaving warehouse from the shipping area. They go through a warehouse door. The
number of doors and sometimes their specific characteristics (size, availability and length of
dock-leveler, etc.) can put a physical constraint on the goods flow in and out of the warehouse if
the demand for the doors or specific type of doors is higher than their availability.
There is practically no academic literature on warehouse doors that considers the supply
and demand relationship within the traditional warehouse operations. The scarce cross-docking
literature considers the optimum door layout for truck assignments (Gue, 1999) or travel and
waiting time minimization due to congestion (Bartholdi and Gue, 2000). These works are not
applicable to the insufficient door capacity problem in an existing traditional warehouse
operation. However, there is plenty of evidence from industry that companies prefer more doors
than fewer doors in warehouse layouts, ration and monitor door use when doors become a
constraint, and even break walls to make more doors in the existing warehouse.
Warehouse dock doors meet all the tests of the key warehouse resource. Even with wall
breaking, the number of doors is finite; adding this resource is very difficult and costly, and it
definitely has the potential to become a constraint and slow down the goods flow.
In a way, doors as a resource are similar to labor or lift trucks: they have capacity
measured in numbers (number of people in the shift, number of working (available, not broken)
42
lift trucks and number of working doors) and productivity (units of output per unit of time per
person or per lift truck and number of trucks served per unit of time per door). Just like
warehouse workers’ skills and lift trucks, doors may be more specialized or more universal. This
provides insight into the similarity of constraints that doors can impose on warehouse operations.
What about lighting, temperature control or fire safety systems (such as sprinklers)? Do
they fall under our definition of key warehouse resources? No, they do not. They are a
precondition to a normal warehouse operation. They can become a constraint if there is a change
in the content of the operation, but not the volume. For example, switching to storing and
handling a different product in the warehouse may require a change in lighting, ventilation, fire
safety systems, etc. However, as part of the normal operation, these systems do not affect the
goods flow and are not considered key warehouse resources for the purposes of this research. To
emphasize, this research does not consider situations when something is broken and simply
needs fixing.
Thus, analyzing previous research and the flow of goods through the warehouse we have
identified a total of six key warehouse resources. They are:
1. dock doors;
2. dock space (area);
3. storage system;
4. labor;
5. lift trucks;
6. warehouse management system.
Any one of them can become a serious bottleneck, or constraint, in warehouse operations.
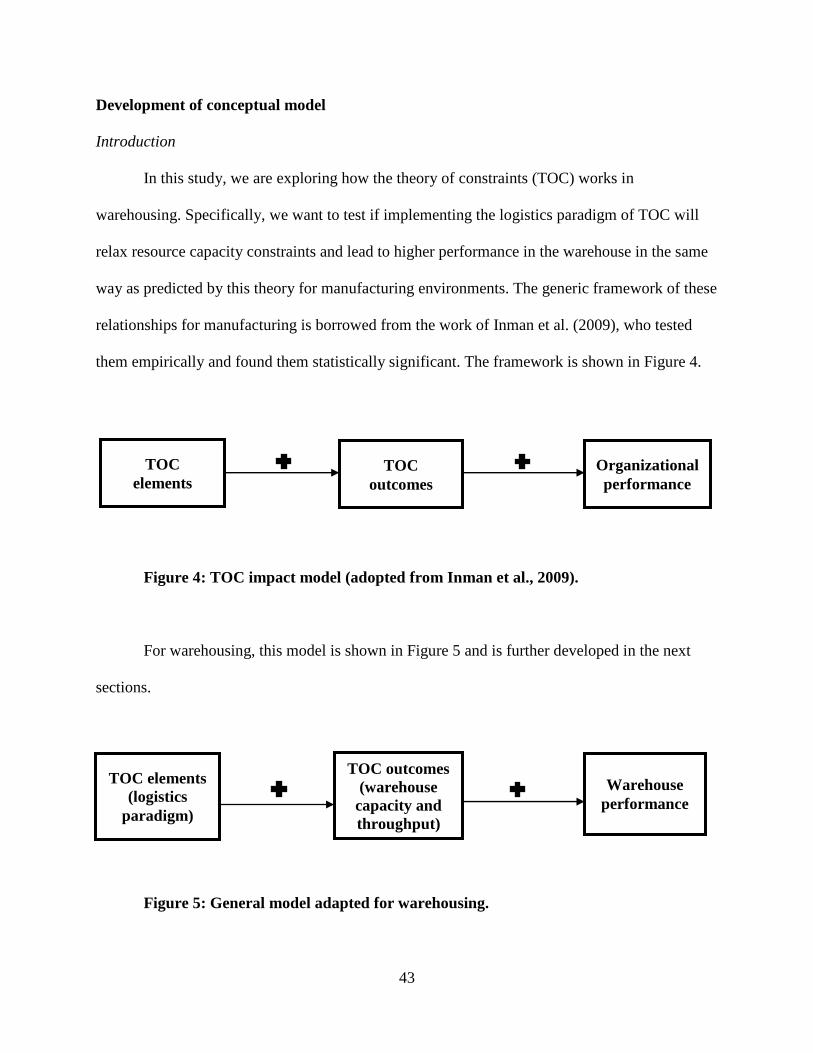
43
Development of conceptual model Introduction
In this study, we are exploring how the theory of constraints (TOC) works in
warehousing. Specifically, we want to test if implementing the logistics paradigm of TOC will
relax resource capacity constraints and lead to higher performance in the warehouse in the same
way as predicted by this theory for manufacturing environments. The generic framework of these
relationships for manufacturing is borrowed from the work of Inman et al. (2009), who tested
them empirically and found them statistically significant. The framework is shown in Figure 4.
Figure 4: TOC impact model (adopted from Inman et al., 2009).
For warehousing, this model is shown in Figure 5 and is further developed in the next
sections.
Figure 5: General model adapted for warehousing.
TOC outcomes
Organizational performance
TOC elements (logistics
paradigm)
TOC elements
TOC outcomes (warehouse capacity and throughput)
Warehouse performance
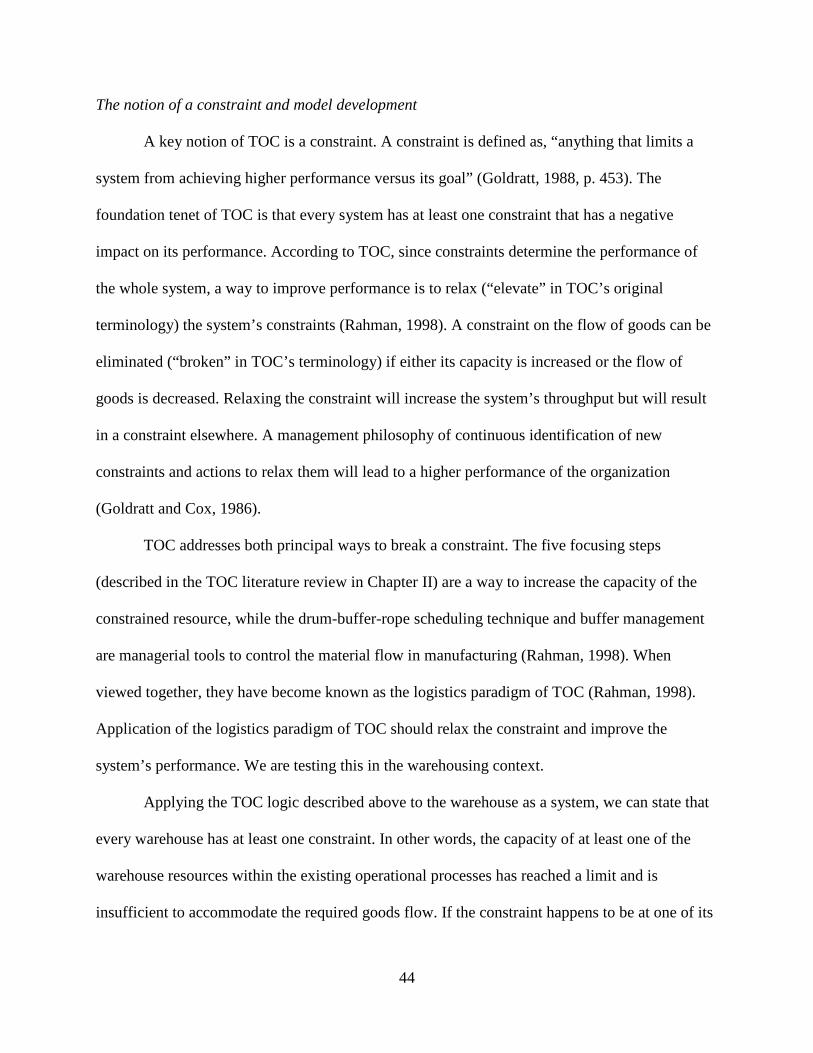
44
The notion of a constraint and model development
A key notion of TOC is a constraint. A constraint is defined as, “anything that limits a
system from achieving higher performance versus its goal” (Goldratt, 1988, p. 453). The
foundation tenet of TOC is that every system has at least one constraint that has a negative
impact on its performance. According to TOC, since constraints determine the performance of
the whole system, a way to improve performance is to relax (“elevate” in TOC’s original
terminology) the system’s constraints (Rahman, 1998). A constraint on the flow of goods can be
eliminated (“broken” in TOC’s terminology) if either its capacity is increased or the flow of
goods is decreased. Relaxing the constraint will increase the system’s throughput but will result
in a constraint elsewhere. A management philosophy of continuous identification of new
constraints and actions to relax them will lead to a higher performance of the organization
(Goldratt and Cox, 1986).
TOC addresses both principal ways to break a constraint. The five focusing steps
(described in the TOC literature review in Chapter II) are a way to increase the capacity of the
constrained resource, while the drum-buffer-rope scheduling technique and buffer management
are managerial tools to control the material flow in manufacturing (Rahman, 1998). When
viewed together, they have become known as the logistics paradigm of TOC (Rahman, 1998).
Application of the logistics paradigm of TOC should relax the constraint and improve the
system’s performance. We are testing this in the warehousing context.
Applying the TOC logic described above to the warehouse as a system, we can state that
every warehouse has at least one constraint. In other words, the capacity of at least one of the
warehouse resources within the existing operational processes has reached a limit and is
insufficient to accommodate the required goods flow. If the constraint happens to be at one of its
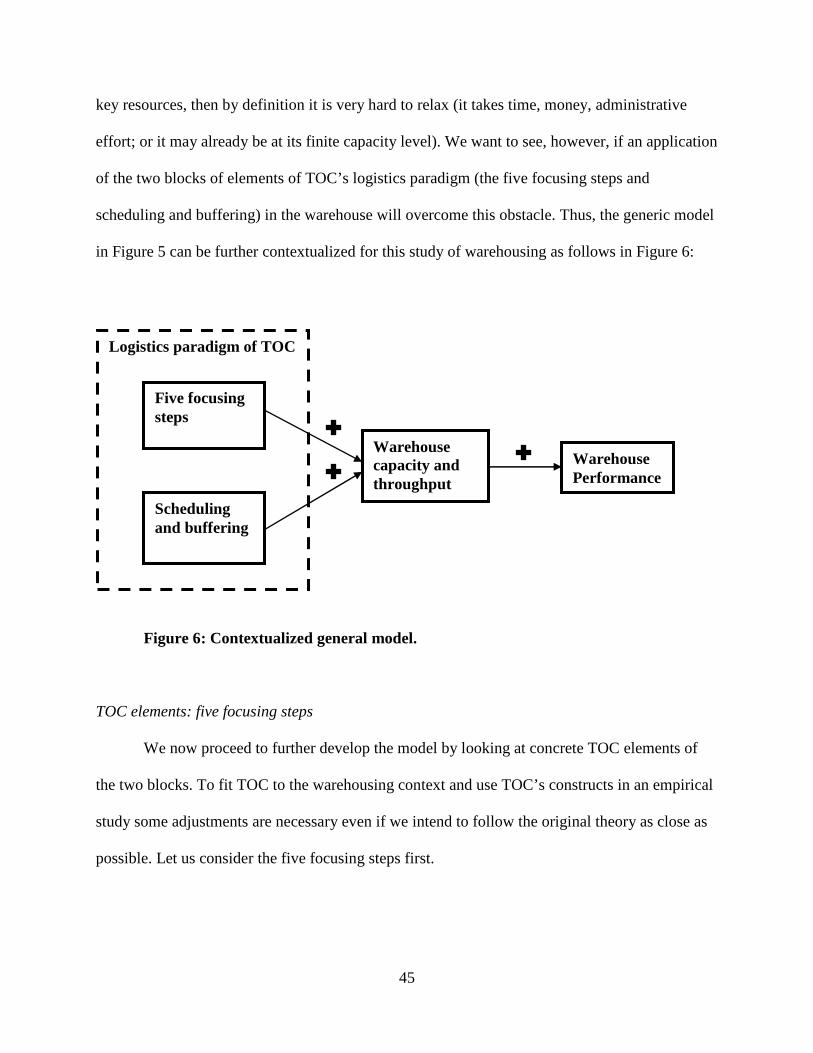
45
key resources, then by definition it is very hard to relax (it takes time, money, administrative
effort; or it may already be at its finite capacity level). We want to see, however, if an application
of the two blocks of elements of TOC’s logistics paradigm (the five focusing steps and
scheduling and buffering) in the warehouse will overcome this obstacle. Thus, the generic model
in Figure 5 can be further contextualized for this study of warehousing as follows in Figure 6:
Figure 6: Contextualized general model.
TOC elements: five focusing steps
We now proceed to further develop the model by looking at concrete TOC elements of
the two blocks. To fit TOC to the warehousing context and use TOC’s constructs in an empirical
study some adjustments are necessary even if we intend to follow the original theory as close as
possible. Let us consider the five focusing steps first.
Logistics paradigm of TOC
Five focusing steps
Scheduling and buffering
Warehouse capacity and throughput
Warehouse Performance
46
We propose no changes to step 1 (“Identify the constraint”). To apply in the warehousing
context, for clarity, three other focusing steps (2, 3 and 5) are renamed with little or no change in
meaning as explained below.
Step 2 (“Exploit the constraint”) implies maximization of the constrained resource
capacity in its existing system configuration (Reid, 2008). To avoid ambiguity, the construct
corresponding to this step is renamed Better utilization of existing resource capacity.
Step 3 (“Subordinate all resources to the global decision”), in addition to using other non-
constrained resources to increase the capacity of the constrained resource, included an additional
meaning of not putting forth any effort to increase throughput of non-constrained resources
because it is pointless:
“The level of utilization of a non-bottleneck is not determined by its own potential but by some other constraint in the system… An hour saved at a non-bottleneck is just a mirage” (Goldratt and Fox, 1986, p. 179). In this study, step 3 is used in a more specific meaning of exchanging the capacity of
non-constrained resources for an increase of the constrained resource (trade-offs). The original
TOC implies that there is no extra cost in implementing the first 3 focusing steps (Roybal et al.,
1999). This narrow understanding of step 3 contradicts the findings in the warehousing design
and operations literature reviewed in Chapter II. It has been shown that it is not possible to
optimize more than one resource in a warehouse at the same time (e.g., Berry, 1968). Optimizing
one resource is always a trade-off with the others which creates an opportunity cost at the design
stage and extra expenses in operating the warehouse. Thus, in this study, we extend the meaning
of trade-offs to include extra inefficiencies and costs in other resources in order to remove the
bottleneck due to the constrained resource and change the name of the construct for step 3 from
“Subordinate all resources to global decision” to Trade-offs with other resources.
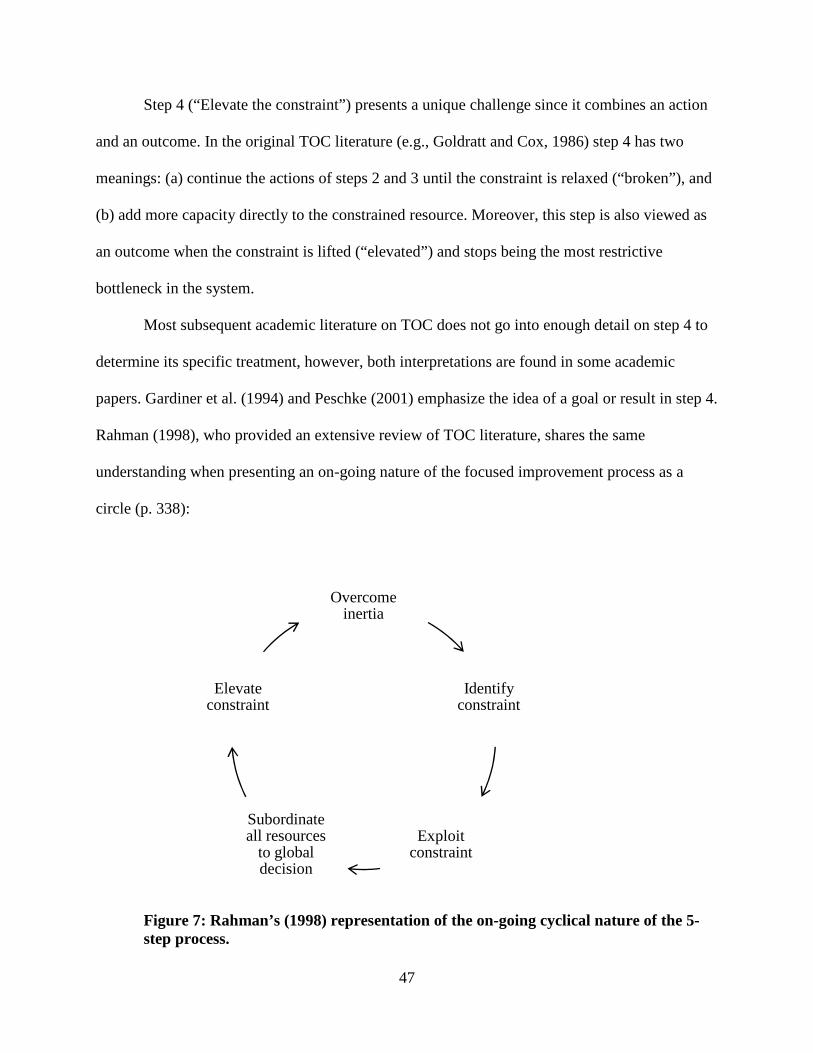
47
Step 4 (“Elevate the constraint”) presents a unique challenge since it combines an action
and an outcome. In the original TOC literature (e.g., Goldratt and Cox, 1986) step 4 has two
meanings: (a) continue the actions of steps 2 and 3 until the constraint is relaxed (“broken”), and
(b) add more capacity directly to the constrained resource. Moreover, this step is also viewed as
an outcome when the constraint is lifted (“elevated”) and stops being the most restrictive
bottleneck in the system.
Most subsequent academic literature on TOC does not go into enough detail on step 4 to
determine its specific treatment, however, both interpretations are found in some academic
papers. Gardiner et al. (1994) and Peschke (2001) emphasize the idea of a goal or result in step 4.
Rahman (1998), who provided an extensive review of TOC literature, shares the same
understanding when presenting an on-going nature of the focused improvement process as a
circle (p. 338):
Figure 7: Rahman’s (1998) representation of the on-going cyclical nature of the 5-step process.
Overcome inertia
Identify constraint
Exploit constraint
Subordinate all resources
to global decision
Elevate constraint
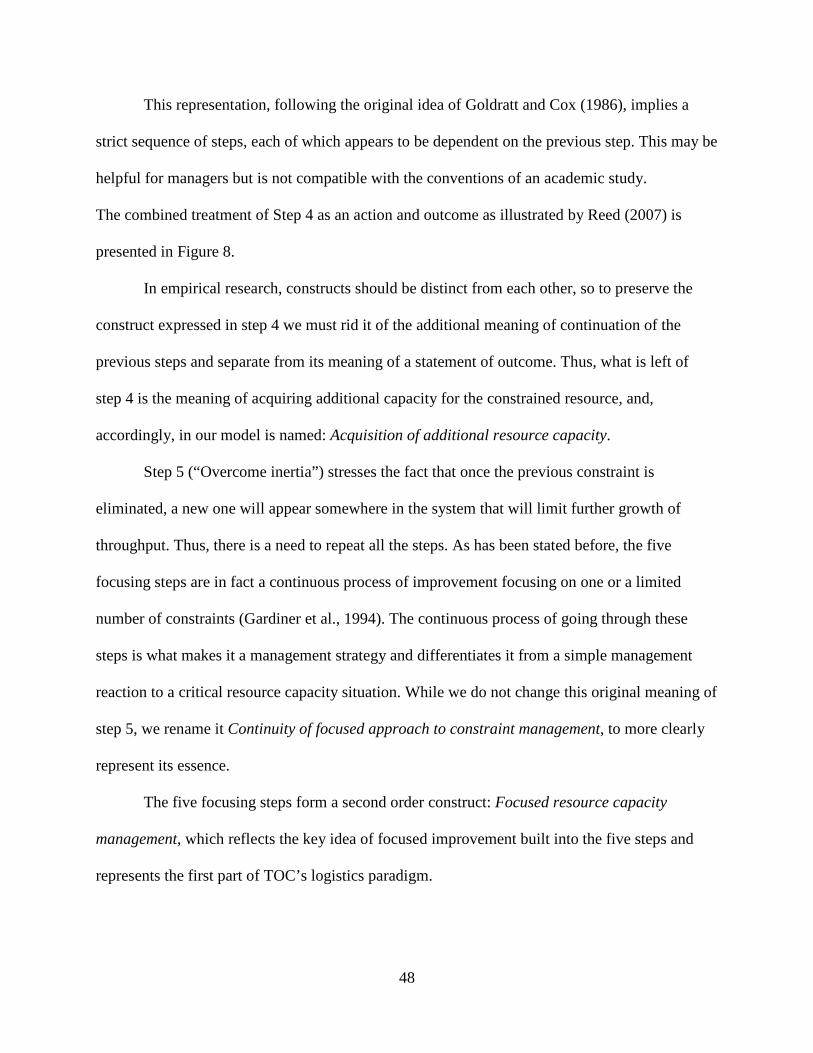
48
This representation, following the original idea of Goldratt and Cox (1986), implies a
strict sequence of steps, each of which appears to be dependent on the previous step. This may be
helpful for managers but is not compatible with the conventions of an academic study.
The combined treatment of Step 4 as an action and outcome as illustrated by Reed (2007) is
presented in Figure 8.
In empirical research, constructs should be distinct from each other, so to preserve the
construct expressed in step 4 we must rid it of the additional meaning of continuation of the
previous steps and separate from its meaning of a statement of outcome. Thus, what is left of
step 4 is the meaning of acquiring additional capacity for the constrained resource, and,
accordingly, in our model is named: Acquisition of additional resource capacity.
Step 5 (“Overcome inertia”) stresses the fact that once the previous constraint is
eliminated, a new one will appear somewhere in the system that will limit further growth of
throughput. Thus, there is a need to repeat all the steps. As has been stated before, the five
focusing steps are in fact a continuous process of improvement focusing on one or a limited
number of constraints (Gardiner et al., 1994). The continuous process of going through these
steps is what makes it a management strategy and differentiates it from a simple management
reaction to a critical resource capacity situation. While we do not change this original meaning of
step 5, we rename it Continuity of focused approach to constraint management, to more clearly
represent its essence.
The five focusing steps form a second order construct: Focused resource capacity
management, which reflects the key idea of focused improvement built into the five steps and
represents the first part of TOC’s logistics paradigm.
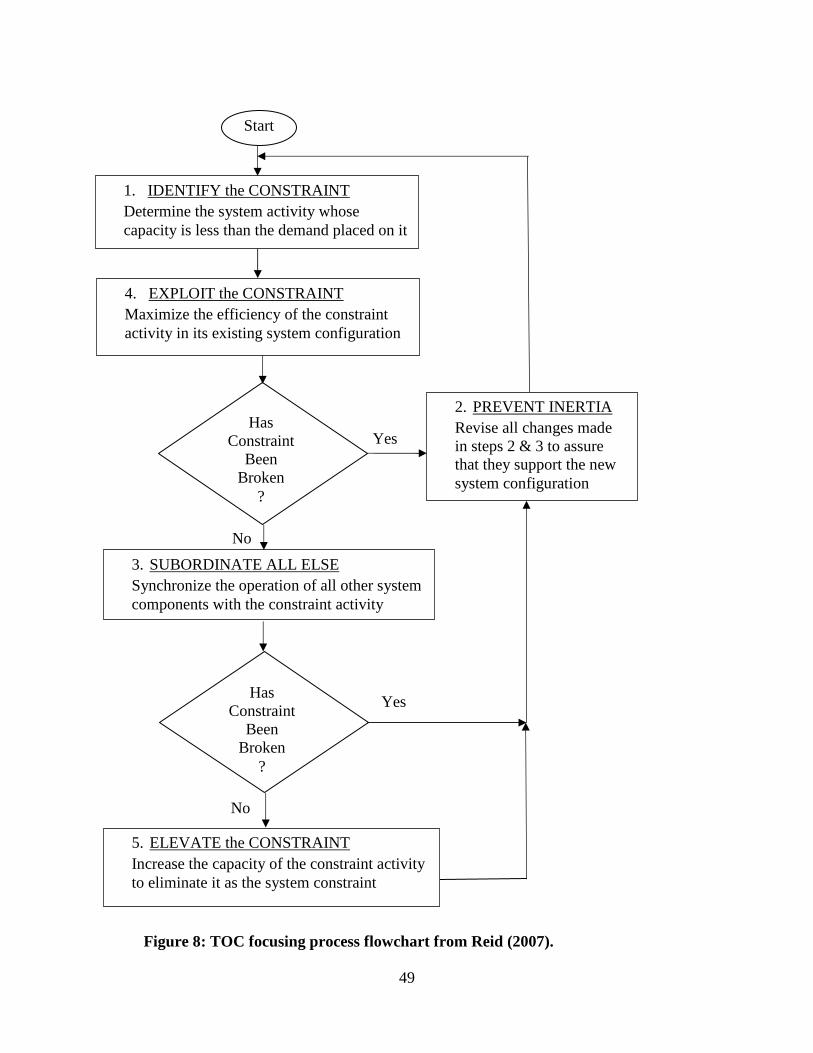
49
Figure 8: TOC focusing process flowchart from Reid (2007).
1. IDENTIFY the CONSTRAINT Determine the system activity whose capacity is less than the demand placed on it
Start
4. EXPLOIT the CONSTRAINT Maximize the efficiency of the constraint activity in its existing system configuration
3. SUBORDINATE ALL ELSE Synchronize the operation of all other system components with the constraint activity
5. ELEVATE the CONSTRAINT Increase the capacity of the constraint activity to eliminate it as the system constraint
Yes
No
Has Constraint
Been Broken
?
Has Constraint
Been Broken
?
No
Yes
2. PREVENT INERTIA Revise all changes made in steps 2 & 3 to assure that they support the new system configuration
50
TOC elements: buffering and scheduling
The second component of the logistics paradigm, the drum-buffer-rope scheduling
technique and buffer management, is best applied to the warehousing context when it is
understood to be somewhat broader, including workflow management in addition to inventory
management. In this case we consider not only buffer manipulations with inventory to ensure
that the constrained resource is never idle, but also include a potential opportunity to decrease
peaks in the flow of goods through a constrained resource by actively engaging with suppliers
and customers in efforts to smooth fluctuations in incoming and outgoing shipments. This view
of buffer management is fully in line with TOC; it simply extends goods flow scheduling and
buffer management to supply chain partners immediately adjacent to the warehouse upstream
and downstream. This is consistent with the goods flow through the warehouse shown earlier in
Figure 3 and in the supply chain literature on warehousing. McGinnis and Kohn (1988)
identified the external warehouse logistics interfaces as carriers, suppliers, buyers, and third
party providers. They note, “warehousing may coordinate its activities with carriers (for inbound
and outbound shipments), suppliers (for inbound shipments), buyers (for outbound shipments),
and third-party providers (for inbound and outbound shipments)” (McGinnis and Kohn 1988, p.
35). Since a particular warehouse may or may not deal with third party-providers, we collapse
this detailed classification into three broader categories: upstream supply chain partners,
downstream supply chain partners, and carriers.
The drum-buffer-rope buffer management and scheduling technique, generally
considered to be one component of the logistics paradigm, is separated into two distinct
constructs and renamed internal scheduling and buffering and external scheduling coordination.
Internal refers to the fact that the buffering of workflow occurs completely within the
51
warehouse, whereas external means that workflow schedules are coordinated with adjacent
partners up or down the supply chain, as has been explained above. The need for splitting the
original construct into two new distinct construct follows TOC’s logic of treating separately
constructs requiring different levels of effort. It is obvious that it is a lot easier to schedule
operations internally than to coordinate inbound and outbound flow of goods with other firms
even if they speak the same language and are in the same time zone (and that may not even be
the case). To clarify, this construct covers the degree of shipment schedule coordination between
supply chain partners, not the variability of transit time. The latter should be managed internally
using buffers, for example.
TOC outcomes
The generic construct of TOC outcomes that appears in the Inman et al. (2009) model
shown in Figure 4 should also be specified more precisely for the warehousing context. Since we
exclude TOC’s Thinking Processes designed to deal with constraints outside the system and only
use TOC’s logistics paradigm as TOC elements that focus on the internal parameters of the
system, the construct of TOC outcomes for warehousing simply means storage capacity and
warehouse throughput, which are the two primary dimensions of warehouses as discussed in the
previous chapters. Thus, instead of the generic label, TOC outcomes, Warehouse capacity and
throughput will be used. As has already been explained, according to TOC, the capacity of the
most constrained resource(s) will determine the overall throughput of the system, thus the
positive direct effect of TOC elements on warehouse capacity and throughput is expected and is
reflected in the model.
52
Warehouse performance
It has been noted that measuring performance may take several approaches and it is
frequently a challenge (Fawcett et al., 1996; Rogers et al., 1996; Min and Mentzer, 2004), so it is
discussed in more detail.
The final construct (Organizational performance) in this study is named Warehouse
performance. The Warehouse performance construct used in this study is somewhat different
from TOC’s Organizational performance. The latter uses specific global financial and
operational performance metrics for the whole organization (Rahman, 1998). However, one
warehouse included in the sample may have little impact on the whole organization that may
include dozens of warehouses that were not surveyed. Additionally, some warehouses may be
cost centers while others are profit centers. This issue was recognized in an empirical study of
warehouse measurement systems by Kiefer and Novack (1998).
Inman et al. (2009), whose approach to research design we are largely following,
encountered the same problem of paucity of constructs associated with performance within TOC
framework. Inman et al. (2009) accepted the suggestion made by Mabin and Balderstone (2003)
to combine the three TOC operational measurement items (throughput, inventory and operational
expense – all three in TOC understanding of the terms) and the three global financial
performance measurement items (profit, return on investment and cash flow) with other usual
operational and financial reporting measures as applicable.
We followed the same approach and decided to use metrics that reflect more closely the
performance of a particular warehouse rather than the whole firm based on available literature.
Swamidass and Newell (1987) noted that organizational performance is best evaluated through
industry and context specific measures. Krauth et al. (2005) reviewed the literature and published
53
a list of more than 130 performance indicators potentially applicable to warehouse operations.
Upon reviewing the list and the summaries of available scales in logistics research literature
compiled by Keller et al. (2002) and Keller et al. (2013), the scale developed by Stank et al.
(1999) was chosen as the basis. Following this approach, traditional performance metrics for
logistics and warehousing were reviewed using two industry publications (CSCMP, 2010;
WERC, 2014) and additional applicable items were added to the questionnaire forming the
potential scale for logistics performance.
The financial performance metrics presented an additional difficulty. As we noted above,
only 3PL warehouses may qualify as profit centers; most warehouses are cost centers. This
dramatically reduces the number of applicable measures for financial performance and raises a
question of whether a good quality financial performance measure of a warehouse can be
developed at all. We left this question to be answered during the pretest phase.
As we built the framework and model based exclusively on TOC manufacturing literature
but found no prior TOC literature on warehousing, we felt that we needed some additional input
from industry experts to validate the model or make some changes in it as the case may be. The
insights we received from interviews with warehouse professionals – and the implications for the
model - are discussed in the next section. Now that we have defined and briefly discussed all
relevant constructs, the conceptual model initially presented in Figure 4 is expanded into the full
model in Figure 9 below.
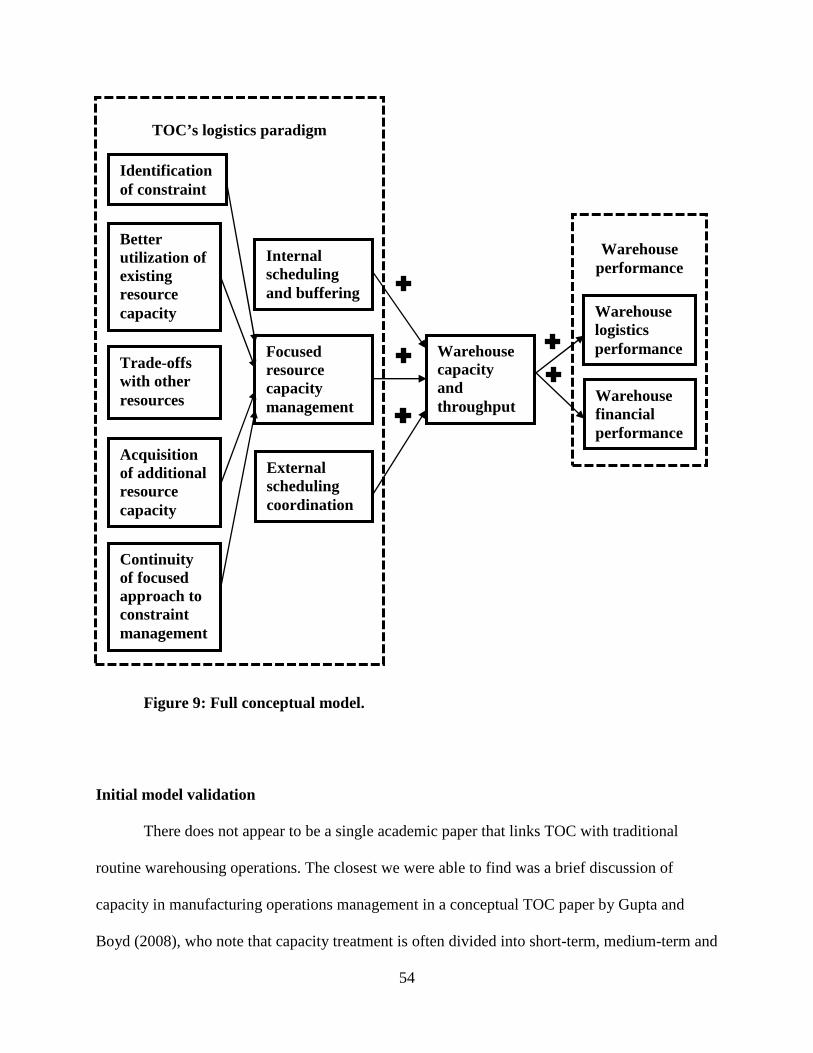
54
Figure 9: Full conceptual model.
Initial model validation
There does not appear to be a single academic paper that links TOC with traditional
routine warehousing operations. The closest we were able to find was a brief discussion of
capacity in manufacturing operations management in a conceptual TOC paper by Gupta and
Boyd (2008), who note that capacity treatment is often divided into short-term, medium-term and
Warehouse
performance
Warehouse financial performance
Warehouse logistics performance Warehouse
capacity and throughput
TOC’s logistics paradigm
Internal scheduling and buffering
Focused resource capacity management
Identification of constraint
Better utilization of existing resource capacity
Trade-offs with other resources
Acquisition of additional resource capacity
Continuity of focused approach to constraint management
External scheduling coordination
55
long-term issues. TOC’s five-step process implies that short-term capacity issues are addressed
before long-term ones (Gupta and Boyd, 2008). But does it really happen like that in the
warehouse?
To clarify this issue and get additional insights, the author met in person and conducted
telephone interviews with warehouse managers and logistics directors of companies operating
warehouses in a variety of industries (e.g., consumer electronics, food, automotive, industrial
chemical products, books, beverages, furniture, etc.) and a variety of settings (traditional private
warehousing, 3PLs, mixed (private and third party), consolidated church non-profit distribution,
etc.).
During the discussions, several important findings emerged. First, the six key warehouse
resources derived from the literature were recognized by the participating managers as the
principal resources they manage in their warehouses. It is extremely rare that one of these
resources should completely be absent in a warehouse. Second, it became apparent that while
many managers were handling warehouse resource constraints in a manner consistent with TOC,
they were not aware of TOC and did not realize that they used some of its elements. No
managers were thinking in the categories of the computer algorithm that gave rise to the five
focusing steps of the logistics paradigm of TOC. Identifying a constraint was rarely a problem;
apparently traditional warehouses have less complex flow of goods than manufacturing
enterprises. In most cases, however, more than one constraint was present at a time, even though
the constraints might be of different severity. For example, the picking operation may be
experiencing a chronic shortage of specialized lift trucks, while the receiving is frequently short
on dock space.
56
We had recognized the problem of TOC’s 5-step process being an artificial algorithm that
was potentially impossible to follow exactly in practice and test in empirical research, and we
mentioned our specific concerns when describing Step 4 and at the end of the previous section.
The interviews with the managers confirmed our apprehensions. Rather than following the strict
TOC sequence of steps to deal with shortages and identifying at which step the constraint would
be overcome, warehouse managers evaluated the severity of each constraint and applied
remedies they deemed to be most likely to resolve the matter effectively and with minimum cost
and effort. This view is not in contradiction with the TOC steps. Steps 2 (better utilization of
existing capacity of the constrained resource), 3 (capacity trade-offs with other resources) and 4
(acquisition of additional capacity) can be viewed as a hierarchy of focused actions that increase
in cost and effort. The managers perceive them all as potentially available tools and may decide
to simply “jump in the middle” of this continuum, use a combination of actions from different
steps or just spend cash to attack the constraint at the very top. After all, if the constraint is in bad
need of a highly specialized order picking truck, to really solve the problem you may just have to
order this piece of equipment bypassing numerous other less efficient alternatives – a strategic
decision to add capacity, or Step 4.
While not entirely falling into the sequence of TOC steps, the managers’ actions were not
lacking a structure. They viewed their actions in terms of 3 categories: (1) things that can be
done within the existing standard operating procedures and required only a small amount of extra
effort and no extra cost; (2) things that required some changes in operations resulting in
improvements that came at some costs and necessitated efforts to use the existing resources in a
different way; and (3) more radical strategic actions that usually resulted in substantial cash
spending on acquisition of extra capacity and considerable administrative effort.
57
Some warehouse managers of larger facilities saw their constraint improvement actions
as split over areas of responsibility: things a foreman or team leader can do, actions that an
operations manager can authorize, and finally, additional resource capacity that a warehouse
manager, often with the approval of superiors, can acquire.
This view does not change the structure described above, which is by no means unique.
More commonly it is known as tactical, operational and strategic management. The principal
difference that TOC introduces in it is that all three types of management must be squarely
focused on constraint elimination.
There is also indirect evidence from the literature supporting the need to preserve the
essence of TOC while relaxing the rigidity of its original framework. Vogt (2010) reviewed
cross-docking operations and reported that when it came to implementation of TOC, the
“approach was not formal, but the principles were actually in use” (p. 111).
Churchill’s (1979) well-known procedure for scale development calls for construct
domain (re-)specification after a major insight has been received. Our major finding from the
interviews reshaped the first order constructs of the logistics paradigm of TOC while leaving the
second order construct in the model (Focused resource capacity management) unchanged. To
illustrate with a culinary example, the change made is akin to changing the description of borsch
from the sequence of cooking instructions to a restaurant menu description highlighting the
salient features and key ingredients. However, the dish itself has not changed. We believe that
the transition from the original, computer algorithm-like sequence of steps to more traditional
theoretical time-neutral constructs supported by actual industry practices is a sizable contribution
to the development of TOC.
58
Finally, the interviews with warehouse managers touched upon warehouse performance
metrics. The original intent to measure overall warehouse performance was to use the traditional
logistics performance scale with items from supply chain literature and WERC studies. It would
be of interest, of course, to learn about the effect of using TOC on financial performance of a
warehouse and its impact on the financial performance of the whole firm, but the apprehension
was that warehouse managers simply would not know it, given that a warehouse is just one
organizational unit of a firm.
The interviews confirmed this apprehension. Most interviewed managers confessed that
they neither knew whether their warehouse made a positive or negative impact on the
performance of the firm, nor were they aware of the magnitude of that impact. However, it was
also established that most warehouse managers used some financial metrics to evaluate their
warehouse operations. Many warehouses track their unit costs, dollar amounts of claims paid due
to picking and shipping mistakes (and mistakes-related costs such as urgently shipping a
“shorted” item) and amounts paid as demurrage and detention claims when not being able to load
or unload transportation vehicles on time.
Thus, it was decided to preserve in the full final model the separation of financial
performance of the warehouse from its logistics performance, while explicitly recognizing two
limitations of the measure. It is narrow in scope and is substantially correlated with logistics
performance by design because it is comprised of dollar-sign items that essentially mirror the
logistics performance items, such as on-time performance, picking and shipping mistakes, etc.
The adjusted full model is shown in Figure 10.
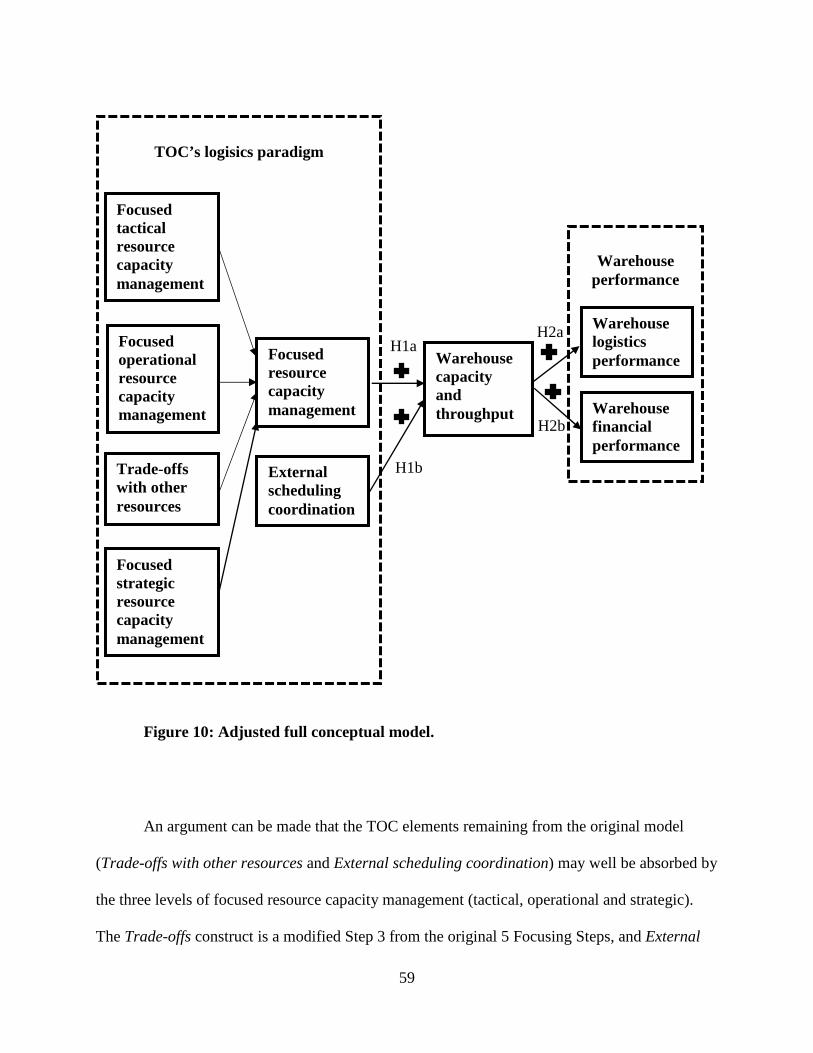
59
Figure 10: Adjusted full conceptual model.
An argument can be made that the TOC elements remaining from the original model
(Trade-offs with other resources and External scheduling coordination) may well be absorbed by
the three levels of focused resource capacity management (tactical, operational and strategic).
The Trade-offs construct is a modified Step 3 from the original 5 Focusing Steps, and External
H2b
H2a H1a
H1b
Warehouse
performance
TOC’s logisics paradigm
Warehouse capacity and throughput
Focused resource capacity management Warehouse
financial performance
Focused tactical resource capacity management
Trade-offs with other resources
External scheduling coordination
Focused operational resource capacity management
Focused strategic resource capacity management
Warehouse logistics performance
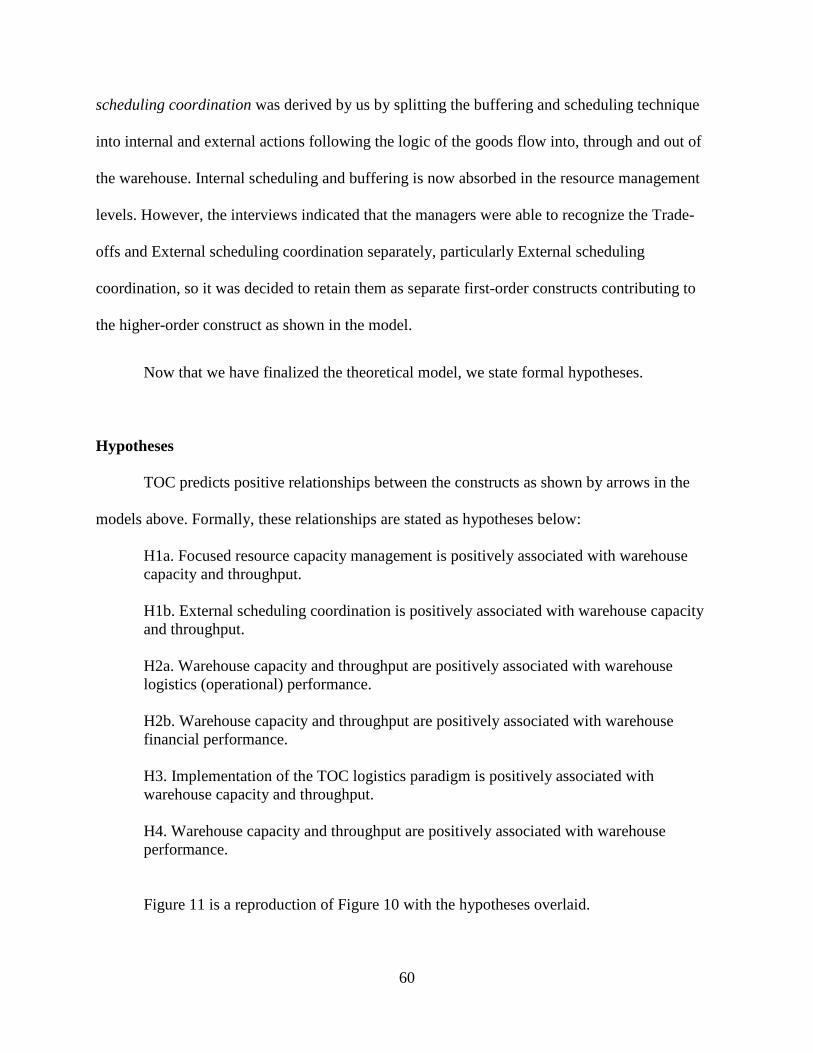
60
scheduling coordination was derived by us by splitting the buffering and scheduling technique
into internal and external actions following the logic of the goods flow into, through and out of
the warehouse. Internal scheduling and buffering is now absorbed in the resource management
levels. However, the interviews indicated that the managers were able to recognize the Trade-
offs and External scheduling coordination separately, particularly External scheduling
coordination, so it was decided to retain them as separate first-order constructs contributing to
the higher-order construct as shown in the model.
Now that we have finalized the theoretical model, we state formal hypotheses.
Hypotheses
TOC predicts positive relationships between the constructs as shown by arrows in the
models above. Formally, these relationships are stated as hypotheses below:
H1a. Focused resource capacity management is positively associated with warehouse capacity and throughput. H1b. External scheduling coordination is positively associated with warehouse capacity and throughput. H2a. Warehouse capacity and throughput are positively associated with warehouse logistics (operational) performance. H2b. Warehouse capacity and throughput are positively associated with warehouse financial performance. H3. Implementation of the TOC logistics paradigm is positively associated with warehouse capacity and throughput. H4. Warehouse capacity and throughput are positively associated with warehouse performance.
Figure 11 is a reproduction of Figure 10 with the hypotheses overlaid.
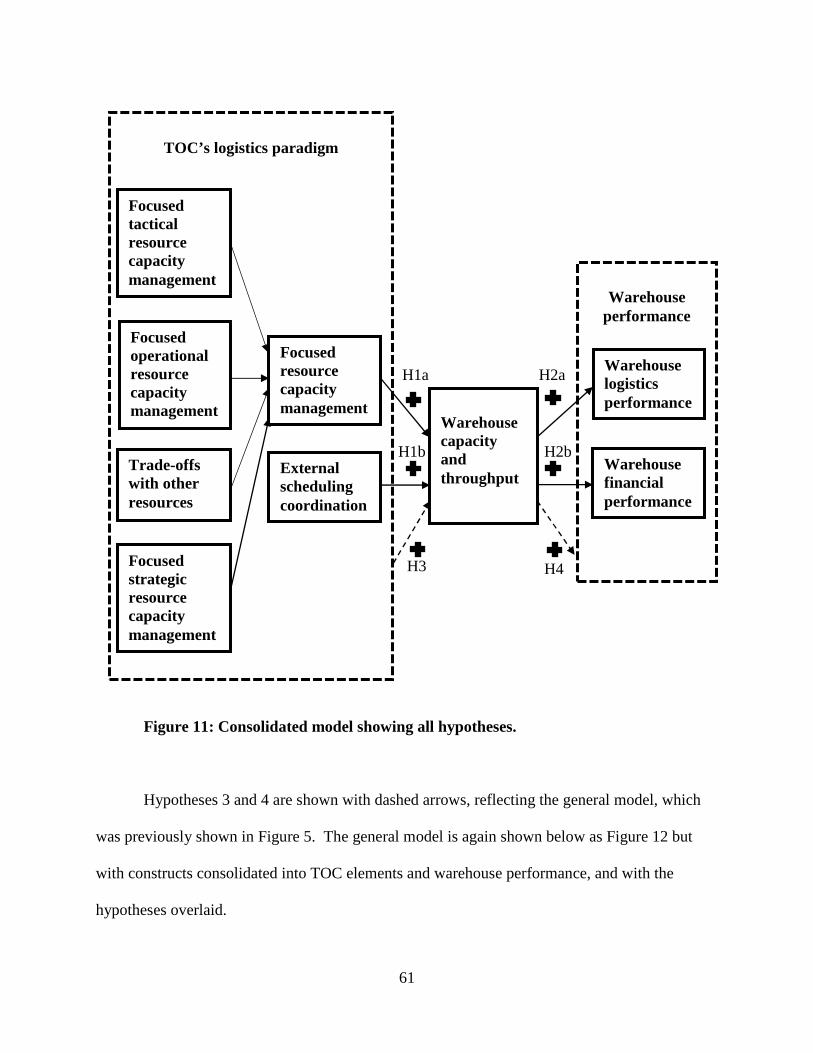
61
Figure 11: Consolidated model showing all hypotheses.
Hypotheses 3 and 4 are shown with dashed arrows, reflecting the general model, which
was previously shown in Figure 5. The general model is again shown below as Figure 12 but
with constructs consolidated into TOC elements and warehouse performance, and with the
hypotheses overlaid.
H4 H3
H2b
H2a H1a
H1b
Warehouse
performance
TOC’s logistics paradigm
Warehouse capacity and throughput
Focused resource capacity management
Warehouse financial performance
Focused tactical resource capacity management
Trade-offs with other resources
External scheduling coordination
Focused operational resource capacity management
Focused strategic resource capacity management
Warehouse logistics performance
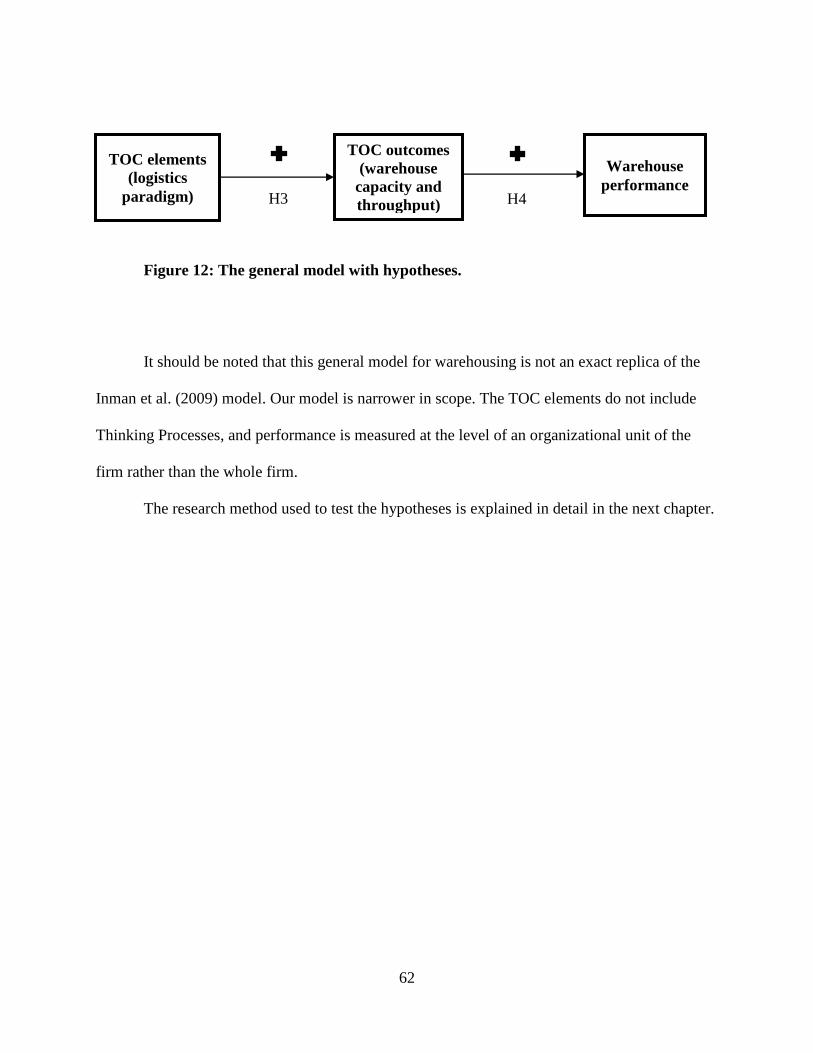
62
Figure 12: The general model with hypotheses.
It should be noted that this general model for warehousing is not an exact replica of the
Inman et al. (2009) model. Our model is narrower in scope. The TOC elements do not include
Thinking Processes, and performance is measured at the level of an organizational unit of the
firm rather than the whole firm.
The research method used to test the hypotheses is explained in detail in the next chapter.
TOC elements (logistics
paradigm)
TOC outcomes (warehouse capacity and throughput)
Warehouse performance
H4 H3
63
CHAPTER IV
METHOD
The survey instrument design and administration
Data collection
The data for the study was collected from a survey of warehouse managers. An online
version of the survey was developed using a popular survey software application. A paper
version was also developed for those respondents wishing to take the survey in that form. Both
paper and online responses were solicited directly by the researcher during the pretest phase of
the study. Adjustments were made based on feedback from the pretest, and the final version was
available in both formats; however, the majority of responses were from the online version.
There were no differences in questions between the two versions; only some technical
differences necessitated by information presentation formats. However, in the online version, an
option forcing the respondent to respond to certain questions was used where appropriate. The
online part of the survey was administered by a commercial service.
The choice of the online survey format was dictated by its advantages as described in the
literature: ready access to participants, large geographic coverage, speed and timeliness,
convenience (including for participants), automated data collection in a ready for analysis form,
and meta-data about a respondent’s behavior (Schmidt, 1997; Wright, 2005; Evans and Mathur,
2005; Bosnjak and Tuten, 2001). In addition to how the survey is administered, the online format
has design advantages: question format diversity, control of answer order, required completion of
answers, and response-dependent question pop-up or skipping capabilities (Evans and Mathur,
2005).
64
Some of the online format disadvantages, such as internet connectivity issues, lack of
computer skills, and other problems related to the level of development of the technology and
user comfort with it, listed in prior literature (e.g., Goldsby et al., 2001; Boyer et al., 2001) were
felt as not being a concern for present-day US-based warehouse managers as the target
population. However, other disadvantages, such as questions about data validity, sampling issues
and survey design issues (Wright, 2005) appeared to be a legitimate concern. These issues are
discussed in the next section of the chapter.
The survey instrument consisted of an introductory page and four parts. The first three
parts provide demographic information, measures of TOC elements, and TOC outcomes and
warehouse performance measures. The fourth section of the survey collected data for a research
question for future research not covered by this study. A copy of the survey instrument is
provided in Appendix A, and is discussed briefly below.
The introductory page contains a brief overview of the study and the survey, as well as
legal disclosures required by the Institutional Research Board of the University of Arkansas.
Respondents were promised confidentiality to the fullest extent allowable by law. The surveys
administered online by a commercial survey service were anonymous to the researcher.
The demographic section of the survey collected basic information about the respondent
and the respondent’s warehouse. The questions were in different formats (a Likert scale, a sliding
scale, multiple choice, and free text entry). Formalized responses to these questions were used to
create control variables. The questions in the other parts of the survey were on a 7-point Likert
scale (from “Strongly agree” to “Strongly disagree”).
The initial survey instrument was reviewed by several academics and experts in the
warehousing field, upon which further improvements and refinements were made. This step was
65
followed by initial data collection and subsequent measure purification, once enough data were
collected for the analysis (discussed further in the next sections). The literature generally
recommends that the number of respondents be at least 5 times the number of items desired on
the final scale, with sample size of at least 200 being a common rule-of-thumb recommendation
(e.g., Hair et al., 2009). Rough guidelines specifically for structural equation modeling (SEM)
suggest at least 100 cases for any but the simplest models, with 200 cases samples considered to
be “large” and acceptable for most models (Kline, 2005). Therefore, the target number of usable
responses for data collection was set at 200 (or more if possible). Target respondents were
contacted by a variety of means, including e-mail and phone calls, and were asked to fill out the
questionnaire developed for this study. The questionnaire was placed online; however, a paper
copy and a Word file copy were made available to those who preferred these options during the
pretest phase. The commercial survey service contacted respondents by e-mail.
Data screening
Initially collected data were subjected to screening. Missing data were not an issue for
online responses because of the forced response setting for the questions collecting data for all
variables. Cases of missing and unusual values in the responses solicited by the researcher
directly were rectified by contacting the respective respondents with a request for clarification.
Next, data were reviewed for signs of departure from normality, linearity and
homoscedasticity, which are the assumptions of the regression analysis. Data collected from
Likert scales often violates normality assumptions (Wu, 2007). Kurtosis and skewness of several
predictor variables of interest were particularly far from normal, a common occurrence in Likert
scales data. However, many of the issues are known to diminish when the variables are
66
aggregated into scale variables. Following the recommendation of Tabachnick and Fidell (2007),
residuals were screened for normality. Visual inspection of histograms and plots of standardized
residuals showed that the distributions of standardized residuals of the dependent variables were
close to normal. Only minor departures from linearity and homoscedasticity were observed.
According to Tabachnick and Fidell (2007), if the residuals plots look normal, there is no need to
screen individual variables for normality, besides individually normally distributed variables do
not guarantee multivariate normality (p. 83). Two of the control variables, however, were
transformed into a logarithmic form to improve normality.
Addressing potential bias
General considerations
In this section we explain how we addressed issues associated with common method
variance. For the following discussion, we rely largely on the influential work of Podsakoff et al.
(2003) as well as papers by Williams et al. (2010) and Craighead et al. (2011).
One of the biggest threats to validity of any research is measurement error. It consists of
two parts: random error and systematic error. One way to reduce random error is to use multiple
items measuring the same construct, an approach we employ in this study where appropriate.
Systematic error is believed to be a bigger problem, “because it provides an alternative
explanation for the observed relationships between measures of different constructs” (Podaskoff
et al., 2003, p. 879) and may lead the researcher to erroneous theoretical conclusions. Systematic
error may be introduced by a method bias, or variance.
Surveys are particularly prone to the method bias known as common method variance.
Common method variance is defined as, “the amount of spurious correlation between variables
67
that is created by using the same method … to measure each variable” (Craighead et al., 2011, p.
578). It may vary in the direction and strength and, “can either inflate or deflate observed
relationships between constructs, thus leading to both Type I and Type II errors” (Podsakoff et
al., 2003, p. 880).
In survey-based research, the most likely sources for common method bias are effects
introduced by the common rater (e.g., consistency motif, implicit theories, social desirability,
leniency and acquiescence biases, and mood and transient mood states), item characteristic and
context effects (e.g., common scale formats and anchors, and scale length) and measurement
context effects (e.g., measuring predictor and outcome variables at the same location or point of
time). Several of these factors may play a role at the same time (Podsakoff et al., 2003).
The possibility of presence of common method variance should be taken into account at
all stages of the survey-based research process: survey design, administration and evaluation of
results. The tools available to the researcher are planning and administering the survey in a way
that minimizes common method variance, diagnosing it upon survey completion and taking
corrective action if necessary. Podsakoff et al. (2003) grouped the techniques for controlling
common method variance into two main categories: procedural and statistical remedies.
The two categories differ in applicability to research designs. Both can be used in
reflective models, but formative models effectively preclude the use of currently available
statistical remedies. In formative constructs, the effects of the method bias should be measured at
the construct level rather than the item level, but unfortunately, available remedies result in
identification problems (Bollen and Lennox, 1991; Podsakoff et al., 2003). Thus, when using
formative models, Podsakoff et al. (2003) advised researchers to, “be even more careful than
68
normal in designing their research because procedural controls are likely to be the most effective
way to control common measurement biases” (p. 900).
Remedies against bias used in this study
Severely crippled in the choices of statistical remedies available for formative models, we
have performed a commonly used traditional Harman’s single factor test, which involves
examining variance accounted for by all variables in an exploratory factor analysis (EFA).
Common method variance is said to be present when one factor accounts for the majority of the
variance or only one factor emerges from the unrotated solution (Podsakoff et al., 2003;
Craighead et al., 2011). While neither was true in our case indicating the absence of a serious
common method variance problem, we acknowledge the note in Podsakoff et al., (2003) that
Harman’s test is a diagnostic procedure rather than a remedy, and it is an insensitive test.
Some of the actual remedies recommended by Podsakoff et al. (2003) in the “procedural”
category were employed at the survey design stage. One such remedy is creating a psychological
separation between the predictor and outcome variables through a cover story that seem to make
their measurements unrelated. This was first attempted in the pretest version of the questionnaire.
Its face validity was assessed by academics and industry professionals contacted during an
annual meeting of a major supply chain membership-based organization. Several comments
received indicated that the lack of match of the paragraph explaining the purpose of the study
and the composition of the questionnaire to the questions asked in it was too noticeable and
raised questions. Thus, it was adjusted to closer reflect the contents; however, any mention of
warehouse performance measures was omitted from that paragraph.
69
Another recommended remedy is guaranteeing anonymity to respondents. The majority
of responses were received online through the commercial survey service company, and
anonymity of responses (to the researcher) was a condition of the service known to the
respondents. However, respondents contacted by the researcher directly could only be promised
confidentiality. The means of several items of the resulting subsamples were found to be
significantly different in statistical terms, and a binary control variable had to be used in
subsequent analysis of the combined dataset. While we report it, we do not make a claim about
the reasons for the difference. An unknown underlying factor could be the reason, and a
theoretical probability of obtaining several statistically different means of items of two random
subsamples from a relatively small sample also exists.
Conflicting advice exists on question order. Randomizing questions is suggested to avoid
some of the item context and consistency effects. On the other hand, Posakoff et al. (2003)
cautioned about intermixing bias, another type of item context effect that may increase
correlations between constructs and decrease correlations within a construct due to an item from
a different construct mixed in the group of same construct items. Control of the answer order is
believed to reduce bias (Evans and Mathur, 2005). With a few exceptions, the survey was
constructed in a way that items were grouped by constructs. The exceptions were mostly to
preserve question order when items were deleted and added during the initial pretest. Following
advice of Evans and Mathur (2005), a graphical progress indicator was employed to avoid an
impression of an endless number of questions on the respondents.
One remedy recommended by Podsakoff et al. (2003) without reservations is improving
scale items by eliminating ambiguity. The six ways to do it listed in the paper focus on clarity,
simplicity and definitions or explanations where warranted. We took this recommendation
70
seriously from the start and further improved the instrument based on the review by academics
and industry professionals during the initial pretest. We report here several examples as an
illustration:
- Abbreviations (e.g., WMS) and complex terms (e.g., internal order cycle) were explained.
- Discrepancies between industry jargon (referring to any type of a lift truck as a forklift, the most common material handling machine in the warehouse) and official language were explained at the first encounter with the term.
- TOC specific terminology (e.g., constraint) was avoided, except where necessary as a
validation check for respondents claiming to use TOC (following the approach of Inman and Sale (2003)).
- Each question was edited to fit on one line for the paper version of the survey (the
online version had exceptions due to survey software limitations)
Behavioral issues in data validation
Survey data screening on behavioral grounds is not often performed or reported in supply
chain literature. We hope that this section that details our efforts to reduce potential data quality
problems in the study introduced through behavioral issues by respondents will have a merit on
its own as a mini-case example of specific actions in this respect. The difference from the issues
discussed in the previous section is that this section deals with measurement error that can be
introduced through respondents’ disregard of expected survey taking procedures or intent to
distort data.
Uncertainty about data validity is noted as a primary concern in online survey research by
Wright (2005). Some of the issues are not different from those that occur in traditional mail
surveys (Schmidt, 1997). The identity of the respondent cannot be guaranteed, and it is just as
easy for respondents to misrepresent any demographic information or their feelings towards the
71
matter of the survey (Wright, 2005). However, Schmidt (1997) notes that the online survey
research validity is likely to be stronger for specific narrowly defined populations that can also
be screened online and offline. He suggests (p. 275) that “conservative researchers” employ a
screening questionnaire for respondents to demonstrate that they meet certain criteria, a
recommendation we followed.
Since the main survey was to be administered by a third party anonymously online, the
respondents were asked qualification questions to establish that they were warehouse managers
and they were familiar with the daily operations of their warehouses for at least three preceding
years (the period covered by the survey). Those replying negatively to any of the screening
questions were taken directly to the survey exit screen, and their responses were automatically
disqualified by the software.
However, we were aware that a screening block of questions at the start of the survey to
eliminate participants who have truthfully reported their demographic data indicating their
ineligibility for the survey is not sufficient to ensure quality data collection. There are accounts
in the literature of cases of grotesque abuse of web-based surveys, such as one individual
submitting 65 responses (6% of the total number of responses) in a survey conducted by Konstan
et al. (2005). The paper recommends a rigorous data validation protocol that includes both
automatic software checks and manual response review. Using some of their recommendations
applicable to our study, we have developed our own protocol, presented below.
In addition to the starting qualification questions discussed above, our online screening
method employed a built-in attention check to prevent responses from respondents not reading or
thinking through questions from entering the data set. First, a polite cautioning message against
answering the questions without reading or thinking was displayed as a separate screen to ensure
72
that it catches attention. The message was followed in the next section by an attention check
requiring a respondent to select a particular answer (“Strongly disagree”). The answer was
chosen in contrast to the prevailing responses in that block of questions as determined from the
online survey pretest. Failure to select this answer led to an automatic survey attempt
termination. It was believed that after the specific warning message, the respondent’s apparent
disregard for the request to pay attention indicated his or her openly defiant attitude and behavior
that was deemed incompatible with obtaining reliable data from such participant.
Bosnjak and Tuten (2001), who studied response behaviors in web-based surveys,
pointed out the ability of survey software to collect meta-data about respondents’ survey taking
behavior such as a chosen order of answers or time between survey start and survey completion
for each respondent. Boyer et al. (2001) raised concerns about data obtained in superfast
responses (in their case, 1.5 minutes compared to approximately 18-minute average) and
concluded that, “the ability to track the time spent filling out the survey offers some value to
researchers who seek to balance and optimize both quantity and quality of respondents” (p. 6)
implying that unreasonably fast responses need to be deleted as unreliable. We followed this
suggestion.
During the online pretest phase, a reasonable response time was determined to be near 20
minutes. The website of the commercial service administering surveys employing this software
recommended an automatic cut-off time (if used) to be set as one third of the average time
recorded during the pretest. To ensure higher quality of data, a more conservative cut-off was set
at 13 minutes. Responses that took less time to complete were disqualified by the software.
Several additional manual checks of data consistency were built in. For example, the
same question (about change in business over a 3-year period) was asked twice in two different
73
formats: as a sliding scale in the opening demographic section of the survey and on a Likert scale
towards the end of the survey. Following the approach of Sale and Inman (2003), several
questions were paired with immediately following validation questions asking the respondent to
enter information explaining the choice made on the previous question. Free-text validation
responses were particularly useful in identifying a case of multiple attempts to take the survey by
one individual using an IP-address manipulation software to bypass the multiple response block
of the survey software.
All remaining responses were reviewed manually for instances of “straightlining”
(picking the same choice for all questions in the block) and other clear geometrical patterns
formed by responses on the screen. In addition, comparisons of responses to objective data
questions with the average pretest and industry data, where available, helped flag suspicious
responses for further scrutiny. For example, respondents reported their warehouse square footage
and number of employees as separate questions. During response review, a ratio of workers per
square foot was calculated and compared to other independently obtained data. Ridiculously
small or large numbers were a reason for suspicion and counted as one failed check.
Finally, modern survey software offers some automatic response validation for certain
types of questions (e.g., the expected number of characters in the entry), and it provides an
option that requires the respondent to make a correction, or to request it, but still allow them to
proceed. We want to point out that the second option (the request), was used to set up a response-
dependent activated question. This offers indirect information about a “bad” attitude of a
respondent who chooses to ignore it and proceed without making a correction to their previous
response.
74
Responses, failing more than one soft check, were disqualified in a simple approach. A
second review assigned weights (in points) to the different checks, and a penalty point threshold
was established as a criterion for response elimination.
A generalized summary of our data validation protocol is shown below:
1. Eligibility criteria through demographic questions at survey start.
2. Warning message + attention check question.
3. Minimum completion time cut-off (if there are not enough pretest data to calculate a standard deviation for good quality responses with confidence, we recommend 2/3 of the average time for good pretest responses as a conservative cut-off and 1/3 as liberal).
4. Same objective data question asked in different formats in different parts of the survey. 5. Free-text validation questions automatically activated for unusual or out of expected
range responses. 6. Automatically tracked deliberate failures to follow specific instructions when
requested. 7. Manual review for “straightlining” and geometrical patterns in responses. 8. Separate objective data collection for a construction of an index to be compared with
industry or pretest averages. 9. Assigning weights to the data quality checks (e.g., in points) and setting up a cut-off
number of points for response elimination.
It is important to note that response screening and elimination of poor quality data due to
respondents’ survey taking behavior was based on carefully determined parameters and took
place before any statistical analysis. In many ways it is akin to outlier deletion on statistical
grounds and should not be interpreted as data manipulation.
While we believe that the extra diligence in setting up the survey instrument and
reviewing the received responses for any problems has definitely reduced the amount of
75
systematic bias and noise in the resulting data, it is impossible to eliminate the problem
completely. Some bias may be inherently present because we use self-reported measures of
warehouse performance. The warehousing industry is very diverse and a single universally
accepted set of performance metrics simply does not exist. In situations when preferred objective
performance measures are not available, the use of perceived measures of performance is
acceptable (Dess and Robinson, 1984). Sale and Inman (2003), who used perceived performance
measures in their empirical TOC research, noted that, “[a]lthough self-rating scales are criticized
for potential bias, this is less a concern when such bias is generic and where the ratings are used
in a relative, rather than absolute, measure” (p. 836). We use the same 3-year period for
performance comparison as Sale and Inman (2003) as a relative performance measure to
minimize the potential bias. The development of measures for the constructs for this study is
explained in more detail in the next section.
Model specification and measurement
General considerations
In this study, we followed widely recognized recommendations of Churchill (1979) and
Gerbing and Anderson (1988) for conducting empirical research. According to Churchill (1979),
the starting step of scale development is construct domain specification. Our work on this step
was explained in the previous chapter. In the next step, items to measure constructs were
generated based on literature and other sources.
While earlier empirical work for manufacturing relied on respondents direct statements
acknowledging the use of TOC (e.g., Sale and Inman, 2003), we could not use this approach
because very few warehouse managers were aware of TOC, even though they used some of its
76
elements, as our interviews showed. Similar evidence came from the literature based on field
work (Vogt, 2010). Other empirical TOC papers (Inman et al., 2009; Moss, 2007) also employed
scales to establish TOC use. That is why we chose to treat all TOC elements as latent constructs
that could be measured by reflective items. The second order Focused resource capacity
management construct was modeled as a formative construct.
Initial measurement items for TOC constructs were borrowed from empirical TOC
literature, specifically, Inman et al. (2009) and Moss (2007). The scale items were adapted to
reflect the warehousing context where necessary. Following the approach of Kocabasoglu and
Suresh (2006), several additional warehouse specific items were added to the scales based on
theory to reflect modifications to the constructs described in the previous sections. Finally,
extensive interviews with industry professionals resulted in additional adjustments.
Scale structure analysis and purification
Churchill (1979) suggests that after an initial data collection, purification of measures
should take place. These and the preceding steps may be repeated as a cycle as needed. In
addition to reviewing the inter-item correlation matrix when practical, a common way to analyze
the structure of the scale to establish construct validity is by using factor analysis (Clark and
Watson, 1995), also recommended by Churchill (1979). There are arguments in the literature
both in favor of exploratory (EFA) and confirmatory (CFA) factor analysis for the purpose. This
study followed the recommendation of Kelloway (1995) and Hurley et al. (1997) to use EFA in
the early stages of scale development because EFA may show loadings of items on non-
hypothesized factors.
77
Kaiser-Meyer-Olkin tests of sampling adequacy of above 0.8 (as recommended by Hair
et al., 1998) and significant Bartlett tests of sphericity indicated that it was appropriate to
perform factor analysis on these data. The factors were extracted using the principal component
analysis. The Promax oblique rotation allowing the factors to be correlated was used with the
default parameter kappa = 4. Guidelines by Hair et al. (1998, p.112) for identifying significant
factor loadings based on the sample size and customary statistical assumptions indicate that
loadings of 0.40 and above, are significant for sample sizes of 200 and greater. A more
conservative approach was adopted to retain loadings above 0.5 with no cross loadings on other
factors higher than half of the loading on the “correct” factor. Per Hair et al. (1998, p. 113),
communalities, which represent the amount of variance accounted for by the factor solution for
each variable, were deemed acceptable for variable retention if they were 0.5 or higher.
Validity and reliability of scaled variables
An important part of an empirical study is evaluating psychometric properties of the
employed scales: validity and reliability. Validity assesses how well a measure or a set of
measures represents the concept of the study; reliability assesses the consistency of the
measurement (Hair et al., 1998, p. 3). In other words, validity refers to what is measured,
whereas reliability relates to how it is measured (Hair et al., 1998, p. 3). It is customary to
evaluate validity of the measures first since their validity is an assumption for calculations of
reliability (Hair et al., 1998, p. 611).
There are several types of validity and ways to evaluate them applicable to empirical
research that uses a method of statistical analysis. To understand whether the theoretical meaning
78
of the concept is captured in the operational definition of a variable, researchers look at construct
validity and its two measures: convergent and discriminant validity.
Convergent validity tests the closeness of association of related measures in a scale by the
strength of its inter-item and item-to-factor correlations (factor loadings). Inter-item correlations
were reviewed first and found acceptable. While higher inter-item correlations are desirable as
they will indicate that items measure the intended concept, very high correlations are an
indication of redundancy in the scale (Clark and Watson, 1995). Convergent validity during EFA
was established by following the procedure of eliminating items with low loadings on the factor
(below 0.5).
Discriminant validity, as the name implies, tests if two unrelated factors do indeed appear
as unrelated when measured by proposed scales. This is evidenced by very low cross-loadings of
the items on the unrelated factors. Items with high cross-loadings above half of the principal
loading were removed.
Reliability also lends itself to assessment with a variety of means. The most common one
is Cronbach’s alpha that measures the consistency of the whole scale and ranges in values from 0
to 1. The recommended lower limit is 0.70, with 0.60 acceptable in exploratory research (Hair et
al., 1998, p. 118; Kocabasoglu and Suresh, 2006). Other possibilities to assess scale reliability
are composite reliability (same as Cronbach’s alpha but with unequal weights of items) and
average variance extracted, which can be estimated by modern software packages. In this study,
we used Cronbach’s alpha with a cutoff value of 0.60 to assess reliability of the scales.
79
Scaled variables construction
To obtain factor score estimates, Tabachnick and Fidell (2007, p. 650) recommend a
simple summation of scores of variables that load highly on the factor as an adequate procedure
for common research applications. They also point out that standardizing variables is not
necessary if the standard deviations of variables are roughly equal, as was the case with our data.
Hair et al. (1998, p.116) note that averaging the scores is more common than combining them.
We chose to average the scores also to ensure equal representation of the factors in higher-order
scaled variables (Focused resource capacity management, TOC logistics paradigm and
Warehouse performance). If combined scores were used, factors with more items would have
contributed more to the higher-order variable.
Since Warehouse performance was created as a two-item scale, its reliability was
assessed by Cronbach’s alpha (0.689). The other two composite constructs are discussed in the
next subsection.
Formative constructs
An important latent construct specification decision for a researcher is modeling a
construct as reflective or formative. The primary difference is in the direction of causality.
While reflective measures are caused by the latent construct, formative measures cause it (Freeze
and Raschke, 2007). It is critically important to distinguish between the two types of constructs
(MacKenzie et al., 2005). Construct misspecification of this type (a reversal of causality
direction), particularly in models estimated by structural equations, leads to misleading results,
which in turn may result in erroneous theoretical conclusions (Jarvis et al., 2003; MacKenzie et
al., 2005). It is possible to define a latent variable as mixed, i.e., having both causal and effect
80
items however, in most cases defining a latent variable with item paths going in just one
direction is more practical (MacCallum and Browne, 1993).
To distinguish reflective and formative perspectives in construct design, it is common to
refer to a formative latent variable as a composite, a scale as an index and a model containing at
least one formative construct as a formative model (Diamantopoulos and Winklhofer, 2001;
Bollen and Lennox, 1991). We followed this convention where it was necessary to avoid
ambiguity.
In addition to the primary difference in the direction of causality, there are several other
special traits that distinguish formative constructs from reflective constructs and are taken into
consideration in this study. Most authors (e.g., Freeze and Raschke, 2007; MacCallum and
Browne, 1993; Jarvis et al., 2003) note that (1) dropping an item may change the conceptual
domain of the composite; (2) a change in an index variable will cause a change in the composite
but not necessarily vice versa; (3) causal items do not have to be correlated with each other or
have low correlations with items of other constructs. Based on the causality direction and the
additional criteria above, we have originally specified as formative two constructs: Focused
resource capacity management in the full detailed model and TOC logistics paradigm in the
general model.
External scheduling coordination, a construct that emerged from our consideration of
physical warehouse transportation interfaces, was initially specified as being measured by a five-
item scale. After the pretest, one item was deleted. It was also recognized that the construct was
specified as mixed: out of four remaining items three were formative, and one was reflective. For
practical reasons and following the advice of MacCallum and Browne (1993), it was decided to
remove the reflective item and specify the construct as completely formative.
81
While we have modified the original logistics paradigm of TOC by removing the
temporal, sequential organization of its elements and adding an extra element (External
scheduling coordination), we have not changed the principal relationship between the elements
and the underlying construct. Whether reflective or formative, the validity of all constructs must
be established to assure that theoretical interpretation is based on sound results. Unfortunately,
the traditional means to establish validity and reliability of scales (Cronbach’s alpha, CFA, etc.)
are not applicable to indexes (Bagozzi, 1994, Diamantopoulos and Winklhofer, 2001). While
conceptual consideration plays a major role in affirming validity of formative constructs,
Diamantopoulos and Winklhofer (2001) propose several validity checks by creating and testing
mini models of specific configuration. We performed one of the checks applicable to our model
that tests the direction and significance of the beta coefficient from the composite construct to
another latent construct with which it should be logically linked in the full model. While the
conceptual considerations are given the main weight in the construct and item specification,
where we are clearly guided by TOC, the formative constructs in our model passed the tests as an
extra indication of external (nomological) validity of the constructs.
Control variables
Finally, several control variables were used in the model estimation. The traditional
control variables are warehouse size (square footage or number of employees), warehouse type
(3PL or cost center), and prevailing picking type (case or pallet) (WERC, 2014; Stank et al.,
1999). For a measure of size the number of employees was chosen over the square footage,
because headcount is much more easily changed than the warehouse surface area and, thus, more
accurate for the purposes of this study.
82
We also controlled for the degree of automation and cross-docking activities in the
warehouse because more rigidly structured operating contexts reduce the flexibility of resources,
and therefore limit a manager’s ability to affect warehouse measures of capacity and throughput.
Additionally, a growth (or decline) of business over the past 3 years, the time span
chosen for this survey following the work of Sale and Inman (2003), may have an effect on our
outcome constructs. Particularly, in a situation of business decline, the resulting excess capacity
in warehouse resources may limit the appeal of using TOC in the warehouse. Parenthetically, we
will remark that TOC still applies, but the constraint is external to the warehouse (e.g., lack of
demand), and TOC has a component (Thinking Processes) to deal with external constraints,
however, it is not considered in this study focused on operations inside the warehouse.
Means of several variables for two groups of survey participants, “anonymous” (received
through the commercial survey service) and “confidential” (solicited by the researcher directly)
were found to be statistically significantly different. A control binary variable was introduced
into the regression models to account for the variance associated with these differences.
The final control variable was a constraint index, which needs a more detailed
explanation. No prior TOC literature was found applicable to constructing a measure of how
badly constrained resources are in a warehouse. Our survey used a 7 by 7 matrix that requested
respondents to select which of the six key resources and an additional “other” resource, if
applicable, for which they experienced a shortage for at least six months in any 12-month period
over the preceding 3 years. They were then asked to rate the severity of the shortage on a scale
from 1 (“Not severe at all”) to 7 (“Extremely severe”). Even though TOC states that each system
has at least one constraint, a forced response option was not chosen for this question in the online
83
version of the survey to allow for a possibility of a system constraint outside the warehouse.
However, the few responses with nothing selected were completely excluded from analysis.
The original TOC does not prohibit multiple constraints. The number of constraints is
limited, “by the number of independent ‘chains’” (Goldratt, 1990, p.124). It was shown earlier
that a regular warehouse typically has two disjoint flows, each of which may have different
constraints. However, more than two constraints are possible in each flow. For example, it is
feasible that a picking operation may not reach its goal because of a shortage of personnel,
forklifts, and dock space at the same time. Theoretically, any one of the three constraints could
be the worst and the most limiting one, and they may switch among themselves as capacity is
added to them at a different rate. However, the managers comparing the capacity of available
resources with calculations of needed capacity to reach the order preparation target (i.e., the
number of people, order picking trucks, and square footage for prepared orders on the dock) are
likely to perceive that they have multiple constraints even in one chain. Hence, multiple
selections were possible and expected in the survey question matrix. The difficulty for the
researcher was how to combine multiple constraints of different severity into just one variable in
order to effectively measure the overall level of constraint within the warehouse.
In a situation similar to this, Geri and Ahituv (2008) applied TOC to joint IT systems
implementation in the supply chain. They used a 7 by 11 cell matrix with 3 levels to choose from
in each cell. They assigned numerical values of 0, 1, and 2 for each of the cell choices and
constructed an index based on the sum of all numerical values plus an arbitrary 50 points for
another condition that deemed to be very important. This simple summation approach plus an
arbitrary correction for another condition was deemed not appropriate for our study. Clearly, 7
resources mildly constrained at the level of 1 are not the same condition as having one level-7
84
severely constrained resource. Instead, a common statistical practice of squaring values and
summing them was chosen. This resulted in a constraint index (CI) with the range of potential
values from 1 to 343 (for 6 plus one resources); however, it was difficult to predict a priori if the
CI of the warehouse will significantly impact any of the predicted variables. To improve
normality, the CI variable was transformed into a logarithmic form.
Choice of an estimation technique
Due to the latent nature of constructs in the model, the recommended technique for
statistical analyses normally would be Structural Equation Modeling (SEM) (Hair et al., 1998;
Kline, 2005). SEM is not a single technique but a collection of confirmatory statistical
procedures to examine relationships between one or more independent variables and one or more
dependent variables (Ullman, 2007; Kline, 2005). As previously mentioned, CFA is considered a
special case of SEM (Ullman, 2007), just as is PLS (Kocabasoglu and Suresh, 2006). The
primary advantage of SEM is that it allows one to evaluate multiple relationships between the
construct in the measurement model simultaneously.
However, for the covariance-based SEM estimation there is an identification requirement
for formative models that our model does not comply with: any composite variable must emit at
least two paths to unrelated latent constructs (Jarvis et al., 2003). The possible alternatives to the
two latent constructs are a minimum of two theoretically appropriate reflective indicators or a
combination of latent constructs and reflective indicators. Our model does not satisfy any of
these conditions. There is only one path emanating from the composite variables to the
Warehouse capacity and throughput latent construct. Thus, SEM was deemed inappropriate as a
model estimation method.
85
Instead of SEM, hierarchical multiple linear regression, which is the most common
technique, was used to test the model. We used it to estimate the function Y = f (X, Z), where X
is a vector of dependent variables of interest, and Z is a vector of control variables. The
hierarchical (sequential) variety of regression allows entering the covariates (controls) on the
first step followed by the independent variables of interest.
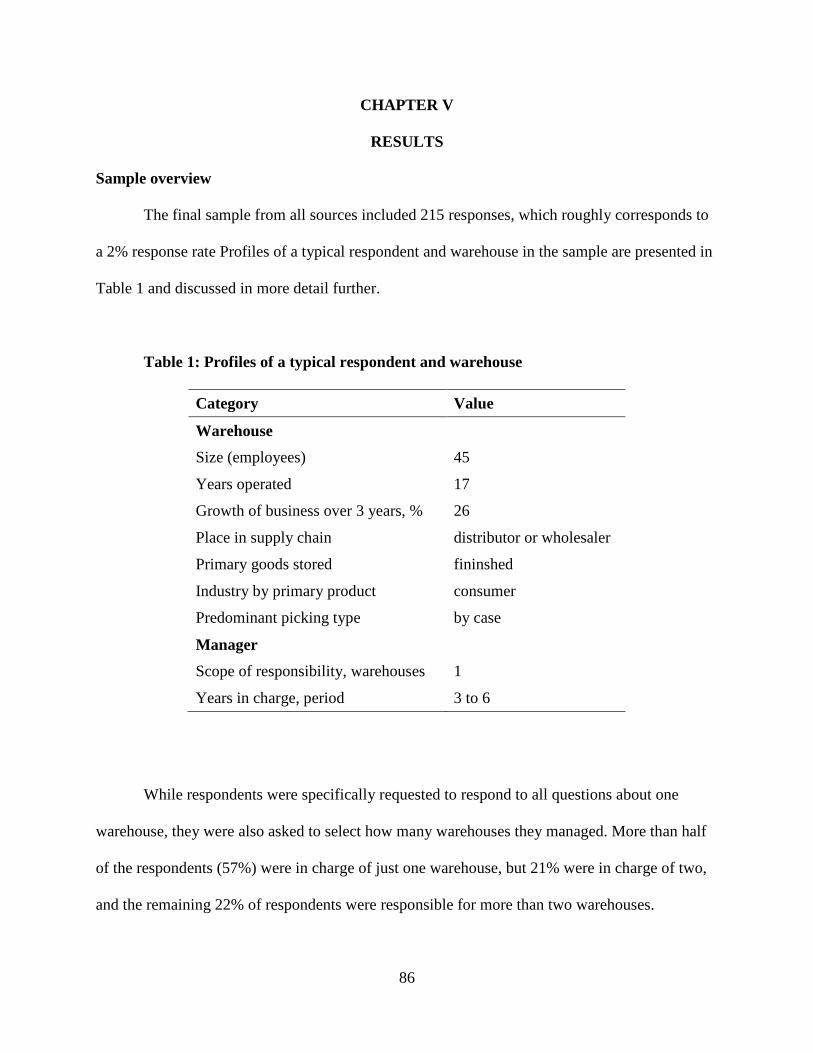
86
CHAPTER V
RESULTS
Sample overview
The final sample from all sources included 215 responses, which roughly corresponds to
a 2% response rate Profiles of a typical respondent and warehouse in the sample are presented in
Table 1 and discussed in more detail further.
Table 1: Profiles of a typical respondent and warehouse
Category Value
Warehouse Size (employees) 45
Years operated 17
Growth of business over 3 years, % 26
Place in supply chain distributor or wholesaler
Primary goods stored fininshed
Industry by primary product consumer
Predominant picking type by case
Manager Scope of responsibility, warehouses 1
Years in charge, period 3 to 6
While respondents were specifically requested to respond to all questions about one
warehouse, they were also asked to select how many warehouses they managed. More than half
of the respondents (57%) were in charge of just one warehouse, but 21% were in charge of two,
and the remaining 22% of respondents were responsible for more than two warehouses.
87
One survey question asked respondents about how many years they were responsible for
their warehouse. In addition to simply collecting demographic information, respondents who
selected the answer “0 – 2 years” were shown an additional question asking if they were familiar
with the operations of their warehouse for the past three years, and those answering negatively
were automatically disqualified from the survey because it covered a three-year period of
warehouse operations. This affected the demographic distribution of respondents to this question
by reducing the share of those who had been responsible for their warehouses for less than 3
years (but had a good knowledge of operations there for the full 3 year period) to 11%. The
largest category of managers (39%) were in charge of their warehouses from 3 to 6 years, the
next largest (30%) – from 7 to 10 years, with the remaining 20% having managerial
responsibility for their warehouses for more than 10 years.
In addition to questions about warehouse managers, the survey collected basic
information about the warehouses as well. The average warehouse employed 45 people not
counting the management, with a standard deviation (SD) of 73, and was operated by the
respondent’s company for 17 years (SD = 14). Over the three years, an average warehouse
experienced a 26% growth of business (SD = 31; the question was in the format of a sliding scale
allowing a decline as well as growth).
For control purposes, the warehouses were split into four categories. When respondents
were involved in more than one type of business, they were asked to indicate the one most
applicable. Fifteen (7%) were for profit third-party logistics providers, 72 (33%) were primarily
manufacturers, 108 (50%) were wholesalers, and 20 (10%) were predominately retailers. In a
binary division by product type, 116 (54%) of the respondents handled primarily industrial
goods, and 99 (46%) dealt in consumer products. Another binary category, type of picking
88
(predominantly by case or predominantly by pallet) resulted in a split of 140 (65%) to 75 (35%),
respectively. As expected, the largest storage category was finished goods (125 warehouses;
58%).
Arguably, the most interesting part of the descriptive statistics of the demographics
section of the survey was the constraint index (CI). Its logarithmic transformation used as a
control variable in a regression of Warehouse capacity and throughput (TOC Outcomes) on its
predictors was statistically significant with a positive coefficient. While it played its intended
role, it is meaningless to interpret a log-transformed control variable. Instead, we offer a brief
discussion of individual constraints data that were used in the construction of the index.
To remind, respondents were asked to identify among six key warehouse resources the
one(s) they were short on in the preceding three years and rate the severity of their constraint on
a 7-point Likert scale, where 7 was the most severe condition. Additionally, respondents had an
option of selecting and rating an “other” resource (as well as identifying it in a conditionally
activated subsequent question). Table 2 illustrates the distribution of the constraint incidence
frequencies and severities among the key warehouse resources.
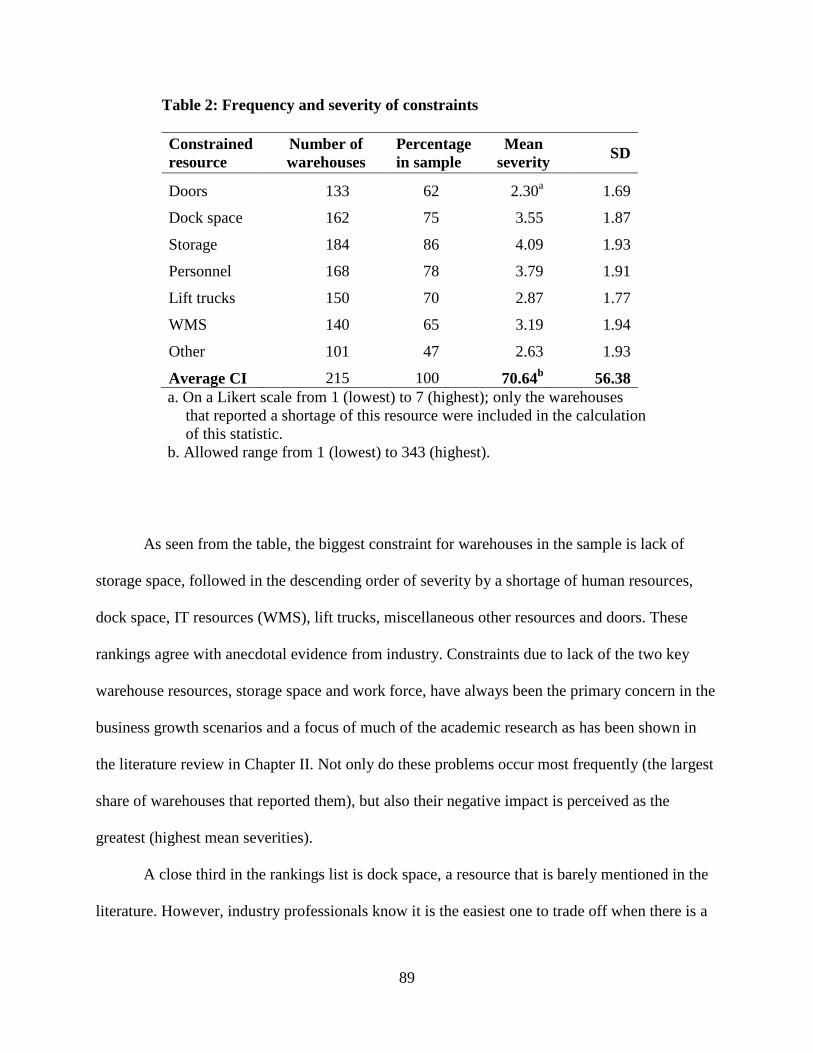
89
Table 2: Frequency and severity of constraints
Constrained resource
Number of warehouses
Percentage in sample
Mean severity SD
Doors 133 62 2.30a 1.69
Dock space 162 75 3.55 1.87
Storage 184 86 4.09 1.93
Personnel 168 78 3.79 1.91
Lift trucks 150 70 2.87 1.77
WMS 140 65 3.19 1.94
Other 101 47 2.63 1.93
Average CI 215 100 70.64b 56.38 a. On a Likert scale from 1 (lowest) to 7 (highest); only the warehouses
that reported a shortage of this resource were included in the calculation of this statistic.
b. Allowed range from 1 (lowest) to 343 (highest).
As seen from the table, the biggest constraint for warehouses in the sample is lack of
storage space, followed in the descending order of severity by a shortage of human resources,
dock space, IT resources (WMS), lift trucks, miscellaneous other resources and doors. These
rankings agree with anecdotal evidence from industry. Constraints due to lack of the two key
warehouse resources, storage space and work force, have always been the primary concern in the
business growth scenarios and a focus of much of the academic research as has been shown in
the literature review in Chapter II. Not only do these problems occur most frequently (the largest
share of warehouses that reported them), but also their negative impact is perceived as the
greatest (highest mean severities).
A close third in the rankings list is dock space, a resource that is barely mentioned in the
literature. However, industry professionals know it is the easiest one to trade off when there is a
90
shortage of storage space by storing some product on the dock. This is likely the reason for its
high spot in the hierarchy of constraints.
At the bottom of the list are doors and miscellaneous other resources. More than half of
the warehouses in the sample reported that they did experience a shortage of doors in the
preceding three years, but the severity of it appears to be very mild. Again, doors were
overlooked in academic research, but the industry evidence shows that it is easy to increase this
resource by simply working overtime or restructuring the shifts (going from one to two, or
switching to a 6- or 7-day working week). This is a trade-off with personnel, the most flexible
warehouse resource.
The respondents’ choices of the miscellaneous “other” category, when examined in detail
through the supporting text, appeared to contain some external constraints as well as many
extensions of the previous six key resources when respondents used it as a way to explain their
problem in more detail. The lack of a common theme in this category is an indirect supporting
evidence of the fact that the six key warehouse resources identified in this study appear to
completely cover the typical constraint problems in a warehouse.
If the “Other” category is excluded from the average warehouse CI, it assumes a value of
65.65 (SD = 51.74), only 5 points below the full CI. While a pairwise t-test of the means was
statistically significant, the replacement of the full CI by the adjusted CI (both in the logarithmic
form) had virtually no effect on the regression results in terms of coefficient of determination,
regression coefficients and t-values significance. The results of this study are reported with the
full CI.
It is also worth noting that in the three-year period an average warehouse reported
experiencing constraints in four different key warehouse resources out of six (Mean = 4.36; SD =
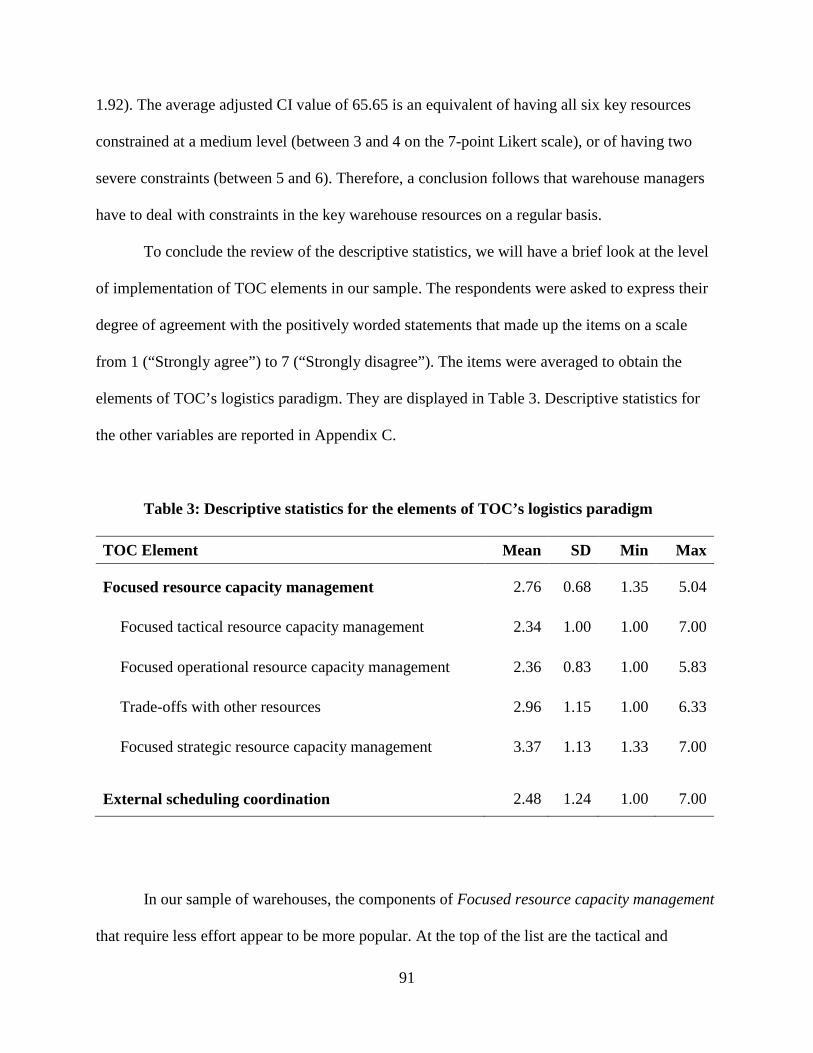
91
1.92). The average adjusted CI value of 65.65 is an equivalent of having all six key resources
constrained at a medium level (between 3 and 4 on the 7-point Likert scale), or of having two
severe constraints (between 5 and 6). Therefore, a conclusion follows that warehouse managers
have to deal with constraints in the key warehouse resources on a regular basis.
To conclude the review of the descriptive statistics, we will have a brief look at the level
of implementation of TOC elements in our sample. The respondents were asked to express their
degree of agreement with the positively worded statements that made up the items on a scale
from 1 (“Strongly agree”) to 7 (“Strongly disagree”). The items were averaged to obtain the
elements of TOC’s logistics paradigm. They are displayed in Table 3. Descriptive statistics for
the other variables are reported in Appendix C.
Table 3: Descriptive statistics for the elements of TOC’s logistics paradigm
TOC Element Mean SD Min Max
Focused resource capacity management 2.76 0.68 1.35 5.04
Focused tactical resource capacity management 2.34 1.00 1.00 7.00
Focused operational resource capacity management 2.36 0.83 1.00 5.83
Trade-offs with other resources 2.96 1.15 1.00 6.33
Focused strategic resource capacity management 3.37 1.13 1.33 7.00
External scheduling coordination 2.48 1.24 1.00 7.00
In our sample of warehouses, the components of Focused resource capacity management
that require less effort appear to be more popular. At the top of the list are the tactical and
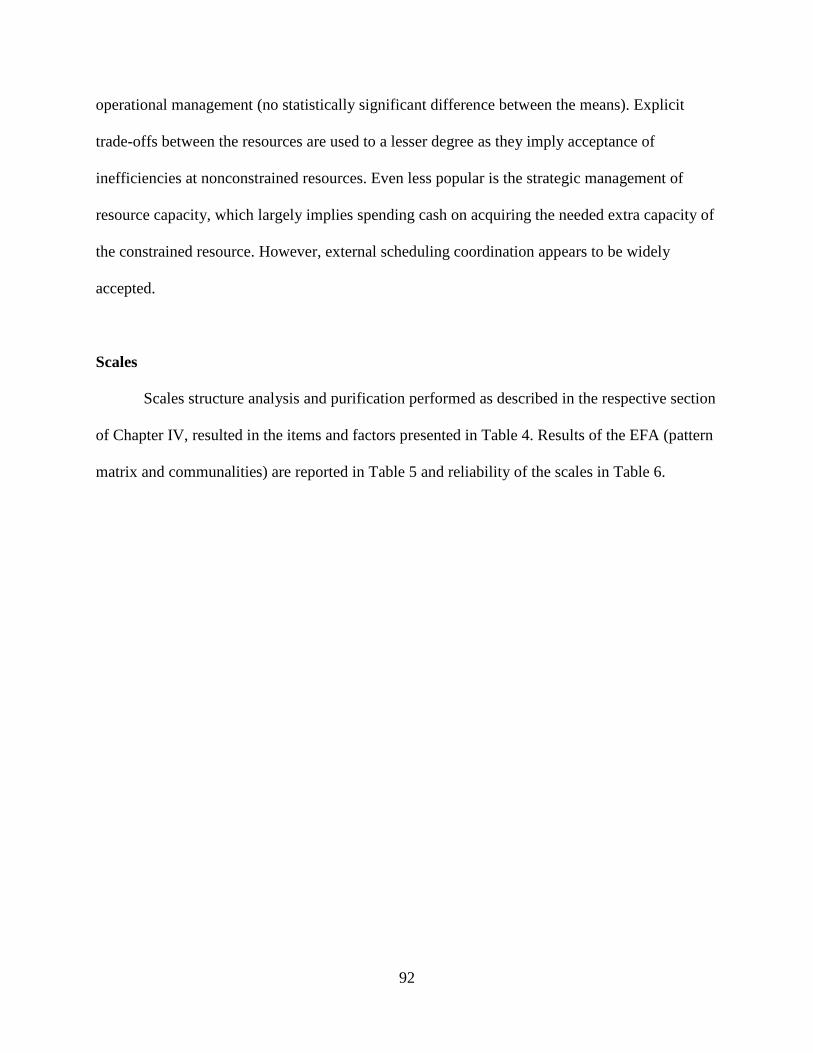
92
operational management (no statistically significant difference between the means). Explicit
trade-offs between the resources are used to a lesser degree as they imply acceptance of
inefficiencies at nonconstrained resources. Even less popular is the strategic management of
resource capacity, which largely implies spending cash on acquiring the needed extra capacity of
the constrained resource. However, external scheduling coordination appears to be widely
accepted.
Scales
Scales structure analysis and purification performed as described in the respective section
of Chapter IV, resulted in the items and factors presented in Table 4. Results of the EFA (pattern
matrix and communalities) are reported in Table 5 and reliability of the scales in Table 6.
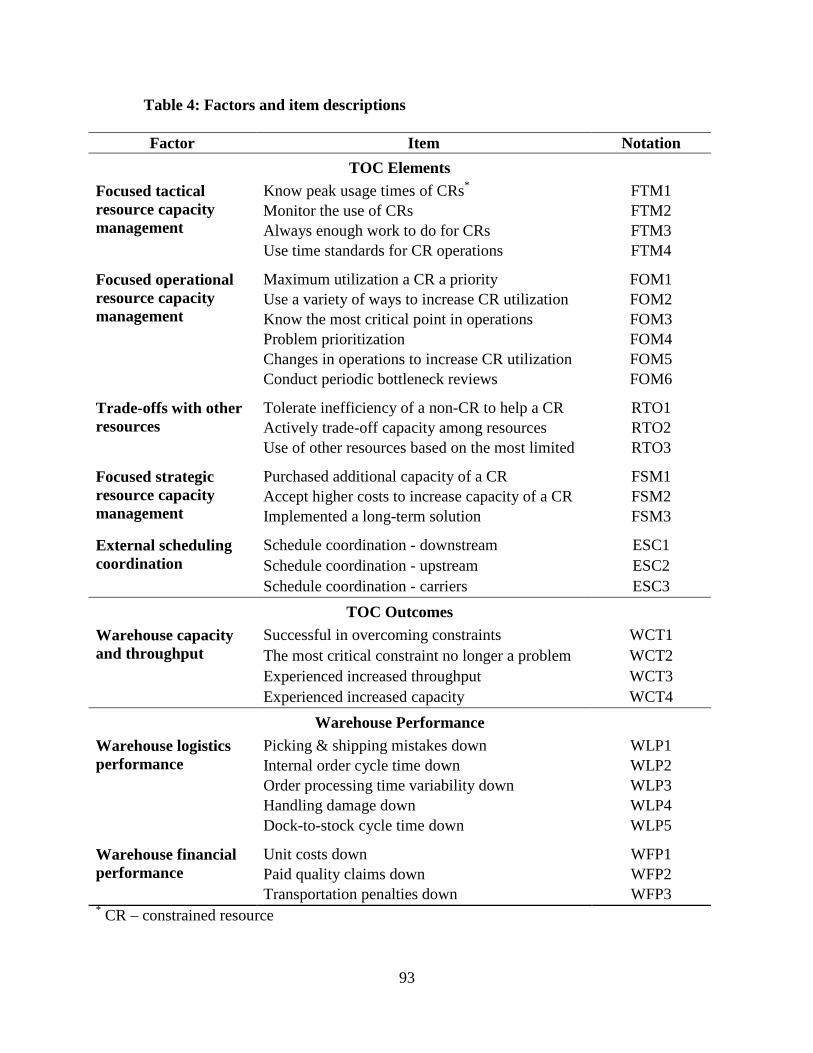
93
Table 4: Factors and item descriptions
Factor Item Notation
TOC Elements
Focused tactical resource capacity management
Know peak usage times of CRs* FTM1 Monitor the use of CRs FTM2 Always enough work to do for CRs FTM3 Use time standards for CR operations FTM4
Focused operational resource capacity management
Maximum utilization a CR a priority FOM1 Use a variety of ways to increase CR utilization FOM2 Know the most critical point in operations FOM3 Problem prioritization FOM4 Changes in operations to increase CR utilization FOM5 Conduct periodic bottleneck reviews FOM6
Trade-offs with other resources
Tolerate inefficiency of a non-CR to help a CR RTO1 Actively trade-off capacity among resources RTO2 Use of other resources based on the most limited RTO3
Focused strategic resource capacity management
Purchased additional capacity of a CR FSM1 Accept higher costs to increase capacity of a CR FSM2 Implemented a long-term solution FSM3
External scheduling coordination
Schedule coordination - downstream ESC1 Schedule coordination - upstream ESC2 Schedule coordination - carriers ESC3
TOC Outcomes
Warehouse capacity and throughput
Successful in overcoming constraints WCT1 The most critical constraint no longer a problem WCT2 Experienced increased throughput WCT3 Experienced increased capacity WCT4
Warehouse Performance
Warehouse logistics performance
Picking & shipping mistakes down WLP1 Internal order cycle time down WLP2 Order processing time variability down WLP3 Handling damage down WLP4 Dock-to-stock cycle time down WLP5
Warehouse financial performance
Unit costs down WFP1 Paid quality claims down WFP2 Transportation penalties down WFP3
* CR – constrained resource
94
Table 5: EFA pattern matrix and communalities
Item FOM WLP FTM WCT ESC RTO FSM WFP Communalities FOM1 .876 .653 FOM2 .800 .685 FOM4 .640 .627 FOM5 .637 .640 FOM3 .618 .688 FOM6 .506 .660 WLP1 .833 .527 WLP2 .793 .604 WLP4 .629 .518 WLP5 .613 .303 .576 WLP3 .550 .652 FTM1 .890 .695 FTM2 .769 .537 FTM4 .699 .580 FTM3 .688 .594 WCT1 .828 .696 WCT3 .750 .791 WCT2 .732 .703 WCT4 .593 .628 ESC1 .899 .758 ESC2 .755 .677 ESC3 .738 .671 RTO1 .795 .609 RTO2 .779 .667 RTO3 .524 .681 FSM1 .741 .500 FSM2 .308 .697 -.303 .549 FSM3 .625 .582 WFP1 .819 .712 WFP2 .629 .689 WFP3 .568 .626
Loadings below .300 not shown. All resulting factors reflective, except ESC, which was later specified as formative. Factor and item labels: FOM Focused operational resource capacity management WLP Warehouse logistics performance FTM Focused tactical resource capacity management WCT Warehouse capacity and throughput ESC External scheduling coordination RTO Trade-offs with other resources FSM Focused strategic resource capacity management WFP Warehouse financial performance
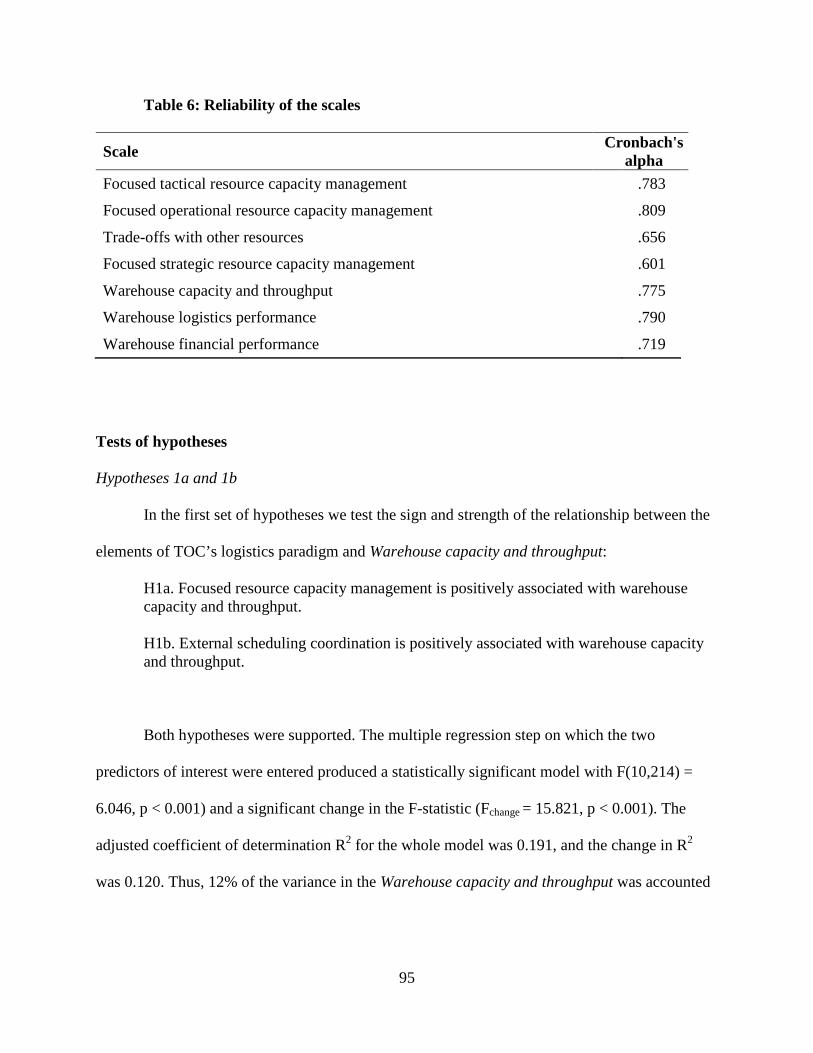
95
Table 6: Reliability of the scales
Scale Cronbach's
alpha Focused tactical resource capacity management .783
Focused operational resource capacity management .809
Trade-offs with other resources .656
Focused strategic resource capacity management .601
Warehouse capacity and throughput .775
Warehouse logistics performance .790
Warehouse financial performance .719
Tests of hypotheses
Hypotheses 1a and 1b
In the first set of hypotheses we test the sign and strength of the relationship between the
elements of TOC’s logistics paradigm and Warehouse capacity and throughput:
H1a. Focused resource capacity management is positively associated with warehouse capacity and throughput. H1b. External scheduling coordination is positively associated with warehouse capacity and throughput.
Both hypotheses were supported. The multiple regression step on which the two
predictors of interest were entered produced a statistically significant model with F(10,214) =
6.046, p < 0.001) and a significant change in the F-statistic (Fchange = 15.821, p < 0.001). The
adjusted coefficient of determination R2 for the whole model was 0.191, and the change in R2
was 0.120. Thus, 12% of the variance in the Warehouse capacity and throughput was accounted
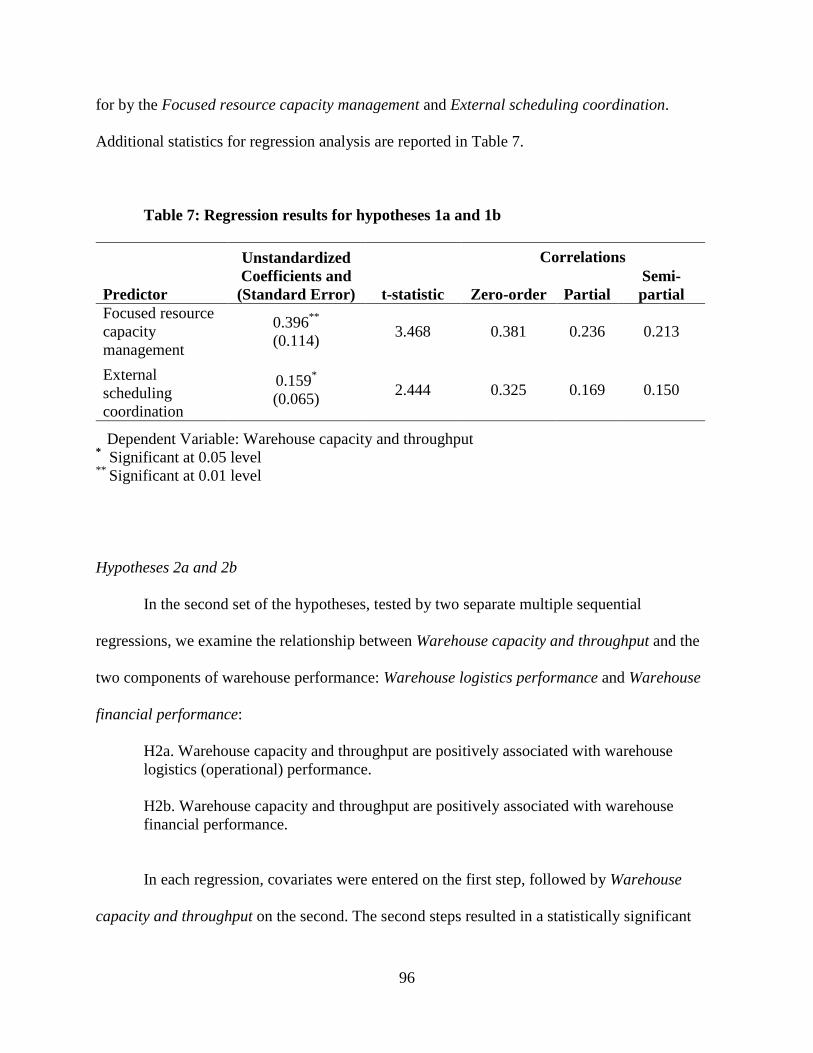
96
for by the Focused resource capacity management and External scheduling coordination.
Additional statistics for regression analysis are reported in Table 7.
Table 7: Regression results for hypotheses 1a and 1b
Unstandardized Coefficients and (Standard Error)
Correlations
Predictor t-statistic Zero-order Partial Semi-partial
Focused resource capacity management
0.396** (0.114)
3.468 0.381 0.236 0.213
External scheduling coordination
0.159* (0.065)
2.444 0.325 0.169 0.150
Dependent Variable: Warehouse capacity and throughput * Significant at 0.05 level ** Significant at 0.01 level
Hypotheses 2a and 2b
In the second set of the hypotheses, tested by two separate multiple sequential
regressions, we examine the relationship between Warehouse capacity and throughput and the
two components of warehouse performance: Warehouse logistics performance and Warehouse
financial performance:
H2a. Warehouse capacity and throughput are positively associated with warehouse logistics (operational) performance. H2b. Warehouse capacity and throughput are positively associated with warehouse financial performance.
In each regression, covariates were entered on the first step, followed by Warehouse
capacity and throughput on the second. The second steps resulted in a statistically significant
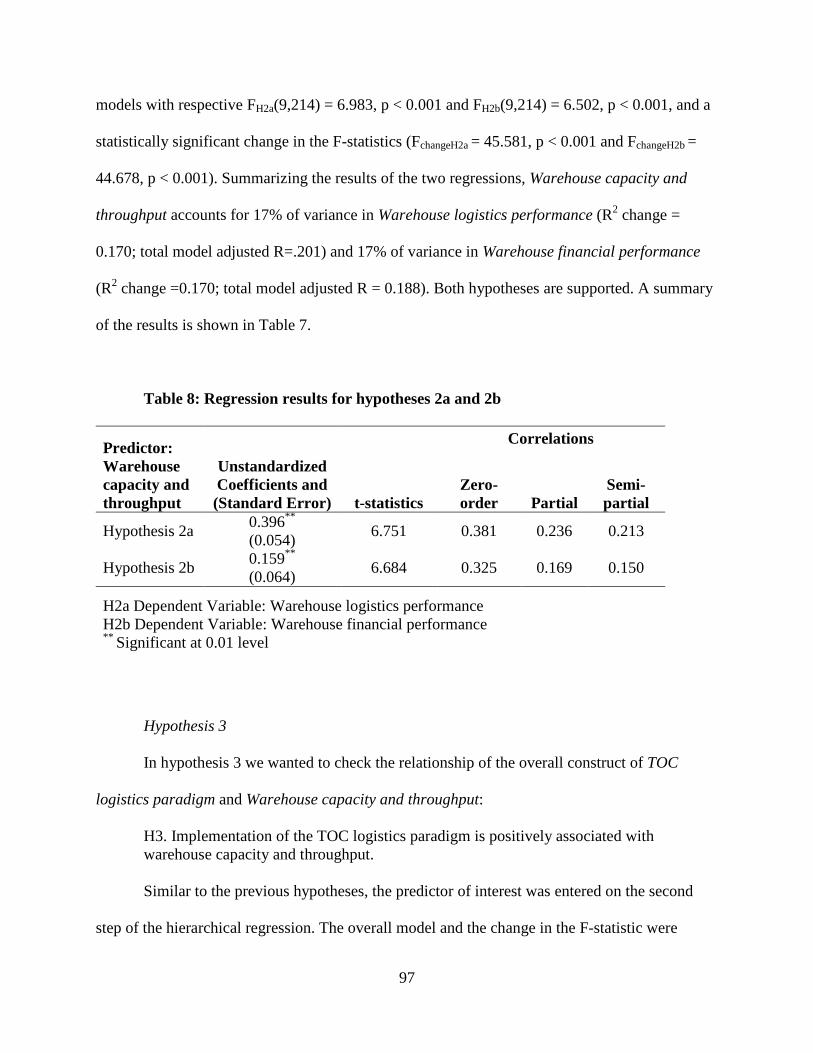
97
models with respective FH2a(9,214) = 6.983, p < 0.001 and FH2b(9,214) = 6.502, p < 0.001, and a
statistically significant change in the F-statistics (FchangeH2a = 45.581, p < 0.001 and FchangeH2b =
44.678, p < 0.001). Summarizing the results of the two regressions, Warehouse capacity and
throughput accounts for 17% of variance in Warehouse logistics performance (R2 change =
0.170; total model adjusted R=.201) and 17% of variance in Warehouse financial performance
(R2 change =0.170; total model adjusted R = 0.188). Both hypotheses are supported. A summary
of the results is shown in Table 7.
Table 8: Regression results for hypotheses 2a and 2b
Predictor: Warehouse capacity and throughput
Unstandardized Coefficients and (Standard Error)
Correlations
t-statistics Zero-order Partial
Semi-partial
Hypothesis 2a 0.396** (0.054)
6.751 0.381 0.236 0.213
Hypothesis 2b 0.159** (0.064)
6.684 0.325 0.169 0.150
H2a Dependent Variable: Warehouse logistics performance H2b Dependent Variable: Warehouse financial performance ** Significant at 0.01 level
Hypothesis 3
In hypothesis 3 we wanted to check the relationship of the overall construct of TOC
logistics paradigm and Warehouse capacity and throughput:
H3. Implementation of the TOC logistics paradigm is positively associated with warehouse capacity and throughput. Similar to the previous hypotheses, the predictor of interest was entered on the second
step of the hierarchical regression. The overall model and the change in the F-statistic were
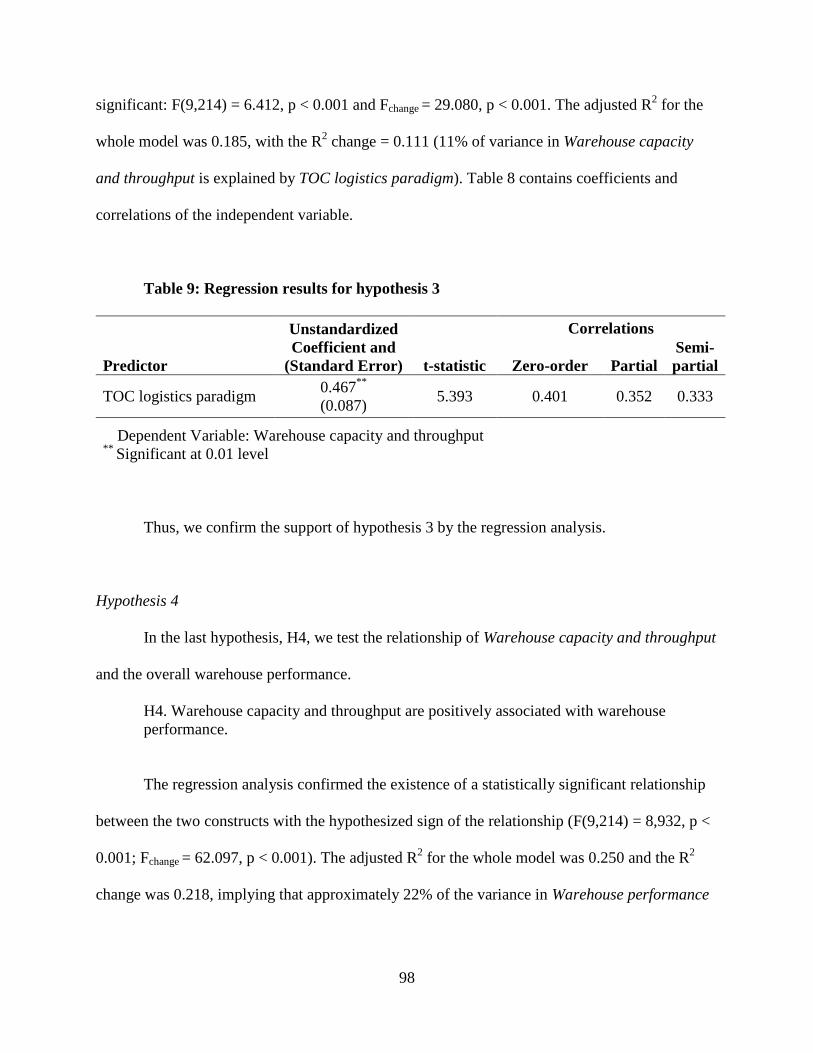
98
significant: F(9,214) = 6.412, p < 0.001 and Fchange = 29.080, p < 0.001. The adjusted R2 for the
whole model was 0.185, with the R2 change = 0.111 (11% of variance in Warehouse capacity
and throughput is explained by TOC logistics paradigm). Table 8 contains coefficients and
correlations of the independent variable.
Table 9: Regression results for hypothesis 3
Unstandardized Coefficient and
(Standard Error)
Correlations
Predictor t-statistic Zero-order Partial Semi-partial
TOC logistics paradigm 0.467** (0.087)
5.393 0.401 0.352 0.333
Dependent Variable: Warehouse capacity and throughput ** Significant at 0.01 level
Thus, we confirm the support of hypothesis 3 by the regression analysis.
Hypothesis 4
In the last hypothesis, H4, we test the relationship of Warehouse capacity and throughput
and the overall warehouse performance.
H4. Warehouse capacity and throughput are positively associated with warehouse performance.
The regression analysis confirmed the existence of a statistically significant relationship
between the two constructs with the hypothesized sign of the relationship (F(9,214) = 8,932, p <
0.001; Fchange = 62.097, p < 0.001). The adjusted R2 for the whole model was 0.250 and the R2
change was 0.218, implying that approximately 22% of the variance in Warehouse performance
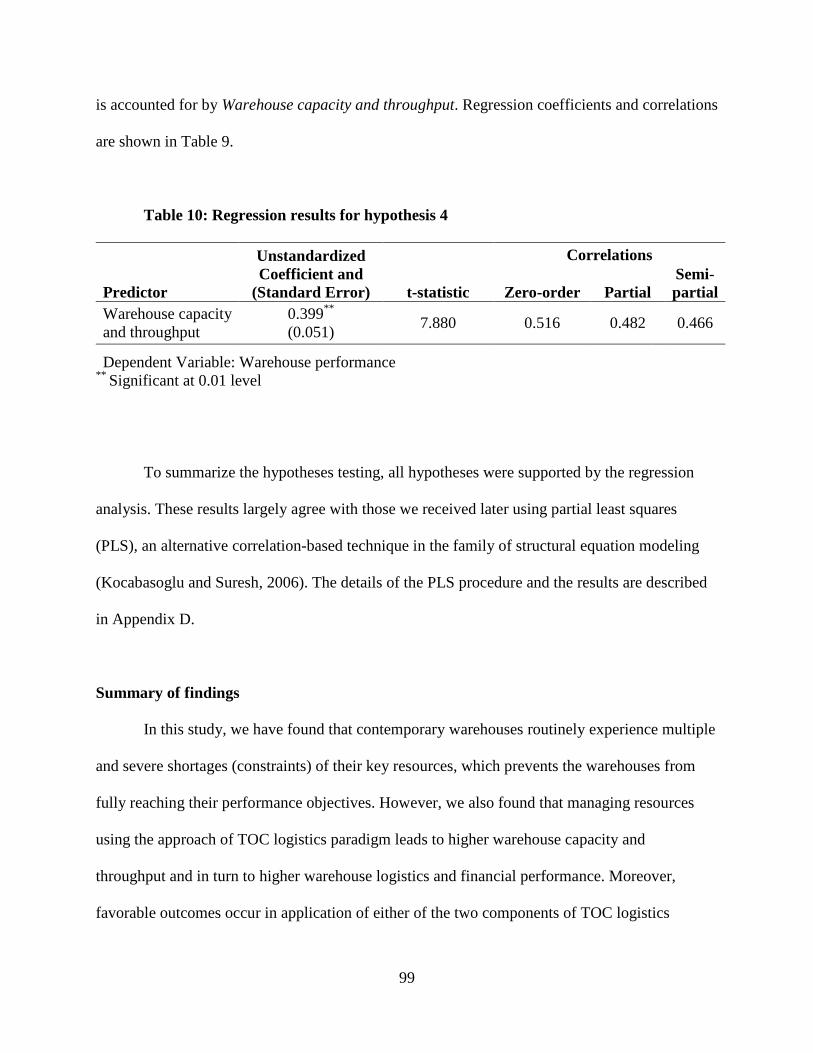
99
is accounted for by Warehouse capacity and throughput. Regression coefficients and correlations
are shown in Table 9.
Table 10: Regression results for hypothesis 4
Unstandardized Coefficient and
(Standard Error)
Correlations
Predictor t-statistic Zero-order Partial Semi-partial
Warehouse capacity and throughput
0.399** (0.051)
7.880 0.516 0.482 0.466
Dependent Variable: Warehouse performance ** Significant at 0.01 level
To summarize the hypotheses testing, all hypotheses were supported by the regression
analysis. These results largely agree with those we received later using partial least squares
(PLS), an alternative correlation-based technique in the family of structural equation modeling
(Kocabasoglu and Suresh, 2006). The details of the PLS procedure and the results are described
in Appendix D.
Summary of findings
In this study, we have found that contemporary warehouses routinely experience multiple
and severe shortages (constraints) of their key resources, which prevents the warehouses from
fully reaching their performance objectives. However, we also found that managing resources
using the approach of TOC logistics paradigm leads to higher warehouse capacity and
throughput and in turn to higher warehouse logistics and financial performance. Moreover,
favorable outcomes occur in application of either of the two components of TOC logistics
100
paradigm: focused resource capacity management and external scheduling coordination. From
the way the conceptual domain of these two components was defined, it follows that
coordination of schedules of operations at the warehouse interfaces with supply chain partners
allows to adjust the inbound and outbound flow of goods to better match the available warehouse
resources, whereas an internal focus on resource constraint elimination at the tactical and
operational levels as well as resources trade-offs and strategic decisions to acquire additional
capacity allows to bring up the capacity of the most constrained resources to the levels where the
whole system capacity and throughput increases to make a significant positive impact on
warehouse performance. The positive effect manifests itself in higher logistics performance
reflected in a decrease of picking and shipping mistakes and handling damage and reduction of
several warehouse cycle metrics (dock-to-stock, internal order, and order variability). The
positive impact also extends to financial performance of the warehouse reflected in decreasing
unit costs and reduction of amounts paid for quality and transportation related claims.
Overall, our research clearly demonstrates that not only TOC can be adapted to a
warehouse setting, but that management of key warehouse resources based on it is a powerful
tool for warehouse management to improve performance of the whole warehouse as a system.
101
CHAPTER VI
CONCLUSIONS
Contributions made by this study
Contributions to theory
One of the most important contributions of this study to theory is a further development
of TOC as a resource management theory and its adaptation to the context of warehousing
operations. This study answers the call for investigation of, “more granular issues regarding the
management and allocation of [supply chain management] resources” (Esper and Crook, 2014).
TOC has been challenged as a theory on the grounds of being built on a computer
algorithm of a very narrow application. The debate over TOC legitimacy as a theory took a
conciliatory turn when the later developed problem solving paradigm of thinking processes (in
1994) received more attention in research and was hailed as the main and most useful part of
TOC (Rahman, 2002). In this study, we take the focus back to the original logistics paradigm of
TOC and rebuild it. We eliminate the temporal, sequential nature of the 5 focusing steps and
recast them and the drum-buffer-rope internal scheduling and buffering technique as a set of
more commonly recognized management constructs without losing the idea of the focus on the
constraint and the hierarchy of their application. The hierarchy is different from the previous
algorithm in that it recognizes the different levels of cost and effort associated with their
application but allows the flexibility to start from any level as well as combine them to achieve a
mix of measures that have the highest likelihood of efficiently eliminating the constraint.
The internal scheduling and buffering technique expectedly blends with the different
levels of focused resource capacity management that is focused on operations inside the
warehouse, but we have identified a construct that impacts the flow of inventory through the
102
warehouse at its interfaces with other supply chain members. Our study shows that coordinating
schedules with upstream shippers, downstream consignees, and carriers helps to alleviate
resource constraints inside the warehouse and in this way to increase warehouse capacity and
throughput. This conclusion also extends to the full logistics paradigm when this construct is
incorporated in it. Thus, our research suggests that when capacity and throughput of a system are
considered its interfaces warrant inclusion in such analysis, and TOC is a theory that allows this
to be done.
The adaptation of TOC we have undertaken in this study and the confirmation we have
received from the empirical results may be considered an answer to the question raised in TOC
literature of whether TOC tools “should be followed ‘blindly’” (Kim et al., 2008, p. 174). Our
effort falls in line with the future research suggestions of Inman et al. (2009) to whose empirical
work we have made comparisons throughout this study. Inman et al. (2009) see TOC as a
constantly evolving entity and suppose that, “the TOC elements or outcomes within the model …
probably should be updated over time” (p. 353).
Contributions to applied research
This study has made several contributions to applied research in warehousing. We
offered a definition, two tests and a list of six key warehouse resources: doors, dock space,
storage, personnel, lift trucks, and WMS. Previous resource classifications in academic literature
did not seem to be based on a single definition or clearly spelled-out logic. Moreover, two of the
resources, doors and dock space were largely ignored. We include them in the list because they
are part of warehouse interface with transportation, the beginning and ending points of
warehouse goods flows that create throughput. Doors and dock space have common
103
characteristics with the other four key warehouse resources mentioned in the key warehouse
resource definition: they are a component of warehouse design or operation, they are not easily
acquirable or modifiable, and their capacity is finite or limited at least in the short term. They
pass both the goods flow impact test and the time-effort-cost tests of a key warehouse resource.
Is the list of six key warehouse resources exhaustive? For most warehouses in the US,
evidence from our study suggests an affirmative answer. The survey responses to the optional
“other” resource choice lacked any common theme and were mostly extensions or specifics of
the previous six. Several respondents mentioned cash or financial resources. However, there are
two types of “cash.” The money required to run a regular warehouse operation does not affect
the product flow directly and is just a necessary condition for an operation, just like electricity.
Prolonged lack of operating cash (e.g., not being able to pay workers’ wages or perform repairs
to forklifts, storage racks or doors) essentially reduces the capacity of the key resources and
makes the whole operation not sustainable. However, the negative effect is indirect, through the
same key warehouse resources.
The other type of financial resources, investment capital for resource capacity upgrades,
falls under focused strategic resource capacity management, and again has only indirect
influence on the warehouse capacity and throughput through the same key warehouse resources.
It is possible to imagine a different context where another resource, pallets or something
else that comes in contact with the goods and is routinely available to most warehouses in the
United States, is in chronic short supply there. But the key warehouse resource definition and the
two tests that we offered should provide the right answer for that context as well.
We believe that this study has made another contribution to warehousing research by
testing and confirming the general TOC model of Inman et al. (2009) developed by them for
104
manufacturing. Our study is not an exact replication of their research. We have changed the
model in two ways: only the logistics paradigm of TOC is examined in our study, but not the
Thinking Processes; and performance is measured at the level of an organizational unit, not the
firm level.
The findings of our study confirm the importance of considering warehouse interface
with supply chain partners when examining antecedents of warehouse capacity and throughput
and ultimately warehouse performance. The confirmation of applicability of TOC to
warehousing and a specific model of how it applies is a contribution to both TOC and
warehousing research.
Contribution to methodology
We believe we have made several contributions to methodology of TOC and supply
chain research by rising to the challenge of, “pairing research methods and research questions in
new ways” (Waller and Fawcett, 2011, p. 209).
There are many TOC case studies, but there are only a handful of empirical papers testing
hypotheses (Kim et al., 2008). Our study is a step on the way to bridge that gap.
The customary tools for warehouse operations research are simulations, which have a
drawback of very limiting assumptions and a very narrow focus (Rouwenhorst et al., 2000),
typically considering one warehouse resource at a time. Our study goes another way. We use a
survey instrument to collect data about traditional warehouse operations. We consider all six key
warehouse resources and view the warehouse as a system allowing flexible internal allocation
and manipulation of resources. We also include outside interfaces of this system in the scope of
this study.
105
In a new approach for TOC empirical research, we have presented several TOC
constructs as formative with a justification for the choice. In contrast to traditional supply chain
literature that typically stays at the level of a whole firm as the smallest unit of research, we
descend to the level of one of its organizational units, while retaining and using all of the
traditional supply chain research perspectives and tools.
Finally, we took extra caution to prevent data from contamination by respondents with
improper attitudes and behaviors toward survey taking. The detailed description of our earnest
effort in this respect may serve as a mini-case example of approaching the issue and the protocol
we developed as a practical tool.
Contributions to practice
Based on this study, we are happy to provide warehouse managers with several pieces of
specific advice that goes beyond very general “managerial implications” often seen in academic
papers. Our advice is presented in the following narration.
Every warehouse can be viewed as a system whose primary dimensions are overall
capacity and throughput. They influence logistics and financial performance of the warehouse.
As operations grow, most warehouses will experience constraints in their operations. The
constraints will limit the system’s throughput and will have a negative effect on overall
warehouse performance. Actively managing available resources will allow to alleviate and
eliminate those constraints. This study suggests that six resources are critical to operations of a
warehouse: doors, dock space, storage capacity, personnel, lift trucks, and WMS. Our research
shows that in a typical warehouse more than one resource may be constrained at the same time,
and some of the constraints may be severe.
106
But the good news is that in the warehouse, TOC works! The adaptation of TOC’s
logistics paradigm in this study presents a particular way of key resource management. The
management philosophy should have a strong focus on constraint elimination. There is a
hierarchy of actions that can be undertaken to overcome the constraint(s). The hierarchy of
actions has several tiers based on the cost and implementation effort, and while the easiest and
least expensive action is the most desirable, it may take a combination of actions from different
levels to overcome the constraint(s). We do not suggest as a requirement following a particular
pattern of action application, i.e., from easiest and cheapest to the most difficult or expensive.
We recognize that the pressure of not meeting the capacity and throughput goals and
jeopardizing overall warehouse performance may call for an immediate “overkill” solution.
However, the manager should be aware of the whole set of tools available to manage resource
capacity.
Focused tactical resource capacity management implies squeezing the most of the
constrained resource within the existing operational process and is usually the task of a foreman
or team leader. It is perceived as a no cost and low effort solution, but the effect may not be
sufficient to overcome the constraint.
Focused operational resource capacity management is a maneuver that may involve a
change in operational processes, resource allocation or a change in internal operations
scheduling. It may take more managerial effort, but still at no or little direct financial cost.
Trade-offs between the resources should be explored. There are many ways to get some
extra capacity of the constrained resource by trading it off with existing resources. This implies
that as part of trade-off some inefficiency or a direct cost of extra capacity in the nonconstrained
resources must be incurred and tolerated as long as this adds capacity in a better (quicker,
107
cheaper) way to the constrained resource. Personnel is believed to be the most flexible
warehouse resource. The anecdotal evidence collected from industry shows that it is normally
easy to get extra lift truck and door time and potentially dock space by asking workers to work
overtime. The extra labor cost incurred is cheaper (at least in the short term) than that of
acquiring an extra lift truck or installing an extra door in the wall (if at all feasible).
In our adaptation of TOC to warehousing, process management should be viewed in the
context of warehouse resource management. For example, a process change allowing picking full
units (e.g., pallets) directly from the reserve is considered a trade-off between labor that is being
freed up and the WMS that will require an upgrade to manage the new process. It is mostly a
matter of activation and training effort if the WMS already possesses this functionality, but there
may be a direct cost if the upgrade needs to be purchased. Again, the cost incurred is not in the
resource whose capacity is being freed up.
A strategic decision may be made to directly acquire (purchase, lease, rent, hire, transfer
from another unit of the firm) additional capacity of the constrained resource. This is the essence
of the focused strategic resource capacity management. Capacity of some resources may be
easier to increase compared to others. Hiring an extra person is usually easier than making more
doors, getting more storage capacity or migrating to an advanced WMS. Nevertheless, all these
actions are viewed as a strategic decision to add capacity directly and they may be the best
choice under certain circumstances.
The previous actions were focused on operations inside the warehouse. One additional
option that may be available to warehouse managers is to coordinate product flow at warehouse
interfaces with supply chain partners to better utilize the most constrained resources (to avoid
idle time and to smooth peaks).
108
Conclusion
This study has revealed the mechanisms of how the adjusted TOC’s logistics paradigm
can be used to address resource constraints in operations inside the warehouse and its physical
interfaces. Another major component of TOC, Thinking Processes (TP), was specifically
designed to apply to nonphysical and external constraints (such as company policies and market
conditions) (Rahman, 2002; Simatupang et al., 2004). TP is very broad in scope by design and
has been praised over the logistics paradigm because of that (Rahman, 2002). By transforming
the logistics paradigm we have increased its potential. The transformed logistics paradigm can
now be used broadly, on the par with TP, and its constructs are suitable for survey-based
empirical research. Together, TOC’s two paradigms present an outstanding opportunity for
research and practice.
Limitations
This study has a number of limitations. One comes from the use of the survey method.
Surveys are known to introduce bias. Electronic surveys may introduce additional bias (Boyer et
al., 2001). We have taken many precautionary measures to minimize it, yet we cannot guarantee
its absence.
Since few scales were available for us to use as is in this study, and only some of the
items borrowed from the previous research fit out study, we had to substantially modify the
existing scales and develop new scales and indexes. The reliability of some of the scales, while
above the minimum cutoff level, was lower than in the comparable study of Inman et al. (2009).
109
Our study was relatively narrow in scope. We examined only one component of TOC –
its logistics paradigm. Some of the constructs we used were also narrow in scope (i.e., warehouse
financial performance and external scheduling coordination).
Future research
Some of the suggestions for future research come from the limitations of this study. One
direction is expanding the scope of TOC warehousing research. Thinking Processes, the problem
solving paradigm, could be tested together with a replication of the logistics paradigm test to
empirically prove our proposition that the whole TOC is applicable to warehousing. The
boundaries of TOC application to warehousing can be tested on subsamples from warehouses
with high shares of cross-docking or automation.
For example, Vogt and Pienaar (2007) note that in the warehouses where cross-docking is
treated as a warehouse extension, the cross-docking operation competes for the same warehouse
resources, and is typically not very efficient. On the other hand, a properly organized cross-
docking operation integrated into its supply chain is conducive to the application of TOC (Vogt
and Pienaar, 2007).
We relied on self-reported performance measures. Some further scale development work
can be done to improve the scales used in this study. It is also of definite value to conduct a
comparable study relying on objective performance data, despite the challenges of big diversity
in warehousing operations.
We have mentioned before that our research design was largely influenced by prior work
of Inman et al. (2009). It primarily sought to examine the more general relationships between
TOC constructs and performance. A more granular view of individual constructs is also a logical
110
extension of our research. For example, individual trade-offs may be considered between
different resources, and their impact on constraint elimination may be evaluated separately.
Alternatively, the new construct of external scheduling coordination that was limited to
physical goods flow coordination at warehouse external interfaces may be raised in scope to the
level of all types of supply chain partner coordination traditionally considered in supply chain
research. The cooperation with direct effect on capacity of warehouse resources may include
activities associated with information sharing and cooperative planning, forecasting and
replenishment (CPFR) as well as joint work to find win-win solutions for the whole supply
chain, examples of which may include shifting order cutoff times for early picking operation
start, switching from trailer floor loading to palletized freight, picking in larger units, optimizing
order types and frequencies, etc.
The condition of being constrained in one or more warehouse resources can be explored
in more detail. Answers should be found to the questions about its moderating effect, if any, on
the efficacy of particular levels of focused resource capacity management.
Other research questions and methods may offer a completely new perspective on the
place of TOC in warehousing. Qualitative methods may provide deeper insights into issues of
warehouse resource management. Differences in propensity of warehouse managers to favor
some TOC elements over others based on organizational and national cultures may provide
another avenue for warehouse-focused TOC research effort. Behavioral aspects largely ignored
in operations research hold a big potential for future academic quest for a full spectrum of factors
underlying warehouse operations management.
111
REFERENCES
Ackerman, Kenneth B. 1999. Designing tomorrow's warehouse: A little ahead of the times. Journal of Business Logistics 20: 1-4.
Ashayeri, Jalal, and R.C. de Booy. 2008. Workload balancing based warehouse management in a Central European distribution center. In: Progress in Material Handling Research: 2008. The Material Handling Institute, Charlotte, NC: 1-20.
Ashayeri, Jalal, and L.F. Gelders. 1985. Warehouse design optimization. European Journal of Operational Research 21 (3): 285-94.
Autry, Chad W., and Patricia J. Daugherty. 2003. Warehouse operations employees: Linking person-organization fit, job satisfaction, and coping responses. Journal of Business Logistics 24 (1) 171-98.
Autry, Chad W., Stanley E. Griffis, Thomas J. Goldsby, and L. Michelle Bobbitt. 2005. Warehouse management systems: Resource commitment, capabilities, and organizational performance. Journal of Business Logistics 26 (2): 165-82.
Bagozzi, Richard P. 1994. Structural equation models in marketing research: Basic principles. In: R. Bagozzi, ed., Principles of Marketing Research, Oxford: Blackwell, 317-85.
Baker, Peter. 2007. An exploratory framework of the role of inventory and warehousing in international supply chains. International Journal of Logistics Management 18 (1): 64-80.
Baker, Peter, and Marco Canessa. 2009. Warehouse design: A structured approach. European Journal of Operational Research 193 (2): 425-36.
Barney, Jay. 1991. Firm resources and sustained competitive advantage. Journal of Management 17 (1): 99-120.
Barney, Jay, Mike Wright, and David J. Ketchen, Jr. 2001. The resource-based view of the firm: Ten years after 1991. Journal of Management 27: 625-41.
Bartholdi, John J., and Kevin R. Gue. 2000. Reducing labor costs in an LTL crossdocking terminal. Operations Research 48 (6): 823-32.
Bassan, Yoseph, Yaakov Roll, and Meir J. Rosenblatt. 1980. Internal layout design of a warehouse. AIIE Transactions 12 (4): 317-22.
Becker, Jan-Michael, Kristina Klein, and Martin Wetzels. 2012. Hierarchical latent variable models in PLS-SEM: Guidelines for using reflective-formative type models. Long Range Planning 45: 359-94.
112
Berry, J. R. 1968. Elements of warehouse layout. International Journal of Production Research 7 (2): 105-21.
Bollen, Kenneth, and Richard Lennox. 1991. Conventional wisdom on measurement: A structural equation perspective. Psychological Bulletin 110 (2): 305-14.
Bosnyak, Michael, and Tracy L. Tuten. 2001. Classifying response behaviors in Web-based surveys. Journal of Computer-Mediated Communication 6 (3), retrieved July 15, 2014, from http://0-onlinelibrary.wiley.com.library.uark.edu/ enhanced/doi/ 10.1111/j.1083-6101.2001.tb00124.x/
Boyd, Lynn, and Mahesh Gupta. 2004. Constraints management: what is the theory? International Journal of Production Research 24 (4): 350-71.
Boyer, Kenneth K., John R. Olson, and Eric C. Jackson. 2001. Electronic surveys: Advantages and disadvantages over traditional print surveys. Decision Line 32 (4): 4-7.
Bozer, Yavuz Ahmet. 1985. Optimizing throughput performance in designing order picking systems. Ph D Thesis. Georgia Institute of Technology, Atlanta, GA.
Bramorski, T., Madan, M.S., and Motwani, J. 1997. Application of the theory of constraints in banks. The Bankers Magazine, Jan-Feb: 53-9.
Bureau of Labor Statistics website: http://www.bls.gov/iag/tgs/iag493.htm, accessed February 15, 2014.
Christofides, Nicos, and I. Colloff. 1973. The rearrangement of items in a warehouse. Operations Research 21 (2): 577-89.
Churchill, Gilbert A. 1979. A paradigm for developing better measures of marketing constructs. Journal of Marketing Research 16 (1): 64-73.
Clark, Lee Anna, and David Watson. 1995. Constructing validity: Basic issues in objective scale development. Psychological Assessment 7 (3): 309-19.
Cormier, Gilles, and Eldon A. Gunn. 1992. A review of warehouse models. European Journal of Operational Research 58 (1): 3-13.
Cormier, Gilles, and Eldon A. Gunn. 1996. Simple models and insights for warehouse sizing. Journal of the Operational Research Society 47 (5): 690-6.
Cormier, Gilles, and Eldon A. Gunn. 1999. Modeling and analysis for capacity expansion planning in warehousing. Journal of the Operational Research Society 50 (1): 52-9.
Craighead, Christopher W., David J. Ketchen, Jr., Kaitlin S. Dunn, and G. Tomas M. Hult. 2011. Addressing common method variance: Guidelines for survey research on information
113
technology, operations, and supply chain management. IEEE Transactions on Engineering Management 58 (3): 578-88.
CSCMP. 2010. Suggested Minimum Supply Chain Benchmarking Standards. Chicago, IL: Council of Supply Chain Management Professionals and Supply Chain Visions, Ltd.
CSCMP. 2013. CSCMP’s Annual State of Logistics Report. Chicago, IL: Council of Supply Chain Management Professionals.
Dadzie, Kofi Q, and Wesley J. Johnston. 1991. Innovative automation technology in corporate warehousing logistics. Journal of Business Logistics 12 (1): 63-82.
Delaney, Robert V. 1992. Third annual “State of logistics report”. National Press Club, Washington DC, 15 June 1992.
Demmy, Steven W., and Arthur B. Petrini. 1992. The theory of constraints: A new weapon for depot maintenance planning and control. Air Force Journal of Logistics 16 (3): 6-11.
Dess, Gregory G., and Richard B. Robinson, Jr. 1984. Measuring organizational performance in the absence of objective measures: The case of the privately-held firm and conglomerate business unit. Strategic Management Journal 5 (3): 265-73.
Diamantopoulos, Adamantios, and Heidi M. Winklhofer. 2001. Index construction with formative indicators: An alternative to scale development. Journal of Marketing Research 38 (2): 269-77.
Ellis, Kimberly, Russel D. Meller, Joseph H Wilck, IV, Pratick J. Parikh, and Franky Marchand. 2008. Analysis and improvement of material flow for Volvo truck assembly operations. In: Progress in material handling research: 2008. The Material Handling Institute, Charlotte, NC: 95-127.
Elton, Jeffrey, and Justin Roe. 1998. Bringing discipline to project management. Harvard Business Review 76 (2): 153-9.
Esper, Terry L., and T. Russel Crook. 2014. Supply chain resources: advancing theoretical foundations and constructs. Editorial, Journal of Supply Chain Management 50 (3): 3-5.
Evans, Joel R., and Anil Mathur. 2005. The value of online surveys. Internet Research 15 (2): 195-219.
Faber, Nynke, René (Marinus) B.M. de Koster, and Steef L. van de Velde. 2002. Linking warehouse complexity to warehouse planning and control structure: An exploratory study of the use of warehouse management information systems. International Journal of Physical Distribution and Logistics Management 32 (5): 381-95.
114
Fawcett, Stanley E., Roger Calantone, and Sheldon R. Smith. 1996. An investigation of the impact of flexibility on global reach and firm performance. Journal of Business Logistics 17 (2): 167-96.
Fawcett, Stanley E., and Matthew A. Waller. 2011. Moving the needle: Making a contribution when the easy questions have been answered. Journal of Business Logistics 32 (4): 291-5.
Frazelle, Edward H. World-class warehousing and material handling. 2002. McGraw-Hill, Inc.
Freeze, Ronald D., and Raschke, Robyn L. 2007. An assessment of formative and reflective constructs in IS research. Proceedings of the 15th European Conference on Information Systems (ECIS2007), St. Gallen, Switzerland.
Fugate, Brian S., John T. Mentzer, and Theodore P. Stank (2010), “Logistics Performance: Efficiency, Effectiveness, and Differentiation,” Journal of Business Logistics, 31 (1): 43-62.
Galbreth, Michael R., James A. Hill, and Sean Handley. 2008. An investigation of the value of cross-docking for supply chain management. Journal of Business Logistics. 29 (1): 225-39.
Gardiner, Stanley C., John H. Blackstone, Jr., and Lorraine R. Gardiner. 1994. The evolution of the theory of constraints. Industrial Management 36 (3): 13-6.
Gerbing, David W., and James C. Anderson. 1988. An updated paradigm for scale development incorporating unidimensionality and its assessment. Journal of Marketing Research 25 (2): 186-92.
Geri, Nitza, and Ahituv, Niv. 2008. A Theory of Constraints approach to interorganizational systems implementation. Information systems and e-Business Management 6 (4): 341-60.
Goetschalckx, Marc, and H. Donald Ratliff. 1988. Order picking in an aisle. IIE Transactions 20 (1) (Mar 1988): 53-62.
Goetschalckx, Marc, and H. Donald Ratliff. 1991. Optimal lane depths for single and multiple products in block stacking storage systems. IIE Transactions 23 (3): 245-58.
Goldratt, Eliyahu M. 1988. Computerized shop floor scheduling. International Journal of Production Research 26 (3): 443-55.
Goldratt, Eliyahu, M. 1990. What is this thing called theory of constraints and how it should be implemented? Croton-on-Hudson, New York: North-River Press.
Goldratt, Eliyahu M. 1994. It's not luck. Great Barrington, MA: North River Press.
Goldratt, Eliyahu M., and Jeff Cox. 1986. The goal: a process of ongoing improvement. New York: North River Press.
115
Goldratt, Eliyahu, M., and Robert E. Fox. 1986. The race. Croton-on-Hudson, New York: North-River Press.
Goldsby, Thomas J., Katrina Savitskie, Theodore P. Stank, and Shawnee K. Vickery. Web-based surveys: Reaching potential respondents online. Decision Line 32 (2), 4-6.
Gu, Jinxiang, Marc Goetschalckx, and Leon F. McGinnis. 2007. Research on warehouse operation: A comprehensive review. European Journal of Operational Research 177 (1): 1-21.
Gu, Jinxiang, Marc Goetschalckx, and Leon F. McGinnis. 2010. Research on warehouse design and performance evaluation: A comprehensive review. European Journal of Operational Research 203 (3) (Jun 16, 2010): 539-49.
Gue, Kevin R. 1999. The effects of trailer scheduling on the layout of freight terminals. Transportation Science 33 (4): 419-28.
Gue, Kevin R., and Russell D. Meller. 2009. Aisle configurations for unit-load warehouses. IIE Transactions 41 (3): 171-82.
Gupta, Mahesh, and Lynn H. Boyd. 2008. Theory of constraints: A theory for operations management. International Journal of Operations and Productions Management 28 (10): 991-1012.
Gupta, Sanjeev. 1997. Supply chain management in complex manufacturing. IIE Solutions 29 (3), 18-23.
Hackman, Steven T., Edward H. Frazelle, Paul M. Griffin, and Dimitra A. Vlasta. 2001. Benchmarking Warehousing and Distribution Operations: An Input-Output Approach. Journal of Productivity Analysis 16: 79-100.
Hackman, Steven T., Meir J. Rosenblatt, and John M. Olin. 1990. Allocating items to an automated storage and retrieval system. IIE Transactions 22 (1): 7-14.
Haenlein, Michael, and Andreas M. Kaplan. 2004. A beginner’s guide to partial least squares analysis. Understanding Statistics 3 (4): 283-97.
Hair, Joseph F., Rolph E. Anderson, Ronald L. Tatham, and William C. Black. 1998. Multivariate data analysis. 5th ed., Upper Saddle River, NJ: Prentice Hall.
Hair, Joseph F., et al. 2009. Multivariate data analysis. 7th ed. Upper Saddle River, NJ: Prentice Hall.
Heragu, Sunderesh S., L. Du, Ronald J. Mantel, and Peter C. Schuur. 2005. Mathematical model for warehouse design and product allocation. International Journal of Production Research 43 (2): 327-38.
116
Heskett, James L. 1963. Cube-Per-Order Index: A Key to Warehouse Stock Location. Transportation and Distribution Management 3: 27-31.
Hurley, Amy E., Terri A. Scandura, Chester A. Schriesheim, Michael T. Brannick, Anson Seers, Robert J. Vandenberg, and Larry J. Williams. 1997. Exploratory and confirmatory factor analysis: Guidelines, issues, and alternatives. Journal of Organizational Behavior 18: 667-83.
Inman, R. Anthony, Martha L. Sale, and Kenneth W. Green, Jr. 2009. Analysis of the relationships among TOC use, TOC outcomes, and organizational performance. International Journal of Operations & Production Management 29 (4): 341-56.
Iyengar, Deepak, Shashank Rao, and Thomas Goldsby. 2012. The power and centrality of the transportation and warehousing sector within the US economy: A longitudinal exploration using social network analysis. Transportation Journal 51 (4): 373-98.
Janea, Chin-Chia and Yih-Wenn Laihb. 2005. A Clustering Algorithm for Item Assignment in a Synchronized Zone Order Picking System. European Journal of Operational Research, 166 (2): 489–96.
Jarvis, Cheryl Burke, Scott B. MacKenzie, and Philip M. Podsakoff. 2003. A critical review of construct indicators and measurement model misspecification in marketing and consumer research. Journal of Consumer Research 30 (2): 199-218.
Kallina, Carl and Jeffrey Lynn. 1976. Application of the Cube-Per-Order Index Rule for Stock Location in a Distribution Warehouse. Interfaces, 7 (1): 37-46.
Keller, Scott B., and Brian C. Keller. 2014. The definitive guide to warehousing. Council of Supply Chain Management Professionals.
Keller, Scott B., Katrina Savitskie, Theodore P. Stank, Daniel F. Lynch, and Alexander E. Ellinger. 2002. A summary and analysis of multi-item scales used in logistics research. Journal of Business Logistics 23 (2): 83-119.
Keller, Scott B., Kimberly Hochard, Thomas Rudolph, and Meaghan Boden. 2013. A compendium of multi-item scales utilized in logistics research (2001-10): Progress achieved since publication of the 1973-2000 compendium. Journal of Business Logistics 34 (2): 85-93.
Kelloway, E. Kevin. 1995. Structural equation modelling in perspective. Journal of Organizational Behavior 16 (3): 215-24.
Kiefer, Allen W., and Robert A. Novack. 1999. An empirical analysis of warehouse measurement systems in the context of supply chain implementation. Transportation Journal 38 (3): 18-27.
117
Kim, Seonmin, Victoria Jane Mabin, and John Davies. 2008. The theory of constraints thinking processes: Retrospect and prospect. International Journal of Operations & Production Management 28 (2): 155-84.
Kline, Rex B. 2005. Principles and practice of structural equation modeling. 2nd ed. New York – London: The Guilford Press.
Kocabasoglu, Canan, and Nallan C. Suresh. 2006. Strategic sourcing: An empirical investigation of the concept and its practices in U.S. manufacturing firms. Journal of Supply Chain Management 42 (2): 4-16.
Kontan, Joseph A., B. R. Simon Rosser, Michael W. Ross, Jeoffrey Stanton, and Weston M. Edwards. 2005. The story of Subject Naught: A cautionary but optimistic tale of internet survey research. Journal of Computer-Mediated Communication 10 (2), retrieved July 14, 2014 from http://onlinelibrary.wiley.com/enhanced/doi/10.1111/j.1083-6101.2005.tb00248.x/
Krauth, Elfriede, Hans Moonen, Viara Popova, and Martijn Schut. 2005. Performance indicators in logistics service provision and warehouse management – a literature review and framework. EurOMA International Conference June 19, 2005: 19-22.
La Londe, Bernard J., and Arnold B. Maltz. 1992. Some propositions about outsourcing the logistics function. International Journal of Logistics Management 3 (1): 1-11.
Lambert, Douglas. 1994. Logistics cost, productivity, and performance analysis. In: ed. P. Robeson and W. Copacino, The Logistics Handbook, New York: The Free Press: 261-302.
Larson, T. Nick, Heather March, and Andrew Kusiak. 1997. A heuristic approach to warehouse layout with class-based storage. IIE Transactions 29 (4): 337-48.
Lippman, Steven A., and Richard P. Rumelt. 2003. A bargaining perspective on resource advantage. Strategic Management Journal 24: 1069-86.
Luebbe, Richard, and Byron Finch. 1992. Theory of constraints and linear programming: A comparison. International Journal of Production Research 30 (6): 1471-8.
Mabin, Victoria J., and Steven J. Balderstone. 2003. The performance of the theory of constraints methodology. International Journal of Operations and Productions Management 23 (6): 568-95.
MacCallum, Robert C., and Michael W. Browne. 1993. The use of causal indicators in covariance structure models: Some practical issues. Psychological Bulletin 114 (3): 533-41.
MacKenzie, Scott B., Philip Podsakoff, and Cheryl Burke Jarvis. 2005. The problem of measurement model misspecification in behavioral and organizational research and some recommended solutions. Journal of Applied Psychology 90 (4): 710-30.
118
Maltz, Arnold B. 1994. The relative importance of cost and quality in the outsourcing of warehousing. Journal of Business Logistics 15 (2): 45-62.
Marsh, WH. 1979. Elements of block storage design. International Journal of Production Research 17 (4): 377-94.
Material Handling & Logistics U.S. Roadmap. 2014. Chicago, IL: Council of Supply Chain Management Professionals.
McGinnis, Michael A., Roger W. Carlson, Lisa Forry, and Lisa Fong. 1987. Competitive pressures and emerging strategies in public warehousing. Transportation Journal (26) 4: 43-53.
McGinnis, Michael A., and Jonathan W. Kohn. 1988. Warehousing, competitive advantage, and competitive strategy. Journal of Business Logistics 9 (2): 32-54.
McGinnis, Michael A., Jonathan W. Kohn, and Mary D. Myers. 1990. Private warehouse investment strategies. Transportation Journal 29 (4): 11-7.
Min, Hokey. 2007. Examining sources of warehouse employee turnover. International Journal of Physical Distribution & Logistics Management 37 (5): 375-88.
Min, Hokey. 2009. Application of a decision support system to strategic warehousing decisions. International Journal of Physical Distribution & Logistics Management 39 (4): 270-81.
Min, Soonhong, and John T. Mentzer. 2004. Developing and measuring supply chain management concepts. Journal of Business Logistics 25 (1): 63-99.
Moder, JJHM, and HM Thornton. 1965. Quantitative analysis of the factors affecting floor space utilization of palletized storage. Journal of Industrial Engineering 16 (1): 8-18.
Moss, Holly K. 2007. Improving service quality with the theory of constraints. Journal of Academy of Business Economics 7 (3): 45-66.
Murphy, Paul R., and Richard F. Poist. 1992. Managing the human side of public warehousing: An overview of modern practices. Transportation Journal 31 (3): 54-62.
Murphy, Paul R., and Richard F. Poist. 1993. In search of warehousing excellence: A multivariate analysis of HRM practices. Journal of Business Logistics 14 (2): 145-64.
Öztürkoğlu, Ömer, Kevin R. Gue, and Russell D. Meller. 2012. Optimal unit-load warehouse designs for single-command operations. IIE Transactions 44 (6): 459-75.
Pandit, R., and U.S. Palekar. 1993. Response time considerations for optimal warehouse layout design. Journal of Engineering for Industry 115 (3): 322-8.
119
Park, Young H., and Dennis B. Webster. 1989. Modelling of three-dimensional warehouse systems. International Journal of Production Research 27 (6): 985-1003.
Perez, J. L. 1997. TOC for world class global supply chain management. Computers & Industrial Engineering 33 (1), 289-93.
Peschke, Richard E. 2001. Resource capacity and the theory of constraints. 2001 APICS Constraints Management Technical Conference Proceedings, March 19-20, 2001, San Antonio, TX: 49-51.
Pliskin, Joseph S., and Dov Dori. 1982. Ranking alternative warehouse area assignments: A multiattribute approach. IIE Transactions 14 (1): 19-26.
Posakoff, Philip M., Scott B. MacKenzie, Jeong-Yeon Lee, and Nathan P. Podsakoff. 2003. Common method biases in behavioral research: A critical review of the literature and recommended remedies. Journal of Applied Psychology 88 (5): 879-903.
Polito, Tony, Kevin Watson, and Robert J. Vokurka. 2006. Using the theory of constraints to improve competitiveness: An airline case study. Competitiveness Review: An International Business Journal Incorporating Journal of Global Competitiveness 16 (1): 44-50.
Porter, Michael E. 1985. Competitive advantage. New York, NY: The Free Press.
Rahman, Shams-ur. 1998. Theory of constraints: A review of the philosophy and its applications. International Journal of Operations & Production Management 18 (4): 336-55.
Rahman, Shams-ur. 2002. The theory of constraints' thinking process approach to developing strategies in supply chains. International Journal of Physical Distribution & Logistics Management 32 (9/10): 809-28.
Raney, Mark A., and Clyde Kenneth Walter. 1992. Electronic data interchange: The warehouse and supplier interface. International Journal of Physical Distribution and Logistics Management 22 (8): 21-6.
Reid, Richard A. 2007. Applying the TOC five-step focusing process in the service sector. A banking subsystem. Managing Service Quality 17 (2): 209-234.
Reinartz, Werner, Michael Haenlein, and Jörg Henseler. 2009. An empirical comparison of the efficacy of covariance-based and variance-based SEM. International Journal of Research in Marketing 26: 332-44.
Rogers, Dale S., Patricia J. Daugherty, and Alexander E. Ellinger. 1996. The relationship between information technology and warehousing performance. The Logistics and Transportation Review 32 (4): 409-22.
120
Roll, Yaakov, and Meir J. Rosenblatt. 1983. Random versus grouped storage policies and their effect on warehouse capacity. Material Flow 1 (3): 199-205.
Rosenblatt, Meir J., and Yaakov Roll. 1984. Warehouse design with storage policy considerations. International Journal of Production Research 22 (5): 809-21.
Rosenblatt, Meir J., and Yaakov Roll. 1988. Warehouse capacity in a stochastic environment. International Journal of Production Research 26 (12): 1847-51.
Rouwenhorst, B., B. Reuter, V. Stockrahm, G. J. van Houtum, R. J. Mantel, and W. H. M. Zijm. 2000. Warehouse design and control: Framework and literature review. European Journal of Operational Research 122 (3) (May 1, 2000): 515-33.
Roybal, H., S. Baxendale, and M. Gupta. 1999. Using activity-based costing and theory of constraints to guide continuous improvement in managed care. Managed Care Quarterly 7 (1): 1-10.
Sadiq, Malik, Thomas L. Landers, and G. Don Taylor. 1996. An assignment algorithm for dynamic picking systems. IIE Transactions 28 (8): 607-16.
Sale, Martha L., and R. Anthony Inman. 2003. Survey-based comparison of performance and change in performance of firms using traditional manufacturing, JIT and TOC. International Journal of Production Research 41 (4): 829-44.
Sanders, Nada R., and Larry P. Ritzman. 2004. Using warehouse workforce flexibility to offset forecast errors. Journal of Business Logistics 25 (2): 251-70.
Schmidt, William C. 1997. World-Wide Web survey research: Benefits, potential problems, and solutions. Behavior Research Methods, Instruments, & Computers 29 (2): 274-9.
Sheehan, William G. 1989. Contract warehousing: The evolution of an industry. Journal of Business Logistics 10 (1): 31-49.
Simatupang, Togar M., Alan C. Wright, and Ramaswami Sridharan. 2004. Applying the theory of constraints to supply chain collaboration. Supply Chain Management 9 (1): 57-70.
Simchi-Levi, David, Philip Kaminsky, and Edith Simchi-Levi. 2003. Designing and management the supply chain. Editorial: McGraw-Hill, Irwin, New York, NY.
Sirmon, David G., Michael A. Hitt, and R. Duane Ireland. 2007. Managing firm resources in dynamic environments to create value: Looking inside the black box. Academy of management review 32 (1): 273-92.
Spencer, Michael S. 1993. Warehouse management using V-A-T logical structure analysis. International Journal of Logistics Management 4 (1): 35-47.
121
Šraml, Matjaž, Tone Lerher, and Grega Ljubej. 2008. Selection of warehouse-transportation vehicles using discrete simulations. In: Progress in material handling research: 2008. The Material Handling Institute, Charlotte, NC: 341-56.
Stank, Theodore P., Michael Crum, and Miren Arango. 1999. Benefits of interfirm coordination in food industry supply chains. Journal of Business Logistics 20 (2): 21-41.
Stank, Theodore P., J. Paul Dittman, and Chad W. Autry. 2011. The new supply chain agenda: A synopsis and directions for future research. International Journal of Physical Distribution and Logistics Management 41 (10): 940-55.
Stank, Theodore P., Dale S. Rogers, and Patricia J. Daugherty. 1994. Benchmarking: Applications by third party warehousing firms. Logistics and Transportation Review 30 (1): 55-72.
Steyn, H. 2002. Project management applications of the theory of constraints beyond critical chain scheduling. International Journal of Project Management 20: 75-80.
Swamidass, Paul M., and William T. Newell. 1987. Manufacturing strategy, environmental uncertainty and performance: A path analytic model. Management Science 33 (4): 509-24.
Tsui, Louis Y., and Chia-Hao Chang. 1990. A microcomputer based decision support tool for assigning dock doors in freight yards. Computers & Industrial Engineering 19 (1): 309-12.
Tsui, Louis Y., and Chia-Hao Chang. 1992. An optimal solution to a dock door assignment problem. Computers & Industrial Engineering 23 (1): 283-86.
Ullman, Jodie B. 2007. Structural Equation Modeling. In: Tabachnick, Barbara G., and Linda S. Fidell. Using multivariate statistics. 5th ed. Boston, MA: Pearson Education, Inc.
Van den Berg, Jeroen P, Gunter P. Sharp, AJRM Gademann, and Yves Pochet. 1998. Forward-reserve allocation in a warehouse with unit-load replenishments. European Journal of Operational Research 111 (1): 98-113.
Vogt, John J. 2010. The successful cross-dock based supply chain. Journal of Business Logistics 31 (1): 99-119.
Vogt, John J., and Wessel J. Pienaar. 2007. The cross-dock: a new viewpoint on the definition and the design of the facility. Southern African Business Review 11 (1): 87-103.
Waller, Matthew A., C. Richard Cassady, and John Ozment. 2006. Impact of cross-docking on inventory in a decentralized retail supply chain. Transportation Research Part E: Logistics and Transportation Review 42 (5): 359-82.
122
Waller, Matthew A., and Stanley Fawcett. 2011. Switching our lenses for new perspectives: A prescription for writing and reviewing out of your comfort zone. Editorial. Journal of Business Logistics 32 (3): 209-13.
Watson, Kevin J., John H. Blackstone, and Stanley C. Gardiner. 2007. The evolution of a management philosophy: The theory of constraints. Journal of Operations Management 25 (2): 387-402.
WERC. 2014. WERCwatch DC Measures. Oak Brook, IL: Warehousing Education and Research Council.
White, John A., and Richard L. Francis. 1971. Normative models for some warehouse sizing problems. AIIE Transactions 3 (3): 185-90.
Williams, Larry J., Nathan Hartman, and Flavia Cavazotte. 2010. Method variance and marker variables: A review and comprehensive CFA marker technique. Operational Research Methods 13 (3): 477-514.
Wright, Kevin B. 2005. Researching internet-based populations: Advantages and disadvantages of online survey research, online questionnaire authoring software packages, and web survey services. Journal of Computer-Mediated Communication 10 (3), retrieved July 15, 2014, from http://onlinelibrary.wiley.com/doi/10.1111/j.1083-6101.2005.tb00259.x/full.
Wu, Chien-Ho. 2007. An empirical study on the transformation of Likert-scale data to numerical scores. Applied Mathematical sciences 1 (58): 2851-62.
123
APPENDIX A
SURVEY (ONLINE VERSION)
You are invited to participate in a research study about warehouses because you are a warehouse manager or are in a similar position in charge of warehouse operations.
WHAT YOU SHOULD KNOW ABOUT THE RESEARCH STUDY
Study title: Managing Warehouse Resources Contact information:
Researcher: Vitaly Brazhkin Adviser: Dr. John Ozment 475 Business Bldg. 1 University of Arkansas Fayetteville, AR 72701 479-575-7674 [email protected]
Compliance person: Ro Windwalker, CIP IRB/RSC Coordinator Research Compliance 210 Administration Bldg. 1 University of Arkansas Fayetteville, AR 72701 479-575-2208 [email protected]
Study description: As volume of business increases, warehouses are often unable to easily upgrade their operation to the new level because of a limited availability of necessary resources. The purpose of this study is to explore effectiveness of certain strategies to deal with the shortage of warehouse resources. The survey collects basic demographic data about your warehouse (size, industry, etc.) and asks to identify resources in short supply in you warehouse and rate applicability to your warehouse of specific strategies dealing with shortages of these resources first in general and then individually for each resource in short supply.
Legal disclosure: A large number of warehouse managers are asked to fill out this 20-minute survey online or on paper. There is neither a cost nor a direct benefit to you to participate in this study, however, you can request the generalized results of the study when it is completed by contacting the researcher using the contact information above. There are no risks involved in filling out the survey. Your participation is voluntary and your refusal to participate will not have any adverse effects on you. The researcher will not disclose any identifying information of any kind to other study participants, research community or the public. All information will be kept confidential to the extent allowed by applicable State and Federal law. You may also contact the University of Arkansas Research Compliance office listed above if you have questions about your rights as a participant, or to discuss any concerns about, or problems with the research. By participating in this survey you will not waive any rights. Your completion of the survey constitutes your consent to the terms above.
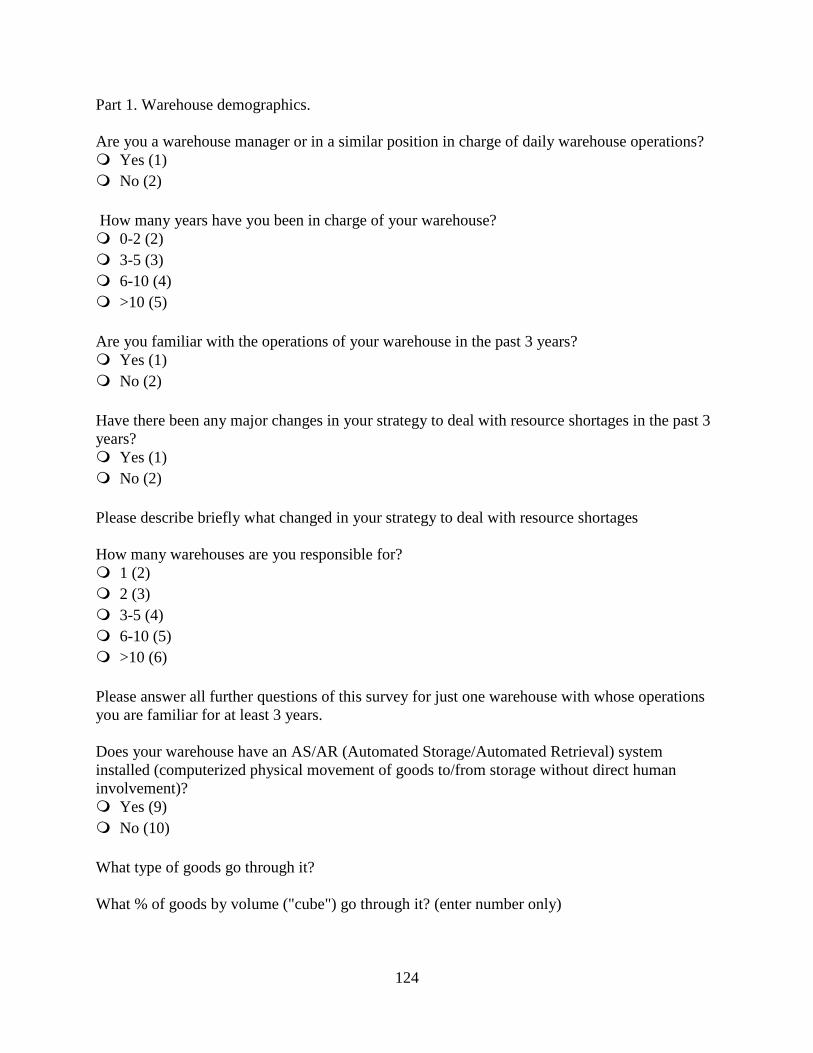
124
Part 1. Warehouse demographics. Are you a warehouse manager or in a similar position in charge of daily warehouse operations? � Yes (1) � No (2) How many years have you been in charge of your warehouse? � 0-2 (2) � 3-5 (3) � 6-10 (4) � >10 (5) Are you familiar with the operations of your warehouse in the past 3 years? � Yes (1) � No (2) Have there been any major changes in your strategy to deal with resource shortages in the past 3 years? � Yes (1) � No (2) Please describe briefly what changed in your strategy to deal with resource shortages How many warehouses are you responsible for? � 1 (2) � 2 (3) � 3-5 (4) � 6-10 (5) � >10 (6) Please answer all further questions of this survey for just one warehouse with whose operations you are familiar for at least 3 years. Does your warehouse have an AS/AR (Automated Storage/Automated Retrieval) system installed (computerized physical movement of goods to/from storage without direct human involvement)? � Yes (9) � No (10) What type of goods go through it? What % of goods by volume ("cube") go through it? (enter number only)
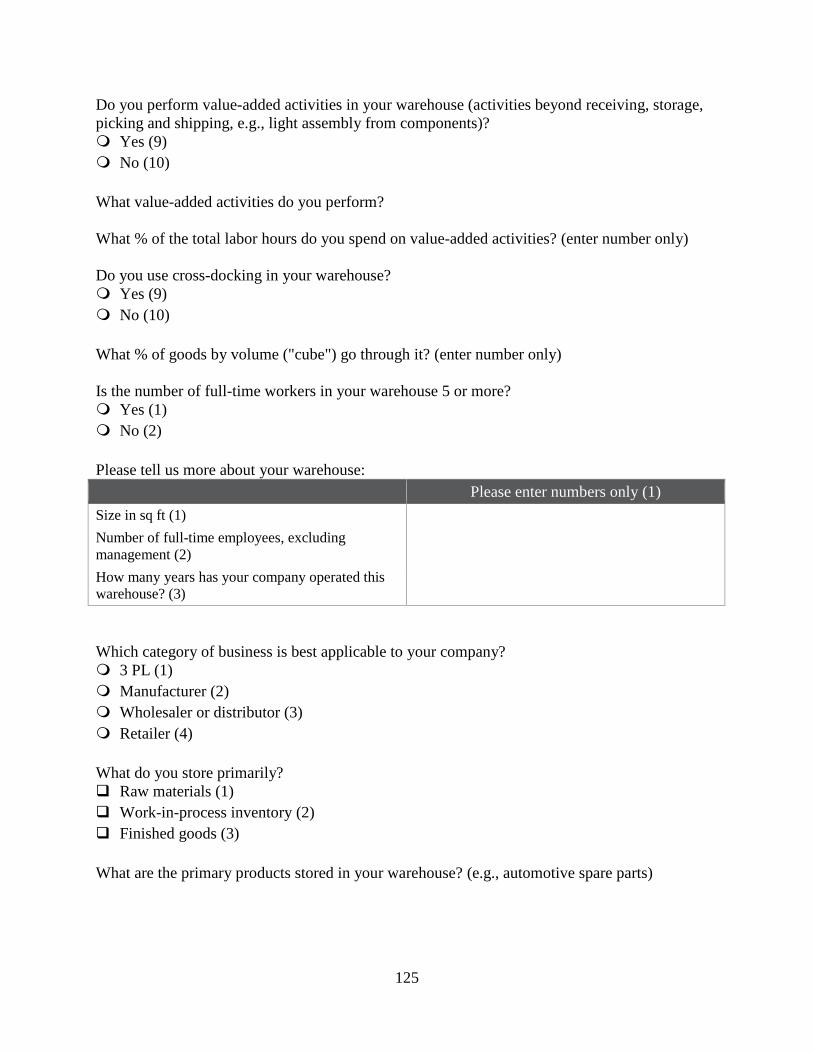
125
Do you perform value-added activities in your warehouse (activities beyond receiving, storage, picking and shipping, e.g., light assembly from components)? � Yes (9) � No (10) What value-added activities do you perform? What % of the total labor hours do you spend on value-added activities? (enter number only) Do you use cross-docking in your warehouse? � Yes (9) � No (10) What % of goods by volume ("cube") go through it? (enter number only) Is the number of full-time workers in your warehouse 5 or more? � Yes (1) � No (2) Please tell us more about your warehouse:
Please enter numbers only (1)
Size in sq ft (1)
Number of full-time employees, excluding management (2)
How many years has your company operated this warehouse? (3)
Which category of business is best applicable to your company? � 3 PL (1) � Manufacturer (2) � Wholesaler or distributor (3) � Retailer (4) What do you store primarily? � Raw materials (1) � Work-in-process inventory (2) � Finished goods (3) What are the primary products stored in your warehouse? (e.g., automotive spare parts)
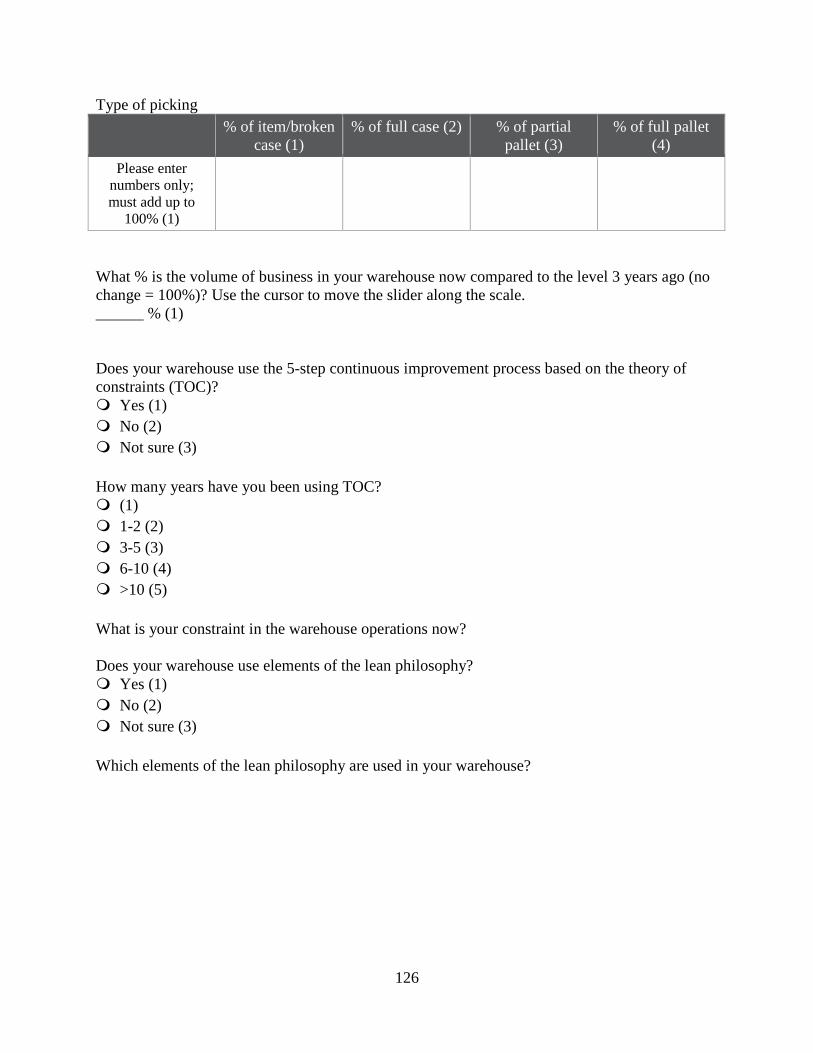
126
Type of picking % of item/broken
case (1) % of full case (2) % of partial
pallet (3) % of full pallet
(4)
Please enter numbers only; must add up to
100% (1)
What % is the volume of business in your warehouse now compared to the level 3 years ago (no change = 100%)? Use the cursor to move the slider along the scale. ______ % (1) Does your warehouse use the 5-step continuous improvement process based on the theory of constraints (TOC)? � Yes (1) � No (2) � Not sure (3) How many years have you been using TOC? � (1) � 1-2 (2) � 3-5 (3) � 6-10 (4) � >10 (5) What is your constraint in the warehouse operations now? Does your warehouse use elements of the lean philosophy? � Yes (1) � No (2) � Not sure (3) Which elements of the lean philosophy are used in your warehouse?
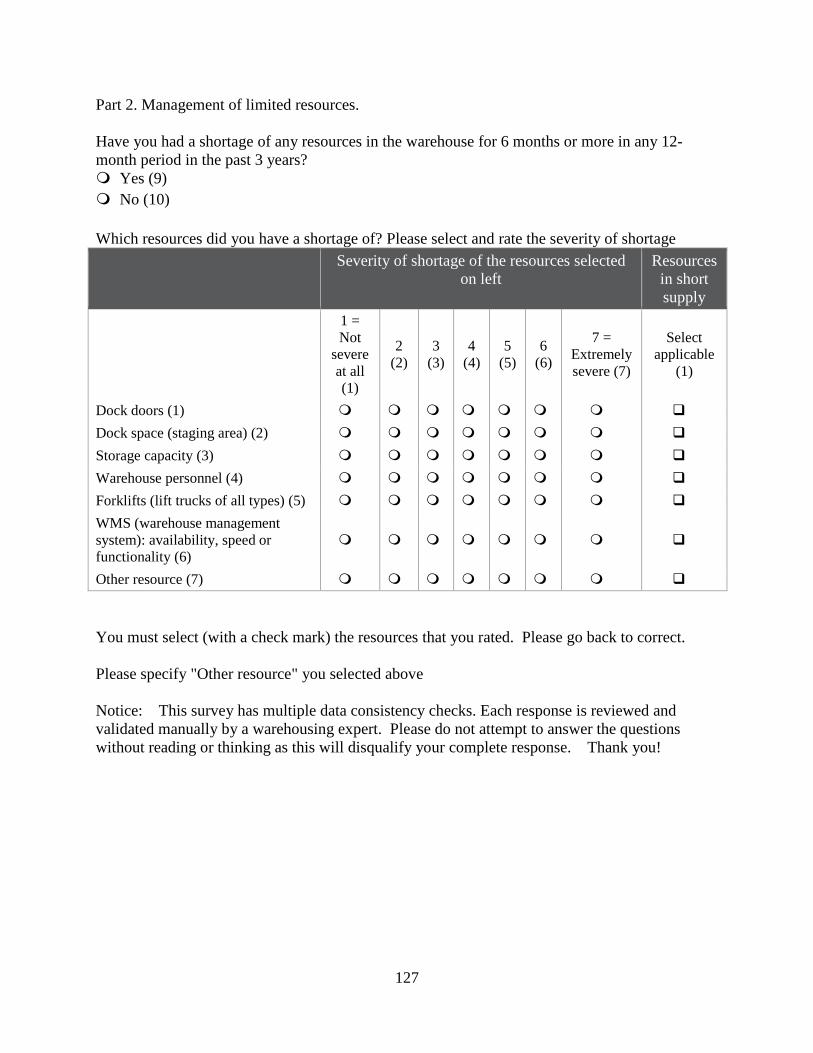
127
Part 2. Management of limited resources. Have you had a shortage of any resources in the warehouse for 6 months or more in any 12-month period in the past 3 years? � Yes (9) � No (10) Which resources did you have a shortage of? Please select and rate the severity of shortage
Severity of shortage of the resources selected on left
Resources in short supply
1 = Not
severe at all (1)
2 (2)
3 (3)
4 (4)
5 (5)
6 (6)
7 = Extremely severe (7)
Select applicable
(1)
Dock doors (1) � � � � � � � �
Dock space (staging area) (2) � � � � � � � �
Storage capacity (3) � � � � � � � �
Warehouse personnel (4) � � � � � � � �
Forklifts (lift trucks of all types) (5) � � � � � � � �
WMS (warehouse management system): availability, speed or functionality (6)
� � � � � � � �
Other resource (7) � � � � � � � �
You must select (with a check mark) the resources that you rated. Please go back to correct. Please specify "Other resource" you selected above Notice: This survey has multiple data consistency checks. Each response is reviewed and validated manually by a warehousing expert. Please do not attempt to answer the questions without reading or thinking as this will disqualify your complete response. Thank you!
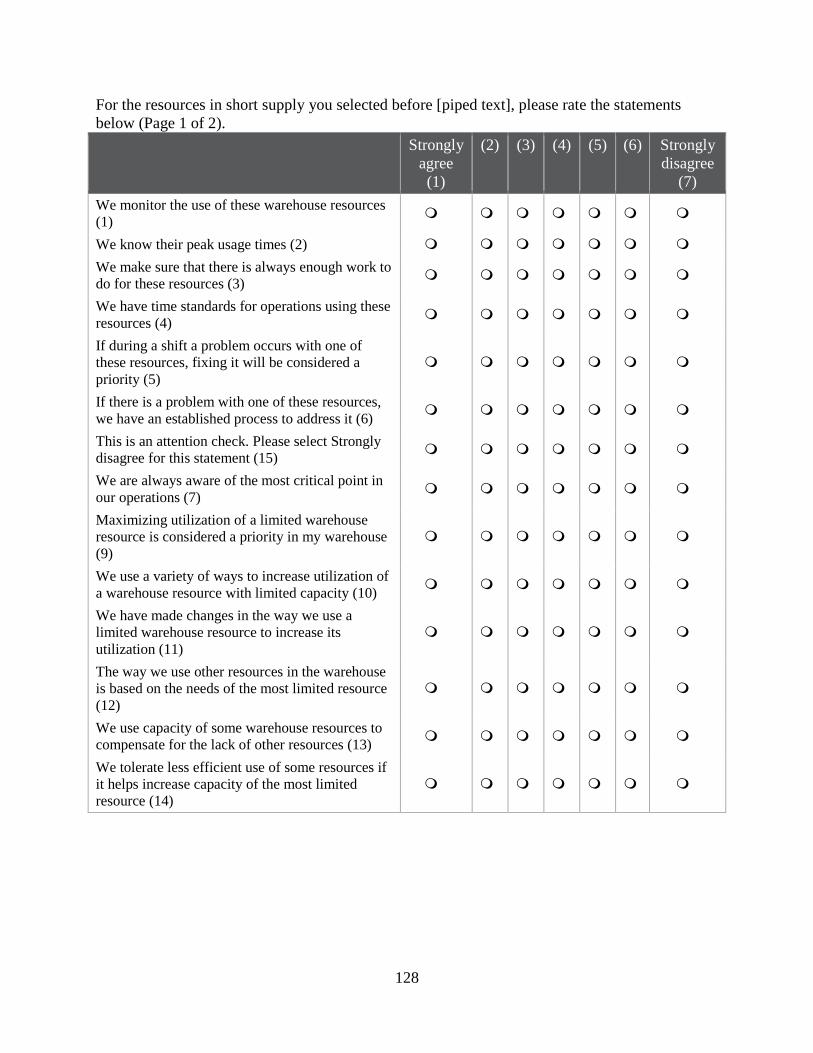
128
For the resources in short supply you selected before [piped text], please rate the statements below (Page 1 of 2).
Strongly agree (1)
(2) (3) (4) (5) (6) Strongly disagree
(7)
We monitor the use of these warehouse resources (1)
� � � � � � �
We know their peak usage times (2) � � � � � � �
We make sure that there is always enough work to do for these resources (3)
� � � � � � �
We have time standards for operations using these resources (4)
� � � � � � �
If during a shift a problem occurs with one of these resources, fixing it will be considered a priority (5)
� � � � � � �
If there is a problem with one of these resources, we have an established process to address it (6)
� � � � � � �
This is an attention check. Please select Strongly disagree for this statement (15)
� � � � � � �
We are always aware of the most critical point in our operations (7)
� � � � � � �
Maximizing utilization of a limited warehouse resource is considered a priority in my warehouse (9)
� � � � � � �
We use a variety of ways to increase utilization of a warehouse resource with limited capacity (10)
� � � � � � �
We have made changes in the way we use a limited warehouse resource to increase its utilization (11)
� � � � � � �
The way we use other resources in the warehouse is based on the needs of the most limited resource (12)
� � � � � � �
We use capacity of some warehouse resources to compensate for the lack of other resources (13)
� � � � � � �
We tolerate less efficient use of some resources if it helps increase capacity of the most limited resource (14)
� � � � � � �
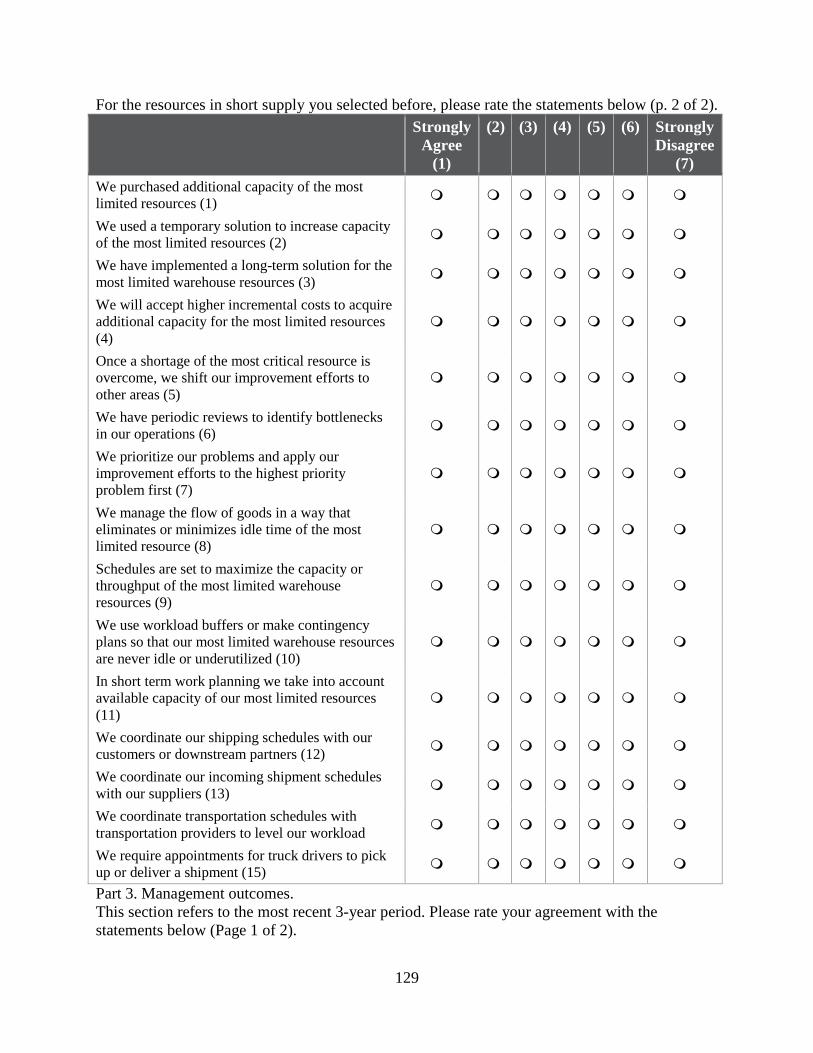
129
For the resources in short supply you selected before, please rate the statements below (p. 2 of 2). Strongly
Agree (1)
(2) (3) (4) (5) (6) Strongly Disagree
(7) We purchased additional capacity of the most limited resources (1) � � � � � � �
We used a temporary solution to increase capacity of the most limited resources (2) � � � � � � �
We have implemented a long-term solution for the most limited warehouse resources (3) � � � � � � �
We will accept higher incremental costs to acquire additional capacity for the most limited resources (4)
� � � � � � �
Once a shortage of the most critical resource is overcome, we shift our improvement efforts to other areas (5)
� � � � � � �
We have periodic reviews to identify bottlenecks in our operations (6) � � � � � � �
We prioritize our problems and apply our improvement efforts to the highest priority problem first (7)
� � � � � � �
We manage the flow of goods in a way that eliminates or minimizes idle time of the most limited resource (8)
� � � � � � �
Schedules are set to maximize the capacity or throughput of the most limited warehouse resources (9)
� � � � � � �
We use workload buffers or make contingency plans so that our most limited warehouse resources are never idle or underutilized (10)
� � � � � � �
In short term work planning we take into account available capacity of our most limited resources (11)
� � � � � � �
We coordinate our shipping schedules with our customers or downstream partners (12) � � � � � � �
We coordinate our incoming shipment schedules with our suppliers (13) � � � � � � �
We coordinate transportation schedules with transportation providers to level our workload � � � � � � �
We require appointments for truck drivers to pick up or deliver a shipment (15) � � � � � � �
Part 3. Management outcomes. This section refers to the most recent 3-year period. Please rate your agreement with the statements below (Page 1 of 2).
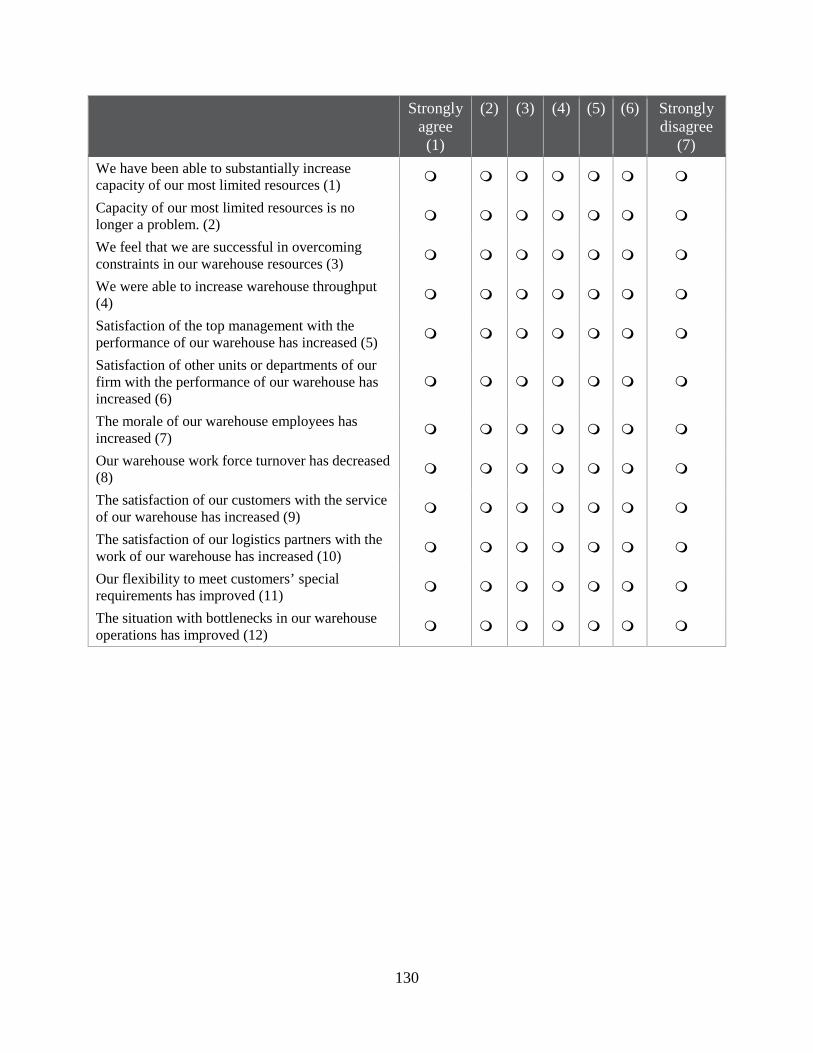
130
Strongly agree (1)
(2) (3) (4) (5) (6) Strongly disagree
(7)
We have been able to substantially increase capacity of our most limited resources (1)
� � � � � � �
Capacity of our most limited resources is no longer a problem. (2)
� � � � � � �
We feel that we are successful in overcoming constraints in our warehouse resources (3)
� � � � � � �
We were able to increase warehouse throughput (4)
� � � � � � �
Satisfaction of the top management with the performance of our warehouse has increased (5)
� � � � � � �
Satisfaction of other units or departments of our firm with the performance of our warehouse has increased (6)
� � � � � � �
The morale of our warehouse employees has increased (7)
� � � � � � �
Our warehouse work force turnover has decreased (8)
� � � � � � �
The satisfaction of our customers with the service of our warehouse has increased (9)
� � � � � � �
The satisfaction of our logistics partners with the work of our warehouse has increased (10)
� � � � � � �
Our flexibility to meet customers’ special requirements has improved (11)
� � � � � � �
The situation with bottlenecks in our warehouse operations has improved (12)
� � � � � � �
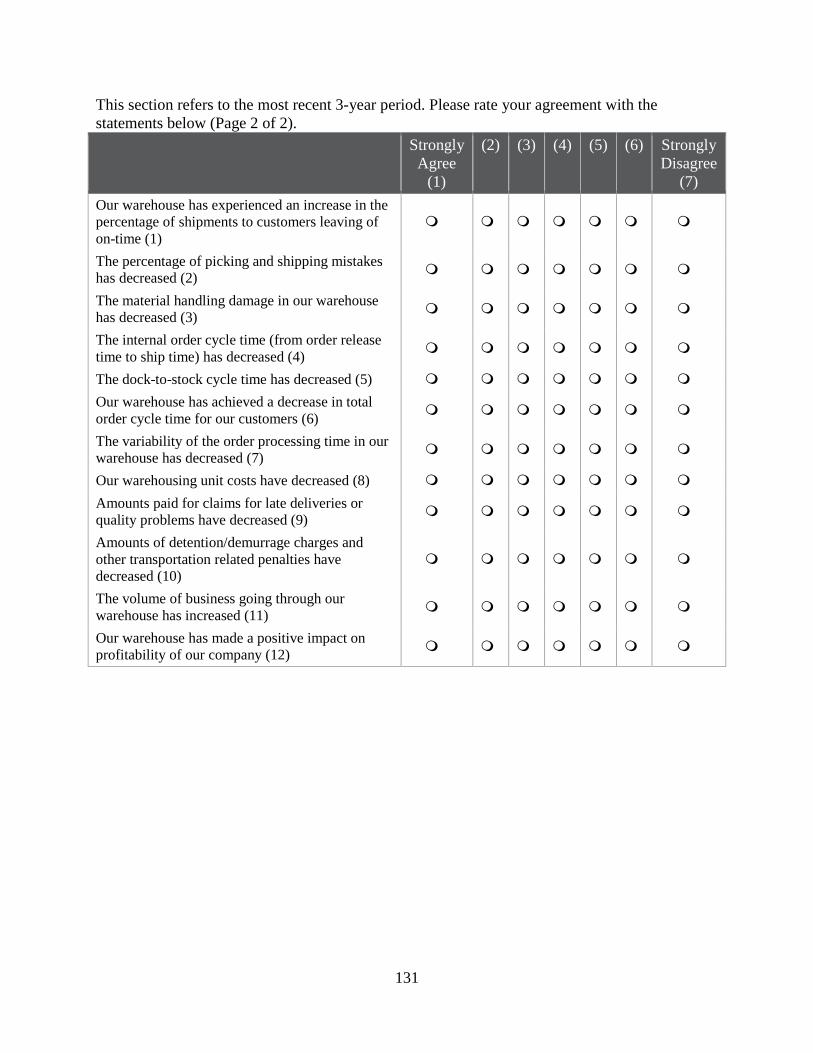
131
This section refers to the most recent 3-year period. Please rate your agreement with the statements below (Page 2 of 2).
Strongly Agree
(1)
(2) (3) (4) (5) (6) Strongly Disagree
(7)
Our warehouse has experienced an increase in the percentage of shipments to customers leaving of on-time (1)
� � � � � � �
The percentage of picking and shipping mistakes has decreased (2)
� � � � � � �
The material handling damage in our warehouse has decreased (3)
� � � � � � �
The internal order cycle time (from order release time to ship time) has decreased (4)
� � � � � � �
The dock-to-stock cycle time has decreased (5) � � � � � � �
Our warehouse has achieved a decrease in total order cycle time for our customers (6)
� � � � � � �
The variability of the order processing time in our warehouse has decreased (7)
� � � � � � �
Our warehousing unit costs have decreased (8) � � � � � � �
Amounts paid for claims for late deliveries or quality problems have decreased (9)
� � � � � � �
Amounts of detention/demurrage charges and other transportation related penalties have decreased (10)
� � � � � � �
The volume of business going through our warehouse has increased (11)
� � � � � � �
Our warehouse has made a positive impact on profitability of our company (12)
� � � � � � �
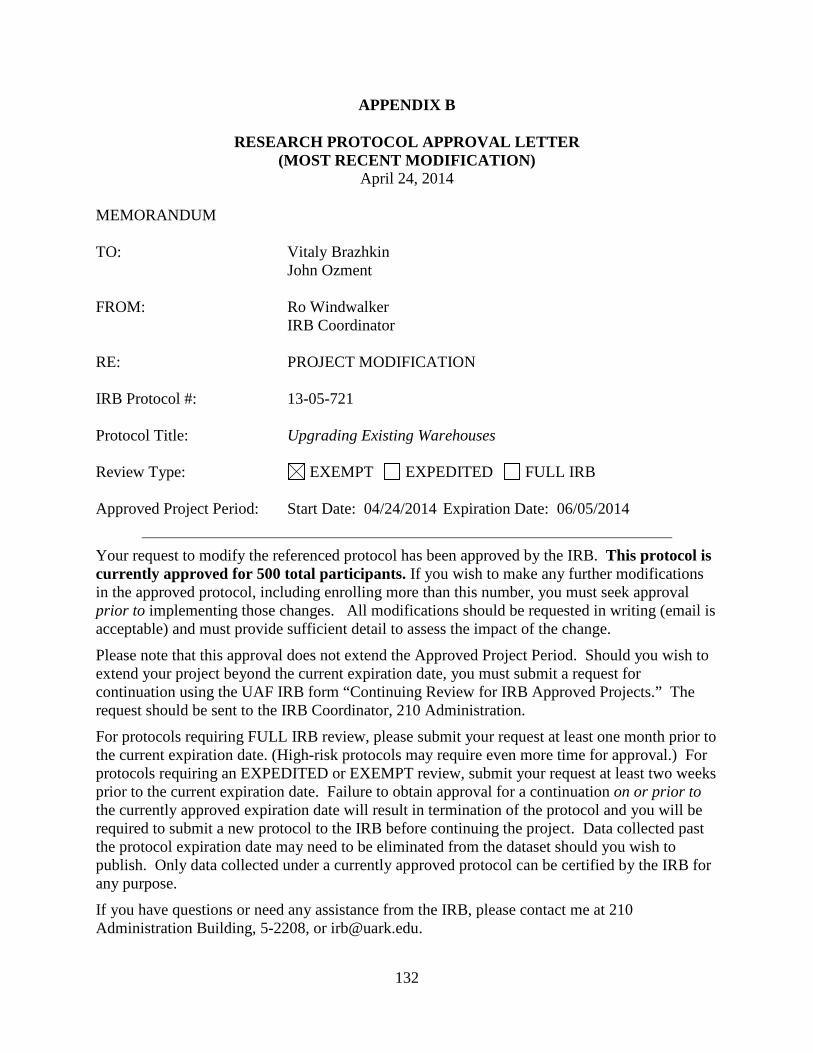
132
APPENDIX B
RESEARCH PROTOCOL APPROVAL LETTER (MOST RECENT MODIFICATION)
April 24, 2014
MEMORANDUM TO: Vitaly Brazhkin John Ozment FROM: Ro Windwalker IRB Coordinator RE: PROJECT MODIFICATION IRB Protocol #: 13-05-721 Protocol Title: Upgrading Existing Warehouses Review Type: EXEMPT EXPEDITED FULL IRB Approved Project Period: Start Date: 04/24/2014 Expiration Date: 06/05/2014
Your request to modify the referenced protocol has been approved by the IRB. This protocol is currently approved for 500 total participants. If you wish to make any further modifications in the approved protocol, including enrolling more than this number, you must seek approval prior to implementing those changes. All modifications should be requested in writing (email is acceptable) and must provide sufficient detail to assess the impact of the change.
Please note that this approval does not extend the Approved Project Period. Should you wish to extend your project beyond the current expiration date, you must submit a request for continuation using the UAF IRB form “Continuing Review for IRB Approved Projects.” The request should be sent to the IRB Coordinator, 210 Administration.
For protocols requiring FULL IRB review, please submit your request at least one month prior to the current expiration date. (High-risk protocols may require even more time for approval.) For protocols requiring an EXPEDITED or EXEMPT review, submit your request at least two weeks prior to the current expiration date. Failure to obtain approval for a continuation on or prior to the currently approved expiration date will result in termination of the protocol and you will be required to submit a new protocol to the IRB before continuing the project. Data collected past the protocol expiration date may need to be eliminated from the dataset should you wish to publish. Only data collected under a currently approved protocol can be certified by the IRB for any purpose.
If you have questions or need any assistance from the IRB, please contact me at 210 Administration Building, 5-2208, or [email protected].
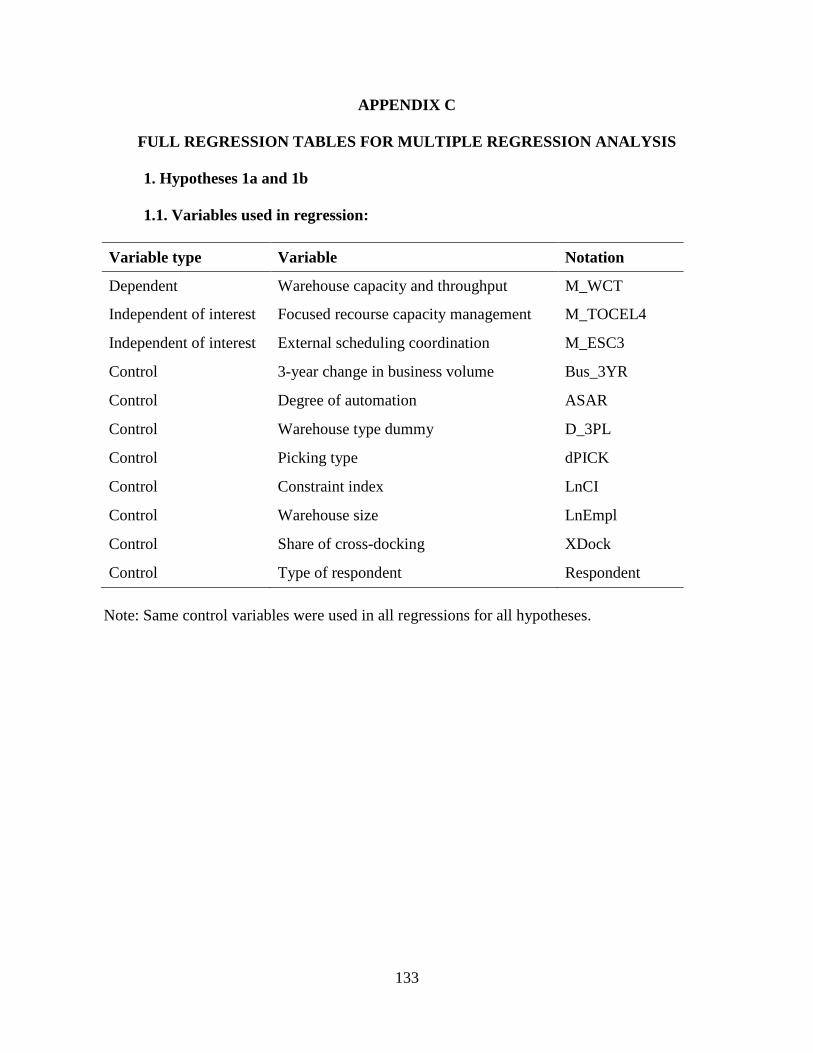
133
APPENDIX C
FULL REGRESSION TABLES FOR MULTIPLE REGRESSION ANAL YSIS
1. Hypotheses 1a and 1b
1.1. Variables used in regression:
Variable type Variable Notation
Dependent Warehouse capacity and throughput M_WCT
Independent of interest Focused recourse capacity management M_TOCEL4
Independent of interest External scheduling coordination M_ESC3
Control 3-year change in business volume Bus_3YR
Control Degree of automation ASAR
Control Warehouse type dummy D_3PL
Control Picking type dPICK
Control Constraint index LnCI
Control Warehouse size LnEmpl
Control Share of cross-docking XDock
Control Type of respondent Respondent
Note: Same control variables were used in all regressions for all hypotheses.
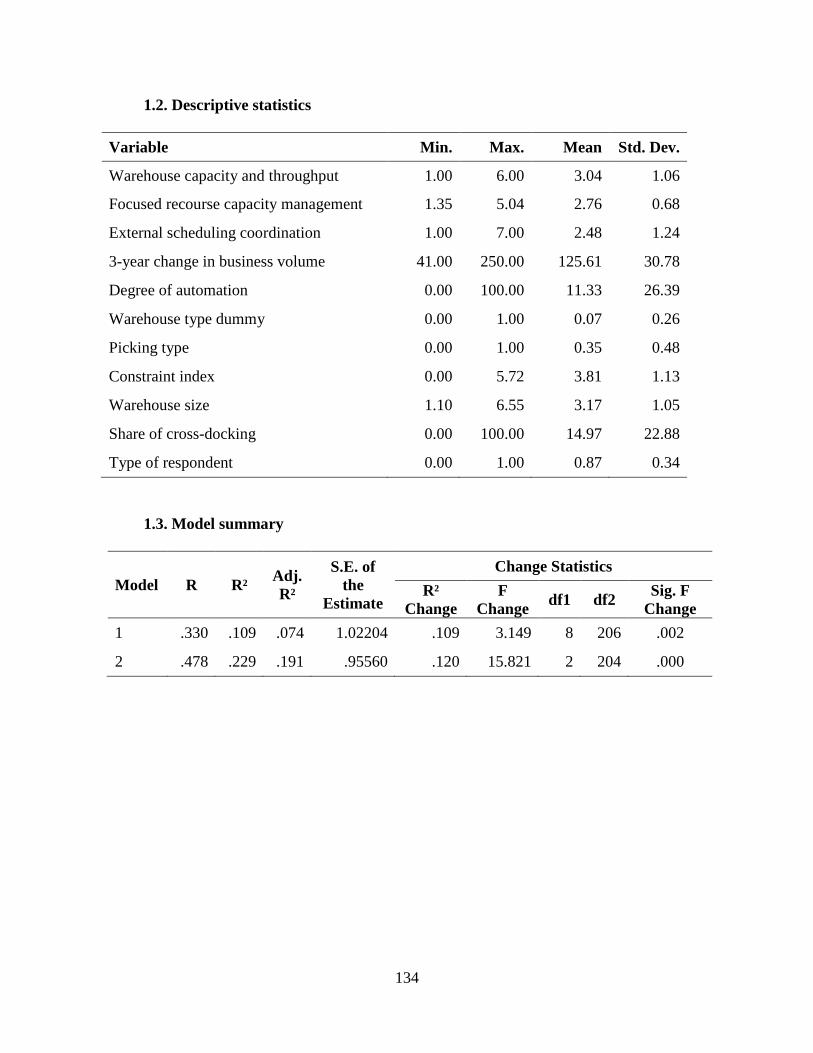
134
1.2. Descriptive statistics
Variable Min. Max. Mean Std. Dev.
Warehouse capacity and throughput 1.00 6.00 3.04 1.06
Focused recourse capacity management 1.35 5.04 2.76 0.68
External scheduling coordination 1.00 7.00 2.48 1.24
3-year change in business volume 41.00 250.00 125.61 30.78
Degree of automation 0.00 100.00 11.33 26.39
Warehouse type dummy 0.00 1.00 0.07 0.26
Picking type 0.00 1.00 0.35 0.48
Constraint index 0.00 5.72 3.81 1.13
Warehouse size 1.10 6.55 3.17 1.05
Share of cross-docking 0.00 100.00 14.97 22.88
Type of respondent 0.00 1.00 0.87 0.34
1.3. Model summary
Model R R² Adj. R²
S.E. of the
Estimate
Change Statistics
R² Change
F Change df1 df2
Sig. F Change
1 .330 .109 .074 1.02204 .109 3.149 8 206 .002
2 .478 .229 .191 .95560 .120 15.821 2 204 .000
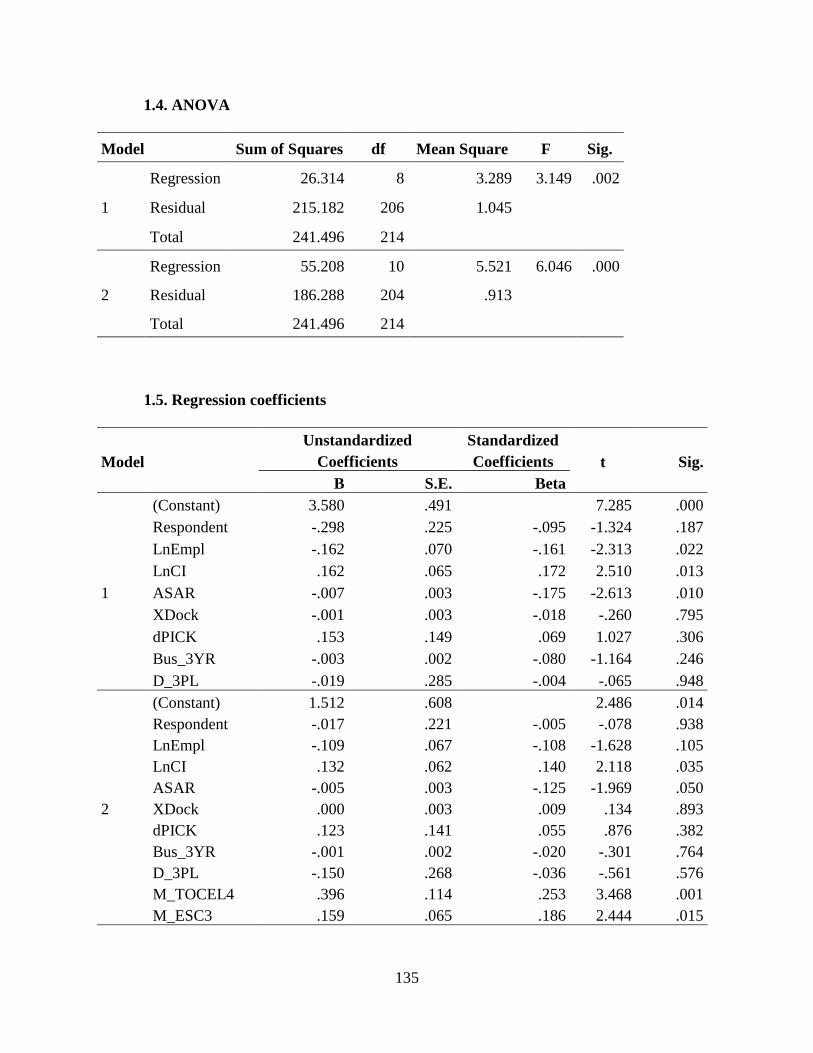
135
1.4. ANOVA
Model Sum of Squares df Mean Square F Sig.
1
Regression 26.314 8 3.289 3.149 .002
Residual 215.182 206 1.045
Total 241.496 214
2
Regression 55.208 10 5.521 6.046 .000
Residual 186.288 204 .913
Total 241.496 214
1.5. Regression coefficients
Model Unstandardized
Coefficients Standardized Coefficients t Sig.
B S.E. Beta
1
(Constant) 3.580 .491 7.285 .000 Respondent -.298 .225 -.095 -1.324 .187 LnEmpl -.162 .070 -.161 -2.313 .022 LnCI .162 .065 .172 2.510 .013 ASAR -.007 .003 -.175 -2.613 .010 XDock -.001 .003 -.018 -.260 .795 dPICK .153 .149 .069 1.027 .306 Bus_3YR -.003 .002 -.080 -1.164 .246 D_3PL -.019 .285 -.004 -.065 .948
2
(Constant) 1.512 .608 2.486 .014 Respondent -.017 .221 -.005 -.078 .938 LnEmpl -.109 .067 -.108 -1.628 .105 LnCI .132 .062 .140 2.118 .035 ASAR -.005 .003 -.125 -1.969 .050 XDock .000 .003 .009 .134 .893 dPICK .123 .141 .055 .876 .382 Bus_3YR -.001 .002 -.020 -.301 .764 D_3PL -.150 .268 -.036 -.561 .576 M_TOCEL4 .396 .114 .253 3.468 .001 M_ESC3 .159 .065 .186 2.444 .015
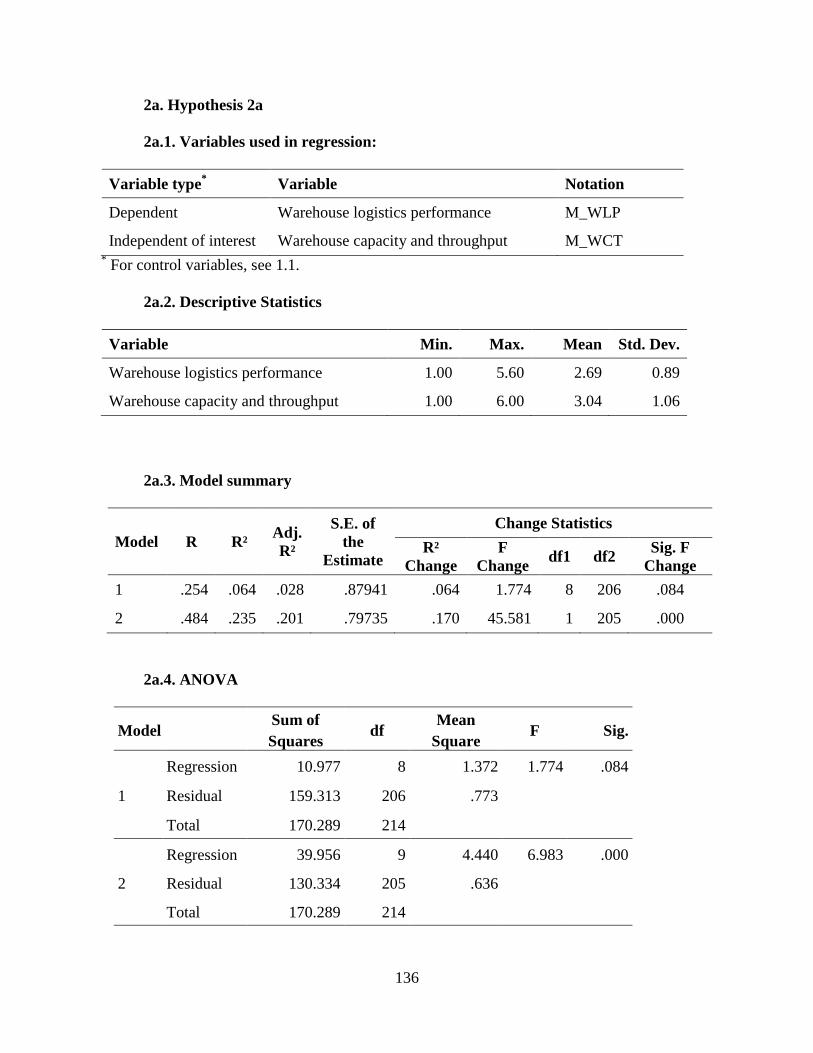
136
2a. Hypothesis 2a
2a.1. Variables used in regression:
Variable type* Variable Notation
Dependent Warehouse logistics performance M_WLP
Independent of interest Warehouse capacity and throughput M_WCT * For control variables, see 1.1.
2a.2. Descriptive Statistics
Variable Min. Max. Mean Std. Dev.
Warehouse logistics performance 1.00 5.60 2.69 0.89
Warehouse capacity and throughput 1.00 6.00 3.04 1.06
2a.3. Model summary
Model R R² Adj. R²
S.E. of the
Estimate
Change Statistics
R² Change
F Change
df1 df2 Sig. F Change
1 .254 .064 .028 .87941 .064 1.774 8 206 .084
2 .484 .235 .201 .79735 .170 45.581 1 205 .000
2a.4. ANOVA
Model Sum of Squares
df Mean
Square F Sig.
1
Regression 10.977 8 1.372 1.774 .084
Residual 159.313 206 .773
Total 170.289 214
2
Regression 39.956 9 4.440 6.983 .000
Residual 130.334 205 .636
Total 170.289 214
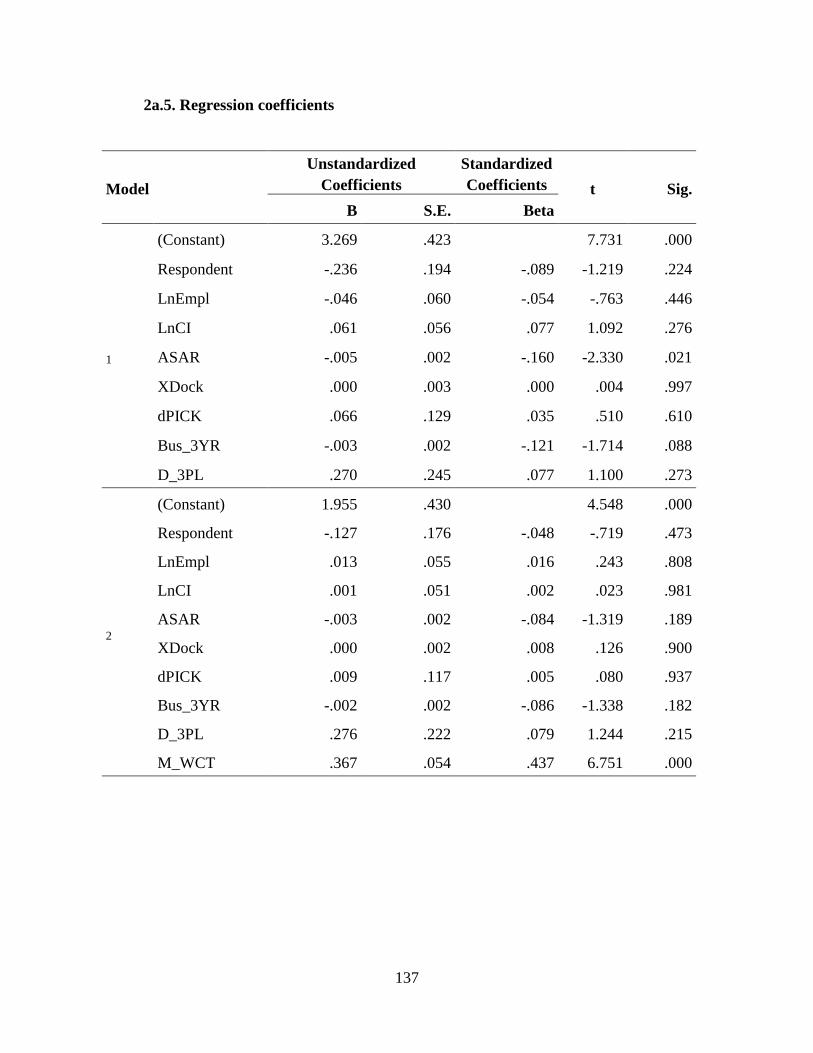
137
2a.5. Regression coefficients
Model
Unstandardized Coefficients
Standardized Coefficients t Sig.
B S.E. Beta
1
(Constant) 3.269 .423 7.731 .000
Respondent -.236 .194 -.089 -1.219 .224
LnEmpl -.046 .060 -.054 -.763 .446
LnCI .061 .056 .077 1.092 .276
ASAR -.005 .002 -.160 -2.330 .021
XDock .000 .003 .000 .004 .997
dPICK .066 .129 .035 .510 .610
Bus_3YR -.003 .002 -.121 -1.714 .088
D_3PL .270 .245 .077 1.100 .273
2
(Constant) 1.955 .430 4.548 .000
Respondent -.127 .176 -.048 -.719 .473
LnEmpl .013 .055 .016 .243 .808
LnCI .001 .051 .002 .023 .981
ASAR -.003 .002 -.084 -1.319 .189
XDock .000 .002 .008 .126 .900
dPICK .009 .117 .005 .080 .937
Bus_3YR -.002 .002 -.086 -1.338 .182
D_3PL .276 .222 .079 1.244 .215
M_WCT .367 .054 .437 6.751 .000
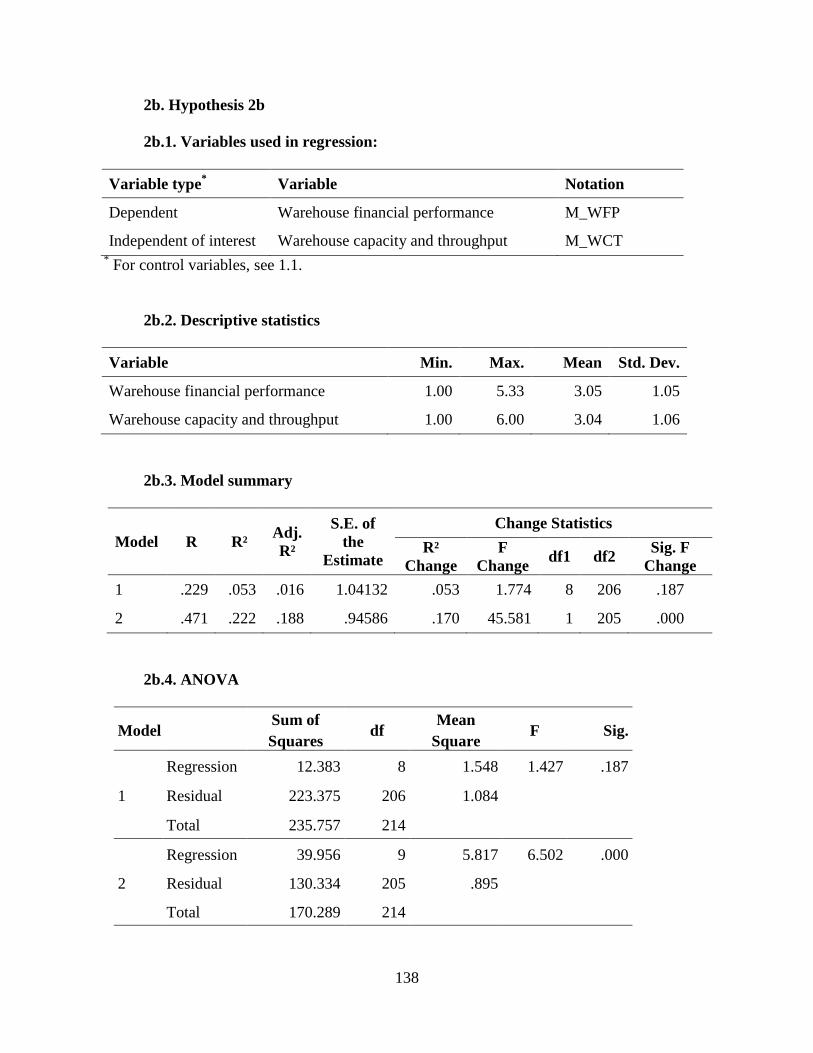
138
2b. Hypothesis 2b
2b.1. Variables used in regression:
Variable type* Variable Notation
Dependent Warehouse financial performance M_WFP
Independent of interest Warehouse capacity and throughput M_WCT
* For control variables, see 1.1.
2b.2. Descriptive statistics
Variable Min. Max. Mean Std. Dev.
Warehouse financial performance 1.00 5.33 3.05 1.05
Warehouse capacity and throughput 1.00 6.00 3.04 1.06
2b.3. Model summary
Model R R² Adj. R²
S.E. of the
Estimate
Change Statistics
R² Change
F Change
df1 df2 Sig. F Change
1 .229 .053 .016 1.04132 .053 1.774 8 206 .187
2 .471 .222 .188 .94586 .170 45.581 1 205 .000
2b.4. ANOVA
Model Sum of Squares
df Mean
Square F Sig.
1
Regression 12.383 8 1.548 1.427 .187
Residual 223.375 206 1.084
Total 235.757 214
2
Regression 39.956 9 5.817 6.502 .000
Residual 130.334 205 .895
Total 170.289 214

139
2b.5. Regression coefficients
Model
Unstandardized Coefficients
Standardized Coefficients t Sig.
B S.E. Beta
1
(Constant) 4.115 .501 8.219 .000
Respondent -.330 .229 -.106 -1.439 .152
LnEmpl -.150 .072 -.151 -2.095 .037
LnCI .020 .066 .022 .306 .760
ASAR -.003 .003 -.073 -1.059 .291
XDock -.001 .003 -.024 -.348 .728
dPICK .159 .152 .073 1.046 .297
Bus_3YR -.003 .002 -.089 -1.261 .209
D_3PL -.100 .290 -.024 -.344 .731
2
(Constant) 2.572 .510 5.044 .000
Respondent -.202 .209 -.065 -.964 .336
LnEmpl -.080 .066 -.080 -1.214 .226
LnCI -.050 .061 -.053 -.819 .414
ASAR .000 .003 .003 .050 .960
XDock -.001 .003 -.017 -.263 .793
dPICK .093 .139 .042 .672 .502
Bus_3YR -.002 .002 -.055 -.844 .400
D_3PL -.092 .264 -.022 -.348 .728
M_WCT .431 .064 .436 6.684 .000

140
3. Hypothesis 3
3.1. Variables used in regression:
Variable type* Variable Notation
Dependent Warehouse capacity and throughput M_WCT
Independent of interest TOC logistics paradigm M_TOCEL2 * For control variables, see 1.1
3.2. Descriptive Statistics
Variable Min. Max. Mean Std. Dev.
TOC logistics paradigm 1.25 5.39 2.62 0.83
Warehouse capacity and throughput 1.00 6.00 3.04 1.06
3.3. Model summary
Model R R² Adj. R²
S.E. of the
Estimate
Change Statistics
R² Change
F Change
df1 df2 Sig. F Change
1 .330 .109 .074 1.02204 .109 3.149 8 206 .002
2 .469 .220 .185 .95879 .111 29.080 1 205 .000
3.4. ANOVA
Model Sum of Squares
df Mean
Square F Sig.
1
Regression 26.314 8 3.289 3.149 .002
Residual 215.182 206 1.045
Total 241.496 214
2
Regression 53.046 9 5.894 6.412 .000
Residual 188.450 205 .919
Total 241.496 214
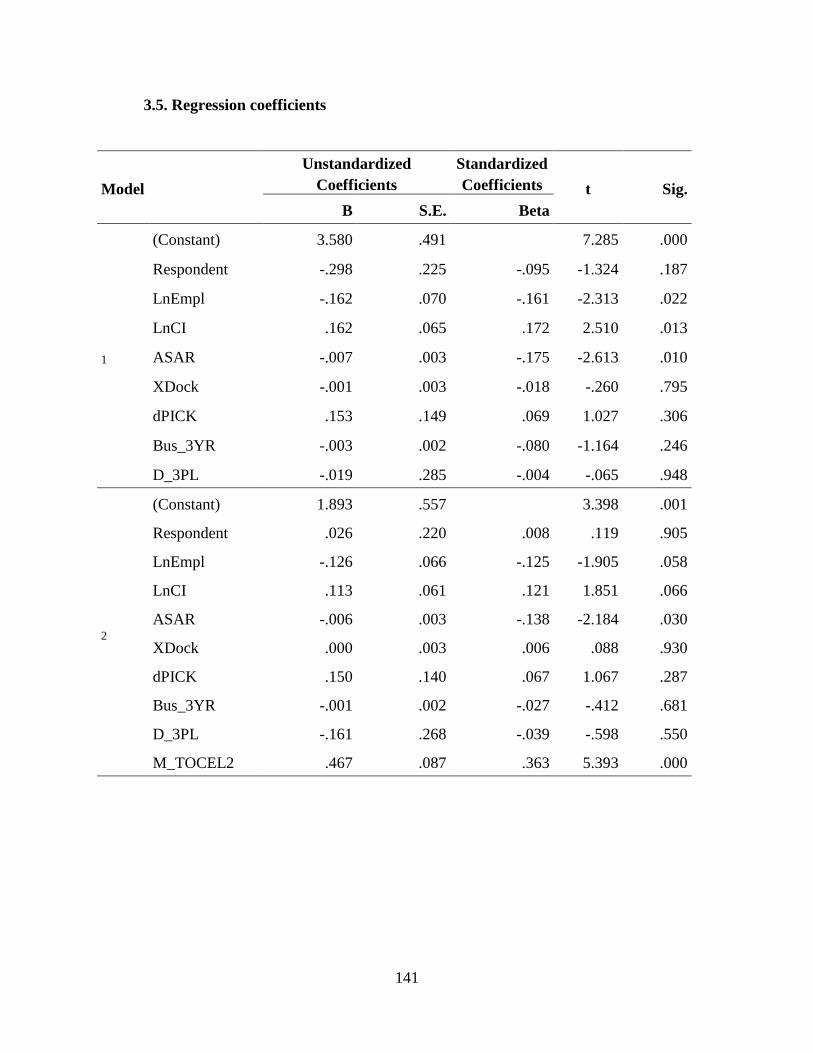
141
3.5. Regression coefficients
Model
Unstandardized Coefficients
Standardized Coefficients t Sig.
B S.E. Beta
1
(Constant) 3.580 .491 7.285 .000
Respondent -.298 .225 -.095 -1.324 .187
LnEmpl -.162 .070 -.161 -2.313 .022
LnCI .162 .065 .172 2.510 .013
ASAR -.007 .003 -.175 -2.613 .010
XDock -.001 .003 -.018 -.260 .795
dPICK .153 .149 .069 1.027 .306
Bus_3YR -.003 .002 -.080 -1.164 .246
D_3PL -.019 .285 -.004 -.065 .948
2
(Constant) 1.893 .557 3.398 .001
Respondent .026 .220 .008 .119 .905
LnEmpl -.126 .066 -.125 -1.905 .058
LnCI .113 .061 .121 1.851 .066
ASAR -.006 .003 -.138 -2.184 .030
XDock .000 .003 .006 .088 .930
dPICK .150 .140 .067 1.067 .287
Bus_3YR -.001 .002 -.027 -.412 .681
D_3PL -.161 .268 -.039 -.598 .550
M_TOCEL2 .467 .087 .363 5.393 .000
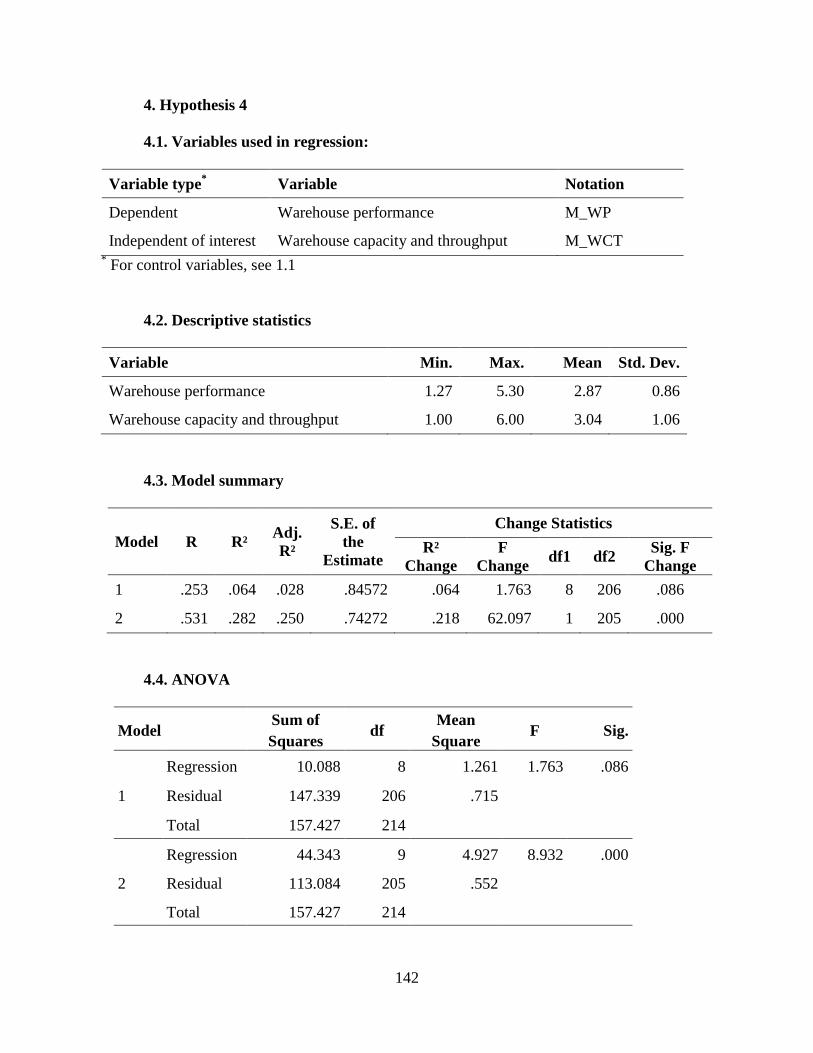
142
4. Hypothesis 4
4.1. Variables used in regression:
Variable type* Variable Notation
Dependent Warehouse performance M_WP
Independent of interest Warehouse capacity and throughput M_WCT * For control variables, see 1.1
4.2. Descriptive statistics
Variable Min. Max. Mean Std. Dev.
Warehouse performance 1.27 5.30 2.87 0.86
Warehouse capacity and throughput 1.00 6.00 3.04 1.06
4.3. Model summary
Model R R² Adj. R²
S.E. of the
Estimate
Change Statistics
R² Change
F Change
df1 df2 Sig. F Change
1 .253 .064 .028 .84572 .064 1.763 8 206 .086
2 .531 .282 .250 .74272 .218 62.097 1 205 .000
4.4. ANOVA
Model Sum of Squares
df Mean
Square F Sig.
1
Regression 10.088 8 1.261 1.763 .086
Residual 147.339 206 .715
Total 157.427 214
2
Regression 44.343 9 4.927 8.932 .000
Residual 113.084 205 .552
Total 157.427 214
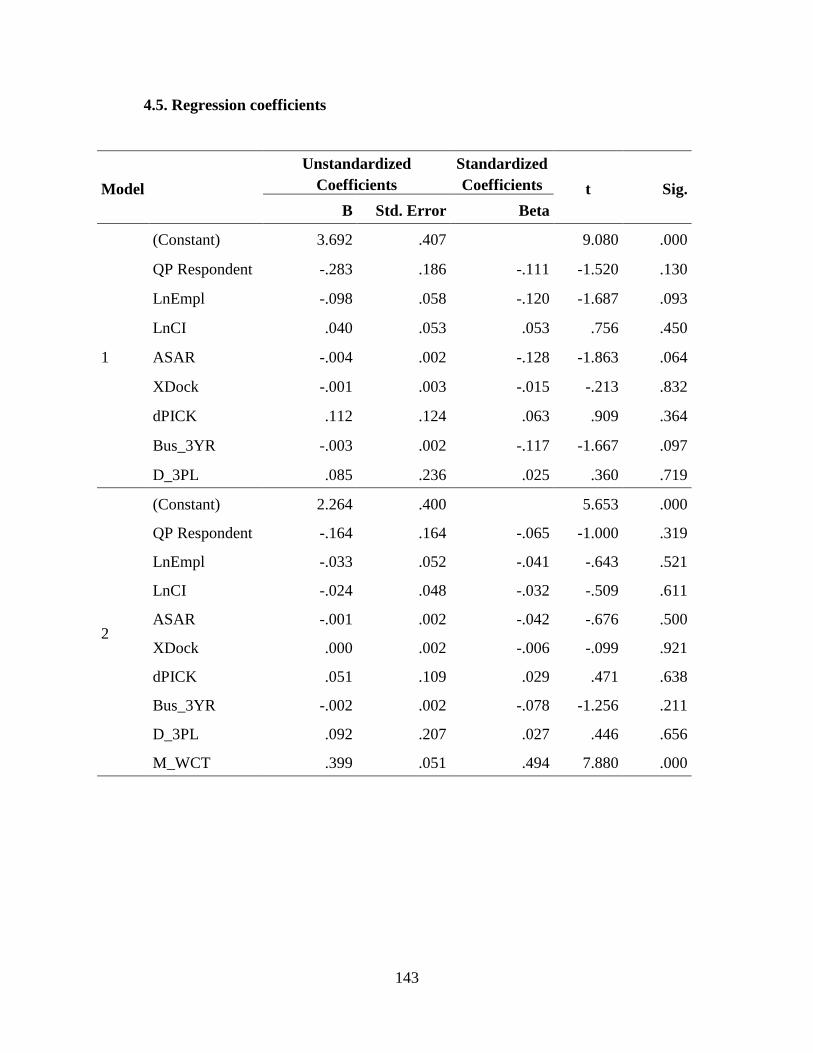
143
4.5. Regression coefficients
Model
Unstandardized Coefficients
Standardized Coefficients t Sig.
B Std. Error Beta
1
(Constant) 3.692 .407 9.080 .000
QP Respondent -.283 .186 -.111 -1.520 .130
LnEmpl -.098 .058 -.120 -1.687 .093
LnCI .040 .053 .053 .756 .450
ASAR -.004 .002 -.128 -1.863 .064
XDock -.001 .003 -.015 -.213 .832
dPICK .112 .124 .063 .909 .364
Bus_3YR -.003 .002 -.117 -1.667 .097
D_3PL .085 .236 .025 .360 .719
2
(Constant) 2.264 .400 5.653 .000
QP Respondent -.164 .164 -.065 -1.000 .319
LnEmpl -.033 .052 -.041 -.643 .521
LnCI -.024 .048 -.032 -.509 .611
ASAR -.001 .002 -.042 -.676 .500
XDock .000 .002 -.006 -.099 .921
dPICK .051 .109 .029 .471 .638
Bus_3YR -.002 .002 -.078 -1.256 .211
D_3PL .092 .207 .027 .446 .656
M_WCT .399 .051 .494 7.880 .000
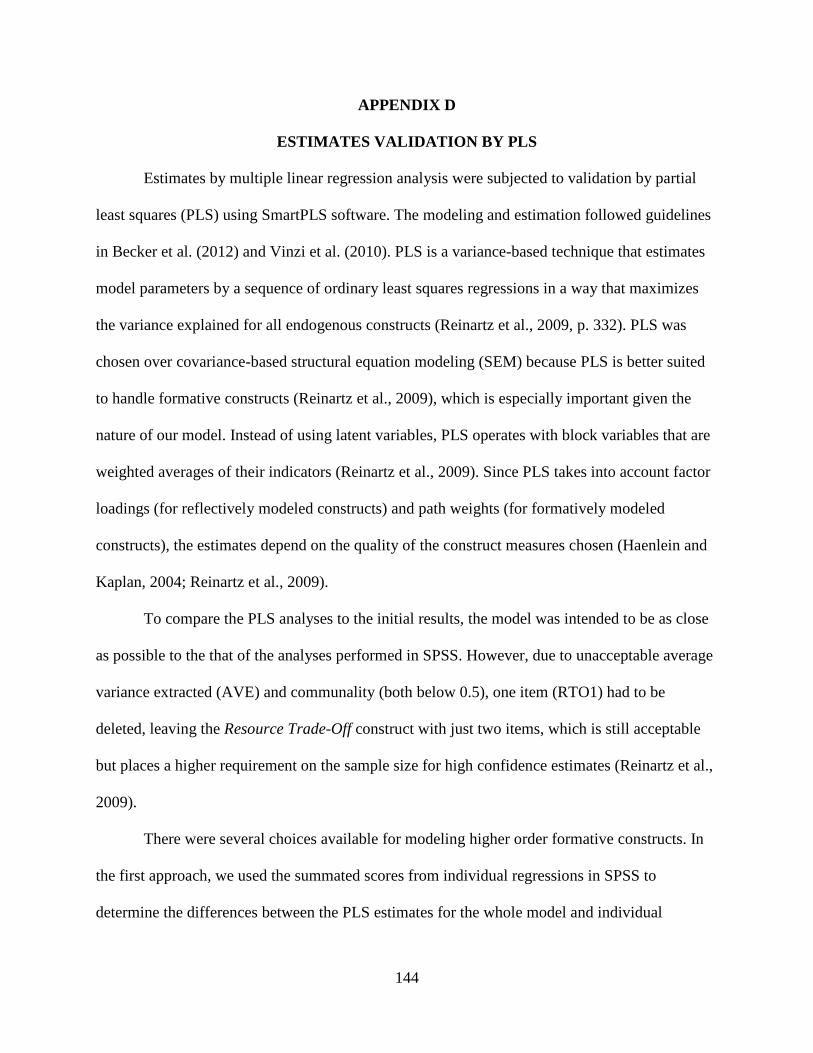
144
APPENDIX D
ESTIMATES VALIDATION BY PLS
Estimates by multiple linear regression analysis were subjected to validation by partial
least squares (PLS) using SmartPLS software. The modeling and estimation followed guidelines
in Becker et al. (2012) and Vinzi et al. (2010). PLS is a variance-based technique that estimates
model parameters by a sequence of ordinary least squares regressions in a way that maximizes
the variance explained for all endogenous constructs (Reinartz et al., 2009, p. 332). PLS was
chosen over covariance-based structural equation modeling (SEM) because PLS is better suited
to handle formative constructs (Reinartz et al., 2009), which is especially important given the
nature of our model. Instead of using latent variables, PLS operates with block variables that are
weighted averages of their indicators (Reinartz et al., 2009). Since PLS takes into account factor
loadings (for reflectively modeled constructs) and path weights (for formatively modeled
constructs), the estimates depend on the quality of the construct measures chosen (Haenlein and
Kaplan, 2004; Reinartz et al., 2009).
To compare the PLS analyses to the initial results, the model was intended to be as close
as possible to the that of the analyses performed in SPSS. However, due to unacceptable average
variance extracted (AVE) and communality (both below 0.5), one item (RTO1) had to be
deleted, leaving the Resource Trade-Off construct with just two items, which is still acceptable
but places a higher requirement on the sample size for high confidence estimates (Reinartz et al.,
2009).
There were several choices available for modeling higher order formative constructs. In
the first approach, we used the summated scores from individual regressions in SPSS to
determine the differences between the PLS estimates for the whole model and individual
145
regression estimates in SPSS. For this analysis higher-order constructs were given the scores of
summated (equally weighted) items from the SPSS regressions. When the summated scores were
applied to the respective higher-order variables, the PLS estimation produced results similar to
those of individual regressions confirming all hypotheses. However, the path coefficients were
lower and their bootstrapped t-statistics indicating significance was smaller. These results are
consistent with observations, including empirical comparisons noted in the literature that the PLS
method tends to underestimate path coefficients, for some models as much as 25% (Becker et al.,
2012; Reinartz et al., 2009).
Next, we used methods specific to PLS modeling to create models with higher-order
formative constructs. There are three approaches discussed in the literature: (1) the two-stage; (2)
the repeated indicator; and (3) the hybrid approaches. The repeated indicator approach was not
appropriate, because our model included block variables with different number of indicators
(Becker et al., 2012), which left us with the two remaining approaches to consider.
According to Becker et al. (2012, the two-stage approach, “estimates the construct scores
of the first order constructs in a first-stage model without the second order construct present, and
subsequently uses these first-stage construct scores as indicators for the higher-order latent
variable in a separate second-stage analysis” (p. 365). Under the hybrid approach the indicator
variables of each first-order construct are split into two halves. The items in the first half are used
with their original constructs, while the items in the other half are “assigned” together to the
higher-order construct and are used to estimate its scores (Becker et al., 2012). The hybrid
approach is an improvement on the repeated indicators approach from the theoretical perspective
in that it avoids artificially correlated residuals by using each indicator variable only once
146
(Becker et al., 2012); however, it obviously shares the same problem of bias due to the different
number of indicators, a fact that seems to be overlooked in the popular PLS literature.
When using these two approaches to modeling higher-order constructs, we received
similar results confirming all hypotheses with the exception of the significance of one path:
Focused Resource Capacity Management � Warehouse Capacity and Throughput (Hypothesis
1a). Hypothesis 1a was significant in the model with the hybrid approach to modeling higher-
order constructs and insignificant using the two-stage approach. In the original SPSS regression
analysis, this hypothesis was significant at the 95% confidence level, while all others were
significant at the 99% confidence level.
Moreover, the hybrid method allowed a number of options of how to split indicator
variables, including those with unequal number of indicators (Focused Strategic Resource
Capacity Management), and it also affected the significance level. The possible explanations for
the drop in significance of this path coefficient are the inherent downward bias and inconsistency
of estimates of the PLS method (Reinhartz, et al., 2009) and its sensitivity to certain features of
our model that make it less appropriate for estimation with PLS. Specifically, Focused Strategic
Resource Capacity Management has too few indicators (three), and displays a lack of internal
consistency when they are spit. PLS is known for inconsistency and bias due to the reliability
issues in the construct measures and the low number of indicators (Reinartz et al., 2009).
Fortunately, these effects are isolated; they are limited to specific paths and do not affect other
parts of the model (Reinartz et al., 2009).
In conclusion, we were able to validate all hypotheses but one by using an alternative
estimation method (PLS). For one hypothesis (H1a) we were unable to provide a definite
validation due to the limitations of the method and the model.