Embed Size (px)
Citation preview
Managing Uncertainty to Improve the Cost Performance of Complex Infrastructure Projects
Sidney Newton The University of New South Wales
email:[email protected] Martin Skitmore
Queensland University of Technology email:[email protected]
Peter Love Curtin University
email:[email protected]
Abstract
There has been a recent spate of high profile infrastructure cost overruns in Australia and internationally. This is just the tip of a longer-term and more deeply-seated problem with initial budget estimating practice, well recognised in both academic research and industry reviews: the problem of uncertainty. A case study of the Sydney Opera House is used to identify and illustrate the key causal factors and system dynamics of cost overruns. It is conventionally the role of risk management to deal with such uncertainty, but the type and extent of the uncertainty involved in complex projects is shown to render established risk management techniques ineffective. This paper considers a radical advance on current budget estimating practice which involves a particular approach to statistical modelling complemented by explicit training in estimating practice. The statistical modelling approach combines the probability management techniques of Savage, which operate on actual distributions of values rather than flawed representations of distributions, and the data pooling technique of Skitmore, where the size of the reference set is optimised. Estimating training employs particular calibration development methods pioneered by Hubbard, which reduce the bias of experts caused by over-confidence and improve the consistency of subjective decision-making. A new framework for initial budget estimating practice is developed based on the combined statistical and training methods, with each technique being explained and discussed.
Keywords: Uncertainty, Calibration, Data Pooling, Risk management
1. Introduction
Building and infrastructure construction is renowned for running over cost and over time. The cost performance of recent high-profile infrastructure projects in Australia are just one case in point: Melbourne wholesale fruit and vegetable market cost more than double the $230 million budget (Victorian Auditor-General’s Report, 2012), Epping to Chatswood rail project in Sydney
went over budget by $300 million (New South Wales Audit Office, 2010), Perth Arena cost more than 3 times the original estimate of $160 million (Western Australia Auditor General, 2010), ASIO central headquarters in Canberra cost more than $40 million over budget (ASIO, 2011). Of course the cost overrun associated with the Sydney Opera House (SOH) project is now legendary –from an initial forecast of A$7m in 1957, the project costs are said to have ballooned by a factor of 14.5 to an actual cost outturn in 1973 of A$102m. Why do the costs of a construction project escalate so dramatically and how might the cost performance of complex projects be improved?
The prevalence of construction cost overruns, particularly in complex infrastructure projects, has many and varied causes (Ramanathan et al, 2012). We all understand that designs change, clients vacillate, productivity varies, delays occur, economies cycle and markets fluctuate. Fundamentally, however, there is a particular flaw in the fabric of basic budget estimating practice when it comes to dealing with such vagaries. The flaw is well recognised in academic research and by an increasing number of industry reviews (see for example, Flyvbjerg, 2013; Dept of Infrastructure and Transport, 2012): it is a flaw in how cost estimating deals with uncertainty. Risk management was developed specifically to deal with the kinds of uncertainty inherent in a major construction project. However, the type and extent of the uncertainties involved in complex infrastructure projects have rendered the established risk management techniques increasingly ineffective. Leading experts Hubbard (2009) and Makridakis et al (2009) highlight the failings of risk management theory in that context: it neglects the biggest risks, lacks calibration, utilises tools that are seriously flawed and relies on outcomes which demonstrably fail to deliver reliable budgets.
This paper reviews the principal drivers of construction cost variability and characterises the key elements of how uncertainty is currently managed/mismanaged in construction cost forecasting. The SOH provides a salutary case study in how a range of factors can collude to repeatedly blow costs well beyond the latest cost estimate, and why risk management theory abjectly fails to cope with the nature of the problem. A radical reformulation of current cost forecasting methods is proposed. The reformulation responds directly to each key failing and proposes a series of procedural changes that will significantly improve the cost performance of large construction projects, particularly the more speculative and innovative projects characterised by the likes of the SOH development. Three procedural improvements are proposed: the use of actual cost data probability distributions to better inform the estimating process, more effective calibration of cost estimating practice and incentivised cost estimating performance, and the collective integration of multiple models and expert opinions of the cost budget forecast.
2. The cost performance of Sydney opera house
Almost every account of the SOH construction project, and it seems every case study on cost overruns, includes reference to what is universally considered the most extreme case of cost overrun in modern construction history. From an original cost and scheduling estimate in 1957
projecting a final cost of A£3,500,000 and completion date of January 1963, the project was completed ten years late and (commonly claimed) more than fourteen times over budget (Drew, 1999). But was the project quite the cost estimating basket-case it is proclaimed to be?
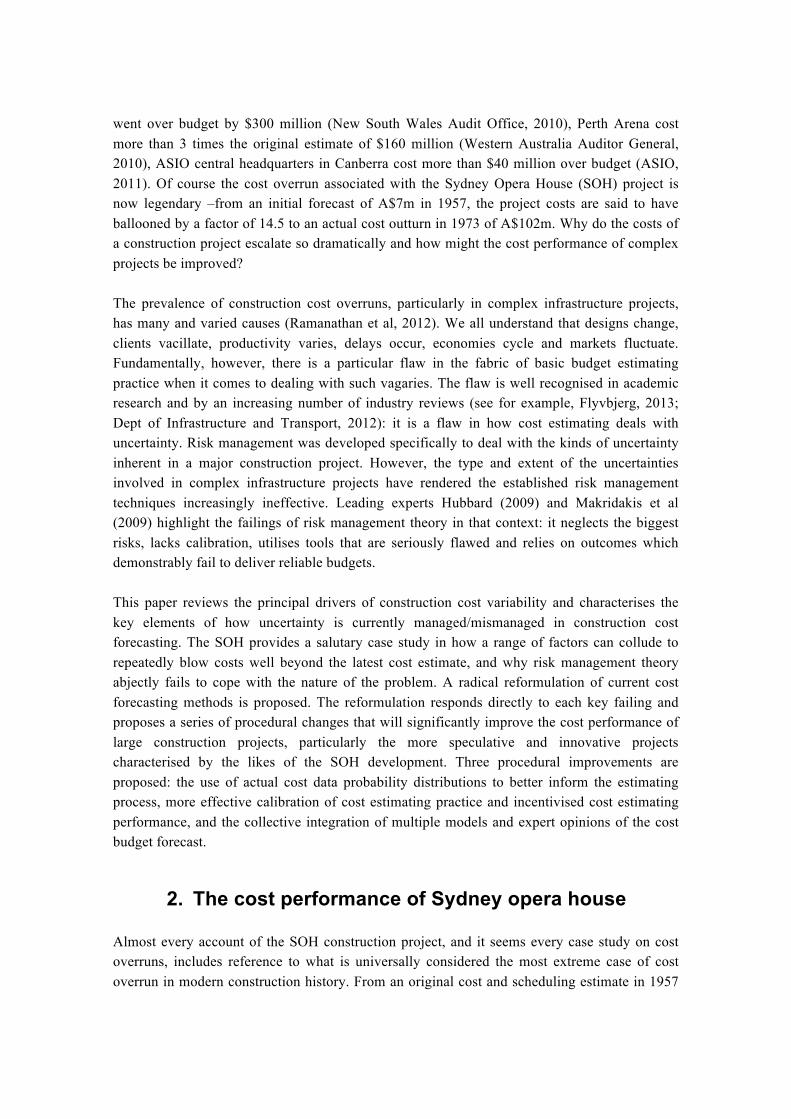
There is little dispute that the project was completed 10 years late, in 1973. The claim that costs escalated by a factor of more than fourteen, however, is contestable. The official listing of budget estimates (Drew, 2000) is presented in Table 1, column Actual Estimate. Using just the raw numbers, the final overrun would be more like 29 times the original estimate. However, the Australian currency was decimalised in 1966 and Table 1, column Dollar Equivalent uses the Reserve Bank of Australia, Pre-Decimal Inflation Calculator to convert Pounds into their direct Dollar equivalents. This is the basis on which a cost overrun of more than fourteen (actually 14.6) is generally claimed.
Table 1: A listing of SOH budget estimates in Australian currency values
Year Actual Estimate Dollar Equivalent 1974 Dollars 2014 Dollars1957 £3,500,000 $7,000,000 $13,512,780 $100,979,9811958 £4,880,000 $9,760,000 $18,709,460 $139,814,3731959 £5,300,000 $10,600,000 $19,907,063 $148,763,97119601961 £9,300,000 $18,600,000 $32,922,046 $246,023,9531962 £13,750,000 $27,500,000 $48,830,193 $364,904,3301963 £14,799,529 $29,599,058 $52,222,532 $390,255,0211964 £17,200,000 $34,400,000 $59,001,792 $440,915,9151965 £24,700,000 $49,400,000 $81,939,000 $612,323,9351966196719681969 $85,000,000 $85,000,000 $124,576,720 $930,952,38119701971 $93,000,000 $93,000,000 $124,149,398 $927,759,0361972 $102,000,000 $102,000,000 $128,427,273 $959,727,2731973 $98,709,085 $98,709,085 $113,926,736 $851,365,8581974 $102,000,000 $102,000,000 $102,000,000 $762,238,267
Overrun 29.1 14.6 7.5 7.5
Comparing a dollar value from 1957 with a dollar value from 1974 however is suspect. If all dollar values are brought to the same time base of 1974 using the Australian Reserve Bank conversions, as presented in Table 1, column 1974 Dollar, the apparent cost escalation reduces to more like a factor of seven or eight (actually 7.5) – still a significant cost overrun, but less extreme than common claims. Interestingly, converting each estimate to 2014 dollar value, as presented in Table 1, column 2014 Dollar, the final project cost equivalent is A$7.6billion – only about 3 times the budget cost for the current transformation of Sydney’s Darling Harbour exhibition and hotel precinct; slightly more than the current Barangaroo urban transformation of Sydney’s Central Business District; and ¾ the budget cost for the current 33 kilometre WestConnex integrated transport and urban revitalisation corridor linking Sydney’s west, city, south and airport. On the other hand, for a total seating capacity of 5,738 patrons the SOH
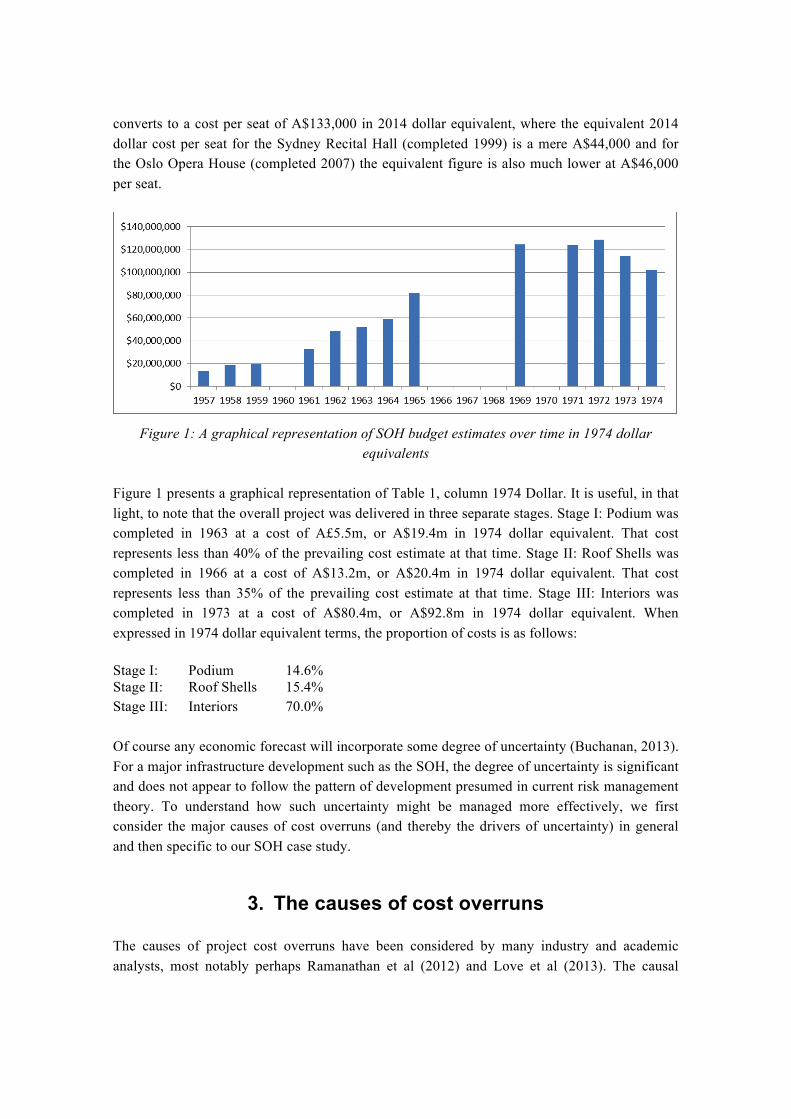
converts to a cost per seat of A$133,000 in 2014 dollar equivalent, where the equivalent 2014 dollar cost per seat for the Sydney Recital Hall (completed 1999) is a mere A$44,000 and for the Oslo Opera House (completed 2007) the equivalent figure is also much lower at A$46,000 per seat.
Figure 1: A graphical representation of SOH budget estimates over time in 1974 dollar
equivalents
Figure 1 presents a graphical representation of Table 1, column 1974 Dollar. It is useful, in that light, to note that the overall project was delivered in three separate stages. Stage I: Podium was completed in 1963 at a cost of A£5.5m, or A$19.4m in 1974 dollar equivalent. That cost represents less than 40% of the prevailing cost estimate at that time. Stage II: Roof Shells was completed in 1966 at a cost of A$13.2m, or A$20.4m in 1974 dollar equivalent. That cost represents less than 35% of the prevailing cost estimate at that time. Stage III: Interiors was completed in 1973 at a cost of A$80.4m, or A$92.8m in 1974 dollar equivalent. When expressed in 1974 dollar equivalent terms, the proportion of costs is as follows:
Stage I: Podium 14.6% Stage II: Roof Shells 15.4% Stage III: Interiors 70.0%
Of course any economic forecast will incorporate some degree of uncertainty (Buchanan, 2013). For a major infrastructure development such as the SOH, the degree of uncertainty is significant and does not appear to follow the pattern of development presumed in current risk management theory. To understand how such uncertainty might be managed more effectively, we first consider the major causes of cost overruns (and thereby the drivers of uncertainty) in general and then specific to our SOH case study.
3. The causes of cost overruns
The causes of project cost overruns have been considered by many industry and academic analysts, most notably perhaps Ramanathan et al (2012) and Love et al (2013). The causal
determinants involve a combination of three elements (see for further details: Chapman and Ward, 2011):
3.1 Human estimating factors
Human estimating factors include such elements as optimism bias, aspirational preferences, calibration and strategic misrepresentation. In the context of SOH, there was certainly real and apparent strategic misrepresentation of the earliest budget estimates, as under-estimation was the only way to ensure political and public support for the project (Baume, 2014). Ultimately the fate of the SOH and the presiding State government were inseparable and the commissioning of the SOH played a key role in the re-election of the sitting Labor government in 1959 (Drew, 1999). There were also clear cases of optimism bias throughout the project, starting broadly with the appointment of Utzon as Architect, despite his total lack of actual building experience. Optimism bias more specific to the cost overruns started with the acceptance of Civil & Civic as the initial contractors on the project, despite a tender price substantially lower than the next best and their alleged reputation for deliberately under-pricing tender submissions (Murray, 2004).
3.2 Technical estimating factors
Technical estimating factors include the quality of the data, knowledge of the market and the choice of estimating methodology. In the context of SOH, the quality of the data available at the earliest stages was severely compromised by the client’s insistence that a tender be called before the relevant design and working drawings had been anywhere near completed. Rework is the most predominant direct cause of cost variations (Love et al, 2010). Constant design and construction changes had huge impact on the overall cost of the SOH project. For example, the estimate revision following the choice of a ribbed ellipsoidal roof profile added almost 65% to the costs. Major design changes resulting from significant changes by the client in terms of seating capacities and general arrangements of the main halls more than doubled the estimated costs. Incorrect column placements for the major structural elements required massively reinforced concrete bases to be demolished using explosives, adding significant cost and time delays to the project.
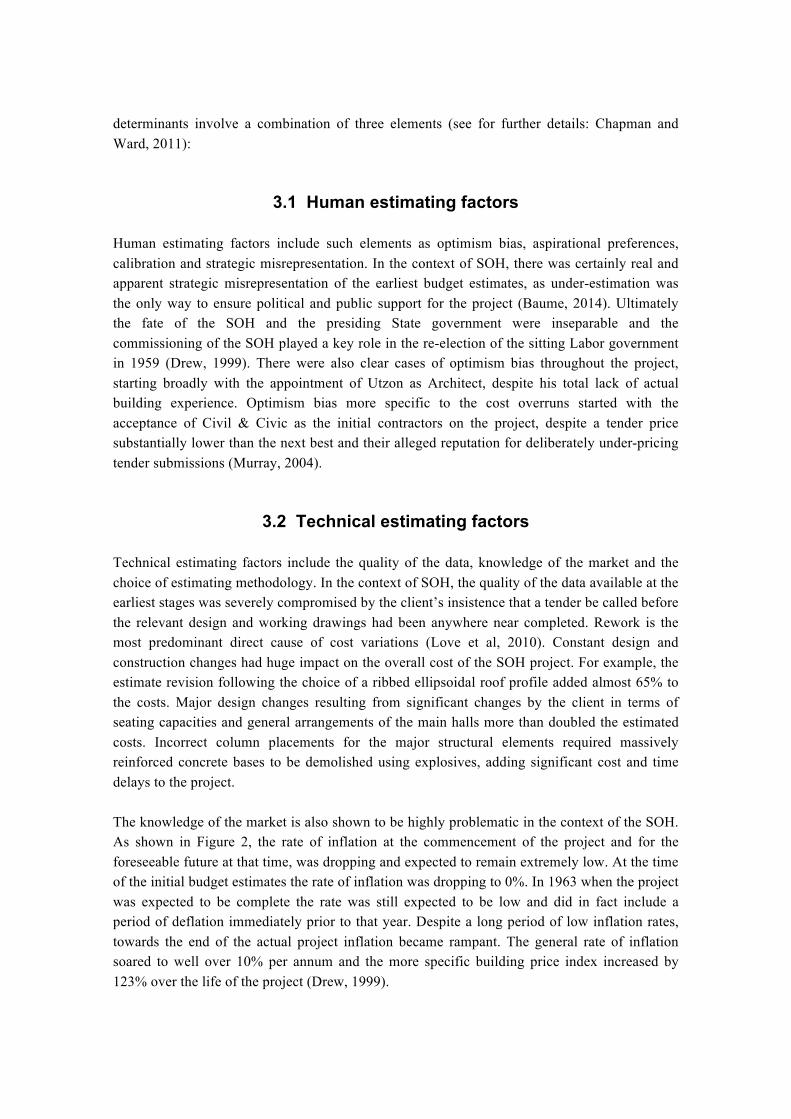
The knowledge of the market is also shown to be highly problematic in the context of the SOH. As shown in Figure 2, the rate of inflation at the commencement of the project and for the foreseeable future at that time, was dropping and expected to remain extremely low. At the time of the initial budget estimates the rate of inflation was dropping to 0%. In 1963 when the project was expected to be complete the rate was still expected to be low and did in fact include a period of deflation immediately prior to that year. Despite a long period of low inflation rates, towards the end of the actual project inflation became rampant. The general rate of inflation soared to well over 10% per annum and the more specific building price index increased by 123% over the life of the project (Drew, 1999).
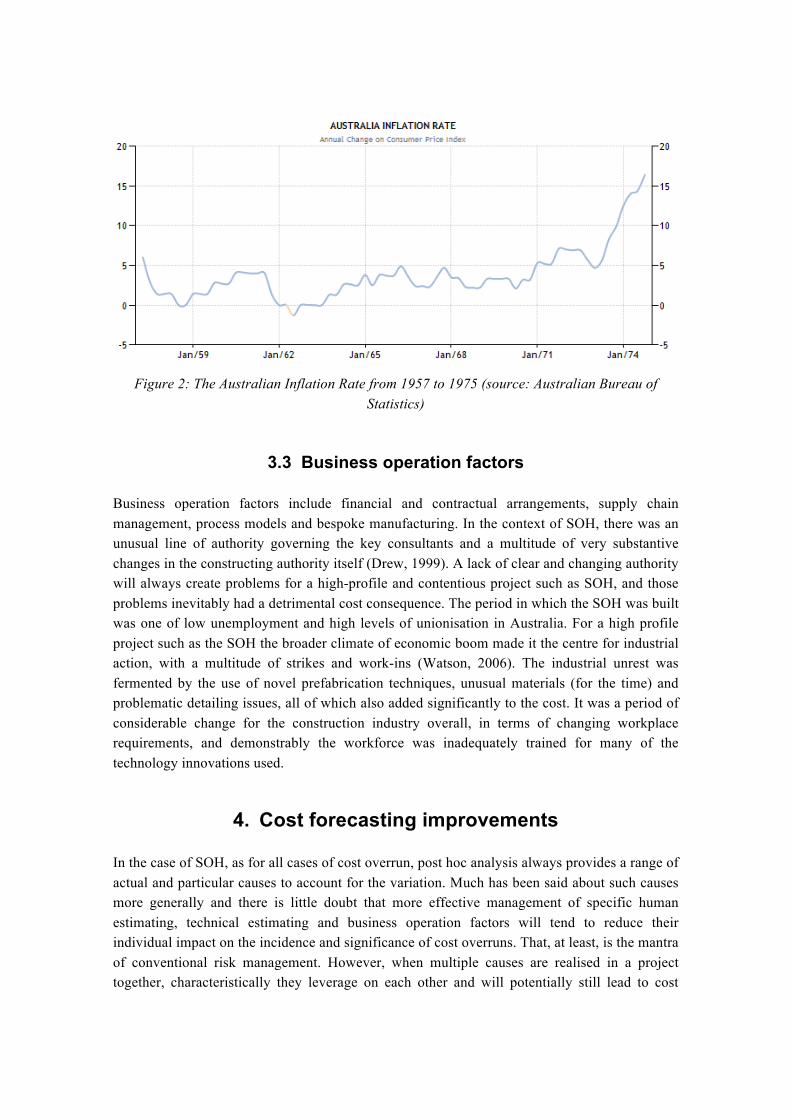
Figure 2: The Australian Inflation Rate from 1957 to 1975 (source: Australian Bureau of
Statistics)
3.3 Business operation factors
Business operation factors include financial and contractual arrangements, supply chain management, process models and bespoke manufacturing. In the context of SOH, there was an unusual line of authority governing the key consultants and a multitude of very substantive changes in the constructing authority itself (Drew, 1999). A lack of clear and changing authority will always create problems for a high-profile and contentious project such as SOH, and those problems inevitably had a detrimental cost consequence. The period in which the SOH was built was one of low unemployment and high levels of unionisation in Australia. For a high profile project such as the SOH the broader climate of economic boom made it the centre for industrial action, with a multitude of strikes and work-ins (Watson, 2006). The industrial unrest was fermented by the use of novel prefabrication techniques, unusual materials (for the time) and problematic detailing issues, all of which also added significantly to the cost. It was a period of considerable change for the construction industry overall, in terms of changing workplace requirements, and demonstrably the workforce was inadequately trained for many of the technology innovations used.
4. Cost forecasting improvements
In the case of SOH, as for all cases of cost overrun, post hoc analysis always provides a range of actual and particular causes to account for the variation. Much has been said about such causes more generally and there is little doubt that more effective management of specific human estimating, technical estimating and business operation factors will tend to reduce their individual impact on the incidence and significance of cost overruns. That, at least, is the mantra of conventional risk management. However, when multiple causes are realised in a project together, characteristically they leverage on each other and will potentially still lead to cost
blow-outs (Bakhshi and Touran, 2012). Take, for example, the issue of optimism bias. When taken in isolation, Flyvbjerg (2008) proposes the use of an adjustment percentage, or uplift. The case for an uplift to be applied is based on data such as illustrated in Figure 3.
Figure 3. The % variation between initial and outturn costs for 258 infrastructure projects (source: Flyvbjerg et al, 2002, p.283)
The application of an uplift percentage will certainly better align the average estimate with the average outturn cost. However, it will do next to nothing to address the coefficient of variation. A successful application of the uplift would merely shift the Figure 3 x-axis slightly, but not change the more significant distribution shape. Cost blow-outs will still occur, as might be noted in cases in the UK such as the Scottish Parliament Building and the Millennium Dome, where cost overruns were experienced despite the requirement in the UK Treasury Green Book to apply an uplift adjustment – the Green Book is guidance for central government on how publicly funded bodies should manage risks and obtain the best public value. Indeed, a recent report by the UK-based Infrastructure Risk Group (IRG, 2013) recommends that optimism bias-based uplifts be avoided.
A further consideration of Figure 3 notes that the distribution shape for cost overruns is characteristically skewed (fat tail) to the right. The fat tail is indicative of a power-law relationship, and explicitly not the Gaussian distribution that underpins so much of risk management and current cost estimating practice. The misrepresentation of power-law distributions using mean and standard deviation measures as descriptors is exactly what Savage (2009) refers to as ‘The Flaw of Averages’, and so neatly illustrates in Figure 4.
What underlies multiple potential causes of cost escalation, and particularly the structural dynamics (interactions) that leverage between them and lead to cost blow-outs, is uncertainty. Uncertainty is distinguished from risk management in order to avoid at least two of the fundamental misconceptions associated with current risk management practice: that the principal cause of cost overruns can be controlled effectively from within the project; and that potential for cost-blow-outs reduce significantly as a project progresses and what was initially unknown or only partially known becomes better understood. Managing uncertainty is about managing the structural dynamics, not just the direct causes, and about putting in place a
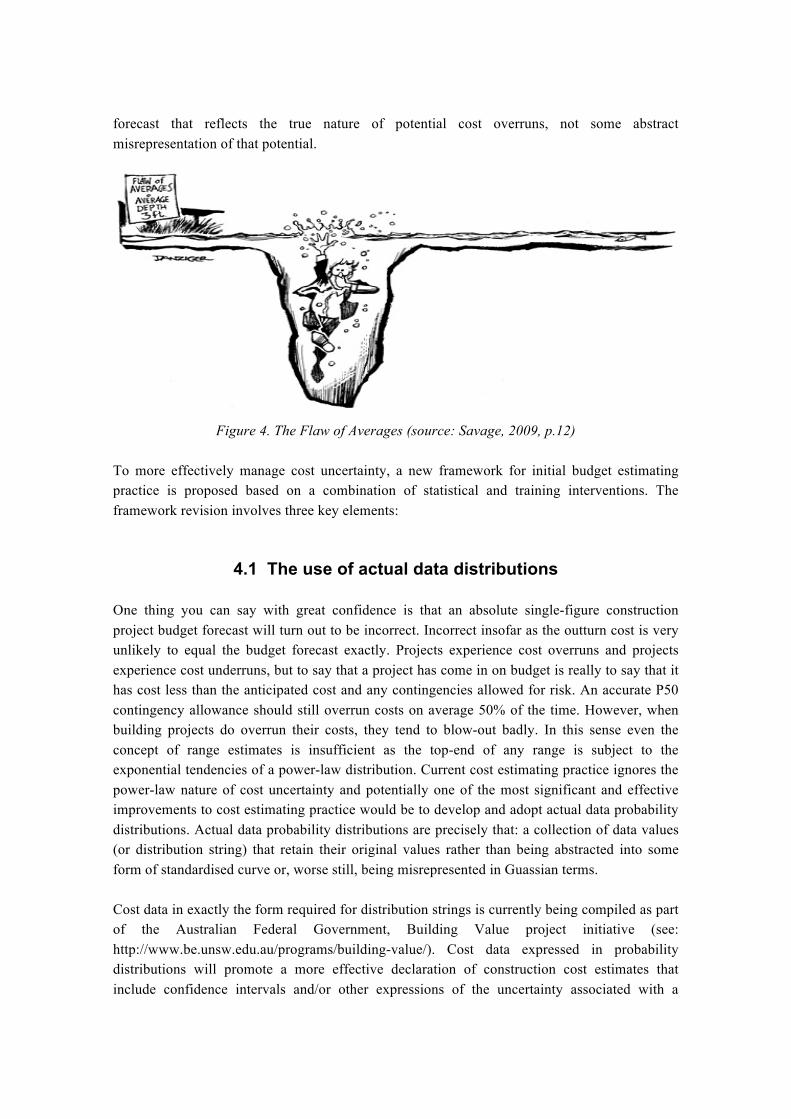
forecast that reflects the true nature of potential cost overruns, not some abstract misrepresentation of that potential.
Figure 4. The Flaw of Averages (source: Savage, 2009, p.12)
To more effectively manage cost uncertainty, a new framework for initial budget estimating practice is proposed based on a combination of statistical and training interventions. The framework revision involves three key elements:
4.1 The use of actual data distributions
One thing you can say with great confidence is that an absolute single-figure construction project budget forecast will turn out to be incorrect. Incorrect insofar as the outturn cost is very unlikely to equal the budget forecast exactly. Projects experience cost overruns and projects experience cost underruns, but to say that a project has come in on budget is really to say that it has cost less than the anticipated cost and any contingencies allowed for risk. An accurate P50 contingency allowance should still overrun costs on average 50% of the time. However, when building projects do overrun their costs, they tend to blow-out badly. In this sense even the concept of range estimates is insufficient as the top-end of any range is subject to the exponential tendencies of a power-law distribution. Current cost estimating practice ignores the power-law nature of cost uncertainty and potentially one of the most significant and effective improvements to cost estimating practice would be to develop and adopt actual data probability distributions. Actual data probability distributions are precisely that: a collection of data values (or distribution string) that retain their original values rather than being abstracted into some form of standardised curve or, worse still, being misrepresented in Guassian terms.
Cost data in exactly the form required for distribution strings is currently being compiled as part of the Australian Federal Government, Building Value project initiative (see: http://www.be.unsw.edu.au/programs/building-value/). Cost data expressed in probability distributions will promote a more effective declaration of construction cost estimates that include confidence intervals and/or other expressions of the uncertainty associated with a
forecast. Adopting ranges to explain early-stage project uncertainty was also a key recommendation of IRG (2013), but in that report the presumption is still that a P10, P50 and P90 triangulation is sufficient to describe what inevitably is a far more complex distribution. Using an abstract triangulation of a power-law data distribution does not address the flaw of averages problem and abjectly fails to capture the true potential for cost blow-outs. With no measure of the potential uncertainty there can be little effective management of it.
4.2 Draw the data from broad-based sources and use multiple models
It is common practice in cost estimating for a single expert to derive an estimate and cost plan based on some reference set of similar, previous projects. However, as demonstrated in the current (poor) cost performance of complex projects, experts acting alone tend not to produce effective forecasts (Buchanan, 2013). Experts in groups often perform even worse again. Part of the problem is in how reference set forecasting is intended to function. A critical factor with all forms of reference set forecasting is the size and make-up of the set: too many projects and the similarities begin to disappear, too few projects and the statistical credibility is questionable. A data pooling method to validate the optimum size of a reference set for statistical analysis specific to the individual project situation has been proposed (see for example Yeung and Skitmore, 2012).
At the same time, in more general terms, the statistically most reliable reference set is actually the broad-based, heterogeneous model (Savage, 2009). Broad-based models do have their limitations however, particularly in the context of substantive uncertainty. In that context, the most robust approach is to use a combination of broad-based and specific models supplemented with expert opinion (Chapman and Ward, 2011). Extending the initial budget estimating framework to incorporate a variety of models and expert opinion would improve the consistency and effectiveness of the estimate quite markedly, and strengthen the cost performance of projects accordingly.
4.3 Apply the data within a methodical process of calibration
Love et al (2009) has argued that the causal determinants of cost variations can most usefully be considered in terms of a pathogen, rather than as something more explicit and extant. The notion of a pathogen recognises that factor interdependencies are highly complex, changing and critical to cost estimating accuracy (Bakhshi and Touran, 2012). The concept of a pathogen describes a latent condition, integral to existing construction practice, which sparks into effect in demonstrably varied and unpredictable ways. The pathogen framework helps move attention from the multifarious symptoms of a problem to their underlying causes. Considered thus, problem factors must be documented and reported over time so that latent pathogens can be identified.
To document and report the performance of cost forecasting is the first critical step in effective calibration of the estimating process. Experts in any context require frequent calibration to mitigate optimism bias, but an effective means of incentivising performance is what best fuels performance improvement (Hubbard, 2010). A strong possibility for cost estimating is the use of a Brier Score, originally developed for weather forecasters (Brier, 1950). The Brier Score has all the key characteristics of an effective incentive method, in particular it provides a verification scheme to privilege forecasts that are right when the estimator is confident in the estimate over those estimators who are correct but express less confidence. In this way the score is impossible to ‘game’ because the Brier Score will penalise whenever the actual forecasts are right or wrong more or less often than the level of confidence expressed in each forecast. Naturally, incentivisation must also be modified by the level of risk exposure. Taking the P90 budget position and coming in on budget, for example, should not attract the same reward as taking a lower probability position and coming in on budget.
5. Conclusions
A review of the SOH case study has exposed and illustrated a range of the individual factors that contribute to cost overruns. It is clear, however, that the critical factor is how multiple causes act in concert to blow-out costs along the characteristically fat-tail of a probability distribution. This structural dynamics represents the cost uncertainty, and conventional risk management techniques are not able to address cost uncertainty effectively when power-law distributions are at play.
To improve cost performance in the context of uncertainty, a series of statistical and operational interventions are proposed: the use of data distributions that comprise the actual data points rather than an abstract and highly simplified representation of the distribution; drawing the data from broad-based, heterogeneous sources and the combination of multiple models and estimate sources; and applying the data within a methodical process of calibration which includes for an appropriate and effective incentivisation framework.
6. References
ABS (2010) A Statistical Overview of the Construction Industry, Online http://www.abs.gov.au/AUSSTATS/[email protected]/Lookup/1350.0Feature+Article1Oct+2010
ASIO (2011) ASIO Report to Parliament 2011-12. Online http://www.asio.gov.au/img/files/ASIO-Annual-Report-2011-12_full.pdf
Bakhshi, P. and Touran, A. (2012) A New Approach for Contingency Determination in a Portfolio of Construction Projects, Journal of Risk Analysis and Crisis Response, Vol.2, No.4, pp.223-232.
Baume, M. (2014) Villains and Myths at the Sydney Opera House, Quadrant, January-February 2014, pp.84-88.
Brier, G.W. (1950) Verification of Forecasts Expressed in Terms of Probability, Monthly Weather Review, Vol.78, No.1, pp.1-3.
Buchanan, M. (2013) Forecast: What physics, meteorology and the natural sciences can teach us about economics, London: Bloomsbury Pubs.
Chapman, C. & Ward, S. (2011) How to Manage Project Opportunity and Risk. UK: John Wiley.
Department of Infrastructure and Transport (2012) Infrastructure Planning and Delivery: Best Practice Case Studies, Vol 2, Canberra: Commonwealth of Australia.
Drew, P. (1999) The Masterpiece: Jørn Utzon A Secret Life, Melbourne: Hardie Grant Books.
Drew, P. (2000) Utzon and the Sydney Opera House, Sydney: Inspire Press.
Flyvbjerg, B. (2008) Curbing Optimism Bias and Strategic Misrepresentation in Planning: Reference Class Forecasting in Practice, European Planning Studies, Vol.16, No.1, pp.3-21.
Flyvbjerg, B. (2013) ‘Quality control and due diligence in project management: Getting decisions right by taking the outside view’, International Journal of Project Management Vol.31, pp.760–774.
Flyvbjerg, B., Holm, M. S. and Buhl, S. (2002) Underestimating costs in public works projects: error or lie?, Journal of the American Planning Association, Vol.68, No.3, pp.279-295.
Hubbard, D.W. (2009) The Failure of Risk Management. New Jersey: John Wiley.
Hubbard, D.W. (2010) How to Measure Anything: Finding the Value of Intangibles in Business, (2nd Ed). New Jersey: John Wiley & Sons.
IGR (2013) Managing Cost Risk and Uncertainty in Infrastructure Projects, Online, http://theirm.org/documents/IRMREPORTLRV2_001.pdf
Love, P., Edwards, D., Irani, Z. & Walker, D. (2009) Project pathogens: The anatomy of omission errors in construction and civil engineering projects’, IEEE Transactions on Engineering Management Vol.56, No.3, pp.425-435.
Love, P., Edwards, D.J., Watson, H. and Davis, P. (2010) Rework in Civil Infrastructure Projects: Determination of Cost Predictors, Journal of Construction Engineering and Management, Vol.136, No.3, pp.275-282.
Love, P., Wang, X., Sing, C. & Tiong, R. (2013) Determining the Probability of Project Cost Overruns, Journal of Construction Engineering Management Vol.139, No.3, pp.321–330.
Makridakis, S., Hogarth, R. & Gaba, A. (2009) Forecasting and uncertainty in the economic and business world, International Journal of Forecasting Vol.25, pp.794-812.
Murray, P. (2004) The Saga of Sydney Opera House, London: Spon Press.
New South Wales Audit Office (2010) Auditor-General’s Report to Parliament 2010 Vol. 9 Online http://www.audit.nsw.gov.au/ArticleDocuments/187/26_Vol_9_2010_Transport_Infrastructure.pdf.aspx?Embed=Y
Ramanathan, C., Narayanan S. and Idrus, A.B. (2012) ‘Construction delays causing risks on time and cost – a critical review’, Australasian Journal of Construction Economics and Building Vol.12, No.1, pp.37-57.
Savage, S.L. (2009) The Flaw of Averages: Why We Underestimate Risk in the Face of Uncertainty, New Jersey, John Wiley & Sons.
Victorian Auditor-General’s Report (2012) Melbourne Markets Redevelopment, Online http://www.audit.vic.gov.au/publications/20120314-Melbourne-Markets/20120314-Melbourne-Markets.pdf
Watson, A. (ed) (2006) Building a Masterpiece: the Sydney Opera House, Sydney: Powerhouse Publishing.
Western Australia Auditor General (2010) The Planning and Management of the Perth Arena. Online https://audit.wa.gov.au/wp-content/uploads/2013/05/report2010_01.pdf
Yeung, K. & Skitmore, R. (2012) ‘A method for systematically pooling data in very early-stage construction price forecasting’, Construction Management and Economics Vol.30, No.11. pp.929-39.