Embed Size (px)
Citation preview

Managing the New Graduation Requirements: Lessons from the Field
Puyallup School District
Everett School District
Tacoma School District


Focus for today
To display the work of three districts which have implemented
systems to assure all students have the opportunity to meet the graduation requirements for the
class of 2008 and beyond.

Framing Question
What are your district, schools, and classrooms doing different or differently to assure that all
students in the class of 2008 and beyond have the opportunity to
meet the new graduation requirements?

A Time to Write!
• What are the obstacles you, your district, schools, and/or classrooms face when assuring all students in the class of 2008 and beyond have the opportunity to meet the new graduation requirements?
• What are the strategies you, your district, schools, and/or classrooms are using to assure all students in the class of 2008 and beyond have the opportunity to meet the new graduation requirements?

Puyallup School District
On-Time Graduation Specialist
Kimberlee Armstrong, RogersLisa Kusche, Emerald Ridge
Angie Reed, Puyallup

Three Comprehensive High Schools
Grades 10-12
Governor John R. Rogers 1700Puyallup 1600
Emerald Ridge 1500
Walker Alternative: Grades 9-12

Our Goal: Increase On Time
Graduation
If the current cohort graduation rate is 80.5%, for the class of 2010, approximately 300 students will not graduate with their class.

Our goal: Decrease Dropouts
Puyallup School District’s most recent dropout rate is 6.4%.

Credit Deficient Students
1st Semester Sophomores- less than 4 credits
1st Semester Juniors- less than 10 credits
1st Semester Seniors- less than 16 credits
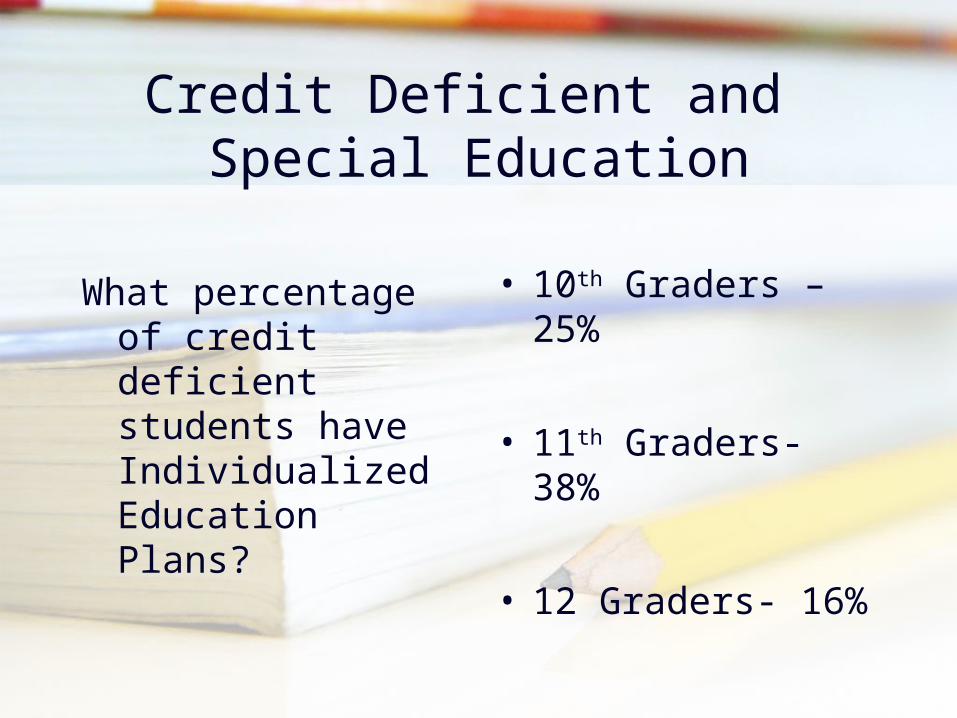
Credit Deficient and Special Education
What percentage of credit deficient students have Individualized Education Plans?
• 10th Graders – 25%
• 11th Graders- 38%
• 12 Graders- 16%

Our Goal: Get Students Back on Track
• Work with Counseling Team to enroll students in after school credit retrieval courses.
• Delay electives and have credit retrieval within daily schedule.
• Class of 2011: Required Credit Retrieval Course for those with less than 4 credits.
There is hope!

WASL and WASL Options
• School Assessment Coordinator• Work with Principal to identify and
monitor those who have not yet met WASL standards.
• COE courses• Student placement• Staff support

CAA Options
50 Seniors are enrolled in a Collection of Evidence class for reading and/or writing and will retake the reading and/or writing portion of the WASL.
400 Seniors are enrolled in a math class and will retake the math portion of the WASL in the Spring.
Approximately 30 seniors are doubling up on math second semester.

COE–Making It Work In Your Building
Leigh Ann Mahaffie –
Puyallup School District

Who should do the COE?
• Deeper, richer, harder, and more rigorous than WASL
• Not for everyone

Our Results
Spring WASL Score 2007
Number who passed CoE
Total Number of CoEs
Percent Passing CoE
334-349 4 9 45%
352-370 24 41 59%
372-390 45 74 61%
391-398 27 34 79%
400-430 20 24 83%
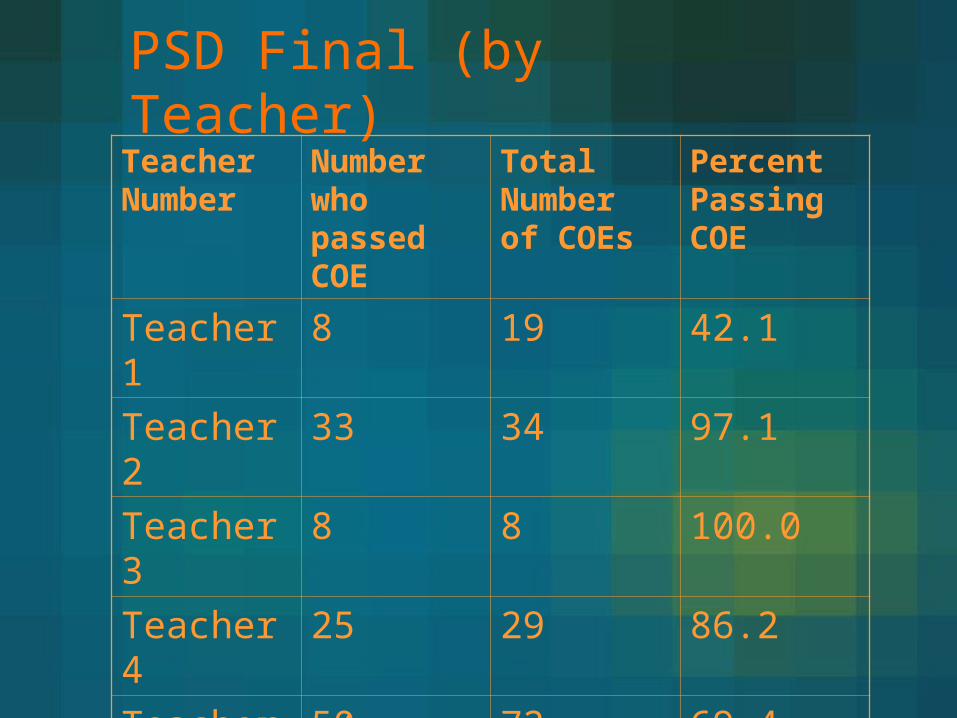
PSD Final (by Teacher)Teacher Number
Number who passed COE
Total Number of COEs
Percent Passing COE
Teacher 1 8 19 42.1
Teacher 2 33 34 97.1
Teacher 3 8 8 100.0
Teacher 4 25 29 86.2
Teacher 5 50 72 69.4
Teacher 6 2 31 6.5

PSD Results
• 193 CoEs were submitted by PSD (out of 700 statewide)• Range of scores from 26-114• Approximately 65% of our students met standard (50%
statewide)– School 1 49/61 80%– School 2 25/29 86%– School 3 52/103 51%

Math Approach Last Year
• Common Vision
• WASL Modules Class
• Item Creation
• OSPI approval

PSD This Year• One core package of 7 items and a pool of extras • 2 items for each content and process strand• Two Classes
– WASL Modules & Segmented WASL• Some items to be completed second semester in Segmented
WASL class • On Demand/Non On-Demand• Sharing statewide

PSD Next Year• Teachers’ Suggestions
– Segmented WASL-Year Long COE• Core set of 10 or 11 simpler items
– WASL Modules - no COE– COE Semester Class
• Srs 1st semester/Jrs 2nd semester• Core set of 7 complex problems

What Does It Look Like?(COE class)
Prep LessonsItem – Most items multi-strand
Revision• 1-2 Week process
– Stack items if you can (Ice Cream Containers leads to Sculpture Design or Painting Houses and Concert Tour Planning)
• Backward Design

What Does It Look Like?(Segmented WASL class)
Prep Lessons – Seg WASL materials
Item – Most items single-strandRevision
• 1-2 Week process– Dependent on the unit, activities chosen,
Segmented WASL test• Backward Design

Revision Day/Tracking
• Whole Group vs. Select Group
• Tracking Chart


Things to Take Away From Today
• Best teachers for resistant learners• Pay them well/Extra Planning/COE Coordinator• Scheduling• There is help!
– OSPI– ESD– me

Managing The New Graduation RequirementsBarriers to On Time Graduation
Terry EdwardsEverett Public Schools
WERA Spring ConferenceMarch 26-28, 2008

Goals
NCLB 85% of On-time Graduates by 2014
Community/Parents 100% of their children right now
Work Force Prepare students for entry into high skilled and high wage
jobs College
Students ready to engage in college level course work without remediation
Board 100% of students graduate when they have met standard

High School Graduation
An educational mandate An economic necessity A civil right A moral imperative

Graduation Definitions
Graduation The completion of required course
work and assessments leading to a high school diploma
On Time Graduation The completion of required course
work and assessments leading to a high school diploma four years after commencing grade 9.

The Graduation Question
Graduation for the Individual Yes / No
Graduation for the District OnTime Rate / Extended Grad Rate

On Time Graduation Rate
Graduating = Initial Gr 9 + Net + Drop Cohort Enrollment Transfers Outs

On Time Graduation Rate
# Graduates (N)# Cohort (D)
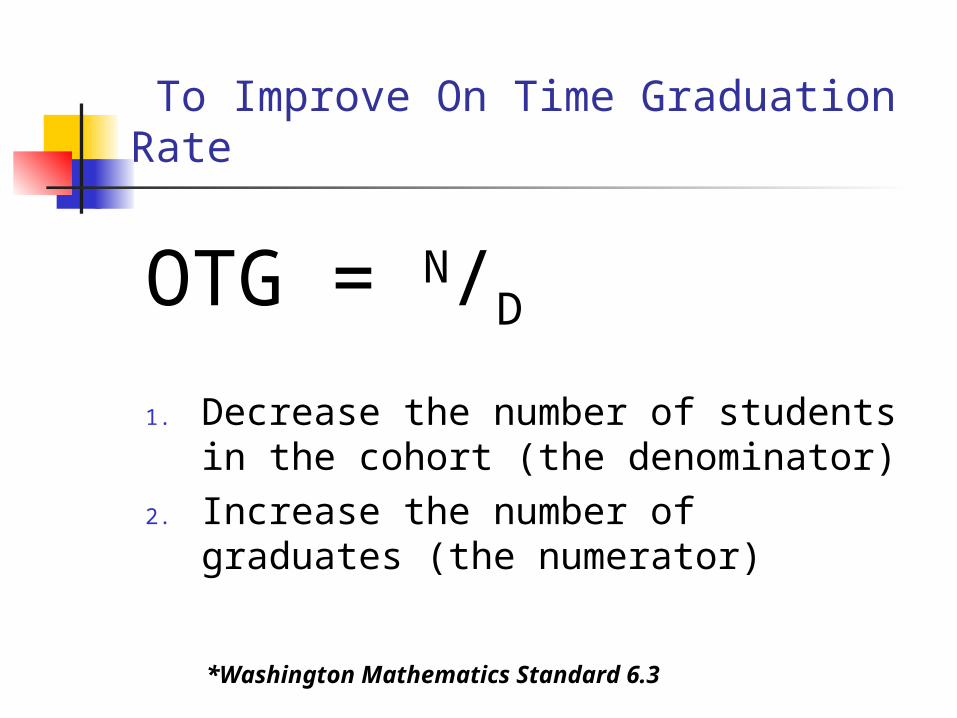
To Improve On Time Graduation Rate
OTG = N/D
1. Decrease the number of students in the cohort (the denominator)
2. Increase the number of graduates (the numerator)
*Washington Mathematics Standard 6.3

To Improve Your Denominator
Audit your business practices around the completion of your P-210
Verify and reduce drop out numbers U – D – C codes
Review building practices in track record requests for transfer students, make sure you include your special education department
Verify student continued enrollment (RSVP) Personalized outreach to prevent and
recover drop outs Success coordinator Counselor teacher
Review district variance practices

Summary by SchoolP210 C’s, D’s and U’s2004-05 to 2006-07 School Year
CHS EHS JHS SHS Others TotalCs 2 8 1 7 0 18Ds 15 26 16 72 5 134Us 148 22 65 251 24 510
Total: 165 56 82 330 29 662
CHS EHS JHS SHS Others TotalCs 5 3 2 6 1 17Ds 3 35 20 24 1 83Us 119 37 39 96 33 324
Total: 127 75 61 126 35 424
CHS EHS JHS SHS Others TotalCs 1 1 2 5 0 9Ds 0 20 44 5 0 69Us 95 57 16 119 10 297
Total: 96 78 62 129 10 375
2004 - 2005
2005 - 2006
2006 - 2007
Source: OSPI Core Student Record System (CSRS) http://eds.ospi.k12.wa.us/CSRS Reports, Enrollment Reports, Enrollment Reports, P210
December 14, 2007

Everett Public SchoolClass of 2008 Inactive Cohort (2004 – 2008)U, C or D
Unknown Drop Out Complete
Cascade HS 55 1 0
Everett HS 29 12 0
Jackson HS 27 7 0
Sequoia HS 93 7 1
District Total 204 27 1
Source: Pentamation
March25,2008

Cumulative Barriers to Graduation
Graduation is the result of meeting each of the individual requirements

Cumulative Barriers to Graduation
6
12
18
24
0
5
10
15
20
25
30
9th 10th 11th 12th
Credits
WASL Mastery:
Reading / Writing / Math*
Argumentative Paper
Culminating Exhibition
GRADE*Math Mastery or continued enrollment and success in challenging math course work

Ways to Improve Your Numerator
1. Increase your number of graduates!!• Increase student achievement from the first day of
school
2. Review District Policy and Procedures for Graduation
3. What are your district’s barriers / requirements to graduation?
4. Do you have the right barriers / requirements 5. What policies are in place in your district that
create additional challenges to students?

Overt: Barriers / Requirements
Credits WASL Argumentative Paper Culminating Exhibition

Covert: Barriers / Requirements
Attendance policy Grading practices Registration process Master schedule
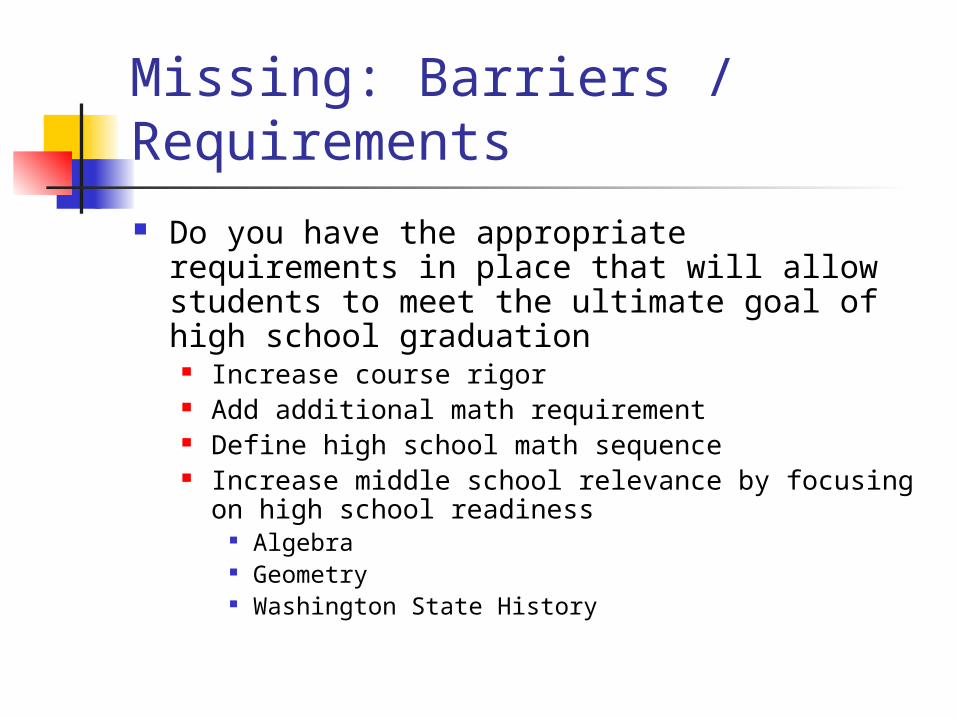
Missing: Barriers / Requirements Do you have the appropriate requirements in
place that will allow students to meet the ultimate goal of high school graduation
Increase course rigor Add additional math requirement Define high school math sequence Increase middle school relevance by focusing on high
school readiness Algebra Geometry Washington State History

Help Overcome Barriers / Requirements
WASL credit recovery Directed athletics ROTC Marching band Private music lessons

Overt Barriers / Requirements
Culminating exhibition: Argumentative Paper
History: 12 years ago 8 years ago Today
Impact: Lessons Learned:

Overt Barriers / Requirements Credits: Red – Yellow – Green
Establish a consistent data tracking process/report What we did
Determine biggest obstacles High failure rate classes High failure rate staff
Focused attention through district wide On Time Graduation Committee
Developed the 1-F strategy Enhanced parent communication about academic
success and progress to graduation
Overt Barriers / Requirements What we did
Pyramid of intervention Additional support classes Extended day programs Success Coordinators Drug Alcohol Interventionists In School academic support
What we are finding: Preliminary progress

Everett Public SchoolsComparison of Red-Yellow-Green by Grade LevelSemester 1 in 2006 and 2007
CHS 2006/2007 Comparison Updated 5/1/07 % Red % Red % Yellow % Yellow % Green % Green Total Total
Grade 9 2006 2007 2006 2007 2006 2007 2006 2007Number of Credits <0.5 <0.5 1.0-2.5 1.0-2.5 >3.0 >3.0Number/Percent of Students 39/7% 11/3% 149/30% 86/21% 316/63% 313/76% 504 410
Grade 10 Number of Credits <6.5 <6.5 7.0-8.5 7.0-8.5 >9.0 >9.0Number/Percent of Students 136/27% 68/15% 106/21% 111/24% 255/52% 279/61% 497 458
Grade 11 Number of Credits <12.5 <12.5 13.0-14.5 13.0-14.5 >15.0 >15.0Number/Percent of Students 149/30% 85/21% 111/22% 102/25% 245/48% 222/54% 505 409
Grade 12 Number of Credits <18.5 <18.5 19-20.5 19-20.5 >21.0 >21.0Number/Percent of Students 75/19% 52/14% 120/30% 122/33% 201/51% 192/53% 396 366
Total Number/Percent of Students 399/21% 216/13% 486/26% 421/26% 1017/53%
1006/61% 1902 1634

Overt Barrier / Requirements
WASL Class of 2008 Performance
1130 active students 1012 met standard in Reading (90%) 995 met standard in Writing (88%)
January 2008

Overt Barrier / Requirements
WASL Does this mean 10% or student will
not graduate due to WASL performance?
What will be the impact of credit and WASL performance on graduation?

Cascade High SchoolClass of 2008386 StudentsReading (January 2008)
22 NOT MET
63 16%
301 MET
10
2
10
BASIC 8+0*
ELL
SPED
BASIC
ELL
SPED
BASIC 273+9*
ELL
SPED
7
12
282
8
4
6
40
0
5
18 NOT MET
45 MET
323 (84%)
BASIC 1+9*
ELL
SPED
93% 7%
71%
32%
44%
22%
34%
89%
0%
11%
45%
10%
45%
94%
2%
4%
*No Score 9

Cascade High SchoolClass of 2008386 StudentsWriting (January 2008)
29 NOT MET
63 16%
294 MET
20
3
6
BASIC
ELL
SPED
BASIC
ELL
SPED
BASIC
ELL
SPED
6
15
273
11
4
5
39
0
4
20 NOT MET
43 MET
323 (84%)
BASIC 11+9*
ELL
SPED
91% 9%
68%
32%
55%
20%
25%
91%
02%
9%
69%
10%
21%
93%
2%
5% *No Score 9

Cascade High SchoolClass of 200827 StudentsNot Met WASL - Reading
13 Off Track
48%
14 ON
TRACK
3-March Re-Take 2-Spring COE
1-Absent (out of the country)
4-March Re-Take 2-Modified WASL 2-Spring Portfolio
1 ELL
8 SPED
5 BASIC
4 SPED
3 ELL
6 BASIC
1-Submitted COE 4-March Re-Take* 1-SAT qualified (also re-tested in March)
3-March Re-Take
3-March Re-Take 1-WAAS Portfolio
District Data March 2008

Cascade High SchoolClass of 200826 StudentsNot Met WASL - Writing
17 Off Track
65%
9 On
Track 35%
1-Private SAT* score 2-Spring COE
3-March Re-Take (*1 SAT)
2-March Re-Take
2-DAW 1-March Re-Take
2 ELL
3 SPED
4 BASIC
4 SPED
4 ELL
9 BASIC
1-Modified WASL 1-March Re-Take / 1-August Re-Take 1-Absent – Long Term Suspension
4-March Re-Take
1-WAAS Portfolio 2-DAW
District Data March 2008

Everett Public Schools 2008 Special Education Graduates
Student # Build. Year Ex. Credits WASL Math WASL Reading
WASL Writing
Cert Mastery
Reading Reading Writing Writing Math Math S
###### 1 2008 04 29 NOT MET MET DIPLOMA WASL MET WASL MET WASL NOT
###### 2 2008 05 23.5 NOT NOT MET DIPLOMA WASL MET WASL MET WASL NOT
###### 1 2008 05 22.126 NOT MET MET 0 of 3 NOT NOT NOT
###### 1 2008 06 22 NOT NOT NOT 0 of 3 WASL NOT PORT NOT WASL NOT
###### 1 2008 13 21 NOT NOT NOT DIPLOMA WAMO MET WASL MET WASL NOT
###### 2 2008 05 21.5 NOT NOT MET 1 of 3 WASL NOT WASL MET WASL NOT
###### 2 2008 14 21 NOT NOT NOT 0 of 3 WASL NOT WASL NOT WASL NOT
###### 1 2008 05 20.5 NOT NOT NOT 1 of 3 WASL NOT WAMO MET WASL NOT
###### 2 2008 04 20.5 0 of 3 NOT NOT NOT
###### 33 2008 13 20.5 NOT NOT NOT 1 of 3 WASL NOT WAMO MET WASL NOT
###### 1 2008 02 20.5 NOT NOT NOT 1 of 3 WASL NOT WASL MET WASL NOT
###### 2 2008 05 15.5 NOT MET NOT DIPLOMA WASL MET WAMO MET WASL NOT
###### 1 2008 05 15.5 NOT NOT NOT 1 of 3 WASL NOT WASL NOT WASL MET
###### 34 2008 02 15.17 NOT 0 of 3 NOT NOT WASL NOT
###### 1 2008 02 14 1 of 3 DAWL MET DAWL NOT DAWL NOT
NEEDING LOCALLY DETERMINED ASSESSMENTS
STUDENTS NEEDING COLLECTION OF EVIDENCE
LACKING ENOUGH EVIDENCE

Extended On-time Graduation Rate 2002-03 through 2006-07 District and School Totals
55
74
64
78
0
53
64
59
71
3
6164
69
78
10
67
81.779.7
8.2
79.6 80.2
87.7
67.4
86.1
36.6
0
10
20
30
40
50
60
70
80
90
100
Everett School District CHS EHS JHS SHS
Ext
end
ed O
n-t
ime
Gra
du
atio
n (%
)
2002-03 2003-04 2004-05 2005-06 2006-07

What does this mean for future work?
Credit is the highest barrier to OTG Less then 10% of students have not met
standard on Reading or Writing WASL Nearly 20% of student have not met
standard in credit requirements If a student has been successful in
rigorous course work they will be successful on WASL Ensure that students are enrolled in
rigorous course work Ensure that students are successful in those
rigorous courses

What does this mean for future work?
We need to help students and teachers be successful the first time a class is attempted Shift grading culture to all can meet
standard Be aware of the cost of credit remediation
We need to create opportunities within the 4 year OTG window to recover “lost” credits

What does this mean for future work?
We have State support and District emphasis on ensuring WASL performance but little to no support for helping students recover “lost” credits Focus on WASL improves WASL Focus on earning credit improves
both credit trajectory and WASL performance

What does this mean for future work?
Reevaluate the core question: Focus on graduation not its individual
requirements

Organizing & Organizing & Implementing Implementing
for for Student SuccessStudent Success
By By
Kimberly Müeller and Kimberly Müeller and Michael PowerMichael Power
Tacoma Public SchoolsTacoma Public Schools

What did we do to address What did we do to address the new graduation the new graduation
requirements?requirements?
• Creating: The structures and Creating: The structures and systemssystems
• Supporting: The students and Supporting: The students and adultsadults
• Re-examining: Is it working? Re-examining: Is it working?

Assis. Superintendents
Coordinator Graduation
Req.
High School Ed.
Public Relations
Research &
Evaluation
Curriculum &
Instruction
Guidance &
Counseling
GALT
Creating: GALT Creating: GALT (Graduation Advisory Leadership Team)(Graduation Advisory Leadership Team)

and...and...supporting students on-supporting students on-
site…site…
Career Counselor
CPL(Culminating
Project Lead)
Teachers
Administrators
Counselors
GSS(Graduation
Support Specialist)
Student

and supporting the adults working and supporting the adults working in the system…in the system…
GSS &
CPL
GALT
Coordinator of
Grad Requirements

Re-examining: Is it Re-examining: Is it working? working?
• Reflecting on individual Reflecting on individual performanceperformance
• Examining system and the Examining system and the supports supports
• Re-evaluating the resourcesRe-evaluating the resources

Framing QuestionFraming Question
What are your district, What are your district, schools, and classrooms schools, and classrooms
doing different or doing different or differently to assure that all differently to assure that all
students in the class of students in the class of 2008 and beyond have the 2008 and beyond have the opportunity to meet the opportunity to meet the
new graduation new graduation requirements?requirements?