Embed Size (px)
Citation preview
Managing the imaging dose duringimage-guided radiation therapy
Martin J Murphy PhDDepartment of Radiation OncologyVirginia Commonwealth University
Richmond VA
Imaging during radiotherapy
Radiographic image guidance has emerged as the newparadigm for patient positioning, target localization, and externalbeam alignment in radiotherapy.
The AAPM has recognized the importance of imaging dosemanagement by supporting a task group report on the subject:Murphy M, Balter J, Balter S, BenComo J, Das I, Jiang S, Ma C,Olivera G, Rodebaugh R, Ruchala K, Shirato H, Yin F, Themanagement of imaging dose during image-guided radiotherapy,Report of the AAPM Task Group 75, Medical Physics 34(10): 4041 –4063, 2007.
Outline
Imaging procedures for radiotherapy Dose summation Dose evaluation Dose reduction Summary
Uses of radiographic imaging in Image-guided radiation therapy (IGRT)
Precise daily positioning of the patient beforetreatment MV portal imaging dual kV planar imaging in-room fan-beam and cone-beam CT
Intra-fraction motion monitoring kV radiography and fluoroscopy
Daily plan adaptation fan-beam and cone-beam CT
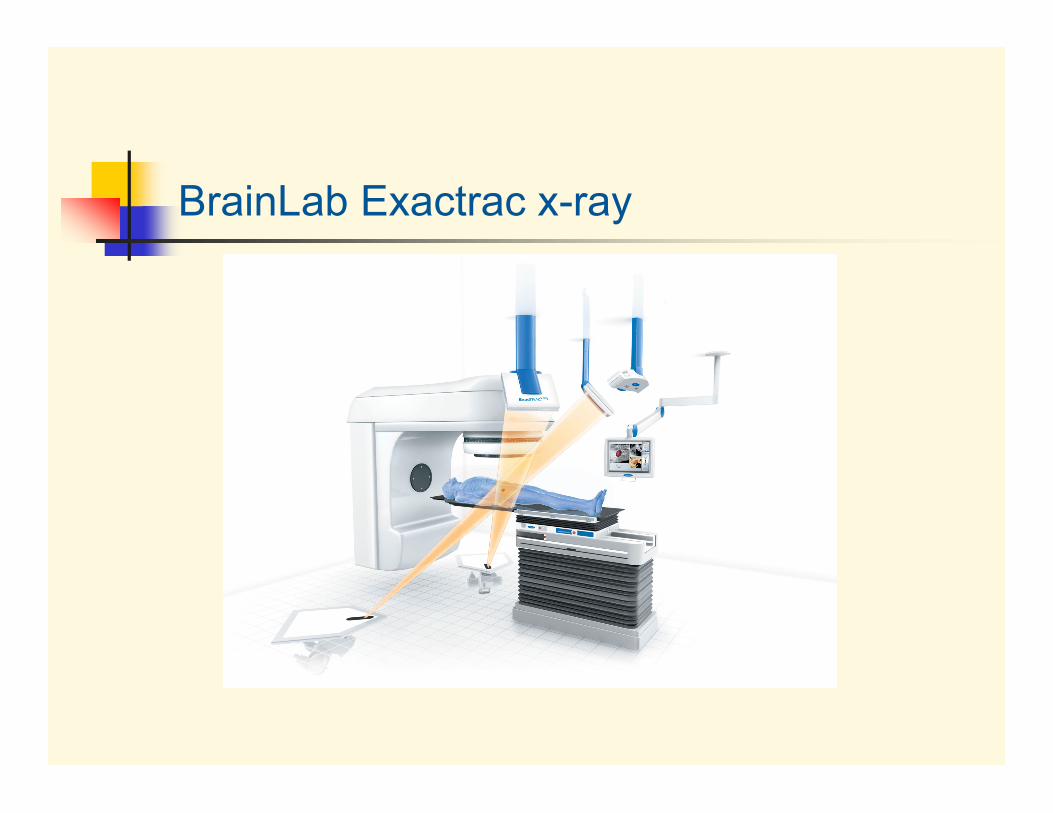
BrainLab Exactrac x-ray
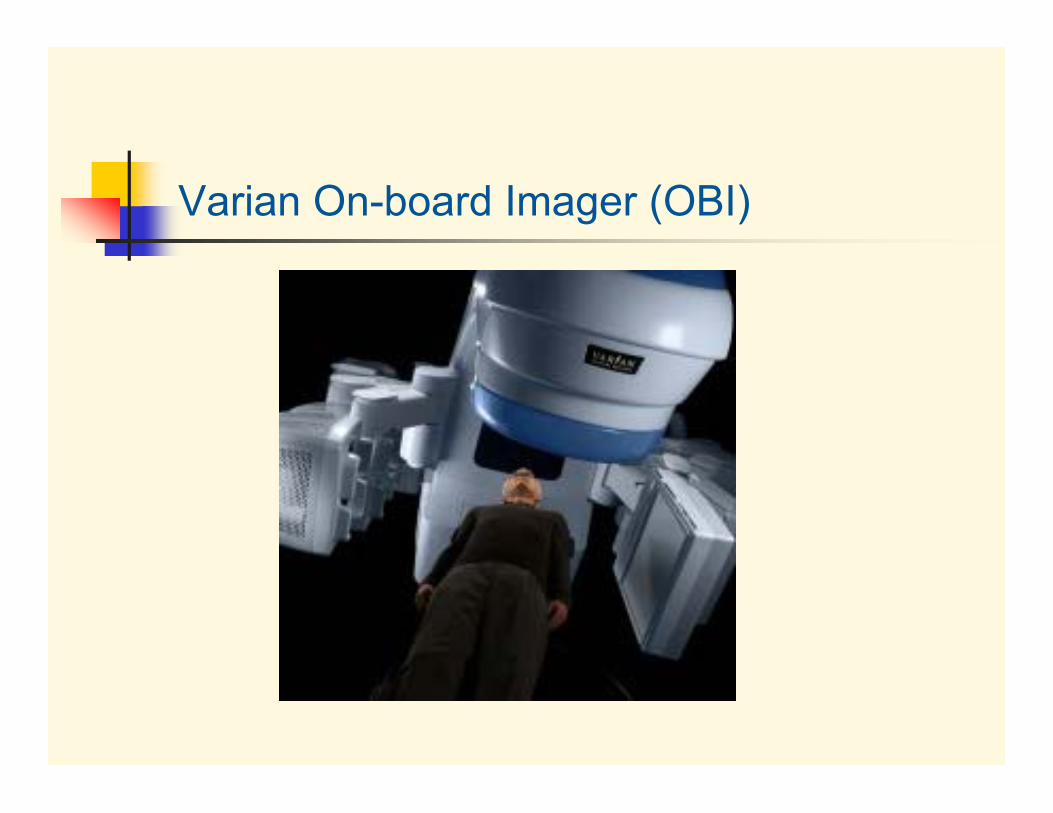
Varian On-board Imager (OBI)
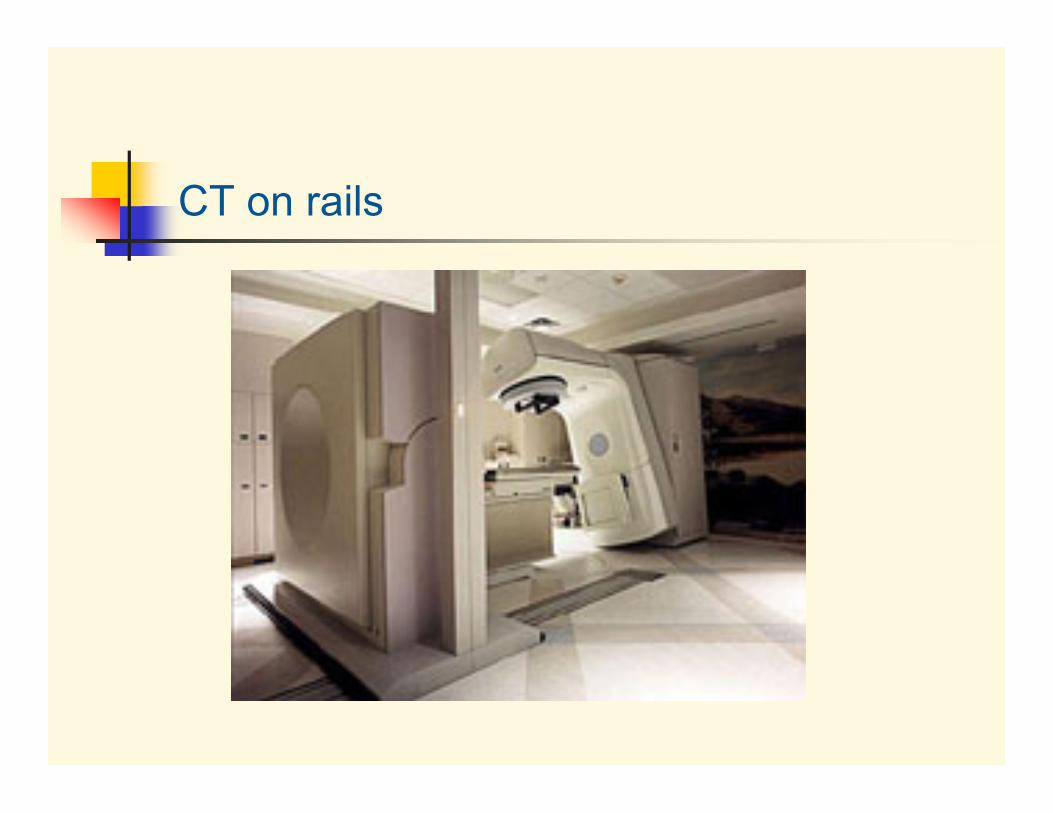
CT on rails
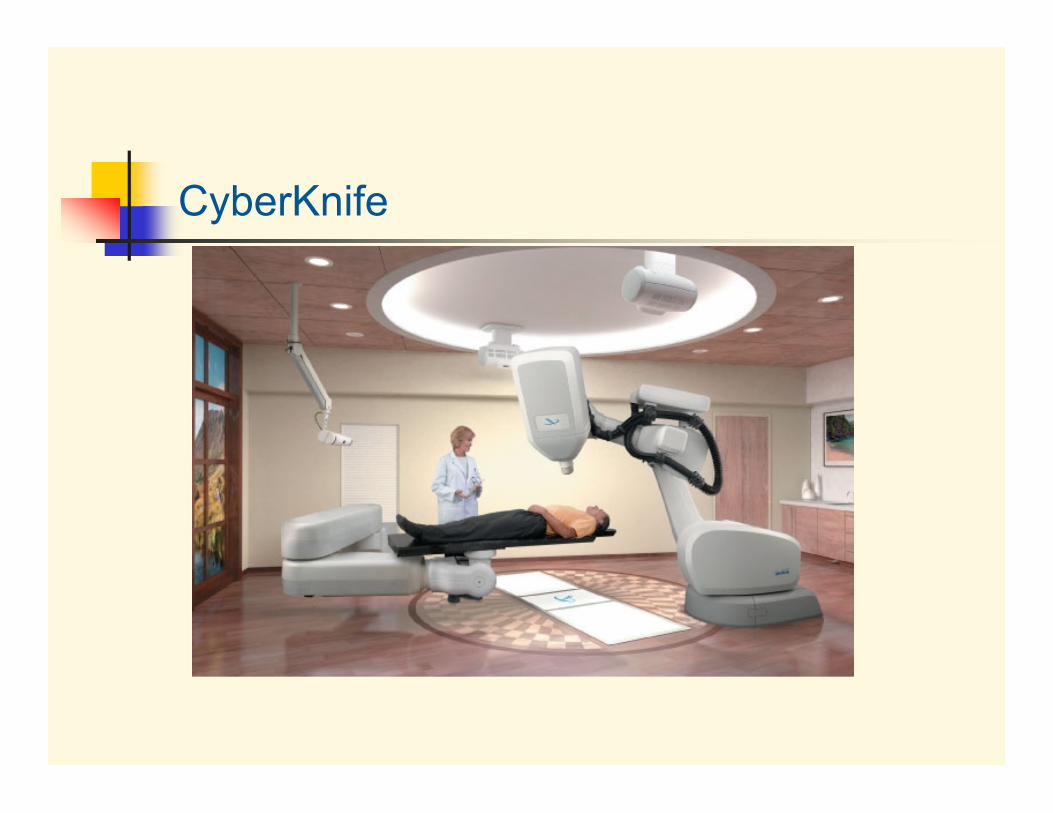
CyberKnife
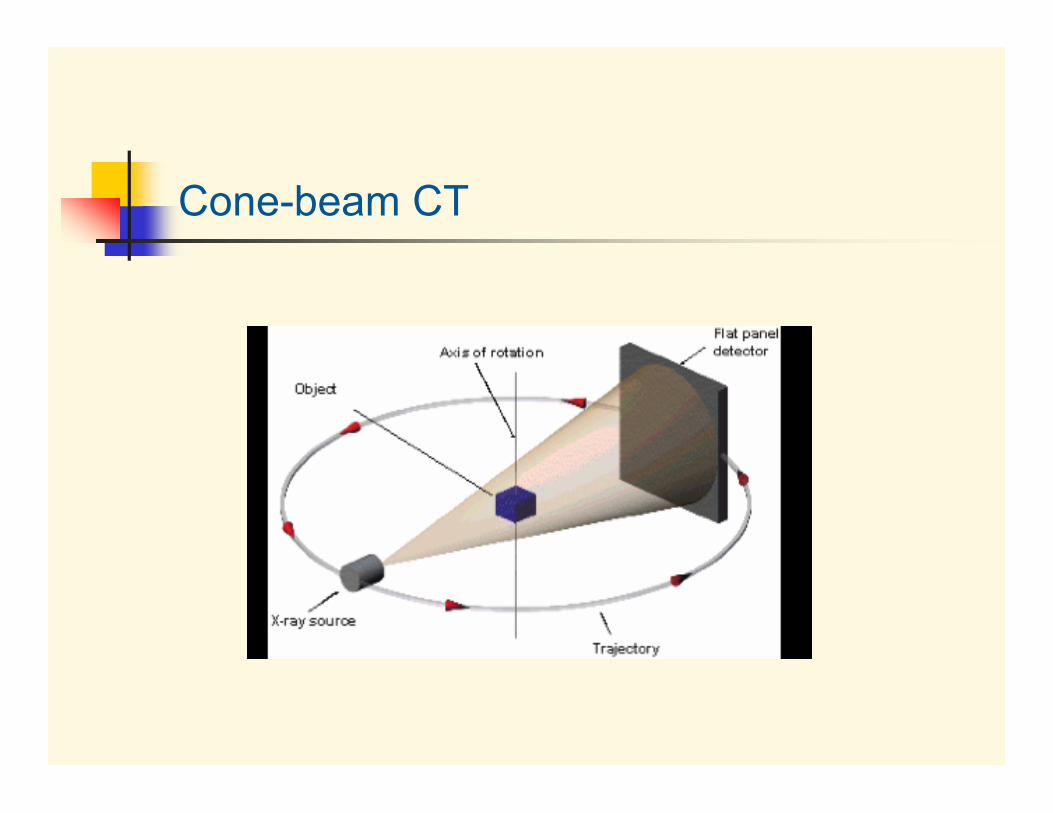
Cone-beam CT
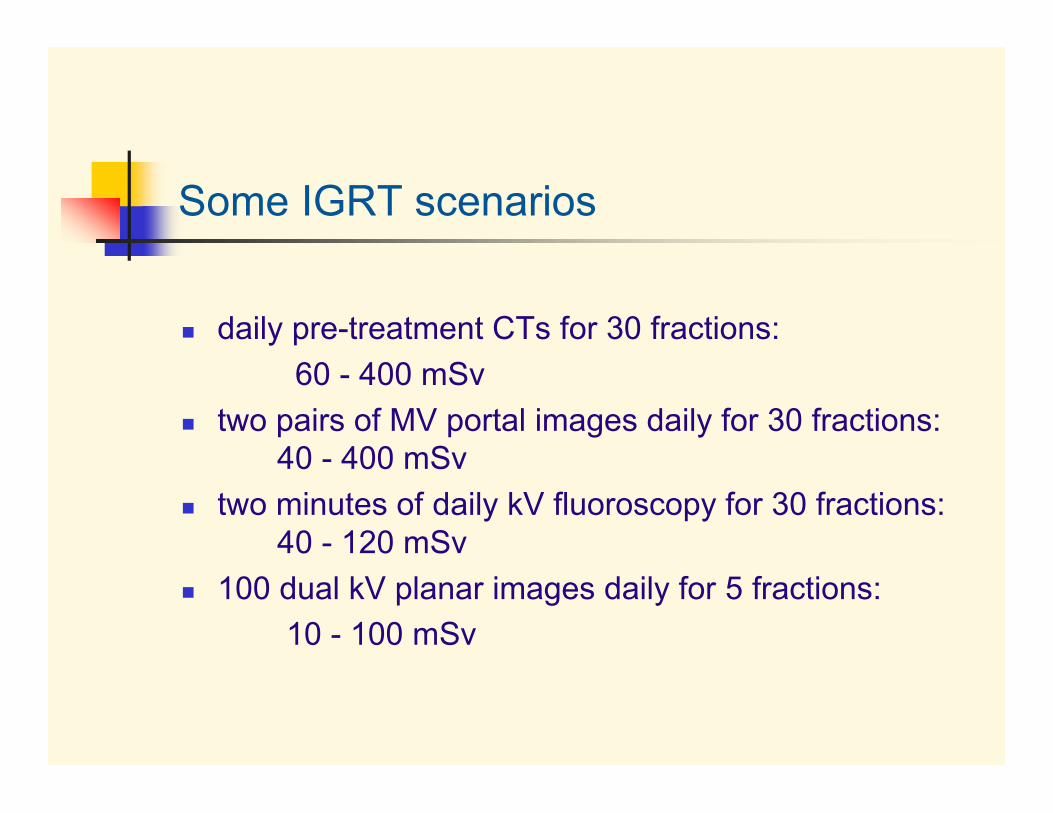
Some IGRT scenarios
daily pre-treatment CTs for 30 fractions: 60 - 400 mSv
two pairs of MV portal images daily for 30 fractions:40 - 400 mSv
two minutes of daily kV fluoroscopy for 30 fractions:40 - 120 mSv
100 dual kV planar images daily for 5 fractions: 10 - 100 mSv
Summing the imaging doseduring IGRT
Difficulties in determining the imagingdose during IGRT
Data for the dose delivered by the variousradiographic imaging modalities being used duringradiation therapy are presently scattered widelythrough the literature, making it difficult to estimatethe total dose that the patient will receive during aparticular treatment scenario.
IGRT systems often are configured differently thandiagnostic imaging setups.
Issues in summing the doses fromdifferent modalities different imaging scenarios distribute dose in fundamentally
different ways, making it difficult to sum dose in a radio-biologically consistent manner: e.g., planar kV imaging dose attenuates rapidly along the line of
sight; CT dose is uniformly distributed through the patient planar kV dose is evaluated as entrance (skin) dose in air
kerma, without scattering; axial kV dose (CT) is evaluated ascomputed tomography dose index (CTDI), with scattering
for kV, air kerma and absorbed dose are essentially the same;for MV they are not the same in regions of electronic dis-equilibrium (e.g., air/tissue boundaries).
kV surface dose buildup layer is very thin; MV surface builduplayer is much deeper; thus skin doses are very different
Summing doses Because of the differing qualities of kV, planar, CT,
and MV exposures, the doses should only becompared and summed in units of “effective dose”,which represents the approximate biologicaldetriment associated with a given integral dose
Effective dose The concept of “effective dose” (or effective dose
equivalent) was introduced to provide a commonframework for evaluating the biological detriment ofexposure to ionizing radiation via any means.
From Jacobi (Radiat Environ Biophys 12, 1975):“the mean absorbed dose from a uniform whole-bodyirradiation that results in the same total radiationdetriment as from the non-uniform, partial-bodyirradiation in question.”
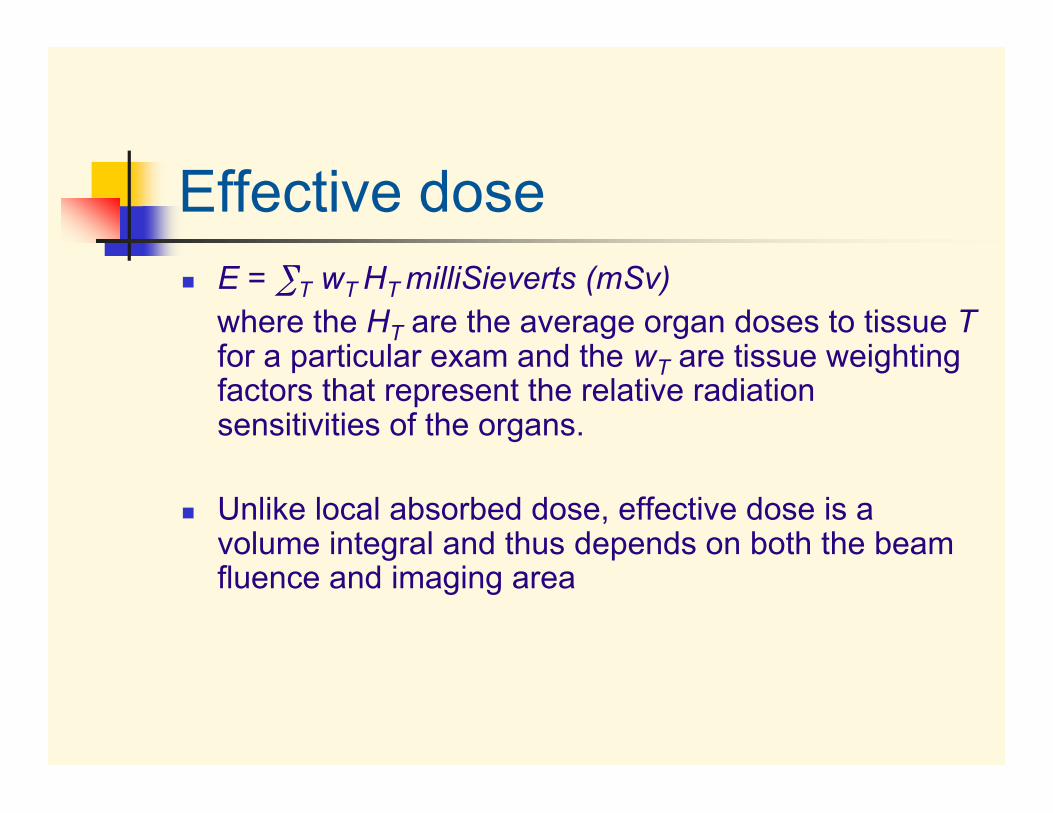
Effective dose E = ∑T wT HT milliSieverts (mSv)
where the HT are the average organ doses to tissue Tfor a particular exam and the wT are tissue weightingfactors that represent the relative radiationsensitivities of the organs.
Unlike local absorbed dose, effective dose is avolume integral and thus depends on both the beamfluence and imaging area
Evaluating the imaging dose

Interpreting risk Two categories of risk:
deterministic risk – e.g., skin injury, cataracts –has an approximate threshold that can beobserved on an individual basis.
stochastic risk –e.g, the increased risk of asecondary cancer – is probabilistic and isextrapolated from population-based data.
Stochastic risk is estimated from the total effective dose
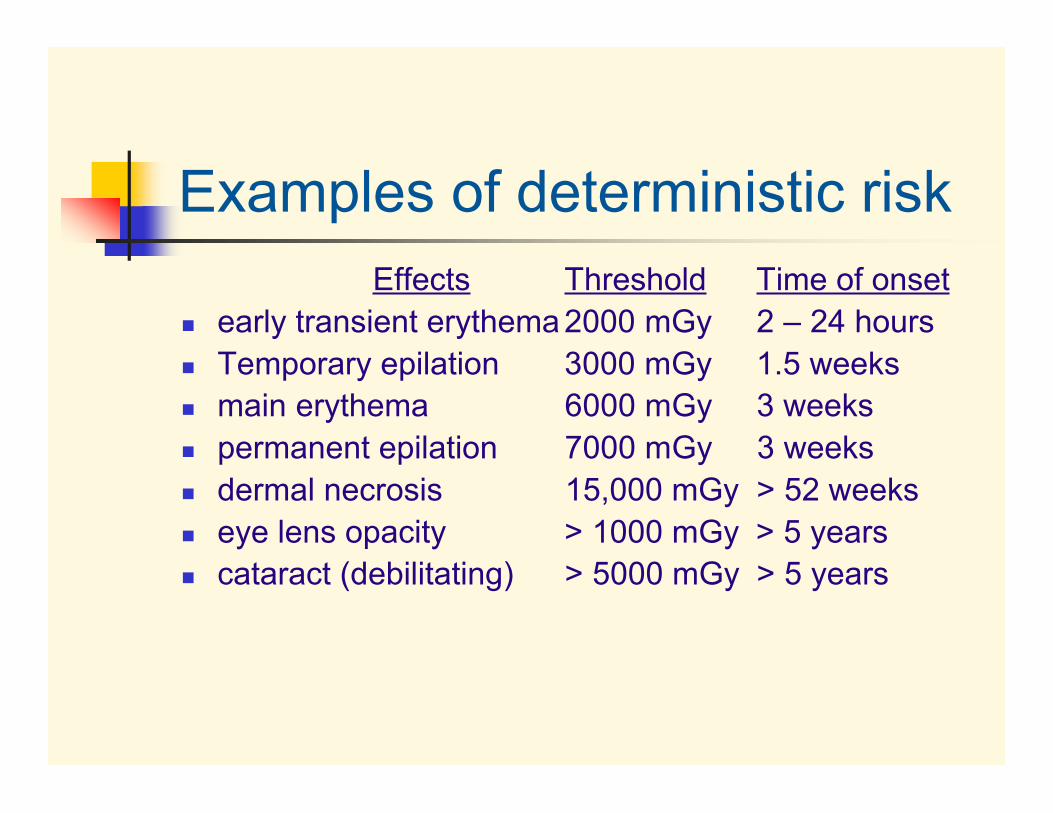
Examples of deterministic riskEffects Threshold Time of onset
early transient erythema 2000 mGy 2 – 24 hours Temporary epilation 3000 mGy 1.5 weeks main erythema 6000 mGy 3 weeks permanent epilation 7000 mGy 3 weeks dermal necrosis 15,000 mGy > 52 weeks eye lens opacity > 1000 mGy > 5 years cataract (debilitating) > 5000 mGy > 5 years
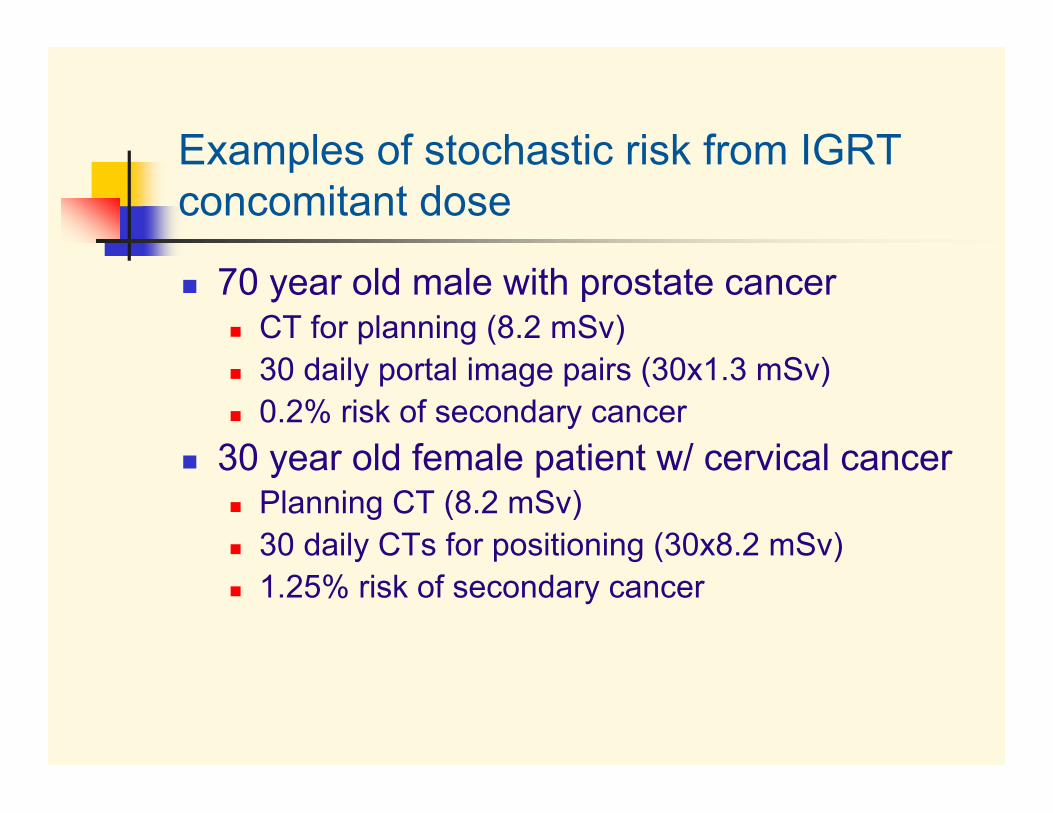
Examples of stochastic risk from IGRTconcomitant dose
70 year old male with prostate cancer CT for planning (8.2 mSv) 30 daily portal image pairs (30x1.3 mSv) 0.2% risk of secondary cancer
30 year old female patient w/ cervical cancer Planning CT (8.2 mSv) 30 daily CTs for positioning (30x8.2 mSv) 1.25% risk of secondary cancer
Difficulties in interpreting risk
Diagnostic imaging and image-guided surgeryintroduce ionizing radiation, while IGRT adds it to analready considerable therapeutic exposure.
Increased imaging dose during IGRT can reducenormal tissue exposure to the treatment beam, thusreducing overall concomitant dose.
Difficulties in interpreting risk
not everyone has the same sensitivity – children are10 times more sensitive than adults; girls are moresensitive than boys, women have different organsensitivities than men.
Not everyone is in the same risk category – a seventyyear old man undergoing image-guided prostatetreatments is in an entirely different risk situation thana 15 year old undergoing image-guided radiosurgeryfor an AVM on the spinal cord.
Comparing imaging and therapeuticeffective doses
In addition to the primary therapeuticdose deposited in the target volume wehave Primary concomitant dose from beams
transiting normal tissue Secondary concomitant dose from internal
and external scatter, linac leakage, etc
Evaluating imaging dose by comparisonto therapeutic dose
Effective dose is the established way to measure andcompare radiation dose in terms of its stochastic risk
Imaging dose is delivered in standard formats Therapeutic dose is delivered in highly variable
patient-specific scenarios There has not yet been much done to calculate
effective doses for therapy Therefore it is not yet feasible to make precise
quantitative comparisons of imaging versus therapydose
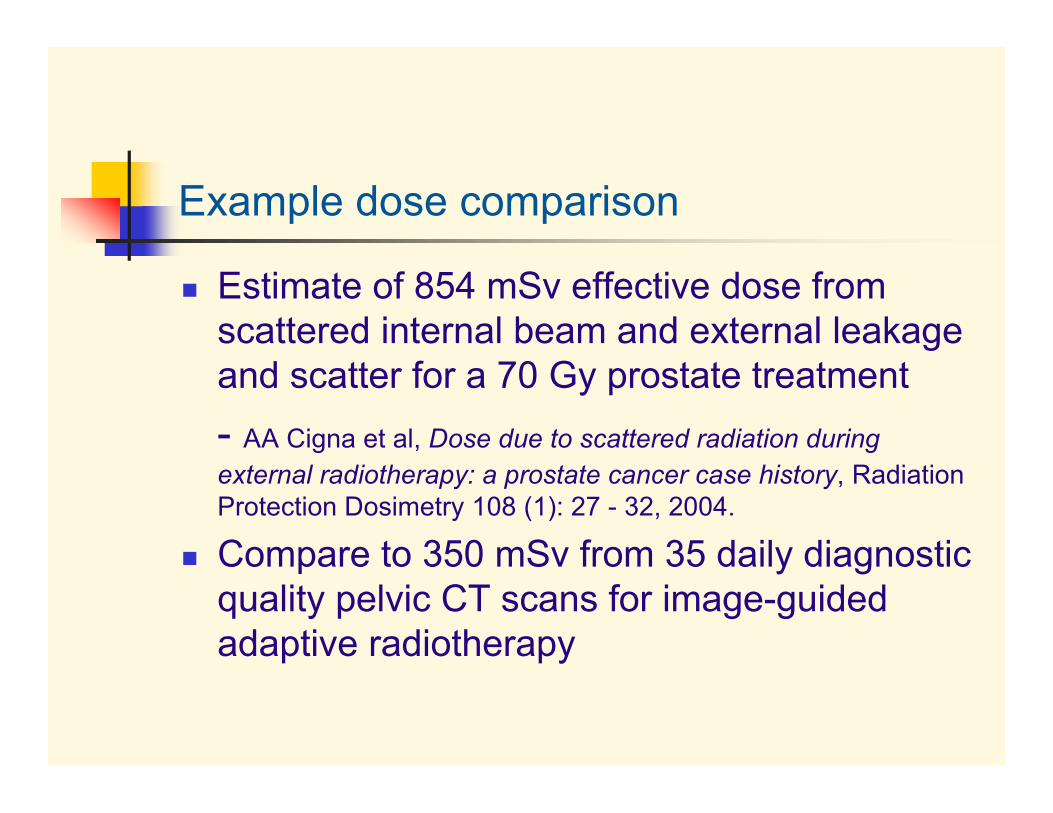
Example dose comparison
Estimate of 854 mSv effective dose fromscattered internal beam and external leakageand scatter for a 70 Gy prostate treatment- AA Cigna et al, Dose due to scattered radiation duringexternal radiotherapy: a prostate cancer case history, RadiationProtection Dosimetry 108 (1): 27 - 32, 2004.
Compare to 350 mSv from 35 daily diagnosticquality pelvic CT scans for image-guidedadaptive radiotherapy
Reducing the imaging dose
Dose reduction
In general, for imaging during IGRT oneshould not assume that diagnostic qualityprocedures and images are necessary in allapplications
Dose reduction Effective dose is a volume integral, so
reducing fluence and/or area helps Planar imaging FOV for patient setup can
be collimated down to the region of interest CT scan length can be reduced to the
region of interest Digital tomosynthesis - CT acquired over a
limited angular arc reduces CTDI
Temporal dose reduction Fluoroscopy for target tracking doesn’t
always require video frame rates (30frames/second) or a continuousexposure - e.g., respiration monitoring can be done
at 2 - 4 frames per second via pulsedfluoroscopy
Fluence reduction Image registration for patient setup,
contour transfer, and dose summingcan be fairly insensitive to noise, so thetechnique can be reduced belowdiagnostic quality
Reduction by modality change
Intra-fraction monitoring via kV fluoroscopy can bereplaced by cine-mode MV portal imaging using thetreatment beam This can work for 3D conformal therapy, where the
beam aperture is fixed for each field Cannot work for dynamic IMRT, where the beam
aperture is constantly changing
Summary Imaging systems and procedures for IGRT are often configured
differently than for diagnostic exams, resulting in different doses IGRT can combine several different imaging procedures for a particular
patient Estimation of the total concomitant dose must recognize the variations
in dose deposition by using effective dose as the common measure Risk evaluation in IGRT is fundamentally different than in diagnostic
radiology because the imaging dose is added to a high therapeuticdose
There is a need for estimates of effective dose for the treatmentprocedures to enable evaluation of imaging dose in context
IGRT procedures do not always require diagnostic quality images andthus allow a variety of dose reduction strategies


![PET-guided delineation of radiation therapy treatment ......and many other techniques including CyberKnife, heavy ion therapy [6] and many other radiation therapy devices for dose](https://img.pdfslide.us/doc/110x75/5ec54a2492626b725255921d/pet-guided-delineation-of-radiation-therapy-treatment-and-many-other-techniques.jpg)