Embed Size (px)
Citation preview
Managing the Family Firm: Evidence from CEOs at Work⇤
Oriana Bandiera (LSE), Andrea Prat (Columbia), Ra↵aella Sadun (Harvard)
November 25, 2014
Abstract
We develop a new survey instrument to codify CEOs’ diaries in large samples and use it to
measure the labor supply of 1,114 family and professional CEOs of manufacturing firms across
six countries (Brazil, France, Germany, India, the United Kingdom and the United States). By
this measure, family CEOs work 9% fewer hours relative to professional CEOs. Di↵erence in
di↵erences estimates with respect to the opportunity cost of leisure reveal that the pattern we
observe is consistent with di↵erences in preferences for leisure, rather than optimal responses to
di↵erences in technology or organization correlated with ownership. Di↵erences in labor supply
are larger in countries where inheritance laws favor wealth concentration and are correlated with
di↵erences in firm performance.
⇤Acknowledgements: We would like to thank Marianne Bertrand, Nick Bloom, Deepak Hegde, Luis Garicano,Lakshmi Iyer, Daniel Paravisini, Damon Phillips, Antoinette Schoar, Scott Stern, John Van Reenen, Daniel Wolfenzon,Chris Woodru↵, Julie Wulf, and participants at seminars in Bocconi, Columbia, Duke, Frankfurt, Harvard, Helsinki,LBS, LSE, Mannheim, Michigan, MIT, Munich, Northwestern, Queens Business School, Stanford, AEA, EEA. EARIEand NBER Summer Meetings for useful comments. Our partnership with Renata Lemos and the support of AnjaliReina and Tanya Bijlani from the HBS India Research Center have been particularly important in the developmentof the project. Kashyap Shah has provided excellent research assistance. We would like to thank Columbia BusinessSchool, Harvard Business School, the International Growth Center, and the Kau↵man Foundation for their financialsupport. Corresponding author: Ra↵aella Sadun, Harvard Business School, Morgan 233, email: [email protected].
1
1 Introduction
The debate over the desirability of the separation between firm ownership and control is as old as
the firm itself. Should firms be led by their owners or by professional managers? The argument in
favor of owners is that they have more at stake. This is the standard prediction of the principal-
agent model, as owners are residual claimants over the income generated by the business and
hence are motivated to succeed, other things equal. The argument against is that, simply put,
other things are not equal. In particular, firm owners are typically wealthier because they own
the firm and might therefore demand more leisure than professional managers. This is in line with
the standard model of labor supply when leisure is a normal good1 and with recent theories of
preference formation that make precise why it is optimal for wealthy parents to transmit a strong
taste for leisure to their o↵springs (Doepke and Zilibotti 2008). Given the ubiquity of family firms,
understanding which of these e↵ects prevails has important implications for aggregate income and
growth (Caselli and Gennaioli 2013, La Porta et al 1999).
In this paper we provide evidence to inform the debate by measuring the labor supply of family and
professional CEOs. We develop a new survey instrument to codify CEOs’ diaries in large samples
and use it to collect data on the time use of 1,114 CEOs of manufacturing firms across six countries:
Brazil, France, Germany, India, the United Kingdom and the United States. To measure the CEOs’
labor supply we reconstruct their time diaries via daily phone interviews over the course of one
week. We ask respondents (the CEOs themselves or their personal assistants) to list sequentially all
activities in their diaries longer than fifteen minutes and to report details of those activities. This
allows us to build an accurate bottom-up estimate of how much time CEOs allocate to business
activities. Our methodology is inspired by Mintzberg’s (1973) celebrated analysis of the work week
of five CEOs, extended to large random samples.2
We find that there is substantial variation in the number of hours CEOs devote to work activities:
the average CEO in our sample spends 52 hours per week (10.4 hours per day) at work, while CEOs
in the bottom quartile work on average 44.2 hours per week and those in the top quartile work on
average 58.5 hours per week. To address our core question, we divide CEOs in two groups: “family”
CEOs, who own the firm or belong to the family that owns the firm, and “professional” CEOs, who
do not. We find a stark di↵erence between these two groups: family CEOs, who account for 41%
of our sample, record 6 fewer hours per week. The di↵erence is driven by two factors: family CEOs
1For example, Holtz-Eakin et al (1993) show that large inheritances reduce labor force participation and laborsupply.
2“Shadowing” exercises are common in the management literature but typically cover a handful of observations.To the best of our knowledge, the most extensive CEO time use study is still Mintzberg’s (1973) seminal work, whichcomprises five CEOs. The largest observational dataset on top executives known to us – Kotter (1999) – includes 15general managers. The largest time use study of managerial personnel we are aware of is Luthans (1988), which covers44 mostly middle managers. Some surveys ask large numbers of CEOs general questions about their aggregate timeuse (e.g. McKinsey 2013), but they are not based on an analysis of their agendas for a specific time period. Comparedto more commonly used recall methods, the time-diary method reduces the impact of recollection biases that havebeen shown to be relevant in other surveys (Robinson et al 2011). This notwithstanding, the diary method will alsofail to capture some activities or still allow respondents to overestimate the time they devote to other activities, sothat the hours of work recorded in our survey should be seen as a proxy of actual work hours.
2
start work later in the day and are more likely to interrupt it to devote time to personal activities.
In line with earlier work (Perez-Gonzalez 2006), in our sample family and professional CEOs have
di↵erent education, experience and tenure. The firms they manage also di↵er, as family CEOs
lead firms that are smaller, less likely to be part of a multinational organization, less likely to
have a COO and with a smaller number of direct reports. In light of this evidence, di↵erences in
hours worked could be due to di↵erences in the production technology or organization that make
it optimal for family CEOs to work fewer hours. Alternatively, family CEOs may simply have a
stronger taste for leisure.
We present a simple model of CEO labor supply that makes precise the conditions under which we
can distinguish between the two hypotheses using a di↵erence in di↵erence approach. The model
illustrates that if family CEOs choose to work fewer hours because they put a higher weight on
leisure relative to firm performance, the di↵erence in hours worked between family and professional
CEOs should decrease as the opportunity cost of leisure increases, or as the marginal cost of e↵ort
decreases. In contrast, if CEOs’ work hours are an optimal response to technology or organization
di↵erences, the di↵erence between family and professional CEOs should be una↵ected by changes
in the opportunity cost of leisure or in the marginal cost of e↵ort common to both CEO types.
We take the model to the data in two steps. First, we examine how the di↵erences in hours worked
vary once we control for observable di↵erences in CEO, industry and firm characteristics. The
analysis shows that observable di↵erences in CEOs’ and firms’ characteristics explain one quarter
of the di↵erence between family and professional CEOs: once we include the full set of firm, industry
and CEO controls, family CEOs still work 8.8% fewer hours than their professional counterparts.
Importantly, this is not due to family ownership per se: professional CEOs who run family firms
work as much as their counterparts in non-family firms.
Second, informed by the model, we use natural experiments to identify factors that a↵ect the
opportunity cost of leisure and cost of e↵ort regardless of CEO type to implement the di↵erence
in di↵erence strategy illustrated above. We identify two factors that a↵ect the opportunity cost
of leisure across firms: size and the competitiveness of the industry in which they operate. The
opportunity cost of leisure is likely to be higher in larger firms as CEOs’ e↵ort a↵ects a larger volume
of activity, analogue to the “scale of operations” e↵ect discussed in Mayer (1960).3 The opportunity
cost of leisure is also likely to be higher in more competitive industries, where the probability of
survival is lower and high e↵ort more likely to be essential to keep the firm in business. For the
largest country in our sample, India, we are also able to measure variation in the opportunity cost
of leisure and cost of e↵ort within firm across days using instances of extreme monsoon rainfall
and the broadcasting of popular sport events (Indian Premier League cricket matches).
The di↵erence in di↵erences estimates depict a consistent picture: the di↵erence between family and
professional CEOs is significantly smaller in larger firms and in firms active in more competitive
industries where the opportunity cost of leisure is higher. Symmetrically, in our Indian sample
3This has been used to explain how small di↵erences in ability can produce large di↵erences in pay when moreable CEOs work for larger firms, see e.g. Tervio (2008).
3
the di↵erence between family and professional CEOs is significantly larger on days when torrential
rains or cricket matches increase the marginal cost of e↵ort.
Taken together, the four tests are consistent with the notion that family CEOs place a larger weight
on leisure than on firm performance. A possible explanation for this di↵erence is that family CEOs
tend to be wealthier, as they own the firms they lead, and leisure is a normal good. To test the
empirical relevance of this hypothesis in the absence of detailed data on individual CEO wealth, we
use cross-country variation in inheritance laws that creates variation in wealth concentration (Ellul
et al 2010) to proxy for the di↵erence in wealth between firm owners and professional managers.
Intuitively, more permissive laws favor the concentration of wealth in the hands of the individual
designated to inherit the control of the family business. Other things equal, we therefore expect
family CEOs to be wealthier in countries where the maximal share of transmissible wealth is larger.
We find that the di↵erence between family and professional CEOs is increasing in the share of wealth
that can be bequeathed to a single heir. To the extent that wealth concentration is correlated with
wealth di↵erentials between owners and managers, the result provides some indicative evidence
that labor supply di↵erences may be due to wealth di↵erences.
The question that follows naturally is why family CEOs do not delegate to professionals who
are willing to work longer hours, so to enjoy both more leisure and higher profits. We explore
two explanations. The first is that family CEOs are unable to delegate due to costly contract
enforcement. To provide evidence on this hypothesis we proxy enforcement costs using measures of
GDP per capita (both at the country and region level), the quality of the rule of law (at the country
level) and generalized trust (at the region level). We find that di↵erences in hours worked between
family and professional CEOs do not systematically vary with any of these measures. Therefore,
while the share of family CEOs is much larger in countries with worse governance (as in Burkart
et al. 2003), development and institutions do not seem to account for the systematic di↵erence in
the work patterns between family and professional CEOs.
The second hypothesis we explore is whether the di↵erence in hours worked between family and
professional CEOs has a negligible e↵ect on firm productivity, so that the potential benefit of
hiring a professional CEO might be lower than the cost of doing so. To assess the relevance
of this explanation, we match our time use data with balance sheet data and estimate a basic
production function augmented by CEO hours. The estimates rule out that CEO hours have a
negligible association with productivity: the elasticity of revenues with respect to CEO hours is
.36, comparable to the labor (.48) and capital (.26) elasticities. The correlation between CEO
hours and productivity is nil in the years before the CEO took o�ce, alleviating the concern that
firm time-invariant characteristics shape the CEO labor supply. CEO hours are also positively
associated with profitability measures (ROCE and Tobin q). The fact that CEOs prefer to lead
their firms despite foregone income and the feasibility of delegation to hard working professionals
is in line with the idea that they might enjoy non-monetary benefits of control (Demsetz and Lehn
1985, Bandiera et al 2013).
The time use patterns we observe - taken together with the association between time use and firm
4
performance - provide a possible explanation for the fact that firms led by family CEOs generally
underperform (Morck et al 2000, Villalonga and Amit 2006, Perez-Gonzalez 2006, Bennedsen et al.
2007, Bertrand et al 2008, Bertrand 2009). Our findings complement the observation that family
CEOs adopt worse managerial practices (Bloom and Van Reenen 2007) and adopt a management
style that is less conducive to shareholder value maximization (Mullins and Schoar 2013). In line
with these literatures, our time use analysis shows that the incentives arising from having a higher
stake in the firm are o↵set by other factors that induce less e↵ort on the part of family CEOs. More
broadly, our research illustrates one channel through which CEOs may a↵ect firm performance
(Bertrand and Schoar 2003, Kaplan et al 2012, Malmendier and Tate 2005, 2008, Schoar and Zuo
2012). Finally, the paper is related to the strand of work emphasizing the importance of preferences
in explaining di↵erences in managerial e↵ort (Bertrand and Mullainathan, 2003, Malmendier and
Tate 2009).
The paper is organized as follows. Section 2 describes our sampling and data collection methodology,
together with the characteristics of CEOs and their firms. Section 3 provides a simple model of labor
supply to guide the identification strategy. Section 4 estimates the di↵erence between family and
professional CEOs and implements the di↵erence in di↵erence estimator to interpret the observed
di↵erences. Section 5 exploits cross-country variation in inheritance laws and contract enforcement
to shed light on why family CEOs work less and yet choose to manage their firms. Section 6
concludes.
2 Measuring CEOs’ Labor Supply
2.1 The CEO Time Use Survey
To measure CEOs’ labor supply, we created a survey instrument that keeps track of the activities
undertaken by executives on a daily basis.4 We use this instrument to collect information for
a sample of CEOs over one work week. While titles may di↵er across countries (e.g. Managing
Director in the UK) we always interview the highest-ranking authority in charge of the organization
who has executive powers and reports to the board of directors. For brevity we refer to them as
CEOs in what follows.
The survey collects information on all the activities lasting longer than 15 minutes in the order
they happened during the day, with their starting and ending time and other activity details. Our
main measure of CEO labor supply is the sum of time devoted to work activities over the week. To
compare our diary measure with the standard recall measure used in time use survey we also asked
CEOs to estimate the hours they worked during the same week. Figure A1 shows a screenshot of
the survey tool.5
4A similar version of the survey was first used in a small scale study of about 100 Italian CEOs. See Bandiera,Guiso, Prat and Sadun (2011) for details.
5The survey tool can also be found online on www.executivetimeuse.org.
5
The data was collected by a team of enumerators we hired for this purpose through daily phone
calls with the Personal Assistant (PA) of the CEO, or with the CEO himself (43% of the cases),
over a week randomly chosen by us. On day one of this week, the enumerator called in the morning
and gathered detailed information on all the activities planned in the CEO diary for the day.
The enumerator then called again in the evening, to gather information on the actual activities
undertaken by the CEO (including those that were not originally included in the planned agenda),
and the activities planned for the following day. On subsequent days, the enumerator called in the
evening, again to collect data on the actual activities undertaken during the day, and the planned
schedule for the next day.6 On the last day of the data collection, the analysts also interviewed the
CEO to validate the activity data (if collected through his PA) and to collect information on the
characteristics of the CEO and of the firm, including firm ownership and organizational structure.
Two concerns are of note. First, we are able to measure only the activities that the CEO is willing to
report. The sign of the bias this creates is ambiguous. CEOs might indeed be prone to overestimate
the hours they work, e.g. by coding time spent in personal activities as work. At the same time, we
will not pick up activities that take place out of business hours unless they are recorded in the CEO
diary. Our working assumption throughout the paper is that the time use we measure is a valid
proxy of the actual time use and captures meaningful di↵erences across CEOs. We validate this
assumption in subsequent analysis by showing the the number of hours worked by CEOs correlates
with observable CEO and firm characteristics in predictable ways (e.g. older CEOs work fewer
hours as their cost of e↵ort is presumably higher).
Second, a week of detailed activity data might not be enough to capture typical CEO behavior.
The allocation of time across activities might just be a reflection of high frequency shocks to the
marginal cost or marginal product of time across CEOs. If so, the time use data would capture the
relevance of these shocks, rather than explicit managerial choices. If this were true, however, we
would expect little similarity in the way the time is allocated within the week by the same CEO (i.e.
we would not see any within week autocorrelation in CEO time use). In contrast, we find a high
degree of autocorrelation in the average number of hours worked during the week by the CEOs.
A simple regression of the number of log(hours worked) on day t on the same variable measured
on day t-1 delivers a coe�cient of .40, statistically significant at the 1% level. In addition, CEO
fixed e↵ects explain 25% of the variance observed in the daily time use data. Finally, at the end of
the survey week, we ask the CEOs to rank whether the week could be considered “representative”
of their usual work activity on a scale 1-10. Reassuringly, we observe substantial heterogeneity in
hours worked even if we restrict the sample to the 63% of CEOs who score the survey week as
highly representative (i.e. a score of 8, 9 or 10 out of 10). This is at odds with the hypothesis that
all observed variation is due to transitory shocks rather than actual di↵erences in behavior.
6For 70% of the CEOs in our sample, the work week consisted of 5 days. The remaining 30% of the CEOs alsoreported to work during the weekend (21% for 6 days and 9% for 7 days). Analysts were instructed to call the CEOafter the weekend to retrieve data on Saturdays and Sundays.
6
2.2 Sampling frame
The survey covers CEOs in six of the world’s ten largest economies: Brazil, France, Germany, India,
the United Kingdom and the United States. For comparability, we chose to focus on established
market economies and opted for a balance between high and middle-low income countries.
Our sampling frame was drawn from ORBIS, an extensive commercial data set that contains
company accounts for more than 30 million companies around the world. To maintain comparability
of performance data we restricted the sample to manufacturing firms. We then selected firms
with available sales and employment data.7 This yielded a sample of 6,527 firms in 32 two-digits
industries that we randomly assigned to di↵erent analysts to call to seek the CEOs’ participation.
We were able to interview 1,134 CEOs, a response rate of 17%. This figure is at the higher end of
response rates for CEO surveys, which range between 9% and 16% (Graham et al 2011). Of the
interviewed CEOs, 20 were later dropped from the sample because of low data quality (typically
because the time use data covered less than 4 days of the week). Our final sample thus comprises
of 1,114 CEOs, of which there are 282 in Brazil, 115 in France, 125 in Germany, 356 in India, 87
in the UK and 149 in the US.8
The selection analysis in Table A1 shows that respondents have on average lower log sales (coe�cient
-0.071, standard error 0.011). However, we do not find any significant selection e↵ect on performance
variables, such as sales over employees and return on capital employed (ROCE).
2.3 Data
Figure 1 shows the distribution of hours worked during the week using the diary method, namely
the sum of the duration of all the activities the CEO undertakes while at work. The average CEO
in our sample spends 52 hours per week (10.4 hours per day) at work, while CEOs in the bottom
quartile work on average 44.2 hours per week and those in the top quartile work on average 58.5
hours per week.
Figures 2a and 2b compare the diary measure with a recall measure that we obtained by asking
CEOs to estimate the number of hours worked at the end of the week.9 Three points are of note.
First, Figure 2a shows that the distribution of the recall measure exhibits considerable bunching
at round numbers, e.g. 26% of the sample CEOs report working 50 hours, while the diary measure
shown in Figure 1 exhibits no bunching, i.e. no more than 1.5% of the sample take the same value.
Second, Figure 2b shows that the two measures are positively correlated, but the correlation is well
below 1 - regressing the recall measure on the diary measure yields a coe�cient of .50, significantly
di↵erent from 1 with p-value=.000. Third, the recall measure is larger than the diary measure for
half of the CEOs whose diary measure is below the mean, but only for 16% of the CEOs whose
diary measure is above the mean. Thus, the noise in the recall measure is not orthogonal to the
7The criteria for inclusion in the sampling frame and the survey methodology are detailed in the Data Appendix.8Table A6 in Appendix reports basic summary statistics by country.9The sample included in this analysis excludes India since we did not collect recall time use in that survey.
7
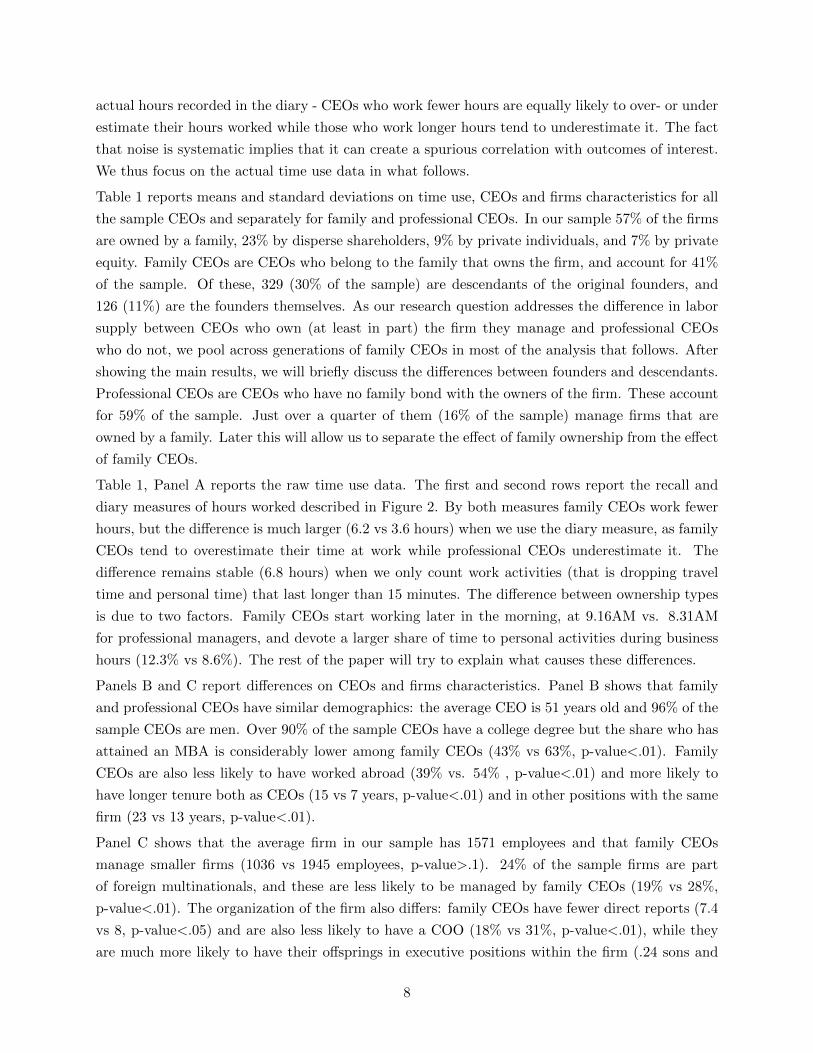
actual hours recorded in the diary - CEOs who work fewer hours are equally likely to over- or under
estimate their hours worked while those who work longer hours tend to underestimate it. The fact
that noise is systematic implies that it can create a spurious correlation with outcomes of interest.
We thus focus on the actual time use data in what follows.
Table 1 reports means and standard deviations on time use, CEOs and firms characteristics for all
the sample CEOs and separately for family and professional CEOs. In our sample 57% of the firms
are owned by a family, 23% by disperse shareholders, 9% by private individuals, and 7% by private
equity. Family CEOs are CEOs who belong to the family that owns the firm, and account for 41%
of the sample. Of these, 329 (30% of the sample) are descendants of the original founders, and
126 (11%) are the founders themselves. As our research question addresses the di↵erence in labor
supply between CEOs who own (at least in part) the firm they manage and professional CEOs
who do not, we pool across generations of family CEOs in most of the analysis that follows. After
showing the main results, we will briefly discuss the di↵erences between founders and descendants.
Professional CEOs are CEOs who have no family bond with the owners of the firm. These account
for 59% of the sample. Just over a quarter of them (16% of the sample) manage firms that are
owned by a family. Later this will allow us to separate the e↵ect of family ownership from the e↵ect
of family CEOs.
Table 1, Panel A reports the raw time use data. The first and second rows report the recall and
diary measures of hours worked described in Figure 2. By both measures family CEOs work fewer
hours, but the di↵erence is much larger (6.2 vs 3.6 hours) when we use the diary measure, as family
CEOs tend to overestimate their time at work while professional CEOs underestimate it. The
di↵erence remains stable (6.8 hours) when we only count work activities (that is dropping travel
time and personal time) that last longer than 15 minutes. The di↵erence between ownership types
is due to two factors. Family CEOs start working later in the morning, at 9.16AM vs. 8.31AM
for professional managers, and devote a larger share of time to personal activities during business
hours (12.3% vs 8.6%). The rest of the paper will try to explain what causes these di↵erences.
Panels B and C report di↵erences on CEOs and firms characteristics. Panel B shows that family
and professional CEOs have similar demographics: the average CEO is 51 years old and 96% of the
sample CEOs are men. Over 90% of the sample CEOs have a college degree but the share who has
attained an MBA is considerably lower among family CEOs (43% vs 63%, p-value<.01). Family
CEOs are also less likely to have worked abroad (39% vs. 54% , p-value<.01) and more likely to
have longer tenure both as CEOs (15 vs 7 years, p-value<.01) and in other positions with the same
firm (23 vs 13 years, p-value<.01).
Panel C shows that the average firm in our sample has 1571 employees and that family CEOs
manage smaller firms (1036 vs 1945 employees, p-value>.1). 24% of the sample firms are part
of foreign multinationals, and these are less likely to be managed by family CEOs (19% vs 28%,
p-value<.01). The organization of the firm also di↵ers: family CEOs have fewer direct reports (7.4
vs 8, p-value<.05) and are also less likely to have a COO (18% vs 31%, p-value<.01), while they
are much more likely to have their o↵springs in executive positions within the firm (.24 sons and
8
.09 daughters vs. .005 and .006, p-values<.01).
Finally, Panel D describes the external environment in which the sample firms operate. 57% of the
sample firms are located in emerging economies (India or Brazil), with this number being higher for
firms led by family CEOs (78% vs 43%, p-value<.01). The sample firms are distributed across 32
di↵erent SIC2 sectors, the largest of which, SIC 28 (Chemicals and Allied Products), accounts for
13% of the firms. The distribution of family and professional CEOs are generally balanced across
sectors. We reject the null that the sector dummies do not predict CEO type only for 4 out of the
32 sectors, three of which account for less than 2% of the sample each. In line with this, Panel
D shows that family and professional CEOs face a similar level of product market competition, as
measured by the Lerner Index, which is defined as (1-profit/sales) calculated as the average across
the entire population of firms in Orbis in the sample countries for the 5 years preceding the data
collection, and is specific to the firms’ three digit industry (Aghion et al, 2005). We obtain similar
results when we use as a proxy for product market competition the degree of import penetration,
measured as the share of total imports relative to domestic production in the industry in which the
firm operates, also aggregated up at the industry level.10
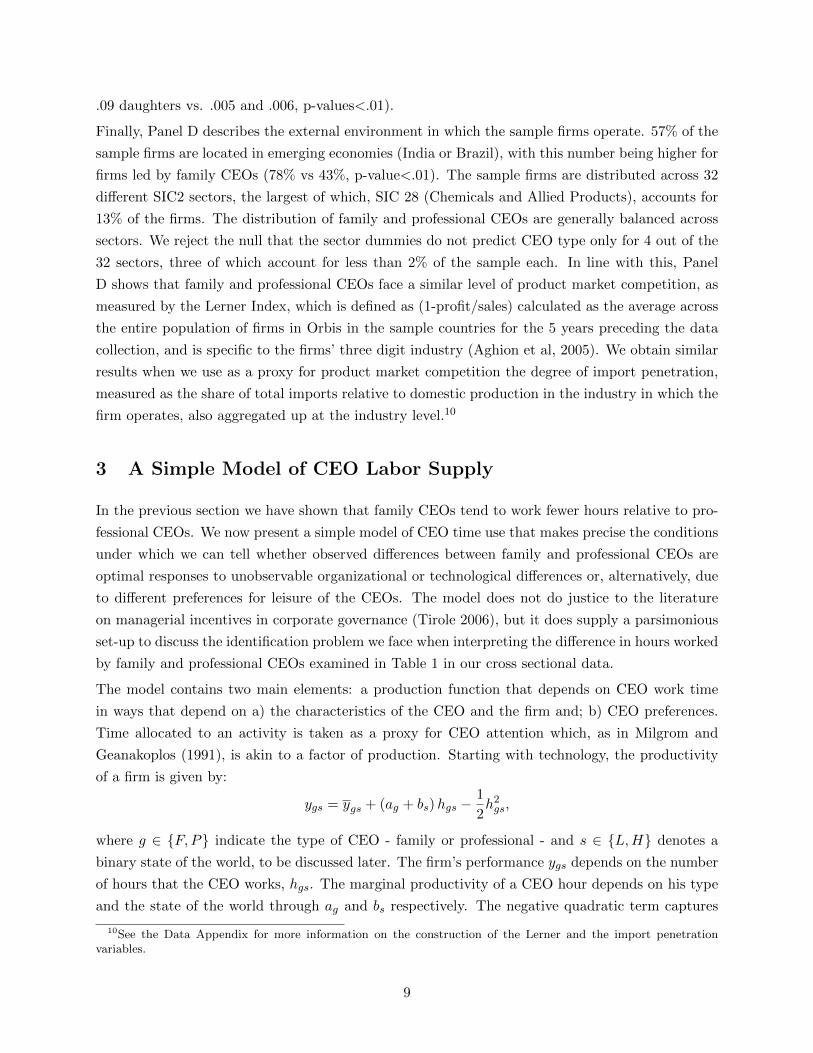
3 A Simple Model of CEO Labor Supply
In the previous section we have shown that family CEOs tend to work fewer hours relative to pro-
fessional CEOs. We now present a simple model of CEO time use that makes precise the conditions
under which we can tell whether observed di↵erences between family and professional CEOs are
optimal responses to unobservable organizational or technological di↵erences or, alternatively, due
to di↵erent preferences for leisure of the CEOs. The model does not do justice to the literature
on managerial incentives in corporate governance (Tirole 2006), but it does supply a parsimonious
set-up to discuss the identification problem we face when interpreting the di↵erence in hours worked
by family and professional CEOs examined in Table 1 in our cross sectional data.
The model contains two main elements: a production function that depends on CEO work time
in ways that depend on a) the characteristics of the CEO and the firm and; b) CEO preferences.
Time allocated to an activity is taken as a proxy for CEO attention which, as in Milgrom and
Geanakoplos (1991), is akin to a factor of production. Starting with technology, the productivity
of a firm is given by:
ygs = ygs + (ag + bs)hgs �1
2h2gs,
where g 2 {F, P} indicate the type of CEO - family or professional - and s 2 {L,H} denotes a
binary state of the world, to be discussed later. The firm’s performance ygs depends on the number
of hours that the CEO works, hgs. The marginal productivity of a CEO hour depends on his type
and the state of the world through ag and bs respectively. The negative quadratic term captures
10See the Data Appendix for more information on the construction of the Lerner and the import penetrationvariables.
9
the idea that the marginal return of CEO time is decreasing.
The firm’s performance may also depend directly on the CEO type and on the state of the world
through ygs. The only restriction that our formulation imposes, by having additive ag and bs rather
than a generic ags, is that the identity of the CEO does not interact directly with the state of the
world in determining the marginal e↵ect of CEO time on performance. We do not take a stand
on whether productivity is higher or lower in firms run by family CEOs or professional CEOs: yFs
can be greater or smaller than yPs. We also remain agnostic as to whether the return to CEO time
is higher or lower for family compared to professional CEOs: aF can be greater or smaller than
aP . For example, the marginal productivity of a professional CEO might be di↵erent from that of
a family CEO because the family CEO can delegate more easily to other family members who are
more likely to work for the firm, as seen in Table 1.
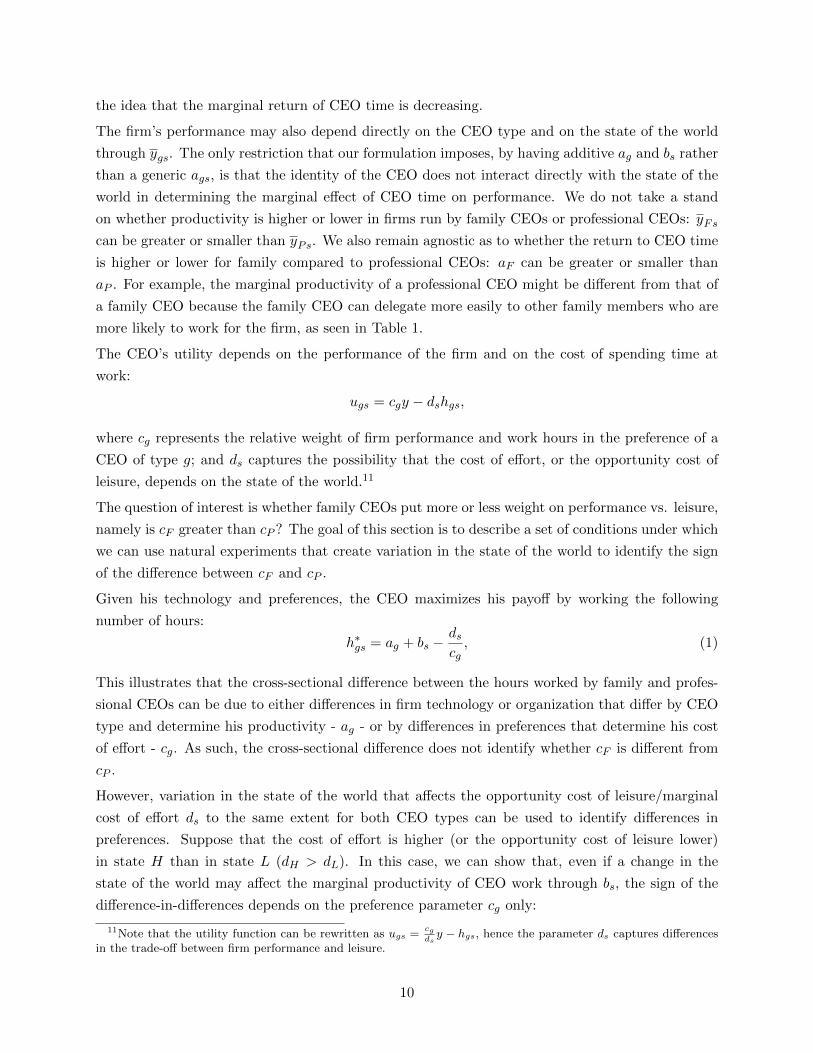
The CEO’s utility depends on the performance of the firm and on the cost of spending time at
work:
ugs = cgy � dshgs,
where cg represents the relative weight of firm performance and work hours in the preference of a
CEO of type g; and ds captures the possibility that the cost of e↵ort, or the opportunity cost of
leisure, depends on the state of the world.11
The question of interest is whether family CEOs put more or less weight on performance vs. leisure,
namely is cF greater than cP ? The goal of this section is to describe a set of conditions under which
we can use natural experiments that create variation in the state of the world to identify the sign
of the di↵erence between cF and cP .
Given his technology and preferences, the CEO maximizes his payo↵ by working the following
number of hours:
h⇤gs = ag + bs �dscg
, (1)
This illustrates that the cross-sectional di↵erence between the hours worked by family and profes-
sional CEOs can be due to either di↵erences in firm technology or organization that di↵er by CEO
type and determine his productivity - ag - or by di↵erences in preferences that determine his cost
of e↵ort - cg. As such, the cross-sectional di↵erence does not identify whether cF is di↵erent from
cP .
However, variation in the state of the world that a↵ects the opportunity cost of leisure/marginal
cost of e↵ort ds to the same extent for both CEO types can be used to identify di↵erences in
preferences. Suppose that the cost of e↵ort is higher (or the opportunity cost of leisure lower)
in state H than in state L (dH > dL). In this case, we can show that, even if a change in the
state of the world may a↵ect the marginal productivity of CEO work through bs, the sign of the
di↵erence-in-di↵erences depends on the preference parameter cg only:
11Note that the utility function can be rewritten as ugs =cgdsy � hgs, hence the parameter ds captures di↵erences
in the trade-o↵ between firm performance and leisure.
10
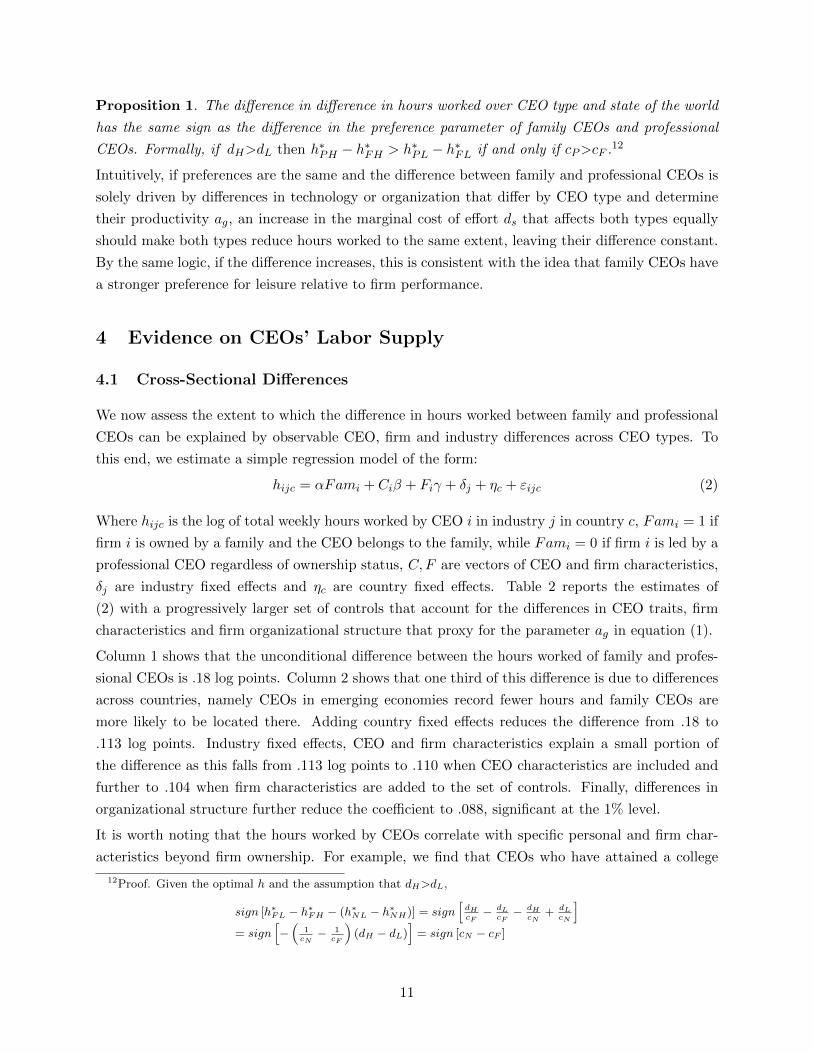
Proposition 1. The di↵erence in di↵erence in hours worked over CEO type and state of the world
has the same sign as the di↵erence in the preference parameter of family CEOs and professional
CEOs. Formally, if dH>dL then h⇤PH � h⇤FH > h⇤PL � h⇤FL if and only if cP>cF .12
Intuitively, if preferences are the same and the di↵erence between family and professional CEOs is
solely driven by di↵erences in technology or organization that di↵er by CEO type and determine
their productivity ag, an increase in the marginal cost of e↵ort ds that a↵ects both types equally
should make both types reduce hours worked to the same extent, leaving their di↵erence constant.
By the same logic, if the di↵erence increases, this is consistent with the idea that family CEOs have
a stronger preference for leisure relative to firm performance.
4 Evidence on CEOs’ Labor Supply
4.1 Cross-Sectional Di↵erences
We now assess the extent to which the di↵erence in hours worked between family and professional
CEOs can be explained by observable CEO, firm and industry di↵erences across CEO types. To
this end, we estimate a simple regression model of the form:
hijc = ↵Fami + Ci� + Fi� + �j + ⌘c + "ijc (2)
Where hijc is the log of total weekly hours worked by CEO i in industry j in country c, Fami = 1 if
firm i is owned by a family and the CEO belongs to the family, while Fami = 0 if firm i is led by a
professional CEO regardless of ownership status, C,F are vectors of CEO and firm characteristics,
�j are industry fixed e↵ects and ⌘c are country fixed e↵ects. Table 2 reports the estimates of
(2) with a progressively larger set of controls that account for the di↵erences in CEO traits, firm
characteristics and firm organizational structure that proxy for the parameter ag in equation (1).
Column 1 shows that the unconditional di↵erence between the hours worked of family and profes-
sional CEOs is .18 log points. Column 2 shows that one third of this di↵erence is due to di↵erences
across countries, namely CEOs in emerging economies record fewer hours and family CEOs are
more likely to be located there. Adding country fixed e↵ects reduces the di↵erence from .18 to
.113 log points. Industry fixed e↵ects, CEO and firm characteristics explain a small portion of
the di↵erence as this falls from .113 log points to .110 when CEO characteristics are included and
further to .104 when firm characteristics are added to the set of controls. Finally, di↵erences in
organizational structure further reduce the coe�cient to .088, significant at the 1% level.
It is worth noting that the hours worked by CEOs correlate with specific personal and firm char-
acteristics beyond firm ownership. For example, we find that CEOs who have attained a college
12Proof. Given the optimal h and the assumption that dH>dL,
sign [h⇤FL � h⇤
FH � (h⇤NL � h⇤
NH)] = signhdHcF
� dLcF
� dHcN
+ dLcN
i
= signh�⇣
1cN
� 1cF
⌘(dH � dL)
i= sign [cN � cF ]
11
degree, who manage larger firms and who have a larger number of direct reports work longer hours,
while those whose sons hold senior management positions in the firm work fewer hours. The cor-
relation between any of these variables and hours worked is an order of magnitude smaller than
the e↵ect of CEO type. In column (6) the college degree dummy is associated with an increase in
hours worked of .063 log points (standard error 0.029), a one standard deviation increase in firm
size increases hours worked by .032 log points, a one standard deviation increase in the number of
direct reports increases hours worked by .026 log points, and a one standard deviation increase in
the number of sons in management decreases hours worked by .018 log points.
We also note that there is no correlation between the identity of the survey respondent (the PA or
the CEO himself) and hours worked, which allays concerns that PAs have more limited information
or that CEOs who choose to report their own time use overstate hours worked. Importantly,
controlling for the identity of the respondent does not a↵ect the estimated di↵erence between
family and professional CEOs.13
Since 16% of the sample firms are owned by a family and managed by a professional CEO we can
separately identify the e↵ect of family CEOs from the e↵ect of family ownership. Column 7 shows
that professional CEOs working in firms owned by a founder or a family are statistically undis-
tinguishable from other professional CEOs. We interpret this finding as prima facie evidence that
the di↵erences in hours worked between family and professional CEOs are not due to unobservable
technological characteristics that are specific to family firms.
Finally, Column 8 replicates the analysis using the recall measure to shed light on whether pro-
fessional CEOs might be more prone to overstate hours worked to impress the board. If so, we
would expect the di↵erence to be larger when using the recall measure that is easier to manipulate.
In contrast, Column 8 shows that the di↵erence is smaller. This is consistent with the fact that
- as shown in Table 1 - family CEOs who are more prone to overstate hours worked relative to
professional CEOs.
As mentioned above, in our baseline specifications we group founder CEOs and their descendants
in the same category, since in both cases these CEOs have a direct and sizable ownership stake in
the company they run. Appendix Tables A2 and A3 provides additional evidence on the di↵erence
between founders and their descendants. Table A2 shows that, unconditionally, founders work 1.3
fewer hours per week relative to professional CEOs, but they are also are older, less educated, have
longer tenure and are mostly located in emerging economies. Once all observable characteristics
are controlled for, Columns 5 and 6 in Table A3 show that both founder and descendant CEOs
work 9% fewer hours than professional CEOs. This is in line with the fact that both founder
and descendant CEOs are wealthier than professional CEOs. Furthermore, it is important to note
that the founders managed firms in our sample are not start-ups: the average founder has been
managing his firm for 22 years. That founder and descendant CEOs behave similarly is also in line
with recent findings that both adopt worse managerial practices (Bloom et al 2012) and that they
share a similar business philosophy and firm governance (Mullins and Schoar 2013).
13The coe�cient remains stable at .088 if we remove the variable capturing the identity of the respondent.
12
Taken together, di↵erences in CEO and firm observable characteristics, including family ownership,
explain a quarter of the di↵erence in total hours between family and professional CEOs. The re-
maining gap in hours worked might be due to unobservable di↵erences in technology or organization
that are specific to family firms, but only when managed by family CEOs, or to di↵erences in the
preferences of the CEOs. We attempt to disentangle these two potential sources of variation in
Section 4.2 below.
4.2 Di↵erence in Di↵erences
State of the world variation I: across firms
Informed by Proposition 1, we exploit di↵erences in factors that a↵ect the CEO opportunity cost
of leisure. We look specifically at two such factors: firm size and the level of competition the firm
is exposed to. In both cases, the intuition is straightforward. The opportunity cost of leisure is
higher in larger firms because the CEO controls a larger volume of activity. Therefore, the marginal
hour of leisure deprives more people of the input of the CEO, and each decision not taken during
that hour has larger monetary value. This is akin to the “scale of operations” e↵ect (Mayer 1960).
Symmetrically, the opportunity cost of leisure is higher in more competitive settings because the
baseline probability of survival is lower, and high CEO e↵ort is more likely to be essential to keep
the firm in business. The marginal hour of leisure can make the di↵erence between firm death and
survival in competitive industries while its consequences are less dire for firms that are sheltered
from competition.
Table 3 reports the estimates of
hijc = ↵Fami + �Fami ⇤Xij + �Xij + Ci'+ Fi�+ �j + ⌘c + "ijc (3)
where Xij is a measure of firm i size, or a measure of competition in industry j, and all other
variables are as defined above. Proposition 1 makes clear that, under the assumption that the
opportunity cost of leisure is higher in larger firms and in more competitive industries, the di↵erence
in di↵erence parameter � has the same sign as the di↵erence in preferences between professional
and family CEOs, namely �> 0 implies that, compared to family CEOs, professional CEOs put
more weight on firm performance relative to leisure.
In Table 3 we use two measures of firm size, number of employees and revenues, and two measures
of competition, the Lerner index and import penetration. The estimates in columns 1 to 4 reveal
a consistent picture: when the opportunity cost of leisure is higher, the di↵erence in hours worked
between family and professional CEOs is smaller. The estimates of � are positive and statistically
di↵erent from zero for all four measures, and the magnitudes are economically meaningful. The
di↵erence between family and professional CEOs is .13 (.12) log points in firms at the 10th percentile
of the distribution of log employment (log sales) but only .04 (.05) log points in firms at the 90th
percentile. Thus, family CEOs in large firms work almost as much as their professional counterparts,
while those in small firms work significantly less. Likewise, the di↵erence between family and
13
professional CEOs is .11 (.12) log points in low competition industries at the 10th percentile of the
Lerner (import penetration) index but only .05 (.05) log points in high competition industries at
the 90th percentile.
In light of Proposition 1, the di↵erence in di↵erences estimates with respect to size and competition
indicates that family CEOs put lower weight on firm performance relative to leisure, that is cP > cF .
An observationally equivalent explanation is that there is a distribution of preferences for leisure
among family CEOs, and variation in the opportunity cost of leisure at the firm or industry level
determines selection, so that leisure-loving family CEOs are only found in small firms and low-
competition industries. In this case, leisure-loving family CEOs drop out rather than working
longer hours, but di↵erences in preferences still explain di↵erences in hours worked. To shed light
on whether family and professional CEOs adjust their hours di↵erently in response to shocks, the
next subsection exploits variation in the cost of e↵ort across days.
State of the world variation II: across days
For the largest of our sample countries - India (357 CEOs) - we are able to exploit shocks a↵ecting
the cost of CEO e↵ort during our sample week. We focus on India because the data collection
period coincided with monsoon rainfall and a popular sport tournament, both of which increased
the cost of e↵ort on some days but not on others.14 Extreme rainfall disrupts local transportation in
urban areas (where most of the CEOs in our sample are located), adding delays and inconveniences
that increase the cost of e↵ort. We obtain rainfall data for all the major weather stations in India
and classify a day as having extreme rain if its deviation from the pre-monsoon benchmark falls in
the upper third of the station level distribution of the same variable. By this measure, 256 CEOs
experience extreme rain at least once during the survey week.15
The second natural experiment we exploit is the broadcasting of important cricket matches. Cricket
is the most popular sport in India, and the cost of e↵ort is likely to be higher during a match for
an average individual, including CEOs. For this test we take advantage of the fact that our data
collection partially overlapped with the playo↵s, semifinals and finals of a major cricket tournament,
the Indian Premier League (IPL). We collect data on the timing of these matches and classify a
day to have a cricket match if one is broadcasted on the day. 28 CEOs are exposed to at least one
match during the survey week.
Table 4 uses the total hours of work at the daily level to estimate the following di↵erence in
14The expected arrival of the monsoon is around June 1st, starting from the southwestern coast of Kerala, andgradually covering the entirety of India by July 15th.
15To build the rain shock variable we proceed in four steps. First, we obtain rainfall data for all the major weatherstations in India starting in May through the end of July 2011. Second, we use this data to compute the averagestation level rainfall in the pre-monsoon period in May, and for each station level observation in June and July wecompute the percentage di↵erence in rainfall with respect to the pre-monsoon period. Third, we define a given dayto have extreme rain if its deviation from the May benchmark falls in the upper third of the station level distributionof the same variable. Fourth, we match the CEO time use information with the rainfall data of the closest weatherstation by using the modal (manually collected) zip code of the activities undertaken by the CEO during the week.Further details on the construction of this variable is provided in the Data Appendix.
14
di↵erences specification:
hid = ↵Fami + �Fami ⇤Xd + �Xd + Ci⇢+ Fi'+ Si� + Ii⌘ + "id (4)
where hid is one plus the log of daily hours worked by CEO i on day d, Fami = 1 if CEO i
belongs to the owning family as defined above, Xd = 1 if day d has extreme rainfall in Columns
1-2 and a cricket match in Columns 3-6 and C,F, S, I are vectors of CEO, firm, state and industry
characteristics as defined in equation 2; standard errors are clustered at the CEO level to take into
account unobservables that a↵ect a given CEO over the week.16 The coe�cient of interest is �, the
di↵erence in di↵erences estimator that measures how di↵erent CEOs react to higher marginal cost
of e↵ort.
Column 1 replicates our baseline specification using daily data from India alone, controlling for
extreme rain. The estimate in column 1, Table 4 indicates that, in line with earlier estimates,
the di↵erence between family and professional CEOs is .07 log points while the e↵ect of extreme
rain is small and not significant. Column 2 shows that the di↵erence in di↵erences coe�cient is
�.083 and precisely estimated at the 5% level. In light of Proposition 1, this indicates that family
CEOs put lower weight on firm performance, that is cP > cF . The results in column 2 also indicate
that family CEOs do not make up lost time by working more on days without extreme rain. The
di↵erence between family and professional CEOs on days without extreme rain is negative rather
than positive and not significantly di↵erent from zero.
The model indicates that the di↵erence in di↵erences estimate identifies the sign of the di↵erence in
preferences if and only if the cost shock (rain) a↵ects all CEOs equally regardless of firm ownership.
This assumption fails if factors correlated with family ownership a↵ect the e↵ect of rain shocks on
the marginal cost or the marginal product of CEO time, namely cov("id,Fami ⇤ Raind) 6= 0.
For example, firms run by family CEOs might have characteristics that make them more prone
to be disrupted by rain (for example, due to the presence of old machinery or bad maintenance
processes). To test the robustness of the results to these factors, in Appendix Table A4a we
augment the specification with additional CEO and firms controls and interactions between rain
and state, and between industry, CEO and firm characteristics. Reassuringly, the inclusion of these
interactions does not generally a↵ect the magnitude and precision of the di↵erence in di↵erence
estimate allaying the concern that this captured unobservables at the firm day level.
Column 3 shows that on days when cricket matches are played the average CEO works 5.8% fewer
hours. Column 4 shows that the di↵erence in di↵erences � is negative (�.049) albeit not precisely
estimated. Since IPL matches are generally held in the evenings, we can use the exact timings
of activities to increase the precision of our estimates. To do so, we divide the work day in two
intervals, before and after 3PM. This analysis (shown in columns 5 and 6) shows that professional
CEOs increase their hours worked in advance of cricket games, while they tend to work significantly
less in the hours immediately preceding the game (from 3PM onwards). In contrast, family CEOs
16In the cricket regressions the standard errors are clustered at the CEO and day level.
15
work fewer hours throughout the day. Therefore, while all CEOs reduce hours to watch the match
in the afternoon, professional CEOs compensate by working harder before the match, while family
CEOs do not. Finally, Appendix Table A4b allows for a rich set of interactions between cricket
matches and CEO, firm, industry and state characteristics. The conclusions are generally robust
to these more flexible specifications.17
Taken together, the results in this section cast doubt on the explanation that di↵erences in hours
worked are optimal responses to di↵erences in firm level technology or organization, and rather point
to the fact that the leisure-performance tradeo↵ di↵ers between family and professional CEOs, with
the former putting a larger weight on leisure. The next section provides indicative evidence of why
that might be the case.
5 Mechanisms
5.1 Wealth and the demand for leisure
The di↵erence in hours worked between family and professional CEOs can be rationalized with a
simple labor supply model where leisure is a normal good and family CEOs have more non-labor
income or wealth. While it is intuitive that the average family CEO, who owns a sizable share of
the firm, is wealthier than the average professional CEOs, who owns a small share of the firm (if
any), a test of the hypothesis requires comparing the di↵erence in hours worked at di↵erent levels
of wealth di↵erentials. Measuring personal wealth via surveys is notoriously di�cult and we have
no information, let alone a plausible source of variation, on the CEOs’ wealth.
Instead, we approach this question using as a proxy for wealth di↵erentials between family and
professional CEOs exploiting cross-country di↵erences in inheritance laws compiled by Ellul et al
(2010), which provide a country-specific measure of the largest share of the family wealth that can
be bequeathed to a single heir. Intuitively, more permissive laws favor the concentration of wealth
in the hands of the individual designated to inherit the control of the family business. Other things
equal, we therefore expect family CEOs to be wealthier in countries where the maximal share of
transmissible wealth is larger. To test whether this results in larger di↵erences in hours worked
between family and professional CEOs we estimate:
hijc = ↵Fami + �Fami ⇤ (Sc � S̄) + Ci'+ Fi�+ �j + ⌘c + "ijc (5)
where Sc is the largest admissible inheritance share in country c and S̄ is the sample mean. Standard
errors are clustered at the country level and bootstrapped using the wild bootstrapping technique
proposed by Cameron et al (2008). Our coe�cient of interest is �, the interaction between the
family CEO dummy and the inheritance share variable. Under the assumption that the latter
proxies for family CEOs wealth, the hypothesis that the demand for leisure is increasing in wealth
17The interaction Family CEO*Cricket game retains its negative sign but loses significance at conventional levelswhen we include a full set of CEO characteristics*Cricket interactions (Table A4b, column 2) and when we includefirm characteristics*Cricket interactions (Table A4b, column 3).
16
implies � < 0. We scale Sc in deviation from its sample mean, so that the coe�cient on the family
CEO dummy ↵ measures the di↵erence between family and professional CEOs at the mean values
of Sc. Sc ranges from .5 (France and India) to 1 (UK and US).18
Column 1, Table 5 reports the estimates of (5). We find that � < 0 and to be precisely estimated.
Its magnitude implies that going from an average share of .69 to the highest share of 1 increases the
di↵erence in hours worked by .07 log points, 79% of the mean e↵ect. In other words, family CEOs
located in countries with the average level of the inheritance variable work 9% fewer hours than
professional CEOs; those in countries with the highest level of the inheritance variable work 16%
fewer hours than professional CEOs. Below we show that these findings are robust to allowing the
e↵ect of family CEOs to be heterogeneous along other dimensions that might vary at the country
or regional level.
5.2 Unable or unwilling to delegate?
The results discussed above suggest that family CEOs demand more leisure, possibly because they
are wealthier. The question that naturally arises is why do they work at all, that is why don’t
family CEOs simply delegate their role to professional managers? One possibility is that delegation
is prohibitively costly in countries with poor contract enforcement like India (Bloom et al 2013).
If delegation costs entirely explain why family CEOs stay at the helm of their firms, we should
observe no di↵erence in the time use of family and professional CEOs in countries where contracts
are easily enforced. Intuitively, when delegation is feasible all family CEOs who have a higher
marginal utility of leisure should delegate to hard working professionals and enjoy the extra profits
these generate, while the only family CEOs who choose not to delegate should work as hard as
professional CEOs.
To test this hypothesis, Columns 2-5 in Table 5 estimate (5) using di↵erent proxies of contract
enforcement in lieu of S. Column 2 uses regional GDP, a country specific measure of the level of
development (Gennaioli et al, 2013), which is presumably correlated with the quality of contractual
enforcement. Column 3 uses cross-country di↵erences in the rule of law and Column 4 uses regional
variation in the level of generalized trust, which we take as a proxy for the ease to manage incomplete
contracts (Bloom, Sadun and Van Reenen, 2012). As above, we scale these variables in deviation
from their sample means. Columns 2-4 show that none of the interactions with these country-
specific measures are significant. Finally, Column 5 includes together all the interactions between
the family CEO dummy and all the proxies of contract enforcement, plus the interaction with the
inheritance law variable discussed in the previous section. The latter remains of a similar magnitude
18For India we refer to the Hindu Succession Act (1956) that stipulates that the head of a family firm (HUF orHindu United Family) must bequeath his share of the firm in equal parts to all members of the HUF. In our sample,81% of the family firms are confirmed HUF but we do not know the number of members (for 19% we could not findinformation on HUF status). We take 0.5 to be the upper bound of the inheritance share as there must be at leasttwo members in a HUF. Results are robust to assuming there are three surviving members hence the maximal shareis 0.33. In contrast, Ellul et al (2010) use the value from the Indian Succession Act. This, however, does not applyto Hindus who account for 80.5% of the population.
17
and statistically significant at the 10% level.
Taken together, the findings in Table 5 cast doubt on the hypothesis that family CEOs would prefer
to delegate but are not able to do so due to costly contract enforcement. Instead, family CEOs
appear to be unwilling rather than unable to delegate. We speculate on possible reasons below.
5.3 CEO hours and firm performance
The last possibility we investigate is that the di↵erences in hours worked between family and
professional CEOs has a negligible e↵ect on firm productivity. If this were the case, it would not be
worth incurring the cost of hiring a professional CEO. To assess whether di↵erences in hours worked
across CEOs are associated with di↵erences in productivity we use panel data at the firm-year level
to estimate a basic production function of the form:
yit = ↵llit + ↵kkit + ↵mmit + ↵hhi + �0Zit + uit (6)
Where yit are sales, lit is labor, kit capital, mit materials of firm i at time t and lower case letters
denote natural logarithms. CEO log daily hours worked are denoted by hi. To the extent that our
measures reflect time use shocks that hit in that particular week or biases in reporting time use
that are orthogonal to yearly firm outcomes, the estimated coe�cients will be biased towards zero.
The accounting data are extracted from accounts published on ORBIS. We restrict the analysis to
the years in which the manager we interviewed actually had the role of CEO, and for each firm
we keep the three most recent years in the data to avoid selection on CEOs with longer tenure.
We also control a full set of industry, country and year dummies and a vector of noise controls.
Standard errors are clustered at the firm level to account for correlated shocks within the same
firm through time.
The results of the analysis are presented in Table 6. Column 1 shows that the association between
hours worked and log sales controlling for employment is positive and precisely estimated: a 1%
change in weekly hours worked is associated with a 0.45% increase in labor productivity. Including
controls for capital and materials reduces the magnitude of the coe�cient on log hours to 0.36, but
leaves its significance unchanged (column 2). For comparison, a 1% increase in capital (employment)
is associated with a 0.26% (0.48%) increase in log sales. Using the coe�cient on CEO hours worked
estimate of column 2, increasing hours worked by the amount of the di↵erence between family and
professional CEOs is associated with a 2.6% increase in productivity.
While in the absence of exogenous variation in hours worked we cannot identify causal e↵ects,
columns 3 and 4 present two placebo tests that partially allay concerns that the observed correlation
is due to reverse causality or measurement error. First, we observe 357 firms at least one year before
the appointment of the current CEO. This allows us to test whether unobservable time-invariant
firm characteristics correlated with firm performance determine hours worked. If this were the case,
we should observe that productivity and hours worked are correlated even when the CEO is not
actually in o�ce. Column 3 shows that this is not the case: the correlation between productivity
18
before the CEO appointment and his hours worked after being appointed is negative and not
precisely estimated.19
A second concern is that the correlation between hours worked and productivity is driven by
measurement error in the time use data. For instance, more productive firms might hire more
talented PAs who keep a more complete record of the CEOs’ activities, thus creating a spurious
correlation between hours recorded and productivity, while the underlying correlation between
hours worked and productivity is zero. To test the practical relevance of this concern, in Column
4 we regress productivity on hours devoted to travel. Intuitively, if the correlation due to PAs in
more productive firms recording hours more carefully, non-work activities should also be positively
correlated with productivity. The findings in Column 4 allay this concern: the correlation between
productivity and time spent traveling is zero.
A question of interest is whether the advantages of having a hard working CEO are competed away,
namely if CEOs capture the entire surplus they generate by working longer hours. To shed light
on this issue, we test whether time use is correlated to firm profitability. Columns 5 and 6 estimate
equation 6 using two measures of firm profitability: the return on capital employed (ROCE) and
Tobin’s q. Our measure of hours worked is positively correlated with both. The magnitude of the
estimates implies that an increase in hours worked equal to the di↵erence between professional and
family CEOs is associated with an increase in ROCE (Tobin’s q) of 3% (5%) of the sample mean.
Finally, column 7 shows that hours worked are also associated with faster sales growth: an increase
in hours worked equal to the di↵erence between professional and family CEOs is associated with
.003 (7.5% of the sample mean) faster sales growth over one year.
The positive correlation between CEO hour worked and firm performance, couple with the fact that
family CEOs prefer to lead their firms even when delegation to professional managers is feasible,
suggests that family CEO might enjoy non-monetary benefits of control (Demsetz and Lehn 1985,
Bandiera et al 2013).
6 Conclusion
The evidence presented in this paper paints a consistent picture of the di↵erence in behavior between
family and professional CEOs. Family CEOs tend to work fewer hours relative to professional
managers. The di↵erence between the two types of managers is smaller when the opportunity cost
of leisure is larger, and when the marginal cost of e↵ort is smaller. These patterns can be accounted
for by a di↵erence in the preferences of family and professional CEOs, with the former placing a
higher relative weight on leisure, presumably due to wealth e↵ects. To provide support to this idea,
we show that the di↵erences in hours worked between family and professional CEOs are greater
where inheritance laws favor wealth concentration.19This is not driven by sample composition. The correlation between productivity and hours after the CEO
appointment is the same for this group of firms as for the larger sample.
19
The data also reveals a strong correlation between CEO hours and firm performance. While no
causal inference can be made, combining this correlation with the e↵ect of ownership on hours trans-
lates into a 2.6% productivity di↵erence between family and professional CEOs. The behavioral
di↵erence is hence a potential candidate to account for at least some of the performance di↵erential
between family and non-family firms documented in the literature (Morck et al 2000, Villalonga
and Amit 2006, Perez-Gonzalez 2006, Bennedsen et al. 2007, Bertrand et al 2008, Bertrand 20).
More generally, the evidence presented here highlights the importance of how corporate leaders
allocate their limited attention. Attention is a scarce resource, particularly so at the top of the
organization. The allocation of time reflects the allocation of attention, which in turns depends on
the strategic priorities of the CEO. The importance for e↵ective corporate leaders of aligning their
own time management to their goals has been a cornerstone of leadership theories for many years
(Drucker 1966). According to Simon (1976), “attention is the chief bottleneck in organizational
activity, and the bottleneck becomes narrower and narrower as we move to the tops of organiza-
tions.” Attention constraints at the top feature prominently in economic models of organizational
hierarchies, which study how managers should allocate this resource optimally. This study doc-
uments di↵erences in attention allocation at the top, but does not identify the channel through
which they may a↵ect firm performance. Halac and Prat (2014) model the e↵ects of attention
misallocation on the quality of management and the engagement of the workforce. Future research
should investigate this and other possible channels for this e↵ect.
Finally, the finding that family CEOs put less e↵ort than professional CEOs because of a wealth
e↵ect raises a public finance question. Would an increase in taxation that a↵ects the owners of
family firms bring about an increase in productive e�ciency? Such taxation might include: an
inheritance tax, a wealth tax, or a reduction in the various forms of exemptions that family firms
enjoy in many parts of the world. Our evidence that inheritance laws are strongly correlated with
the hours worked by family CEOs is a case in point.
20
References
[1] Aghion, Philippe, Nick Bloom, Richard Blundell, Rachel Gri�th and Peter Howitt,
“Competition and innovation: an inverted U relationship,” Quarterly Journal of Eco-
nomics, 120 (2005), 701-728.
[2] Bandiera, Oriana, Luigi Guiso, Andrea Prat, and Ra↵aella Sadun, “What do CEOs
do?” (2011), HBS Working Papers n. 11-081.
[3] Bandiera, Oriana, Luigi Guiso, Andrea Prat, and Ra↵aella Sadun, “Matching Man-
agers, Firms and Incentives,” (2013) forthcoming, Journal of Labor Economics.
[4] Bennedsen, Morten, Kasper Meisner Nielsen, Francisco Perez-Gonzalez and Daniel
Wolfenzon, “Inside the Family Firm: The Role of Families in Succession Decisions
and Performance,” Quarterly Journal of Economics, 122 (2007), 647-691.
[5] Bertrand, Marianne. “CEOs.” Annual Review of Economics, 1, no. 1 (2009), 121-50.
[6] Bertrand, Marianne and Sendil Mullainathan, “Enjoying the Quiet Life? Corporate
Governance and Managerial Preferences,” Journal of Political Economy, 111 no. 5
(2003), 1043-1075.
[7] Bertrand, Marianne and Antoinette Schoar, “Managing with Style: The E↵ect of
Managers on Firm Policies,” Quarterly Journal of Economics, 118 (2003), 1169-1208.
[8] Bertrand Marianne, Simon Johnson, Krislert Samphantarak and Antoinette Schoar,
“Mixing Family with Business: A Study of Thai Business Groups and the Families
Behind Them,” Journal of Financial Economics, 88 (2008), 466–498.
[9] Bloom, Nicholas and John Van Reenen, “Measuring and Explaining Management
Practices across Firms and Countries,” Quarterly Journal of Economics, 122, no. 4
(2007) 1351-1408.
[10] Bloom, Nicholas and John Van Reenen, “Why Do Management Practices Di↵er across
Firms and Countries?,” Journal of Economic Perspectives, 24 no. 1 (2010), 203-24.
[11] Bloom, Nicholas, Ra↵aella Sadun and John Van Reenen, “The Organization of Firms
Across Countries,” The Quarterly Journal of Economics, 127 no. 4 (2012), 1663-1705.
[12] Bloom, Nicholas, Benn Eifert, Aprajit Mahajan, David McKenzie and John Roberts,
“Does Management Matter? Evidence from India,” Quarterly Journal of Economics,
128, no. 1 (2013), 1-51.
[13] Bloom, Nicholas, Christos Genakos, Ra↵aella Sadun, and John Van Reenen, “Manage-
ment Practices Across Firms and Countries,” Academy of Management Perspectives,
26 no. 1 (2012), 12-33.
21
[14] Burkart, Mike C., Fausto Panunzi, and Andrei Shleifer, “Family Firms,” Journal of
Finance, 58, no. 5, (2003), 2167-2202.
[15] Cameron, A. Colin, Jonah B. Gelbach, and Douglas L. Miller (2008) ’Bootstrap-
based improvements for inference with clustered errors.’ The Review of Economics
and Statistics 90(3).
[16] Caselli, Francesco and Nicola Gennaioli, “Dynastic Management”. Economic Inquiry,
51, no. 1, (2013), 971-996.
[17] Demsetz, Harold, and Kenneth Lehn, “The Structure of Corporate Ownership: Causes
and Consequences,” Journal of Political Economy, 93, no. 6 (1985), 1155-1177.
[18] Doepke, Matthias and Fabrizio Zilibotti, 2008. “Occupational Choice and the Spirit
of Capitalism,” The Quarterly Journal of Economics, vol. 123(2), pages 747-793, 05.
[19] Drucker, Peter F., The E↵ective Executive, (1966), New York:Harper & Row.
[20] Garicano, Luis, “Hierarchies and the Organization of Knowledge in Production,” Jour-
nal of Political Economy, 108, no. 5 (2000), 874-904.
[21] Garicano, Luis and Andrea Prat, “Organizational Economics with Cognitive
Costs,”Advances in Economic Theory, Econometric Society 10th World Congress, D.
Acemoglu, M. Arellano, E. Dekkel, (2013) Cambridge: University Press,
[22] Geanakoplos, John and Milgrom, Paul, “A Theory of Hierarchies based on Limited
Managerial Attention,” Journal of the Japanese and International Economies, 5, no.
3 (1991), 205-225.
[23] Gennaioli, Nicola, Rafael LaPorta, Florencio Lopez-de-Silanes, and Andrei Shleifer.
2013. Human Capital and Regional Development, Quarterly Journal of Economics
128, no. 1: 105-164.
[24] Graham, John R., Cam Harvey, and Manju Puri, “Capital Allocation and Delegation
of Decision-Making Authority within Firms,” NBER Working Paper 17370, (2011).
[25] Holtz-Eakin,Douglas, David Joulfaian and Harvey S. Rosen “The Carnegie Conjecture:
Some Empirical Evidence” The Quarterly Journal of Economics, Vol. 108, No. 2 (May,
1993), pp. 413-435
[26] Kaplan, Steven N., Mark M. Klebanov and Morten Sorensen, “Which CEO Charac-
teristics and Abilities Matter?” Journal of Finance, 67, no. 3 (2012), 973-1007.
[27] Kaufmann, Daniel, Aart Kraay and Massimo Mastruzzi (2010). “The Worldwide Gov-
ernance Indicators: Methodology and Analytical Issues”. World Bank Policy Research
Working Paper No. 5430
22
[28] Kotter, John P. “What E↵ective General Managers Really Do,” Harvard Business
Review, March-April (1999), 145-159.
[29] La Porta, Rafael, Florencio Lopez-De-Silanes and Andrei Shleifer, ”Corporate Own-
ership Around the World,” Journal of Finance, 54, no. 2 (1999), 471-517.
[30] Luthans, Fred, “Successful vs. E↵ective Real Managers,” Academy of Management
Executive, 2, no. 2 (1988), pp. 127-132.
[31] Malmendier, Ulrike and Geo↵rey Tate, “CEO Overconfidence and Corporate Invest-
ment,” Journal of Finance, 60 (2005), 2660-2700.
[32] Malmendier, Ulrike and Geo↵rey Tate,“Who Makes Acquisitions? CEO Overconfi-
dence and the Market’s Reaction,” Journal of Financial Economics, 89 (2008), 20-43.
[33] Malmendier, Ulrike and Geo↵rey Tate, “Superstar CEOs,” Quarterly Journal of Eco-
nomics, 124, no. 4 (2009), 1593-1638.
[34] Mayer, Thomas “The Distribution of Ability and Earnings” The Review of Economics
and Statistics Vol. 42, No. 2 (1960) , pp. 189-195
[35] Mintzberg, Henry, The Nature of Managerial Work, (1973), New York: Harper &
Row.
[36] McKinsey, “Making Time Management the Organization’s Priority,” McKinsey Quar-
terly, January 2013.
[37] Morck Randall K., David A. Stangeland, and Bernard Yeung, “”Inherited Wealth,
Corporate Control and Economic Growth: The Canadian Disease,” in Concentrated
Corporate Ownership, ed. Randall K. Morck, (2000), 319–69, Chicago: University
Chicago Press.
[38] Mullins, William and Antoinette Schoar, “How do CEOs see their Role? Management
Philosophy and Styles in Family and Non-Family Firms,”NBERWorking Paper 19395,
2013.
[39] OECD, “Economic Surveys of India,” (2007).
[40] Perez-Gonzalez, Francisco, “Inherited Control and Firm Performance,” American Eco-
nomic Review, 96, no. 5 (2006), 1559-1588.
[41] Robinson, John, Steven Martin, Ignace Glorieux and Joeri Minnen, “The Overesti-
mated Workweek Revisited, ”Monthly Labor Review, June (2011).
[42] Schoar, Antoinette and Luo Zuo, “Shaped by Boom and Busts: How the Economy
Impacts CEO Careers and Management Style,” NBER Working Paper 17590, 2012.
23
[43] Simon, Herbert, “Administrative Behavior,” New York, NY, The Free Press (1976).
[44] Tervio, Marko. 2008. “The Di↵erence That CEOs Make: An Assignment Model Ap-
proach.” American Economic Review, 98(3): 642-68.
[45] Tirole, Jean, “The Theory of Corporate Finance,” Princeton University Press, January
(2006).
[46] Villalonga Belen and Raphael Amit, “”How do Family Ownership, Control and Man-
agement A↵ect Firm Value?” Journal of Financial Economics, 80, (2006), 385–417.
24
A Data Appendix
A.1 The Time Use Survey
A.1.1 Survey Management
The time use survey took place in two stages: in the Spring of 2011 a team of 15 analysts based
in Mumbai and led by one of our project managers collected data on India, while the rest of the
countries were covered in a second survey wave in the Spring of 2013 by a team of 40 enumerators
based at the London School of Economics. To ensure comparability, we adopted the same protocol
and retained the same project manager across both waves. The enumerators where typically grad-
uate students (often MBAs) recruited specifically for this project. All enumerators were subject
to a common intensive training on the survey methodology for three days at the beginning of the
project, plus weekly team progress reviews and one to one conversations with their supervisors to
discuss possible uncertainties with respect to the classification of the time use data. Each interview
was checked o↵ at the end of the week by one supervisor, who would make sure that the data was
complete in every field, and that the enumerator had codified all the activities according to the
survey protocol. Each enumerator ran on average 30 interviews.
Each enumerator was allocated a random list of about 120 companies, and was in charge of calling
up the numbers of his or her list to convince the CEO to participate in the survey, and to collect
the time use data in the week allocated to the CEO. One project manager, five full time supervisors
and one additional manager working on a part time basis led the survey team.
We actively monitored and coached the enumerators throughout the project, which intensified
their persistence in chasing the CEOs and getting them to participate. We also o↵ered the CEOs
a personalized analysis of their use of time (which was sent to them in January 2012 to the Indian
CEOs and in June 2014 to the rest of the countries) to give them the ability to monitor their time
allocation, and compare it with peers in the industry.
A.1.2 Sampling Frame
The sampling frame was drawn from ORBIS, an extensive commercial data set that contains
company accounts for several millions of companies around the world. Our sampling criteria were
as follows. First, we restricted the sample to manufacturing and additionally kept firms that were
classified as “active” in the year prior to the survey (2010 in India and 2012 for the other countries)
and with available recent accounting data.20These conditions restricted our sample to 11,500 firms.
Second, we further restricted the sample to companies for which we could find CEOs contact details.
To gather contact information we hired a team of research assistants based in Mumbai, London and
20For the Indian sample, we also restricted the sample to firms headquartered in the fifteen main Indian states.This excluded firms located in Assam, Bihar, Chandigarh, Chhattisgarh, Dadra, Daman and Diu, Goa, HimachalPradesh, Jammu and Kashmir, Jharkhand, Orissa and Uttarakhand, each of which accounts for less than 3% ofIndian GDP.
25
Boston who verified the CEOs names and found their phone numbers and emails. This restricted
the sample to 7,744 firms. Of these, 907 later resulted not to be eligible for the interviews upon the
first telephonic contact (the reasons for non eligibility included recent bankruptcy or the company
not being in manufacturing), and 310 were never contacted because the project ended before this
was possible. The final number of eligible companies was thus 6,527, with median yearly sales of
$53,000,000. Of these, we were able to secure an interview with 1,131 CEOs, although 17 CEOs
dropped out before the end of the data collection week for personal reasons and were thus removed
from the sample before the analysis was conducted.
The selection analysis in Table A1 shows that firms in the final sample have on average slightly
lower log sales relative to the sampling frame (coe�cient 0.071, standard error 0.011). However,
we do not find any significant selection e↵ect on performance variables, such as labor productivity
(sales over employees) and return on capital employed (ROCE).
A.2 Firm Data
A.2.1 Accounts
The data on sales, employment, capital, materials, profits, return on capital employed, market
values came from ORBIS.21 For each company, we restrict the sample to the three most recent
years in the interval running from 2007 to 2011 in India and 2008 to 2012 for the rest of the sample.
A.2.2 Ownership
Ownership data is collected in interviews with the CEOs and independently checked using several
Internet sources (e.g. The Economic Times of India, Bloomberg, etc.), information provided on
the company website and supplemental phone interviews. We define a firm to be owned by an
entity if this controls more than 25.01% of the shares; if no single entity owns at least 25.01% of
the share the firm is labeled as “Dispersed shareholder”. Family firms are defined as those where
a family (combined across all family members, all second generation relative to the founder or
beyond) are the largest shareholders. Founder firms are defined as those where the original founder
of the company is the largest shareholder. For both family 2nd generation and founder firms, we
distinguish between cases in which a family firm or the founder are also CEOs of the company, in
contrast to cases in which a professional manager (i.e. a person not a�liated with the founder or
the family) has been nominated CEO. In the analysis we combine founder CEO and family, 2nd
generation CEOs in a single category (41% of the sample). The omitted category in all regressions
includes family or founder owned firms with professional CEOs (16.2%), dispersed shareholders
(22.5%), government (0.8%), private equity/venture capital (7.5%), private individuals who are
not founders or heirs to the founders of the company (9.3%). In 2.7% of the sample, the firm was
owned by joint venture with equal split of the ownership shares.
21The main exception is India, where employment figures are typically not published in the public accounts.Therefore, we gathered this information from the survey questionnaire.
26
A.3 Industry Data
Our industry classification is the US SIC (1987). Each firm is allocated to each main two digit
sector based on sales. We have 32 distinct two digit industries, and at least two companies for all
of these industries except 4 (0.4% of the sample of firms).
The Lerner index of competition is constructed following Aghion et al. (2005) as the mean of
(1-profit/sales) in the entire database excluding the firm itself for every three digit SIC industry,
using accounting data relative to the six countries in our sample (data averaged between 2006 and
2010 for India and between 2008 and 2012 for the rest of the countries).
The import competition measure is built as real industry imports divided by industry sales, using
STAN data produced by the OECD. The measure is obtained by taking averages across all countries
in our sample for which the industry measures were available (France, Germany, UK and US). The
years used to build this measures are 2006 to 2008, i.e. the latest years for which the data was
produced using the ISIC REV3 classification (the coverage of the countries included in our sample
declines dramatically in the data produced using the ISIC REV4 classification).
A.4 Shocks
A.4.1 Monsoons
The climate data was extracted on 12/08/2011 from http://www7.ncdc.noaa.gov/CDO/cdodata.cmd.
The data was merged with station coordinates (latitude and longitude), and these were in turn used
to merge the data with the time use dataset using the date and zipcode of each of the activities
recorded in the data (data matched with the closest station, distance computed by generating the
vertical and horizontal distance using the latitude and longitude points and applying Pythagoras).
The definition of days of intense rain is based on the comparison of the daily rainfall precipita-
tion with the average precipitation in the pre-Monsoon month of May for the same station. We
first compute a variable measuring for each day between June 1st and July 31st the change in
precipitation relative to the average May values for the same station. We then define a variable
“Extreme Rain” which takes value one if the change in rainfall lies in the third tercile of the overall
distribution computed using data across all stations in the sample.
The measure can be constructed for 350 CEOs in the sample. About 45% of the sample includes
days of extreme rain (standard deviation is .49). 253 CEOs in the sample (159 Family CEOs and
94 professional CEOs) have at least one day of extreme rain during the sample week. 289 CEOs in
the sample (194 Family CEOs and 95 professional CEOs) have at least one day of non-extreme rain
during the sample week. 192 CEOs in the sample (118 Family CEOs and 74 professional CEOs)
have at least one day of extreme rain and one day of non-extreme rain during the sample week.
27
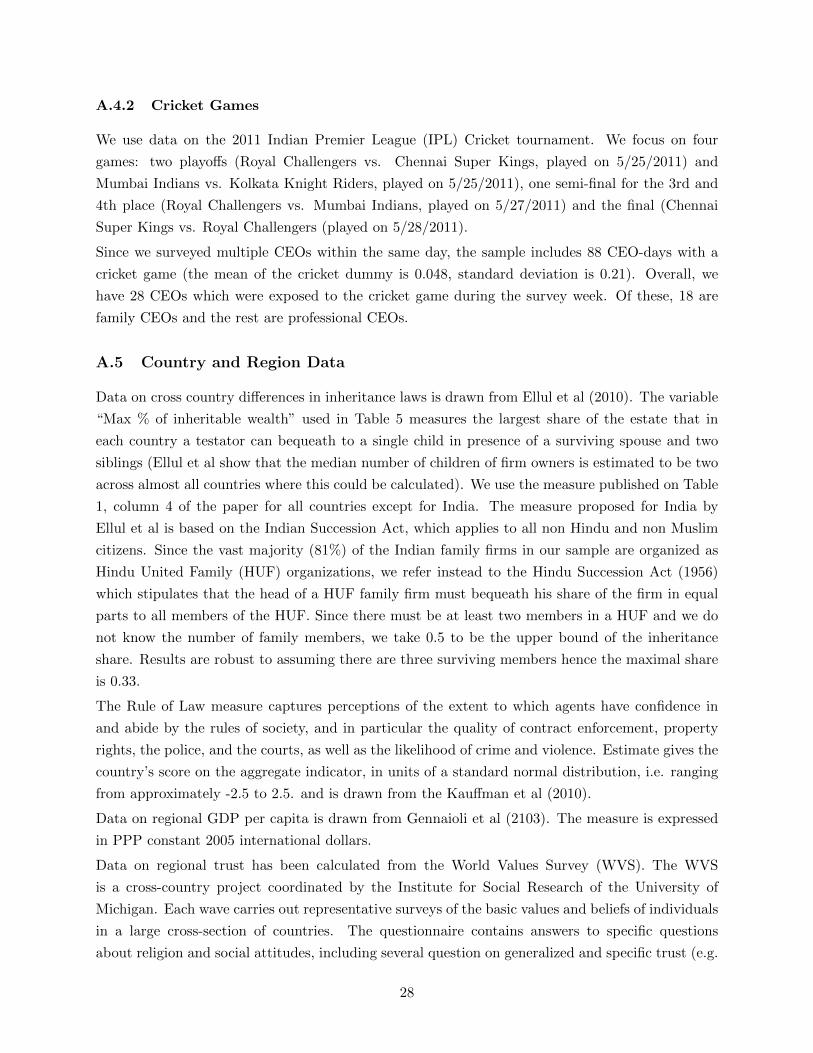
A.4.2 Cricket Games
We use data on the 2011 Indian Premier League (IPL) Cricket tournament. We focus on four
games: two playo↵s (Royal Challengers vs. Chennai Super Kings, played on 5/25/2011) and
Mumbai Indians vs. Kolkata Knight Riders, played on 5/25/2011), one semi-final for the 3rd and
4th place (Royal Challengers vs. Mumbai Indians, played on 5/27/2011) and the final (Chennai
Super Kings vs. Royal Challengers (played on 5/28/2011).
Since we surveyed multiple CEOs within the same day, the sample includes 88 CEO-days with a
cricket game (the mean of the cricket dummy is 0.048, standard deviation is 0.21). Overall, we
have 28 CEOs which were exposed to the cricket game during the survey week. Of these, 18 are
family CEOs and the rest are professional CEOs.
A.5 Country and Region Data
Data on cross country di↵erences in inheritance laws is drawn from Ellul et al (2010). The variable
“Max % of inheritable wealth” used in Table 5 measures the largest share of the estate that in
each country a testator can bequeath to a single child in presence of a surviving spouse and two
siblings (Ellul et al show that the median number of children of firm owners is estimated to be two
across almost all countries where this could be calculated). We use the measure published on Table
1, column 4 of the paper for all countries except for India. The measure proposed for India by
Ellul et al is based on the Indian Succession Act, which applies to all non Hindu and non Muslim
citizens. Since the vast majority (81%) of the Indian family firms in our sample are organized as
Hindu United Family (HUF) organizations, we refer instead to the Hindu Succession Act (1956)
which stipulates that the head of a HUF family firm must bequeath his share of the firm in equal
parts to all members of the HUF. Since there must be at least two members in a HUF and we do
not know the number of family members, we take 0.5 to be the upper bound of the inheritance
share. Results are robust to assuming there are three surviving members hence the maximal share
is 0.33.
The Rule of Law measure captures perceptions of the extent to which agents have confidence in
and abide by the rules of society, and in particular the quality of contract enforcement, property
rights, the police, and the courts, as well as the likelihood of crime and violence. Estimate gives the
country’s score on the aggregate indicator, in units of a standard normal distribution, i.e. ranging
from approximately -2.5 to 2.5. and is drawn from the Kau↵man et al (2010).
Data on regional GDP per capita is drawn from Gennaioli et al (2103). The measure is expressed
in PPP constant 2005 international dollars.
Data on regional trust has been calculated from the World Values Survey (WVS). The WVS
is a cross-country project coordinated by the Institute for Social Research of the University of
Michigan. Each wave carries out representative surveys of the basic values and beliefs of individuals
in a large cross-section of countries. The questionnaire contains answers to specific questions
about religion and social attitudes, including several question on generalized and specific trust (e.g.
28
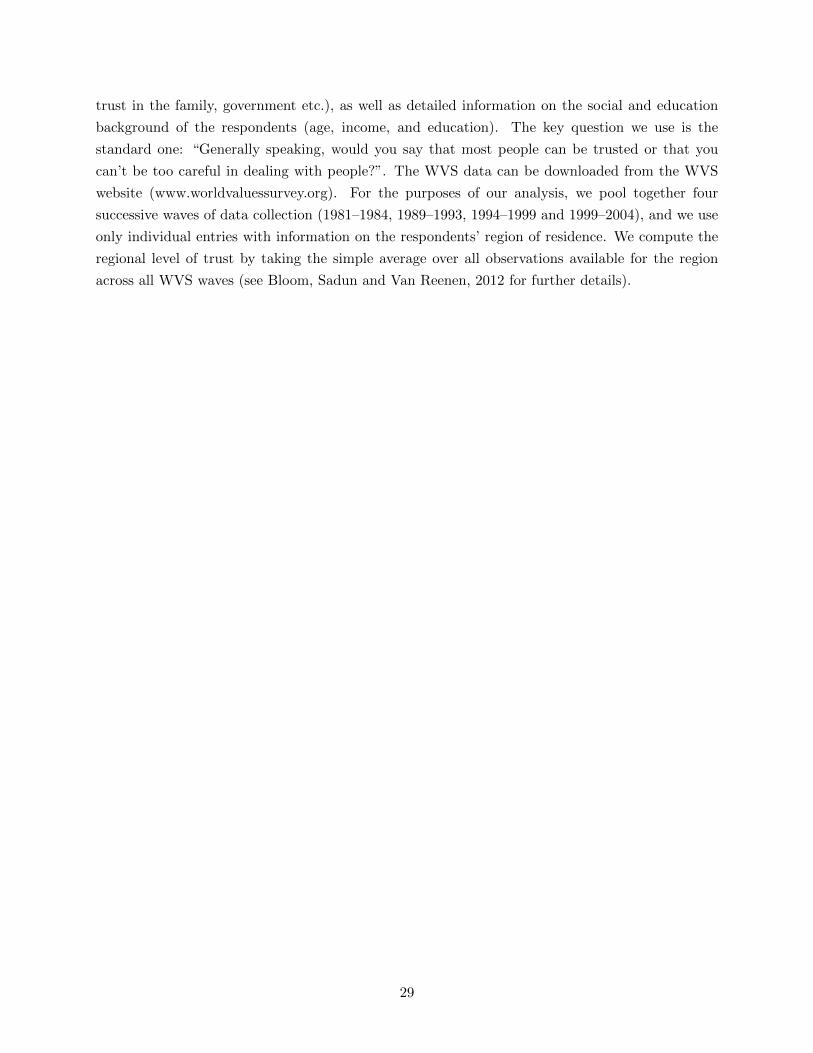
trust in the family, government etc.), as well as detailed information on the social and education
background of the respondents (age, income, and education). The key question we use is the
standard one: “Generally speaking, would you say that most people can be trusted or that you
can’t be too careful in dealing with people?”. The WVS data can be downloaded from the WVS
website (www.worldvaluessurvey.org). For the purposes of our analysis, we pool together four
successive waves of data collection (1981–1984, 1989–1993, 1994–1999 and 1999–2004), and we use
only individual entries with information on the respondents’ region of residence. We compute the
regional level of trust by taking the simple average over all observations available for the region
across all WVS waves (see Bloom, Sadun and Van Reenen, 2012 for further details).
29
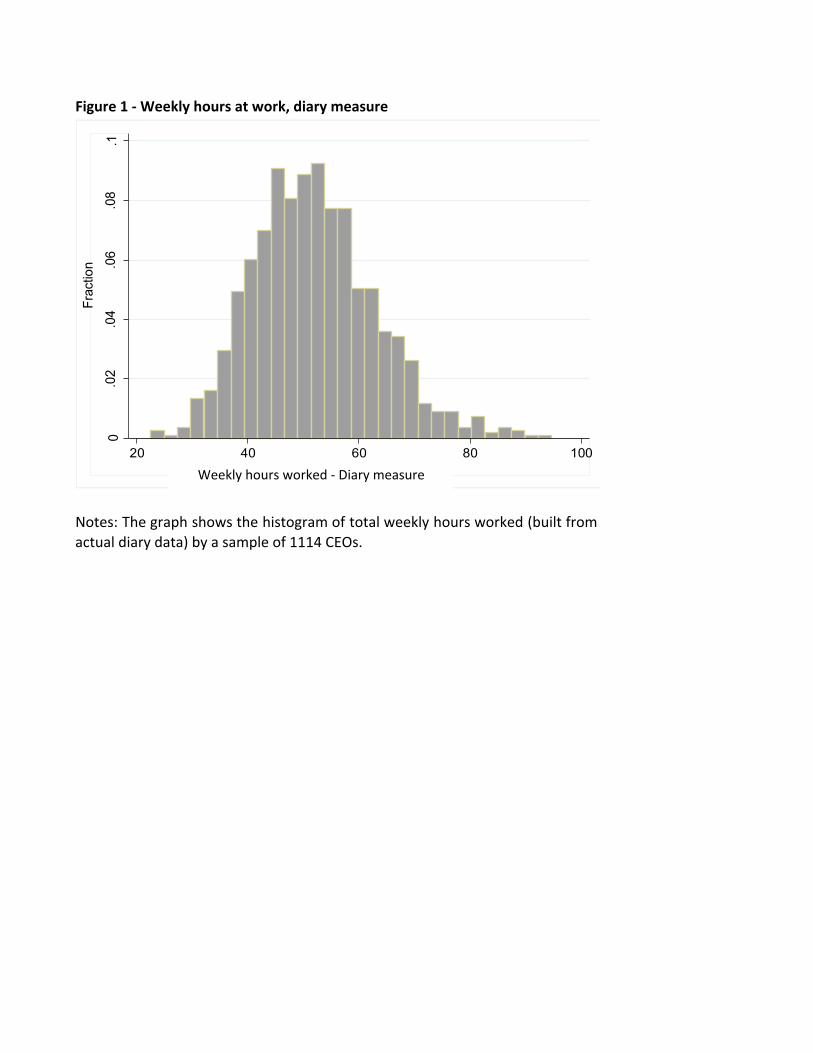
Figure'1')'Weekly'hours'at'work,'diary'measure
Notes: The graph shows the histogram of total weekly hours worked (built fromactual9diary9data)9by9a9sample9of911149CEOs.
0.0
2.0
4.0
6.0
8.1
Frac
tion
20 40 60 80 100Average weekly hours at work
Weekly9hours9worked9B9Diary9measure9
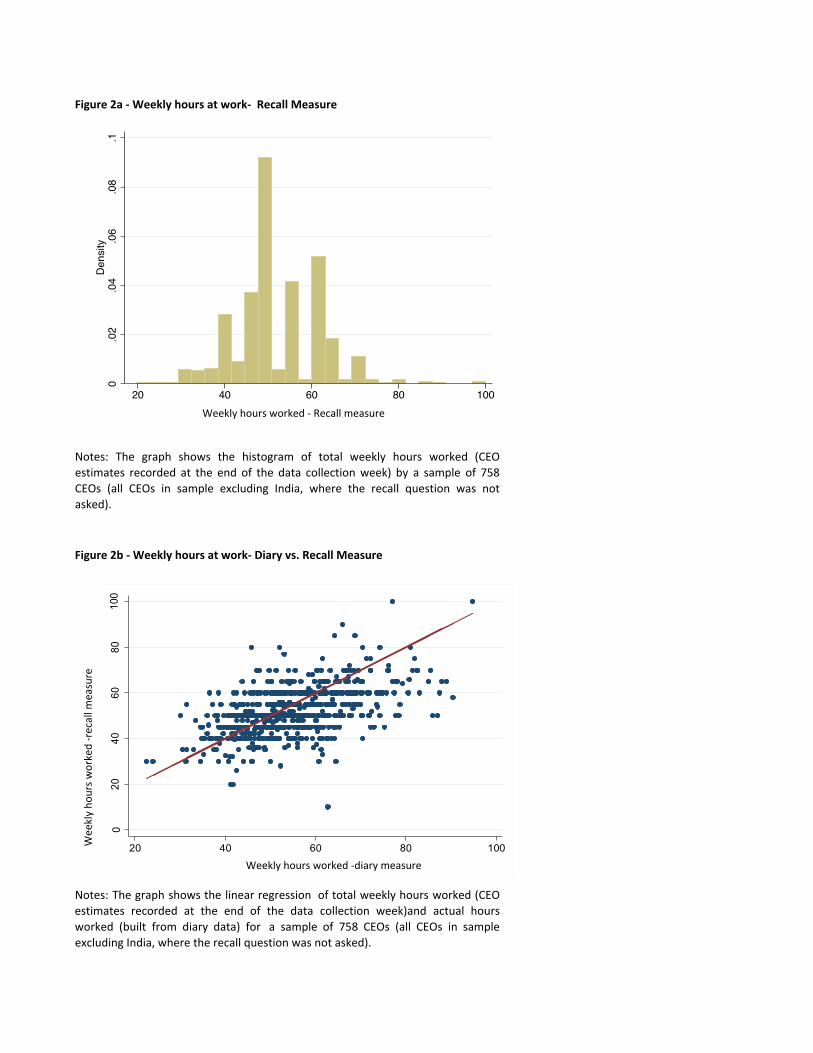
Figure'2a'*'Weekly'hours'at'work*''Recall'Measure
Figure'2b'*'Weekly'hours'at'work*'Diary'vs.'Recall'Measure
Notes: The graph shows the histogram of total weekly hours worked (CEOestimates recorded at the end of the data collection week) by a sample of 758CEOs (all CEOs in sample excluding India, where the recall question was notasked).
Notes: The graph shows the linear regression of total weekly hours worked (CEOestimates recorded at the end of the data collection week)and actual hoursworked (built from diary data) for a sample of 758 CEOs (all CEOs in sampleexcludingFIndia,FwhereFtheFrecallFquestionFwasFnotFasked).
weeklyFhoursFworkedFGdiaryFmeasureF
WeeklyFho
ursFw
orkedFGrecallFm
easureF
0.02
.04
.06
.08
.1Density
20 40 60 80 100per_tot_hours_work_wtravel
020
4060
8010
0
20 40 60 80 100(mean) tot_hours
WeeklyFhoursFworkedFGFRecallFmeasureF
WeeklyFhoursFworkedFGdiaryFmeasureF
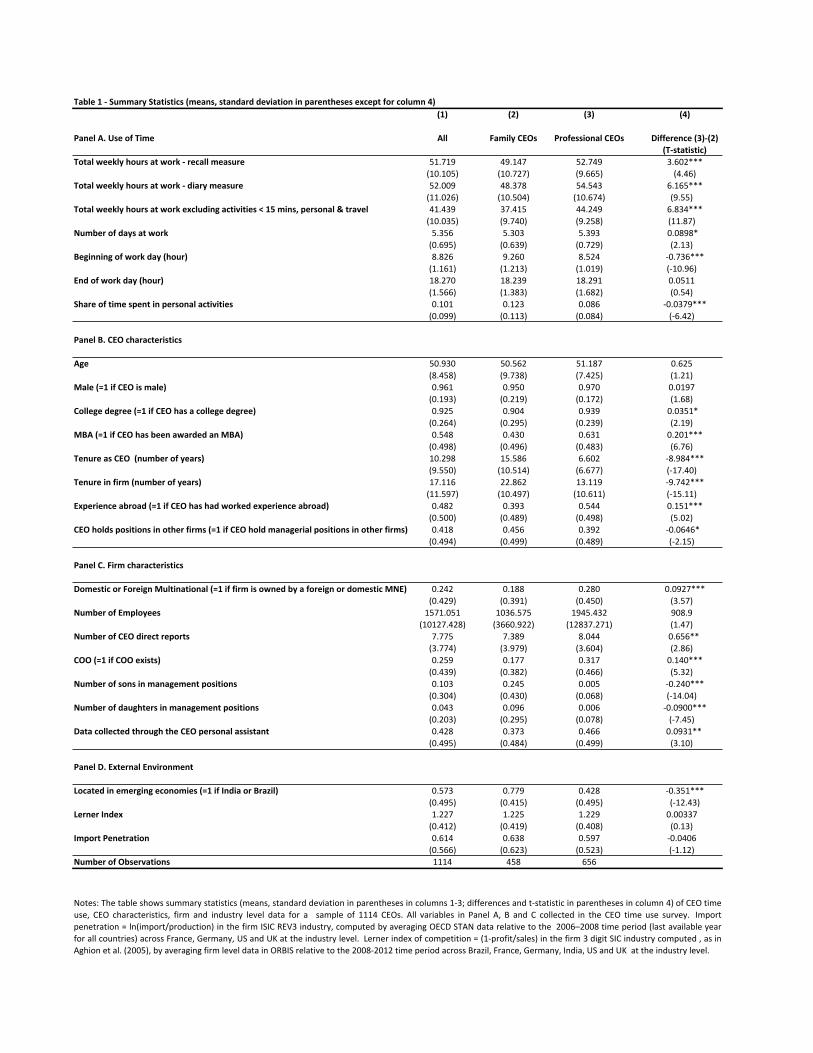
Table&1&(&Summary&Statistics&(means,&standard&deviation&in&parentheses&except&for&column&4)(1) (2) (3) (4)
Panel&A.&Use&of&Time All Family&CEOs Professional&CEOs Difference&(3)((2)(T(statistic)
Total&weekly&hours&at&work&(&recall&measure 51.719 49.147 52.749 3.602***(10.105) (10.727) (9.665) (4.46)
Total&weekly&hours&at&work&(&diary&measure 52.009 48.378 54.543 6.165***(11.026) (10.504) (10.674) (9.55)///
Total&weekly&hours&at&work&excluding&activities&<&15&mins,&personal&&&travel 41.439 37.415 44.249 6.834***(10.035) (9.740) (9.258) (11.87)///
Number&of&days&at&work 5.356 5.303 5.393 0.0898*//(0.695) (0.639) (0.729) (2.13)///
Beginning&of&work&day&(hour) 8.826 9.260 8.524 00.736***(1.161) (1.213) (1.019) (010.96)///
End&of&work&day&(hour) 18.270 18.239 18.291 0.0511///(1.566) (1.383) (1.682) (0.54)///
Share&of&time&spent&in&personal&activities 0.101 0.123 0.086 00.0379***(0.099) (0.113) (0.084) (06.42)///
Panel&B.&CEO&characteristics
Age 50.930 50.562 51.187 0.625///(8.458) (9.738) (7.425) (1.21)///
Male&(=1&if&CEO&is&male) 0.961 0.950 0.970 0.0197///(0.193) (0.219) (0.172) (1.68)///
College°ree&(=1&if&CEO&has&a&college°ree) 0.925 0.904 0.939 0.0351*//(0.264) (0.295) (0.239) (2.19)///
MBA&(=1&if&CEO&has&been&awarded&an&MBA) 0.548 0.430 0.631 0.201***(0.498) (0.496) (0.483) (6.76)///
Tenure&as&CEO&&(number&of&years) 10.298 15.586 6.602 08.984***(9.550) (10.514) (6.677) (017.40)///
Tenure&in&firm&(number&of&years) 17.116 22.862 13.119 09.742***(11.597) (10.497) (10.611) (015.11)///
Experience&abroad&(=1&if&CEO&has&had&worked&experience&abroad) 0.482 0.393 0.544 0.151***(0.500) (0.489) (0.498) (5.02)///
CEO&holds&positions&in&other&firms&(=1&if&CEO&hold&managerial&positions&in&other&firms) 0.418 0.456 0.392 00.0646*//(0.494) (0.499) (0.489) (02.15)///
Panel&C.&Firm&characteristics
Domestic&or&Foreign&Multinational&(=1&if&firm&is&owned&by&a&foreign&or&domestic&MNE) 0.242 0.188 0.280 0.0927***(0.429) (0.391) (0.450) (3.57)///
Number&of&Employees 1571.051 1036.575 1945.432 908.9///(10127.428) (3660.922) (12837.271) (1.47)///
Number&of&CEO&direct&reports 7.775 7.389 8.044 0.656**/(3.774) (3.979) (3.604) (2.86)///
COO&(=1&if&COO&exists) 0.259 0.177 0.317 0.140***(0.439) (0.382) (0.466) (5.32)///
Number&of&sons&in&management&positions 0.103 0.245 0.005 00.240***(0.304) (0.430) (0.068) (014.04)///
Number&of&daughters&in&management&positions 0.043 0.096 0.006 00.0900***(0.203) (0.295) (0.078) (07.45)///
Data&collected&through&the&CEO&personal&assistant 0.428 0.373 0.466 0.0931**/(0.495) (0.484) (0.499) (3.10)///
Panel&D.&External&Environment
Located&in&emerging&economies&(=1&if&India&or&Brazil) 0.573 0.779 0.428 00.351***(0.495) (0.415) (0.495) (012.43)
Lerner&Index 1.227 1.225 1.229 0.00337///(0.412) (0.419) (0.408) (0.13)///
Import&Penetration 0.614 0.638 0.597 00.0406///(0.566) (0.623) (0.523) (01.12)///
Number&of&Observations 1114 458 656
Notes: The table shows summary statistics (means, standard deviation in parentheses in columns 103; differences and t0statistic in parentheses in column 4) of CEO timeuse, CEO characteristics, firm and industry level data for a sample of 1114 CEOs. All variables in Panel A, B and C collected in the CEO time use survey. Importpenetration = ln(import/production) in the firm ISIC REV3 industry, computed by averaging OECD STAN data relative to the 2006–2008 time period (last available yearfor all countries) across France, Germany, US and UK at the industry level. Lerner index of competition = (10profit/sales) in the firm 3 digit SIC industry computed , as inAghion/et/al./(2005),/by/averaging/firm/level/data/in/ORBIS/relative/to/the/200802012/time/period/across/Brazil,/France,/Germany,/India,/US/and/UK//at/the/industry/level.
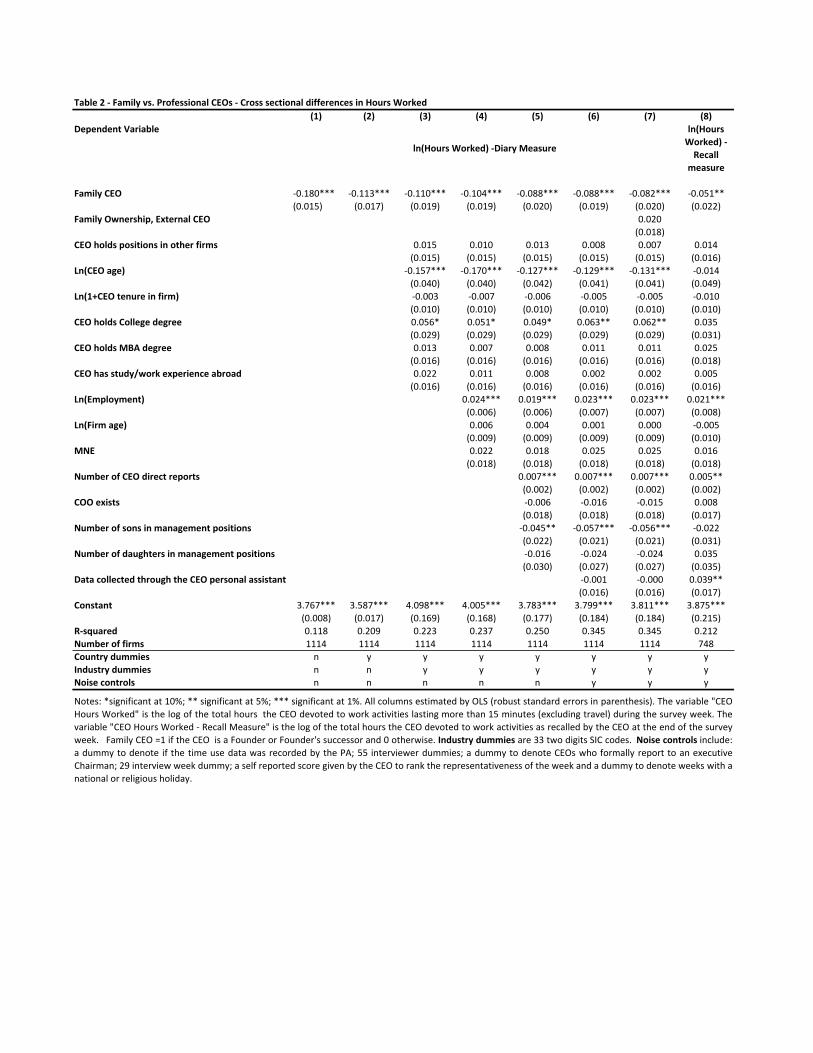
Table&2&(&Family&vs.&Professional&CEOs&(&Cross§ional&differences&in&Hours&Worked(1) (2) (3) (4) (5) (6) (7) (8)
Dependent&Variable ln(Hours&Worked)&(&Recall&
measure
Family&CEO !0.180*** !0.113*** !0.110*** !0.104*** !0.088*** !0.088*** !0.082*** !0.051**(0.015) (0.017) (0.019) (0.019) (0.020) (0.019) (0.020) (0.022)
Family&Ownership,&External&CEO 0.020(0.018)
CEO&holds&positions&in&other&firms 0.015 0.010 0.013 0.008 0.007 0.014(0.015) (0.015) (0.015) (0.015) (0.015) (0.016)
Ln(CEO&age) !0.157*** !0.170*** !0.127*** !0.129*** !0.131*** !0.014(0.040) (0.040) (0.042) (0.041) (0.041) (0.049)
Ln(1+CEO&tenure&in&firm) !0.003 !0.007 !0.006 !0.005 !0.005 !0.010(0.010) (0.010) (0.010) (0.010) (0.010) (0.010)
CEO&holds&College°ree 0.056* 0.051* 0.049* 0.063** 0.062** 0.035(0.029) (0.029) (0.029) (0.029) (0.029) (0.031)
CEO&holds&MBA°ree 0.013 0.007 0.008 0.011 0.011 0.025(0.016) (0.016) (0.016) (0.016) (0.016) (0.018)
CEO&has&study/work&experience&abroad 0.022 0.011 0.008 0.002 0.002 0.005(0.016) (0.016) (0.016) (0.016) (0.016) (0.016)
Ln(Employment) 0.024*** 0.019*** 0.023*** 0.023*** 0.021***(0.006) (0.006) (0.007) (0.007) (0.008)
Ln(Firm&age) 0.006 0.004 0.001 0.000 !0.005(0.009) (0.009) (0.009) (0.009) (0.010)
MNE 0.022 0.018 0.025 0.025 0.016(0.018) (0.018) (0.018) (0.018) (0.018)
Number&of&CEO&direct&reports 0.007*** 0.007*** 0.007*** 0.005**(0.002) (0.002) (0.002) (0.002)
COO&exists !0.006 !0.016 !0.015 0.008(0.018) (0.018) (0.018) (0.017)
Number&of&sons&in&management&positions !0.045** !0.057*** !0.056*** !0.022(0.022) (0.021) (0.021) (0.031)
Number&of&daughters&in&management&positions !0.016 !0.024 !0.024 0.035(0.030) (0.027) (0.027) (0.035)
Data&collected&through&the&CEO&personal&assistant !0.001 !0.000 0.039**(0.016) (0.016) (0.017)
Constant 3.767*** 3.587*** 4.098*** 4.005*** 3.783*** 3.799*** 3.811*** 3.875***(0.008) (0.017) (0.169) (0.168) (0.177) (0.184) (0.184) (0.215)
R(squared 0.118 0.209 0.223 0.237 0.250 0.345 0.345 0.212Number&of&firms 1114 1114 1114 1114 1114 1114 1114 748Country&dummies n y y y y y y yIndustry&dummies n n y y y y y yNoise&controls n n n n n y y y
Notes: *significant at 10%; ** significant at 5%; *** significant at 1%. All columns estimated by OLS (robust standard errors in parenthesis). The variable "CEOHours Worked" is the log of the total hours the CEO devoted to work activities lasting more than 15 minutes (excluding travel) during the survey week. Thevariable "CEO Hours Worked ! Recall Measure" is the log of the total hours the CEO devoted to work activities as recalled by the CEO at the end of the surveyweek. Family CEO =1 if the CEO is a Founder or Founder's successor and 0 otherwise. Industry dummies are 33 two digits SIC codes. Noise controls[include:[a dummy to denote if the time use data was recorded by the PA; 55 interviewer dummies; a dummy to denote CEOs who formally report to an executiveChairman; 29 interview week dummy; a self reported score given by the CEO to rank the representativeness of the week and a dummy to denote weeks with anational[or[religious[holiday.
ln(Hours&Worked)&(Diary&Measure
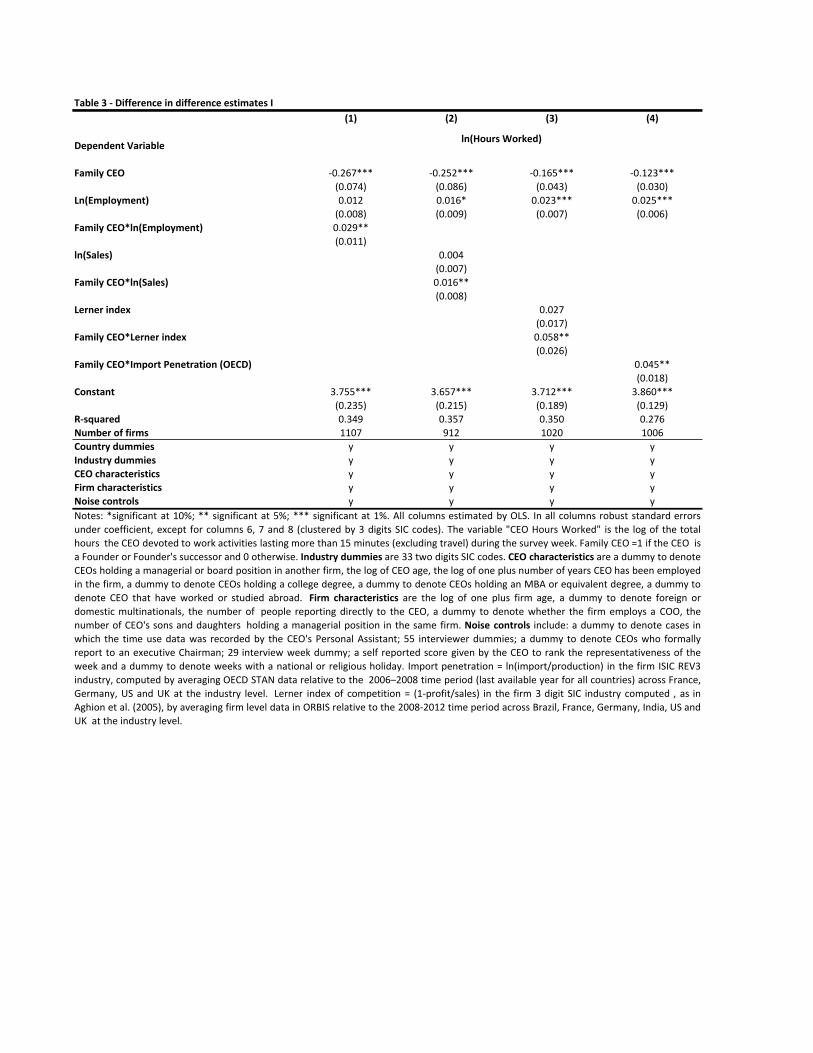
Table&3&(&Difference&in&difference&estimates&I(1) (2) (3) (4)
Dependent&Variable
Family&CEO !0.267*** !0.252*** !0.165*** !0.123***(0.074) (0.086) (0.043) (0.030)
Ln(Employment) 0.012 0.016* 0.023*** 0.025***(0.008) (0.009) (0.007) (0.006)
Family&CEO*ln(Employment) 0.029**(0.011)
ln(Sales) 0.004(0.007)
Family&CEO*ln(Sales) 0.016**(0.008)
Lerner&index 0.027(0.017)
Family&CEO*Lerner&index 0.058**(0.026)
Family&CEO*Import&Penetration&(OECD) 0.045**(0.018)
Constant 3.755*** 3.657*** 3.712*** 3.860***(0.235) (0.215) (0.189) (0.129)
R(squared 0.349 0.357 0.350 0.276Number&of&firms 1107 912 1020 1006Country&dummies y y y yIndustry&dummies y y y yCEO&characteristics y y y yFirm&characteristics& y y y yNoise&controls y y y y
ln(Hours&Worked)
Notes: *significant at 10%; ** significant at 5%; *** significant at 1%. All columns estimated by OLS. In all columns robust standard errorsunder coefficient, except for columns 6, 7 and 8 (clustered by 3 digits SIC codes). The variable "CEO Hours Worked" is the log of the totalhours the CEO devoted to work activities lasting more than 15 minutes (excluding travel) during the survey week. Family CEO =1 if the CEO isa Founder or Founder's successor and 0 otherwise. Industry dummies are 33 two digits SIC codes. CEO characteristics are a dummy to denoteCEOs holding a managerial or board position in another firm, the log of CEO age, the log of one plus number of years CEO has been employedin the firm, a dummy to denote CEOs holding a college degree, a dummy to denote CEOs holding an MBA or equivalent degree, a dummy todenote CEO that have worked or studied abroad. Firm characteristics are the log of one plus firm age, a dummy to denote foreign ordomestic multinationals, the number of people reporting directly to the CEO, a dummy to denote whether the firm employs a COO, thenumber of CEO's sons and daughters holding a managerial position in the same firm. Noise controls include: a dummy to denote cases inwhich the time use data was recorded by the CEO's Personal Assistant; 55 interviewer dummies; a dummy to denote CEOs who formallyreport to an executive Chairman; 29 interview week dummy; a self reported score given by the CEO to rank the representativeness of theweek and a dummy to denote weeks with a national or religious holiday. Import penetration = ln(import/production) in the firm ISIC REV3industry, computed by averaging OECD STAN data relative to the 2006–2008 time period (last available year for all countries) across France,Germany, US and UK at the industry level. Lerner index of competition = (1!profit/sales) in the firm 3 digit SIC industry computed , as inAghion et al. (2005), by averaging firm level data in ORBIS relative to the 2008!2012 time period across Brazil, France, Germany, India, US andUKggatgthegindustryglevel.
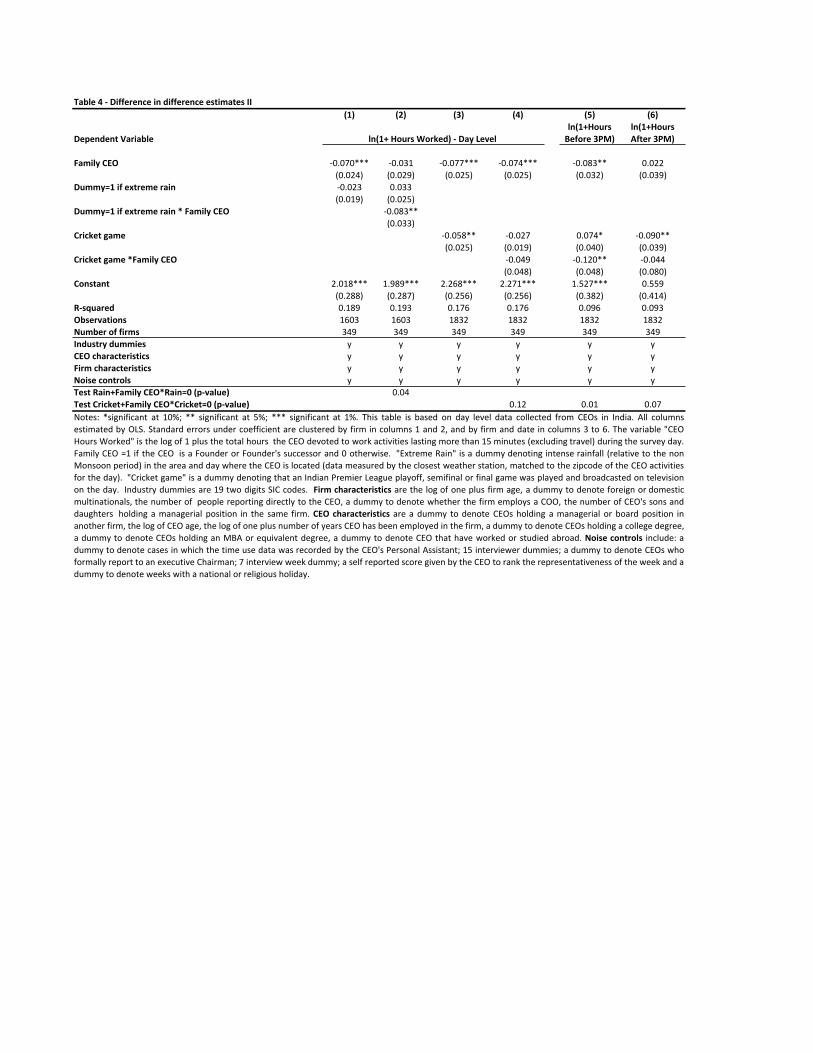
Table&4&(&Difference&in&difference&estimates&II(1) (2) (3) (4) (5) (6)
Dependent&Variableln(1+Hours&Before&3PM)
ln(1+Hours&After&3PM)
Family&CEO !0.070*** !0.031 !0.077*** !0.074*** !0.083** 0.022
(0.024) (0.029) (0.025) (0.025) (0.032) (0.039)
Dummy=1&if&extreme&rain !0.023 0.033
(0.019) (0.025)
Dummy=1&if&extreme&rain&*&Family&CEO !0.083**
(0.033)
Cricket&game !0.058** !0.027 0.074* !0.090**
(0.025) (0.019) (0.040) (0.039)
Cricket&game&*Family&CEO !0.049 !0.120** !0.044
(0.048) (0.048) (0.080)
Constant 2.018*** 1.989*** 2.268*** 2.271*** 1.527*** 0.559
(0.288) (0.287) (0.256) (0.256) (0.382) (0.414)
R(squared 0.189 0.193 0.176 0.176 0.096 0.093
Observations 1603 1603 1832 1832 1832 1832
Number&of&firms 349 349 349 349 349 349
Industry&dummies y y y y y y
CEO&characteristics y y y y y y
Firm&characteristics y y y y y y
Noise&controls y y y y y y
Test&Rain+Family&CEO*Rain=0&(p(value) 0.04
Test&Cricket+Family&CEO*Cricket=0&(p(value) 0.12 0.01 0.07
&
Notes: *significant at 10%; ** significant at 5%; *** significant at 1%. This table is based on day level data collected from CEOs in India. All columns
estimated by OLS. Standard errors under coefficient are clustered by firm in columns 1 and 2, and by firm and date in columns 3 to 6. The variable "CEO
Hours Worked" is the log of 1 plus the total hours the CEO devoted to work activities lasting more than 15 minutes (excluding travel) during the survey day.
Family CEO =1 if the CEO is a Founder or Founder's successor and 0 otherwise. "Extreme Rain" is a dummy denoting intense rainfall (relative to the non
Monsoon period) in the area and day where the CEO is located (data measured by the closest weather station, matched to the zipcode of the CEO activities
for the day). "Cricket game" is a dummy denoting that an Indian Premier League playoff, semifinal or final game was played and broadcasted on television
on the day. Industry dummies are 19 two digits SIC codes. Firm characteristics are the log of one plus firm age, a dummy to denote foreign or domestic
multinationals, the number of people reporting directly to the CEO, a dummy to denote whether the firm employs a COO, the number of CEO's sons and
daughters holding a managerial position in the same firm. CEO characteristics are a dummy to denote CEOs holding a managerial or board position in
another^firm,^the^log^of^CEO^age,^the^log^of^one^plus^number^of^years^CEO^has^been^employed^in^the^firm,^a^dummy^to^denote^CEOs^holding^a^college^degree,^
a dummy to denote CEOs holding an MBA or equivalent degree, a dummy to denote CEO that have worked or studied abroad. Noise controls include: adummy to denote cases in which the time use data was recorded by the CEO's Personal Assistant; 15 interviewer dummies; a dummy to denote CEOs who
formally report to an executive Chairman; 7 interview week dummy; a self reported score given by the CEO to rank the representativeness of the week and a
dummy^to^denote^weeks^with^a^national^or^religious^holiday.
ln(1+&Hours&Worked)&(&Day&Level&
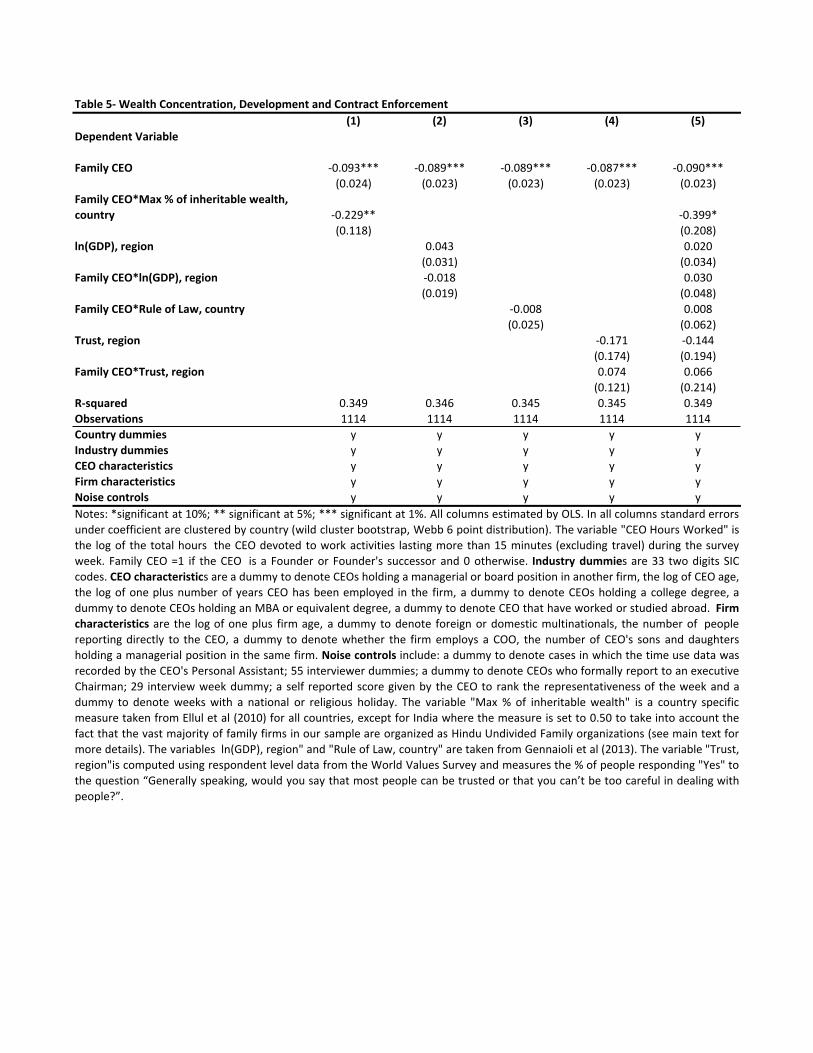
Table&5(&Wealth&Concentration,&Development&and&Contract&Enforcement
(1) (2) (3) (4) (5)
Dependent&Variable
Family&CEO !0.093*** !0.089*** !0.089*** !0.087*** !0.090***(0.024) (0.023) (0.023) (0.023) (0.023)
Family&CEO*Max&%&of&inheritable&wealth,&
country !0.229** !0.399*(0.118) (0.208)
ln(GDP),®ion& 0.043 0.020(0.031) (0.034)
Family&CEO*ln(GDP),®ion& !0.018 0.030(0.019) (0.048)
Family&CEO*Rule&of&Law,&country !0.008 0.008(0.025) (0.062)
Trust,®ion !0.171 !0.144(0.174) (0.194)
Family&CEO*Trust,®ion& 0.074 0.066(0.121) (0.214)
R(squared 0.349 0.346 0.345 0.345 0.349Observations 1114 1114 1114 1114 1114Country&dummies y y y y yIndustry&dummies y y y y yCEO&characteristics y y y y yFirm&characteristics& y y y y yNoise&controls y y y y yNotes: *significant at 10%; ** significant at 5%; *** significant at 1%. All columns estimated by OLS. In all columns standard errorsunder coefficient are clustered by country (wild cluster bootstrap, Webb 6 point distribution). The variable "CEO Hours Worked" isthe log of the total hours the CEO devoted to work activities lasting more than 15 minutes (excluding travel) during the surveyweek. Family CEO =1 if the CEO is a Founder or Founder's successor and 0 otherwise. Industry dummies are 33 two digits SICcodes. CEO characteristics are a dummy to denote CEOs holding a managerial or board position in another firm, the log of CEO age,the log of one plus number of years CEO has been employed in the firm, a dummy to denote CEOs holding a college degree, adummy to denote CEOs holding an MBA or equivalent degree, a dummy to denote CEO that have worked or studied abroad. Firm&
characteristics are the log of one plus firm age, a dummy to denote foreign or domestic multinationals, the number of peoplereporting directly to the CEO, a dummy to denote whether the firm employs a COO, the number of CEO's sons and daughtersholding a managerial position in the same firm. Noise controls include: a dummy to denote cases in which the time use data wasrecorded by the CEO's Personal Assistant; 55 interviewer dummies; a dummy to denote CEOs who formally report to an executiveChairman; 29 interview week dummy; a self reported score given by the CEO to rank the representativeness of the week and adummy to denote weeks with a national or religious holiday. The variable "Max % of inheritable wealth" is a country specificmeasure taken from Ellul et al (2010) for all countries, except for India where the measure is set to 0.50 to take into account thefact that the vast majority of family firms in our sample are organized as Hindu Undivided Family organizations (see main text formore details). The variables ln(GDP), region" and "Rule of Law, country" are taken from Gennaioli et al (2013). The variable "Trust,region"is computed using respondent level data from the World Values Survey and measures the % of people responding "Yes" tothe question “Generally speaking, would you say that most people can be trusted or that you can’t be too careful in dealing withpeople?”.
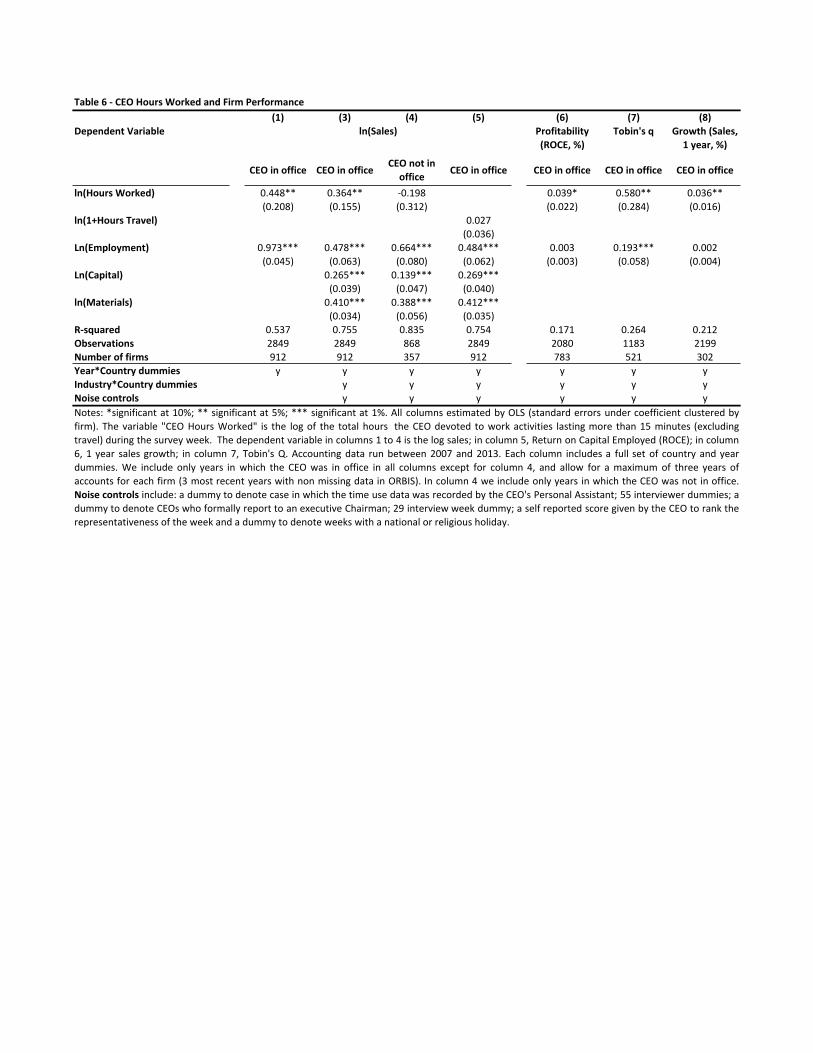
Table&6&(&CEO&Hours&Worked&and&Firm&Performance(1) (3) (4) (5) (6) (7) (8)
Dependent&Variable Profitability&(ROCE,&%)
Tobin's&q Growth&(Sales,&1&year,&%)
CEO&in&office CEO&in&officeCEO¬&in&
office CEO&in&office CEO&in&office CEO&in&office CEO&in&office
ln(Hours&Worked) 0.448** 0.364** (0.198 0.039* 0.580** 0.036**(0.208) (0.155) (0.312) (0.022) (0.284) (0.016)
ln(1+Hours&Travel) 0.027(0.036)
Ln(Employment) 0.973*** 0.478*** 0.664*** 0.484*** 0.003 0.193*** 0.002(0.045) (0.063) (0.080) (0.062) (0.003) (0.058) (0.004)
Ln(Capital) 0.265*** 0.139*** 0.269***(0.039) (0.047) (0.040)
ln(Materials) 0.410*** 0.388*** 0.412***(0.034) (0.056) (0.035)
R(squared 0.537 0.755 0.835 0.754 0.171 0.264 0.212Observations 2849 2849 868 2849 2080 1183 2199Number&of&firms 912 912 357 912 783 521 302Year*Country&dummies y y y y y y yIndustry*Country&dummies y y y y y yNoise&controls y y y y y y
ln(Sales)
Notes: *significant at 10%; ** significant at 5%; *** significant at 1%. All columns estimated by OLS (standard errors under coefficient clustered byfirm). The variable "CEO Hours Worked" is the log of the total hours the CEO devoted to work activities lasting more than 15 minutes (excludingtravel) during the survey week. The dependent variable in columns 1 to 4 is the log sales; in column 5, Return on Capital Employed (ROCE); in column6, 1 year sales growth; in column 7, Tobin's Q. Accounting data run between 2007 and 2013. Each column includes a full set of country and yeardummies. We include only years in which the CEO was in office in all columns except for column 4, and allow for a maximum of three years ofaccounts for each firm (3 most recent years with non missing data in ORBIS). In column 4 we include only years in which the CEO was not in office.Noise controls include: a dummy to denote case in which the time use data was recorded by the CEO's Personal Assistant; 55 interviewer dummies; adummy to denote CEOs who formally report to an executive Chairman; 29 interview week dummy; a self reported score given by the CEO to rank therepresentativeness\of\the\week\and\a\dummy\to\denote\weeks\with\a\national\or\religious\holiday.
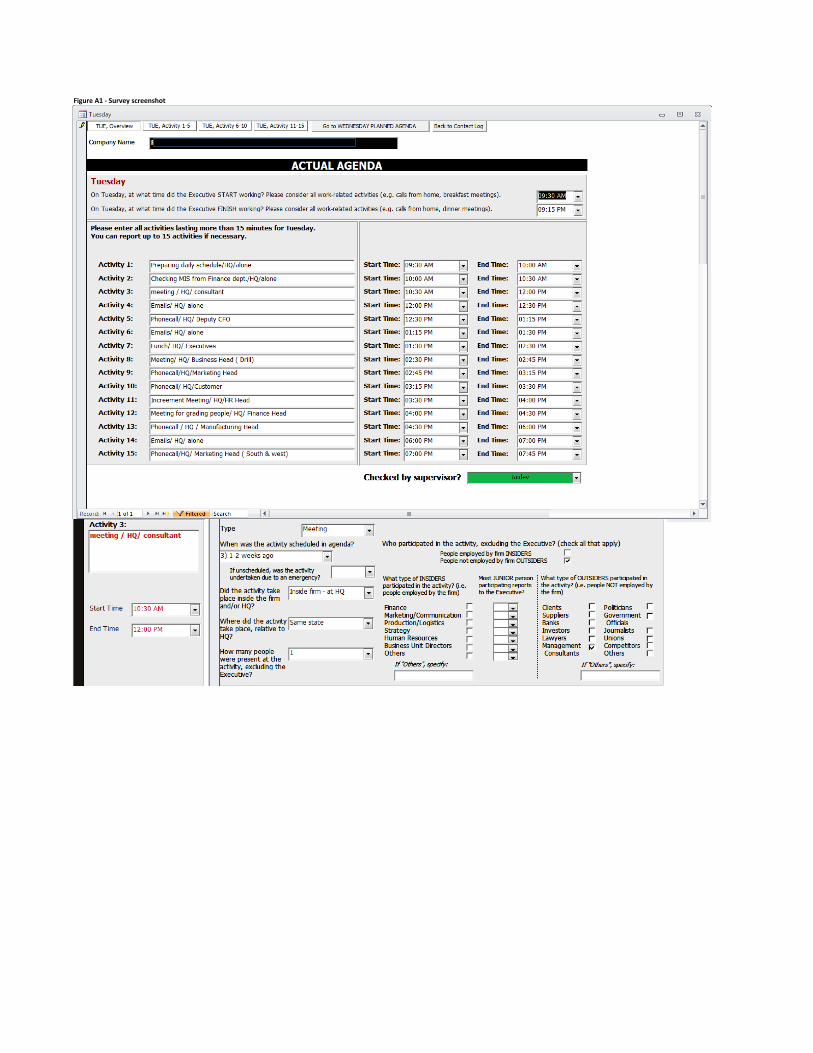
Figure'A1'*'Survey'screenshot
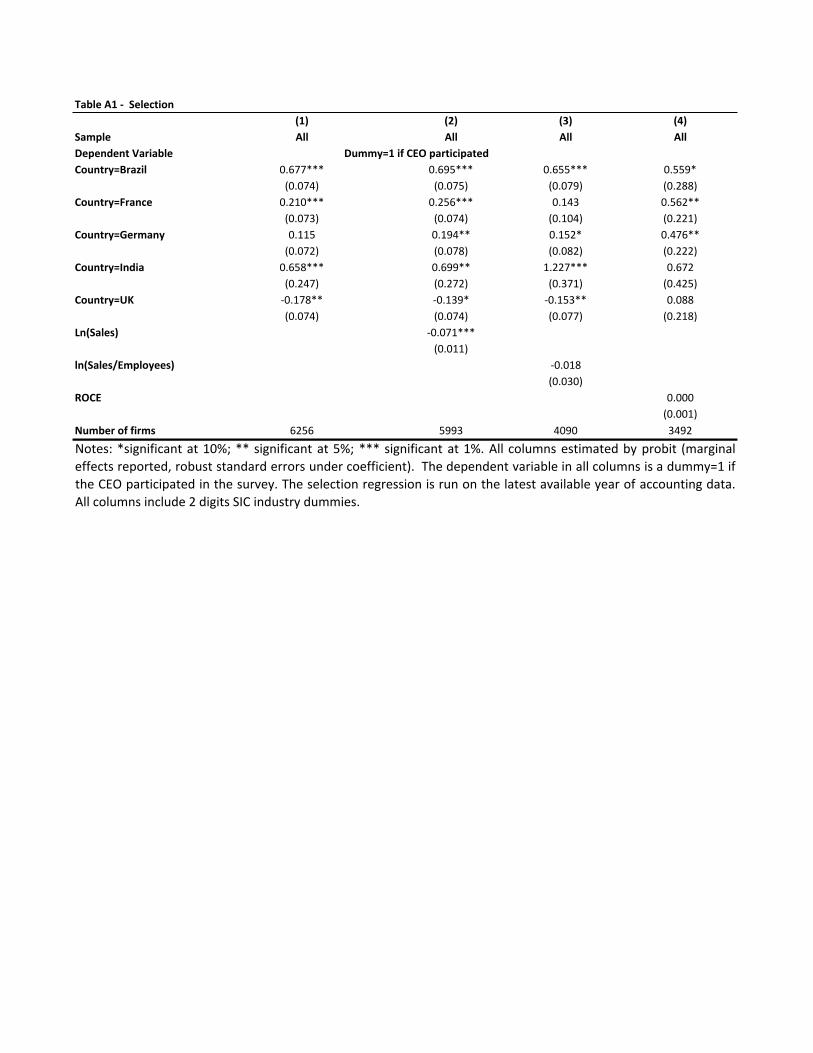
Table&A1&)&&Selection(1) (2) (3) (4)
Sample All All All AllDependent&VariableCountry=Brazil 0.677*** 0.695*** 0.655*** 0.559*
(0.074) (0.075) (0.079) (0.288)
Country=France 0.210*** 0.256*** 0.143 0.562**
(0.073) (0.074) (0.104) (0.221)
Country=Germany 0.115 0.194** 0.152* 0.476**
(0.072) (0.078) (0.082) (0.222)
Country=India 0.658*** 0.699** 1.227*** 0.672
(0.247) (0.272) (0.371) (0.425)
Country=UK /0.178** /0.139* /0.153** 0.088
(0.074) (0.074) (0.077) (0.218)
Ln(Sales) /0.071***
(0.011)
ln(Sales/Employees) /0.018
(0.030)
ROCE 0.000
(0.001)
Number&of&firms 6256 5993 4090 3492
Dummy=1&if&CEO&participated
Notes: *significant at 10%; ** significant at 5%; *** significant at 1%. All columns estimated by probit (marginal
effects reported, robust standard errors under coefficient). The dependent variable in all columns is a dummy=1 if
the CEO participated in the survey. The selection regression is run on the latest available year of accounting data.
AllOcolumnsOincludeO2OdigitsOSICOindustryOdummies.
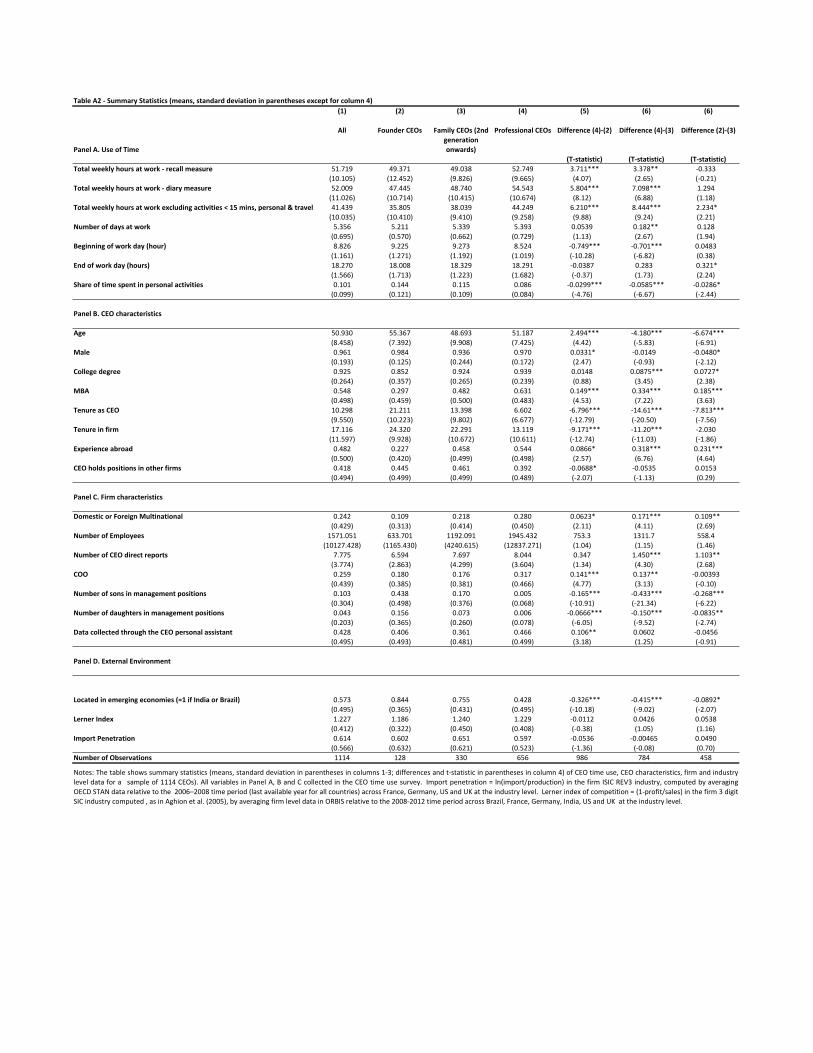
Table&A2&)&Summary&Statistics&(means,&standard&deviation&in&parentheses&except&for&column&4)(1) (2) (3) (4) (5) (6) (6)
Panel&A.&Use&of&Time
All Founder&CEOs Family&CEOs&(2nd&generation&onwards)
Professional&CEOs Difference&(4))(2) Difference&(4))(3) Difference&(2))(3)
(T)statistic) (T)statistic) (T)statistic)Total&weekly&hours&at&work&)&recall&measure 51.719 49.371 49.038 52.749 3.711*** 3.378**, -0.333,,,
(10.105) (12.452) (9.826) (9.665) (4.07),,, (2.65),,, (-0.21),,,Total&weekly&hours&at&work&)&diary&measure 52.009 47.445 48.740 54.543 5.804*** 7.098*** 1.294,,,
(11.026) (10.714) (10.415) (10.674) (8.12),,, (6.88),,, (1.18),,,Total&weekly&hours&at&work&excluding&activities&<&15&mins,&personal&&&travel 41.439 35.805 38.039 44.249 6.210*** 8.444*** 2.234*,,
(10.035) (10.410) (9.410) (9.258) (9.88),,, (9.24),,, (2.21),,,Number&of&days&at&work 5.356 5.211 5.339 5.393 0.0539,,, 0.182**, 0.128,,,
(0.695) (0.570) (0.662) (0.729) (1.13),,, (2.67),,, (1.94),,,Beginning&of&work&day&(hour) 8.826 9.225 9.273 8.524 -0.749*** -0.701*** 0.0483,,,
(1.161) (1.271) (1.192) (1.019) (-10.28),,, (-6.82),,, (0.38),,,End&of&work&day&(hours) 18.270 18.008 18.329 18.291 -0.0387,,, 0.283,,, 0.321*,,
(1.566) (1.713) (1.223) (1.682) (-0.37),,, (1.73),,, (2.24),,,Share&of&time&spent&in&personal&activities 0.101 0.144 0.115 0.086 -0.0299*** -0.0585*** -0.0286*,,
(0.099) (0.121) (0.109) (0.084) (-4.76),,, (-6.67),,, (-2.44),,,
Panel&B.&CEO&characteristics
Age 50.930 55.367 48.693 51.187 2.494*** -4.180*** -6.674***(8.458) (7.392) (9.908) (7.425) (4.42),,, (-5.83),,, (-6.91),,,
Male 0.961 0.984 0.936 0.970 0.0331*,, -0.0149,,, -0.0480*,,(0.193) (0.125) (0.244) (0.172) (2.47),,, (-0.93),,, (-2.12),,,
College°ree 0.925 0.852 0.924 0.939 0.0148,,, 0.0875*** 0.0727*,,(0.264) (0.357) (0.265) (0.239) (0.88),,, (3.45),,, (2.38),,,
MBA 0.548 0.297 0.482 0.631 0.149*** 0.334*** 0.185***(0.498) (0.459) (0.500) (0.483) (4.53),,, (7.22),,, (3.63),,,
Tenure&as&CEO& 10.298 21.211 13.398 6.602 -6.796*** -14.61*** -7.813***(9.550) (10.223) (9.802) (6.677) (-12.79),,, (-20.50),,, (-7.56),,,
Tenure&in&firm 17.116 24.320 22.291 13.119 -9.171*** -11.20*** -2.030,,,(11.597) (9.928) (10.672) (10.611) (-12.74),,, (-11.03),,, (-1.86),,,
Experience&abroad 0.482 0.227 0.458 0.544 0.0866*,, 0.318*** 0.231***(0.500) (0.420) (0.499) (0.498) (2.57),,, (6.76),,, (4.64),,,
CEO&holds&positions&in&other&firms 0.418 0.445 0.461 0.392 -0.0688*,, -0.0535,,, 0.0153,,,(0.494) (0.499) (0.499) (0.489) (-2.07),,, (-1.13),,, (0.29),,,
Panel&C.&Firm&characteristics
Domestic&or&Foreign&Multinational 0.242 0.109 0.218 0.280 0.0623*,, 0.171*** 0.109**,(0.429) (0.313) (0.414) (0.450) (2.11),,, (4.11),,, (2.69),,,
Number&of&Employees 1571.051 633.701 1192.091 1945.432 753.3,,, 1311.7,,, 558.4,,,(10127.428) (1165.430) (4240.615) (12837.271) (1.04),,, (1.15),,, (1.46),,,
Number&of&CEO&direct&reports 7.775 6.594 7.697 8.044 0.347,,, 1.450*** 1.103**,(3.774) (2.863) (4.299) (3.604) (1.34),,, (4.30),,, (2.68),,,
COO 0.259 0.180 0.176 0.317 0.141*** 0.137**, -0.00393,,,(0.439) (0.385) (0.381) (0.466) (4.77),,, (3.13),,, (-0.10),,,
Number&of&sons&in&management&positions 0.103 0.438 0.170 0.005 -0.165*** -0.433*** -0.268***(0.304) (0.498) (0.376) (0.068) (-10.91),,, (-21.34),,, (-6.22),,,
Number&of&daughters&in&management&positions 0.043 0.156 0.073 0.006 -0.0666*** -0.150*** -0.0835**,(0.203) (0.365) (0.260) (0.078) (-6.05),,, (-9.52),,, (-2.74),,,
Data&collected&through&the&CEO&personal&assistant 0.428 0.406 0.361 0.466 0.106**, 0.0602,,, -0.0456,,,(0.495) (0.493) (0.481) (0.499) (3.18),,, (1.25),,, (-0.91),,,
Panel&D.&External&Environment
Located&in&emerging&economies&(=1&if&India&or&Brazil) 0.573 0.844 0.755 0.428 -0.326*** -0.415*** -0.0892*,,(0.495) (0.365) (0.431) (0.495) (-10.18),,, (-9.02),,, (-2.07),,,
Lerner&Index 1.227 1.186 1.240 1.229 -0.0112,,, 0.0426,,, 0.0538,,,(0.412) (0.322) (0.450) (0.408) (-0.38),,, (1.05),,, (1.16),,,
Import&Penetration 0.614 0.602 0.651 0.597 -0.0536,,, -0.00465,,, 0.0490,,,(0.566) (0.632) (0.621) (0.523) (-1.36),,, (-0.08),,, (0.70),,,
Number&of&Observations 1114 128 330 656 986,,, 784,,, 458,,,
Notes: The table shows summary statistics (means, standard deviation in parentheses in columns 1-3; differences and t-statistic in parentheses in column 4) of CEO time use, CEO characteristics, firm and industrylevel data for a sample of 1114 CEOs). All variables in Panel A, B and C collected in the CEO time use survey. Import penetration = ln(import/production) in the firm ISIC REV3 industry, computed by averagingOECD STAN data relative to the 2006–2008 time period (last available year for all countries) across France, Germany, US and UK at the industry level. Lerner index of competition = (1-profit/sales) in the firm 3 digitSIC,industry,computed,,,as,in,Aghion,et,al.,(2005),,by,averaging,firm,level,data,in,ORBIS,relative,to,the,2008-2012,time,period,across,Brazil,,France,,Germany,,India,,US,and,UK,,at,the,industry,level.
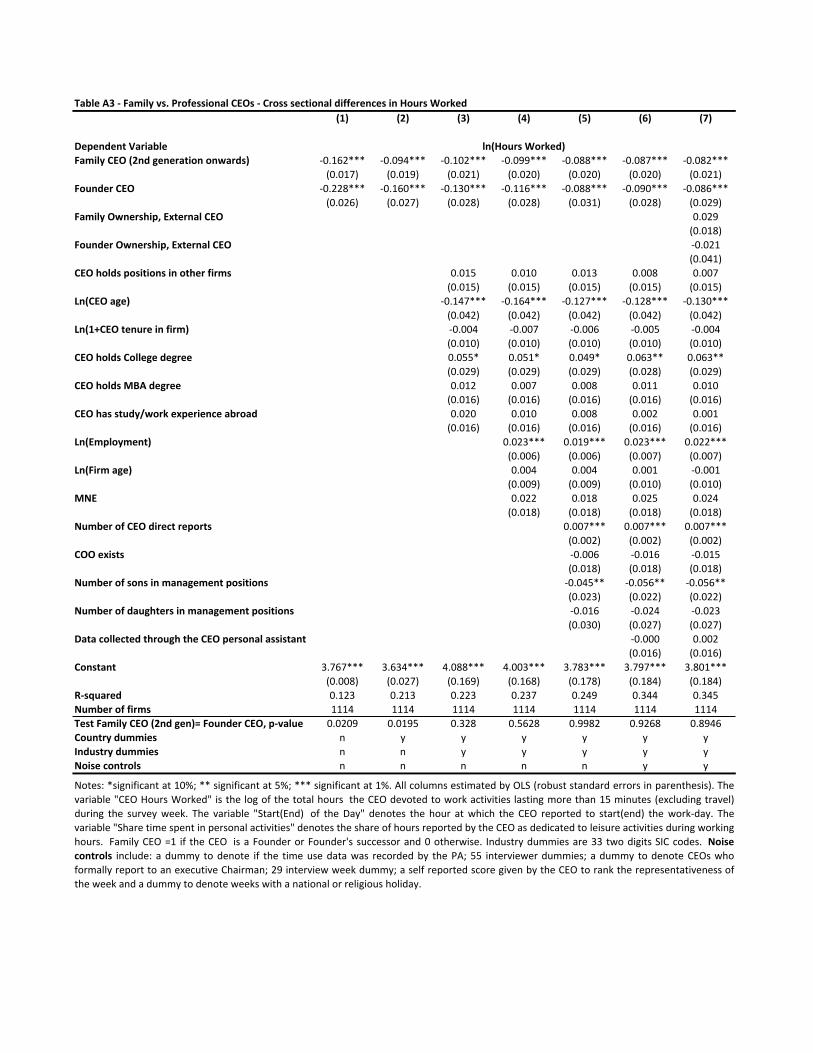
Table&A3&)&Family&vs.&Professional&CEOs&)&Cross§ional&differences&in&Hours&Worked(1) (2) (3) (4) (5) (6) (7)
Dependent&VariableFamily&CEO&(2nd&generation&onwards) !0.162*** !0.094*** !0.102*** !0.099*** !0.088*** !0.087*** !0.082***
(0.017) (0.019) (0.021) (0.020) (0.020) (0.020) (0.021)Founder&CEO !0.228*** !0.160*** !0.130*** !0.116*** !0.088*** !0.090*** !0.086***
(0.026) (0.027) (0.028) (0.028) (0.031) (0.028) (0.029)Family&Ownership,&External&CEO 0.029
(0.018)Founder&Ownership,&External&CEO !0.021
(0.041)CEO&holds&positions&in&other&firms 0.015 0.010 0.013 0.008 0.007
(0.015) (0.015) (0.015) (0.015) (0.015)Ln(CEO&age) !0.147*** !0.164*** !0.127*** !0.128*** !0.130***
(0.042) (0.042) (0.042) (0.042) (0.042)Ln(1+CEO&tenure&in&firm) !0.004 !0.007 !0.006 !0.005 !0.004
(0.010) (0.010) (0.010) (0.010) (0.010)CEO&holds&College°ree 0.055* 0.051* 0.049* 0.063** 0.063**
(0.029) (0.029) (0.029) (0.028) (0.029)CEO&holds&MBA°ree 0.012 0.007 0.008 0.011 0.010
(0.016) (0.016) (0.016) (0.016) (0.016)CEO&has&study/work&experience&abroad 0.020 0.010 0.008 0.002 0.001
(0.016) (0.016) (0.016) (0.016) (0.016)Ln(Employment) 0.023*** 0.019*** 0.023*** 0.022***
(0.006) (0.006) (0.007) (0.007)Ln(Firm&age) 0.004 0.004 0.001 !0.001
(0.009) (0.009) (0.010) (0.010)MNE 0.022 0.018 0.025 0.024
(0.018) (0.018) (0.018) (0.018)Number&of&CEO&direct&reports 0.007*** 0.007*** 0.007***
(0.002) (0.002) (0.002)COO&exists !0.006 !0.016 !0.015
(0.018) (0.018) (0.018)Number&of&sons&in&management&positions !0.045** !0.056** !0.056**
(0.023) (0.022) (0.022)Number&of&daughters&in&management&positions !0.016 !0.024 !0.023
(0.030) (0.027) (0.027)Data&collected&through&the&CEO&personal&assistant !0.000 0.002
(0.016) (0.016)Constant 3.767*** 3.634*** 4.088*** 4.003*** 3.783*** 3.797*** 3.801***
(0.008) (0.027) (0.169) (0.168) (0.178) (0.184) (0.184)R)squared 0.123 0.213 0.223 0.237 0.249 0.344 0.345Number&of&firms 1114 1114 1114 1114 1114 1114 1114Test&Family&CEO&(2nd&gen)=&Founder&CEO,&p)value 0.0209 0.0195 0.328 0.5628 0.9982 0.9268 0.8946Country&dummies n y y y y y yIndustry&dummies n n y y y y yNoise&controls n n n n n y y
Notes: *significant at 10%; ** significant at 5%; *** significant at 1%. All columns estimated by OLS (robust standard errors in parenthesis). Thevariable "CEO Hours Worked" is the log of the total hours the CEO devoted to work activities lasting more than 15 minutes (excluding travel)during the survey week. The variable "Start(End) of the Day" denotes the hour at which the CEO reported to start(end) the work!day. Thevariable "Share time spent in personal activities" denotes the share of hours reported by the CEO as dedicated to leisure activities during workinghours. Family CEO =1 if the CEO is a Founder or Founder's successor and 0 otherwise. Industry dummies are 33 two digits SIC codes. Noise&controls include: a dummy to denote if the time use data was recorded by the PA; 55 interviewer dummies; a dummy to denote CEOs whoformally report to an executive Chairman; 29 interview week dummy; a self reported score given by the CEO to rank the representativeness ofthe[week[and[a[dummy[to[denote[weeks[with[a[national[or[religious[holiday.
ln(Hours&Worked)
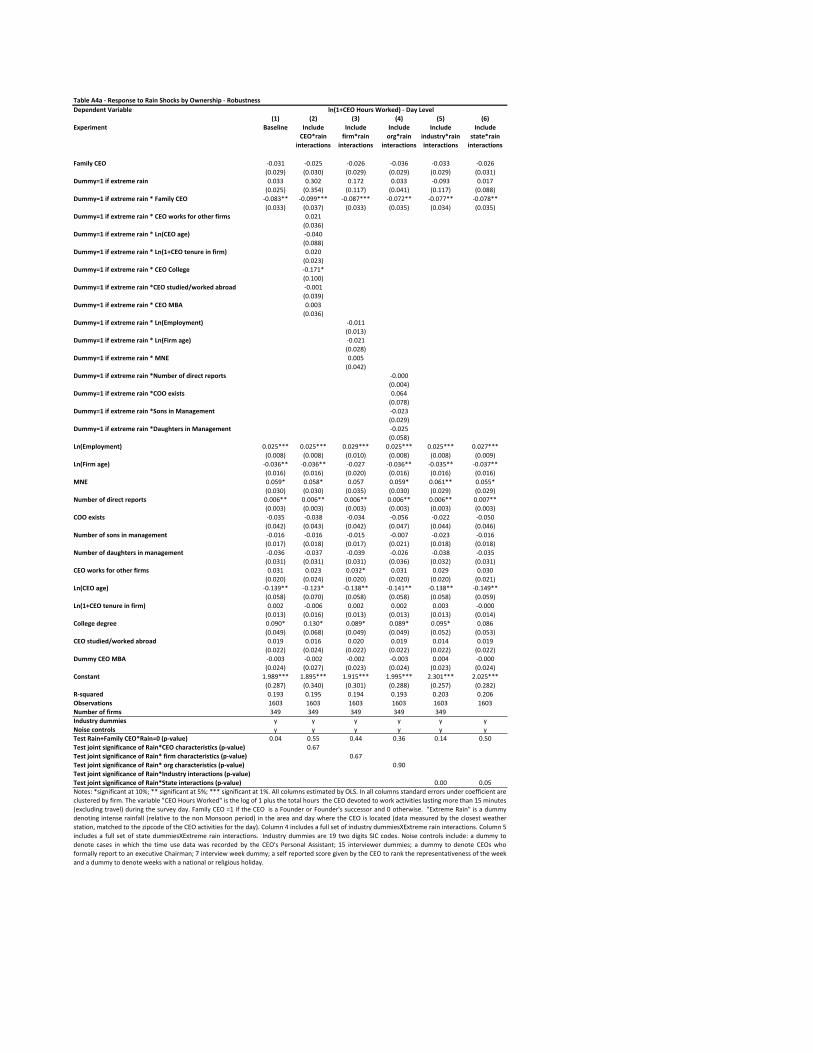
Table&A4a&)&Response&to&Rain&Shocks&by&Ownership&)&RobustnessDependent&Variable
(1) (2) (3) (4) (5) (6)Experiment Baseline Include&
CEO*rain&interactions
Include&firm*rain&
interactions
Include&org*rain&
interactions
Include&industry*rain&interactions
Include&state*rain&interactions
Family&CEO !0.031 !0.025 !0.026 !0.036 !0.033 !0.026(0.029) (0.030) (0.029) (0.029) (0.029) (0.031)
Dummy=1&if&extreme&rain 0.033 0.302 0.172 0.033 !0.093 0.017(0.025) (0.354) (0.117) (0.041) (0.117) (0.088)
Dummy=1&if&extreme&rain&*&Family&CEO !0.083** !0.099*** !0.087*** !0.072** !0.077** !0.078**(0.033) (0.037) (0.033) (0.035) (0.034) (0.035)
Dummy=1&if&extreme&rain&*&CEO&works&for&other&firms 0.021(0.036)
Dummy=1&if&extreme&rain&*&Ln(CEO&age) !0.040(0.088)
Dummy=1&if&extreme&rain&*&Ln(1+CEO&tenure&in&firm) 0.020(0.023)
Dummy=1&if&extreme&rain&*&CEO&College !0.171*(0.100)
Dummy=1&if&extreme&rain&*CEO&studied/worked&abroad !0.001(0.039)
Dummy=1&if&extreme&rain&*&CEO&MBA 0.003(0.036)
Dummy=1&if&extreme&rain&*&Ln(Employment) !0.011(0.013)
Dummy=1&if&extreme&rain&*&Ln(Firm&age) !0.021(0.028)
Dummy=1&if&extreme&rain&*&MNE 0.005(0.042)
Dummy=1&if&extreme&rain&*Number&of&direct&reports !0.000(0.004)
Dummy=1&if&extreme&rain&*COO&exists 0.064(0.078)
Dummy=1&if&extreme&rain&*Sons&in&Management !0.023(0.029)
Dummy=1&if&extreme&rain&*Daughters&in&Management !0.025(0.058)
Ln(Employment) 0.025*** 0.025*** 0.029*** 0.025*** 0.025*** 0.027***(0.008) (0.008) (0.010) (0.008) (0.008) (0.009)
Ln(Firm&age) !0.036** !0.036** !0.027 !0.036** !0.035** !0.037**(0.016) (0.016) (0.020) (0.016) (0.016) (0.016)
MNE 0.059* 0.058* 0.057 0.059* 0.061** 0.055*(0.030) (0.030) (0.035) (0.030) (0.029) (0.029)
Number&of&direct&reports 0.006** 0.006** 0.006** 0.006** 0.006** 0.007**(0.003) (0.003) (0.003) (0.003) (0.003) (0.003)
COO&exists !0.035 !0.038 !0.034 !0.056 !0.022 !0.050(0.042) (0.043) (0.042) (0.047) (0.044) (0.046)
Number&of&sons&in&management !0.016 !0.016 !0.015 !0.007 !0.023 !0.016(0.017) (0.018) (0.017) (0.021) (0.018) (0.018)
Number&of&daughters&in&management !0.036 !0.037 !0.039 !0.026 !0.038 !0.035(0.031) (0.031) (0.031) (0.036) (0.032) (0.031)
CEO&works&for&other&firms 0.031 0.023 0.032* 0.031 0.029 0.030(0.020) (0.024) (0.020) (0.020) (0.020) (0.021)
Ln(CEO&age) !0.139** !0.123* !0.138** !0.141** !0.138** !0.149**(0.058) (0.070) (0.058) (0.058) (0.058) (0.059)
Ln(1+CEO&tenure&in&firm) 0.002 !0.006 0.002 0.002 0.003 !0.000(0.013) (0.016) (0.013) (0.013) (0.013) (0.014)
College°ree 0.090* 0.130* 0.089* 0.089* 0.095* 0.086(0.049) (0.068) (0.049) (0.049) (0.052) (0.053)
CEO&studied/worked&abroad 0.019 0.016 0.020 0.019 0.014 0.019(0.022) (0.024) (0.022) (0.022) (0.022) (0.022)
Dummy&CEO&MBA !0.003 !0.002 !0.002 !0.003 0.004 !0.000(0.024) (0.027) (0.023) (0.024) (0.023) (0.024)
Constant 1.989*** 1.895*** 1.915*** 1.995*** 2.301*** 2.025***(0.287) (0.340) (0.301) (0.288) (0.257) (0.282)
R)squared 0.193 0.195 0.194 0.193 0.203 0.206Observations 1603 1603 1603 1603 1603 1603Number&of&firms 349 349 349 349 349Industry&dummies y y y y y yNoise&controls y y y y y yTest&Rain+Family&CEO*Rain=0&(p)value) 0.04 0.55 0.44 0.36 0.14 0.50Test&joint&significance&of&Rain*CEO&characteristics&(p)value) 0.67Test&joint&significance&of&Rain*&firm&characteristics&(p)value) 0.67Test&joint&significance&of&Rain*&org&characteristics&(p)value) 0.90Test&joint&significance&of&Rain*Industry&interactions&(p)value)Test&joint&significance&of&Rain*State&interactions&(p)value) 0.00 0.05
ln(1+CEO&Hours&Worked)&)&Day&Level&
Notes: *significant at 10%; ** significant at 5%; *** significant at 1%. All columns estimated by OLS. In all columns standard errors under coefficient areclusteredJbyJfirm.JTheJvariableJ"CEOJHoursJWorked"JisJtheJlogJofJ1JplusJtheJtotalJhoursJJtheJCEOJdevotedJtoJworkJactivitiesJlastingJmoreJthanJ15JminutesJ(excluding travel) during the survey day. Family CEO =1 if the CEO is a Founder or Founder's successor and 0 otherwise. "Extreme Rain" is a dummydenoting intense rainfall (relative to the non Monsoon period) in the area and day where the CEO is located (data measured by the closest weatherstation, matched to the zipcode of the CEO activities for the day). Column 4 includes a full set of industry dummiesXExtreme rain interactions. Column 5includes a full set of state dummiesXExtreme rain interactions. Industry dummies are 19 two digits SIC codes. Noise controls include: a dummy todenote cases in which the time use data was recorded by the CEO's Personal Assistant; 15 interviewer dummies; a dummy to denote CEOs whoformally report to an executive Chairman; 7 interview week dummy; a self reported score given by the CEO to rank the representativeness of the weekandJaJdummyJtoJdenoteJweeksJwithJaJnationalJorJreligiousJholiday.
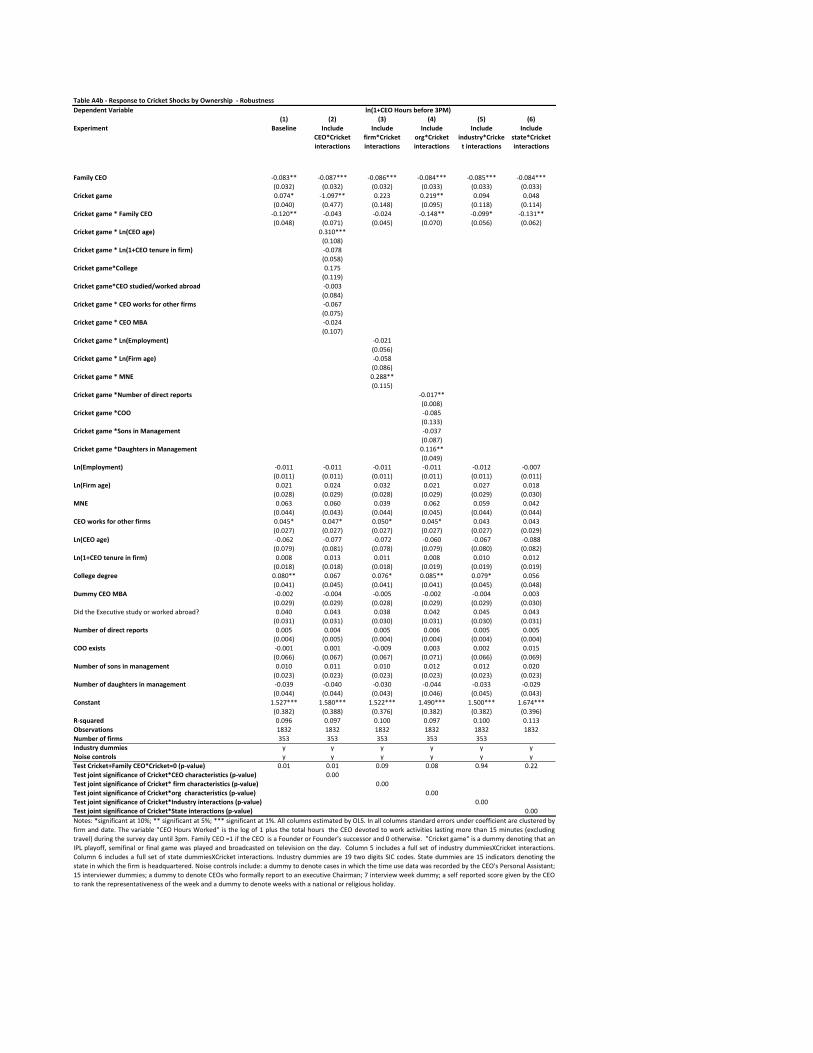
Table&A4b&)&Response&to&Cricket&Shocks&by&Ownership&&)&RobustnessDependent&Variable
(1) (2) (3) (4) (5) (6)Experiment Baseline Include&
CEO*Cricket&interactions
Include&firm*Cricket&interactions
Include&org*Cricket&interactions
Include&industry*Cricket&interactions
Include&state*Cricket&interactions
Family&CEO !0.083** !0.087*** !0.086*** !0.084*** !0.085*** !0.084***(0.032) (0.032) (0.032) (0.033) (0.033) (0.033)
Cricket&game 0.074* !1.097** 0.223 0.219** 0.094 0.048(0.040) (0.477) (0.148) (0.095) (0.118) (0.114)
Cricket&game&*&Family&CEO !0.120** !0.043 !0.024 !0.148** !0.099* !0.131**(0.048) (0.071) (0.045) (0.070) (0.056) (0.062)
Cricket&game&*&Ln(CEO&age) 0.310***(0.108)
Cricket&game&*&Ln(1+CEO&tenure&in&firm) !0.078(0.058)
Cricket&game*College 0.175(0.119)
Cricket&game*CEO&studied/worked&abroad !0.003(0.084)
Cricket&game&*&CEO&works&for&other&firms !0.067(0.075)
Cricket&game&*&CEO&MBA !0.024(0.107)
Cricket&game&*&Ln(Employment) !0.021(0.056)
Cricket&game&*&Ln(Firm&age) !0.058(0.086)
Cricket&game&*&MNE 0.288**(0.115)
Cricket&game&*Number&of&direct&reports !0.017**(0.008)
Cricket&game&*COO !0.085(0.133)
Cricket&game&*Sons&in&Management !0.037(0.087)
Cricket&game&*Daughters&in&Management 0.116**(0.049)
Ln(Employment) !0.011 !0.011 !0.011 !0.011 !0.012 !0.007(0.011) (0.011) (0.011) (0.011) (0.011) (0.011)
Ln(Firm&age) 0.021 0.024 0.032 0.021 0.027 0.018(0.028) (0.029) (0.028) (0.029) (0.029) (0.030)
MNE 0.063 0.060 0.039 0.062 0.059 0.042(0.044) (0.043) (0.044) (0.045) (0.044) (0.044)
CEO&works&for&other&firms 0.045* 0.047* 0.050* 0.045* 0.043 0.043(0.027) (0.027) (0.027) (0.027) (0.027) (0.029)
Ln(CEO&age) !0.062 !0.077 !0.072 !0.060 !0.067 !0.088(0.079) (0.081) (0.078) (0.079) (0.080) (0.082)
Ln(1+CEO&tenure&in&firm) 0.008 0.013 0.011 0.008 0.010 0.012(0.018) (0.018) (0.018) (0.019) (0.019) (0.019)
College°ree 0.080** 0.067 0.076* 0.085** 0.079* 0.056(0.041) (0.045) (0.041) (0.041) (0.045) (0.048)
Dummy&CEO&MBA !0.002 !0.004 !0.005 !0.002 !0.004 0.003(0.029) (0.029) (0.028) (0.029) (0.029) (0.030)
Did3the3Executive3study3or3worked3abroad? 0.040 0.043 0.038 0.042 0.045 0.043(0.031) (0.031) (0.030) (0.031) (0.030) (0.031)
Number&of&direct&reports 0.005 0.004 0.005 0.006 0.005 0.005(0.004) (0.005) (0.004) (0.004) (0.004) (0.004)
COO&exists !0.001 0.001 !0.009 0.003 0.002 0.015(0.066) (0.067) (0.067) (0.071) (0.066) (0.069)
Number&of&sons&in&management 0.010 0.011 0.010 0.012 0.012 0.020(0.023) (0.023) (0.023) (0.023) (0.023) (0.023)
Number&of&daughters&in&management !0.039 !0.040 !0.030 !0.044 !0.033 !0.029(0.044) (0.044) (0.043) (0.046) (0.045) (0.043)
Constant 1.527*** 1.580*** 1.522*** 1.490*** 1.500*** 1.674***(0.382) (0.388) (0.376) (0.382) (0.382) (0.396)
R)squared 0.096 0.097 0.100 0.097 0.100 0.113Observations 1832 1832 1832 1832 1832 1832Number&of&firms 353 353 353 353 353Industry&dummies y y y y y yNoise&controls y y y y y yTest&Cricket+Family&CEO*Cricket=0&(p)value) 0.01 0.01 0.09 0.08 0.94 0.22Test&joint&significance&of&Cricket*CEO&characteristics&(p)value) 0.00Test&joint&significance&of&Cricket*&firm&characteristics&(p)value) 0.00Test&joint&significance&of&Cricket*org&&characteristics&(p)value) 0.00Test&joint&significance&of&Cricket*Industry&interactions&(p)value) 0.00Test&joint&significance&of&Cricket*State&interactions&(p)value) 0.00Notes: *significant at 10%; ** significant at 5%; *** significant at 1%. All columns estimated by OLS. In all columns standard errors under coefficient are clustered byfirm and date. The variable "CEO Hours Worked" is the log of 1 plus the total hours the CEO devoted to work activities lasting more than 15 minutes (excludingtravel) during the survey day until 3pm. Family CEO =1 if the CEO is a Founder or Founder's successor and 0 otherwise. "Cricket game" is a dummy denoting that anIPL playoff, semifinal or final game was played and broadcasted on television on the day. Column 5 includes a full set of industry dummiesXCricket interactions.Column 6 includes a full set of state dummiesXCricket interactions. Industry dummies are 19 two digits SIC codes. State dummies are 15 indicators denoting thestate in which the firm is headquartered. Noise controls include: a dummy to denote cases in which the time use data was recorded by the CEO's Personal Assistant;15 interviewer dummies; a dummy to denote CEOs who formally report to an executive Chairman; 7 interview week dummy; a self reported score given by the CEOto3rank3the3representativeness3of3the3week3and3a3dummy3to3denote3weeks3with3a3national3or3religious3holiday.
ln(1+CEO&Hours&before&3PM)
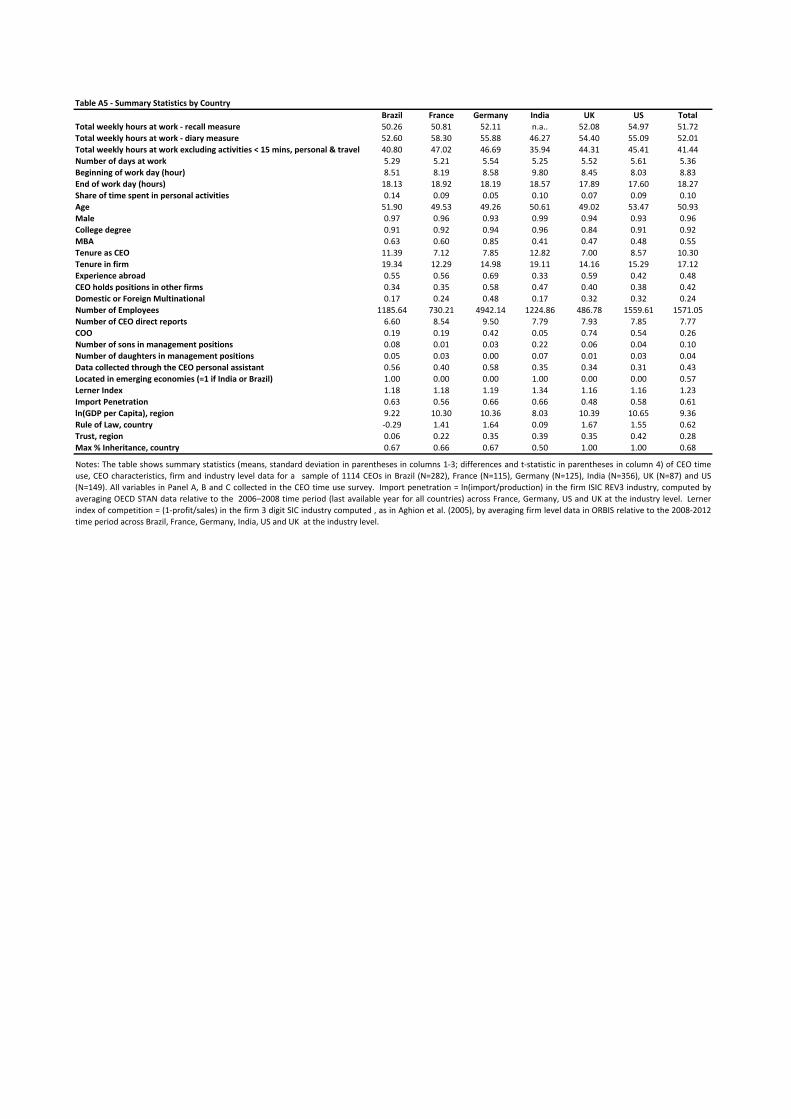
Table&A5&)&Summary&Statistics&by&CountryBrazil France Germany India UK US Total
Total&weekly&hours&at&work&)&recall&measure 50.26 50.81 52.11 n.a.. 52.08 54.97 51.72Total&weekly&hours&at&work&)&diary&measure 52.60 58.30 55.88 46.27 54.40 55.09 52.01Total&weekly&hours&at&work&excluding&activities&<&15&mins,&personal&&&travel 40.80 47.02 46.69 35.94 44.31 45.41 41.44Number&of&days&at&work 5.29 5.21 5.54 5.25 5.52 5.61 5.36Beginning&of&work&day&(hour) 8.51 8.19 8.58 9.80 8.45 8.03 8.83End&of&work&day&(hours) 18.13 18.92 18.19 18.57 17.89 17.60 18.27Share&of&time&spent&in&personal&activities 0.14 0.09 0.05 0.10 0.07 0.09 0.10Age 51.90 49.53 49.26 50.61 49.02 53.47 50.93Male 0.97 0.96 0.93 0.99 0.94 0.93 0.96College°ree 0.91 0.92 0.94 0.96 0.84 0.91 0.92MBA 0.63 0.60 0.85 0.41 0.47 0.48 0.55Tenure&as&CEO& 11.39 7.12 7.85 12.82 7.00 8.57 10.30Tenure&in&firm 19.34 12.29 14.98 19.11 14.16 15.29 17.12Experience&abroad 0.55 0.56 0.69 0.33 0.59 0.42 0.48CEO&holds&positions&in&other&firms 0.34 0.35 0.58 0.47 0.40 0.38 0.42Domestic&or&Foreign&Multinational 0.17 0.24 0.48 0.17 0.32 0.32 0.24Number&of&Employees 1185.64 730.21 4942.14 1224.86 486.78 1559.61 1571.05Number&of&CEO&direct&reports 6.60 8.54 9.50 7.79 7.93 7.85 7.77COO 0.19 0.19 0.42 0.05 0.74 0.54 0.26Number&of&sons&in&management&positions 0.08 0.01 0.03 0.22 0.06 0.04 0.10Number&of&daughters&in&management&positions 0.05 0.03 0.00 0.07 0.01 0.03 0.04Data&collected&through&the&CEO&personal&assistant 0.56 0.40 0.58 0.35 0.34 0.31 0.43Located&in&emerging&economies&(=1&if&India&or&Brazil) 1.00 0.00 0.00 1.00 0.00 0.00 0.57Lerner&Index 1.18 1.18 1.19 1.34 1.16 1.16 1.23Import&Penetration 0.63 0.56 0.66 0.66 0.48 0.58 0.61ln(GDP&per&Capita),®ion 9.22 10.30 10.36 8.03 10.39 10.65 9.36Rule&of&Law,&country .0.29 1.41 1.64 0.09 1.67 1.55 0.62Trust,®ion 0.06 0.22 0.35 0.39 0.35 0.42 0.28Max&%&Inheritance,&country 0.67 0.66 0.67 0.50 1.00 1.00 0.68
Notes: The table shows summary statistics (means, standard deviation in parentheses in columns 1.3; differences and t.statistic in parentheses in column 4) of CEO timeuse, CEO characteristics, firm and industry level data for a sample of 1114 CEOs in Brazil (N=282), France (N=115), Germany (N=125), India (N=356), UK (N=87) and US(N=149). All variables in Panel A, B and C collected in the CEO time use survey. Import penetration = ln(import/production) in the firm ISIC REV3 industry, computed byaveraging OECD STAN data relative to the 2006–2008 time period (last available year for all countries) across France, Germany, US and UK at the industry level. Lernerindex of competition = (1.profit/sales) in the firm 3 digit SIC industry computed , as in Aghion et al. (2005), by averaging firm level data in ORBIS relative to the 2008.2012time^period^across^Brazil,^France,^Germany,^India,^US^and^UK^^at^the^industry^level.