Embed Size (px)
Citation preview
SANDEE Working Paper No. 27-07 41
M. ZAKIR HOSSAIN KHAN
Economic Research GroupDhaka, Bangladesh
SANDEE Working Paper No. 27-07
November 2007
South Asian Network for Development and Environmental Economics (SANDEE)PO Box 8975, EPC 1056
Kathmandu, Nepal
Managing the Arsenic Disaster in Water Supply:Risk Measurement, Costs of Illness and Policy
Choices for Bangladesh
42 SANDEE Working Paper No. 27-07
Published by the South Asian Network for Development and Environmental Economics(SANDEE)PO Box 8975, EPC 1056 Kathmandu, Nepal.Telephone: 977-1-552 8761, 552 6391 Fax: 977-1-553 6786
SANDEE research reports are the output of research projects supported by the SouthAsian Network for Development and Environmental Economics. The reports have beenpeer reviewed and edited. A summary of the findings of SANDEE reports are alsoavailable as SANDEE Policy Briefs.
National Library of Nepal Catalogue Service:
M. Zakir Hossain Khan
Managing the Arsenic Disaster in Water Supply: Risk Measurement, Costs of Illness andPolicy Choices for Bangladesh
(SANDEE Working Papers, ISSN 1893-1891; 2007 - WP 27)
ISBN: 978 - 9937 - 8015 - 3-9
Key Words:
1. Arsenic
2. Health impact
3. Drinking water
4. Mitigation
5. Avertive technology
6. Bangladesh
The views expressed in this publication are those of the author and do not necessarilyrepresent those of the South Asian Network for Development and EnvironmentalEconomics or its sponsors unless otherwise stated.
II SANDEE Working Paper No. 27-07
SANDEE Working Paper No. 27-07 43
The South Asian Network for Development andEnvironmental Economics
The South Asian Network for Development and Environmental Economics (SANDEE)is a regional network that brings together analysts from different countries in SouthAsia to address environment-development problems. SANDEE’s activities includeresearch support, training, and information dissemination. SANDEE is supported bycontr ibut ions f rom internat ional donors and i ts members . Please seewww.sandeeonline.org for further information about SANDEE.
SANDEE is financially supported by International Development Research Centre(IDRC), The Ford Foundation, Swedish International Development CooperationAgency (SIDA) and Norwegian Agency for Development Cooperation (NORAD).
Technical EditorPriya Shyamsundar
English EditorCarmen Wickramagamage
Comments should be sent to M. Zakir Hossain Khan, Economic Research GroupDhaka, Bangladesh, Email: [email protected]
SANDEE Working Paper No. 27-07 III
SANDEE Working Paper No. 27-07 45
TABLE OF CONTENTS
1. INTRODUCTION 1
2. BACKGROUND 2
3. METHODS 3
3.1 VALUING THE BENEFITS OF ARSENIC SAFE WATER 3
3.2 RISK OF DISEASE AND SOCIO-ECONOMIC DIFFERENCES 5
3.3 DATA 5
3.4 EMPIRICAL MODEL 7
4. RESULTS 8
4.1 ESTIMATING THE SICKNESS DOSE-RESPONSE FUNCTION 8
4.2 MEASURING RISKS BY DISEASE 9
4.3 MEDICAL EXPENSES FROM ARSENICOSIS 10
4.4 AVERTING EXPENDITURE AT THE HOUSEHOLD LEVEL 10
4.5. WTP FOR SWTICHING WATER SOURCE FROM RED TO GREEN 11
4.6. WELFARE LOSS DUE TO ARSENIC EXPOSURE 11
5. DISCUSSIONS AND CONCLUSIONS 11
6. ACKNOWLEDGEMENTS 13
REFERENCES 15
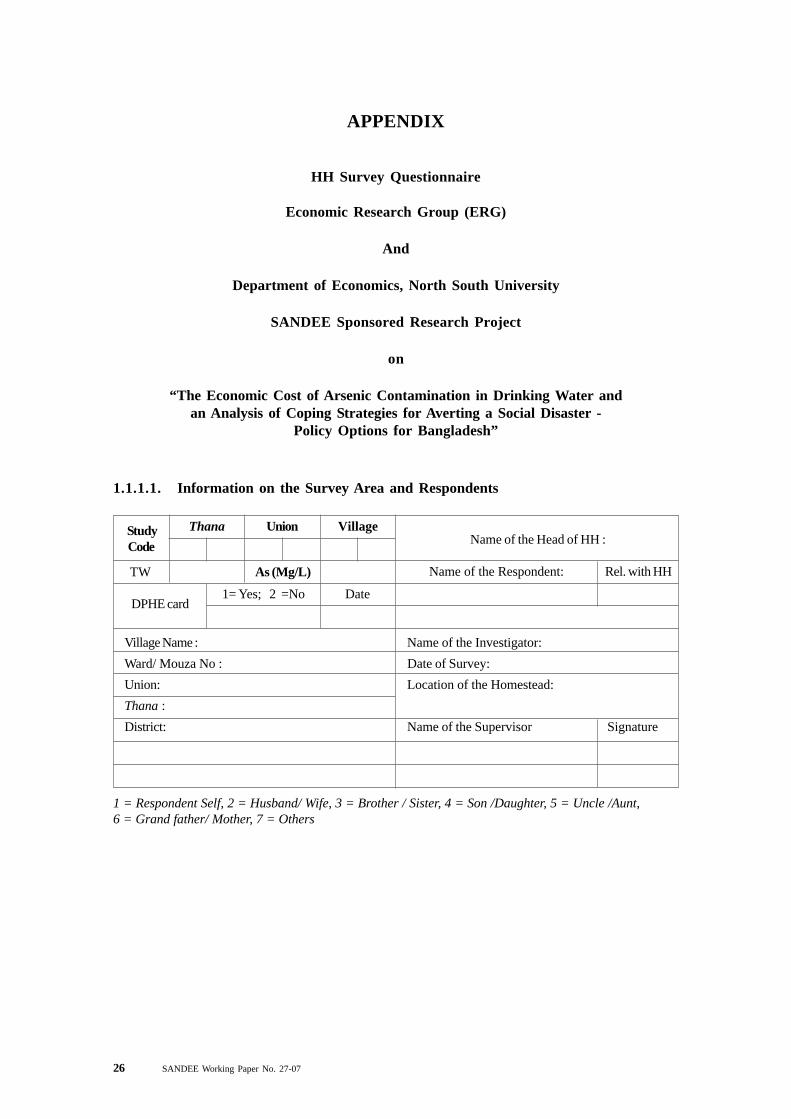
APPENDIX 26
HH SURVEY QUESTIONNAIRE 26
SANDEE Working Paper No. 27-07 V
46 SANDEE Working Paper No. 27-07
LIST OF TABLES
Table 1 : Household level information 17
Table 2 : Individual level information 18
Table 3 : Distribution of arsenic related diseases among sick households 18
Table 4 : Estimating the probability of sickness 19
Table 5 : Probability of reducing health impacts by supplying arsenic free water fordifferent arsenic-related diseases 19
Table 6 : Estimating probability of incurring medical costs 20
Table 7 : Calculation of cost of illness or welfare gain 20
Table 8 : Lower bound of willingness to pay to avoid arsenicosis 20
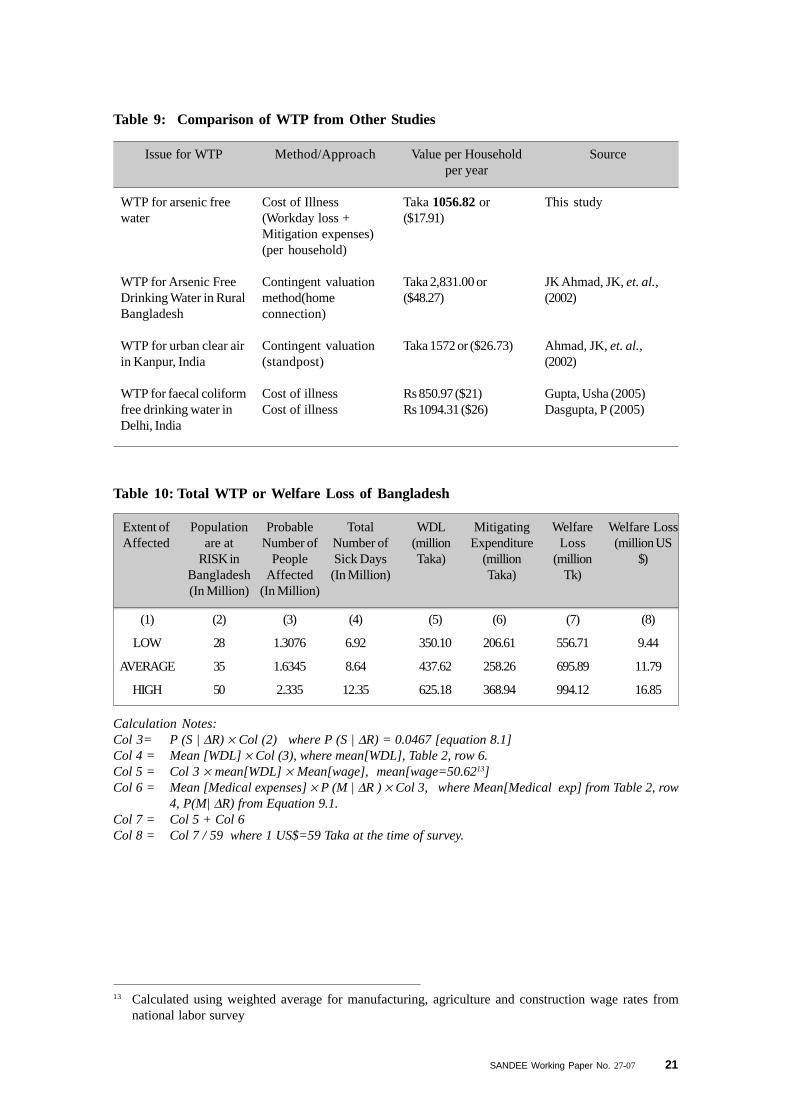
Table 9 : Comparison of WTP from other studies 21
Table 10 : Total WTP or welfare loss of Bangladesh 21
Table 11 : Probit estimates of Arsenic-related disease of primary and secondarystage with Marginal effects 22
Table 12 : Unit cost of different types of arsenic removal/mitigating technologies 23
LIST OF FIGURES
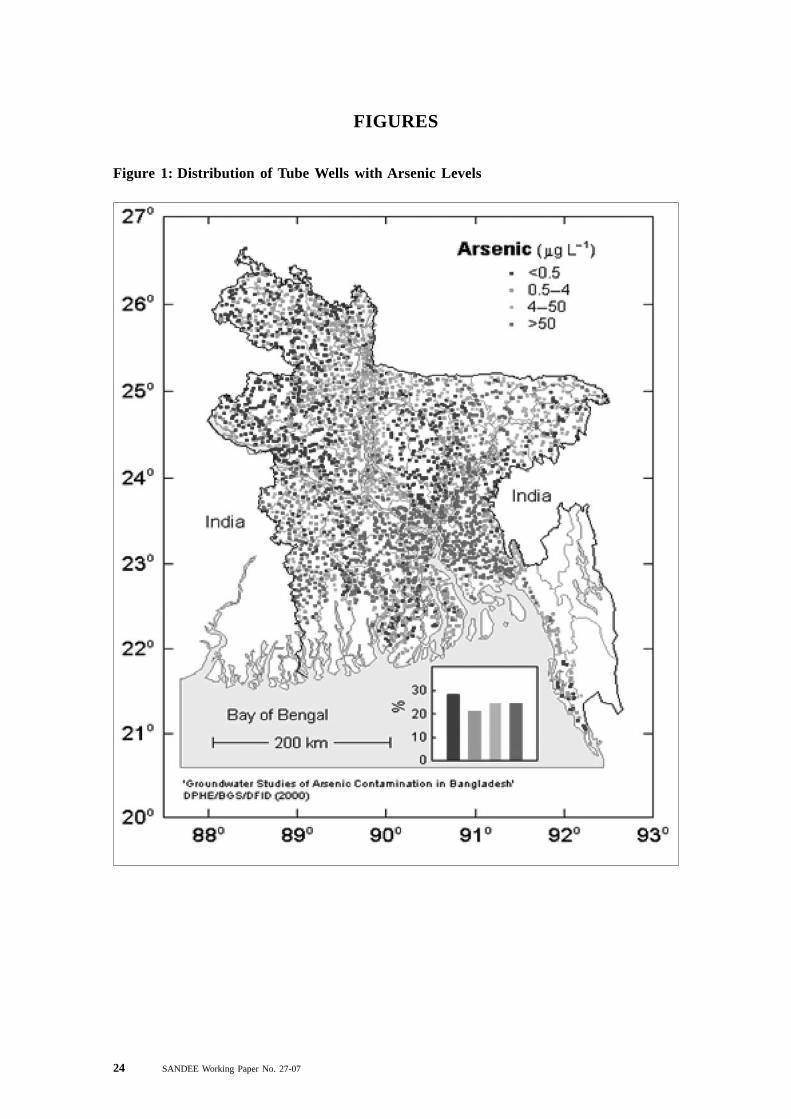
Figure 1 : Distribution of Tube-wells with Arsenic Levels 24
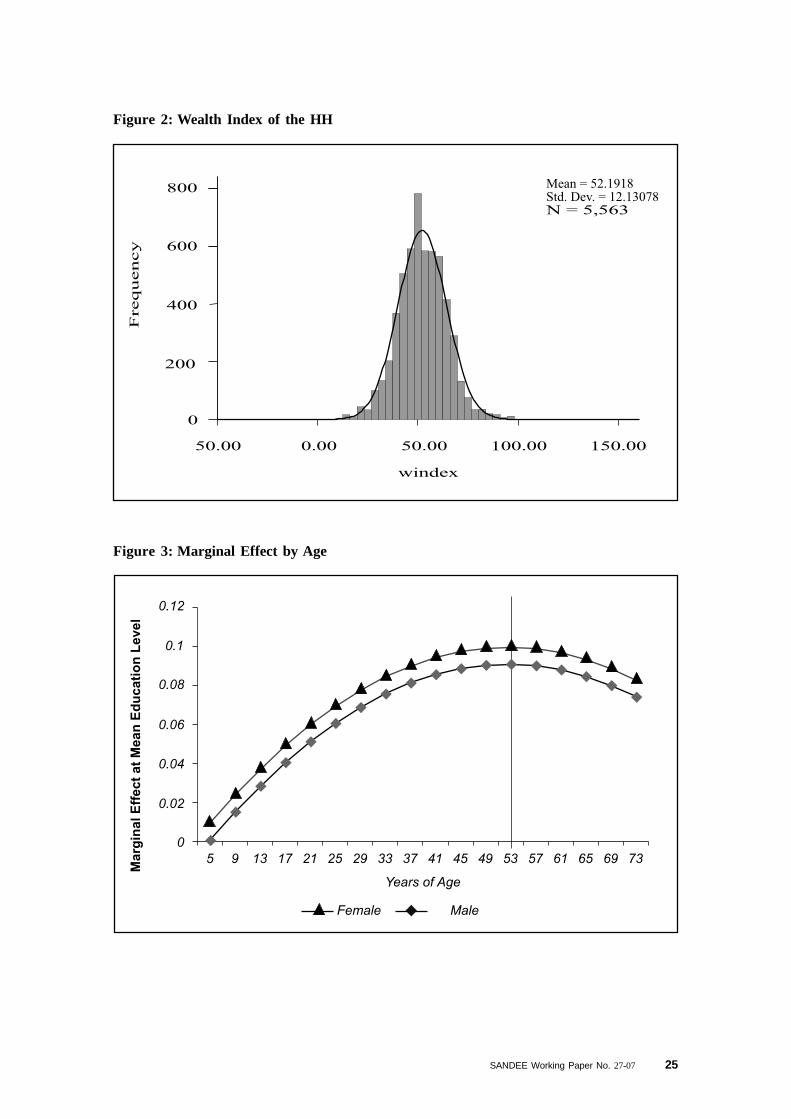
Figure 2 : Wealth Index of the HH 25
Figure 3 : Marginal effect by age 25
VI SANDEE Working Paper No. 27-07
SANDEE Working Paper No. 27-07 47
Abstract
Arsenic poisoning is a major public health concern in Bangladesh. This study uses primary datato examine health impacts and costs associated with arsenic contamination of groundwater. Thestudy estimates that some 7 to 12 million person-days per year are lost as a result of arsenicexposure. In addition, individuals who are sick spend between 207 (US$ 3.5) million to 369(US$ 6.25) million taka per year for medical help. The total cost of illness as a result of exposureto arsenic is Tk 557 (US$ 9) to Tk 994 (US$ 17) million per annum or on average nearly 0.6percent of the annual income of affected individuals. If it is possible to provide arsenic-free(within safe limit) alternative technologies to reverse the impact of arsenic, the social gains toBangladesh are considerable. The study also finds that the threat of Melanosis--the black spotdisease—and Keratosis—roughness in palms and soles— is high when there is cumulativeexposure and that this threat is not the same for all wealth classes. Richer households takemitigation measures to reduce the threat on their health. Richer households also seem to be moresuccessful in avoiding the incidence of conjunctivitis due to Arsenicosis. Women on the otherhand are more likely to be affected by inflammation of the respiratory tracts--a sign of long-termexposure without recourse to medical help.
Key Words: Arsenic, health impact, drinking water, mitigation, avertive technology, Bangladesh.
SANDEE Working Paper No. 27-07 VII
SANDEE Working Paper No. 27-07 1
Managing the Arsenic Disaster in Water Supply: Risk Measurement,Costs of Illness and Policy Choices for Bangladesh
M. Zakir Hossain Khan
1. Introduction
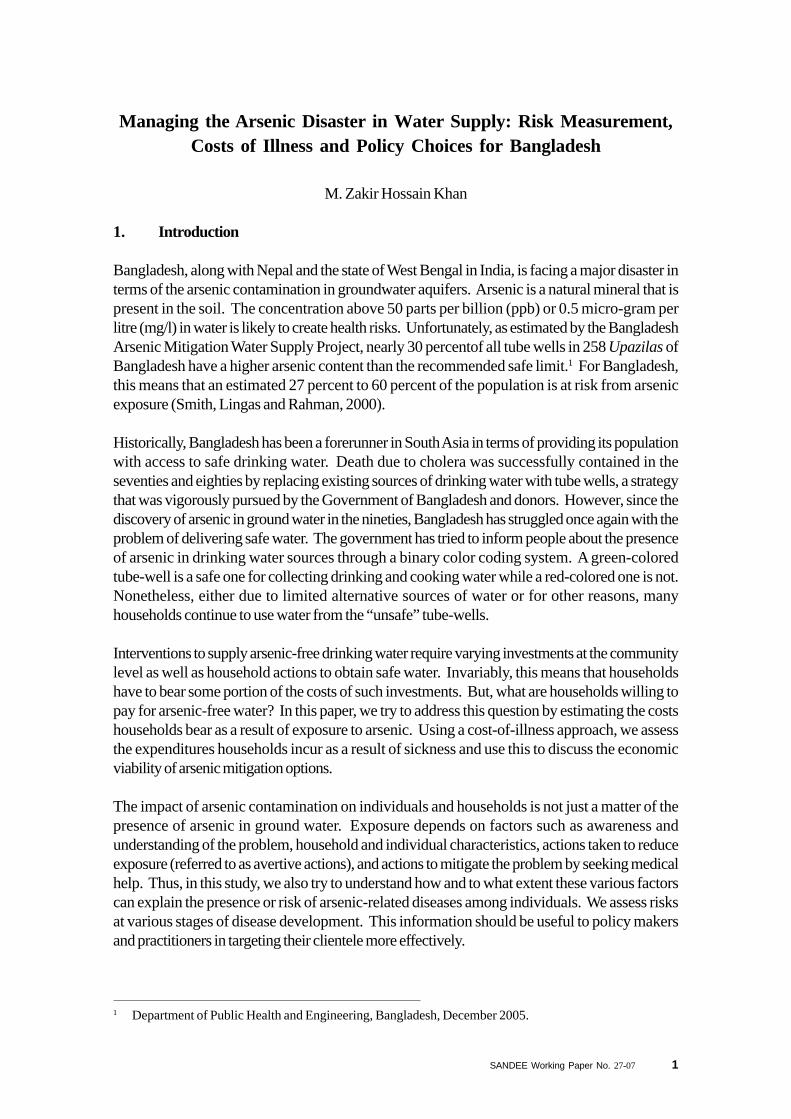
Bangladesh, along with Nepal and the state of West Bengal in India, is facing a major disaster interms of the arsenic contamination in groundwater aquifers. Arsenic is a natural mineral that ispresent in the soil. The concentration above 50 parts per billion (ppb) or 0.5 micro-gram perlitre (mg/l) in water is likely to create health risks. Unfortunately, as estimated by the BangladeshArsenic Mitigation Water Supply Project, nearly 30 percentof all tube wells in 258 Upazilas ofBangladesh have a higher arsenic content than the recommended safe limit.1 For Bangladesh,this means that an estimated 27 percent to 60 percent of the population is at risk from arsenicexposure (Smith, Lingas and Rahman, 2000).
Historically, Bangladesh has been a forerunner in South Asia in terms of providing its populationwith access to safe drinking water. Death due to cholera was successfully contained in theseventies and eighties by replacing existing sources of drinking water with tube wells, a strategythat was vigorously pursued by the Government of Bangladesh and donors. However, since thediscovery of arsenic in ground water in the nineties, Bangladesh has struggled once again with theproblem of delivering safe water. The government has tried to inform people about the presenceof arsenic in drinking water sources through a binary color coding system. A green-coloredtube-well is a safe one for collecting drinking and cooking water while a red-colored one is not.Nonetheless, either due to limited alternative sources of water or for other reasons, manyhouseholds continue to use water from the “unsafe” tube-wells.
Interventions to supply arsenic-free drinking water require varying investments at the communitylevel as well as household actions to obtain safe water. Invariably, this means that householdshave to bear some portion of the costs of such investments. But, what are households willing topay for arsenic-free water? In this paper, we try to address this question by estimating the costshouseholds bear as a result of exposure to arsenic. Using a cost-of-illness approach, we assessthe expenditures households incur as a result of sickness and use this to discuss the economicviability of arsenic mitigation options.
The impact of arsenic contamination on individuals and households is not just a matter of thepresence of arsenic in ground water. Exposure depends on factors such as awareness andunderstanding of the problem, household and individual characteristics, actions taken to reduceexposure (referred to as avertive actions), and actions to mitigate the problem by seeking medicalhelp. Thus, in this study, we also try to understand how and to what extent these various factorscan explain the presence or risk of arsenic-related diseases among individuals. We assess risksat various stages of disease development. This information should be useful to policy makersand practitioners in targeting their clientele more effectively.
1 Department of Public Health and Engineering, Bangladesh, December 2005.
2 SANDEE Working Paper No. 27-07
2. Background
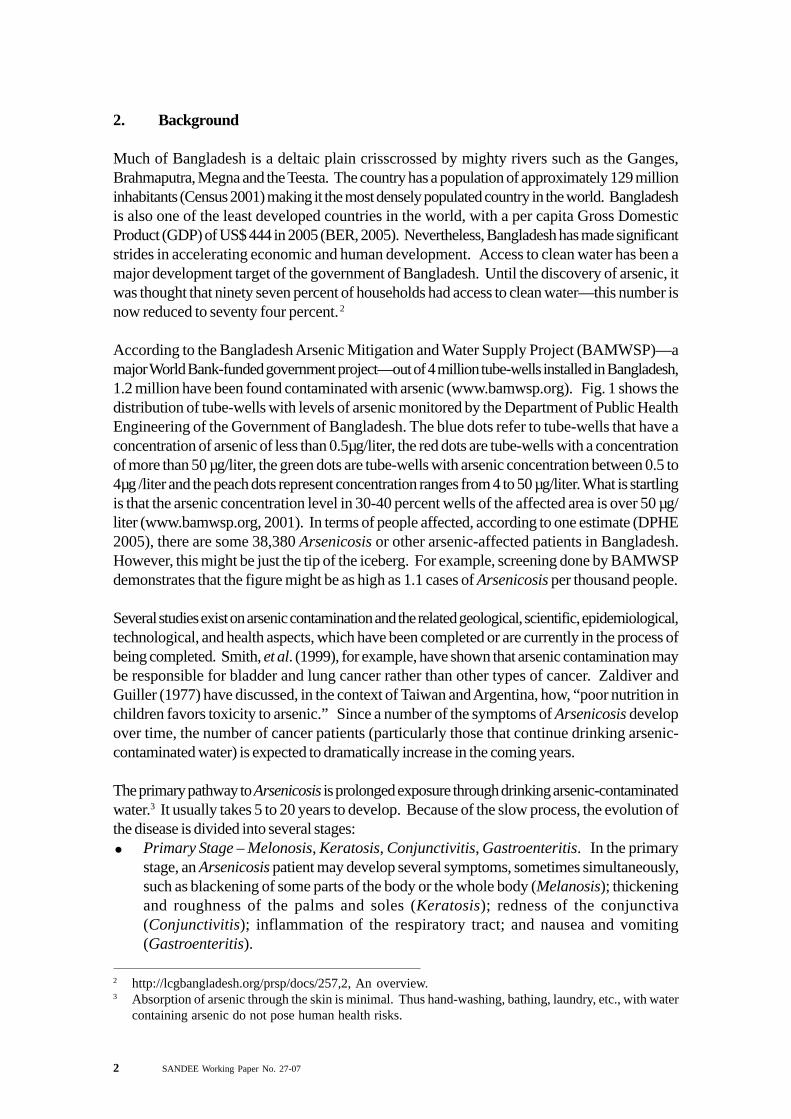
Much of Bangladesh is a deltaic plain crisscrossed by mighty rivers such as the Ganges,Brahmaputra, Megna and the Teesta. The country has a population of approximately 129 millioninhabitants (Census 2001) making it the most densely populated country in the world. Bangladeshis also one of the least developed countries in the world, with a per capita Gross DomesticProduct (GDP) of US$ 444 in 2005 (BER, 2005). Nevertheless, Bangladesh has made significantstrides in accelerating economic and human development. Access to clean water has been amajor development target of the government of Bangladesh. Until the discovery of arsenic, itwas thought that ninety seven percent of households had access to clean water—this number isnow reduced to seventy four percent. 2
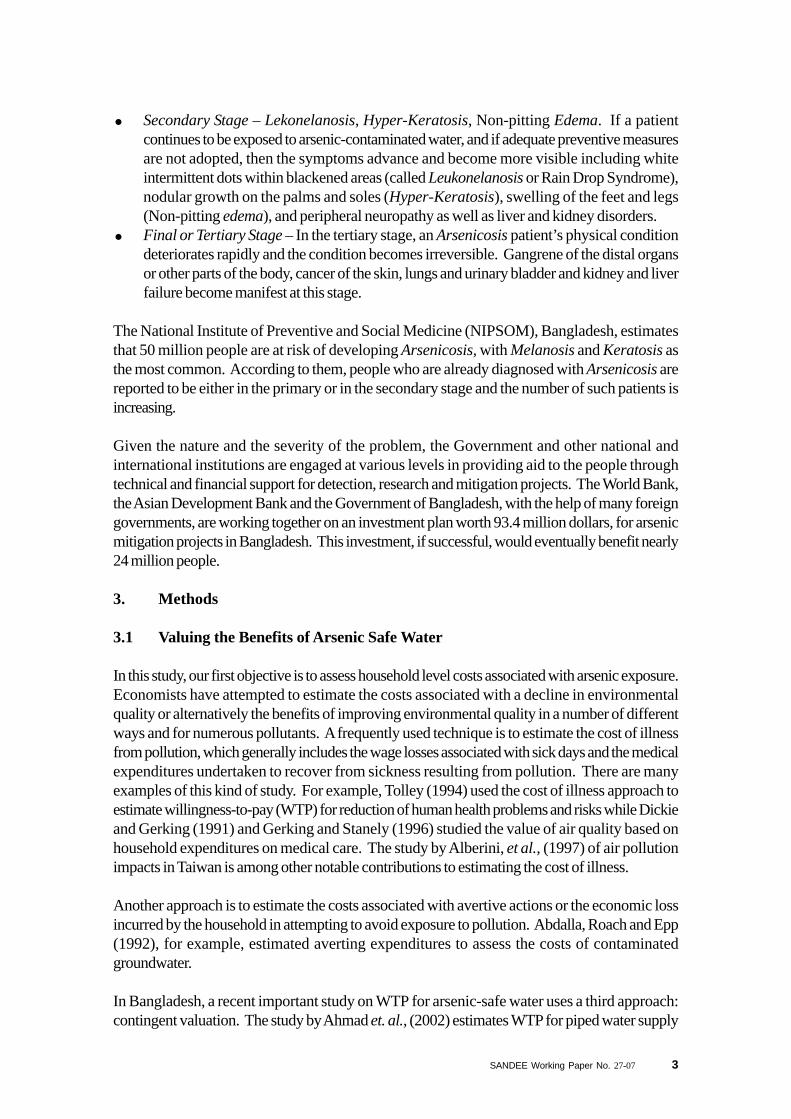
According to the Bangladesh Arsenic Mitigation and Water Supply Project (BAMWSP)—amajor World Bank-funded government project—out of 4 million tube-wells installed in Bangladesh,1.2 million have been found contaminated with arsenic (www.bamwsp.org). Fig. 1 shows thedistribution of tube-wells with levels of arsenic monitored by the Department of Public HealthEngineering of the Government of Bangladesh. The blue dots refer to tube-wells that have aconcentration of arsenic of less than 0.5µg/liter, the red dots are tube-wells with a concentrationof more than 50 µg/liter, the green dots are tube-wells with arsenic concentration between 0.5 to4µg /liter and the peach dots represent concentration ranges from 4 to 50 µg/liter. What is startlingis that the arsenic concentration level in 30-40 percent wells of the affected area is over 50 µg/liter (www.bamwsp.org, 2001). In terms of people affected, according to one estimate (DPHE2005), there are some 38,380 Arsenicosis or other arsenic-affected patients in Bangladesh.However, this might be just the tip of the iceberg. For example, screening done by BAMWSPdemonstrates that the figure might be as high as 1.1 cases of Arsenicosis per thousand people.
Several studies exist on arsenic contamination and the related geological, scientific, epidemiological,technological, and health aspects, which have been completed or are currently in the process ofbeing completed. Smith, et al. (1999), for example, have shown that arsenic contamination maybe responsible for bladder and lung cancer rather than other types of cancer. Zaldiver andGuiller (1977) have discussed, in the context of Taiwan and Argentina, how, “poor nutrition inchildren favors toxicity to arsenic.” Since a number of the symptoms of Arsenicosis developover time, the number of cancer patients (particularly those that continue drinking arsenic-contaminated water) is expected to dramatically increase in the coming years.
The primary pathway to Arsenicosis is prolonged exposure through drinking arsenic-contaminatedwater.3 It usually takes 5 to 20 years to develop. Because of the slow process, the evolution ofthe disease is divided into several stages:
Primary Stage – Melonosis, Keratosis, Conjunctivitis, Gastroenteritis. In the primarystage, an Arsenicosis patient may develop several symptoms, sometimes simultaneously,such as blackening of some parts of the body or the whole body (Melanosis); thickeningand roughness of the palms and soles (Keratosis); redness of the conjunctiva(Conjunctivitis); inflammation of the respiratory tract; and nausea and vomiting(Gastroenteritis).
2 http://lcgbangladesh.org/prsp/docs/257,2, An overview.3 Absorption of arsenic through the skin is minimal. Thus hand-washing, bathing, laundry, etc., with water
containing arsenic do not pose human health risks.
SANDEE Working Paper No. 27-07 3
Secondary Stage – Lekonelanosis, Hyper-Keratosis, Non-pitting Edema. If a patientcontinues to be exposed to arsenic-contaminated water, and if adequate preventive measuresare not adopted, then the symptoms advance and become more visible including whiteintermittent dots within blackened areas (called Leukonelanosis or Rain Drop Syndrome),nodular growth on the palms and soles (Hyper-Keratosis), swelling of the feet and legs(Non-pitting edema), and peripheral neuropathy as well as liver and kidney disorders.Final or Tertiary Stage – In the tertiary stage, an Arsenicosis patient’s physical conditiondeteriorates rapidly and the condition becomes irreversible. Gangrene of the distal organsor other parts of the body, cancer of the skin, lungs and urinary bladder and kidney and liverfailure become manifest at this stage.
The National Institute of Preventive and Social Medicine (NIPSOM), Bangladesh, estimatesthat 50 million people are at risk of developing Arsenicosis, with Melanosis and Keratosis asthe most common. According to them, people who are already diagnosed with Arsenicosis arereported to be either in the primary or in the secondary stage and the number of such patients isincreasing.
Given the nature and the severity of the problem, the Government and other national andinternational institutions are engaged at various levels in providing aid to the people throughtechnical and financial support for detection, research and mitigation projects. The World Bank,the Asian Development Bank and the Government of Bangladesh, with the help of many foreigngovernments, are working together on an investment plan worth 93.4 million dollars, for arsenicmitigation projects in Bangladesh. This investment, if successful, would eventually benefit nearly24 million people.
3. Methods
3.1 Valuing the Benefits of Arsenic Safe Water
In this study, our first objective is to assess household level costs associated with arsenic exposure.Economists have attempted to estimate the costs associated with a decline in environmentalquality or alternatively the benefits of improving environmental quality in a number of differentways and for numerous pollutants. A frequently used technique is to estimate the cost of illnessfrom pollution, which generally includes the wage losses associated with sick days and the medicalexpenditures undertaken to recover from sickness resulting from pollution. There are manyexamples of this kind of study. For example, Tolley (1994) used the cost of illness approach toestimate willingness-to-pay (WTP) for reduction of human health problems and risks while Dickieand Gerking (1991) and Gerking and Stanely (1996) studied the value of air quality based onhousehold expenditures on medical care. The study by Alberini, et al., (1997) of air pollutionimpacts in Taiwan is among other notable contributions to estimating the cost of illness.
Another approach is to estimate the costs associated with avertive actions or the economic lossincurred by the household in attempting to avoid exposure to pollution. Abdalla, Roach and Epp(1992), for example, estimated averting expenditures to assess the costs of contaminatedgroundwater.
In Bangladesh, a recent important study on WTP for arsenic-safe water uses a third approach:contingent valuation. The study by Ahmad et. al., (2002) estimates WTP for piped water supply

4 SANDEE Working Paper No. 27-07
projects. This study estimates that WTP for a community water stand post is Tk 51 per month,with an additional Tk 960 towards capital costs. For domestic connections, the mean estimatedWTP is Tk 87 per month and Tk 1787 towards capital costs. For poor households, the costsare Tk 44 per month and Tk 838 towards capital costs for a stand post and Tk 68 per monthand Tk 1401 towards capital costs for a home connection. This study has however come undersome criticism on the grounds that poor households might not be able to pay for arsenic-freepiped-water connections (www.arsenic poisoning in Bangladesh-India.htm, 2004). In our study,we adopt a cost of illness plus avertive expenditures approach—an approach discussed in Freeman(1993), which discusses different techniques to measure the health costs of environmental change.
This study follows the Freeman (1993) model of household production function to estimate thewillingness-to-pay for arsenic-free water in Bangladesh. A household maximizes the utility subjectto a full-income budget constraint:4
U (.) = U (X, L, S: Hi) ................................................................. (1)
Where, X is the amount of consumption of goods and services (private), L is the amount of timespent in leisure, S is the number of sick days and Hi is a vector of characteristics of the individuallike education, health status, wealth, etc.
Following Freeman (1993), it can be shown that an individual determines his/her choice ofconsumption of goods and services and mitigation/averting activities based on income, cost ofmedical and averting activities, level of contamination in water, health status, and householdcharacteristics. The marginal willingness-to-pay for a reduction in pollution (or an improvementin environmental quality) is given by:
dR
dSSU
R
MP
R
AP
dR
dSwMWTP MA λ
∂∂
−∂
∂+∂
∂+= ** ................... (2)
where, S is the number of work days lost due to sickness, A is averting activity undertaken, Mrefers to mitigating activities (illness and medicine related), R is the level of contamination, w isthe wage, and P
A and P
M are the price of averting and mitigating activities and λ refers to the
marginal utility of investment in mitigating and averting expenses to get rid of sickness. It shouldbe noted that variables with asterisk (*) are measured at the optimal level.
Because of difficulties in estimating the last term in equation (2), which measures disutility fromsickness, valuation studies often estimate a lower bound of the MWTP, as given in equation (3),
R
MP
R
AP
dR
dSwMWTP MA ∂
∂+∂
∂+= **........................................... (3)
where MWTP is the sum of a) cost due to work days lost, b) cost due to adoption of avertingactivities, and c) cost of mitigating activities.
4 For a detailed derivation, see Freeman (1993).
SANDEE Working Paper No. 27-07 5
3.2 Risk of Disease and Socio-Economic Differences
Households respond to costs incurred from sickness in many ways. In some cases, other familymembers increase their work and/or there is a reduction in household consumption. Householdsalso cope by drawing on cash savings, selling assets and obtaining loans. Furthermore, in atraditional society where social stratification is defined by kinship, assets and also ignorance,social exclusion can play an important role in influencing coping strategies. For example, sinceArsenicosis in its initial stage is manifested as a skin disease, parents of brides with arsenicdiseases find it difficult to gain appropriate grooms for their daughters. Exclusion is evident inother social interactions as well. For example, Asia Arsenic Network (2004) found that“Arsenicosis patients are refused jobs and water collection by neighbors or others.” However,this type of unfortunate exclusion can have a positive impact when it comes to fighting arseniccontamination—the risk of social exclusion leading to the adoption of some mitigation measures.This, in turn, affects the risk associated with Arsenicosis. With the above scenario in mind, thisstudy attempts to capture the influence of social and economic factors in determining the risk ofArsenicosis.
3.3 Data
To estimate the cost of illness, we undertook a survey of 5563 individuals from 878 householdsin two Upazillas (sub-districts), Matlab and Laksman, in 2005. These Upazillas are located inthe southeastern part of Bangladesh, which is the most arsenic prone region (see Fig. 1). Todetermine the sample frame, the database of the Department of Public Health Engineering (DPHE)was used and households were randomly chosen for the survey. Although the two Upazillas arelocated within a 50 km distance from each other, one of them, Matlab, is an area where health-related interventions are high due to its linkage with the International Centre for Diarrheal DiseasesResearch, Bangladesh (ICDDRB).
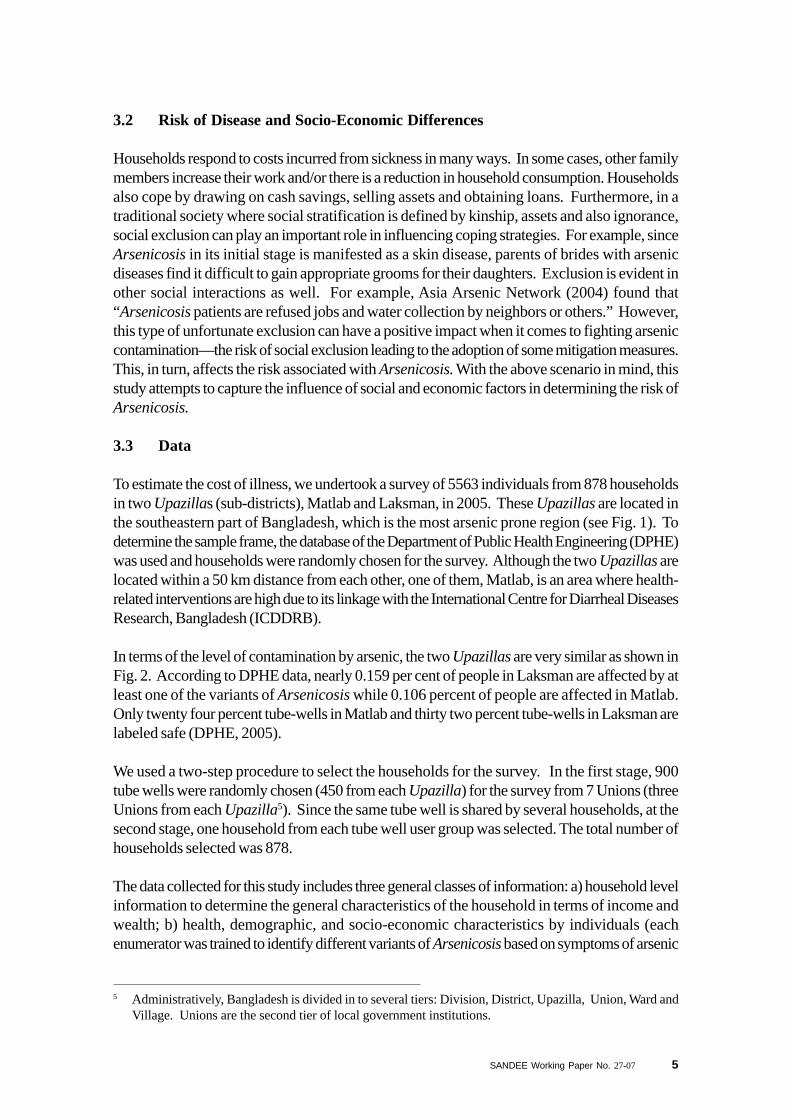
In terms of the level of contamination by arsenic, the two Upazillas are very similar as shown inFig. 2. According to DPHE data, nearly 0.159 per cent of people in Laksman are affected by atleast one of the variants of Arsenicosis while 0.106 percent of people are affected in Matlab.Only twenty four percent tube-wells in Matlab and thirty two percent tube-wells in Laksman arelabeled safe (DPHE, 2005).
We used a two-step procedure to select the households for the survey. In the first stage, 900tube wells were randomly chosen (450 from each Upazilla) for the survey from 7 Unions (threeUnions from each Upazilla5). Since the same tube well is shared by several households, at thesecond stage, one household from each tube well user group was selected. The total number ofhouseholds selected was 878.
The data collected for this study includes three general classes of information: a) household levelinformation to determine the general characteristics of the household in terms of income andwealth; b) health, demographic, and socio-economic characteristics by individuals (eachenumerator was trained to identify different variants of Arsenicosis based on symptoms of arsenic
5 Administratively, Bangladesh is divided in to several tiers: Division, District, Upazilla, Union, Ward andVillage. Unions are the second tier of local government institutions.
6 SANDEE Working Paper No. 27-07
diseases); and c) work days lost, income loss, sick days, and averting and mitigating activitiesboth at household level and at the individual level. Avertive activities here refer to actions takenby households to avoid use of contaminated water. Mitigating activities refer to doctor andhospital visits.
Tables 1 and 2 provide a brief summary of statistics at the individual and household level. Theaverage age of the individuals in the sample is 28 years and the average year of schooling is 5years6 while height and weight of the individuals are 55.10 inches and 41.66 kg respectively.Fifty percent of the sample individuals are male.
To determine wealth status of the household, we collected a list of assets for each household.Using this list, the wealth index that was developed provides a relative scale on wealth for eachhousehold in terms of wealth status. The maximum value of the index is 100 and the minimumvalue is 0. A total of 43 types of assets were included in the calculation of the index. Of the 43assets, 32 were listed as household assets and the other 11 were listed as productive assets. Wepresent the wealth distribution of the sampled households in Fig. 3.
Non-governmental organizations in the area are involved in raising the level of awareness againstdrinking water from the arsenic-contaminated sources. Survey data shows that 32 percent ofhouseholds attended such programs organized by NGOs. In Bangladesh, NGOs have coverednearly 50 percent of the rural population in terms of their activities. This number thus is notsurprising.
In terms of sources of drinking water by the household, 46 percent of households in the sampleuse either a tube well or hand pump as the primary source of water for drinking. Only 11.5percent people use water from deep tube wells as the source of drinking water. Less than 0.5percent people use filters and only 0.2 percent use water from Arsenic Removal Plants (ARP).This clearly shows the extent of vulnerability of the local people in terms of Arsenicosis.
In the study area, a large number of tube wells (though not all) have been marked RED (unsafefor drinking) or GREEN (safe) by the government. However, survey data shows that 56 percentof households still drink water from RED-labeled tube wells. Further, since all the tube wells arenot color-coded, it is possible that 86 percent of the households (see Table 2), who state thatthey drink water from shallow aquifer sources, may also be exposed to arsenic.
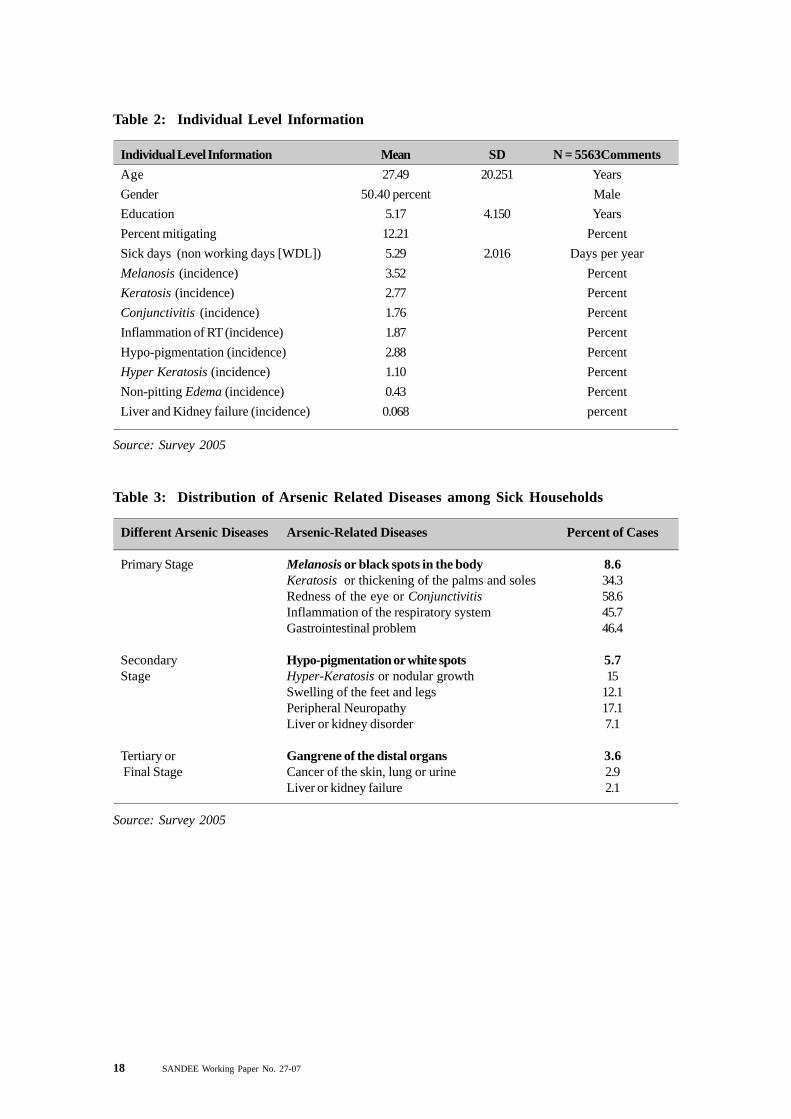
The survey also collected data on individuals, which is presented in Table 2. Our survey suggeststhat 5 percent of all the people surveyed have at least one of the various types of Arsenicosis: 4percent have black spots or Melanosis, 3 percent have thickening or roughness of palms andsoles (Keratosis), 2 percent have redness in eyes or Conjunctivitis, 2 percent have inflammationof respiratory tract, 0.43 percent have swelling of the feet and legs, .068 percent suffer from liverand kidney failure.
6 Households use several sources of water for drinking, cooking, bathing, and washing purposes. Basedon their responses, this percentage was calculated keeping in view that households using shallow aqui-fers for drinking and cooking purposes are likely to be at risk.
SANDEE Working Paper No. 27-07 7
Table 3 shows the percentage of cases found with variants of Arsenicosis amongst people whoreported that they were sick from arsenic. Most of the individuals with arsenic-related diseasesreport their diseases to be in the primary stage. Fifty seven percent of sick individuals’ symptomsrelated to conjunctivitis, 34.3 percent are suffering from Keratosis, 45.7 percent have respiratoryproblems and 46.4 percent people have reported gastrological problems. These figures suggestthat the extent of Arsenicosis is much more severe than is commonly thought.
3.4 Empirical Model
In order to estimate the marginal willingness-to-pay for arsenic safe water given in equation (3),we need to estimate three functions. Freeman’s (1993) model provides the basis for estimatinga dose-response function for sickness and two demand functions for mitigating and avertiveactivities.
The demand for mitigating activities is given by: M* = M*(y, w, P
M, P
A, R, Aw, H
S , Hi) ...................................... (4)
The demand for averting activities is given by: A* = A*(y, w, R, P
M, P
A, Aw, H
S , Hi)......................................... (5)
The dose-response function for workdays lost7 (S) is:S = S(R, M*, A*, Aw, Hs, Hi) ...................................................... (6)
Where, w is wage income, y is non-wage income, PM
is cost (price) of mitigating activities, PA
cost (price) of averting activities, R is level of arsenic contamination, Aw is level of awareness, HS
is health status, and Hi is household characteristics. Mitigation activities, M, refer to actionsundertaken to reduce the effects of arsenic related sickness and include medical expenses, feespaid to doctors or pharmacists, and travel costs. Averting activities, A, include adoption ofdifferent measures to reduce risk to arsenic. These included switching the source of water toanother ‘safe’ surface or ground water source, harvesting rain water or using technologies suchas the three pitcher method for purifying water.
Our survey data showed that households with arsenic affected patients did not have much ofeither averting or mitigating expenses, probably due to poor income status. Consequently, insteadof using continuous data on mitigating or averting actions, we use binary variables. Thus, mitigatingactivities take the value 1 if an individual has any medical expenditures and zero otherwise.Similarly, avertive activities are a binary variable that takes the value 1 if the individual undertakesany avertive actions and zero otherwise.
Only 82 individuals out of more than 3260 individuals with some form of sickness reportedworkdays lost (WDL) due to sickness. The actual number of days lost was 5.29 per year. It ispossible that due to poverty, perhaps, people could not afford to abstain from work. Thus in ourempirical analyses, sickness is also treated as a binary variable, which takes the value of 1 if theindividual reported arsenic-related sickness and 0 otherwise.
7 Work days lost is equal to or less than the sick days.
8 SANDEE Working Paper No. 27-07
The empirical model of equation (3) for estimating marginal willingness to pay is thus modified asbelow:
zAPRSPRMPMRSPWDLwMWTP Aiiii /)0()|()|()|( >×∆×+∆×+∆××= β ...... (7)= (A) + (B) + (C)
where P(S|∆R) is the marginal effect or change in the probability of sickness (related to arsenicpoisoning) for an individual due to changes in the level of arsenic poisoning, ∆R is expectedchanges in the dose of arsenic poisoning in water; w is average wage of the adult working
population, WDL is the mean workdays lost, M is the mean mitigating expenditure per individual
when he/she is affected with arsenic related diseases and P(M|∆R) is the changes in the probabilityof incurring mitigating expenses due to changes in the level of exposure at the individual level. â
A
is the estimated co-efficient of averting expenses when the level of arsenic changes and measuresthe marginal changes in the averting expenses due to changes in the level of exposure; P(A>0) isthe probability of taking averting measures at the household level; the subscript i refers to individualmember-based information; z refers to number of members in a household.
(A) )|( RSPWDLw iii ∆×× measures the marginal impact in terms of income loss due to
changes in the level of exposure to arsenic (∆R);
(B) )|( RMPM ∆× measures the marginal effect on mitigating expenditure due to changes
in the exposure to arsenic poisoning; and
(C) zAPRSPA /)0()|( >×∆×β measures the marginal effect on averting activities at
the individual level for changes in the exposure. The first two terms measure the effecton averting expenses due to changes in exposure to risk.
4. Results
4.1 Estimating the Sickness Dose-Response Function
The probability estimates in equation (7) are derived using a probit model by maximizing thefollowing log-likelihood function.
∑ −−+= )),(1()1(),(( ββ xx FLnYLnFYL ii ............................................ (8)
where x is a vector of independent variables and βs are the coefficients. x includes a) individuallevel information such as age measured in years (AGE and AGESQ), sex measured as a binaryvariable (SEX), and education measured in years (EDUC); b) household wealth index (WINDEX);and c) a binary variable indicating the presence of arsenic in drinking water (ARSCODE = 1means the tube well is labeled RED while 0 means the tube well is labeled GREEN). Thesummary statistics of the variables used are presented in Table 1 and 2. F ( ) is the cumulativeprobability function for a probit model. Y
i =1 if an arsenic related disease is prevalent and = 0 if
absent for ith individual.
SANDEE Working Paper No. 27-07 9
Using the probit model, we determine the marginal effect due to a change in the source of drinking
water (from RED to GREEN).8 The marginal effect )|ˆ()|ˆ(ˆ01 == −=∆ ARSCODEARSCODE FFF shows
the effect on changes in the probability of reducing incidence of an arsenic-related disease whena RED source of water is replaced by a GREEN source. Therefore, it measures the benefit interms of disease prevalence by switching the source of water to a ‘safe’ mode.
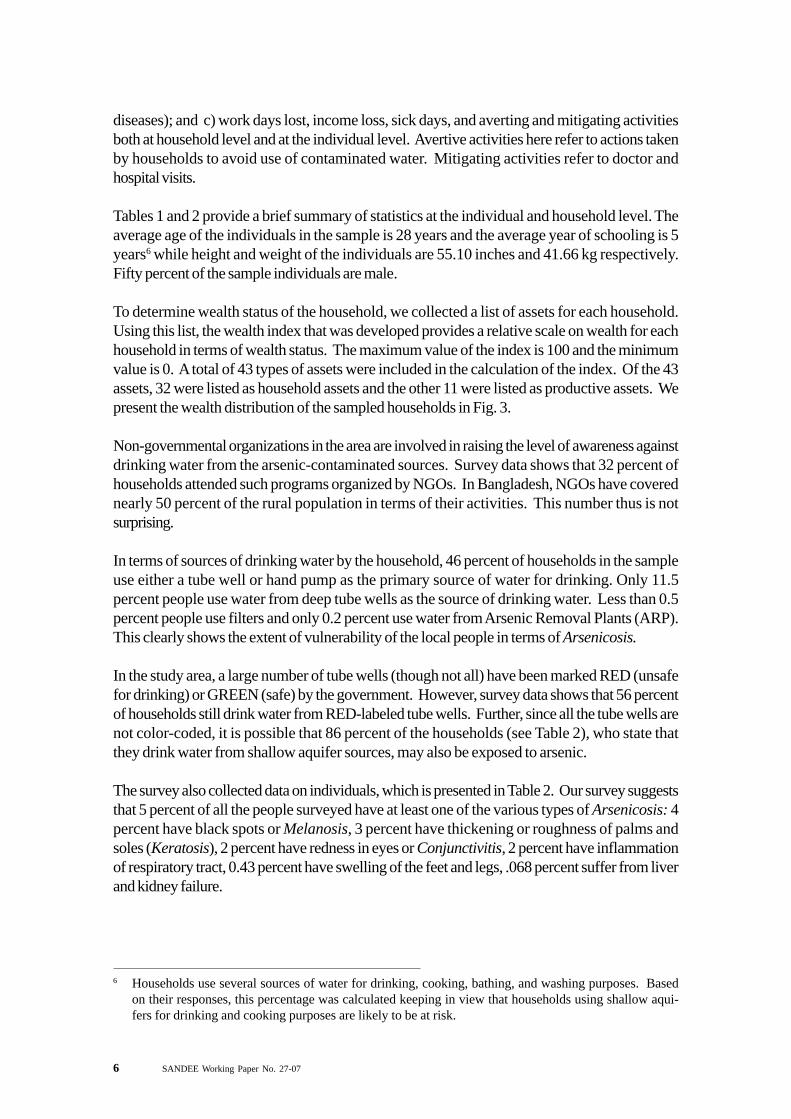
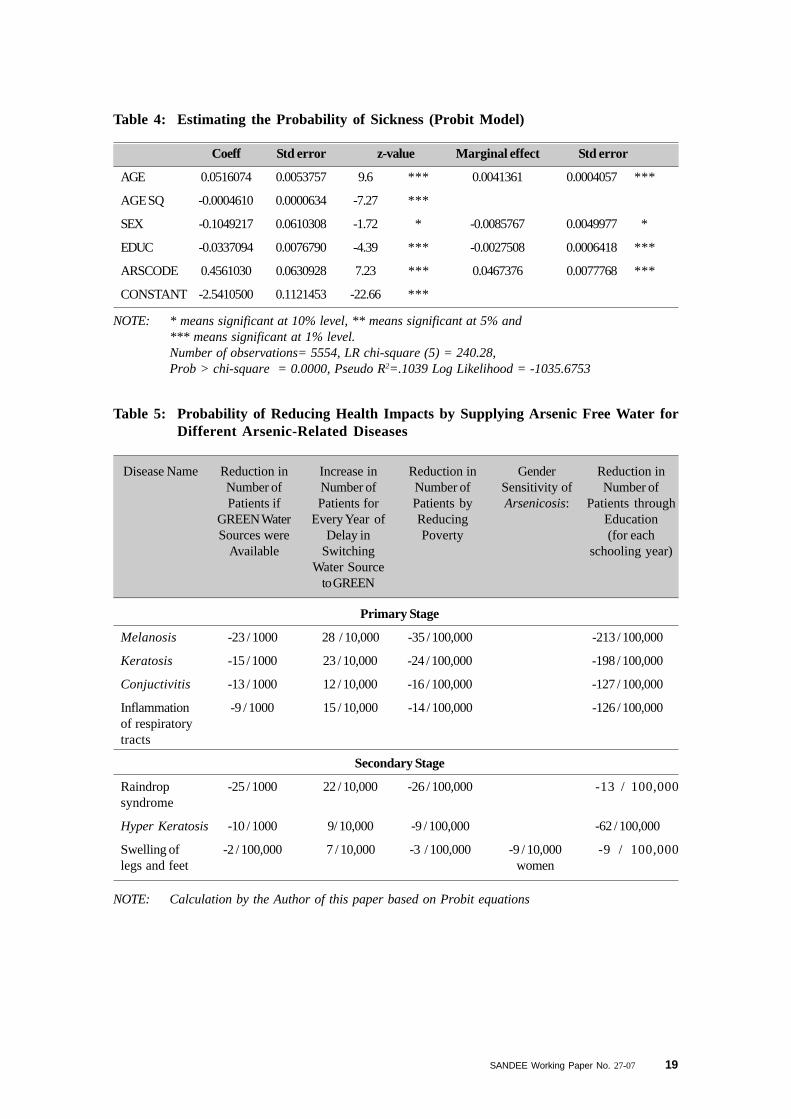
Table 4 also shows that a change in the probability of sickness is associated with the age, genderand education of the individual. Since arsenic is a bio-accumulative element, the probability ofArsenicosis increases with age up to 55 years for both men and women (see Fig. 3). Forfemales, the marginal effect is higher than for males implying that there is a larger gain in terms ofreducing the probability of sickness when a women switches from RED to GREEN source ofwater. In terms of the probability of sickness, the model shows that a male has lower probability(by 0.86 percent) of getting sick than a female. This is probably caused by a) the poor healthstatus of the female in a poor household; b) food habits where men often get more nutritious foodthan women.
The estimated model further shows that schooling years is negatively related with the probabilityof sickness, i.e., higher the level of education lower is the probability of getting sick (which couldbe caused by more awareness level). Each year of additional education reduces the probabilityof sickness by 0.27 percent. Finally, the impact of switching from RED to GREEN source ofwater reduces probability of sickness by 4.6 percent, by far the largest gain in terms of reducingsickness. These observations are valid for households using water from RED tube wells only.
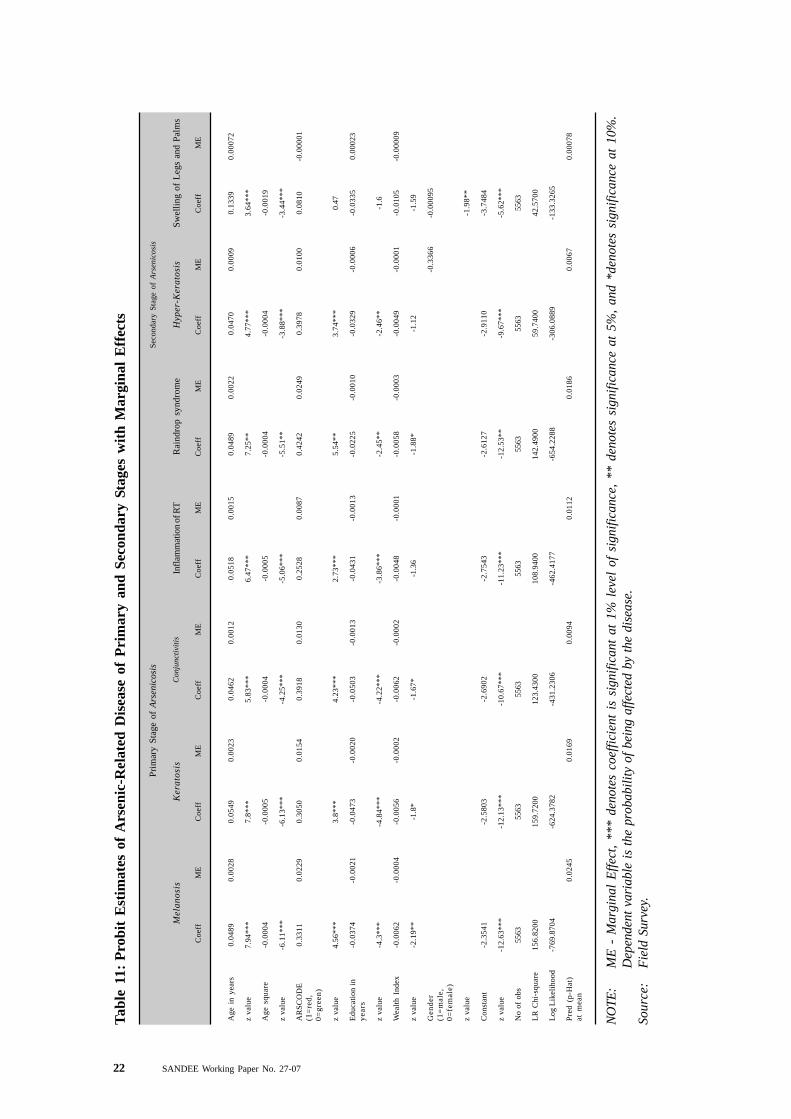
4.2 Measuring Risks by Disease
Arsenicosis is the final stage of the disease arising out of drinking arsenic contaminated water fora long time. The disease itself is a slow growth disease and its manifestation in the human bodyvaries significantly due to a) exposure; b) socio-economic and demographic characteristics ofthe individual; and c) cumulative intake of arsenic contaminated water.
To measure the risks of these variants of disease, we use a probit model to estimate how much ofthis impact could have been avoided if the affected people were given arsenic-free water. Theseresults are presented in Annexure.
For Melanosis, Table 5 shows that if GREEN source of water can be introduced, then nearly 23per 1000 persons could avoid the disease each year. If there is a delay in providing GREENsource of water in the area, there will be an increase in the number of patients (suffering fromMelanosis) by 28 for every 10,000 individuals. Similarly, for every one unit rise in the index ofwealth, number of patients could be reduced by 35 in 100,000. There appears to be no genderdimension to this disease, which means the probability will not change for either male or female.Finally, Table 5 also shows that educational attainment could influence the number of patients.For Melanosis, every one year increase in the level of education reduces the number of patientsby 213 for every 100,000 people.
8 For detailed derivation see Greene (2003, p 674).
10 SANDEE Working Paper No. 27-07
Table 5 shows that the family benefits the most in terms of incidence of all the diseases related toarsenic in water with an immediate switch to GREEN water sources. The next important variablefor reducing incidence of various diseases comes from the cumulative impact of drinking water.Hence, earlier the switch is made the better off the population would be in terms of incidence ofdiseases. Education also plays a significant role in terms of reducing the incidence of arsenic-related diseases. The gender aspect of the disease is only visible in cases of swelling of legs andfeet. For a man the number is 9 / 10,000 less than for a woman. Since we did not collectinformation on death related to arsenic, this analysis does not estimate the changes in probabilityof death due to Arsenicosis.
4.3 Medical Expenses from Arsenicosis
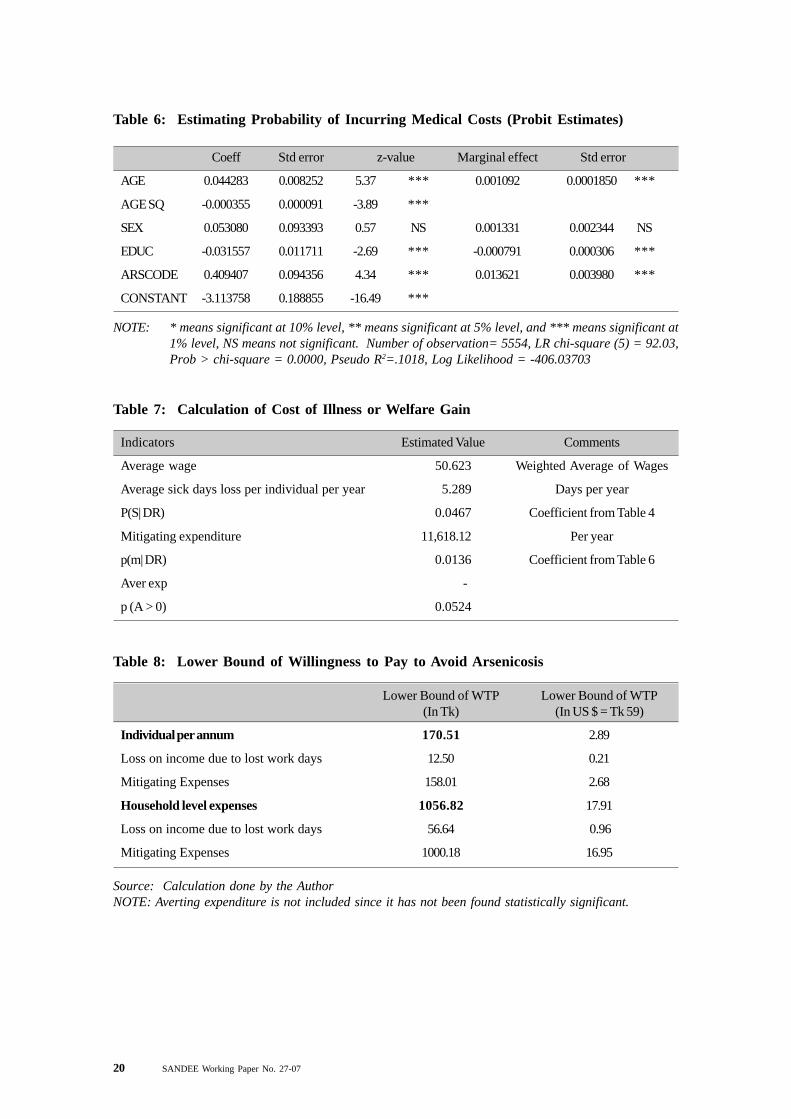
Mitigating activities include expenditures incurred due to sickness when any individual member inthe household is affected by arsenic-related diseases. In the sample of 5563, only 88 reportedmedical expenditure related to arsenic, whereas 296 were suffering from arsenic-related diseases.Using the probit model, we estimate the probability of incurring mitigating expenditure due toexposure to arsenic. The estimated probit equation and the marginal effects are shown inTable 6.
Table 6 shows that the probability of incurring mitigating expenses is also influenced by the age ofthe individual, the square of his/her age, and the level of arsenic in drinking water (ARSCODE).It shows that the probability of incurring health expenditure will go up by 1.36 percent if thewater source turns RED from GREEN. The co-efficient of Gender and Education is not significantbut we kept these variables in the equation in order to avoid errors due to dropping relevantvariables from the equation. In Table 6 the marginal value of AGE is positive. This implies thatthe individual’s probability of incurring medical expenditure will increase with age or time.Unfortunately, the marginal value of ‘sex’ is not significant.
4.4 Averting Expenditure at the Household Level
Avertive expenses are incurred when adopting any alternative technology to reduce the impact ofcontamination. It is a precautionary step on the part of the household and expenses are oftenincurred at the household level rather than at the individual level. Aftab, Haque and Khan (2006)have shown that raising awareness on arsenic-related health risks leads to adoption of avertingtechnologies.
In our study, only 196 households (out of 878 households in the sample) adopted at least onetype of technology (the choice ranging from individual level to community level interventions) andreported operating and maintenance costs or installation costs or both. As a result, a majority ofthe households did not have any expenditure on averting technologies. Hence, when we estimatedthe demand for avertive activities, we found no statistical relationship with the adoption of avertingtechnology at the household level and type of well used. We did not use the information on theavertive actions further while estimating the MWTP.9
9 We wish to note that several other types of functional forms and variables were tried in order to determinethe suitability of this function. In no case did we find ARSCODE to be statistically significant.
SANDEE Working Paper No. 27-07 11
4.5 WTP for Swtiching Water Source from Red to Green
Using the calculation given in equation (7), and the coefficients of the Tables 1 and 2, we calculatethe mean cost of illness for an individual at Tk 170.51 or $ 2.89 per annum. This is equivalentto Tk 1056.82 or US$ 17.91 per household per year. This measures annual willingness to payfor switching from RED to GREEN sources of water. This includes costs in terms of a) loss ofincome due to sickness (Tk 12.5 per annum for adults only) and b) mitigating expenditures forsick members in the family (Tk 158.01 per annum10). Table 9 presents the comparative analysisof WTP estimates from different studies. Among them, the study of Ahmad, et al., (2002) ismost relevant. This study used the CV method to estimate the WTP for arsenic free water at thehousehold level using either home connection or a stand post. However, in this study, we did notmeasure WTP for any specific arsenic-free water at the household level.
Our estimate shows that even when we include a) costs due to lost working days, and b) cost ofmitigation during sickness, the cost is lower than that estimated by Ahmad, et al., (2002). Thedifference is expected given the fact that we use the revealed preference method of estimationwhile Ahmad used the stated preference model to estimate the cost of damage. Other studiesare not comparable because the WTP question is for different purposes. However, we presentthem in Table 9 to complete the illustrations.
4.6 Welfare Loss due to Arsenic Exposure
As stated earlier, mitigation of this problem will ensure the health and wellbeing of about 28-50million people who are at risk. In financial terms, as estimated from willingness-to-pay, this issubstantial. We estimated that the total medical expenditure from arsenic exposure is potentiallyin the range of 206.61 million to 368.94 million taka per year. In addition, there are costs in therange of 350 million to 625 million in terms of workday losses. Thus, total marginal willingness topay lies between 556.71 million taka to 994.12 million taka per annum or nearly 0.6 percentofthe income of the households (based on an average per capita income of $ 480). This means thatif it is possible to mitigate this problem using suitable technology there is likely to be a net socialgain of 9.44 to 16.85 million US$ per annum (see Table 10).
5. Discussion and Conclusions
This study has provided a key set of results in terms of risks and costs related to Arsenicosiscaused by drinking water from arsenic-contaminated sources. We reiterate below some of thekey findings of the study.
Our sample shows that the number of days lost in work due to sickness is 5.28 days per year.Thus, most of the households did not report a significant number of workdays lost11 due toarsenic-related diseases. In terms of benefits, if a household switches to a GREEN source ofwater, then it could avoid only about $1 per year per household in terms of work days lost. Thislow value implies that adult members of households continue to work while they are sick. It alsoreflects their low wage earnings.
10 See Table 811 Only applicable for adult individuals of the household.
12 SANDEE Working Paper No. 27-07
An estimated 28-50 million Bangladeshis are at risk from arsenic-contaminated water. For apopulation of 28 million people exposed to arsenic risks, this is equivalent of 6.92 million workdayslost per year or a 350 million taka loss in income for affected individuals. For the higher estimateof 50 million people at risk, this is equivalent of 625 million taka loss in income. Hence, 350million to 625 million taka is the total benefit in terms of avoiding workday losses by switching toGREEN source of water.
Given the range of population at risk, the equivalent savings in terms of medical expenditureavoided by switching to GREEN source of water is between 206.61 and 368.94 million taka peryear. However, the probability of illness rises with age; therefore, this estimate is a lower boundin terms of medical expenditure. The actual cost will rise each year as the incidence of sicknesswill increase by nearly 4 for every 1000 population each year (see Table 4).
Annual total willingness to pay for switching from RED to GREEN sources of water is taka1056.82 ($18) per household. We estimate the total welfare gain from switching to GREENsource of water by the exposed population to avoid arsenic related disease to be between556.71 million to 994.12 million taka per year.
In terms of exposure to different diseases, switching to GREEN sources reduces the risk ofMelanosis, raindrop and Keratosis diseases. A delay in adopting averting measures increasesthe risks of Melanosis, Keratosis and raindrop syndrome.
Education is an important tool in reducing the risk of Arsenicosis diseases in Bangladesh. Similarly,reduction of poverty is another important policy variable which can also successfully reduce therisk of arsenic-related diseases. Consequently, poverty reduction and education should bepursued as a policy to reduce the impact of arsenic poisoning.
Females are likely to be more affected by swelling of legs disease. This is probably because thisdisease often goes undetected for a longer period of time since women do not report to a doctorin the initial stages of the disease. As a result, we see more female patients in this category.
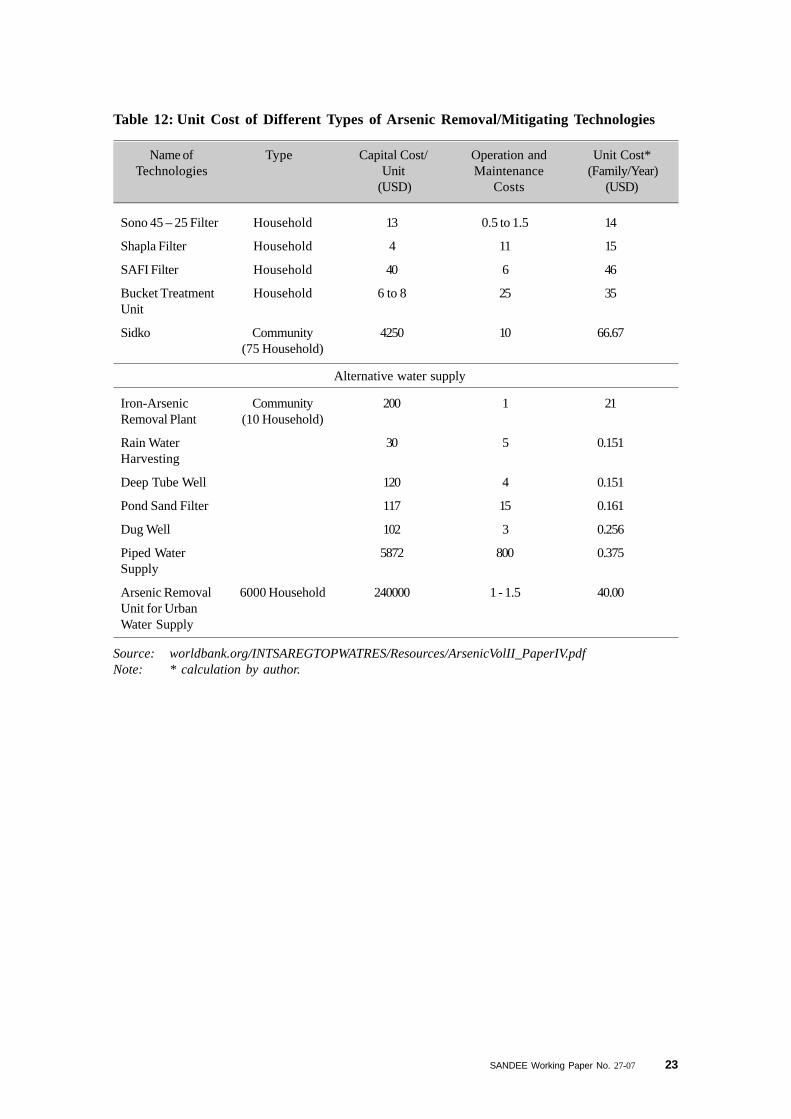
Since the study estimates the costs of arsenic exposure, it is useful to see how the costs of arsenicexposure compare with the costs of mitigation. Currently, there are two types of arsenic mitigationoptions available in Bangladesh. In the first category, there are community based mitigationtechniques, which include arsenic and iron removal plant, pond sand filters, deep tube wells andpiped water supply. These mitigation options require the involvement of institutions (like NGOs,Government agencies, etc.) to bear the initial cost of investment, which can range from $2,000 to$240,000 for 100 households (see Table 12). The dynamics of establishing institutions to runthese community-based mitigation options is not simple and needs to be taken into considerationwhen assessing the feasibility of such investments.
Mitigation can also be undertaken at the household level using various techniques such as thethree pitcher method and use of Shapla or Sono filters, etc. These options cost between $4 to$4250 (initial capital) plus $0.5 to $25 annually for operation and maintenance. Our studysuggests that the less expensive of these options, i.e., those that cost less than $18 annually maybe acceptable to households if the initial costs are low or subsidized. The Government ofBangladesh is yet to finalize any specific technique as suitable for all households. One factor that
SANDEE Working Paper No. 27-07 13
should be taken into account in making any such decision is household willingness to pay formitigation. Clearly, the costs of mitigation, if they are to be acceptable to households, should beless than the costs incurred by exposure to arsenic.
Arsenic poisoning is a major public health concern in Bangladesh. However, much of the socialand economic story of arsenic is unknown. People drinking from the same water source for thesame period of time may not be affected similarly because of their health and hygiene standards.People of the same age too are not affected similarly because of differences in body mass andfood habits. As a result, the challenge can be said to contain both social as well as strictlymedical dimensions when it comes to seeking remedies.
The costs of arsenic contamination are large and the risks vary by socio-economic categories. Inthe absence of this kind of detailed information, identification of causes may be difficult and all thecauses could be lumped together into one cause—arsenic contamination. Or all the solutionscould be merged into one, i.e., improving the water quality. Such a quick fix, we propose, isneither efficient nor desirable to society.
6. Acknowledgements
This study has been conducted with financial support from the South Asian Network forDevelopment and Environmental Economics (SANDEE). I am grateful to my SupervisorProfessor A K Enamul Haque for providing intellectual and technical inputs, Dr Priya Shyamsundarfor her meticulous reading of the queries on several drafts, and also to Dr. Sajjad Zohir for hisinsightful comments throughout the study. The feedbacks and the comments of resource personsJeff Vincent, Maureen Cropper, Priya Shyamsundar, M N Murty and others of SANDEE haveenriched the study at various stages. I am thankful to Mr Prashant and Mr Rahman for theirencouragement at the initial stage of conceptualization of this study. I would also like to expressmy thanks to the SANDEE Secretariat, especially Mr Manik Duggar, Ms Anuradha Kafle andMs Kavita Shrestha, for their encouragement and support during different stages of this study.

14 SANDEE Working Paper No. 27-07
SANDEE Working Paper No. 27-07 15
References
Abdalla, C W, B A Roach, and D J Epp (1992), “Valuing Environmental Quality Changes usingaverting Expenditures: An application to groundwater Contamination,” Land Economics, Vol.68 (May): 163-69.
Aftab, Sonia, A K Enamul Haque, and M Zakir Hossain Khan (2006), “Adoption of Arsenic-Safe Drinking Water Practice in Rural Bangladesh: An Averting Behavior Model”, Journal ofBangladesh Studies, Vol. 8, No. 1: 48-59
Ahmad, M F and C M Ahmed, (2002), Study on Area Wise Concentration of Arsenic inBangladesh, Dhaka, ICDDRB, 2004.
Alberini A. and Krupnick A. (February, 2000), Cost-of-Illenss and Willingness-to-Pay Estimatesof the Benefits of Improved Air Quality: Evidence from Taiwan, Journal of Land Economics,76(1): 37-53
Asia Arsenic Network Report, 2004 (www.asiaarsenic.net).
Bangladesh Arsenic Mitigation Water Supply Project, a joint World Bank-Government ofBangladesh project (2000).
Department of Public Health and Engineering (DPHE) Bangladesh (2005), “Supplying SafeWater and Prevention Arsenic”.
Dickie, M and S Gerking (1991), “Valuing Reduced Morbidity: A Health Production Approach,”Southern Economic Journal, Vol. 57, No. 3: 690-702.
Freeman, A M III (1993), The Measurement of Environmental and Resource Values: Theoryand Methods, Resources for the Future: Washington, D. C.
Gerking, S and L Stanely (1996), “An Economic Analysis of Air Pollution and Health: The Caseof St. Louis,” The Review of Economics and Statistics, Vol. 68, No. 1:115-21.
Smith, Allan, M L Biggs, and L Moore (1999), “Cancer Risks from Arsenic in DrinkingWater: Implications for Drinking Water Standards”, Arsenic Exposure and Health Effects, Ed.W R Chappell, CO Abernathy and Rebecca L Calderon, Proceedings of the Third InternationalConference on Arsenic Exposure and Health Effects, 1998, San Diego, California.
Smith, A H, E O Lingas and M Rahman (2000), “Contamination of Drinking Water by Arsenic inBangladesh: A Public Health Emergency,” Bulletin of WHO, Vol. 78:1093-103.
16 SANDEE Working Paper No. 27-07
The National Institute of Preventive and Social Medicine (NIPSOM) (2001), The study onArsenicosis patients, NIPSOM, Dhaka, Bangladesh.
Tolley, G and R Fabin (1994), “Future Directions for Health Value Research”, Valuing Healthfor Policy, Ed. G Tolley, D Kenkel and R Fabian, University of Chicago Press: Chicago,USA.
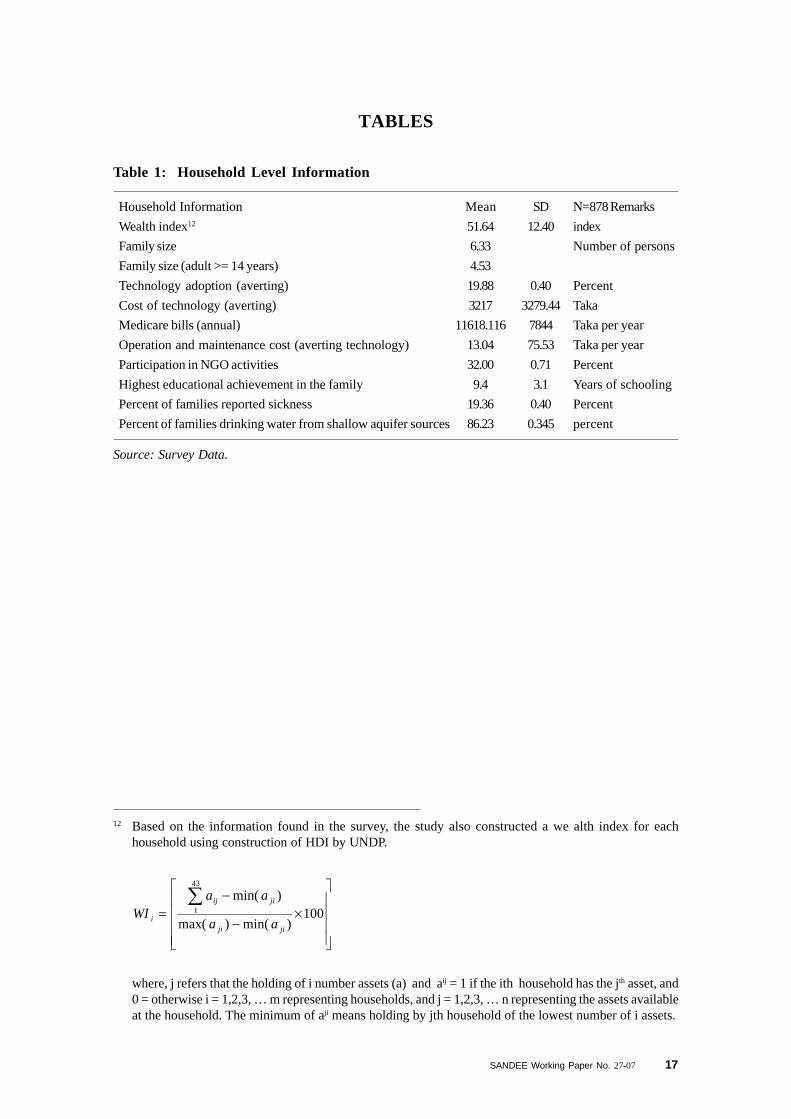
SANDEE Working Paper No. 27-07 17
Household Information Mean SD N=878 Remarks
Wealth index12 51.64 12.40 index
Family size 6.33 Number of persons
Family size (adult >= 14 years) 4.53
Technology adoption (averting) 19.88 0.40 Percent
Cost of technology (averting) 3217 3279.44 Taka
Medicare bills (annual) 11618.116 7844 Taka per year
Operation and maintenance cost (averting technology) 13.04 75.53 Taka per year
Participation in NGO activities 32.00 0.71 Percent
Highest educational achievement in the family 9.4 3.1 Years of schooling
Percent of families reported sickness 19.36 0.40 Percent
Percent of families drinking water from shallow aquifer sources 86.23 0.345 percent
Table 1: Household Level Information
12 Based on the information found in the survey, the study also constructed a we alth index for eachhousehold using construction of HDI by UNDP.
×−
−=
∑100
)min()max(
)min(43
1
jiji
jiij
i aa
aaWI
where, j refers that the holding of i number assets (a) and aij = 1 if the ith household has the jth asset, and0 = otherwise i = 1,2,3, … m representing households, and j = 1,2,3, … n representing the assets availableat the household. The minimum of aji means holding by jth household of the lowest number of i assets.
Source: Survey Data.
TABLES
18 SANDEE Working Paper No. 27-07
Individual Level Information Mean SD N = 5563Comments
Age 27.49 20.251 Years
Gender 50.40 percent Male
Education 5.17 4.150 Years
Percent mitigating 12.21 Percent
Sick days (non working days [WDL]) 5.29 2.016 Days per year
Melanosis (incidence) 3.52 Percent
Keratosis (incidence) 2.77 Percent
Conjunctivitis (incidence) 1.76 Percent
Inflammation of RT (incidence) 1.87 Percent
Hypo-pigmentation (incidence) 2.88 Percent
Hyper Keratosis (incidence) 1.10 Percent
Non-pitting Edema (incidence) 0.43 Percent
Liver and Kidney failure (incidence) 0.068 percent
Different Arsenic Diseases Arsenic-Related Diseases Percent of Cases
Primary Stage Melanosis or black spots in the body 8.6Keratosis or thickening of the palms and soles 34.3Redness of the eye or Conjunctivitis 58.6Inflammation of the respiratory system 45.7Gastrointestinal problem 46.4
Secondary Hypo-pigmentation or white spots 5.7Stage Hyper-Keratosis or nodular growth 15
Swelling of the feet and legs 12.1Peripheral Neuropathy 17.1Liver or kidney disorder 7.1
Tertiary or Gangrene of the distal organs 3.6 Final Stage Cancer of the skin, lung or urine 2.9
Liver or kidney failure 2.1
Table 2: Individual Level Information
Source: Survey 2005
Table 3: Distribution of Arsenic Related Diseases among Sick Households
Source: Survey 2005
SANDEE Working Paper No. 27-07 19
Coeff Std error z-value Marginal effect Std error
AGE 0.0516074 0.0053757 9.6 *** 0.0041361 0.0004057 ***
AGE SQ -0.0004610 0.0000634 -7.27 ***
SEX -0.1049217 0.0610308 -1.72 * -0.0085767 0.0049977 *
EDUC -0.0337094 0.0076790 -4.39 *** -0.0027508 0.0006418 ***
ARSCODE 0.4561030 0.0630928 7.23 *** 0.0467376 0.0077768 ***
CONSTANT -2.5410500 0.1121453 -22.66 ***
Table 4: Estimating the Probability of Sickness (Probit Model)
NOTE: * means significant at 10% level, ** means significant at 5% and*** means significant at 1% level.Number of observations= 5554, LR chi-square (5) = 240.28,Prob > chi-square = 0.0000, Pseudo R2=.1039 Log Likelihood = -1035.6753
Primary Stage
Melanosis -23 / 1000 28 / 10,000 -35 / 100,000 -213 / 100,000
Keratosis -15 / 1000 23 / 10,000 -24 / 100,000 -198 / 100,000
Conjuctivitis -13 / 1000 12 / 10,000 -16 / 100,000 -127 / 100,000
Inflammation -9 / 1000 15 / 10,000 -14 / 100,000 -126 / 100,000of respiratorytracts
Secondary Stage
Raindrop -25 / 1000 22 / 10,000 -26 / 100,000 -13 / 100,000syndrome
Hyper Keratosis -10 / 1000 9/ 10,000 -9 / 100,000 -62 / 100,000
Swelling of -2 / 100,000 7 / 10,000 -3 / 100,000 -9 / 10,000 -9 / 100,000legs and feet women
Table 5: Probability of Reducing Health Impacts by Supplying Arsenic Free Water forDifferent Arsenic-Related Diseases
Disease Name Reduction inNumber ofPatients if
GREEN WaterSources were
Available
Increase inNumber ofPatients for
Every Year ofDelay in
SwitchingWater Source
to GREEN
Reduction inNumber ofPatients byReducingPoverty
GenderSensitivity ofArsenicosis:
Reduction inNumber of
Patients throughEducation(for each
schooling year)
NOTE: Calculation by the Author of this paper based on Probit equations
20 SANDEE Working Paper No. 27-07
Table 6: Estimating Probability of Incurring Medical Costs (Probit Estimates)
Table 7: Calculation of Cost of Illness or Welfare Gain
Coeff Std error z-value Marginal effect Std error
AGE 0.044283 0.008252 5.37 *** 0.001092 0.0001850 ***
AGE SQ -0.000355 0.000091 -3.89 ***
SEX 0.053080 0.093393 0.57 NS 0.001331 0.002344 NS
EDUC -0.031557 0.011711 -2.69 *** -0.000791 0.000306 ***
ARSCODE 0.409407 0.094356 4.34 *** 0.013621 0.003980 ***
CONSTANT -3.113758 0.188855 -16.49 ***
NOTE: * means significant at 10% level, ** means significant at 5% level, and *** means significant at1% level, NS means not significant. Number of observation= 5554, LR chi-square (5) = 92.03,Prob > chi-square = 0.0000, Pseudo R2=.1018, Log Likelihood = -406.03703
Indicators Estimated Value Comments
Average wage 50.623 Weighted Average of Wages
Average sick days loss per individual per year 5.289 Days per year
P(S| DR) 0.0467 Coefficient from Table 4
Mitigating expenditure 11,618.12 Per year
p(m| DR) 0.0136 Coefficient from Table 6
Aver exp -
p (A > 0) 0.0524
Lower Bound of WTP Lower Bound of WTP(In Tk) (In US $ = Tk 59)
Individual per annum 170.51 2.89
Loss on income due to lost work days 12.50 0.21
Mitigating Expenses 158.01 2.68
Household level expenses 1056.82 17.91
Loss on income due to lost work days 56.64 0.96
Mitigating Expenses 1000.18 16.95
Table 8: Lower Bound of Willingness to Pay to Avoid Arsenicosis
Source: Calculation done by the AuthorNOTE: Averting expenditure is not included since it has not been found statistically significant.
SANDEE Working Paper No. 27-07 21
Table 9: Comparison of WTP from Other Studies
Issue for WTP
WTP for arsenic freewater
WTP for Arsenic FreeDrinking Water in RuralBangladesh
WTP for urban clear airin Kanpur, India
WTP for faecal coliformfree drinking water inDelhi, India
Method/Approach
Cost of Illness(Workday loss +Mitigation expenses)(per household)
Contingent valuationmethod(homeconnection)
Contingent valuation(standpost)
Cost of illnessCost of illness
Value per Householdper year
Taka 1056.82 or($17.91)
Taka 2,831.00 or($48.27)
Taka 1572 or ($26.73)
Rs 850.97 ($21)Rs 1094.31 ($26)
Source
This study
JK Ahmad, JK, et. al.,(2002)
Ahmad, JK, et. al.,(2002)
Gupta, Usha (2005)Dasgupta, P (2005)
(1) (2) (3) (4) (5) (6) (7) (8)
LOW 28 1.3076 6.92 350.10 206.61 556.71 9.44
AVERAGE 35 1.6345 8.64 437.62 258.26 695.89 11.79
HIGH 50 2.335 12.35 625.18 368.94 994.12 16.85
Table 10: Total WTP or Welfare Loss of Bangladesh
13 Calculated using weighted average for manufacturing, agriculture and construction wage rates fromnational labor survey
Calculation Notes:Col 3= P (S | ∆R) × Col (2) where P (S | ∆R) = 0.0467 [equation 8.1]Col 4 = Mean [WDL] × Col (3), where mean[WDL], Table 2, row 6.Col 5 = Col 3 × mean[WDL] × Mean[wage], mean[wage=50.6213]Col 6 = Mean [Medical expenses] × P (M | ∆R ) × Col 3, where Mean[Medical exp] from Table 2, row
4, P(M| ∆R) from Equation 9.1.Col 7 = Col 5 + Col 6Col 8 = Col 7 / 59 where 1 US$=59 Taka at the time of survey.
Extent ofAffected
Populationare at
RISK inBangladesh(In Million)
ProbableNumber of
PeopleAffected
(In Million)
TotalNumber ofSick Days
(In Million)
WDL(millionTaka)
MitigatingExpenditure
(millionTaka)
WelfareLoss
(millionTk)
Welfare Loss(million US
$)
22 SANDEE Working Paper No. 27-07
NO
TE:
ME
- M
argi
nal
Eff
ect,
***
deno
tes
coef
fici
ent
is s
igni
fica
nt a
t 1%
lev
el o
f si
gnif
ican
ce,
** d
enot
es s
igni
fica
nce
at 5
%,
and
*den
otes
sig
nifi
canc
e at
10%
.D
epen
dent
var
iabl
e is
the
pro
babi
lity
of b
eing
affe
cted
by
the
dise
ase.
Sour
ce:
Fie
ld S
urve
y.
Tab
le 1
1:P
robi
t E
stim
ates
of
Ars
enic
-Rel
ated
Dis
ease
of
Pri
mar
y an
d Se
cond
ary
Stag
es w
ith
Mar
gina
l E
ffec
ts
Age
in
year
s0.
0489
0.00
280.
0549
0.00
230.
0462
0.00
120.
0518
0.00
150.
0489
0.00
220.
0470
0.00
090.
1339
0.00
072
z va
lue
7.94
***
7.8*
**5.
83**
*6.
47**
*7.
25**
4.77
***
3.64
***
Age
squ
are
-0.0
004
-0.0
005
-0.0
004
-0.0
005
-0.0
004
-0.0
004
-0.0
019
z va
lue
-6.1
1***
-6.1
3***
-4.2
5***
-5.0
6***
-5.5
1**
-3.8
8***
-3.4
4***
AR
SC
OD
E0.
3311
0.02
290.
3050
0.01
540.
3918
0.01
300.
2528
0.00
870.
4242
0.02
490.
3978
0.01
000.
0810
-0.0
0001
(1=
red,
0=gr
een)
z va
lue
4.56
***
3.8*
**4.
23**
*2.
73**
*5.
54**
3.74
***
0.47
Edu
cati
on i
n-0
.037
4-0
.002
1-0
.047
3-0
.002
0-0
.050
3-0
.001
3-0
.043
1-0
.001
3-0
.022
5-0
.001
0-0
.032
9-0
.000
6-0
.033
50.
0002
3y
ears
z va
lue
-4.3
***
-4.8
4***
-4.2
2***
-3.8
6***
-2.4
5**
-2.4
6**
-1.6
Wea
lth
Inde
x-0
.006
2-0
.000
4-0
.005
6-0
.000
2-0
.006
2-0
.000
2-0
.004
8-0
.000
1-0
.005
8-0
.000
3-0
.004
9-0
.000
1-0
.010
5-0
.000
09
z va
lue
-2.1
9**
-1.8
*-1
.67*
-1.3
6-1
.88*
-1.1
2-1
.59
Gen
der
-0.3
366
-0.0
0095
(1=
mal
e,0
=fe
mal
e)
z va
lue
-1.9
8**
Con
stan
t-2
.354
1-2
.580
3-2
.690
2-2
.754
3-2
.612
7-2
.911
0-3
.748
4
z va
lue
-12.
63**
*-1
2.13
***
-10.
67**
*-1
1.23
***
-12.
53**
-9.6
7***
-5.6
2***
No
of o
bs55
6355
6355
6355
6355
6355
6355
63
LR
Chi
-squ
are
156.
8200
159.
7200
123.
4300
108.
9400
142.
4900
59.7
400
42.5
700
Log
Lik
elih
ood
-769
.870
4-6
24.3
782
-431
.230
6-4
62.4
177
-654
.228
8-3
06.0
889
-133
.326
5
Pre
d (p
-Hat
)0.
0245
0.01
690.
0094
0.01
120.
0186
0.00
670.
0007
8at
mea
n
Pri
mar
y S
tage
of
Ars
enic
osis
Sec
onda
ry S
tage
of
Ars
enic
osis
Mel
anos
isK
erat
osis
Con
junc
tivi
tis
Infl
amm
atio
n of
RT
Sw
elli
ng o
f L
egs
and
Pal
ms
Rai
ndro
p sy
ndro
me
Hyp
er-K
erat
osis
Coe
ffM
EC
oeff
ME
Coe
ffM
EC
oeff
ME
Coe
ffM
EC
oeff
ME
Coe
ffM
E
SANDEE Working Paper No. 27-07 23
Name of Type Capital Cost/ Operation and Unit Cost*Technologies Unit Maintenance (Family/Year)
(USD) Costs (USD)
Sono 45 – 25 Filter Household 13 0.5 to 1.5 14
Shapla Filter Household 4 11 15
SAFI Filter Household 40 6 46
Bucket Treatment Household 6 to 8 25 35Unit
Sidko Community 4250 10 66.67(75 Household)
Alternative water supply
Iron-Arsenic Community 200 1 21Removal Plant (10 Household)
Rain Water 30 5 0.151Harvesting
Deep Tube Well 120 4 0.151
Pond Sand Filter 117 15 0.161
Dug Well 102 3 0.256
Piped Water 5872 800 0.375Supply
Arsenic Removal 6000 Household 240000 1 - 1.5 40.00Unit for UrbanWater Supply
Table 12: Unit Cost of Different Types of Arsenic Removal/Mitigating Technologies
Source: worldbank.org/INTSAREGTOPWATRES/Resources/ArsenicVolII_PaperIV.pdfNote: * calculation by author.
24 SANDEE Working Paper No. 27-07
Figure 1: Distribution of Tube Wells with Arsenic Levels
FIGURES
SANDEE Working Paper No. 27-07 25
����������� �����������������������
���� ���
������
��������
���� ����
�
���
!��
���
���
����
Figure 2: Wealth Index of the HH
Figure 3: Marginal Effect by Age
�
����
����
����
����
���
����
� � �� �� �� � � �� �� � � �� �� �� � �
� ���������
���
���
���
��
��
����
��
��
�� �
��
����
��
� ��� ���
26 SANDEE Working Paper No. 27-07
APPENDIX
HH Survey Questionnaire
Economic Research Group (ERG)
And
Department of Economics, North South University
SANDEE Sponsored Research Project
on
“The Economic Cost of Arsenic Contamination in Drinking Water andan Analysis of Coping Strategies for Averting a Social Disaster -
Policy Options for Bangladesh”
1.1.1.1. Information on the Survey Area and Respondents
Village Name : Name of the Investigator:
Ward/ Mouza No : Date of Survey:
Union: Location of the Homestead:
Thana :
District: Name of the Supervisor Signature
StudyCode
Thana Union Village
TW As (Mg/L)
Name of the Head of HH :
DPHE card1= Yes; 2 =No Date
Name of the Respondent: Rel. with HH
1 = Respondent Self, 2 = Husband/ Wife, 3 = Brother / Sister, 4 = Son /Daughter, 5 = Uncle /Aunt,6 = Grand father/ Mother, 7 = Others
SANDEE Working Paper No. 27-07 27
MemberID
1
2
Name ofthe
Members(1,3,5.....
Male;2,4,6,.....Female)
Respondentsown
Respondentsown
Age(Years)
Sex
1 Male2 Female
MaritalStatus
1=NeverMarried
2 = Married3 = Widow /
Widower4 =Divorced5 =Separated
Height(Inch)
Weight(kg)
EducationalAttainment
(Classpassed/
completed)
WorkStatus
*
Relation-ship with
the head ofHH
Collectsor
bringswater
for HHuse
1 = Yes2 = No
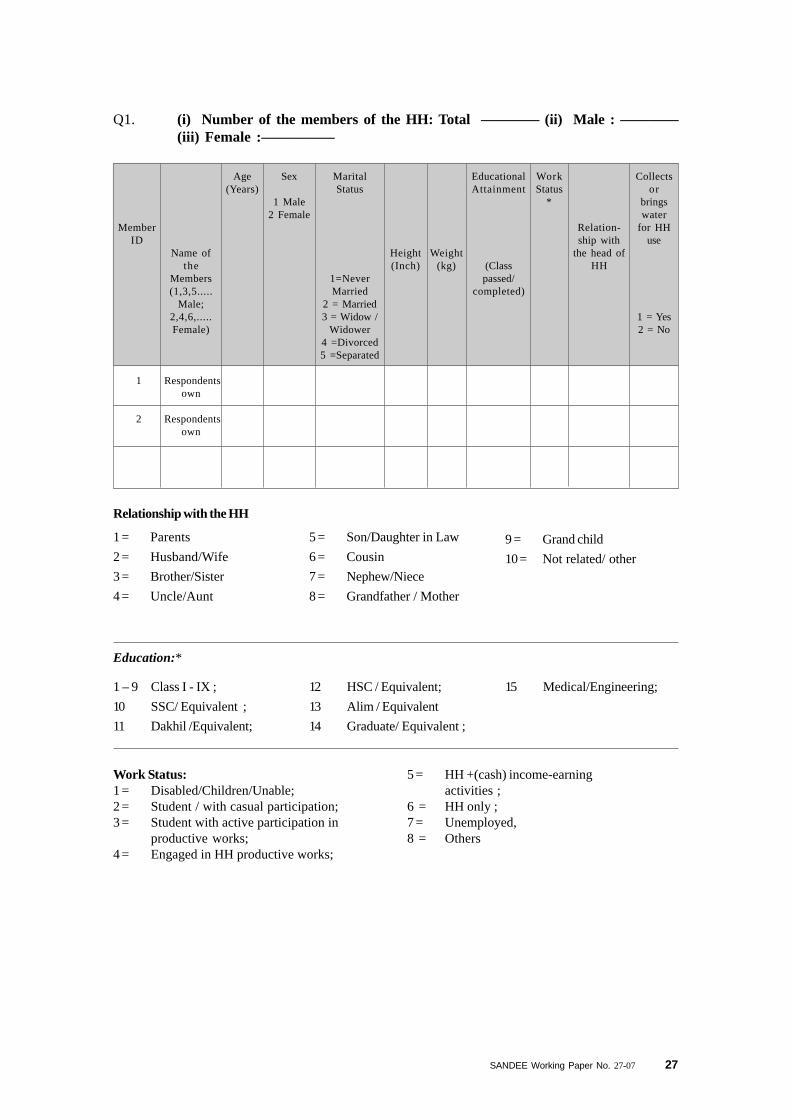
Education:*
Relationship with the HH
1 = Parents
2 = Husband/Wife
3 = Brother/Sister
4 = Uncle/Aunt
5 = Son/Daughter in Law
6 = Cousin
7 = Nephew/Niece
8 = Grandfather / Mother
1 – 9 Class I - IX ;
10 SSC/ Equivalent ;
11 Dakhil /Equivalent;
12 HSC / Equivalent;
13 Alim / Equivalent
14 Graduate/ Equivalent ;
9 = Grand child
10 = Not related/ other
15 Medical/Engineering;
5 = HH +(cash) income-earningactivities ;
6 = HH only ;7 = Unemployed,8 = Others
Work Status:1 = Disabled/Children/Unable;2 = Student / with casual participation;3 = Student with active participation in
productive works;4 = Engaged in HH productive works;
Q1. (i) Number of the members of the HH: Total ———— (ii) Male : ————(iii) Female :—————
28 SANDEE Working Paper No. 27-07
Name of the Assets Assets Code Do You Hold this Asset?1= Yes, 2 = No
Personal living house (Excluding land) 3.1.1
Big tree 3.1.2
Bucket/Lota/Goti 3.1.3
Stove/ Heater/Gas burner 3.1.4
All cooking materials (metallic) 3.1.5
Bed / Khat/ Native bed (Chowki) 3.1.6
Chest of drawer/ Showcase/ Meat safe/Cloth rag or Alna 3.1.7
Table/ Chair/ Bench or Tool 3.1.8
Fan / Electric Iron or Calendar 3.1.9
Radio/ Cassette Player/CD Player 3.1.10
Wall clock/ Wrist Watch 3.1.11
TV/ VCD 3.1.12
Freezer 3.1.13
Ornaments (Gold/ Silver) 3.1.14
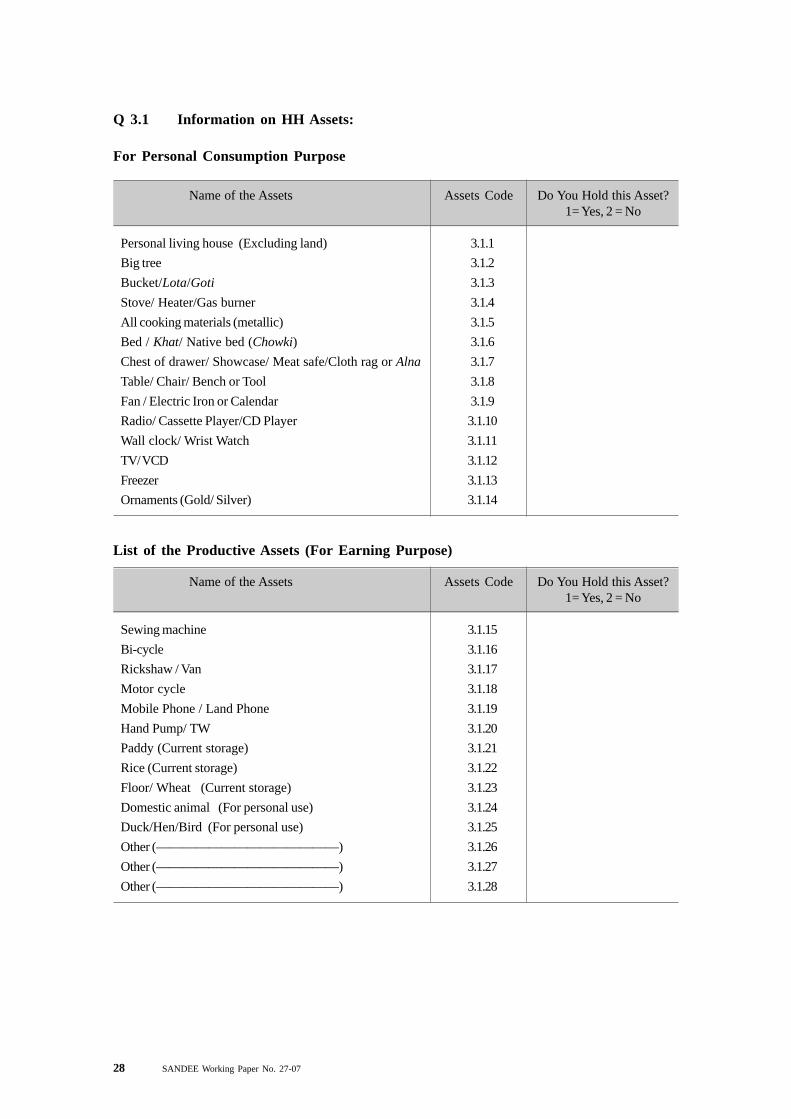
Q 3.1 Information on HH Assets:
For Personal Consumption Purpose
List of the Productive Assets (For Earning Purpose)
Name of the Assets Assets Code Do You Hold this Asset?1= Yes, 2 = No
Sewing machine 3.1.15
Bi-cycle 3.1.16
Rickshaw / Van 3.1.17
Motor cycle 3.1.18
Mobile Phone / Land Phone 3.1.19
Hand Pump/ TW 3.1.20
Paddy (Current storage) 3.1.21
Rice (Current storage) 3.1.22
Floor/ Wheat (Current storage) 3.1.23
Domestic animal (For personal use) 3.1.24
Duck/Hen/Bird (For personal use) 3.1.25
Other (——————————————) 3.1.26
Other (——————————————) 3.1.27
Other (——————————————) 3.1.28
SANDEE Working Paper No. 27-07 29
Name of the Assets Assets Code Do You Hold this Asset?1= Yes, 2 = No
Sewing machine 3.1.29
Rickshaw / Van 3.1.30
Mobile phone / Land phone 3.1.31
Fishing net 3.1.32
Electric iron 3.1.33
Hand pump / TW 3.1.34
Irrigation equipments 3.1.35
Boat 3.1.36
Cattle 3.1.37
Duck and hen 3.1.38
Other agricultural equipments 3.1.39
Other vehicle 3.1.40
Charcoal machine 3.1.41
Others (---------------------------) 3.1.42
Name of theend-uses
Drinking
Washing
Bathing
Cooking
Irrigation
Others(Gardening,and others)
Sources ofEnd-Uses(Code*)
No. of Years in Use
Years
CurrentOwnership
Pattern
1 Govt.2 NGO
3 Community4 Personal
5 Institutionand others
For how longthe current
ownership isprevalent
In Years
Prior Source
1 Govt. 2 NGO
3 Community4 Personal
5 Institutionand others
Ownership
1 Govt.2 NGO
3 Community4 Personal
5 Institutionand others
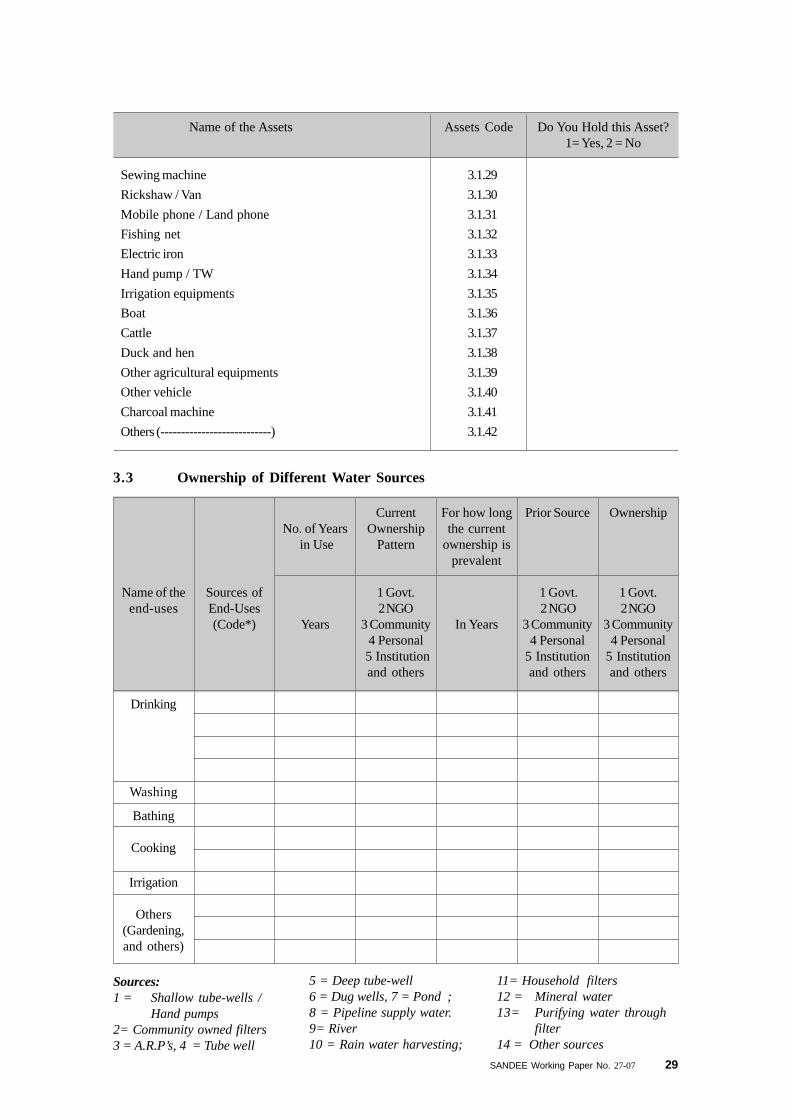
3.3 Ownership of Different Water Sources
Sources:1 = Shallow tube-wells /
Hand pumps2= Community owned filters3 = A.R.P’s, 4 = Tube well
5 = Deep tube-well6 = Dug wells, 7 = Pond ;8 = Pipeline supply water.9= River10 = Rain water harvesting;
11= Household filters12 = Mineral water13= Purifying water through
filter14 = Other sources
30 SANDEE Working Paper No. 27-07
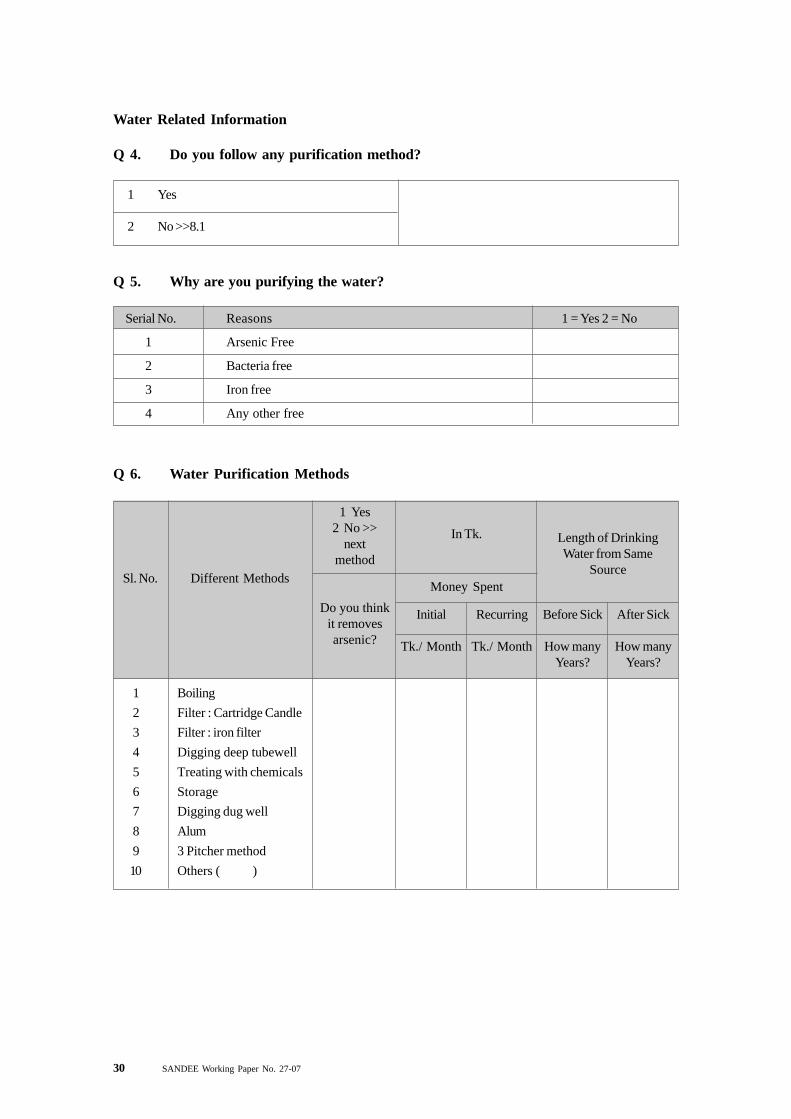
Water Related Information
Q 4. Do you follow any purification method?
1 Yes
2 No >>8.1
Q 5. Why are you purifying the water?
Serial No. Reasons 1 = Yes 2 = No
1 Arsenic Free
2 Bacteria free
3 Iron free
4 Any other free
Q 6. Water Purification Methods
1 Boiling
2 Filter : Cartridge Candle
3 Filter : iron filter
4 Digging deep tubewell
5 Treating with chemicals
6 Storage
7 Digging dug well
8 Alum
9 3 Pitcher method
10 Others ( )
Sl. No. Different Methods
1 Yes2 No >>
nextmethod
Do you thinkit removesarsenic?
In Tk.
Money Spent
Length of DrinkingWater from Same
Source
Initial
Tk./ Month
Recurring
Tk./ Month
Before Sick
How manyYears?
After Sick
How manyYears?
SANDEE Working Paper No. 27-07 31
1 Drinking Dry season Wet season Dry season Wet season
2 Cooking
3 Washing utensils
4 Bathing
5 Irrigation/Gardening
6 Animal washing
7 Others
Serial No.
End Uses
Collection Cost per HH
Tk./ Month
Quantity of Water Usedper Day
Initial
Tk./ Month
Recurring
Tk./ Month
Before Sick
How manyYears?
After Sick
How manyYears?
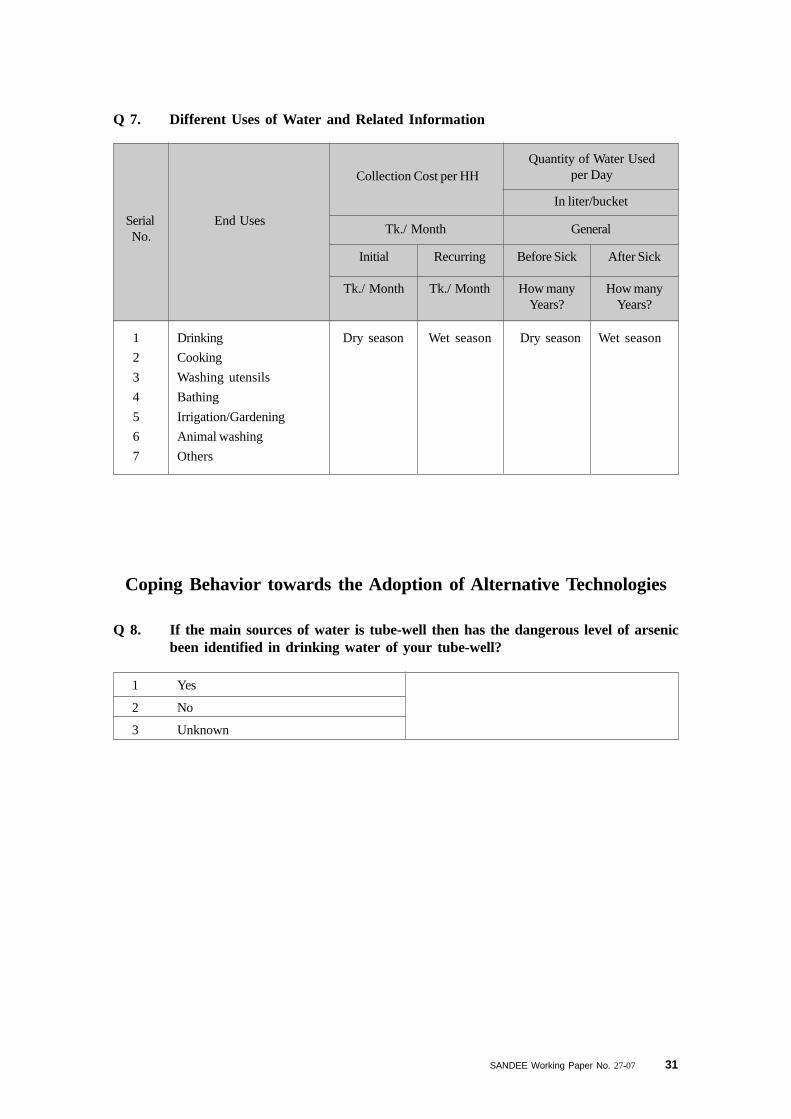
Q 7. Different Uses of Water and Related Information
General
In liter/bucket
Q 8. If the main sources of water is tube-well then has the dangerous level of arsenicbeen identified in drinking water of your tube-well?
1 Yes
2 No
3 Unknown
Coping Behavior towards the Adoption of Alternative Technologies
32 SANDEE Working Paper No. 27-07
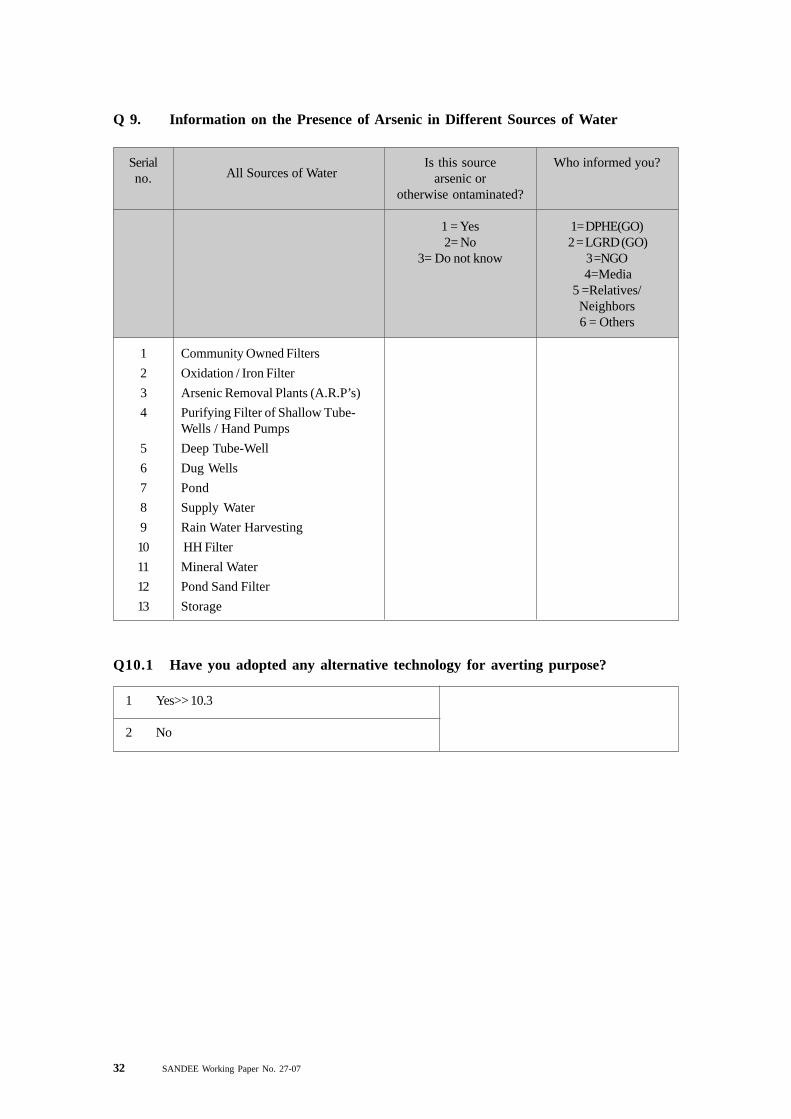
Q 9. Information on the Presence of Arsenic in Different Sources of Water
Serialno. All Sources of Water
Is this sourcearsenic or
otherwise ontaminated?
1 = Yes2= No
3= Do not know
Who informed you?
1= DPHE(GO) 2 = LGRD (GO)
3 =NGO 4=Media
5 =Relatives/Neighbors6 = Others
1 Community Owned Filters
2 Oxidation / Iron Filter
3 Arsenic Removal Plants (A.R.P’s)
4 Purifying Filter of Shallow Tube-Wells / Hand Pumps
5 Deep Tube-Well
6 Dug Wells
7 Pond
8 Supply Water
9 Rain Water Harvesting
10 HH Filter
11 Mineral Water
12 Pond Sand Filter
13 Storage
Q10.1 Have you adopted any alternative technology for averting purpose?
1 Yes>> 10.3
2 No
SANDEE Working Paper No. 27-07 33
Sl. No 1 Yes 2 No >> Q (III)
1 Community Owned Filters
2 Oxidation / Iron Filter
3 Arsenic Removal Plants (A.R.P’s)
4 Purifying Filter of ShallowTube-Wells / Hand Pumps
5 Deep Tube-Well
6 Dug Wells
7 Pond
8 Supply Water
9 Rain Water Harvesting
10 HH Filter
11 Mineral Water
12 Pond Sand Filter
13 Storage
14 Other ( )
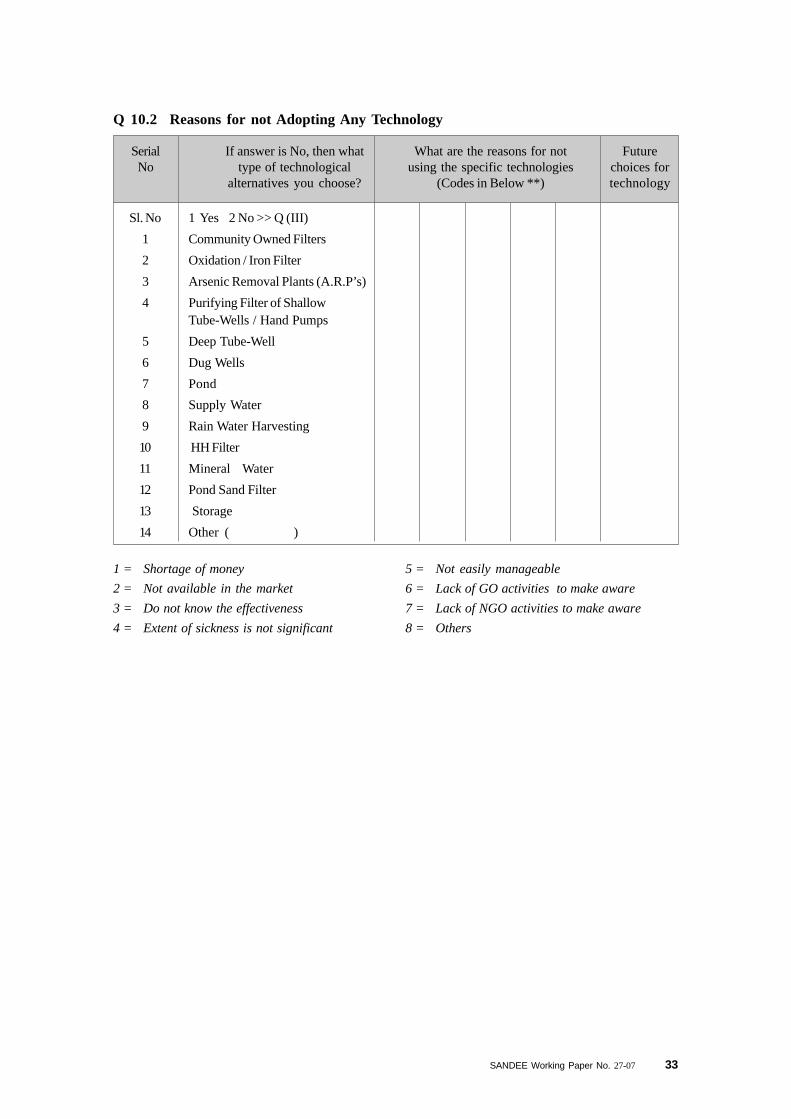
Q 10.2 Reasons for not Adopting Any Technology
SerialNo
If answer is No, then whattype of technological
alternatives you choose?
Futurechoices fortechnology
What are the reasons for notusing the specific technologies
(Codes in Below **)
1 = Shortage of money
2 = Not available in the market
3 = Do not know the effectiveness
4 = Extent of sickness is not significant
5 = Not easily manageable
6 = Lack of GO activities to make aware
7 = Lack of NGO activities to make aware
8 = Others
34 SANDEE Working Paper No. 27-07
1 2 3 4 5 6 7 8 9 10
11
12
Com
mun
ity
Ow
ned
filt
ers
Oxi
dati
on /
Iro
n F
ilte
r
Ars
enic
Rem
oval
Pla
nts
(A.R
.P’s
)
Pur
ifyi
ng F
ilte
r of
Sha
llow
Tub
e-W
ells
Dee
p T
ube-
Wel
l
Dug
Wel
ls
Tap
Wat
er
Sup
ply
Rai
n W
ater
Har
vest
ing
HH
Fil
ter
for
Pur
ifyi
ng
Pon
d S
and
Fil
ter
Sto
rage
Oth
er (
)
Do
you
use
the
foll
owin
gte
ch?
1 =
Yea
s;2
=N
o
10.3
.110
.3.2
10.3
.310
.3.4
10.3
.510
.3.6
10.3
.710
.3.8
10.3
.910
.3.1
010
.3.1
1 10
.3.1
2 10
.3.1
3 10
..3.1
4
Ser
ial
No
If a
nsw
er i
s ye
s, t
hen
at p
rese
nt
Ow
ners
hip
If
HH
has
per
sona
l te
chno
logy
, th
en
For
how
man
y
year
s ha
ve y
ou
been
usi
ng?
Nam
e of
all
sou
rces
of t
he d
rink
ing
wat
er
Do
you
coll
ect
wat
er
from
the
outs
ide
of
the
ho
use
?
From
how
far
do y
ou
coll
ect
wat
er?
Mai
nten
ance
cost
Sou
rce
of t
he e
xpen
ses
Cos
ts t
o
esta
blis
h
the
tech
nolo
gy
Col
lect
ion
cost
s
How
muc
h
tim
e do
you
spen
d
dai
ly?
1 =
Ind
efin
ite
2 =
Yea
r
Cod
eY
ear
1 =
Yes
,
2 =
No
>>
10.2
.9
Tk
./Y
ear
Cod
eT
k.
1 =
Per
sona
l
2 =
Gov
t.
3 =
NG
O
4 =
Com
mun
ity
(T
aka)
Hou
r/
day
In
met
er
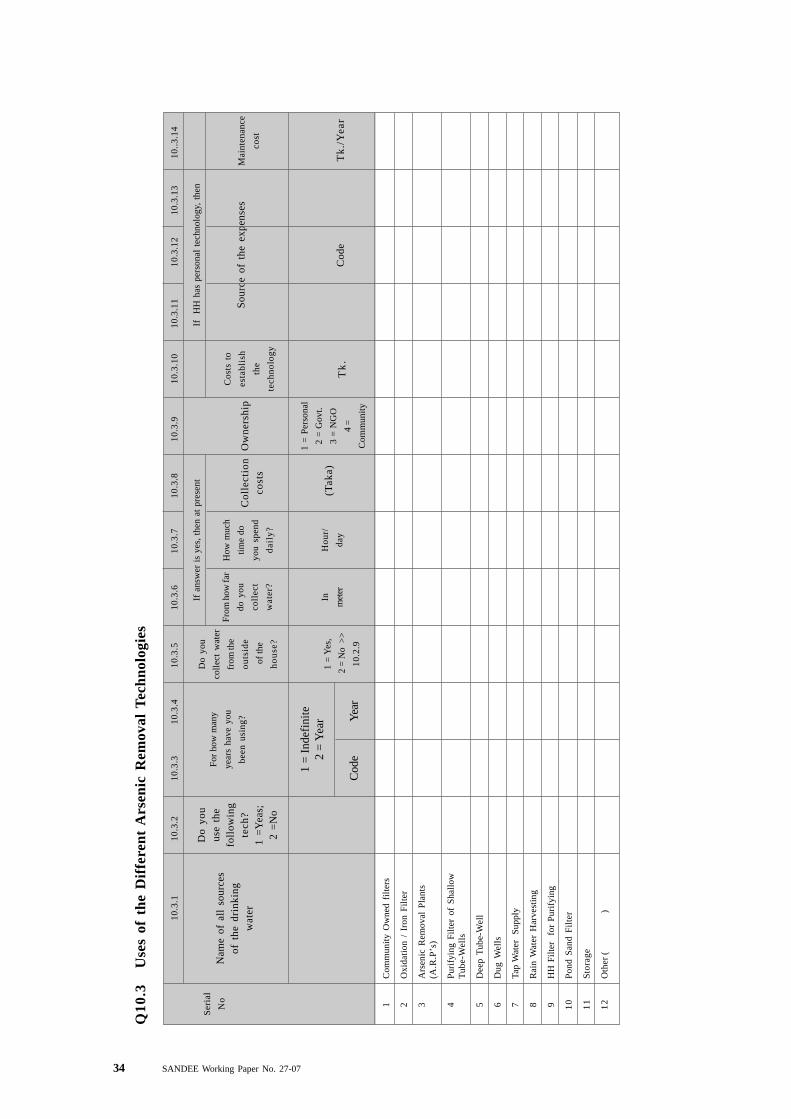
Q10
.3U
ses
of t
he D
iffe
rent
Ars
enic
Rem
oval
Tec
hnol
ogie
s
SANDEE Working Paper No. 27-07 35
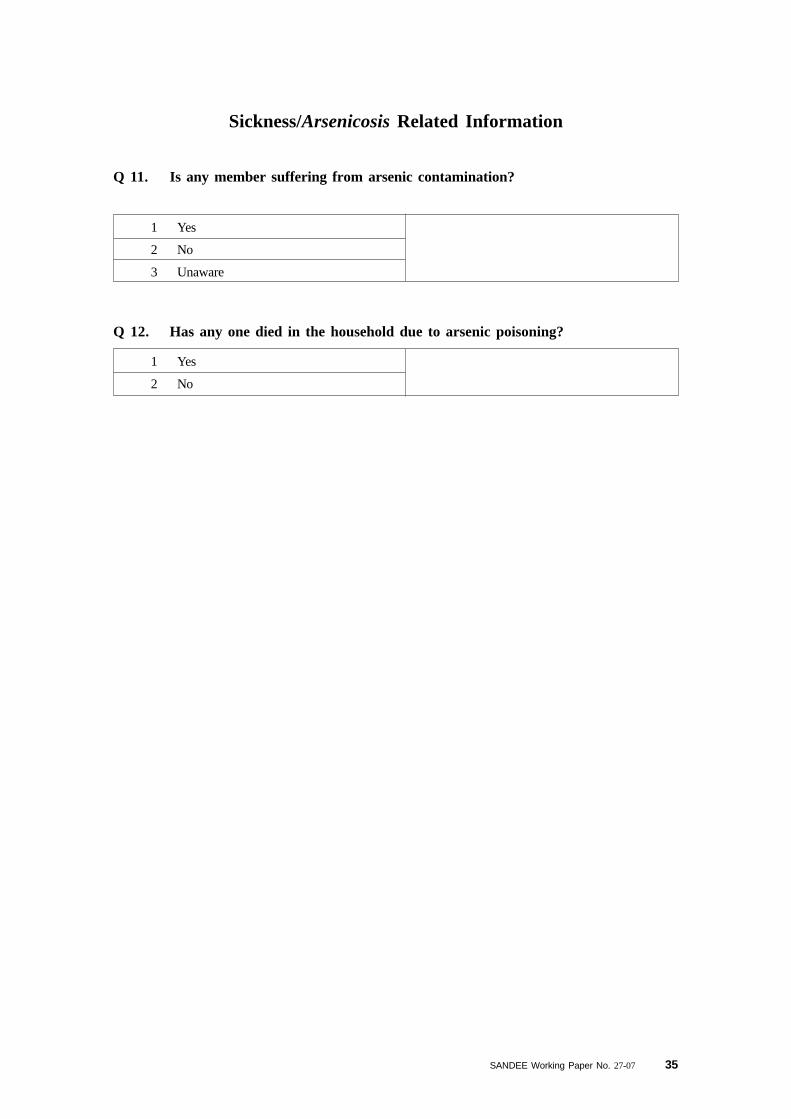
1 Yes
2 No
3 Unaware
Sickness/Arsenicosis Related Information
Q 11. Is any member suffering from arsenic contamination?
1 Yes
2 No
Q 12. Has any one died in the household due to arsenic poisoning?
36 SANDEE Working Paper No. 27-07
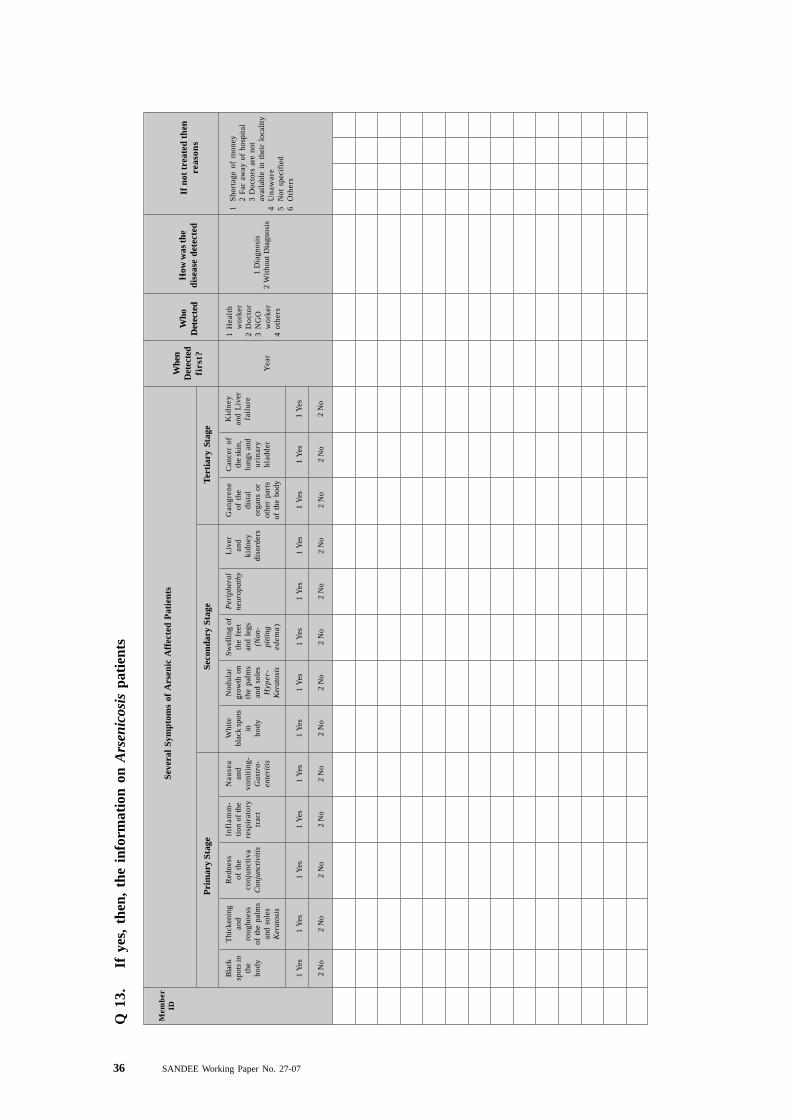
Q 1
3.If
yes
, th
en,
the
info
rmat
ion
on A
rsen
icos
is p
atie
nts
Seve
ral
Sym
ptom
s of
Ars
enic
Aff
ecte
d P
atie
nts
Whe
nD
etec
ted
firs
t?
Who
Det
ecte
dH
ow w
as th
edi
seas
e de
tect
edIf
not
tre
ated
the
nre
ason
sP
rim
ary
Stag
eSe
cond
ary
Stag
eT
erti
ary
Stag
e
Bla
cksp
ots
inth
ebo
dy
1 Y
es
2 N
o
Thi
cken
ing
and
roug
hnes
sof
the
pal
ms
and
sole
sK
erat
osis
1 Y
es
2 N
o
Mem
ber
ID
Red
ness
of t
heco
njun
ctiv
aC
onju
ncti
viti
s
1 Y
es
2 N
o
Infl
amm
-ti
on o
f th
ere
spir
ator
ytr
act
1 Y
es
2 N
o
Nau
sea
and
vom
itin
g-G
astr
o-en
teri
tis
1 Y
es
2 N
o
Whi
tebl
ack
spot
sin
body
1 Y
es
2 N
o
Nod
ular
grow
th o
nth
e pa
lms
and
sole
sH
yper
-K
erat
osis
1 Y
es
2 N
o
Sw
elli
ng o
fth
e fe
etan
d le
gs(N
on-
pitt
ing
edem
a)
1 Y
es
2 N
o
Per
iphe
ral
neur
opat
hy
1 Y
es
2 N
o
Liv
eran
dki
dney
diso
rder
s
1 Y
es
2 N
o
Gan
gren
eof
the
dist
alor
gans
or
othe
r pa
rts
of t
he b
ody
1 Y
es
2 N
o
Can
cer
ofth
e sk
in,
lung
s an
du
rin
ary
blad
der
1 Y
es
2 N
o
Yea
r
1H
ealt
hw
orke
r2
Doc
tor
3N
GO
wor
ker
4ot
hers
Kid
ney
and
Liv
erfa
ilur
e
1 Y
es
2 N
o
1 D
iagn
osis
2 W
itho
ut D
iagn
osis
1S
hort
age
of m
oney
2 F
ar a
way
of
hosp
ital
3 D
octo
rs a
re n
otav
aila
ble
in t
heir
loc
alit
y4
Un
awar
e5
Not
spe
cifi
ed6
Oth
ers
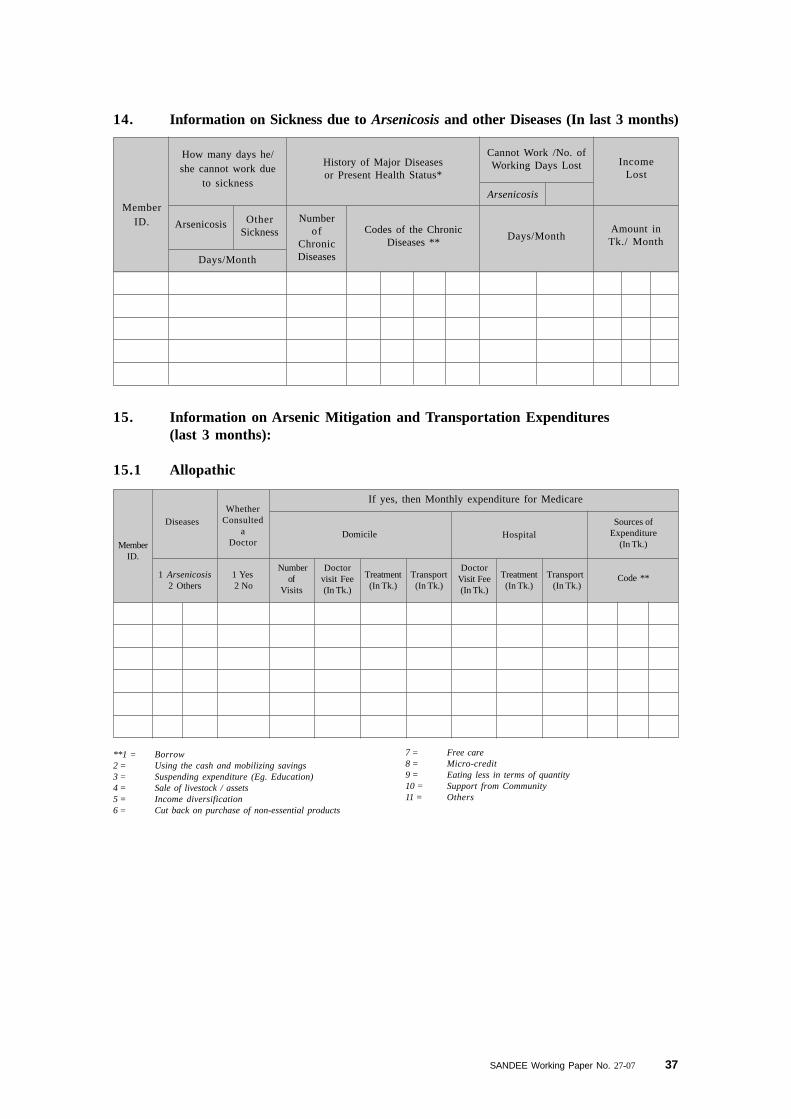
SANDEE Working Paper No. 27-07 37
15. Information on Arsenic Mitigation and Transportation Expenditures(last 3 months):
15.1 Allopathic
**1 = Borrow2 = Using the cash and mobilizing savings3 = Suspending expenditure (Eg. Education)4 = Sale of livestock / assets5 = Income diversification6 = Cut back on purchase of non-essential products
7 = Free care8 = Micro-credit9 = Eating less in terms of quantity10 = Support from Community11 = Others
14. Information on Sickness due to Arsenicosis and other Diseases (In last 3 months)
IncomeLost
MemberID.
How many days he/she cannot work due
to sickness
OtherSickness
Arsenicosis
Days/Month
History of Major Diseasesor Present Health Status*
Numberof
ChronicDiseases
Codes of the ChronicDiseases **
Days/MonthAmount inTk./ Month
Cannot Work /No. ofWorking Days Lost
Arsenicosis
MemberID.
DiseasesWhether
Consulteda
Doctor
If yes, then Monthly expenditure for Medicare
HospitalSources of
Expenditure(In Tk.)
Domicile
1 Arsenicosis2 Others
1 Yes 2 No
Numberof
Visits
Doctorvisit Fee(In Tk.)
Treatment(In Tk.)
Transport(In Tk.)
DoctorVisit Fee(In Tk.)
Treatment(In Tk.)
Transport (In Tk.)
Code **
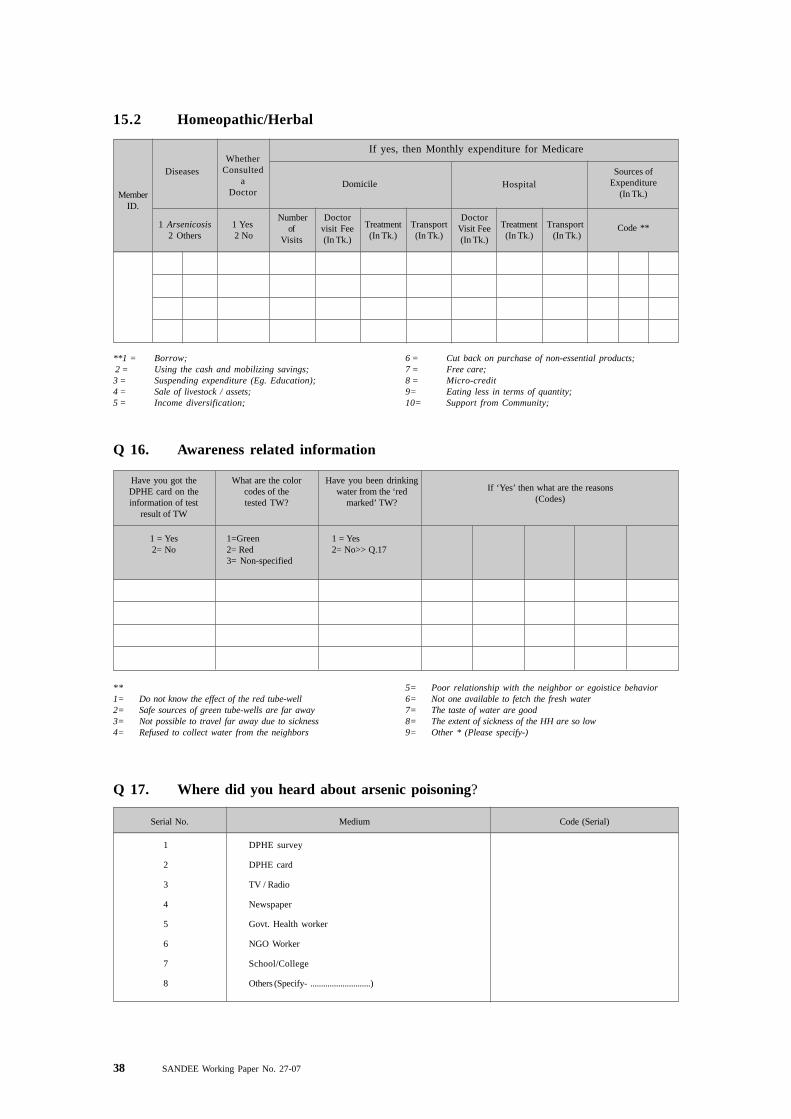
38 SANDEE Working Paper No. 27-07
MemberID.
DiseasesWhether
Consulteda
Doctor
If yes, then Monthly expenditure for Medicare
HospitalSources of
Expenditure(In Tk.)
Domicile
1 Arsenicosis2 Others
1 Yes 2 No
Numberof
Visits
Doctorvisit Fee(In Tk.)
Treatment(In Tk.)
Transport(In Tk.)
DoctorVisit Fee(In Tk.)
Treatment(In Tk.)
Transport (In Tk.)
Code **
15.2 Homeopathic/Herbal
**1 = Borrow; 2 = Using the cash and mobilizing savings;3 = Suspending expenditure (Eg. Education);4 = Sale of livestock / assets;5 = Income diversification;
6 = Cut back on purchase of non-essential products;7 = Free care;8 = Micro-credit9= Eating less in terms of quantity;10= Support from Community;
Q 16. Awareness related information
Have you got theDPHE card on theinformation of test
result of TW
1 = Yes2= No
What are the colorcodes of thetested TW?
1=Green2= Red3= Non-specified
Have you been drinkingwater from the ‘red
marked’ TW?
1 = Yes2= No>> Q.17
If ‘Yes’ then what are the reasons(Codes)
**1= Do not know the effect of the red tube-well2= Safe sources of green tube-wells are far away3= Not possible to travel far away due to sickness4= Refused to collect water from the neighbors
5= Poor relationship with the neighbor or egoistice behavior6= Not one available to fetch the fresh water7= The taste of water are good8= The extent of sickness of the HH are so low9= Other * (Please specify-)
Serial No. Medium Code (Serial)
1 DPHE survey
2 DPHE card
3 TV / Radio
4 Newspaper
5 Govt. Health worker
6 NGO Worker
7 School/College
8 Others (Specify- ............................)
Q 17. Where did you heard about arsenic poisoning?
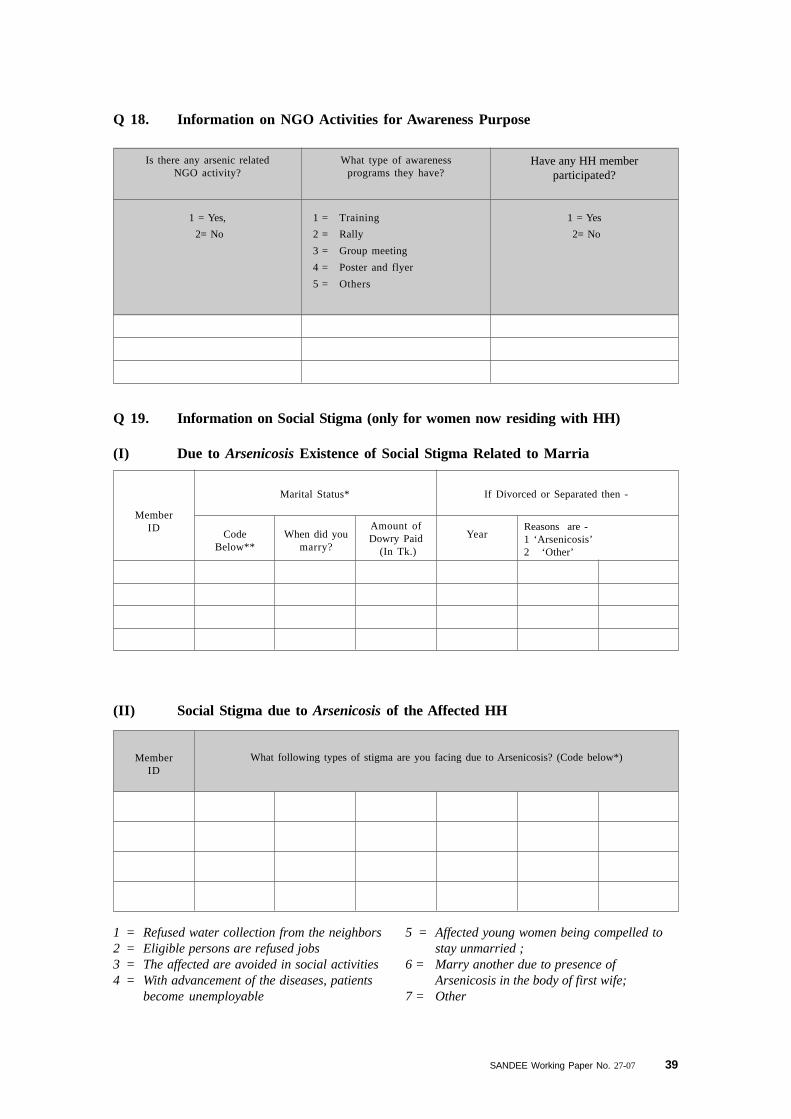
SANDEE Working Paper No. 27-07 39
Q 19. Information on Social Stigma (only for women now residing with HH)
(I) Due to Arsenicosis Existence of Social Stigma Related to Marria
Q 18. Information on NGO Activities for Awareness Purpose
Is there any arsenic relatedNGO activity?
What type of awarenessprograms they have?
Have any HH memberparticipated?
1 = Yes,
2= No
1 = Training
2 = Rally
3 = Group meeting
4 = Poster and flyer
5 = Others
1 = Yes
2= No
MemberID
Marital Status* If Divorced or Separated then -
When did youmarry?
CodeBelow**
YearAmount ofDowry Paid
(In Tk.)
Reasons are -1 ‘Arsenicosis’2 ‘Other’
1 = Refused water collection from the neighbors2 = Eligible persons are refused jobs3 = The affected are avoided in social activities4 = With advancement of the diseases, patients
become unemployable
(II) Social Stigma due to Arsenicosis of the Affected HH
5 = Affected young women being compelled tostay unmarried ;
6 = Marry another due to presence ofArsenicosis in the body of first wife;
7 = Other
MemberID
What following types of stigma are you facing due to Arsenicosis? (Code below*)