Embed Size (px)
Citation preview
© 2015 EAGE www.firstbreak.org 75
special topicfirst break volume 33, November 2015
Marine Seismic
1 ION Geophysical.* Corresponding author, E-mail: [email protected]
Managing simultaneous operations during seismic acquisition
Gary Pemberton1*, Stuart Darling1, Cornelia Koehler1 and Emma McDonald1 describe a soft-ware solution that provides both a spatial and temporal overview of all known activities in the area in near real time, allowing a safe and efficient seismic operation.
I t is increasingly common for seismic surveys to take place among busy and complex operating fields. The variety and intricacy of simultaneous operations (SIMOPS) con-siderations have increased dramatically as oilfields and
their infrastructure have developed. The implications of these disruptions range from unnecessary delays and downtime to a compromising of data quality. These effects are both undesirable and costly, prolonging surveys and increasing HSE exposure.
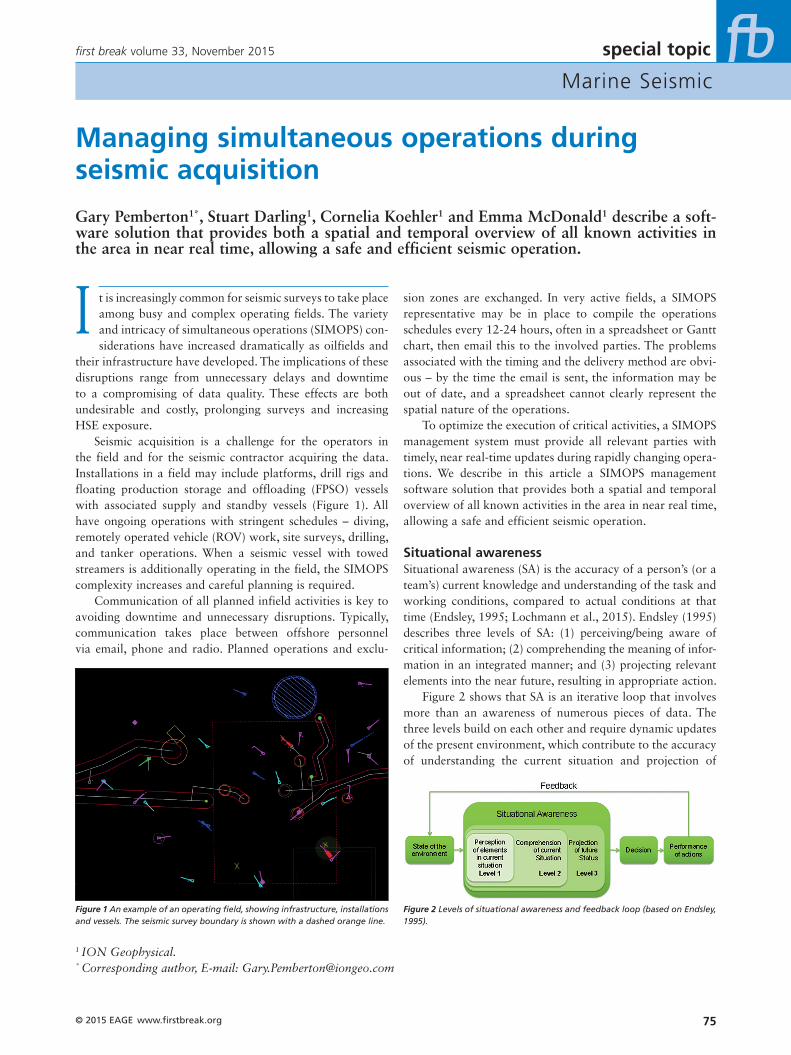
Seismic acquisition is a challenge for the operators in the field and for the seismic contractor acquiring the data. Installations in a field may include platforms, drill rigs and floating production storage and offloading (FPSO) vessels with associated supply and standby vessels (Figure 1). All have ongoing operations with stringent schedules – diving, remotely operated vehicle (ROV) work, site surveys, drilling, and tanker operations. When a seismic vessel with towed streamers is additionally operating in the field, the SIMOPS complexity increases and careful planning is required.
Communication of all planned infield activities is key to avoiding downtime and unnecessary disruptions. Typically, communication takes place between offshore personnel via email, phone and radio. Planned operations and exclu-
sion zones are exchanged. In very active fields, a SIMOPS representative may be in place to compile the operations schedules every 12-24 hours, often in a spreadsheet or Gantt chart, then email this to the involved parties. The problems associated with the timing and the delivery method are obvi-ous – by the time the email is sent, the information may be out of date, and a spreadsheet cannot clearly represent the spatial nature of the operations.
To optimize the execution of critical activities, a SIMOPS management system must provide all relevant parties with timely, near real-time updates during rapidly changing opera-tions. We describe in this article a SIMOPS management software solution that provides both a spatial and temporal overview of all known activities in the area in near real time, allowing a safe and efficient seismic operation.
Situational awarenessSituational awareness (SA) is the accuracy of a person’s (or a team’s) current knowledge and understanding of the task and working conditions, compared to actual conditions at that time (Endsley, 1995; Lochmann et al., 2015). Endsley (1995) describes three levels of SA: (1) perceiving/being aware of critical information; (2) comprehending the meaning of infor-mation in an integrated manner; and (3) projecting relevant elements into the near future, resulting in appropriate action.
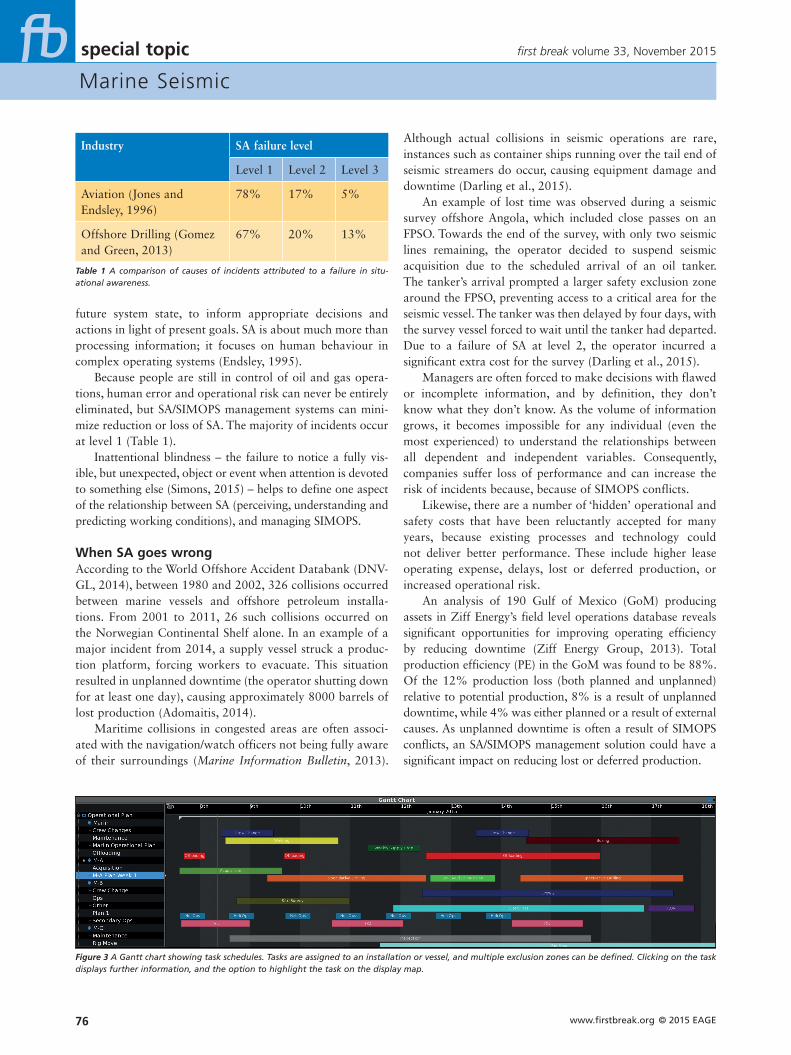
Figure 2 shows that SA is an iterative loop that involves more than an awareness of numerous pieces of data. The three levels build on each other and require dynamic updates of the present environment, which contribute to the accuracy of understanding the current situation and projection of
Figure 1 An example of an operating field, showing infrastructure, installations and vessels. The seismic survey boundary is shown with a dashed orange line.
Figure 2 Levels of situational awareness and feedback loop (based on Endsley, 1995).
special topic
Marine Seismic
www.firstbreak.org © 2015 EAGE76
first break volume 33, November 2015
Although actual collisions in seismic operations are rare, instances such as container ships running over the tail end of seismic streamers do occur, causing equipment damage and downtime (Darling et al., 2015).
An example of lost time was observed during a seismic survey offshore Angola, which included close passes on an FPSO. Towards the end of the survey, with only two seismic lines remaining, the operator decided to suspend seismic acquisition due to the scheduled arrival of an oil tanker. The tanker’s arrival prompted a larger safety exclusion zone around the FPSO, preventing access to a critical area for the seismic vessel. The tanker was then delayed by four days, with the survey vessel forced to wait until the tanker had departed. Due to a failure of SA at level 2, the operator incurred a significant extra cost for the survey (Darling et al., 2015).
Managers are often forced to make decisions with flawed or incomplete information, and by definition, they don’t know what they don’t know. As the volume of information grows, it becomes impossible for any individual (even the most experienced) to understand the relationships between all dependent and independent variables. Consequently, companies suffer loss of performance and can increase the risk of incidents because, because of SIMOPS conflicts.
Likewise, there are a number of ‘hidden’ operational and safety costs that have been reluctantly accepted for many years, because existing processes and technology could not deliver better performance. These include higher lease operating expense, delays, lost or deferred production, or increased operational risk.
An analysis of 190 Gulf of Mexico (GoM) producing assets in Ziff Energy’s field level operations database reveals significant opportunities for improving operating efficiency by reducing downtime (Ziff Energy Group, 2013). Total production efficiency (PE) in the GoM was found to be 88%. Of the 12% production loss (both planned and unplanned) relative to potential production, 8% is a result of unplanned downtime, while 4% was either planned or a result of external causes. As unplanned downtime is often a result of SIMOPS conflicts, an SA/SIMOPS management solution could have a significant impact on reducing lost or deferred production.
future system state, to inform appropriate decisions and actions in light of present goals. SA is about much more than processing information; it focuses on human behaviour in complex operating systems (Endsley, 1995).
Because people are still in control of oil and gas opera-tions, human error and operational risk can never be entirely eliminated, but SA/SIMOPS management systems can mini-mize reduction or loss of SA. The majority of incidents occur at level 1 (Table 1).
Inattentional blindness – the failure to notice a fully vis-ible, but unexpected, object or event when attention is devoted to something else (Simons, 2015) – helps to define one aspect of the relationship between SA (perceiving, understanding and predicting working conditions), and managing SIMOPS.
When SA goes wrongAccording to the World Offshore Accident Databank (DNV-GL, 2014), between 1980 and 2002, 326 collisions occurred between marine vessels and offshore petroleum installa-tions. From 2001 to 2011, 26 such collisions occurred on the Norwegian Continental Shelf alone. In an example of a major incident from 2014, a supply vessel struck a produc-tion platform, forcing workers to evacuate. This situation resulted in unplanned downtime (the operator shutting down for at least one day), causing approximately 8000 barrels of lost production (Adomaitis, 2014).
Maritime collisions in congested areas are often associ-ated with the navigation/watch officers not being fully aware of their surroundings (Marine Information Bulletin, 2013).
Industry SA failure level
Level 1 Level 2 Level 3
Aviation (Jones and Endsley, 1996)
78% 17% 5%
Offshore Drilling (Gomez and Green, 2013)
67% 20% 13%
Table 1 A comparison of causes of incidents attributed to a failure in situ-ational awareness.
Figure 3 A Gantt chart showing task schedules. Tasks are assigned to an installation or vessel, and multiple exclusion zones can be defined. Clicking on the task displays further information, and the option to highlight the task on the display map.
special topic
Marine Seismic
© 2015 EAGE www.firstbreak.org 77
first break volume 33, November 2015
A complete interactive operational overview is presented both temporally and spatially. Using data hosting, the appli-cation is updated in near real time and all users are therefore continuously informed on current and upcoming operations.
Superimposed on the map are Automatic Identification System (AIS) locations from all vessels operating within the prescribed area. There is an option to overlay radar, a valu-able feature in areas with a high number of smaller vessels (such as barges and fishing vessels) with no AIS transmitter. Radar targets can be identified and labelled, enabling all SIMOPS activities to be visible on a single screen.
The software can be installed and run on any operation within the survey area – such as seismic survey vessels, instal-lations, FPSOs, supply vessels and ROV vessels.
Rules based systemMarlin uses a knowledge-based, rules-based monitoring sys-tem. The knowledge base is comprised of user-defined facts:n Facts include static and dynamic vessel position (includ-
ing seismic equipment), installation position, acquisition and other operational plans;
SIMOPS Management – the software solutionIn order for SIMOPS to be managed safely and efficiently, SA is important. The given examples demonstrate this, and indicate how difficult it can be to judge situations, due to the infield complexity. It is therefore essential to minimize the human error due to lack of understanding of the present conditions, limited information, or fatigue.
It is generally accepted that manual processes are better than no processes and that properly implemented automated processes are better than manual ones. Automated system controls increase the efficiency of operations and improve accuracy in addition to being more reliable (Protiviti, 2011). Their execution is not subject to human error. Endsley (1995) argues that systems should be designed to support and enhance SA.
Utilizing its extensive experience of planning, acquiring and optimizing seismic surveys, ION has developed a new SIMOPS management system with SA at its core. Marlin is aimed at improving safety and efficiency of all infield opera-tions, including seismic surveys (Darling et al., 2015).
An interactive Gantt chart containing all known opera-tions is created (Figure 3) and dynamically linked to a map display showing the entire infrastructure of the area (Figure 4). This real-time and dynamic link between the map and Gantt chart is key to improving the users’ SA.
Tasks (operations) entered in the Gantt chart are visible on the map (with associated exclusion zones) and detailed information can quickly be displayed (Figure 5).
Seismic plans can be entered, enabling all parties to see the predicted position of the survey vessel and streamer array for the duration of the future plan. It is possible to time slide forward in the Gantt chart, making future operations, exclu-sion zones and potential conflicts visible on the map. Future conflicts can then be identified and mitigated in advance, through discussions between the involved parties. In the longer-term, it is possible to identify upcoming SIMOPS events that may prevent access to areas within the survey. This allows accurate prioritization, and planning of a survey with minimal downtime for both the seismic survey and the infield operators.
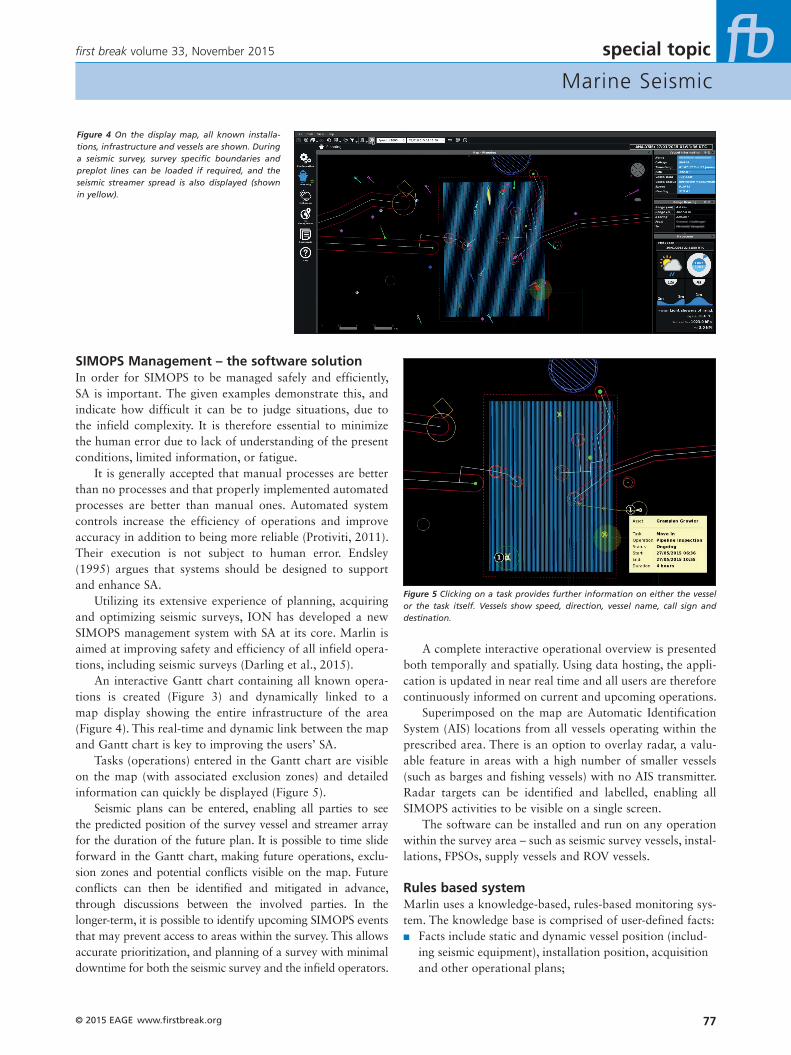
Figure 4 On the display map, all known installa-tions, infrastructure and vessels are shown. During a seismic survey, survey specific boundaries and preplot lines can be loaded if required, and the seismic streamer spread is also displayed (shown in yellow).
Figure 5 Clicking on a task provides further information on either the vessel or the task itself. Vessels show speed, direction, vessel name, call sign and destination.
special topic
Marine Seismic
www.firstbreak.org © 2015 EAGE78
first break volume 33, November 2015
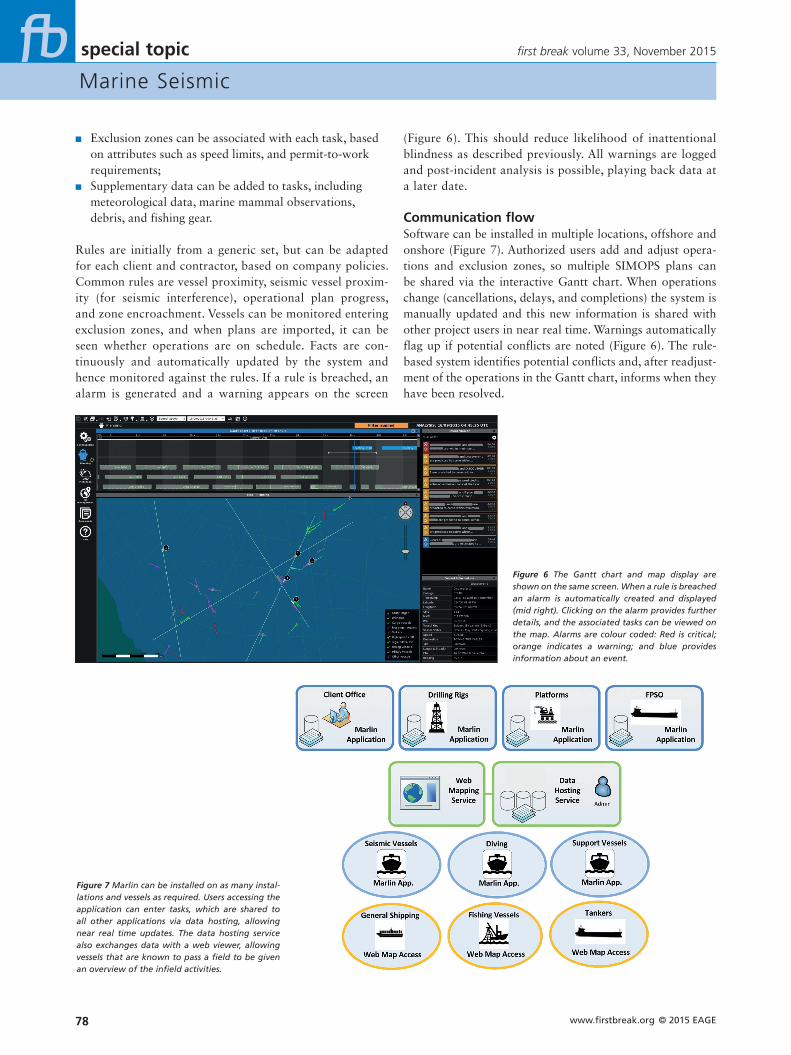
(Figure 6). This should reduce likelihood of inattentional blindness as described previously. All warnings are logged and post-incident analysis is possible, playing back data at a later date.
Communication flowSoftware can be installed in multiple locations, offshore and onshore (Figure 7). Authorized users add and adjust opera-tions and exclusion zones, so multiple SIMOPS plans can be shared via the interactive Gantt chart. When operations change (cancellations, delays, and completions) the system is manually updated and this new information is shared with other project users in near real time. Warnings automatically flag up if potential conflicts are noted (Figure 6). The rule-based system identifies potential conflicts and, after readjust-ment of the operations in the Gantt chart, informs when they have been resolved.
n Exclusion zones can be associated with each task, based on attributes such as speed limits, and permit-to-work requirements;
n Supplementary data can be added to tasks, including meteorological data, marine mammal observations, debris, and fishing gear.
Rules are initially from a generic set, but can be adapted for each client and contractor, based on company policies. Common rules are vessel proximity, seismic vessel proxim-ity (for seismic interference), operational plan progress, and zone encroachment. Vessels can be monitored entering exclusion zones, and when plans are imported, it can be seen whether operations are on schedule. Facts are con-tinuously and automatically updated by the system and hence monitored against the rules. If a rule is breached, an alarm is generated and a warning appears on the screen
Figure 6 The Gantt chart and map display are shown on the same screen. When a rule is breached an alarm is automatically created and displayed (mid right). Clicking on the alarm provides further details, and the associated tasks can be viewed on the map. Alarms are colour coded: Red is critical; orange indicates a warning; and blue provides information about an event.
Figure 7 Marlin can be installed on as many instal-lations and vessels as required. Users accessing the application can enter tasks, which are shared to all other applications via data hosting, allowing near real time updates. The data hosting service also exchanges data with a web viewer, allowing vessels that are known to pass a field to be given an overview of the infield activities.
special topic
Marine Seismic
© 2015 EAGE www.firstbreak.org 79
first break volume 33, November 2015
significant. Vessels operating in close proximity can interfere with each other’s seismic signals, degrading data quality and creating potential environmental and regulatory issues.
In the case of an ION multi-client survey, 2D lines extend the width of the Gulf of Mexico, bringing the survey into potential conflict with numerous other operations. As such, Marlin was utilized for managing simultaneous operations.
While the majority of seismic acquisition occurred in open waters, this case demonstrates just how congested these open waters can be when seismic contractors are prioritizing the same blocks due to licensing round schedules:
August 1, 2015: A seismic vessel arrived in the area, and contacted the Discoverer II (chartered by ION) notifying that they were deploying equipment in preparation to start acquisition and providing vessel position, speed and heading. This information was inputted into Marlin and displayed in a GIS map. While checking the effects of this task, the navigator noted that the new vessel was potentially entering the exclusion zones of another vessel and of a WAZ fleet operating in the area – a fact that they were not aware of. The vessel was informed of this and changed heading to avoid any potential conflicts.
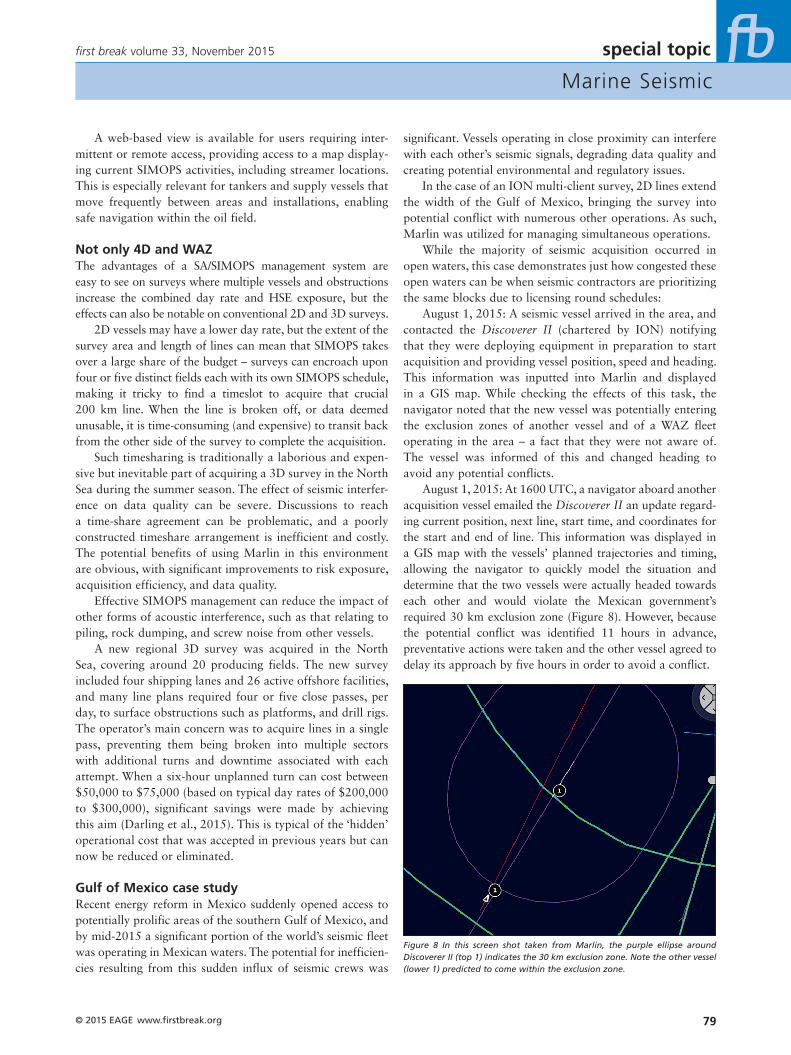
August 1, 2015: At 1600 UTC, a navigator aboard another acquisition vessel emailed the Discoverer II an update regard-ing current position, next line, start time, and coordinates for the start and end of line. This information was displayed in a GIS map with the vessels’ planned trajectories and timing, allowing the navigator to quickly model the situation and determine that the two vessels were actually headed towards each other and would violate the Mexican government’s required 30 km exclusion zone (Figure 8). However, because the potential conflict was identified 11 hours in advance, preventative actions were taken and the other vessel agreed to delay its approach by five hours in order to avoid a conflict.
A web-based view is available for users requiring inter-mittent or remote access, providing access to a map display-ing current SIMOPS activities, including streamer locations. This is especially relevant for tankers and supply vessels that move frequently between areas and installations, enabling safe navigation within the oil field.
Not only 4D and WAZThe advantages of a SA/SIMOPS management system are easy to see on surveys where multiple vessels and obstructions increase the combined day rate and HSE exposure, but the effects can also be notable on conventional 2D and 3D surveys.
2D vessels may have a lower day rate, but the extent of the survey area and length of lines can mean that SIMOPS takes over a large share of the budget – surveys can encroach upon four or five distinct fields each with its own SIMOPS schedule, making it tricky to find a timeslot to acquire that crucial 200 km line. When the line is broken off, or data deemed unusable, it is time-consuming (and expensive) to transit back from the other side of the survey to complete the acquisition.
Such timesharing is traditionally a laborious and expen-sive but inevitable part of acquiring a 3D survey in the North Sea during the summer season. The effect of seismic interfer-ence on data quality can be severe. Discussions to reach a time-share agreement can be problematic, and a poorly constructed timeshare arrangement is inefficient and costly. The potential benefits of using Marlin in this environment are obvious, with significant improvements to risk exposure, acquisition efficiency, and data quality.
Effective SIMOPS management can reduce the impact of other forms of acoustic interference, such as that relating to piling, rock dumping, and screw noise from other vessels.
A new regional 3D survey was acquired in the North Sea, covering around 20 producing fields. The new survey included four shipping lanes and 26 active offshore facilities, and many line plans required four or five close passes, per day, to surface obstructions such as platforms, and drill rigs. The operator’s main concern was to acquire lines in a single pass, preventing them being broken into multiple sectors with additional turns and downtime associated with each attempt. When a six-hour unplanned turn can cost between $50,000 to $75,000 (based on typical day rates of $200,000 to $300,000), significant savings were made by achieving this aim (Darling et al., 2015). This is typical of the ‘hidden’ operational cost that was accepted in previous years but can now be reduced or eliminated.
Gulf of Mexico case studyRecent energy reform in Mexico suddenly opened access to potentially prolific areas of the southern Gulf of Mexico, and by mid-2015 a significant portion of the world’s seismic fleet was operating in Mexican waters. The potential for inefficien-cies resulting from this sudden influx of seismic crews was
Figure 8 In this screen shot taken from Marlin, the purple ellipse around Discoverer II (top 1) indicates the 30 km exclusion zone. Note the other vessel (lower 1) predicted to come within the exclusion zone.
special topic
Marine Seismic
www.firstbreak.org © 2015 EAGE80
first break volume 33, November 2015
contractors using real-time AIS, shared vessel trajectory information and the software modelling capabilities. As a result, several seismic contractors were able to benefit from the modelling capabilities that allowed the avoidance or minimization of standby time and risk as well as faster completion of acquisition.
Applications beyond seismicThe potential cost savings and risk reduction in construc-tion or production situations can be even more significant. Consider an analogous situation in a production scenario, with a tanker expected to arrive at an FPSO within 12 hours, and diving operations for maintenance work actively occur-ring. Offloading hydrocarbons to the tanker becomes the number one operational priority, and as such, standard oper-ating procedures require that the exclusion zone be expand-ed, thereby restricting other activities and causing diving operations to cease. However, if the tanker progresses more slowly than anticipated, this would be tracked in Marlin. As the tankers’ predicted arrival time was updated (based on observed speed), the Offshore Installation Manager (OIM) may allow diving operations to continue until just before the predicted exclusion zone takes effect. Depending on the extent of diving operations required, the savings could easily be significant and perhaps the maintenance task completed.
On a rig, FPSO or platform, given the volume of daily activity, numerous potential conflicts might occur – crew change, supply vessels, drilling or offloading, maintenance, etc. Today, the majority of these operations are managed manually through Gantt charts and spreadsheets or through scheduling or logistics applications. However, rarely do these provide a holistic view with the ability to visualize not only real-time but also planned activities in the field. This situa-tion leaves room for human error and risk. To better manage these simultaneous operations, professionals involved in off-shore operations need to create, import, share and visualize operational plans, real-time activities, vessel movements, and relevant data such as weather, both temporally and spatially. They need to be able to analyze, manage, and model opera-tions in order to resolve potential conflicts proactively – just as the crew delivered for the 2D seismic operation in the Gulf of Mexico.
Conclusion and outlookSeismic surveys are often conducted over busy congested areas where other operations may dictate the efficiency of the survey. Prolonging a survey increases costs and hinders other infield activities. SIMOPS are either managed by direct communications between the vessel and the installations or by a dedicated SIMOPS coordinator. Neither solution pro-vides everyone with a full temporal and spatial operational picture which is updated in real time. In this way, the SA of all members is compromised on all three levels.
August 2, 2015: Discoverer II was delayed in acquisi-tion, requiring an additional potential delay of six hours by the other vessel to avoid conflict. However, because the other vessel had provided additional survey information, the navigator identified and suggested another line that the other vessel was planning to shoot. Acquiring this line would not only result in reduced lost time, but also provided unobstructed acquisition. As a result, both vessels avoided expensive manoeuvres such as a line break off, the other vessel avoided six hours of standby time, and both vessels avoided putting their permits at risk.
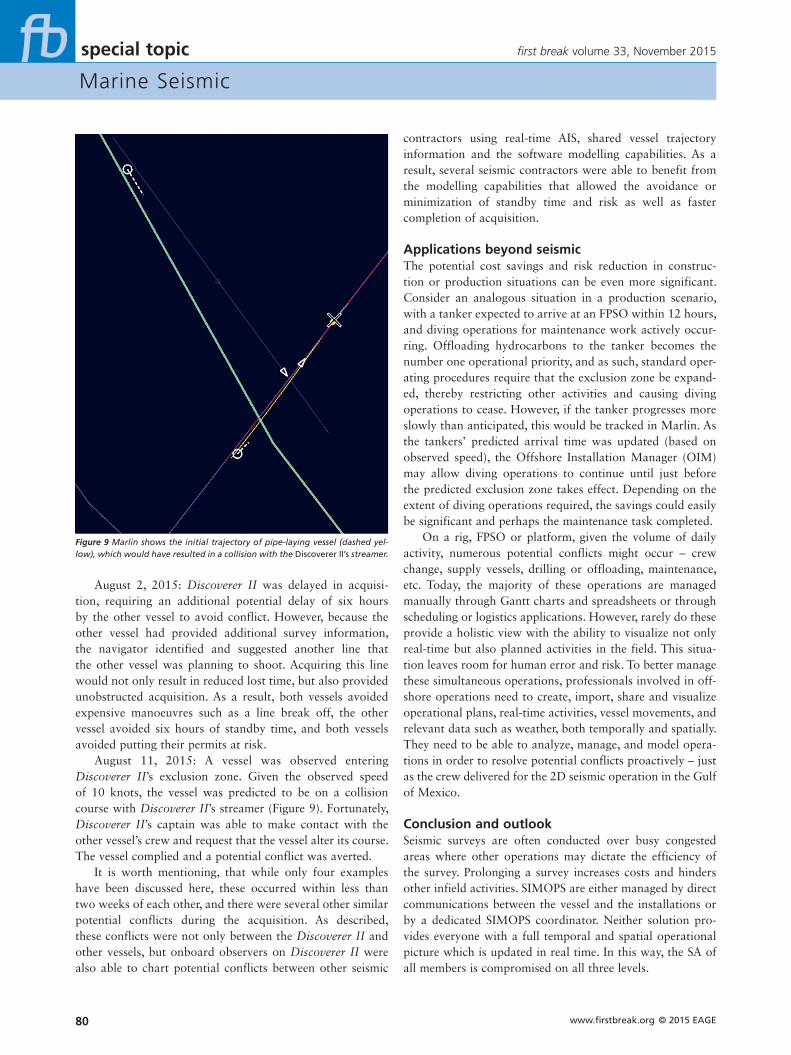
August 11, 2015: A vessel was observed entering Discoverer II’s exclusion zone. Given the observed speed of 10 knots, the vessel was predicted to be on a collision course with Discoverer II’s streamer (Figure 9). Fortunately, Discoverer II’s captain was able to make contact with the other vessel’s crew and request that the vessel alter its course. The vessel complied and a potential conflict was averted.
It is worth mentioning, that while only four examples have been discussed here, these occurred within less than two weeks of each other, and there were several other similar potential conflicts during the acquisition. As described, these conflicts were not only between the Discoverer II and other vessels, but onboard observers on Discoverer II were also able to chart potential conflicts between other seismic
Figure 9 Marlin shows the initial trajectory of pipe-laying vessel (dashed yel-low), which would have resulted in a collision with the Discoverer II’s streamer.
special topic
Marine Seismic
© 2015 EAGE www.firstbreak.org 81
first break volume 33, November 2015
Darling, S., Pemberton, G. and Strater, L. [2015] Managing simultaneous
operations during seismic acquisition in offshore fields. World Oil,
53-55.
DNV-GL. (2014). World Offshore Accident Database. Accessed 2 May
2014, at: https://www.dnvgl.com/services/world-offshore-accident-
database-woad-1747.
Endsley, M.R. [1995] Toward a theory of situation awareness in dynamic
systems. Human Factors, 37 (1), 32-64.
Gomez, C. and Green, D.R. [2013] The impact of oil and gas drilling
on EU fisheries. EU-Directorate General for Internal Policies, DOI:
10.2861/49220.
Jones, D.G. and Endsley, M.R. [1996] Sources of situational awareness
errors in aviation. Aviation, Space and Environmental Medicine, 67
(6), 507-512.
Lochmann, M., Darling, S., Pemberton, G., Mills, R. and Altaie, J. [2015]
Improving situational awareness to prevent conflicts in simultaneous
offshore operations. SPE International. SPE-176796-MS.
Marine Information Bulletin [2013] Situational Awareness. Department
of Transport and Main Roads, Queensland Government.
Protiviti [2011] Making the Business Case for Automated Controls.
Accessed 13 June 2015, at: http://www.protiviti.com/en-US/
Documents/POV/POV-Automated-Controls-Protiviti.pdf.
Simons, D. [2015] Failures of Awareness: The Case of Inattentional
Blindness. Accessed 2 June 2015, at: http://nobaproject.com/mod-
ules/failures-of-awareness-the-case-of-inattentional-blindness.
Wikipedia [2015] Three Mile Island accident. Accessed 2 July 2015, at:
https://en.wikipedia.org/wiki/Three_Mile_Island_accident.
Ziff Energy Group [2013] Ziff Energy Analysis Reveals 8% of Gulf of
Mexico Production Lost to Unplanned Downtime: A Significant
Production Loss Management Opportunity for Producers. Accessed
1 June 2015, at: http://www.ziffenergy.com/download/pressrelease/
PR20130318-01.pdf.
Nessim M. [2015] President’s Page: Necessity is the mother of collabora-
tion. The Leading Edge, 34 (7), 736 .
A new automated SA/SIMOPS technology has been intro-duced: Marlin. It is based on 20 years of academic SA research and study as well as extensive field experience. It addresses the operating conditions of today’s market where complex assets, rising production costs, high well counts and low headcounts make efficiency a practical necessity. Producers are no longer forced to accept the historical costs of doing business and the performance levels set by manual SA/SIMOPS processes.
Marlin SIMOPS management software takes all three levels of SA awareness into account. On level 1, SA/SIMOPS software shares all the critical infield and operations data through data hosting. Data is shared among users in real time. Through the interactive map and calendar functions, a clear understanding of the situation is provided: what is taking place, where, and when and for how long (level 2). Automated alarms and rule-based systems warn the users of potential conflicts, and any further information regarding an operation is easily retrieved. At level 3, the ability to slide for-ward in time allows the effects of operations on each other to become apparent. By improving SA at all three levels, the ability to successfully address SIMOPS is greatly increased.
In a recent article in The Leading Edge, Maurice Nessim commented that ‘collaboration could be an increasingly attractive option for operators facing tighter budgets for complex industry projects’. Marlin creates an opportunity for the seismic industry and the broader E&P community to eliminate downtime and reduce risk for all involved.
ReferencesAdomaitis, N. [2014] Collision Halts Statoil Oseberg East Platform,
Restart Seen Thursday. Rigzone, Accessed 2 June 2015, at: http://
www.rigzone.com/news/oil_gas/a/133968/Collision_Halts_
Statoil_Oseberg_East_Platform_Restart_Seen_Thursday#sthash.
UX9MQA8C.dpuf.


![SIMULTANEOUS EQUATIONS (QUADRATIC) SOLUTIONS · 2017. 12. 19. · SIMULTANEOUS EQUATIONS SOLUTIONS (QUADRATIC) GCSE (+ IGCSE) EXAM QUESTION PRACTICE 1. [Edexcel, 2006] Simultaneous](https://img.pdfslide.us/doc/110x75/61216357d4e8c92bd4719ae9/simultaneous-equations-quadratic-solutions-2017-12-19-simultaneous-equations.jpg)