Embed Size (px)
Citation preview
24469 vol. 1December 2001
Managing PublIc Resources BetterPublic Expenditure Review 2000
Volume 1: Main Report
Joint Report of the Government of Vietnam - Donor Working Groupon Public Expenditure Review
Pub
lic D
iscl
osur
e A
utho
rized
Pub
lic D
iscl
osur
e A
utho
rized
Pub
lic D
iscl
osur
e A
utho
rized
Pub
lic D
iscl
osur
e A
utho
rized

Managing Public Resources BetterPublic Expenditure Review 2000
Volume 1: Main Report
Joint Report of the Government of Vietnam - Donor Wpr:'on Public Expenditure Review
December, 2000

ACKNOWLEDGEMENTS
The Vietnam Public Expenditure Review (PER) 2000 was prepared by a jointGovernment-donor working group, with contributions by several other people, including anNGO. The initial draft of the main report was discussed at the Mid-Year Meeting of theConsultative Group in Dalat, June 22-23, 2000. The final report reflects comments received
from donors and Government agencies.
Throughout the process, the working group works closely with Mr. Do Hoang Tuan,-Deputy Director, State Budget Department of the Ministry of Finance (MOF) and theGovernment team comprised of representatives from other departments of MOF, from theMinistry of Planning and Investment, from sector ministries like Ministry of Education andTraining (MOET), Ministry of Health (MOH), Ministry of Agriculture and RuralDevelopment (MARD), and Ministry of Transport (MOT). The donor team -- staff andconsultants from the World Bank, IMF, UNDP, Denmark, Netherlands and the UnitedKingdom -- led by Mr. David Shand, worked closely with Mr. Kazi Matin (LeadEconomist, Vietnam). The drafts of concept paper and the draft reports of four sectors aswell as those of the cross-cutting themes were discussed in meetings where all donors aswell as the NGO resource-center were invited at three different stages since November1999. The team would like to express its gratitude to various government agencies andprovincial authorities for their support and cooperation throughout the PER process. Theteam would also like to thank Mr. Andrew Steer (Director, Vietnam Program, World Bank),Mr. Homi Kharas (Director, Poverty Reduction and Economic Management, East Asia andPacific Region), and Ms. Barbara Nunberg (Lead Specialist in Public Sector Management,East Asia and Pacific Region), for providing ideas and advise during the preparation of thereport.
Team Managers: Mr. Nguyen Cong Nhiep, Mr. David Shand
Lead Advisor: Mr. Vinaya Swaroop
Coordinators: Mr. Do Hoang Anh Tuan, Mr. Nguyen Van Minh
Members of the PER teams included the following:
(i) Government Team: Mr. Nguyen Cong Nghiep, Mr. Do Hoang Anh Tuan, Mrs. TruongThai Phuong, Mrs. Tran Thu Ha, Mrs. Tran Kim Hien, Mr. Nguyen Truong Giang, Mrs. DoThuy Hang, Mr. Lai Van Duong, Mr. Ngo Huu Loi, Mrs. Nguyen Lan Huong, Mr. Do VietDuc, Mrs. Le Thi Hong Sinh, Mr. Vu Duc Hiep (MOF); Mr. Nguyen Buu Quyen, Mr.Nguyen Tu Nhat, Mr. Trinh Nhu Phuc, Mr. Le Van Xuan (MPI); Mr. Nguyen Van Hung,Mr. Vu Xuan Cuu (MOT); Mrs. Phan Ngoc Thuy (MARD) ; Mr. Vuong Doan Quan(MOET); Mr. Nguyen Nam Lien (Ministry of Health).
(ii) Donor Team: Mr. David Shand (Task Manager), Mr. Vinaya Swaroop (Lead Advisor),Mr. Peter Brooke, Mr. Perran Penrose, Mrs. Nguyen Nguyet Nga (Education), Mr. AnilDeolikar, Mr. Nguyen Van Minh (Health), Mr. Franicesco Golleti, Mr. Mylene Kherallah,
Mr. Nguyen Cong Chuc, (Agriculture), Mr. Dieter Havlichek, Ms. Nguyen Thi ThanhHang, Mrs. Duong Thi Thanh Mai (Transport), Mr. Haroon Akram Lodhi, Mr. Jaki Desai,Mrs. Tran Thi Que (gender), Mr. Nguyen Dam, Mr. Brian Van Arkadie (expenditureprocesses and PIP), Mr. Govinda Rao (decentralization), Mrs. Carolyn Turk, Mr. Vu XuanDao, Mr. Nguyen Dinh Huan, Mr. Bertrand de Hartingh (voluntary contributions), Mr.David Cowan, Mr. Feridoun Sarraf, Mr. Murray Petrie (fiscal sustainability andtransparency).
Other participants from donors and NGOs: Mr. Torben Bellers (Danish Embassy), Mr.
Alan Johnson, Mr. Peter Balacs (Dfid); Mr. Dennis de Tray, (IMF); Mrs. Ellen Berenrcs,Mr. Els Klinkert (Netherlands Embassy); Ms. Anne-Isabelle Blateau, Mr. Trinh Tien Dung,Mr. Emmanuel Cuvillier (UNDP); Mr. Pham Van Ngoc (ActionAid).
Other Contributors: Mr. Christopher Shaw, Mrs. Mai Thi Thanh, Mrs. Christopher Gibbs.Mrs. Tran Thi Minh Phuong, Mr. Nguyen Thi Mai and others.
Peer Reviewers: Mr. Charles Humphreys, Mr. Kyle Peters (World Bank)
Other Support: Mrs. Hang Thu Nguyen, Mrs. Phuong Anh Vu Tran, Mrs. Giang ThiHuong Nguyen, Mrs. Van Thi Hong Do, Mrs. Ha Thanh Hoang, Mrs. Chi Kim Tran (WorldBank)
Participants at Various Consultations on PER-drafts:
Transport Sector: Mr. Nguyen Viet Tien, Vice Minister of MOT, Mrs. Nguyen Thi ThanhHang, Mrs. Ha Khac Hao, Mr. Nguyen Van Hung, Mrs. Dang Thi Hoc, Mr. Tran BaNghiep, Mrs. Nguyen Thuy Ha (Ministry of Transport); Mr. Nguyen Van Thuc, Mr. LaiVan Duong, Mrs. Nguyen Thi Nhuan, Mr. Tran Viet Hung (Ministry of Finance); Mr. VuVan Huy, Mr. Do Quoc Binh, Mr. Trinh Nhu Phuc (Ministry of Planning and Investment);Mrs. Duong Thi Thanh Mai (National Economic University); Mrs. Tran Thi Que(Economic Institute); Mr. Haroon Akram Lodhi (Netherlands), Mr. Kazi M. Matin, Mr.Nguyen Van Minh, Mrs. Tran Thi Minh Phuong (World Bank); Mr. Trinh Tien Dung(UNDP), Mr. Emmanuel Cuvillier, Mr. Hoang Van Hai (UNDP Project VIE 96/028); Mr.Steve Ray (Dfid).
Agriculture Sector: Mr. Cao Duc Phat, Vice Minister of MARD, Mr. Vu Van Dong, Mrs.Nguyen Thi Hai (Ministry of Finance); Mr. Dao Trong Tu, Mr. Phan Duy Tam, Mr. PhanVan Quan, Ms. Phan Ngoc Thuy, Mr. Nguyen Van Than (Ministry of Agriculture & RuralDevelopment); Ms. Le Thi Thong, Mr. Nguyen Van Doan (Ministry of Planning &Investment); Mr. David Shand, Mr. Francesco Golleti, Mr. Kazi M. Matin, Mr. Nguyen VanMinh, Mr. Vinaya Swaroop, Mr. Jaikishan Desai (World Bank); Mr. Emmanuel Cuvillier(UNDP); Mr. Hoang Van Hai (VIE 96/028); Mr. Henning Nohr, Mr. Morten Boye Hansen(Danish Embassy); Mr. Els Klinkert, Mrs. Tran Thi Que (Netherlands Embassy); Mr. Steve Ray(Dfid).
Health Sector: Mrs. Phan Thi Cuc, Mrs. Nguyen Lan Huong, Mrs. Nguyen Thi Nhuan,Mrs. Do Thuy Hang, Mrs. Tran Viet Hung (Ministry of Finance); Mr. Nguyen DinhKhuong, Mr. Nguyen Nam Lien, Mr. Le Van Quan, Mr. Truong Viet Dung, Mr. NghiemTran Dung, Mr. Nguyen Van Duy, Mrs. Vuong Thi Lua (Ministry of Health); Mrs. Hoang
Kim Thoa, Mrs. Tran Kim Nguyen (Ministry of Planning and Investment); Mr. AnilDeolalikar, Mr. Kazi M. Matin, Mr. Nguyen Van Minh (World Bank); Mr. Els Klinkert(Netherlands Embassy); Mr. Emmanuel Cuvillier (UNDP Project VIE 96/028).
Educationi Sector: Mrs. Le Thi Hong Sinh, Mr. Tran Viet Hung (Ministry of Finance); Mr.Duong Duc Lan, Mr. Vuong Doan Quan, Mr. Nguyen Dang Thin, Mr. Nguyen Duc Chinh,Mr. Kieu Duc Thanh (Ministry of Education and Training); Mr. Peter Brooke, Mr.Christopher Shaw, Mr. Nguyen Van Minh, Mrs. Mai Thi Thanh (World Bank); Mrs.Nguyen Thi Hue (Dfid).
Budget Process: Mr. Do Hoang Anh Tuan, Mr. Pham Tuan Dat, Mr. Ngo Huu Loi, Ms.Duong Quynh Le, Mr. Tran Sy Thanh, Mr. Bui Anh Binh, Mr. Do Viet Duc, Mrs. Phan ThiCuc, Mr. Dang Van Thanh (Ministry of Finance); Mr. Le Van Xuan, Mr. Nguyen Tu Nhat(Ministry of P]anning & Investment); Mr. David Shand, Mr. Kazi Matin, Mr. Nguyen VanMinh, Mr. Jaikishan Desai, Mr. Vinaya Swaroop, Mr. Peter Brooke (World Bank); Mr.Haroon Akram Lodhi (Netherlands); Mr. Emmanuel Cuviller, Mr. Hoang Van Hai (VIE96/028); Mr. Johan Fredriksson, Mr. Trinh Tien Dung, (UNDP); Mr. Dennis de Tray(IMF); Mr. Torben Bellers, Mrs. Elisabeth Carlsson, Mrs. Tran Thi Que (Danish Embassy);Ms. Nguyen Nu Hoai Van (Netherlands Embassy).
Fiscal Sustainability & Transparency: Mr. Do Hoang Anh Tuan, Mr. Dang Van Thanh, Mr.Bui Anh Binh, Mr. Nguyen Van Nghia, Mr. Do Viet Duc, Mr. Pham Tuan Dat, Mr. HoangNguyen Hoc, Mrs. Pham Thi Tuat, Mrs. Nguyen Thi Yen, Mrs. Nguyen Anh Van (Ministryof Finance); Mrs. Vu Phuong Lien (State Bank of Vietnam); Mr. Bui Duc Thu (NationalAssembly); Mr. David Shand, Mr. Kazi Matin, Mr. Nguyen Van Minh, (World Bank); Mr.Haroon Akram Lodhi (Netherlands); Mr. Dennis de Tray, Ms. Ha Thi Kim Nga (IMF); Mr.Emmanuel Cuviller, Mr. Johan Fredriksson (UNDP); Mr. Louise Andersen, Ms. AnetteAarestrup (Danish Embassy); Mr. Trinh Quoc Cuong (Dfid); Mrs. Tran Thi Que(Netherlands Embassy).

TABLE OF CONTENT
EXECUTIVE SUMMARY ............................................................ ;
CHAPTER 1. FISCAL SUSTAINABILITY AND TRANSPARENCY ................................................ 1
Government Budget .............................................................. 1Potential risks to fiscal sustainability .............................................................. 2
A medium term fiscal outlook ............................................................. 8Fiscal transperency .............................................................. 9
CHAPTER 2. BUDGETING AND PUBLIC EXPENDITURE MANAGEMENT ............................... 13
General Position ............................................................. 13
Improving expenditure prioritization ............................................................. 14Review of expenditure norms ............................................................. 18
Improving the public investment plan (PIP) process ....................................................... 18Improving budget implementation and monitoring .......................................................... 19Fiscal decentralization and public spending ...................................................... ....... 20Local fees and contributions ............................................................. 22
CHAPTER 3. INTER AND INTRA-SECTORAL COMPOSITION OF EXPENDITURES ......... ....... 25Coverage of the PER Data ............................................................. 25Allocation decisions ............................................................. 25
Redistributive role of public expenditure ............................................................. 31Gender Issues in public expenditures ............................................................. 33
Agriculture sector ............................................................. 36Health sector ............................................................. 47
Education sector ............................................................. 56Transport sector ............................................................. 67
Social Safety Net Expenditures ............................................................. 77
TABLES
Table 1.1 Government Budget ................................................................ 1
Table 3- 1-A Budget Expenditure by Economic Types and by Sector,
by Central and Local Government 1987 ..................................................... 29
Table 3-1-B Budget Expenditure by Economic Types and by Sector,
by Central and Local Government 1988 ..................................................... 30
Table 3.2 Public Expenditure in Agriculture ............................................................... 38
Table 3.3 Capital and Current Expenditures by Agriculture Sub-sector 1997-1998 ....... 39
Table 3.4 Budget Support to SOEs ............................................................... 45
Table 3.5 Information on Agricultural SOEs Owned by the central government ........... 46
Table 3.6 Gross and net enrolment ratios ............................................................... 58
Table 3.7 Attainment test in mathematics and language ................................................. 58
Table 3.8 Growth of Public expenditure on education .................................................... 59
Table 3.9 International comparison og education expenditure ........................................ 59
Table 3.10 Sub-sectoral percent shares of education expenditure ................................... 60
Table 3.11 Regional differences in average school expenditure ...................................... 62
Table 3.12 Shares of expenditure in total expenditure ..................................................... 64
Table 3.13 State transport expenditure ............................................................... 70
Table 3.14 State transport spending by mode, locality and spending category ............... 71
Table 3.15 Social subsidies ............................................................... 78
FIGURES
Figure 3.1 Decision tree for evaluating public program .................................................. 26
Figure 3.2 Inter-sectoral Composition of Public Expenditure ......................................... 28
Figure 3.3 Lorenz Curve for Public Spending on Education,
health and household consumption ............................................................... 31
Figure 3.4 Agriculture Spending vs. Per capita ............................................................... 40
Figure 3.5 Total public spending on health, Vietnam 1991-1998 ................................... 50
Figure 3.6 Persons per hospital bed, selected Asian countries, 1995 .............................. 51
BOXES
Box 1.1 Fiscal Cost of SOE and Banking Reform ............................................................. 3
Box 1.2 Assessing fiscal sustainbility in Vietnam ............................................................. 7
Box 1.3 Recent Measures to Improve Transparency ......................................................... 9
Box 2.1 The Budgetary Process in Vietnam ............................................................... 14
Box 2.2 Better Intergrating the Capital and Recurrent Budgets ...................................... 15
Box 2.3 Medium-term Planning and Budgeting .............................................................. 17Box 3.1 Evaluating Public Expenditure Programs ........................................................... 27
Box 3.2 Broad Strategy for Future Spending ............................................................... 77
Currency EquivalentsCURRENCY UNIT = DONG
US$ = 14459 DONG (November 2000)
Government Fiscal YearJanuary 1 to December 31
Abbreviations
ADB Asian Development BankAFTA Asian Free Trade AreaAMC Asset Management CompanyBOT Build - Operation - TransferCG Consultative GroupDANIDA Danish International Development AgencyDFID Department for International DevelopmentFAO Food and Agriculture OrganizationFDI Foreign Direct InvestmentFTE Full Time EquivalentGCOP Government Committee for Organization and PersonnelGDP Gross Domestic ProductGER Gross Enrolment RatioGFS Government Financial StatisticsGNP Gross National ProductGOV Government of VietnamGSO General Statistics OfficeGTD General Taxation DepartmentHCMC Hochiminh CityHEPR Hunger Eradication and Poverty ReductionIMCs Irrigation Management CompaniesIMF International Monetary FundIUD Intrauterine DeviceJICA Japan International Cooperation AgencyLSMS Living Standard Measurement SurveyLSS Lower secondaryMARD Ministry of Agriculture and Rural DevelopmentMCTPC Ministry of Communication, Transport, Post and ConstructionMICT Manila International Container TerminalMIS Management Information SystemMOF Ministry of FinanceMOH Ministry of HealthMOLISA Ministry of Labor, Invalids and Social AffairsMOT Ministry of TransportMOTE Ministry of Education and TrainingMPI Ministry of Planning and Investment
MTEF Medium term expenditure frameworkMVUC Motor Vehicle User ChargeNCFAW National Committee For the Advancement of WomenNCPFP National Committee of Population and Family PlanningNER Net Enrolment RatioNFEP National Fund for Employment PromotionNGO Non-government OrganizationNPL Non-Performing LoansNTPE National Target Program on EmploymentO&M Operations and MaintenanceODA Official Development AssistantPER Public Expenditure ReviewPHP Phillipine PesosPIP Public Investment ProgramPPA Phillipine Ports AuthorityPPC Province People's CommitteePTR Pupil Teacher RatioSBV State Bank of VietnamSDI Strategic Development InstituteSEC Securities and Exchange CommissionSMEs Small and medium-scale private enterprisesSOE State-Owned EnterpriseSSR Staff Student RatioT.B TuberculosisUNDP United Nations Development ProgrammeUNICEF United Nation Children's FundUSS Upper secondaryVAT Value Added TaxVHI Vietnam Health InsuranceVHIA Vietnam Health Insurance AuthorityVHSR Vietnam Health Sector ReviewVICT Vietnam International Container TerminalVITRANSS Vietnam Transport Sector StudyVLSS Vietnam Living Standards SurveyVR Vietnam RailwayVRA Vietnam Road AdministrationVSI Vietnam Social InsuranceVTET Vocational Technical Education and TrainingVWU Vietnam Women's Union
EXECUTIVE SUMMARY
1. This Public Expenditure Review (PER), prepared jointly by the Government ofVietnam and donors, examines Vietnam's public expenditure policy and management andproposes ways of improving the results of its public spending program. The report examinescross-cutting issues-fiscal sustainability and transparency, expenditure managementprocesses, fiscal decentralization-and analyzes public spending on agriculture, health,education, and transport from the perspective of growth, poverty reduction, and genderequity.
2. The report identifies six important areas requiring action:
* Reversing the Government's declining revenue share in GDP and developing a medium-term fiscal outlook.
* Improving budgetary data and increasing the transparency of data and information flows.
* Ensuring an effective process for prioritizing public expenditures.
* Enhancing "pro-poor" bias of public expenditures.
* Reallocating spending within sectors to improve sector outcomes.
* Assessing where services can be provided by private sector to reduce budgetary burden.
The report's findings reflect a situation which applies in many countries, including those atmuch higher levels of economic development and income than Vietnam. For a country atVietnam's stage of development its system of public expenditure management appears tooperate well.
3. This PER represents another step in the Government's ongoing efforts to increasefiscal transparency and improve public expenditure management and policy. Time did notpermit all relevant issues to be examined or policy suggestions to be made on all the issuesthat were analyzed. The report should therefore be seen as an important part of an ongoingprocess, with discussions and work continuing in the coming months.
4. The report was prepared in a participatory and consultative manner, with stakeholdersparticipating throughout the process. Participants included not only the 'Ministries of Finance(MOF), Planning and Investment (MPI), Education and Training, Health, Transport, andAgriculture and Rural Development but also provincial authorities; donors, such as DFID,DANIDA, the Government of the Netherlands, the UNDP, and the IMF; and NGOs, such asAction Aid. Consultative sessions with sector ministries and donors were held at variousstages of the process, and workshops were held in Hanoi and Ho Chi Minh City.
5. The report's findings and recommendations should help the Government and donorsbetter understand how well Vietnam's public expenditure management system encourages the
Viet Nani - Public Expendliture Review 2000 Main Report
effective use of public resources and ensures that inter and intra-sectoral spending isconsistent with the Government's stated development objectives. The findings andrecommendations should help policymakers assess whether Vietnam can move from a projectapproach to a programmatic approach to foreign assistance in any of the four sectorsexamined, and if so how it could do so. The report could also help the Government preparethe future state budgets, develop the new five-year plan (including the Public InvestmentProgram [PIP]), and revise the Budget Law.
6. For the Government the next steps will be to adopt measures that have been wellspecified in the PER, initiate additional follow-up work to develop specific measures wherefindings warrant such work, and analyze issues not examined in this PER. For donors thenext steps will be to assess the report's implications for their assistance to Vietnam andcoordinate technical assistance for implementing its recommendation.
Constraints to Growth and the Challenges Facing Vietnam
7. High growth has helped reduce poverty... In recent years Vietnam has been one ofthe 10 fastest-growing economies in the world, with annual growth averaging an exceptional8.5 percent between 1992 and 1997. This high rate of growth-the result of the introductionof the economic reform process (doi m?loi) in the late 1980s-helped dramatically reducepoverty, which fell from 58 percent in 1992 to 37 percent in 1997.
8. ... but annual growth has slowed since 1998, falling to about 5 percentt in 1999.Growth in nonagricultural production and investment, especially foreign investment, hasslumped, and unemployment has risen. While the downturn in growth partly reflects theeffect of the regional economic crisis, insufficient competitiveness and efficiency in theVietnamese economy has hindered the resumption of higher growth. The decline in growthmakes increasing the effectiveness of public expenditure policies and management all themore important.
9. In November 1999 the Prime Minister identified several constraints on fastereconomic growth and poverty reduction: the poor performance by and need for fiscal supportto state-owned enterprises, inadequate sectoral policies and inappropriate investment choices,the gap between policy and implementation, and the need for better targeting of publicspending on the poor. This PER confirms that these problems are hampering efforts to moveto sustained economic growth and poverty reduction.
Reversing Declining Revenue and Developinga Medium-Term Fiscal Outlook
10. Revenues have declined... Revenue as a share of GDP has fallen by 3-4 percent ofGDP. Most of the decline occurred in 1998 and 1999 and was caused by the decline incorporate income tax collections-the result of a slowing economy, flagging enterpriseperformance and weakness in tax administration. Given current policies the decline isprojected to continue in 2000 and beyond.
HI
11. ... and total expenditures have fallen. Public spending as a share of GDP has fallenby about 4 percent of GDP since 1998. While this fiscal restraint is commendable, furthercuts in public spending may undermine the Government's efforts to reduce poverty. Most ofthe decline in spending has been in nonwage spending in economic services, generaladministration, and social transfers (facilitated by the gradual reduction in the number ofpensioners paid from the budget and the shifting of pension payments to the social insurancefund).
12. But spending pressures are likely to grow. Two types of spending are likely to growin the medium term. First, implementation of planned reforms of state-owned enterprises andbanks would require additional spending of as much as 1-2 percent of GDP a year for threeto four years, according to IMF estimates. This spending would comprise creating a socialsafety net for displaced workers and paying the interest on government bonds used to fundthe restructuring of state-owned enterprise debt and the phased recapitalization of the banks.Second, the Government has increased the base wage of civil servants by 25 percent (withfurther real increases envisaged), to be paid in part by the downsizing of the civil service.Given unsustainably low civil service wages, these increases are clearly needed, but if civilservice employment is not reduced, they may crowd out other spending.
13. Reversing the continuing decline in revenues as a share of GDP is critical forsustaining real levels of public spending in the medium term. In the past, Vietnam hasmaintained a prudent fiscal stance, maintaining relatively small budget deficits (typicallyabout 1 percent of GDP, excluding on-lending) and a low level of debt/GDP. But the currentfiscal situation is under pressure from the declining ratio of revenue to GDP and the growingspending pressures. Without actions to address the revenue problem and accurately assess themedium-term fiscal outlook and emerging fiscal risks, acceptable levels of public spending inkey sectors may be difficult to maintain in the medium term.
14. Several actions are needed to address these problems over the medium term:* Revenues need to be increased to about 19-20 percent of GDP. Doing so will require
broadening the revenue base, removing discretionary exemptions and multiple rates inthe VAT, and further strengthening tax administration.
* Definitive estimates of the fiscal costs of state-owned enterprise and banking reform areneeded, linked to annual implementation of the reform programs.
* Full cost estimates of recent and future wage increases are needed, linked to plannedchanges in civil service employment.
15. A medium-term fiscal outlook is needed. A medium-term fiscal outlook would assessthe impact of new revenue-raising policies and project total spending. It would reflect thepace of sectoral and economy-wide reforms, which determine the volume of donor support inthe medium term and thus the size of public investment expenditure. The resulting forecastsof likely deficits and their financing as well as an analysis of the implications of suchfinancing, could trigger timely action and improve the stability of budgetary resources. Themedium-term fiscal outlook could also play a key role in informing the annual budgetformulation process and in building a medium-term sector expenditure programs.
Viet Nam?) - Public Eyvenditiure Rev,iew 2000 Main Report
16. All types offiscal risk need to be regularly assessed and reported to the Ministry of
Finance. Identifying and assessing fiscal risks on a regular basis would reduce unanticipatedshocks to public spending. Tight monitoring and control over approved expenditures can beundermined if fiscal risks are not also monitored. For example, in many countries,Government guarantees of loans to state enterprises and sectors or directives to state-ownedbanks to provide credit to state enterprises on noncommercial terms have threatened the fiscalbalance. It is thus essential that contingent liabilities and other fiscal risks be reported to theMOF and assessed regularly.
17. A medium-term fiscal outlook would thus incorporate revenue policies andprojections; projections of donor disbursement; analysis of all fiscal risks, and in due course a
detailed medium-term public expenditure plan, broken down by sectoral programs. Given thetradition of planning in Vietnam, it should be relatively easy to begin developing suchprograms. The medium term fiscal outlook should be published with the annual budget andused to inform budget formulation.
Improving the Recording and Reporting of Dataand Increasing budget Transparency
18. Reliable and timely information on spending-and adequate access to suchinformation-is needed to get the best results from public expenditure. Public expenditureneeds to be accurately recorded and reported by different spending units, timely and reliablereports need to be generated and be accessible across spending agencies and ministries, and
sufficient budgetary information needs to be published to enable businesses and citizens to
understand how public resources are being deployed. Vietnam has made considerableprogress in these areas in recent years. Enactment of the budget law, regular fiscal reportingand the adoption of international economic classifications, the removal of budgetaryinformation from the secrecy law, and the publication of some of that information reflect
such progress. Preparation of this joint PER in a participatory manner and its publication alsoreflects significant progress. Nevertheless, further improvements in reporting budgetary dataand in making data accessible by government agencies and the public are required if Vietnamis to be on a par with other countries in the region.
19. The detailed data used for this PER was available in much greater details than the
General Statistical Office publication of budgetary information for the first time in June 1999.The sectoral breakdown of total budget spending, which covers three-quarters of total
expenditures, details spending by type (capital or recurrent, wage and wage-related,operations and maintenance) and by level of government
20. The lack of a consolidated budget makes it difficult to determine total revenues and
expenditures. The PER covers recurrent and capital spending funded from the Government'sown revenues, Official Development Assistance (ODA) grants not on-lent, and borrowing(domestic and external concessional ODA loans that are not on-lent). It does not coverrecurrent and capital expenditures from off-budget funds or on-lent ODA funds or capitalspending by state-owned enterprises, nor all spending by communes.
iv
Evecutive' Summarv
21. Data recording and reporting are inconsistent across ministries, and many gapsexist. The data used in this report were developed from data provided by the MOF, MPI, andindividual sector ministries. Reconciling their different figures revealed several gaps inreporting and recording of budgetary data. First, where sector ministries record expendituresfrom ODA, they are not classified according to budget codes. Differences in estimates ofcapital spending by the MOF, MPI and sectoral ministries stem partly from this, and partlyfrom differences in classifying capital and recurrent expenditures. Second, there are alsoclassification anomalies, for example, in recurrent versus capital expenditures in the transportsector, curative versus preventive expenditures in the health sector, salary versus nonsalaryexpenditures in the education sector. Third, comparison of budgeted and actual spending at adisaggregated level is not possible, because budget allocations and treasury releases are madeusing 11 categories, while spending agencies and the MOF report expenditure using fullbudget classification. Fourth, reporting by state-owned enterprises is uneven. Not all largestate-owned enterprises submit audited financial statements, and many smaller state-ownedenterprises do not regularly report to the MOF. Fifth, a detailed classification of spending onsocial transfers is not available in a form that permits analysis of its impact.
22. More and better information is needed on the impact of public expenditures.Linking expenditures and outcomes to assess the effectiveness or efficiency of publicspending is difficult even in advanced economies. Vietnam may thus need to proceedgradually in this respect. Nevertheless, many sectors have information bases that could beused to develop key performance indicators. Data will gradually need to be improved andlinked with budgetary decision-making and with the development of medium-term sectoralplans.
23. Over time, a consolidated budget statement will be needed to accurately reflect thecountry's fiscal situation. Such a statement would include the activities of all off-budgetfunds, improve budgetary reporting by communes, obtain regular reports from state-ownedenterprises, and ensure better coverage of expenditures funded by ODA.
24. Adopting the following actions would help the Government improve its budgetaryreporting:
* Designate the Treasury as the department responsible for maintaining comprehensivecentral public accounts, and consider developing a fully integrated managementinformation system within the Treasury.
* Channel agency payments from ODA through the Treasury so that all transactions arerecorded using the same budgetary classifications.
* Adopt functional classifications in line with international practice.* Ensure that all ministries adopt a uniform classification for capital and recurrent
expenditures.* Develop a detailed classification of spending on social transfers.* Require large state-owned enterprises to submit audited financial statements, to be
reviewed by the Ministry of Finance and the appropriate sectoral ministry.
v
1'itt Nam - Phibli/ Eipenthtitre Review' 2000() Maain Repl t
Develop key output and outcome measures in one or a few sectors, as a first step towardsdeveloping a comprehensive set of performance measures.
25. MOF has expressed a strong interest in implementing an integrated financialmanagement system in the Treasury and will seek technical assistance from the World Bankto do so. Such assistance will be most productive if the Ministry also considers significantlyreorganizing its functions to ensure greater coherence and focus in its policy formulation andpolicy implementation roles.
26. More systematic and frequent sharing of budgetary information across spendingagencies is needed. The process of interagency consultations for this PER revealed thatsectoral ministries lack adequate information on expenditures by provinces to exercise theirpolicy role. Ministries also lack information on related expenditures by other ministries.
27. The system of local fees and "voluntary" contributions is nontransparent, andinsufficiently accountable. The bases of these charges, which generate between 23 and 61percent of revenues in four of the six communes studied, are so complex that householdsoften do not understand how their payment is calculated. None of the six communespublishes a budget indicating what charges have been collected from households and howthose funds have been spent, leading to dissatisfaction among commune residents.
28. To increase transparency and improve budgeting and decisionmaking, theGovernment should consider taking the following steps:
* Enhance the flow of budgetary information across all government ministries, agenciesand provinces. MOF should ensure appropriate involvement of sectoral ministries inreviewing provincial government expenditures in each sector, while preserving existingprovincial autonomy.
* Provide donors and international organization with more comprehensive information onbudgetary outcomes and processes in order to increase donor understanding of Vietnam'spublic finances. Better information could also strengthen partnerships between theGovernment and donors, and could lead to programmatic funding by donors in differentsectors.
* Consider regularly publishing the sectoral breakdown for the more than 75 percent oftotal spending as contained in this PER, based on data on all four levels of government.MOF should also publish the annual budget and final accounts figures for each sector,including relevant intrasectoral detail. Each province, district, and commune shouldpublish its own annual budget and final accounts.
* Ensure that existing requirements for transparency in imposing commune fees and"voluntary" contributions are observed. Implementing decrees on "grassrootsdemocracy" and annually publishing commune budgets would be one way of addressingthis.
Executive Summary
Creating Effective Processes for Prioritizing Expenditures
29. The Government has succeeded in promoting economic growth and reducing poverty,including improving the equity of health and education spending. But there is consider-ablescope for further improving the effectiveness of public spending. Better processes are neededfor prioritizing recurrent and capital spending; recurrent spending needs to account for alarger share of total spending, so that more efficient use is made of the capital stock; sectoralministries need to play a larger role in prioritizing spending in their sectors; the system ofrecurrent expenditure norms needs to be simplified; local authorities need more flexibility toallocate funding to their priorities; and a formal budget process that better integrates capitaland recurrent budgets is needed.
30. Prioritizing recurrent and capital spending has been difficult, for several reasons.Prioritization is carried out separately for capital spending by the MPI and for recurl-elntspending by the MOF. Coordination is insufficient to ensure that the recurrent budgetimplications of planned capital spending are fully analyzed or that appropriate balancebetween recurrent and capital spending is attained. The current processes in MF'I forevaluating and prioritizing PIP projects need significant strengthening. There is a nced toimprove the evaluation criteria for projects, develop the skills of MPI staff and streamline PIPapproval process. A fixed five-year PIP does not permit the prioritization of capital spendingto be responsive to changes in the economic situation or the availability of resources. Theseproblems.are recognized by MPI and efforts are underway to address them.
31. There is an imbalance between capital and recurrent expenditures. It is Governmentpolicy that recurrent expenditures should not increase faster than investment expenditures. Asa result recurrent spending is too low, implying inefficient allocation and inadequate use ofthe public capital stock. For example, a significant proportion of irrigation capacity is notused because of inadequate operations and maintenance (O&M) expenditures. Routinemaintenance of roads (and inland waterways) is insufficient even though it is much moreexpensive to rehabilitate roads once they become unusable.
32. Sector ministries play too small a role in prioritizing spending in their sectors.Sector ministries prepare five-year targets and goals, but these are not linked to an affordableexpenditure plan. Each sector submits an annual plan for capital spending to the MPI and anannual plan for recurrent spending to the MOF. Because coordination among the threeministries in the finalization of these plans is inadequate, the process for prioritizing allexpenditures within a sector remains fragmented. There also appears to be limited scope forevaluating expenditures and reviewing policies, because sector ministries do not receivedetailed reports on actual expenditures in their sectors, especially by the provinces.
33. Given that O&M spending is insufficient to make adequate use of the capital stockin several sectors, further work is needed to determine what reallocation of recurrentspending between wage and wage-related expenses and O&M expenses may be needed.Wage and wage-related expenses do not appear to be crowding out O&M expenditures, asthey do in many other countries. However, anecdotal evidence suggest's that wage and wage-
vii
Viet Nam - Pub/li E.vpclniture Review 2000 MWai Repoi t
related expenses may be underreported, due to misclassification. Moreover, civil servicewages in Vietnam are unsustainably low. and pressures for wage increases are substantial.
34. The system of recuirrent expenditure itorms, which guides the allocatioln ofresources to and withinl sectors is complex and somne niorms are muJtutally conztradictory.Actual spending and service delivery standards in provinces and communes are sometimesinconsistent with stated Government priorities. The use of population-based norms forallocating resources to schools, for example, does not take into account varying enrollmentrates or adjust fully for different geographical conditions or cost disadvantages. As a result,poorer provinces and remote areas are often inadequately funded.
35. Local authorities, especially the comun/7wies, have insuifficientiflexibility to prioritizetheir ownI spendinig. Poorer provinces depend on cash transfers to meet minimum servicedelivery standards. but the existing transfer system is unable to meet their requiremenits.Districts and communes receive a share of those transfers, but they are often inadequate tomeet the nonwage costs of service delivery. This limits their flexibility in responding to localneeds, except to the extent that their revenues exceed budget estimates or they are able toresort to fees and voluntary contributions for a significant share of their revenue, which theyallocate in line with local preferences. Consideration could be given to providing localgovernments with additional revenue sources
36. A formal bIudget process ineeds to be established that better itntegrates capital anidrecurrenzt budgets and promtiotes prioritizatiorn that mzaxiimizes the imtzpact on growth anidpoverty reducetiont. Several actions would help achieve this:
* MPI and the MOF should improve existing mechanisms for coordinating capital andrccurrent expenditure. This shiould involve ministries and provinces submitting integratedcapital and recurrent budget requests to both the MOF and the MPI, and all parties shouldparticipate in future discussions on these budget requests.
* Develop medium-term sector expenditure programs as the basis for developing annualsectoral budget requests.
* Strengthen the MPI's processes for evaluatinig investment projects. Developing capacity,adopting more rigorous evaluation crite-ia, and turninig the PIP into a rolling five-yearexpenditure plan that is adjusted each year would improve the MPIs capacity to assess theappropriateness of investment priorities.
* MOF, together witlh the provinces and sector ministries, should review the cur-elntexpenditure norms-both the budget allocation norms used to guide expenditure tosectors and the budget transfer norms governing cash transfers to the provinces. Inreviewing the latter consider adopting a new, more equitable formula-based system; andconsider assigning some revenue-raising powers to lower levels of government. (TheGovernment believes that assigning such powel-s would not be appropriate at this timebut will undertake work to assess the pros and conls of such an action.)
Executive Slumniary
Enhancing the Pro-Poor Bias of Public Spending
37. There is considerable evidence that the Government's public expenditure programplays an important redistributive role and helps the poor. Although national safety netprograms are not particularly effective, cash transfers to poorer provinces and the distributionof health and education sector spending are redistributing income. But considerable scoperemains for improving the impact of public spending on the poor, particularly by bettertargeting social expenditures and developing alternative mechanisms for increasing incometransfers to the poorest.
38. Targeting of spending on public health and education, especially on education, hasimproved over time, and public social expenditures are now more equally distributed thanhousehold expenditures. For example, the poorest quintile received 18 percent of totalspending on public education in 1997/98 (a 2 percentage point increase over 1992/93) and 26percent of spending on primary education (a 6 percentage point increase).
39. Cash transfers to poorer provinces are performing a useful redistributive role, andallowing these provinces to support a higher level of service delivery. In 1998 at least 41provinces received cash transfers. Although richer provinces still spend more than poorerprovinces, provincial per capita expenditures are more equally distributed across provincesthan are per capita revenue collections, and they have become more equally distributed overtime. Nevertheless, the fact that the size of these cash transfers is only weakly related to thedepth and incidence of poverty in the provinces suggest that there is room for improvetargeting.
40. To enhance the pro-poor bias of public spending, four types of actions arerecommended:
* Target social spending more effectively at the poor. In primary health care, for example,spending could be reallocated from certain types of curative care to preventive care.Reallocating expenditure to rural roads will also assist the poor.
* Improve the operation of the existing system of user fee exemption for primary schoolsand certain types of hospital care. The existing system does not work in a particularlypro-poor way and forces. schools and clinics to fund exemptions from their ownresources. The goal would be to reduce the level of out-of-pocket payments made bypoor households, which appears to be very high relative to their incomes. One optionwould be to provide direct funding to some institutions to cover the cost of theseexemptions
* Examine other mechanisms for increasing income transfers to the poorest. One optionmight be to target income transfers to poor parents of primary school children, many ofwhom are funding nearly half the cost of primary schooling from their own meagerresources. A program (such as that successfully adopted in Indonesia) which providesscholarships to children from poor families, could be an effective targeting mechanism.
* Adopt a formula-based system for determining the amount of cash transfers to poorerprovinces, in order to ensure that transfers are more closely related to their needs. Further
ix
Viet N'umn - Pu,blu E.xpolautui e Review 2()0(: Muin Report
work should be undertaken to explore the implications of alternative formulas, developconsensus around a particular formula, and then adopt it in the revised budget law.
Reallocating Spending within Sectors
41. Three of the four sectors examined suggest the need for reallocating spending toimprove outcomes-education is the exception. Given the limited scope for raising totalspending, reallocation is likely to be the main source of improvement in the medium term.
Agriculture
42. Public expenditure on agriculture accounts for about 6 percent of the state budget and1.3 percent of GDP. Although this is much lower than in China, India, or Thailand (whichspend 8-16 percent of their budgets on agriculture), the sector growth has been one of thestrongest among developing countries.
43. Given that most growth in the sector is expected to come from crop diversificationand increases in yields, improving irrigation, extension, and research will be important.Irrigation currently accounts for half of agricultural expenditure, but the imbalance betweencapital and recurrent spending means that a significant share of irrigation facilities are notused because of inadequate O&M. Public spending on research is very small and increased itsspending (the returns to which are very high worldwide) could raise agricultural productivityand enhance the international competitiveness of Vietnamese agricultural products.
44. Several reforms could improve performance in the sector:
* Increase public spending on agricultural research and extension, especially in the poorestcommunes. Funding of this additional spending could come from reallocating statesubsidies, transfers, and investments from some loss-making state-owned enterprises.
* Improve linkages between research and extension, and involve farmers and agro-industryrepresentatives in the management of these services.
* Improve irrigation service delivery and cost recovery by basing irrigation charges onwater consumption and improving the collection system.
* Extend pilot projects for developing water user associations.* Improve the performance of reforestation programs.
Health
45. Public spending on health grew rapidly over the past five years, reaching 7 percent ofthe budget in 1998 (about 1.4 percent of GDP), although still relatively low by internationalstandards. Nearly two-thirds of spending on health is carried out by provinces, communes,and districts. Curative care absorbs a disproportionate 70 percent of the health budget, whilepreventative care receives just 15 percent; another 7 percent goes to family planning.
46. Although public expenditures on health have risen rapidly since the early 1990s,households finance nearly 80 percent of total health care spending. Out-of-pocket paymentsfor the poor are very large relative to their incomes. A fee exemption mechanism for poorpatients exists, but it appears not to function well.
x
Evecutive Summary
47. Increases in public spending on health have been accompanied by impressive gains inthe health status of Vietnam's population, but there is scope for improving delivery of healthservices by reallocating spending. Several reforms could help improve health care delivery:
* Shift from high-cost hospital based services to more cost-effective commune healthcenters.
* Establish a national strategy for assistance to the poor with their health care costs. Thismay include improving the system of user fees exemption for the poor, and ensuring thatit functions effectively.
* Once such a strategy is in place the Government should consider raising user fees athospitals, to reduce budgetary subsidies to hospitals.
* Develop mechanisms for ensuring that provinces make their health spending patternsconsistent with national health priorities and strategies.
* Improve the budget transfer norms (used in determining transfers to the provinces) forhealth sector public spending to reduce disparities among provinces in the delivery ofminimum services.
* Consider expansion of the health insurance program, especially the voluntary scheme, asa means of reducing health costs to the budget.
* In the longer run, rethink the role of the state in the health sector. It may make moresense for the government to reduce its role in the direct provision of curative, hospital-based health services and focus instead on providing high-quality preventive healthservices; financing health expenditures, especially for the poor; and improving regulationand monitoring of the growing private health sector.
Education
48. Vietnam has made considerable progress in increasing educational enrollments at alllevels and improving the efficiency and equity of education spending. Total education andtraining expenditure has grown significantly over the past five years, reaching 17 percent oftotal public spending exclusive of amortization (about 3.5 percent of GDP) in 2000. As aresult, the number of teachers and the average duration of studies have risen, albeit fromrelatively low levels. However, additional public spending will be necessary given the likelygrowth in enrollments in lower secondary schools, flowing through from increased primaryenrollments. Raising pupil/teacher ratios can reduce but not eliminate the need for suchincreases.
49. Spending on education is highly decentralized, with more than 73 percent of totalspending carried out by provinces, districts, and communes. School education represents 62percent of total spending on public education, with 36 percent of spending allocated toprimary education and 18 percent to lower secondary education. This intrasectoral allocationappears to be appropriate and should be maintained. The balance between wages andnonwage expenditure is also reasonable, although there is some evidence of misclassificationof nonwage spending. Nearly half of total spending on primary education is financed byhouseholds, which implies an undue burden on the poor.
xi
Iliet Ncani - Publ/i Expe,dlitml e Review 2000() -Main Reporl
50. There is little scope for reallocating of public spending across primary, secondary, andtertiary education services without damaging service delivery. But there is a need to reduceexisting regional variations in expenditures and quality by reviewing the system of budgettransfer norms.
51. Several reforms could improve the effectiveness of spending on education:
* Consider gradually increasing spending on education from 15 percent of publicexpenditure to around 20 percent by 2005.
* Simplify the system of allocative norms for education expenditures, and replace themwith guidelines under which local management has discretion as long as educationaloutcomes are achieved and the budget allocation not exceeded.
* Address existing regional variations by reviewing the present system of norms budgettransfer for allocating education funds to the provinces.
* Increase pupil/teacher ratios at all levels as enrollment rates rise.* Consider establishing a revolving fund that would leverage expenditure on school
construction by lending lending school funds for construction.* Develop outcome indicators to assess the impact of expenditures by testing student
attainment on a regular basis.
Transport
52. Public spending on transport increased significantly over the past decade, but theefficiency of the sector remains low. The poor state of the country's roads imposes economiccosts on users of about $160 million a year, according to the World Bank. Problems withports and railways exist as well. Expenditure priorities have focused on rehabilitation andmodernization of transport infrastructure, especially roads
53. Nearly 11 percent of total public spending (about 2.2 percent of GDP) goes totransport-a figure that is comparable to other countries-with over 90 percent going toroads. Nearly a third of road expenditure is in the growth corridors of Ho Chi Minh City (BaRia Vung Tau and Hanoi-Haiphong). But recurrent spending represents only about 12 percentof total road spending, and road maintenance has remained underfunded relative to capitalinvestment. Progress in improving rural roads has been slow.
54. To address these problems, the Government will consider several reforms.
* For recurrent spending, it will consider reallocating expenditures to increase roadmaintenance to an adequate level, possibly by establishing an earmarked road fundfinanced by a levy on gasoline and other charges.
* It will also consider increasing spending on maintenance of inland waterways.
* For capital spending, the Government will consider reallocating spending toward ruralroads. It will also improve processes to ensure better quality and management oftransport infrastructure projects.
xii
Ex cut,tivZe Summary
Assessing the Scope for Shifting Services to the Private Sector
55. Given the pressures on the budget, there is a need to reassess the scope for privatedelivery of services in education, health, and infrastructure. Doing so could reduce demandson the budget without reducing the services needed for growth and poverty reduction. Somegrowth in private services in health and education has already occurred, mainly in urbanareas, but little private investment has been made in infrastructure, except in water supply.More private sector involvement will be needed if the availability of public resources is not tobe a constraint to achieving Vietnam's potential. The Government may consider undertakinga detailed assessment of the scope for gradually shifting services to the private sector.
56. It may also be necessary to expedite the pace of state-owned enterprise reformparticularly in the transport and agriculture sectors and especially for troubled enterprises, inorder to reduce the fiscal risk borne by the Government. While state-owned enterprises nolonger receive direct or cash subsidies in Vietnam, some continue to receive on implicitsubsidies from the budget in the form of loans at concessionary interest rates, debt andinterest forgiveness, and tax exemptions. The full extent of this support is not known.Moreover, with Vietnam's integration into AFTA and the consequent reductions in importprotection, some of these state-owned enterprises are likely to begin to require cash and directsubsidies.
57. Increased private sector participation could occur through new entry of private firmsand through shifting ownership by equitizing and divesting state-owned enterprises. Privatesector involvement in operations (e.g. of ports and airports), need not be inconsistent with theGovernment's objective of retaining strategic control of these activities. As privatizationproceeds, sector ministries will need to strengthen their monitoring and policymaking role toexercise this strategic control.
What Is Doable in the Short and Medium Term?
58. The attached Timetable of Next Steps sets out the possible time frame of the mainrecommendations of this PER on the basis of short-term or medium term.
59. Preparation of the 2001 budget provides the Government with the opportunity toinstitute some of the changes in spending suggested in this PER and to consider some of thesuggestions for improving the budgetary process. However, some expenditure reallocationshave institutional preconditions, suggesting that major expenditure reallocations may have tobe phased in gradually. The development of the 2001-05 PIP also provides an opportunity forconsidering the findings and options suggested in this PER, on both expenditure allocationsand improvements in PIP processes. The Government's intention to review the operation ofthe budget law in 2000 will also provide the opportunity for many of the recommendations onimproving budgetary processes and public expenditure management to be considered.
60. The need to improve information and prioritization and to determine affordabilitycreate common institutional requirements across sectors, such as developing an aggregate
xiii
Viet Nam - Public Expenditure Review 2000 1 Main Report
mecilum-termn fiscal plan and medium-term strategies. Developing such plans and strategieswill.require that the Government commit itself to a significant program of policy analysis anddevelopment and to improving the budgetary and expenditure management system.Developing this institutional capacity will take time. A shared commitment to andunderstanding of this process throughout the Government (including the Office ofGovernment, MOF, MPI sectoral ministries, provincial governments, and the NationalAssembly) is an important precondition.
61. In considering these issues, the Government can build on the extensive consultativeprocess already developed for this PER. Apart from the National Assembly, the provinces,and other subnational levels of government it could also consider consulting representativesof the media and civil society wherever possible. The World Bark stands ready to provideassistance in these consultations.
xiv
Evecut,ive Sumrnary
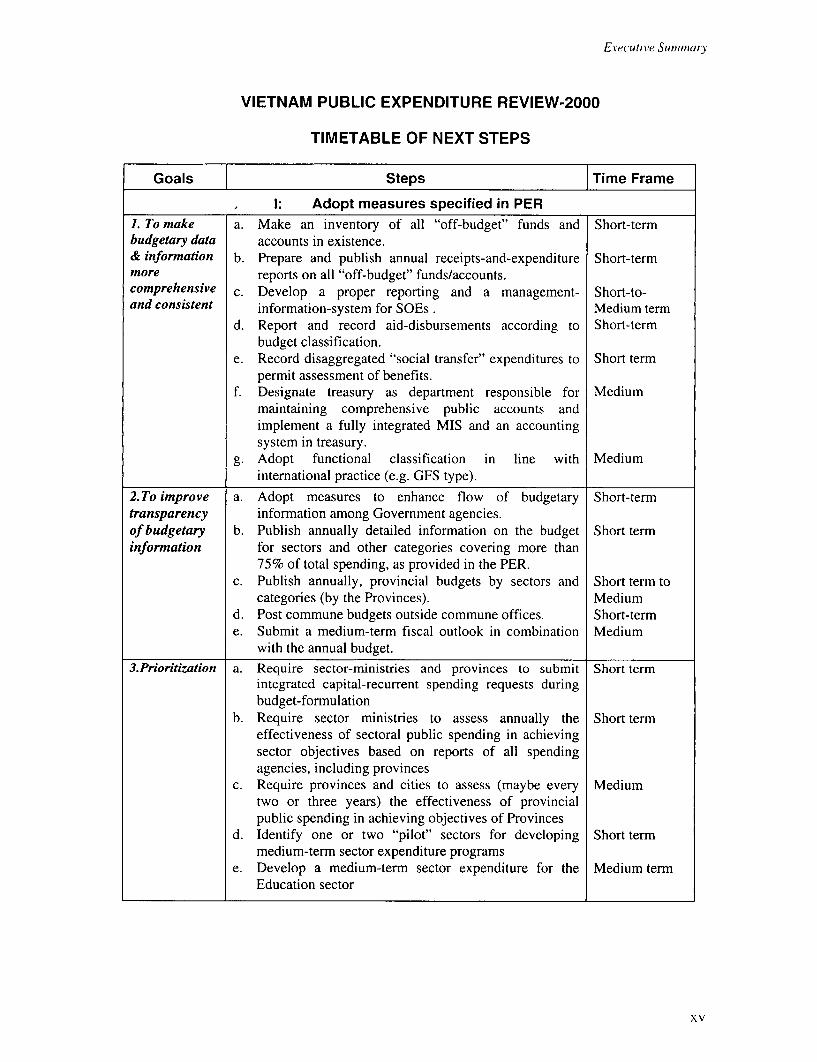
VIETNAM PUBLIC EXPENDITURE REVIEW-2000
TIMETABLE OF NEXT STEPS
Goals Steps |Time Frame
, 1: Adopt measures specified in PER1. To make a. Make an inventory of all "off-budget" funds and Short-termbudgetary data accounts in existence.& information b. Prepare and publish annual receipts-and-expenditure Short-termmore reports on all "off-budget" funds/accounts.comprehensive c. Develop a proper reporting and a management- Short-to-and consistent information-system for SOEs . Medium tern
d. Report and record aid-disbursements according to Short-termbudget classification.
e. Record disaggregated "social transfer" expenditures to Short termpermit assessment of benefits.
f. Designate treasury as department responsible for Mediummaintaining comprehensive public accounts andimplement a fully integrated MIS and an accountingsystem in treasury.
g. Adopt functional classification in line with Mediuminternational practice (e.g. GFS type).
2.To improve a. Adopt measures to enhance flow of budgetary Short-termtransparency information among Government agencies.of budgetary b. Publish annually detailed information on the budget Short terminformation for sectors and other categories covering more than
75% of total spending, as provided in the PER.c. Publish annually, provincial budgets by sectors and Short term to
categories (by the Provinces). Mediumd. Post commune budgets outside commune offices. Short-terme. Submit a medium-term fiscal outlook in combination Medium
with the annual budget.3.Prioritization a. Require sector-ministries and provinces to submit Short term
integrated capital-recurrent spending requests duringbudget-formulation
b. Require sector ministries to assess annually the Short termeffectiveness of sectoral public spending in achievingsector objectives based on reports of all spendingagencies, including provinces
c. Require provinces and cities to assess (maybe every Mediumtwo or three years) the effectiveness of provincialpublic spending in achieving objectives of Provinces
d. Identify one or two "pilot" sectors for developing Short termmedium-term sector expenditure programs
e. Develop a medium-term sector expenditure for the Medium termEducation sector
xv
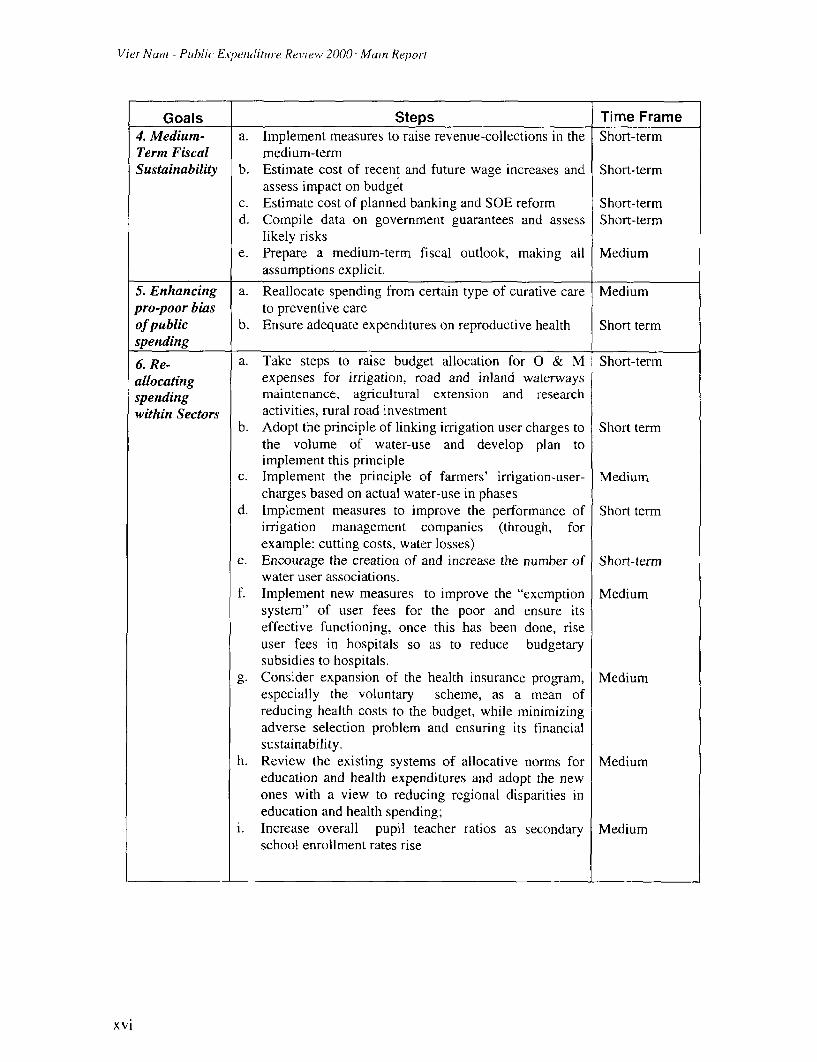
Viet Nani - Public Expenditure Review 2000 -Main ReporI
Goals Steps Time Frame4. Medium- a. Implement measures to raise revenue-collections in the Short-termTerm Fiscal medium-termSustainability b. Estimate cost of recent and future wage increases and Short-term
assess impact on budgetc. Estimate cost of planned banking and SOE reform Short-termd. Compile data on government guarantees and assess Short-term
likely riskse. Prepare a medium-term fiscal outlook, making all Medium
assumptions explicit.
5. Enhancing a. Reallocate spending from certain type of curative care Mediumpro-poor bias to preventive careof public b. Ensure adequate expenditures on reproductive health Short termspending
6. Re- a. Take steps to raise budget allocation for 0 & M Short-termallocating expenses for irrigation, road and inland waterwaysspending maintenance, agricultural extension and researchwithin Sectors activities, rural road investment
b. Adopt the principle of linking irrigation user charges to Short termthe volume of water-use and develop plan toimplement this principle
c. Implement the principle of farmers' irrigation-user- Mediumcharges based on actual water-use in phases
d. Implement measures to improve the performance of Short termirrigation management companies (through, forexample: cutting costs, water losses)
e. Encourage the creation of and increase the number of Short-termwater user associations.
f. Implement new measures to improve the "exemption Mediumsystem" of user fees for the poor and ensure itseffective functioning, once this has been done, riseuser fees in hospitals so as to reduce budgetarysubsidies to hospitals.
g. Consider expansion of the health insurance program, Mediumespecially the voluntary scheme, as a mean ofreducing health costs to the budget, while minimizingadverse selection problem and ensuring its financialsustainability.
h. Review the existing systems of allocative norms for Mediumeducation and health expenditures and adopt the newones with a view to reducing regional disparities ineducation and health spending;
i. Increase overall pupil teacher ratios as secondary Mediumschool enrollment rates rise
xvi
Executive Sunmmury
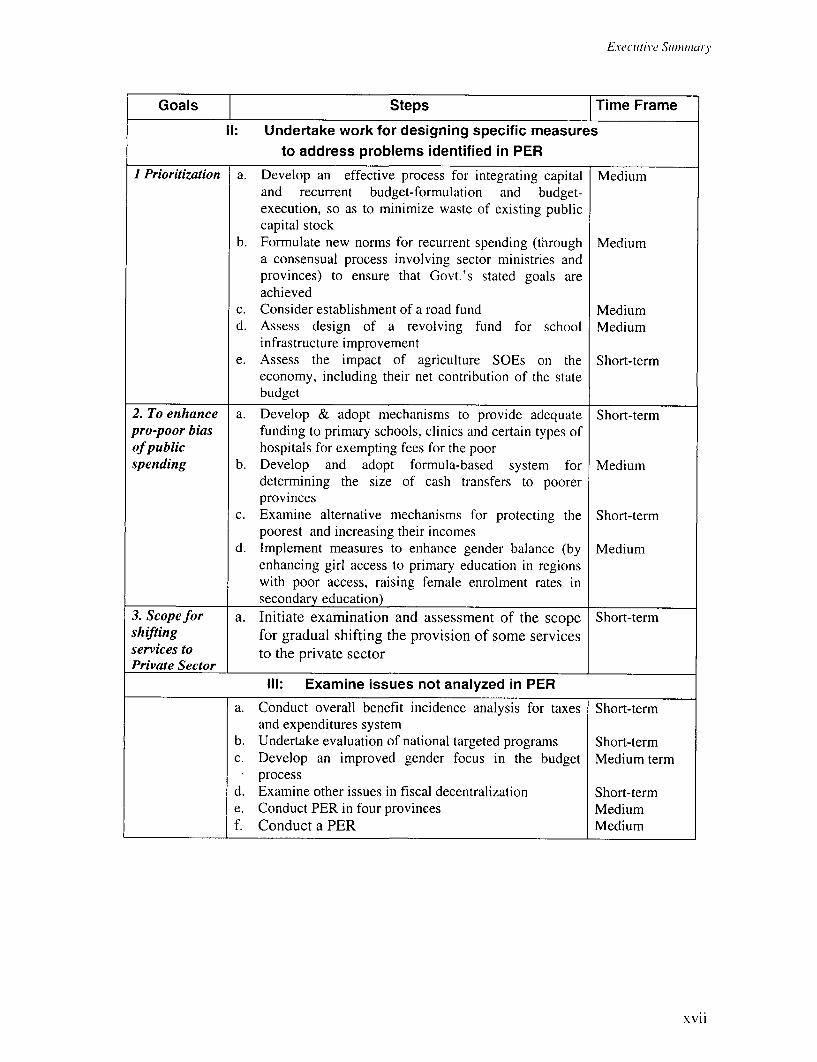
Goals Steps Time FrameII: Undertake work for designing specific measures
to address problems identified in PERI Prioritization a. Develop an effective process for integrating capital Medium
and recurrent budget-formulation and budget-execution, so as to minimize waste of existing publiccapital stock
b. Formulate new norms for recurrent spending (through Mediuma consensual process involving sector ministries andprovinces) to ensure that Govt.'s stated goals areachieved
c. Consider establishment of a road fund Mediumd. Assess design of a revolving fund for school Medium
infrastructure improvemente. Assess the impact of agriculture SOEs on the Short-term
economy, including their net contribution of the statebudget
2. To enhance a. Develop & adopt mechanisms to provide adequate Short-termpro-poor bias funding to primary schools, clinics and certain types ofof public hospitals for exempting fees for the poorspending b. Develop and adopt formula-based system for Medium
determining the size of cash transfers to poorerprovinces
c. Examine altemative mechanisms for protecting the Short-termpoorest and increasing their incomes
d. Implement measures to enhance gender balance (by Mediumenhancing girl access to primary education in regionswith poor access, raising female enrolment rates insecondary education)
3. Scope for a. Initiate examination and assessment of the scope Short-termshifting for gradual shifting the provision of some servicesservices to to the private sectorPrivate Sector
IlI: Examine issues not analyzed in PERa. Conduct overall benefit incidence analysis for taxes Short-term
and expenditures systemb. Undertake evaluation of national targeted programs Short-termc. Develop an improved gender focus in the budget Medium term
processd. Examine other issues in fiscal decentralization Short-terme. Conduct PER in four provinces Mediumf. Conduct a PER Medium
xvii

CHAPTER 1FISCAL SUSTAINABILITY AND TRANSPARENCY
Current situation
1. 1 Vietnam has a history of fiscal prudence with relatively small budget deficits(generally less than 1 percent of GDP, excluding on-lending) and low debt (both domesticand foreign) as a share of GDP. This is reflected in the level of interest payments in thebudget of about 3 percent of total expenditure. The Budget Law permits borrowing for onlyinvestment expenditures and National Assembly decision limits budget deficit to less than 5percent of GDP.
1. 2 However, the fiscal balance does not fully cover all government spending i.e.consolidated general government. It excludes a number of significant off-budget accounts asdiscussed in paragraph 1.11. Significant quasi fiscal activity involving finance from thebanking system to State Owned Enterprises (SOEs) is also not included. It also excludes on-lending of ODA funds to SOEs.
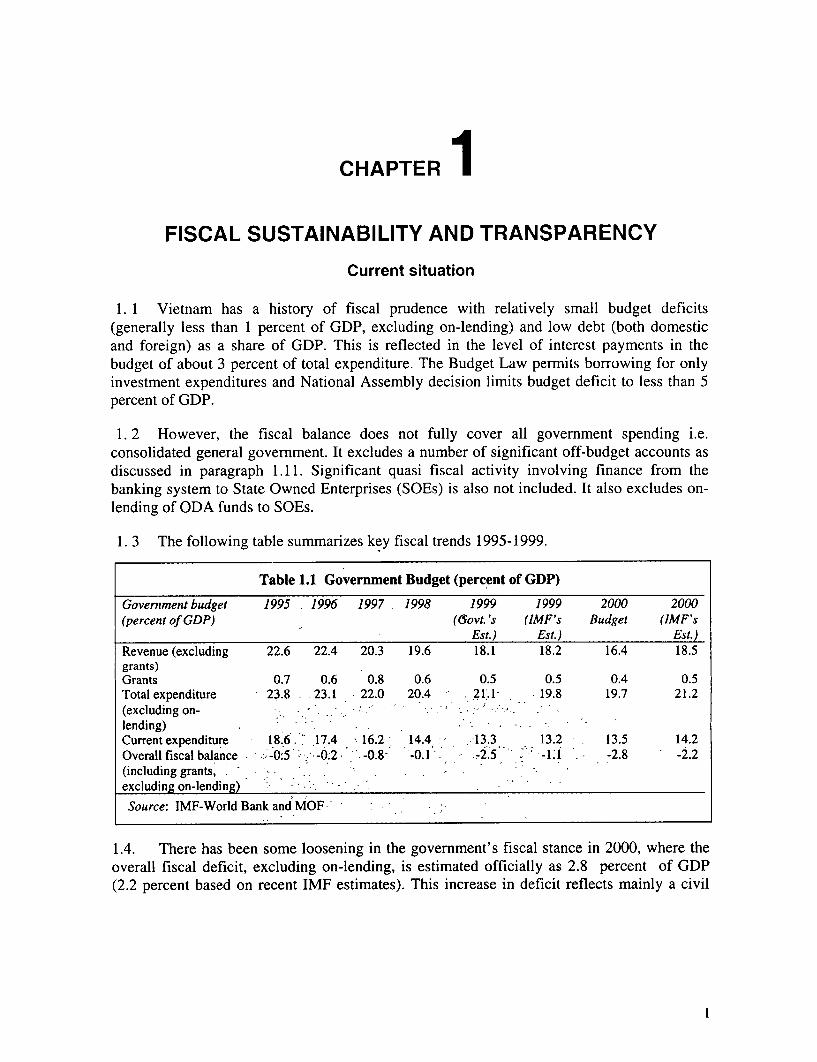
1. 3 The following table summarizes key fiscal trends 1995-1999.
Table 1.1 Government Budget (percent of GDP)
Government budget 1995 1996 1997 1998 1999 1999 2000 2000(percent of GDP) (GYovt. 's (IMF's Budget (IMF's
Est.) Est.) Est.)Revenue (excluding 22.6 22.4 20.3 19.6 18.1 18.2 16.4 18.5grants)Grants 0.7 0.6 0.8 0.6 0.5 0.5 0.4 0.5Total expenditure 23.8 23.1 22.0 20.4 21.1 - 19.8 19.7 21.2(excluding on-lending)Current expenditure 18.6. 17.4 16.2 14.4 .13.3 13.2 13.5 14.2Overall fiscal balance :-0.5 - -0;. -0.8 -0.1 . -- 2.5 -v -J. -2.8 -2.2(including grants, . - .excluding on-lending)
Source: IMF-World Bank and MOF : .
1.4. There has been some loosening in the government's fiscal stance in 2000, where theoverall fiscal deficit, excluding on-lending, is estimated officially as 2.8 percent of GDP(2.2 percent based on recent IMF estimates). This increase in deficit reflects mainly a civil
Viet Nani, - Pibl/ic Ex/peniditure RL'leviw 2000: MA'ain Repo,t
service wage increase (0.8 percent of GDP) the carry-over of under-spent capital expenditureallocations from 1999 as a modest fiscal stimulus.
1.5. The medium term fiscal position envisages overall deficits of around of 2 percent ofGDP for the years 2001-2003. This pressure increases in revenue and limits growth of thewage bill. However the actual size of the deficit will also depend on the pace and scope ofstructural reforms and the cost of those reform.
Potential risks to fiscal sustainability
1.6. The potential risks to fiscal sustainability faced by Vietnam are manageable in thenear term. Declining revenue and new pressures for raising expenditure suggest the need foran accurate assessment of trends and certain actions to mitigate these risks.
Thius somie fiscal adjustment will be required in the medium-termn to ensure that these deficitsare not exceeded. The Government needs to develop these measures now to ensure an easyadjustmnent as part of its fiscal strategy
1.7. Revenue collections as a percentage of GDP has fallen by over 4 percent of GDP overthe period 1996-1999 as indicated in Table 1.1. This erosion in revenue reflects a range offactors including reduction in economic growth, a reduction in imports, poorer SOEperformance (SOE payments are a substantial part of budget revenues) and someweaknesses in tax administration.
1.8. Strong revenue efforts will be needed to increase revenue collections as a share ofGDP - to around 19-20 percent of GDP - otherwise medium term fiscal sustainability may bethreatened. This increase could be achieved by broadening the revenue base, removingdiscretionary exemptions for VAT and further strengthening of the tax administration.Strengthening SOE profitability must be part of this revenue improvement strategy. Anyfuture trade reform will also have revenue implications, which should be allowed for in theGovernments fiscal strategy.
1.9. Expenditure pressures arise from at least four different sources. First, low wage ratesof the civil service is being addressed An initial increase of 25 percent in 2000 is expected tobe followed by further increases in future years (2001 budget plan that is under preparationenvisages about 17% increase). Unless the Government's proposal for downsizing generaladministration by 15 percent is implemented, these raises will squeeze out other expenditures.The Government needs to develop full cost estimates of recent and planned future wageincreases and together with alternative scenarios of employment reductions to ascertain itsmedium-term implications. Second, the likely costs of SOE and banking reform willcontribute to the higher budget deficit for each of the next three years (see Box 1.1)1, thoughthis should be easily financeable by prospective external donor support While capital costs of
' Critical details of the Government's SOE reform plans are not yet available to enable a more precise costing ofthe potential fiscal burden. Under tentative reform scenarios, Bank-Fund estimates that the current costs ofreform could start at 0.5 percent of GDP in 2000, and average about I percent of GDP annually over 2000-03.
Chapter 1: Fiscal Sustuinucbility uandI Trunspurenc
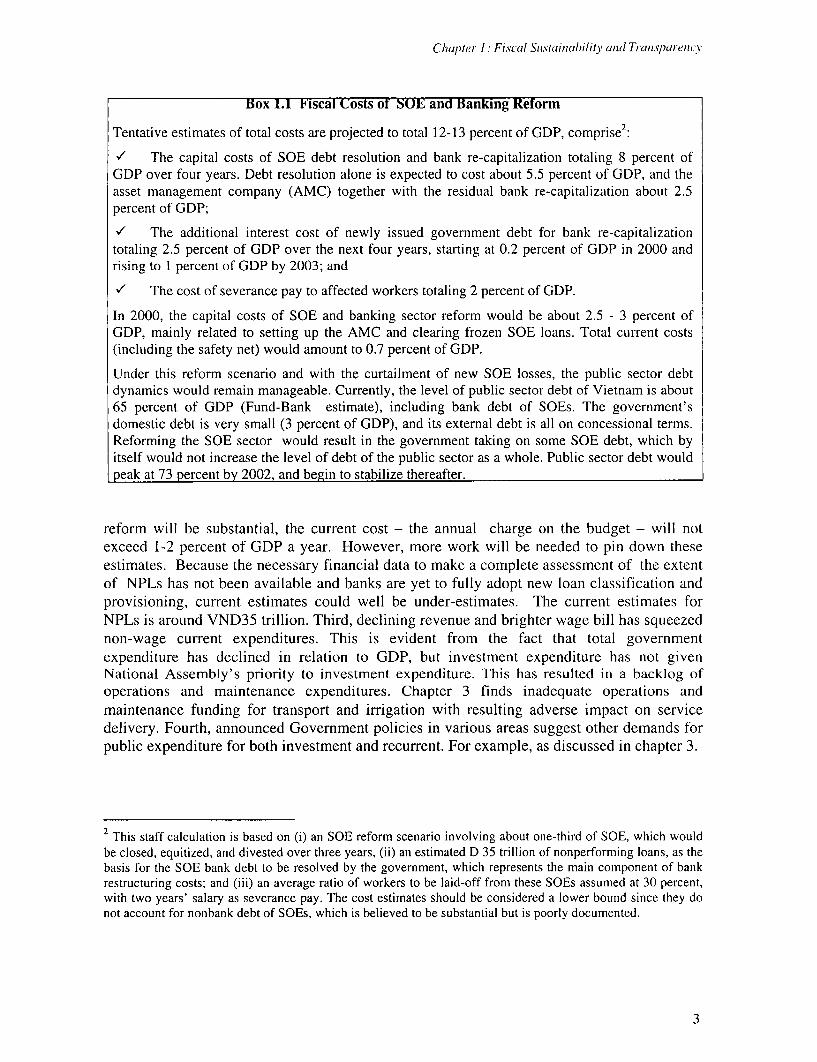
Box 1.1 Fiscal Costs of SOL and Banking Reform
2Tentative estimates of total costs are projected to total 12-13 percent of GDP, comprise
vl The capital costs of SOE debt resolution and bank re-capitalization totaling 8 percent ofGDP over four years. Debt resolution alone is expected to cost about 5.5 percent of GDP, and theasset management company (AMC) together with the residual bank re-capitalization about 2.5percent of GDP;
/ The additional interest cost of newly issued government debt for bank re-capitalizationtotaling 2.5 percent of GDP over the next four years, starting at 0.2 percent of GDP in 2000 andrising to 1 percent of GDP by 2003; and
v' The cost of severance pay to affected workers totaling 2 percent of GDP.
In 2000, the capital costs of SOE and banking sector reform would be about 2.5 - 3 percent ofGDP, mainly related to setting up the AMC and clearing frozen SOE loans. Total current costs(including the safety net) would amount to 0.7 percent of GDP.
Under this reform scenario and with the curtailment of new SOE losses, the public sector debtdynamics would remain manageable. Currently, the level of public sector debt of Vietnam is about65 percent of GDP (Fund-Bank estimate), including bank debt of SOEs. The government'sdomestic debt is very small (3 percent of GDP), and its external debt is all on concessional terms.Reforming the SOE sector would result in the government taking on some SOE debt, which byitself would not increase the level of debt of the public sector as a whole. Public sector debt wouldpeak at 73 percent by 2002, and begin to stabilize thereafter.
reform will be substantial, the current cost - the annual charge on the budget - will notexceed 1-2 percent of GDP a year. However, more work will be needed to pin down theseestimates. Because the necessary financial data to make a complete assessment of the extentof NPLs has not been available and banks are yet to fully adopt new loan classification andprovisioning, current estimates could well be under-estimates. The current estimates forNPLs is around VND35 trillion. Third, declining revenue and brighter wage bill has squeezednon-wage current expenditures. This is evident from the fact that total governmentexpenditure has declined in relation to GDP, but investment expenditure has not givenNational Assembly's priority to investment expenditure. This has resulted in a backlog ofoperations and maintenance expenditures. Chapter 3 finds inadequate operations andmaintenance funding for transport and irrigation with resulting adverse impact on servicedelivery. Fourth, announced Government policies in various areas suggest other demands forpublic expenditure for both investment and recurrent. For example, as discussed in chapter 3.
2 This staff calculation is based on (i) an SOE reform scenario involving about one-third of SOE, which wouldbe closed, equitized, and divested over three years, (ii) an estimated D 35 trillion of nonperforming loans, as thebasis for the SOE bank debt to be resolved by the government, which represents the main component of bankrestructuring costs; and (iii) an average ratio of workers to be laid-off from these SOEs assumed at 30 percent,with two years' salary as severance pay. The cost estimates should be considered a lower bound since they donot account for nonbank debt of SOEs, which is believed to be substantial but is poorly documented.
3
Viet Nani - Public Expenditure Review 2000 Main Report
* Impressive enrollment results in primary education will raise demand for additionalexpenditure in lower secondary education.
* Transport master plan envisages additional recurrent and capital expenditures in thatsector
* The low level of expenditures on social safety net programs call for higher expenditurein the medium-term.
1.10. On the other band this PER also identifies areas which might provide furtherresources or reduce expenditure demands on the budget. Apart from improving theperformance of SOEs, as discussed above, these include
* Reviewing the role of the state in areas where the private sector may be able toadequately provide services.
* Placing more emphasis on user charges, for example in areas of hospitals (withappropriate assistance strategies for the poor), road expenditure and irrigation.
1.11. No comprehensive or regular financial information is available on the off-budgetaccounts but there are at least seven off-budget accounts in existence:
* Social Security Insurance Fund
* Health Insurance Fund
* National Development Support Fund (to support policy-based lending)
* Export Support Fund (formerly the Price Stabilization Fund)
* SOE Restructuring Support Fund (to cover the cost of workers made redundant bySOE reform, to resolve SOE debt, and to provide support for SOE investment)
* Sinking Fund (for repayment of foreign debt, on-lent by government)
* Re-forestation Program Lending Fund
1.12. According to MOF, transactions in these accounts amount to only about one percent
of GDP and most of these are self financing i.e. dependent on specific sources of revenue,and the accounts cannot go into deficit by law. Thus contingent fiscal risk arising from these
funds is limited.
1.13. The only exception is the National Development Support Fund, established to provide
concessionary loans to priority activities, as directed by the Government. As this fund mayborrow beyond its initial funding provided from the budget, there is a risk that is fund
borrows excessively and its loans perform poorly. Transparency concerning the operations of
this fund is therefore particularly important.
4
Chal1 ter I Fisxcal Sustainability andIC Transparency
Nevertheless the Government should ensure that off-budget accounts are limited as far aspossible, that it has adequate information on their operations to limit any fiscal risk, thattheir operations are integrated as far as possible into overall budgetary decision making andthat there is adequate reporting of their activities.
1.14. Management of contingent liabilities in the form of loan guarantees is also important.The government has provided data on explicit loan guarantees of 14 credits totaling US$345million for the three years 1996-98. However, a comprehensive data base will need to bedeveloped and updated regularly by MOF to adequately monitor these fiscal risks.
Assessing Fiscal Sustainability
1.15. This section highlights a few areas where the government of Vietnam needs to focusin order to develop a framework for determining sustainability of the country's current fiscalstance. The findings and recommendations are intended to assist Vietnam in developing aclearer picture of potential fiscal risks, so as to improve the effectiveness of fiscal policy. Aforward looking process will be key to properly assessing the budgetary costs associated withenvisaged structural reforms. Taking the necessary steps to make a complete assessment offiscal sustainability might also form the basis for formulating a medium-term expenditureframework, which could be an important tool for improving expenditure management.
1.16. Fiscal sustainability addresses the issue of whether the current fiscal position can bemaintained over the medium term without excessively raising the overall debt burden andundermining macroeconomic stability. Various models have been developed to assess fiscalsustainability, which typically involve comparing expected primary deficits (deficit beforeinterest charges) with sustainable primary deficits.3 If current and future policy stances, asembodied in the expected primary deficits, require untenable levels of debt-both domesticand foreign, fiscal adjustment would be necessary in order to return a country to a sustainablefiscal path. Typically, models for assessing fiscal sustainability incorporate country-specificassumptions and a sensitivity test of expected fiscal deficits to changes in policies-bothdirectly through new revenue and expenditure measures and indirectly through other changesin macroeconomic policies and implementation of structural reforms. Moreover, fiscalsustainability would be sensitive to changes in the external environment.
Fiscal sustainability in Vietnam
1.17. The analysis of whether Vietnam is on a sustainable fiscal path is a backward andforward looking exercise and would need to incorporate a number of factors. First, the impactof potential changes in macroeconomic policies and in the pace, cost and scope of structuralreforms must be reviewed in terms of their direct and indirect effects on fiscal performance.Second, the current and projected level and composition of revenue and expenditure must be
3 The sustainable primary deficit is defined as the deficit level that can be financed without adding toa country's overall debt burden. It would typically be examined in terms of the ratio of official debt toGDP.
5
Viet Nani - Publa Expenditure Review 2000 Muini Repoi I
examined closely to see whether they are consistent with overall policy objectives such ashigh rates of sustained economic growth, low inflation, and broad-based poverty reduction. Athird and related consideration is an assessment of the vulnerability of current fiscal policiesto shocks so as to ensure overall fiscal performance is not tied excessively to factors beyondVietnam's control, such as terms of trade shocks (e.g. oil price changes), exchange raterealignments, or unanticipated climatic changes. For factors that can be potentially controlled,a full appraisal would need to be made as to whether the government of Vietnam had theresources and capacity to properly forecast and manage its primary deficit (e.g. throughestablishing a medium-term expenditure framework and supporting systems for accountingfor, monitoring, and hedging against fiscal risks, etc.)
1.18. Box 1.2 sets out key areas of focus in assessing fiscal sustainability
6
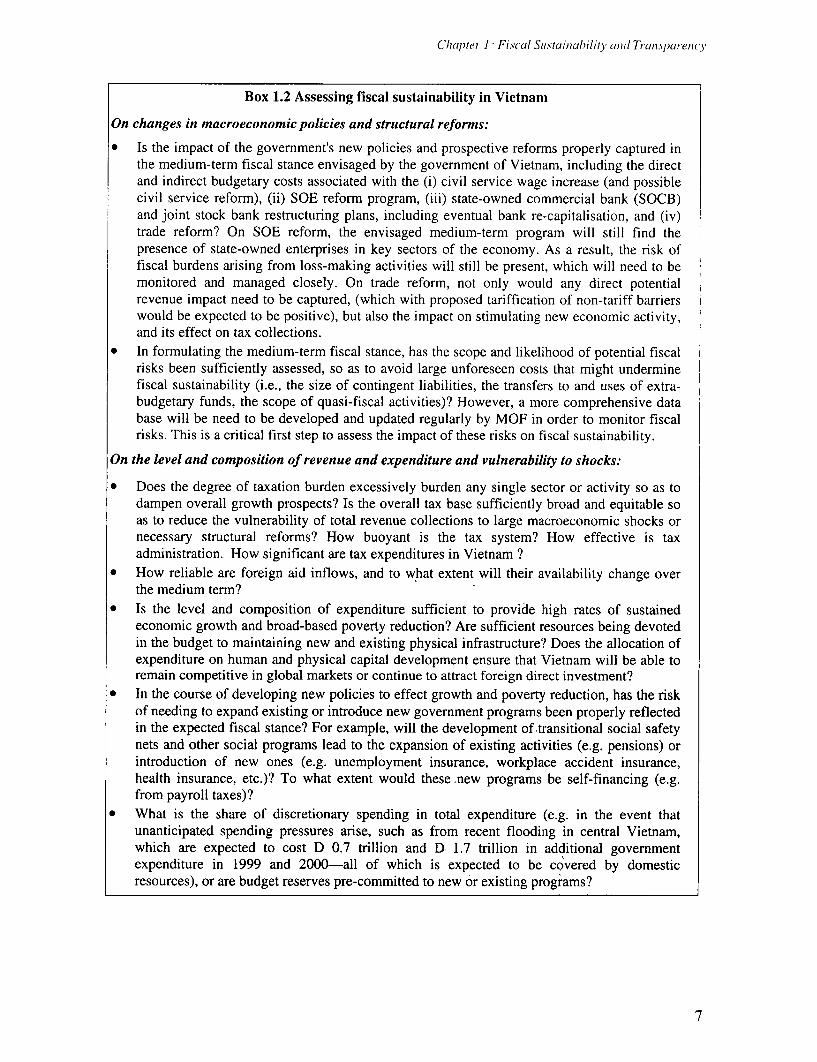
Chap?tei 1 -Fiscal Sustainability and Transparency
Box 1.2 Assessing fiscal sustainability in Vietnam
On changes in macroeconomic policies and structural reforms:
* Is the impact of the government's new policies and prospective reforms properly captured inthe medium-term fiscal stance envisaged by the government of Vietnam, including the directand indirect budgetary costs associated with the (i) civil service wage increase (and possiblecivil service reform), (ii) SOE reform program, (iii) state-owned commercial bank (SOCB)and joint stock bank restructuring plans, including eventual bank re-capitalisation, and (iv)trade reform? On SOE reform, the envisaged medium-term program will still find thepresence of state-owned enterprises in key sectors of the economy. As a result, the risk offiscal burdens arising from loss-making activities will still be present, which will need to bemonitored and managed closely. On trade reform, not only would any direct potentialrevenue impact need to be captured, (which with proposed tariffication of non-tariff barrierswould be expected to be positive), but also the impact on stimulating new economic activity,and its effect on tax collections.
* In formulating the medium-term fiscal stance, has the scope and likelihood of potential fiscalrisks been sufficiently assessed, so as to avoid large unforeseen costs that might underminefiscal sustainability (i.e., the size of contingent liabilities, the transfers to and uses of extra-budgetary funds, the scope of quasi-fiscal activities)? However, a more comprehensive database will be need to be developed and updated regularly by MOF in order to monitor fiscalrisks. This is a critical first step to assess the impact of these risks on fiscal sustainability.
On the level and composition of revenue and expenditure and vulnerability to shocks:
* Does the degree of taxation burden excessively burden any single sector or activity so as todampen overall growth prospects? Is the overall tax base sufficiently broad and equitable soas to reduce the vulnerability of total revenue collections to large macroeconomic shocks ornecessary structural reforms? How buoyant is the tax system? How effective is taxadministration. How significant are tax expenditures in Vietnam ?
* How reliable are foreign aid inflows, and to what extent will their availability change overthe medium term?
* Is the level and composition of expenditure sufficient to provide high rates of sustainedeconomic growth and broad-based poverty reduction? Are sufficient resources being devotedin the budget to maintaining new and existing physical infrastructure? Does the allocation ofexpenditure on human and physical capital development ensure that Vietnam will be able toremain competitive in global markets or continue to attract foreign direct investment?
* In the course of developing new policies to effect growth and poverty reduction, has the riskof needing to expand existing or introduce new government programs been properly reflectedin the expected fiscal stance? For example, will the development of transitional social safetynets and other social programs lead to the expansion of existing activities (e.g. pensions) orintroduction of new ones (e.g. unemployment insurance, workplace accident insurance,health insurance, etc.)? To what extent would these new programs be self-financing (e.g.from payroll taxes)?
* What is the share of discretionary spending in total expenditure (e.g. in the event thatunanticipated spending pressures arise, such as from recent flooding in central Vietnam,which are expected to cost D 0.7 trillion and D 1.7 trillion in additional governmentexpenditure in 1999 and 2000-all of which is expected to be covered by domesticresources), or are budget reserves pre-committed to new or existing programs?
7
Viet Nuni - Public Expenditure Review 2000 Main Report
1.19. There are three other key actions for the Government to consider:
* it should devote more resources to comprehensively review its fiscal sustainability and tolink this with a medium term fiscal strategy (as discussed below).
* it should develop improved arrangements for the managing of fiscal risk. These couldinclude requirements such as centralization (desirably in the MOF ) for the approval ofguarantees and for transparent operations of SOEs, which fully reflect their financialresults and position and the amount of any government assistance to them. This issue isfurther discussed below.
* moving beyond this it should develop its own capacity in the MOF to manage fiscalsustainability and risk, through developing a medium term fiscal outlook. This is furtherdiscussed below.
A medium term fiscal outlook
1.20. Fiscal sustainability is thus almost by definition a medium and long-term issue. Itinvolves both a backward look (e.g. to determine the current financial position) and a forwardlook. Vietnam already has a forward look in the area of public expenditures through its FiveYear Plan, and the related Public Investment Program (PIP). The Plan sets output and growthtargets as determined by the National Assembly. The PIP reflects the investment expendituresassessed as needed to achieve these targets. It incorporates likely sources and amounts offunding, and also acts as a vehicle to mobilize funds from donors.
1.21. But this falls short of a full medium term fiscal outlook. Using the best availableforecasts of economic growth, a medium-term fiscal outlook includes a full assessment oflikely government revenues and expenditures, both recurrent and investment expenditures,covering over a medium term period and their expression in an aggregate medium-term fiscalplan, incorporating the government's fiscal targets. This plan would be regularly updated androlled over annually, forming the starting point for the preparation of the annual budget.While the budget and allocations would remain on an annual basis, they are made within amedium-term framework.
1.22. Developing such forward looking fiscal approach is obviously not easy. In particularfuture uncertainty may make it difficult to forecast reliably, particularly on the revenue side.On the other hand it may be argued that it is precisely because of this uncertainty that aforward look is necessary, and that such a plan will assist in developing strategies to dealwith a range of future scenarios.
1.23. A number of countries have found it useful to deepen this into a fiscal plan at thesectoral level, providing the basis for the development of costed sectoral plans, as discussedin Chapter 2 of this PER.
The Government should therefore commence development of a medium term fiscal strategy,in the context of a medium term fiscal plan.
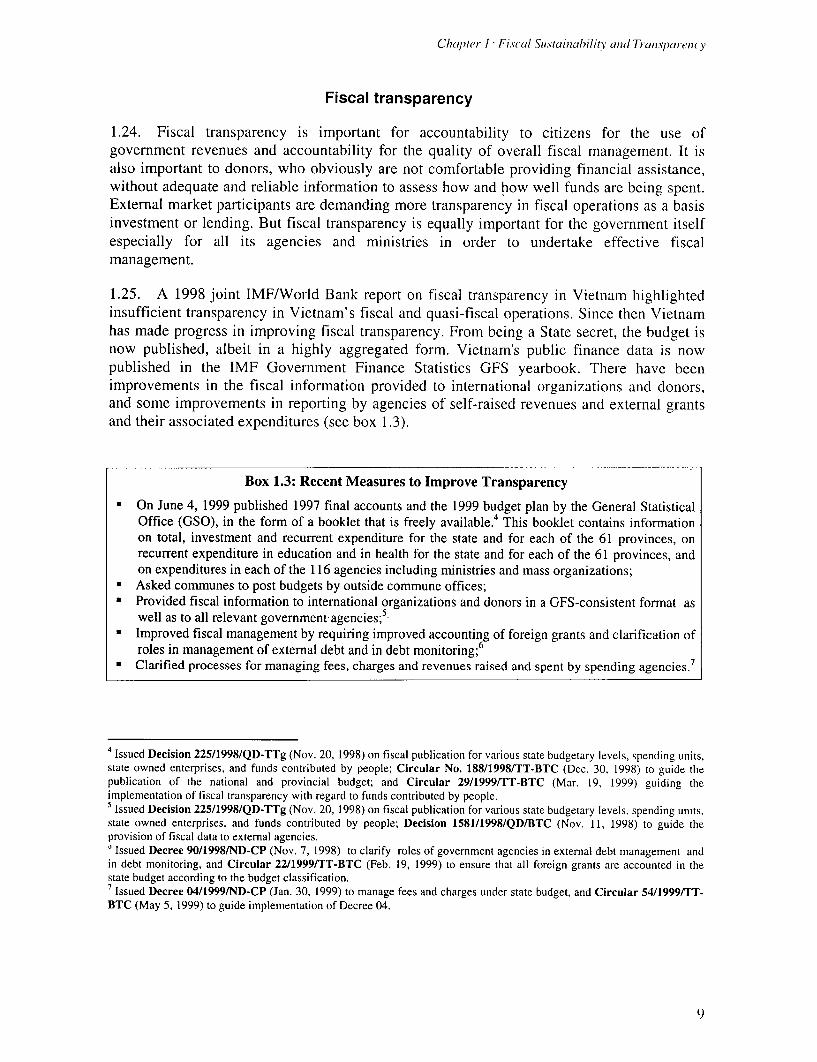
Cha1 tler I Fiscal Suvstainabilit)y and Transpareml y
Fiscal transparency
1.24. Fiscal transparency is important for accountability to citizens for the use ofgovernment revenues and accountability for the quality of overall fiscal management. It isalso important to donors, who obviously are not comfortable providing financial assistance,without adequate and reliable information to assess how and how well funds are being spent.External market participants are demanding more transparency in fiscal operations as a basisinvestment or lending. But fiscal transparency is equally important for the government itselfespecially for all its agencies and ministries in order to undertake effective fiscalmanagement.
1.25. A 1998 joint IMF/World Bank report on fiscal transparency in Vietnam highlightedinsufficient transparency in Vietnam's fiscal and quasi-fiscal operations. Since then Vietnamhas made progress in improving fiscal transparency. From being a State secret, the budget isnow published, albeit in a highly aggregated form. Vietnam's public finance data is nowpublished in the IMF Government Finance Statistics GFS yearbook. There have beenimprovements in the fiscal information provided to international organizations and donors,and some improvements in reporting by agencies of self-raised revenues and external grantsand their associated expenditures (see box 1.3).
Box 1.3: Recent Measures to Improve Transparency
* On June 4, 1999 published 1997 final accounts and the 1999 budget plan by the General StatisticalOffice (GSO), in the form of a booklet that is freely available. 4 This booklet contains informationon total, investment and recurrent expenditure for the state and for each of the 61 provinces, onrecurrent expenditure in education and in health for the state and for each of the 61 provinces, andon expenditures in each of the 116 agencies including ministries and mass organizations;
* Asked communes to post budgets by outside commune offices;• Provided fiscal information to international organizations and donors in a GFS-consistent format as
well as to all relevant government agencies;5
* Improved fiscal management by requiring improved accounting of foreign grants and clarification of6roles in management of external debt and in debt monitoring;
* Clarified processes for managing fees, charges and revenues raised and spent by spending agencies.7
4Issued Decision 225/1998/QD-TTg (Nov. 20, 1998) on fiscal publication for various state budgetary levels, spending units,state owned enterprises, and funds contributed by people; Circular No. 188/1998/TT-BTC (Dec. 30, 1998) to guide thepublication of the national and provincial budget; and Circular 29/1999/TT-BTC (Mar. 19, 1999) guiding theimplementation of fiscal transparency with regard to funds contributed by people.5 Issued Decision 225/1998/QD-TTg (Nov. 20, 1998) on fiscal publication for various state budgetary levels, spending units,state owned enterprises, and funds contributed by people; Decision 1581/1998/QD/BTC (Nov. 11, 1998) to guide theprovision of fiscal data to external agencies.' Issued Decree 90/1998/ND-CP (Nov. 7, 1998) to clarify roles of government agencies in external debt management andin debt monitoring, and Circular 22/1999/TT-BTC (Feb. 19, 1999) to ensure that all foreign grants are accounted in thestate budget according to the budget classification.7Issued Decree 04/1999/ND-CP (Jan. 30, 1999) to manage fees and charges under state budget, and Circular 54/1999/TT-BTC (May 5, 1999) to guide implementation of Decree 04.
9
Viet Nunm - Publ/ EyxpewhiIIr; e Rei iew 2000. Maini Report
Transparency Agenda for Government
1.26. Nevertheless, Vietnam still has some distance to go to meet the minimum standards ofthe IMF Fiscal Transparency Code. The following issues should be addressed in the future
Increasing the amount of information in the budget and the public accounts, which arecurrently published in a highly aggregated form. Deepening this information is a
particular priority for international donors. An important starting point would be to
publish on an annual basis, the information provided to and published in this PER report.Beyond this, it would also be desirable to consolidate information already available on
public expenditures at the four levels of government into one or more publications, toprovide as far as possible a comprehensive national picture of Government expenditures.
* Improving the comprehensiveness of the budget and public accounts - significant off
budget accounts, quasi fiscal transactions and contingent liabilities are not covered.* Providing a comprehensive and detailed medium-term fiscal or economic outlook
together with the annual budget, to provide context to the budget and to fiscal policiesgenerally. Such a report would indicate key macroeconomic forecasting assumptions,macroeconomic and sectoral policies to be reflected in the budget, as well as relevantinformation on fiscal sustainability
* Improving the classification system, which differs from the international GFSclassification in some areas, including the functional classification and definition of theboundaries between the government, SOE and banking sector.
* Deepening the classification system to provide more detailed information onexpenditures below the functional or sub-function level, particularly at the activity orprogram level. Lack of such a classification limits the ability to analyze the effectivenessof government programs and their efficiency of operation.
* Improving the financial reporting of SOEs , so that their financial results and position can
be assessed in accordance with international accounting standards* Addressing the lack of an adequate, and by international standards, independent external
audit function to provide assurance that internal controls over revenue and expenditureare operating adequately, and that published fiscal information is accurate and reliable
1.27. Fiscal transparency at the level of provinces, districts and communes is equallyimportant in terms of accountability and fiscal management. While there are clearGovernment requirements for the publication of budgets and public accounts at these levels,there is some evidence from this PER, as discussed in the section on fees and contributions inChapter 2, that this is not always observed.
1.28. While key issues listed above have yet not been addressed, it is accepted that theirimplementation will take time and Government agencies are developing a timetable for their
consideration and possible implementation. Some could be done immediately, such as thepublication of more detailed information in the budget and public accounts. Some, such asdeveloping a Fiscal and Economic Outlook publication would require some capacitydevelopment in the Ministries of Planning and Investment and Finance.
Particular priority should be given to increasing public information concerning the budgetand public accounts. As a first step the Government plans to provide on an annual basis the
10
Chapter 1 Fis(cal Slustainalbility andl Ttani.sparenicy
information contained in this PER report. The Government also plans to consolidate existingpublic information on expenditures at all four levels of government into one or morepublication, to provide as far as possible a comprehensive national picture of publicexpenditures. A first step in this direction would be for MOF publish separately the budgetand final accounts figures for each of the sectoral ministries and for each provinces to publishbudget and final accounts information covering its departments and lower levels ofgovernment.
A number of these recommendations on fiscal transparency relate closely to budget andpublic expenditure management issues, and are further discussed below in Chapter 2.
Transparency Agenda for State-Owned Enterprises
1.29. In view of its importance, transparency in respect of SOEs is discussed separately.Vietnam has a substantial number of SOEs, ranging from major national enterprises toprovincial enterprises and public utilities and small local undertakings. The past budgetaryimpact of SOEs both implicit and explicit is not fully known. Nor is the budgetary impact ofthe to-be-announced SOE reform program well estimated. Such factual information is crucialto future budgetary management and to assessing fiscal sustainability.
1.30. Financing of SOEs investment expenditures has been undertaken through the PIP,using government financing retained earnings and donor funds. The banking system has alsoprovided medium and long term loans on a concessionary basis. With many SOEs performingpoorly and operating at a loss the banks have accumulated considerable non-performingloans. As a result the envisaged banking reforms will likely entail sizeable debt restructuringtools over the medium term.
1.31. The Government is therefore developing, through the National EnterpriseRestructuring Committee, a program of SOE reform, involving divestiture, closing andrestructuring of enterprises on a more commercial basis. Although details of this program arenot yet available, it is envisaged that the SOE sector will be downsized by at least one thridover three years, reducing the number of SOEs from about 6,000 currently to around 3,000 inthe medium term through equitization, sale and closure. Apart from appropriate safety netsfor displaced workers this program will also require resolution of the SOE debt problem andmore transparent procedures for equitization.
1.32. The SOE reform program that is being finalized will have fiscal impact in variousways. The program when implemented will require budgetary funding for redundancies andfor debt restructuring. There will also be losses in SOE revenues, but this is likely to be offsetby revenue from restructured and profitable enterprises, whether equitized or divested. Alsomany SOEs received implicit subsidies, which will no longer be required, e.g. taxexemptions. Although SOEs received no explicit subsidies from the budget to coveroperating losses, some cash transfers are made from the budget to SOEs, in the form ofagricultural price supports or subsidies designed to assist the producer or consumer.
Viet Nuni - Publ/i Expenditure Revi ew 2000 Main Report
1.33. For the future, it would be desirable for the financial relationship between the budgetand SOEs to be both transparent and standardized. The present system appears to haveconsiderable variation in terms of types and levels of charges on and exemptions for SOEs. Anew approach would include a transparent and consistent basis for payments from SOEs tothe budget, and for any budget support to SOEs. This would flow from establishing acommercially based operating framework for continuing SOEs based on clear financialtargets, management autonomy to achieve these targets, transparency of any directives fromthe Government to management, a commercial accounting system to report performanceagainst targets. There will also need to be appropriate capacity to monitor SOE operations insectoral ministries and centrally in the Ministry of Finance.
12
CHAPTER 2BUDGETING AND PUBLIC EXPENDITURE MANAGEMENT
General Position
2.1. There have been significant achievements in the budgeting and public expendituremanagement system in Vietnam in recent years. The adoption of the Budget Law in 1996,with a further revision in 1998 to establish a clearer division of responsibilities between thecenter and the provinces, has provided an important framework for an orderly budget system.However it is important that this framework be capable of easy amendment, so that it is not abarrier to necessary changes.
2.2. The preparation of the first Public Investment Program (PIP) covering the period1996-2000 has made the processes for determining investment expenditures more orderly andrealistic. It has related proposed expenditures to assumptions about available financing, aswell as acting as a means of mobilizing finance. But there have been problems concerningover-optimism on project implementation and on absorptive capacity, including too manyprojects being included in the PIP and lack of adequate criteria for evaluation and ranking ofprojects. These issues are being addressed in the new arrangements for the preparation of the2001-2006 PIP.
2.3. Overall the budgeting and public expenditure management system provides for goodaggregate control of expenditures within years. There have been no significant over-runs ofexpenditure, release of funds has been tightly controlled and there has been no problem ofexpenditure arrears.
2.4. Because of the relative complexity of the budget system (see Box 2.1), it is difficultfrom the outside to determine the way the budget process works in practice-in terms of howdecisions are made, and with what information. However there is considerable anecdotalevidence which suggests that there may not be significant coordination and consultationbetween the different players to make the system work effectively. In particular, the role ofsectoral ministries appears unclear. The lack of a computerized network through which allparties could access the same budget information further limits consultation, coordination anddissemination.
2.5. There is also a need for greater capacity building in the Ministry of Finance, theMinistry of Planning and Investment, relevant sectoral ministries, and in particular atprovincial and communes level, in respect of budgeting, accounting, program and projectevaluation. Such a capacity building program thus is needed at all levels of government, butparticularly at district and commune levels.
13
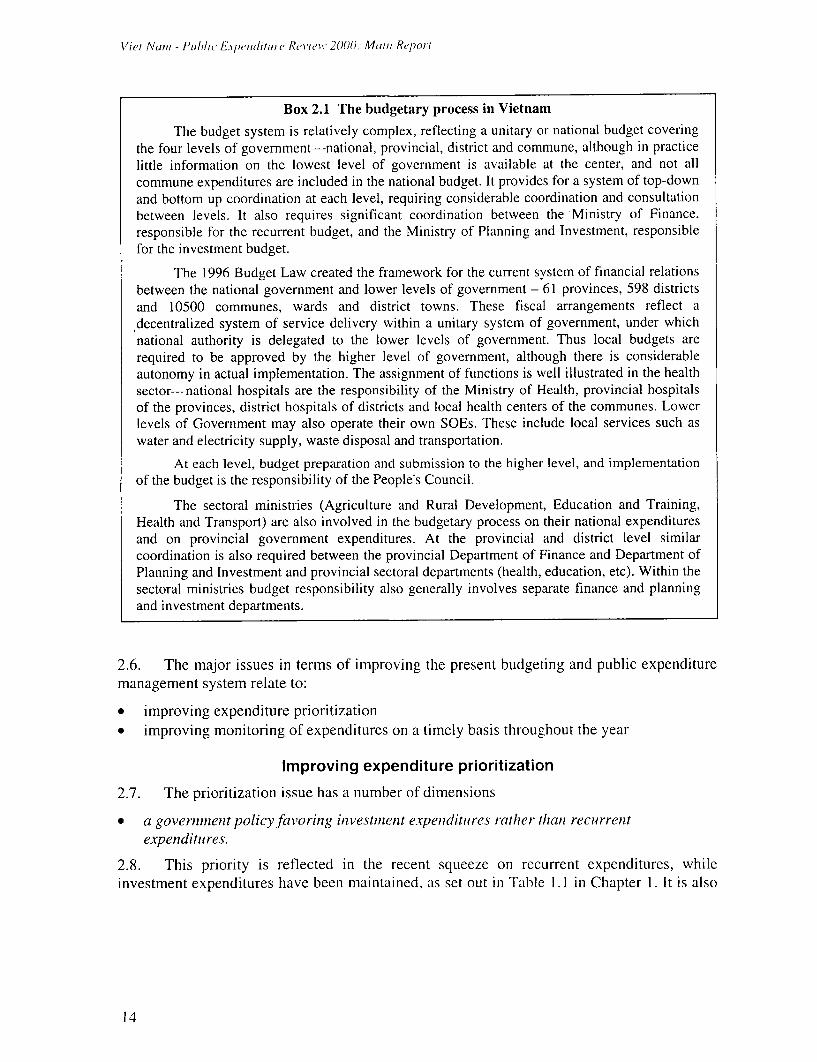
Viet A'u,i - P1ll l/C' E II(piti) C I R?ti'IC 2000)(: Me11 R1por/lOl
Box 2.1 The budgetary process in Vietnam
The budget system is relatively complex, reflecting a unitary or national budget coveringthe four levels of government-national, provincial, district and commune, although in practicelittle information on the lowest level of government is available at the center, and not allcommune expenditures are included in the national budget. It provides for a system of top-downand bottom up coordination at each level, requiring considerable coordination and consultationbetween levels. It also requires significant coordination between the Ministry of Finance,responsible for the recurrent budget, and the Ministry of Planning and Investment, responsiblefor the investment budget.
The 1996 Budget Law created the framework for the current system of financial relationsbetween the national government and lower levels of government - 61 provinces, 598 districtsand 10500 communes, wards and district towns. These fiscal arrangements reflect a,decentralized system of service delivery within a unitary system of government, under whichnational authority is delegated to the lower levels of government. Thus local budgets arerequired to be approved by the higher level of government, although there is considerableautonomy in actual implementation. The assignment of functions is well illustrated in the healthsector-national hospitals are the responsibility of the Ministry of Health, provincial hospitalsof the provinces, district hospitals of districts and local health centers of the communes. Lowerlevels of Government may also operate their own SOEs. These include local services such aswater and electricity supply, waste disposal and transportation.
At each level, budget preparation and submission to the higher level, and implementationof the budget is the responsibility of the People's Council.
The sectoral ministries (Agriculture and Rural Development, Education and Training,Health and Transport) are also involved in the budgetary process on their national expendituresand on provincial government expenditures. At the provincial and district level similarcoordination is also required between the provincial Department of Finance and Department ofPlanning and Investment and provincial sectoral departments (health, education, etc). Within thesectoral ministries budget responsibility also generally involves separate finance and planningand investment departments.
2.6. The major issues in terms of improving the present budgeting and public expendituremanagement system relate to:
* improving expenditure prioritization* improving monitoring of expenditures on a timely basis throughout the year
Improving expenditure prioritization
2.7. The prioritization issue has a numbet of dimensions
* a governmenit policyfavoring investment expenditures rather than recurrenztexpenditiures.
2.8. This priority is reflected in the recent squeeze on recurrent expenditures, whileinvestment expenditures have been maintained, as set out in Table 1.1 in Chapter 1. It is also
14
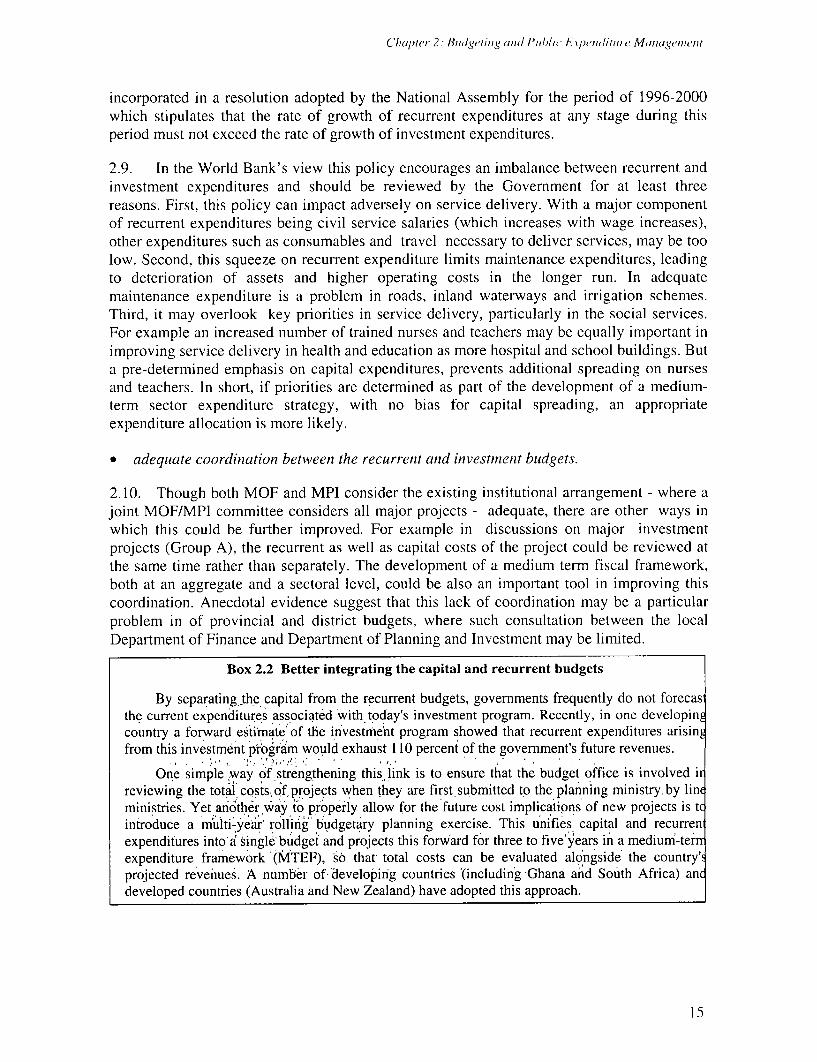
Chu1 ,pter 2: Bu3ldgelir,g and Public Exp JnduitU ( M(Autiage'nl,nt
incorporated in a resolution adopted by the National Assembly for the period of 1996-2000which stipulates that the rate of growth of recurrent expenditures at any stage during thisperiod must not exceed the rate of growth of investment expenditures.
2.9. In the World Bank's view this policy encourages an imbalance between recurrent andinvestment expenditures and should be reviewed by the Government for at least threereasons. First, this policy can impact adversely on service delivery. With a major componentof recurrent expenditures being civil service salaries (which increases with wage increases),other expenditures such as consumables and travel necessary to deliver services, may be toolow. Second, this squeeze on recurrent expenditure limits maintenance expenditures, leadingto deterioration of assets and higher operating costs in the longer run. In adequatemaintenance expenditure is a problem in roads, inland waterways and irrigation schemes.Third, it may overlook key priorities in service delivery, particularly in the social services.For example an increased number of trained nurses and teachers may be equally important inimproving service delivery in health and education as more hospital and school buildings. Buta pre-determined emphasis on capital expenditures, prevents additional spreading on nursesand teachers. In short, if priorities are determined as part of the development of a medium-term sector expenditure strategy, with no bias for capital spreading, an appropriateexpenditure allocation is more likely.
* adequate coordination betweeni the recurrent and investmiient budgets.
2.10. Though both MOF and MPI consider the existing institutional arrangement - where ajoint MOF/MPI committee considers all major projects - adequate, there are other ways inwhich this could be further improved. For example in discussions on major investmentprojects (Group A), the recurrent as well as capital costs of the project could be reviewed atthe same time rather than separately. The development of a medium term fiscal framework,both at an aggregate and a sectoral level, could be also an important tool in improving thiscoordination. Anecdotal evidence suggest that this lack of coordination may be a particularproblem in of provincial and district budgets, where such consultation between the localDepartment of Finance and Department of Planning and Investment may be limited.
Box 2.2 Better integrating the capital and recurrent budgets
By separating the capital from the recurrent budgets, governments frequently do not forecasthe current expenditures associated with today's investment program. Recently, in one developinEcountry a forward esti'mate of the investment program showed that recurrent expenditures arisinEfrom this investment program would exhaust 110 percent of the government's future revenues.
One simple way of strengthening this link is to ensure that the budget office is involved irreviewing the total costs of projects when they are first submitted to the planning ministry.by lineministries. Yet anrither wa'y to pr'operly allow for the future cost implications of new projects is tcintroduce a nuilti-year rolling budgetary planning exercise. This unifies capital and recurrenexpenditures into'a single budget and projects this forward for three to five'years in a mediumn-terrrexpenditure framework'(MTEF), so that, total costs can be evaluated alongside' the country"projected revenues. A number of developinig countries '(including 'Ghana and South Africa) ancdeveloped countries (Australia and New Zealand) have adopted this approach.
15
V7iet Num - Putblic Expenditure Review 2000: Maini Report
* involvement of sectoral ministries in budget discussions, particularly on provincialexpenditures, and receiving infonrmation on expenditure allocations and actual
expenditures
2.11. Sectoral ministries have a clear role in policy formulation and assessment in theirsectors. For example the MOET formulates education policy relating to issues such as pupil-teacher ratios, education fees and contributions, assistance to disadvantaged localities throughnational program and so on. MOET also works with MOF to determine budget norms toguide the allocation of public education funds (as discussed in Chapter 3). It is alsoresponsible for developing five-year sectoral strategies. Sectoral ministries have the right tobe involved in all budget discussions with the provinces, and provinces are required to submittheir expenditure proposals through the relevant sectoral ministry and to inform sectoralministries of their actual spending in that sector. But in practice sectoral ministries are not tofully participating in the budget discussions (which may focus on aggregate expenditureissues rather than on allocation within sectors), and are either not receiving or not making aneffort to obtain detailed information on actual expenditures by provinces and lower levels ofGovernment. The current mechanism of final accounts reporting does not provide a ministrywith adequately detailed information on what is actually spent in that sector by lower levelsof government. The sectoral ministry is thus unable to assess whether actual spending byprovinces and lower levels of Government has been consistent with the sectoral policies, andif not - whether there are sufficient grounds to change the sectoral policy. While localgovernments should have the independent and flexibility to respond to local conditions, theirspending behaviour needs to be broadly consistent with policy.
2.12. Therefore it is important to provide access by sectoral ministries to information on budgetallocation and expenditures within their sector by lower levels of government, as well as toavailable information on expenditure outputs and outcomes. But it is important to distinguish accessto information from control. The Vietnamese system of govemment provides considerableautonomy to provincial and other levels of government in determining their expenditures, andaccess to information by sectoral ministries should not change this autonomy.
* the nieed for clearly articulated mledium-term-l sectot-al strategies (i.e. comprising of
sectoral policies, inistitutionis anzd inlestmen t) which reflect reasoniable assumiiptionisabout wlhat is affordable.
2.13. The medium term or five-year development plans and goals which sector ministries arerequired to submit to the National Assembly are not tightly linked to available resources or to policyand institutional changes needed to achieve them. The development of medium-termcomprehensive and costed sectoral strategies, articulating required policy and institutional changesshould therefore be a medium term objective. The lack of such strategies is another factor limitinggood prioritization of expenditures. Indeed, the development of such five-year sectoral strategieswould be the inputs into the country's Five-Year Plan. Such a transport plan is being prepared andan education draft strategy paper covering the period 2001-2005 is also being developed. Thesepresent an opportunity to develop realistic strategies to guide the future allocation of resources inthese sectors, including facilitating better integration of recun-ent and capital expenditures. Box 2.3sets out a general approach to medium-term planning and budgeting.
16
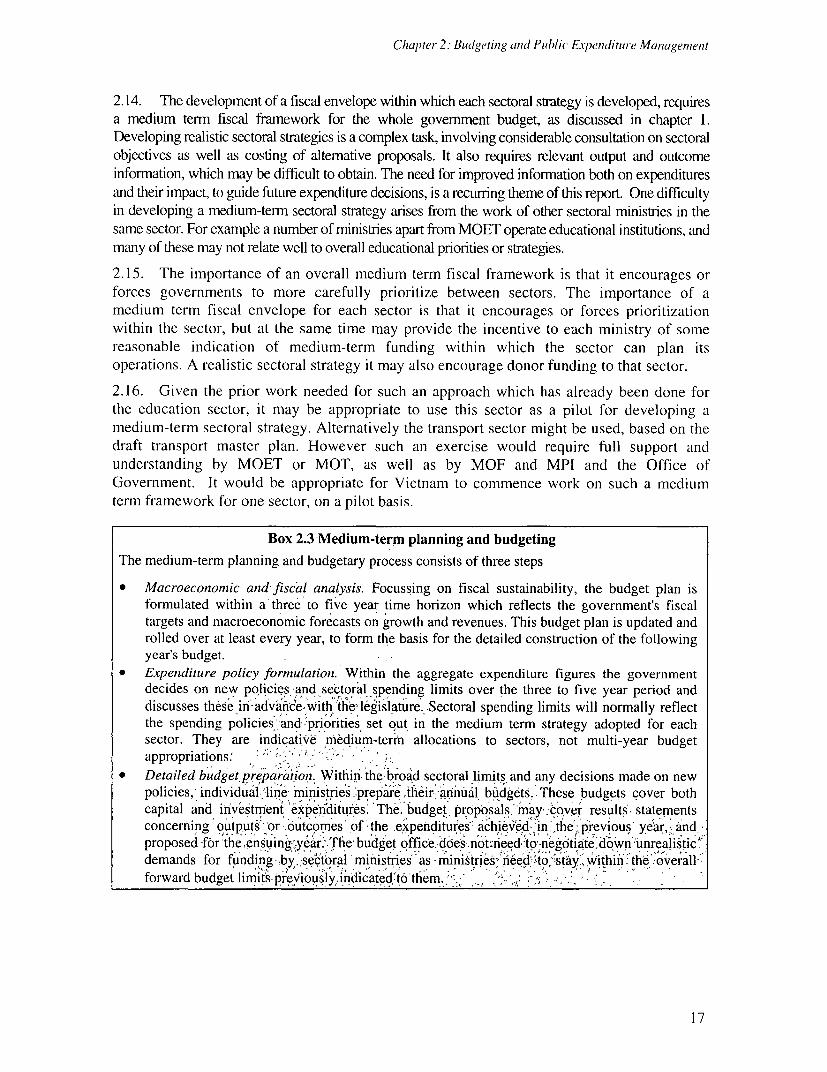
Chupter 2: Budgeting antd Pth/lic E.penditure Managenienit
2.14. The development of a fiscal envelope within which each sectoral strategy is developed, requiresa medium term fiscal framework for the whole government budget, as discussed in chapter 1.Developing realistic sectoral strategies is a complex task, involving considerable consultation on sectoralobjectives as well as costing of alternative proposals. It also requires relevant output and outcomeinformation, which may be difficult to obtain. The need for improved information both on expendituresand their impact, to guide future expenditure decisions, is a recurring theme of this report. One difficultyin developing a medium-term sectoral strategy arises from the work of other sectoral ministries in thesame sector. For example a number of ministries apart from MOET operate educational institutions, andmany of these may not relate well to overall educational priorities or strategies.
2.15. The importance of an overall medium term fiscal framework is that it encourages orforces governments to more carefully prioritize between sectors. The importance of amedium term fiscal envelope for each sector is that it encourages or forces prioritizationwithin the sector, but at the same time may provide the incentive to each ministry of somereasonable indication of medium-term funding within which the sector can plan itsoperations. A realistic sectoral strategy it may also encourage donor funding to that sector.
2.16. Given the prior work needed for such an approach which has already been done forthe education sector, it may be appropriate to use this sector as a pilot for developing amedium-term sectoral strategy. Alternatively the transport sector might be used, based on thedraft transport master plan. However such an exercise would require full support andunderstanding by MOET or MOT, as well as by MOF and MPI and the Office ofGovernment. It would be appropriate for Vietnam to commence work on such a mediumterm framework for one sector, on a pilot basis.
Box 2.3 Medium-term planning and budgeting
The medium-term planning and budgetary process consists of three steps
* Macroeconomic and-fiscŽal analysis. Focussing on fiscal sustainability, the budget plan isformulated within a three to five year time horizon which reflects the government's fiscaltargets and macroeconomic forecasts on growth and revenues. This budget plan is updated androlled over at least every year, to form the basis for the detailed construction of the followingyear's budget.
* Expenditure policy fornulation. Within the aggregate expenditure figures the governmentdecides on new policies -and sectoral spending limits over the three to five year period anddiscusses these ih-adv'e-iith 'tI& legislature. Sectoral spending limits will normally reflectthe spending policies and 'priorities set out in the medium term strategy adopted for eachsector. They are indicative niedium-term allocations to sectors, not multi-year budgetappropriations.'
* Detailed budget preparation. Withinrithe broad sectoral limits and any decisions made on newpolicies, individual- line; ministries.'prepa're their arnnual -bukdgets. .These budgets cover bothcapital and investment expenditures' The. budget. proposals.''may- :cover results. statementsconcerning outputs.-or outcomes'of'the expenditur'es achiev6d-in: the ;previous' year,. andproposed -for 'the,ensuing .year.-The budget office. does notmneed:to negotiated"own"unreali§tic'demands for funding tby1se&bral ministres'ns -ministri"seed to sta", wthir the
demands for '.~~~nstiesas- nn' e, ne t.-sA. ti te:.overall-':
forward budget lim ts-preViously,indicated t6 them.
17
Viert N1am - Publ/i ELxpod,a,mht, e Review 2000 MtAlum RePort
Review of expenditure norms
2.17. The allocation of funds to and within sectors is guided by a complex set ofexpenditure norms, as discussed later in this chapter on fiscal decentralization, in Chapter 3as well as in the health and education Annexes. The norms, which influence the allocation ofexpenditures within sectors, once provinces receive their aggregate allocation are referred toas budget allocationi norms. For example the allocation of funds within the education sectorby provinces is supposed to reflect a standard pupil teacher ratio and minimum expenditurelevels per pupil are set for such items as books or equipment. These norms are in some casesinconsistent or impossible to achieve within available funding, are focussed more on inputsthan results, and were in many cases determined years ago. They may therefore no longer beappropriate in terms achieving good prioritization of expenditures.
2.18. The Miniistry of Finiance togetlher With the relevanit sectoral miniistries anid theprovinces shloiuld therefore unldertake a reviewv of allocationi norms, to enisure tlheir con1tinuin1grelevance in achieviing good prioritizationi of expenditures.
Improving the public investment plan (PIP) process
2.19. In the development of the PIP there are several additional issues concerningprioritization of expenditures. The lack of clear evaluation criteria and of evaluation capacityhave been referred to above. A further issue referred to is some investment decisions whichhave lacked economic or social justification, in some cases because decision makers have notbeen presented with available project evaluations.. It is important that to assist their decisionmaking, decision makers be presented with relevant technical and economic evaluations ofproven investment expenditures and their suggested ranking against other proposals.
2.20. A further issue concerns the influence of donors on the composition of investmentexpenditure. Donor interests, which may not reflect national priorities are a problem in manydeveloping or transitional economies. The best response to this problem is well developedand articulated government policies and priorities, set out in costed medium-term sectoralstrategies, as discussed above.
2.21. More generally there are other ways in which the PIP process might be improved.Annex A of this PER discusses in more detail the experiences of the 1996-2000 PIP and thelessons learned, which may be used to improve processes for the forthcoming 2001-2005 PIP,including an assessment of these issues prepared by MPI. Illustrations given in the discussionof transport sector expenditure in chapter 3 of this report indicate the top heavy and repetitivenature of the project approval process. They also identify lack of ex post evaluation to reviewthe extent to which projects achieved their objectives.
2.22. The disclussion2 of the PIP process in this PER thlus indicates a numiiiiber of areas wherethe developmiienit and impleimienitation of' tlhe PIP cani be improved. Maniy of tlhese issues arealreadY beinig addressed in pr-ocedutres for for)mlulatinig the PlP for 2001-2005. A key issue is
I 8
Chapter 2 Biid(getiilg and Pub/lic Ependitrne Mmangement
avoiding over optimism about the level of costs and benefits of projects and about thecapacity and time to implement them. A related point is ensuring that not too many projectsare included in the PIP, or are commenced. There is also considerable scope for streamliningprocesses both for evaluation and implementation of projects, including encouraging donorsto accept standardized processes, rather than impose their own diverse requirements. There isalso a need for better ex post evaluation of results achieved from projects, to improve futuredecision making.
2.23. The PIP covers a five year period and is fixed plan except that a mid-period reviewwas undertaken during the course of the 1996-2000 PIP. This was a response to the regionaleconomic crisis and resulted in changes in both the total and allocation of PIP expenditures toreflect these changed circumstances and priorities. MPI has stated that during the comingplanning period it will conduct an annual review of the PIP and adjust it in the light ofimplementation progress and changing economic circumstances.
Improving budget implementation and monitoring
2.24. Actual payments are made for all levels of government by local offices of the NationalTreasury Department (part of the Ministry of Finance) which has an office in each provinceor major city. In turn each provincial treasury office has sub-offices in each district. Paymentinformation is sent from each of district treasuries daily to the provincial Treasury-bycomputer link in the case of 20 provinces and by telegram in the case of the others. Paymentinformation is also sent daily from provincial treasuries to the National Treasury by computerfiles. This provides reasonable information for monitoring of expenditures at an aggregatelevel and for overall cash management. Provincial and district governments receive theirpayments information from the Treasury for their own monitoring purposes. Linking of thedistrict treasuries of remaining provinces into the provincial network is planned for 2000 witha link between the National Treasury and provincial governments planned for 2002.
2.25. Expenditure monitoring at the level of budget items for each ministry is lesssatisfactory, reflecting limitations in budget preparation. Spending units find difficulty inpreparing their budgets based on 23 major budget line items (as currently required by law),and in practice only 11 of these items are used. Furthermore, as actual expenditures arerecorded against the full classification, it is difficult to monitor actual expenditures againstbudget allocations at the line item level. The expenditure information at this level is onlyavailable after the end of the year. Improvements are needed in budget preparation,particularly capacity in using the classification system, to overcome this problem.
2.26. There is thus often a considerable divergence between budgeted and actualexpenditures. In the case of investment expenditures this may also indicate over-optimismabout the ability to implement projects, as discussed above under PIP processes. At theprovincial level this divergence also occurs between budget and actual expenditures at theaggregate level, as well as the composition of expenditures. This appears to reflect theconsiderable flexibility enjoyed by provinces in implementing the budget once it is passed,
1'9
Viet Narn - Public Expenditure Review 2000() MAlim Report
and under-estimation of revenues by provinces, under which they may retain the additionalrevenue collected for further expenditure.
2.27. There are a number of difficulties in obtaining reliable information on details ofexpenditure in Vietnam, reflecting different data formats between ministries andinappropriate classification or insufficiently deep classification systems, which needimproving. For example, it is difficult to reconcile differing figures for transport expenditurebetween MOF and MOT and MOF and MPI report differing investment expenditure figures.There are classification anomalies or limitations in a number of important expenditure areas,for example recurrent versus capital expenditure in the transport sector, curative versuspreventive expenditure in the health sector and salary versus non-salary expenditures in theeducation sector, identified in this PER. In addition information concerning social safety netexpenditures lacks a sufficiently detailed classification, making it difficult to make any policyassessment in this area.
2.28. To overcome these data limitations and improve budget execution and monitoringgenerally, the Government wishes to develop a more extensive, integrated informationsystem, based on a national computer network and including the revenue departments (there
are currently three different information systems covering revenues-the budget, treasury andtax department systems, which frequently report different revenue figures). It has indicated itwill seek technical assistance and loans from the World Bank to do this.
2.29. In the current approaci of nloving gradually to expand tile existing treasury systemz
and developing comlmuniication links it is inmportanit that there be close liaison between the
Budget anid Treasury Departments to ensure conisistenicy between anly developments inl tlle
budget preparation system anld tile treasury system.
2.30. In the nmedium term the Governmnent wishes to develop anl integrated budget and
finanicial managemiienit system and hlas indicated it will seek techniical assistance fronli the
World Bank for this.
Fiscal decentralization and public spending
2.31. Overall 43 percent of total expenditures (1998 figures) are undertaken at sub-nationallevel; this includes 73 percent of education expenditures and 63 percent of healthexpenditures. This decentralization of expenditure has shown a steady increase since 1992,when 26 percent of total expenditures were undertaken at the sub-national level.
2.32. The Budget Law specifies the taxes that are assigned to each level of government.However, determining the rate structure of all taxes rests with the center although provinceshave some ability to influence collections by changing the base within a framework set by thecenter. Tax collection is undertaken by the center through the General Taxation Department(GTD). But local governments can retain all or part of collections in excess of the budgetfigure, creating an incentive to underestimate revenues and to encourage GTD to fully collectthese taxes. This also tends to skew resources in favor of better-off provinces. Thus these
20
Chapler 2 Buelgeting e,nd1 Phublic E ,pendittre Managele7nt
taxes are assigned to lower levels only in an accounting sense - they do not represent revenueraising powers.
2.33. While local governments thus have little revenue raising power although they havebeen given the power to raise revenue from some fees, charges and tolls and to obtainvoluntary contributions for the provision of particular services. The operation of these localfees and contributions which are particularly important at the commune level, is furtherdiscussed in the following section of this chapter and in Annex C.
2.34. The distribution of revenue collections and allocations shows that a substantialproportion of revenues collected in the richer provinces is redistributed to the poorerprovinces for spending. However the issue is whether this level of revenue equalization issufficient to offset the revenue and cost disabilities of the less well-off provinces. In additionthe ability of provinces to retain some revenues in excess of budget estimates may createfurther inequity between provinces by advantaging provinces with greater revenues.
2.35. It is not clear that allocations to provinces are based on a clear assessment of needs, orthat they show equity between provinces. The cash transfers made to poorer (deficit)provinces reduce any inequity but overall there is considerable variation in local, (as opposedto national) per capita expenditures between provincial provinces, with a significantcorrelation between per capita expenditures and provincial per capita GDP. However therehas been some narrowing of the gap between richer and less well-off provinces, for examplein per capita spending on health. But richer provinces still spend more per head. In part thisreflects the system of allocating funds to provinces using "transfer norms", in whichpopulation based norms dominate. These take account of differing geographical conditionsbetween provinces, but not enough to offset revenue and cost disadvantages and to takeaccount of different need factors. Apart from the official norms other criteria may be used byMOF during the budget negotiating process. There is therefore a need to make transparent thefull criteria used in allocating funds to the provinces.
2.36. There also appears to be considerable inequality in the provincial distribution of stateinvestment expenditures, reflecting the fact that investment expenditures have previouslybeen more growth than equity oriented, with significant concentration in the growth regionsof Hanoi-Haiphong and Ho Chi Minh city, although there has been some re-balancing of thissince the first half of 1998.
2.37. The result of this system is that despite their autonomy lower levels of governmentlack flexibility in their expenditure patterns. Civil service salaries are a first call on funds andconstitute the great bulk of expenditures. This lack of flexibility is particularly true for theless well-off provinces, which raise lesser amounts of local revenues.
2.38. About 4 percent of the budget is allocated to National Programs, which aim to ensurethat minimum levels of expenditure are undertaken on important national priorities - forexample combating AIDS, providing clean drinking water and increasing literacy. Some ofthe national programs are particularly important to disadvantaged groups in remote or
21
Viet Nani - Public Expewiditure Review 2000: Ma,ii Repoi t
mountainous areas. The programs are mainly implemented through local governments.
However the amounts involved are small and achieving the program objectives may require
some increase in spending, or alternatively consolidating them into a more general program.
Also to avoid substitution for local government's own expenditure there is a case for
requiring matching financial contributions from local governments. It is also important to
ensure that once National Program objectives are achieved that programs are discontinued.
The programs should therefore be regularly reviewed to determine whether they are still
necessary.
2.39. Discussion in the health section of this report indicates that the allocations under
health national programs appear to be more or less evenly distributed across provinces with
little account of the specific disease profile of a province. This may indicate that they are not
well targeted.
2.40. There are a number of possible options in improving the system of inter-governmental
fiscal relations.
* In the Bank's view the government should consider assigning additional revenue powers
to the provinces. These might include such locally based taxes as land and housing tax,
license tax, tax on property transfers, agricultural taxes and commodities tax (amounting
to about 6 percent of total revenues in 1999). Local based collection might also
significantly increase their yield. This could begin with the urban provinces, before being
extended to all provinces. However the government believe that it would not be
appropriate to consider this at the moment.
* develop a new formula based system for the budget transfer norms governing the
allocation of funds to the provinces, providing for a more transparent and equitable basis.
There are several possible approaches. Firstly the formula could reflect costs required to
deliver a standard level of services in each region, allowing for their different level of
needs in sectors such as health and education, and allowing for cost differentials.
Alternatively there could be a much simpler overall formula. In either case a more
equitable system of allocating investment expenditures should be considered.
* reviewing the current arrangements under which provinces may retain some revenues in
excess of budget estimates, for further provincial spending.
* reviewing the existing National Programs, to determine whether they are appropriately
targeted and to what extent some of them are still needed. Consideration could also be
given to possible increases in expenditure or consolidating them into larger programs,
requiring matching contributions from local governments.
Local fees and contributions
2.41. Local governments, mainly at the commune level, collect certain fees and voluntary
contributions for local services. These cover services such as water and electricity,
educational contributions, contributions to local infrastructure, child assistance and the local
militia. It is important to study the level and structure of these charges in terms of their
22
Chupter 2 Budlgeting and1 Puiblic Expenditure Mcnagenient
impact on poverty and the institutional accountability arrangements. In this PER study wastherefore undertaken in 6 communes covering three provinces-Quang Binh, Ha Tinh and HaTay. VLSS and other recent studies suggest that the level of fees and contributions raised bycommunes is higher in these provinces than elsewhere. However the general issues are likelyto be similar even in areas where lesser amounts are collected.
2.42. These charges comprise a significant proportion of commune revenue-ranging from23 percent to 61 percent in four of the six communes studied. The number and range of feesmakes up a complex system of revenue raising. Specific points emerging from the study were
* although they are in theory levied separately, in practice many of the charges are treatedfungibly, as general revenue for the commune (or in some cases village) budget.
* despite the requirements of Decree 29 none of the six communes publishes its budget oractual revenues and expenditures, indicating what charges have been collected and howthey have been spent
* individual taxpayers or households have difficulty in determining whether they arepaying the correct amount or in querying the amount of any charge
* there is provision for exemption from fees and contributions, but these are governed bycomplex regulations which appear to be applied differently between communes
* there is therefore a need to improve transparency and accountability in both the raisingand spending of these fees and contributions
* poor households pay disproportionately more as some fees and contribution are leviedper head
The following recommendations therefore arise:
* simplification, by reducing the number of separate fees and contributions* clearer criteria for exemptions from fees and contributions* for utility charges such as electricity and water, relating fees as far as possible to
household consumption, to encourage efficiency of use* for other charges, restructuring the charging system so that overall the fees and
contributions system becomes significantly more progressive* ensuring transparency of how individual household assessments for fees and
contributions are calculated, of the total amounts raised and the way they have been spentthrough enforcement of Decree 29, possibly raising this to the level of an Ordinance, toensure it is fully observed
* strengthening the implementation of Decree 225, which provides a mechanism forhouseholds to raise questions about commune financial issues
* establishing a mechanism for households to seek further clarification from appropriateauthorities outside the commune, if these questions are not satisfactorily answered.
23

CHAPTER 3INTER AND INTRA-SECTORAL COMPOSITION OF
EXPENDITURES
Coverage of the PER Data
3.1. As reflected in the Government's final accounts8 of actual budgetary expenditures for1997 and 1998, the PER covers recurrent (i.e., wage and wage-related expenditures plusgoods and service expenditures used for operations and maintenance) and capitalexpenditures that are funded by a combination of Government's own resources, grants underOfficial Development Assistance (ODA) and borrowing (either domestic or externalconcessional ODA loans). It does not cover recurrent or capital spending by ministries from"off-budget-funds"). This reflects the fact that Vietnam's budget is not fully comprehensive.Expenditure by communes is also excluded, except to the extent of payments made to themby higher levels of government.
3.2. More specifically, PER figures for Government capital expenditures do not includeinvestments (e.g. infrastructure investments) presently funded by the General Department forDevelopment and Investment's credit (and in the future by the National DevelopmentSupport Fund) or by SOE's retained earnings or by SOEs using on-lent ODA. Thus roadsconstructed by the Ministry of Transport and funded by ODA are included in the capitalspending shown in the PER, but power-generation projects constructed by Electricity ofVietnam (EVN) and funded by on-lent ODA are not. While capital spending by SOEs is partof in the PIP, it is not included in Government capital expenditure.
Allocation decisions
3.3. Both theory and international experience suggest that deciding how much to spend ondifferent activities is the most difficult aspect of public-sector budgeting. There is no optimal(or unique) allocation of public goods and services. Beyond the "pure" public goods likenational defense, fire services or street lighting, decisions on prioritizing of publicexpenditures require detailed assessment in each country and in all cases have a large"political" component. However, a technocratic approach under which policymakers considerexplicitly the objectives of public sector provision of goods and services, the appropriate
8 The "final accounts" of actual budgetary spending are approved by the National Assembly 11 months after thefiscal year ends.9 As discussed in Chapter 1, the amount of expenditures through off-budget funds is not known although MOFestimate them as I percent of GDP.
25
Viet Nani - Public Expenditure Review 2000: MAili Repoi t
instrument for such provision, the competing claims on the budget and, the likely outputs oroutcomes of alternative expenditure allocation, can be used to take better decisions. Box 3.1below sets out a decision tree involving such an approach.
3.4. Expenditure allocation involves two dimensions: recurrent versus capital expenditureand the inter and intra sectoral composition of expenditures.
Recurrent Versus Capital
3.5. In Vietnam-as is the case in a majority of developing countries-the rates of returnon many nonwage operations and maintenance (O&M) activities are estimated to be quitelarge in several sectors. Yet the O&M budget has not been adequately funded in thosesectors.
3.6. For example surveys indicate that almost half of the national road network is in poorto very poor condition and one quarter of the bridges have considerably reduced load bearingcapacity. The situation of the provincial, district and commune networks is even worse.World Bank estimates suggest that around US$160 million annually is imposed on theeconomy in the form of higher vehicle operating costs. Furthermore, most of the roads areeventually rehabilitated at a cost several times than that of a proper operation andmaintenance strategy. Maintenance has also been inadequate in inland waterways, which hasled to siltation and loss of water depth, hampering the operation of larger vessels andincreasing transport costs. In the irrigation sub-sector, consistent under-funding of O&M hasled to poor maintenance and under-utilization of existing capacity.
3.7. There is a better balance of recurrent and capital spending in the health and educationsectors in Vietnam. For example, the findings from the health sector indicate that adequatefunding of medical equipment and drugs has contributed significantly to improved delivery ofservices and better health sector outcomes in Vietnam.
3.8. The above findings indicate that an appropriate balance between capital and recurrentexpenditures, including a well formulated non-wage operations and maintenance strategy, isimportant in making good use of public resources. Achieving this balance is not easy underthe "dual budgeting" approach, with two separate ministries managing the recurrent andinvestment budgets, as is the case in Vietnam and many developing countries. In additionVietnam has a policy under which the rate of growth of recurrent expenditure may not exceedthe rate of growth of investment expenditures. In the World Bank's view this policy shouldbe re-examined by the Government.
3.9. A bias towards investment as opposed to recurrent expenditures may also reflectdonor priorities since donors, generally prefer to fund capital investments in most sectors. Yethaving adequately trained teachers and adequate textbooks (recurrent expenditure) may beequally important to improving educational attainment as new classrooms (investmentexpenditure).
26
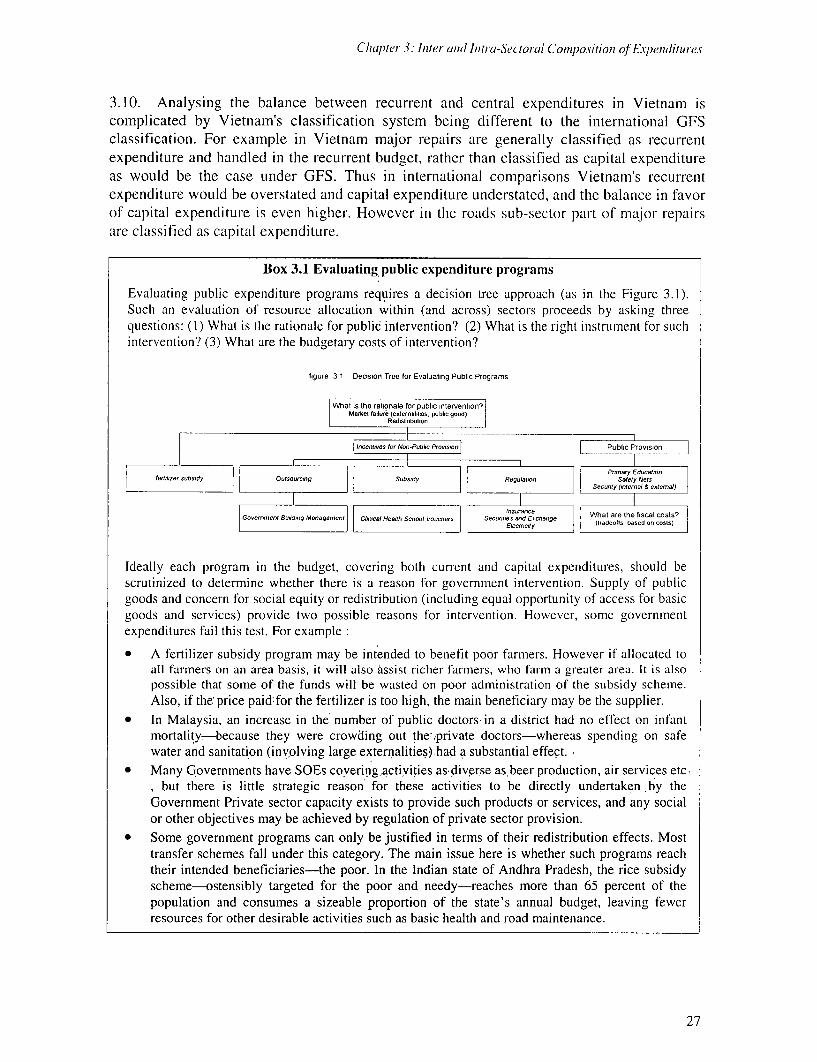
Chapter .3: Intetr and(I Intra-5S'e toral Coniposition of Exp7)enditulres
3.10. Analysing the balance between recurrent and central expenditures in Vietnam iscomplicated by Vietnam's classification system being different to the international GFSclassification. For example in Vietnam major repairs are generally classified as r-ecurrentexpenditure and handled in the recurrent budget, rather than classified as capital expenditureas would be the case under GFS. Thus in international comparisons Vietnam's recurrenitexpenditure would be overstated and capital expenditure understated, and the balance in favorof capital expenditure is even higher. However in the roads sub-sector part of major repairsare classified as capital expenditure.
Box 3.1 Evaluating public expenditure programs
Evaluating public expenditure programs requires a decision tree approach (as in the Figure 3.1).Such an evaluation of resource allocation within (and across) sectors proceeds by asking threequestions: (I) What is the rationale for public intervention? (2) What is the right instrument for suchintervention? (3) What are the budgetary costs of intervention?
figure 31 Decsion Tree for Evaluating Public Programs
s What is the rasonale for pubgic oterven n ntion o Mrr ket ributon ( it-nal uans, pulblac gord)
Red,slrbutwo
pInceners sor Nf-Pabil Ptnh i t. FoPrrovn
Afetize d Oytsoprog Smbsnde Rfergsb.n H if alloted t
possible that some of the funds will e wasted on poor administrationofhth subsheidyscheme
* In Malaysia, an incr~Goeaseint thledn Mnugmber of puba 1e COli douctors iecnte andistcbrictha no (aeoffsaet on oinfant
.~ ~~~~~~~- E--. ta
Ideally each prolram in the budwet, covering both curient and capital expenditures, should bescrutinized to determine whether there is a reason for ie overnaestntervention. Supply of publicgoods and concern for social equity or redistribution (includinv equal opportunity of access for basicgoods and services) provide two possible reasons for intervention. However, some overnyientexpenditures fail this test. For examplev
* A fertilizer subsidy program may be intended to benefit poor farmers. However if allocated toall farmers on an area basis, it will also rssist richer farmers, who farm a sreater area. It is alsopossible that some of the funds will be wasted on poor administration of the subsidy scheide.Also, ifc tensibe tar the fertilizer is too high, the main beneficiary may be the supplier.
* In Malaysia, an increase in the'number of public doctors-in a district had no effect on infantmortalityi-because they were crowding out theo,private doctors-whereas spending on safewater and sanitation (inv,olving large externalitieSs)-had a substantial effect..
* Many Governments have SOEs covering,activities as-diverse as,beer production, air services etc.but there is little strategic reason for these activities to be directly undertaken ey the
Government Private sector capacity exists to provide such products or services, and any socialor other objectives may be achieved by regulation of private sector provision.
* Some government programs can only be justified in terms of their redistribution effects. Mosttransfer schemes fall under this category. The main issue here is whether such programs reachtheir intended beneficiaries-the poor. In the Indian state of Andhra Pradesh, the rice subsidyscheme-ostensibly targeted for the poor and needy-reaches more than 65 percent of thepopulation and consumes a sizeable proportion of the state's annual budget, leaving fewerresources for other desirable activities such as basic health and road maintenance.
27
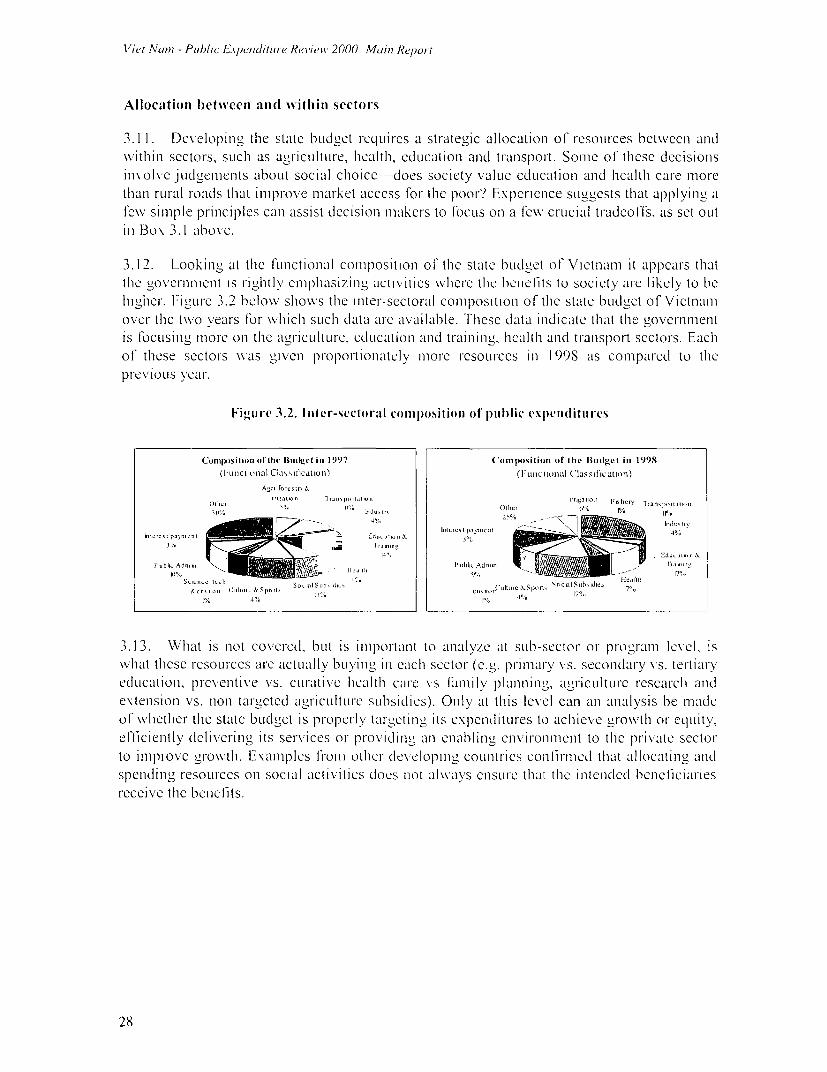
Wliet Nunit - Public Expeniditure Review 2000- M'Iinl Report
Allocation between ancl wvithini sectors
3.11. Developing the state budlCgt rcqLlircs a strategic allocation of resoLurces bctwcccn andciwvithin scctors, suci as agricultuLe, hCaltil, cIucationi andc transport. Soiie of' thcse dccisioInsinolve judgCeniCenits about social choicc--does society valuc education and(i health care mior-ethan ruL-al roacis that improve miar-ket acccss for the poor? Experience SuLIJests tShat applyilln, aI'e simple principles call assist dlecision makcrs to fOcuIs on a fCw\ crcial1 tradeoff's, IS SCt oLit
in Bo\ 3.1 abovc.
3. 2. Looking at the IfLinctional comilposition o1 tilc state hbuldet of ViCtnilL i.t appears thattilhC g\ovClelrllnllt is rig,ltlv emilphasizilln activities \vhere the beneflis to society are likely to be
highcr. FiguLC 3.2 below shows the inter-sectoral composition of the state budget of Vietinamii
Over the twVo years for Wvhich suLiC ciata are available. Tlese dLataL in(dicalte that the vcvernmentis fOCusing^> miiore on the ag1riCIltuLre, e(LuCatioll adlld traini ng,, health and transport smetors. Eacih
of thiese sector-s was given proportionately m0ore rCsouL-cCs in 1998 as comipar-ed to theprevIOLiS yCIa.
Higure 3.2. Inlter-sectoral compositimll o0 puI)Iic expcllenituires
Comixisiti on ofthe Budget in 19)97 Co'omposition of tle lu iget in 1998
(l LUIlC1101411 CldaSSfilc.t]010 (F] LUIlt llMI CLISSICICatUo1l)
Ag,. fo-CSt- &Oi. lrrI4eIkJn 1 rnnrpert.rtren ilihit Itk31t Fe lsherv lt)isitt
htcrcstraymcnl ;~~~~~~~~~~~~~ idu.ltuzra& hlcicstilapilelit tred4t,siry~~~~~~~~~~~~~~~~~Iriitstr00--
r ,btr. Adns ms \tp, tI4.It I' deblic Ads,i re 1°
r.O 4n," , $'lPhkl[C~~~~~~~~~('A r t.\prrs hocnl.l)let 7
10
3.13. What is not covered,l but is imporoltanit to anal.lyze at SLib scttor or programlelIvel, is\vhlat thecse resourices are actually buying: inl each sector (c Lr pi i mai y v s second(ary vs. tertiaryed Lication, pr-cexnti ye vs. cirativ ye halthl care x s famaily p1 annii: nt t'iculturec researchl andextenisionl vs. nonl targetedl ai.riculture subsidlies). Only at thlis level can an ana.lysis be madetlof whiethler the state bulidgei is properly targzetingO its expend(itures to achieve gro\v th or eqiuity,efliciently dcl iverini;, its services or pr-ovidling; an enabling: environmlient to the priV.ltt sector-to imiprove growvth. Examlelis fromi other (levelopingz COUnltriesCoS flirmed tha.t allocating_ and
spendting: resourccs on social activities dloes not alwayvs ensure thatl the i ntendeicl benfchiarliesreceive the benefts
28
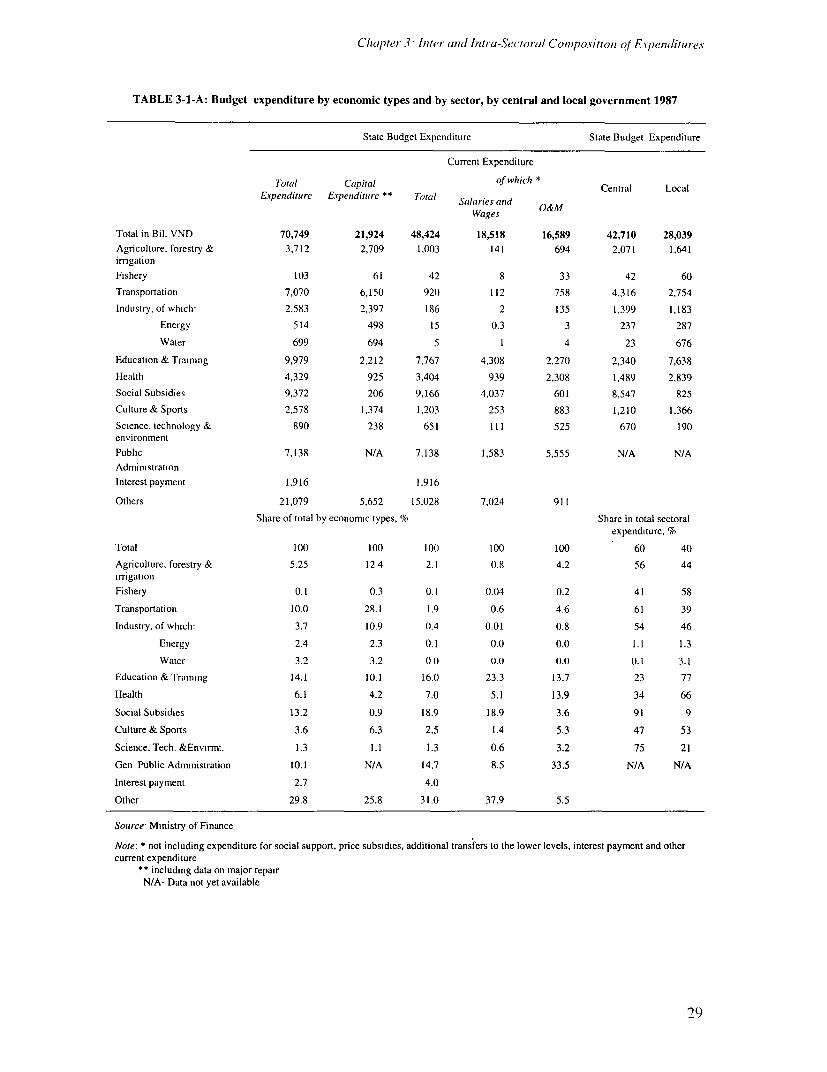
Chapter -I nter aind] Intr/-Sectoral Conmposition af Evpenditures
TABLE 3-1-A: Budget expenditure by economic types and by sector, by central and local government 1987
State Budget Expenditure State Budget Expenditure
Current Expenditure
Total Capital of which * Central LocalKrpendituire Expenditure ** Total Salaries and O&M
Wages
Total in Bil. VND 70,749 21,924 48,424 18,518 16,589 42,710 28,039
Agriculture, forestry & 3,712 2,709 1,003 141 694 2,071 1,641inigation
Fishery 103 61 42 8 33 42 60
Transportation 7,070 6,150 920 112 758 4,316 2,754
Industry, of which 2,583 2,397 186 2 135 1,399 1,183
Energy 514 498 15 0.3 3 237 287
Water 699 694 5 1 4 23 676
Education & Training 9,979 2,212 7,767 4,308 2,270 2,340 7,638
Health 4,329 925 3,404 939 2,308 1,489 2,839
Social Subsidies 9,372 206 9,166 4,037 601 8,547 825
Culture & Sports 2,578 1,374 1,203 253 883 1,210 1,366
Science, technology & 890 238 651 III 525 670 190environment
Public 7,138 N/A 7,138 1,583 5,555 N/A N/A
Administration
Interest payment 1,916 1,916
Others 21,079 5,652 15,028 7,024 911
Share of total by economic types, % Share in total sectoralexpenditure, %
Total 100 100 10() 100 100 60 40
Agriculture, forestry & 5.25 124 2.1 0.8 4.2 56 44ifgation
Fishery 0.1 0.3 0.1 0.04 0.2 41 58
Transportation 10.0 28.1 1.9 0.6 4.6 61 39
Industry, of which: 3.7 10.9 (0.4 0.01 0.8 54 46
Energy 2.4 2.3 0.1 0.0 0.0 1.1 1.3
Water 3.2 3.2 (1) 0.0 0.0 0.1 3.1
Education & Training 14.1 10.1 16.0 23.3 13.7 23 77
Health 6.1 4.2 7.0 5.1 13.9 34 66
Social Subsidies 13.2 0.9 18.9 18.9 3.6 91 9
Culture & Sports 3.6 6.3 2.5 1.4 5.3 47 53
Science, Tech. &Envirmt. 1.3 1.1 1.3 0.6 3.2 75 21
Gen Public Administration 10.1 N/A 14.7 8.5 33.5 N/A N/A
Interest payment 2.7 4.0
Other 29.8 25.8 31.0 37.9 5.5
Source Ministry of Finance
Note: * not including expenditure for social support, price subsidies, additional transfers to the lower levels, interest payment and othercurrent expenditure
** including data on major repairN/A- Data not yet available
29
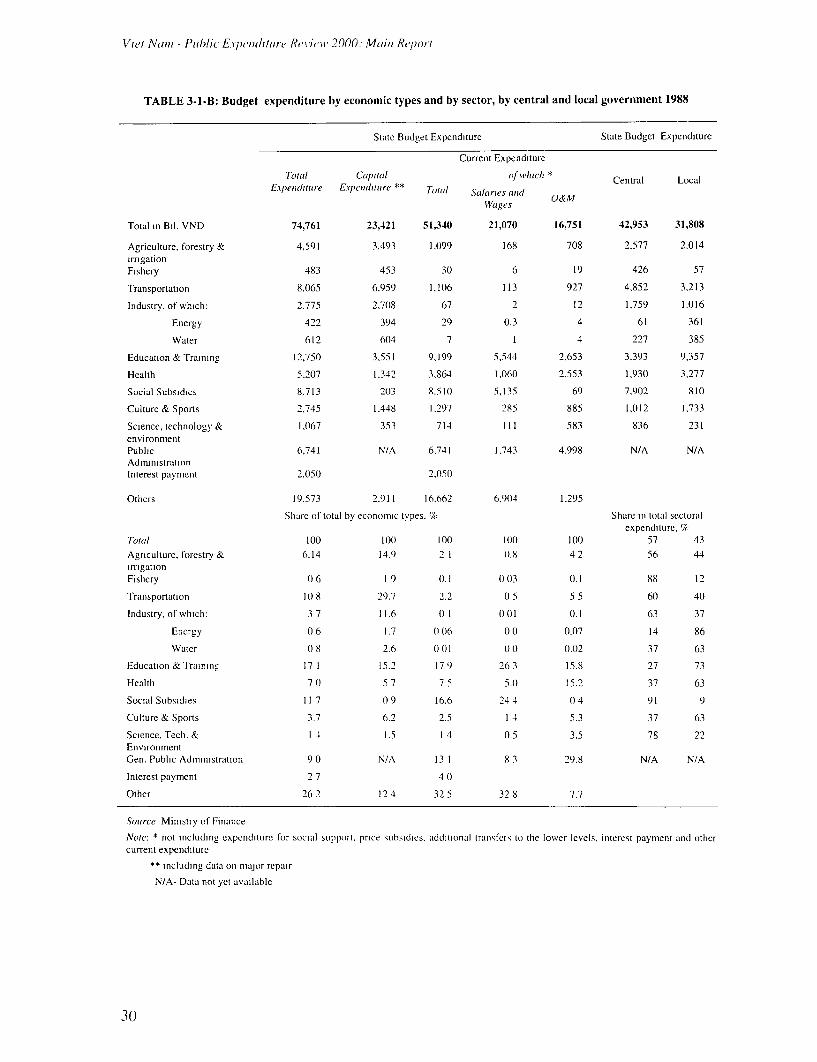
lVet Min,t, - Publ/i Exjpenliture Rev iew 2000: Main Report
TABLE 3-1-B: Budget expenditure by economic types and by sector, by central and local government 1988
State Budget Expenditure State Budgct Expenditure
Current Expenditure
Total Capital of wvich * Central LocalELipenditure Expenditure ** Tot(i Salaries anzd O&M
Waiges
Total in Bil. VND 74,761 23,421 51,340 21,070 16,751 42,953 31,808
Agriculture, forestry & 4,591 3,493 1,(99 168 708 2,577 2.014imgationFishery 483 453 30 6 19 426 57
Transportation 8,065 6.959 1,106 113 927 4,852 3,213
Industry, of which: 2,775 2.708 67 2 12 1,759 1,016
Energy 422 394 29 0.3 4 61 361
Water 612 604 7 1 4 227 385
Education & Training 12,750 3,551 9,199 5,544 2,653 3,393 9,357
Health 5.207 1.342 3.864 1,060 2,553 1,930 3,277
Social Subsidies 8.713 203 ,51(0 5,135 69 7,902 810
Culture & Sports 2,745 1,448 1,297 285 885 1,012 1,733
Science, technology & 1,067 353 714 III 583 836 231environmentPublic 6,741 N/A 6,741 1,743 4,998 N/A N/AAdministrationInterest payment 2.050 2,050
Others 19,573 2,911 16.662 6,9(04 1,295
Shalre of total by economic types, 'ii Share in total sectoralexpenditure, %
Total 100 1() 100 1()() 1(10 57 43Agriculture, forestry & 6.14 14.9 2 1 ().8 4 2 56 44irrigationFishery 1 6 1 9 (.1 003 0.1 88 12
T'ransportation 1) 8 29.7 2.2 () 5 5 5 60 40
Industry, of which: 3 7 11.6 0 1 () 0.1 63 37
Energy 0 6 1.7 (1(16 0 0.07 14 86
Water ( 8 2.6 M()) () 0.(2 37 63
Education & Training 17 1 15.2 179 263 15.8 27 73
Health 7 0 5 7 7 5 5.() 15.2 37 63
Social Subsidies 11 7 0 9 16.6 24 4 ( 4 91 9
Culture & Sports 3.7 6.2 2.5 1 4 5.3 37 63
Science, Tech. & 1 4 1.5 1 4 0.5 3.5 78 22EnvironmentGen. Public Administration 9 0 N/A 13 1 8 3 29.8 N/A N/A
Interest payment 2 7 4 ()
Other 26 2 12 4 32 5 32 8 7.7
Souirce Ministry of Finance
Note: * not includinig cxpcnditure for social suppoit, price siUbsidies, additional transfei s to the lower levels, interest payment and othercurrent expendituic
** including data on1 major repair
N/A- Data not yet available
30
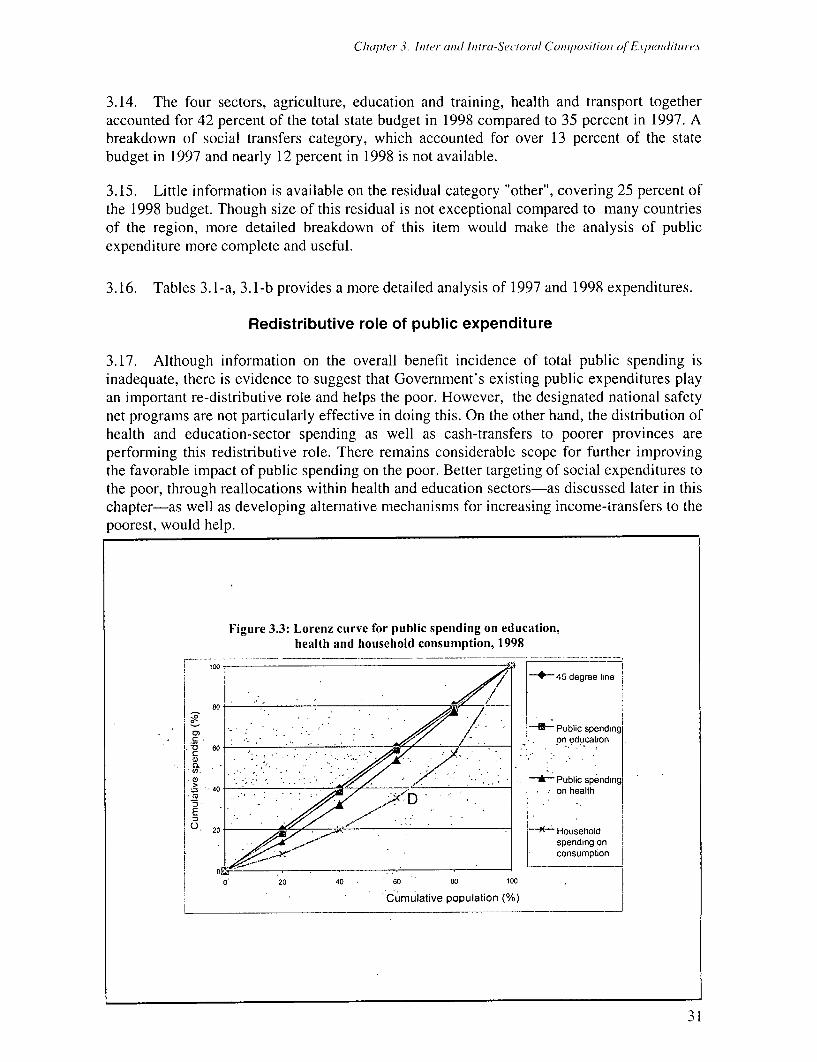
Chapter 3. Initer andtl Int-a-Sectoral Compositionl of Evjendelitalrles
3.14. The four sectors, agriculture, education and training, health and transport togetheraccounted for 42 percent of the total state budget in 1998 compared to 35 percent in 1997. Abreakdown of social transfers category, which accounted for over 13 percent of the statebudget in 1997 and nearly 12 percent in 1998 is not available.
3.15. Little information is available on the residual category "other", covering 25 percent ofthe 1998 budget. Though size of this residual is not exceptional compared to many countriesof the region, more detailed breakdown of this item would make the analysis of publicexpenditure more complete and useful.
3.16. Tables 3.1-a, 3.1-b provides a more detailed analysis of 1997 and 1998 expenditures.
Redistributive role of public expenditure
3.17. Although information on the overall benefit incidence of total public spending isinadequate, there is evidence to suggest that Government's existing public expenditures playan important re-distributive role and helps the poor. However, the designated national safetynet programs are not particularly effective in doing this. On the other hand, the distribution ofhealth and education-sector spending as well as cash-transfers to poorer provinces areperforming this redistributive role. There remains considerable scope for further improvingthe favorable impact of public spending on the poor. Better targeting of social expenditures tothe poor, through reallocations within health and education sectors-as discussed later in thischapter-as well as developing alternative mechanisms for increasing income-transfers to thepoorest, would help.
Figure 3.3: Lorenz curve for public spending on education,health and household consumption, 1998
10045 degree line
80 - -- ' .' m
- m 5 - D/ / Public spendingon education
-.lle - ' 5 i.'0;,..
-,C>) 40 - '8 Z 4 ;4z// / i * t + r .Public spending|CO .- : , / XD . . .on health
20 ~~~~~~~~~~Householdspending onconsumption
| 0' 20 40 60 80 100
Cumulative population (%)
31
Viet Numt - Publi( Evpenditure Review 2000. Muain Report
Pro-Poor Health & Education Spending
3.18. Targeting of public health and education spending, especially education spending, hasimproved over time and currently total public social expenditures are more equallydistributed than household expenditures. For example, in education, according to VLSS 1998,the poorest quintile receive 18 percent of total public education expenditures (a twopercentage point jump in 1997/98 relative to 1992/93) and 26 percent of primary educationexpenditures (a six percentage point jump). Figure 3.3 shows that both health and educationpublic spending is more equally distributed than household spending. When expendituresfrom national safety net programs are added to this, the distribution of total social spending(including safety nets) does not change much, because national safety-net programs(excluding pension) comprise a small share of total public spending relative to health andeducation spending, and its benefits are unequally distributedl'
Redistributive Cash Transfers to Poor Provinces
3.19. Cash transfers to poorer provinces are also performing a useful re-distributive role;supporting a higher level of service delivery than could be funded by their own availablerevenue. In 1998, at least 41 provinces received cash transfers. First, provincial per capitaexpenditures are more equally distributed across provinces than are provincial per capitarevenue-collections. Second, over time (e.g. between 1994 and 1998), provincial per capitaspending has become more equally distributed across provinces. Thus a substantial portion ofrevenues collected in the richer provinces is redistributed to the poorer provinces forspending. However, the issue is whether this level of revenue equalization is sufficient tooff-set the revenue and cost disadvantages of the poorer provinces. Rich provinces spendmore per capita than provinces. The fact that the size of these cash transfers are relativelyweakly related to the depth and incidence of poverty in the provinces, suggest that there isroom for better targeting these transfers. Overall it is not clear that there is equity inallocations between provinces.
Other Discussion of Pro-poor issues in this PER
3.20. More specific issues concerning the "pro-poor" emphasis in public expenditures arediscussed in other parts of this PER. These conclusions are:
* in health, the large share of health care spending financed by individuals or householdshas inherent inequities. The burden of user charges on poor households is high, and thesystem of exemption from some fees and charges does not appear to operate in a pro-poor way. A strategy needs to be developed to assist the poor with their health care costs,particularly if there is to be an increase in certain user fees, such as for hospitals.
10The report "Attacking Poverty" shows that the household coverage of the social welfare programs are low andthe distribution of these payments/transfers are very unequal with the lowest quintile receiving only 5 percent ofthese income-transfers (p-125)
32
Chapter 3. Initer- antld Intra-Sectoral Composition of Expenditures
* in health, the high level of expenditure on curative programs is inequitable, as much of itis focussed on hospitals, which have disproportionately large numbers of users from themore affluent sections of the community.
* in health, the health insurance program does not benefit many poor or rural dwellers.* in education, the greatest improvements in participation (enrolment) rates have been in
the lower income groups. Regional variations in enrolment rates have also narrowed, butremain high. The level of attainment varies significantly across regions and may reflectpoorer quality education in poor and remote areas.
* in education, the level of costs borne by parents, both directly and through fees is high,and the system of exemption from fees operates in a manner which is far from pro-poor.Higher education is restricted to those who can afford to pay.
* in education, the system of budgetary transfer norms and allocation norms, used to guidethe allocation of funds to and within the education sector may not be achieving anequitable allocation of resources between provinces.
* in transport, slow progress in improving rural roads has particularly affected the poor.The inadequate maintenance of rural roads and of inland waterways in the delta regionshas also particularly impacted on the poor.
* the system of local fees and contributions, particularly important at the commune level,needs to be redesigned to have a more progressive impact overall. It appears to operatein a somewhat randomly regressive manner.
* in general there appears to be considerable inequity in the provincial distribution of stateinvestment expenditures , reflecting their concentration in the economic growth regionsof Hanoi-Haiphong and HCM City.
Gender Issues in public expenditures
3.21. Gender balance in both expenditure outcomes and processes is another aspect ofequity in public spending. Vietnam has made great progress in providing education andhealth care services to all citizens, regardless of gender. However, that should not distractattention from the fact that there remain gender imbalances in Vietnamese society and in thefunctioning of the Vietnamese economy.
3.22. This PER thus attempts to examine gender outcomes in the various sectors to theextent that there is information, the need for additional intervention through public spendingand the institutional environment which public spending decisions are made. Someconclusions are given below.
3.23. Knowledge of the institutional environment of decision making offers the possibilityof corrective action. The greater transparency of public spending allocations advocated in thisPER is important, because it would permit the Vietnam Women's Union (VWU) andNational Committee For the Advancement of Women (NCFAW) to provide inputs intopublic spending-decisions.
33
Vi/et Naui - Publi/ Expduliiia e Revijew' 2090: Main Report
Agriculture
3.24. It is difficult to determine how agricultural expenditure and the possible changesdiscussed in this PER impact men and women differentially since both work side by side inagricultural production.
3.25. The desirability of more spending on agricultural research and extension has beenraised in this PER. To promote greater efficiency and equity, there are two options worthconsidering. Firstly, women undertake most of the animal husbandry activities and so moreresearch on animal husbandry-improving the genetic stock through artificial insemination,and selective breeding practices-would directly benefit women, by increasing their incomes.Secondly, and more importantly, targeting agricultural extension contacts to both men andwomen would be a step in the direction of promoting (information) equity. It would alsopromote more efficient utilization of resources, because over the past few years malemigration to cities has increasingly feminized agriculture in Vietnam.
3.26. Finally, any moves to reduce the number of agricultural SOEs could promote greatergender equity. Women are very active in the small scale non-agricultural self-employedsector, and might well benefit from withdrawal of SOEs from activities that are particularlysuited to the small scale private sector activity.
Education
3.27. Vietnam has made remarkable progress in raising literacy and universalizing primaryeducation in just three decades. Primary enrolment rates do not exhibit large differencesbetween girls and boys. Pockets of gender imbalance exist in some regions, but given thestrong government commitment to universalize primary education these do not require anypublic intervention beyond exhorting parents to enroll all children in primary school.Although out-of-pocket costs of primary education remain significant, (which might thenresult in parents preferring to spend money on boys rather than girls education) there is noevidence of gender imbalance at this level of education.
3.28. The earlier gender-gap in lower secondary schools has closed between 1992-1993 and1997-1998 and there is little difference between girls and boys enrolments, but there may beneed to monitor these recent gains carefully. The opportunity costs of children's time risedramatically beyond primary education, as children are at an age where they can begin tomake meaningful contributions to house work and small contributions to household income.There would be a need to seriously consider intervention to maintain parity between girls andboys in the event of any gender gap developing.
3.29. Higher levels of education-upper secondary, higher, vocational, and university-exhibit larger imbalances, with lower female enrolment, but the case for public interventiongets progressively weaker as one moves up the education ladder. Low female and overallenrolment suggests that there is failure in the market for female education and that the statecould undertake measures to make the financing system work better. At the highest levels of
34
C1hapter 3 Inte', (I/?(/ Intra-Sectoral Composition n/'Expenditures
education this might involve greater access of women to loans and at upper secondary levelscholarships could be a cost-effective way of intervening in this market.
Health
3.30. Indicators of mortality, morbidity, and nutritional status, on the whole, do not suggestparents actively discriminate between boys and girls. Health care "needs" (loosely defined)are similar for boys and girls, at least until they reach puberty. User fees at health carefacilities, public and private, are not differentiated on the basis of gender so both the supplyand demand side of the children's health care market do not justify gender-based publicintervention. However there are several reasons for being watchful.
3.31. Health contact rates for boys 0 to 4 years of age are consistently higher than those forgirls of the same age but morbidity differences (which define the "at risk" group for curativecare) in this age group are minimal. Further analysis is needed to determine whether thisdifference reflects a parental preference for spending on boys health care, compared with girls.
3.32. Adult health "needs" are different for men and women, owing largely to the physicaldemands placed on women by the reproductive process. Higher levels of (self-reported)illness amongst women confirm this difference. For this reason the higher health contact ratesobserved for women of all ages in Vietnam should not be viewed as being necessarilyadvantageous to women. Nutritional deficiencies amongst adult women are evident in highrates of anemia (53 percent), Vitamin A deficiency, and poor maternal nutrition (40 percentchronically energy deficient in 1994). There is, therefore, little doubt that women are athigher risk than men of being sick.
3.33. In Vietnam maternal mortality is around 160 per 100,000 live births which is quitelow in comparison with other countries in the region, but in the mountainous areas-theNorthern Highlands and Central Highlands-it is at least twice the national figure. Utilizationof antenatal services is not comprehensive (28 percent do not use), and reproductive tractinfections are a major cause of maternal morbidity. Moreover, contraception mix is heavilyweighted towards use of IUD which is associated with severe side effects. Partly as a result ofthis limited choice of contraception, an average Vietnamese woman has roughly 2.5 abortionsin her life time, an inordinately high figure by any standards.
3.34. Thus more can be done to improve reproductive health in Vietnam. Vietnam's familyplanning program has been largely geared towards controlling the rate of population growth,although the focus is now shifting towards reproductive health. There is a need to assesspublic spending on reproductive health and utilization of these services independently ofother morbidity factors.
3.35. Spending on family planning services has shown a marked increase in the pastdecade, with the share of family planning in total ODA grants and loans for healthquadrupling between 1996 and 1998. National budget allocations have also increased, butthere has been little change in local spending on these services. There is little separateinformation on reproductive health interventions, so it is difficult to determine how public
35
Viet Nant - Public Expendliture Revieuv 2000 MAaii Report
spending on reproductive health meets women's needs. But it is fairly clear that there is scopefor increasing public spending on this area.
Transport
3.36. Much of public spending in the transport sector is on public goods such as roads andinland waterways, and it is difficult to ascertain individual benefits associated with this typeof spending. There are no obvious gender differences in user charges and no overtdiscrimination in the allocation of public spending. Nevertheless one can make some generalinferences by examining the type of economic growth promoted by improvements intransport infrastructure.
3.37. Improvements in rural roads are likely to have proportionally larger benefits forwomen because women are very active in marketing farm output. Increases in farm gateprices lead to direct increases in the cash incomes women receive from sales of farm output.While these incomes may be actually pooled with other household incomes the actual receiptof these incomes by women increases their position within the household. Increasedinvestments in rural roads is therefore likely to benefit women more than men.
3.38. Another aspect of increased spending on rural roads is its significant use of labor-much of it provided by women. In some cases this may be 'voluntary" contributions. In caseswhere wage labor is used, this may provide increased earning opportunities for women.
Agriculture sector
3.39. Vietnam's agricultural sector provides approximately one-quarter of the country'sGDP, generates more than a third of its exports (in value terms) and employs over two-thirdsof its labor force. Although its share has been gradually declining as farm householdsdiversify their production, rice still accounts for almost half of the gross value of agriculturaloutput. Other food crops account for another 15 percent, industrial crops for 16 percent andlivestock for 17 percent. Agricultural production hit record levels in 1998 and 1999 andVietnam has moved from being a net food importer in the mid 1980s to being the secondlargest exporter of rice in the world.
3.40. The Government of Vietnam (GOV) recognizes the important role of agriculture inthe sustainable development of the country and as an engine for broad-based povertyreduction and income growth. In particular, it considers agricultural processing and off-farmrural service activities as a means of achieving its long-term development goals. Theagricultural sector has been performing well despite the recent slow down in the nationaleconomy. The average annual growth rate in the past five years was between 4 and 5 percent,fuelled by diversification into high-value crops (e.g., coffee, cashew nuts, rubber), increasesin rice productivity, and expansion of cultivated area including irrigated rice. As aconsequence, agricultural income rose by 61 percent between 1993 and 1998 and was themain source of poverty reduction in rural areas.
36
Chapter 3: ltiter- andci Iit u-Sectoral Conmos1ition of Expenditures
Public Spending in the Agricultural Sector
3.41. Public spending in agriculture, if properly allocated and managed, can improveagricultural productivity and provide beneficial spill-over effects, inducing more privateinvestment in the sector. Research has shown that public spending on rural roads, andagricultural research and extension is positively associated with agricultural productivitygrowth and poverty reduction. However if public spending in agriculture is poorly targeted, itcan crowd-out private investment and lead to inefficiencies. Examples of these includesubsidizing inefficient crop sub-sectors or investing in marketing or processing activities thatcan be effectively managed by the private sector.
3.42. Despite the increase in recent years, public spending on agriculture is still relativelylow and accounts for roughly five to six percent of the state budget (6.3 percent in 1998).This is lower than several Asian countries such as China, India and Thailand, where thebudget share for agriculture was between 8 and 16 percent in 1990-93. As a share of GDP,public expenditures on agriculture were 1.3 percent in 1998.
3.43. The comparisons, however, do not necessarily constitute an argument for a higherlevel of public spending in agriculture. The performance of the agricultural sector is relatednot only to public expenditures in the sector, but also to public expenditures in transport,education, and health in rural areas. In spite of the comparatively low level of publicexpenditures in agriculture, the agriculture sector has performed well when compared to othercountries in the region. With the exception of China, Vietnam's agricultural growth has beenthe strongest among a wide range of developing, and developed countries. Before advocatinga higher level of expenditures in agriculture, it would be appropriate to see if the compositionof capital and current expenditures reflects the overall objectives and priorities established bythe government.
37
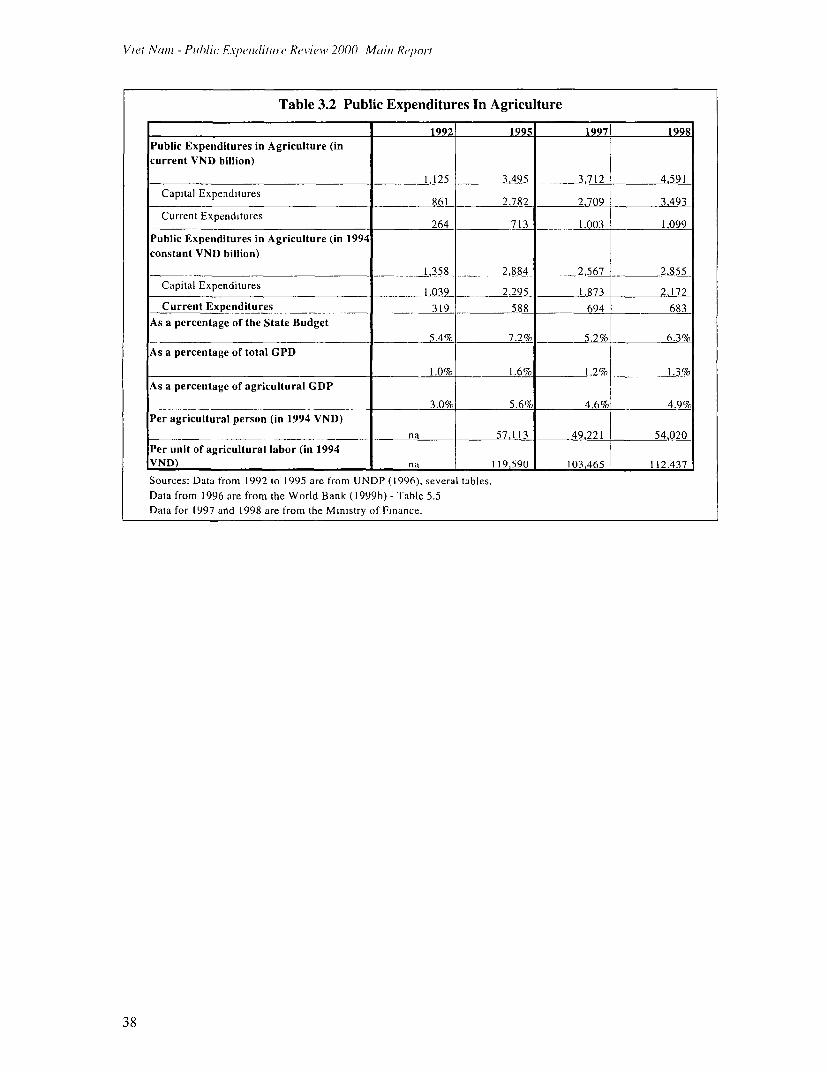
Viet Nain - Pub/lic Exjwendifure Review 2000 MtAini Report
Table 3.2 Public Expenditures In Agriculture
1992 1995 19971 1998
Public Expenditures in Agriculture (in
current VND billion)
1, 125 3_495 3.712 L 4.591
Capital Expenditures 861 2.782 2.709 1 3.493
Current Expenditures 2264 713 1.003 1 1.099
Public Expenditures in Agriculture (in 1994
constant VND billion)
. ____ _____________- .............. 1,358 2,884 _ 2,567 _1 _ ,855Capital Expenditures 1.039 2.295 1.873 2.172
Current Expenditures 319 588 694 , 683
As a percentage of the State Budget
_____________________________________ 5.4% 7.2% 5.2%, 6.3%
As a percentage of total GPD
As a percentage of agricultural GDP
.___________ _ 3.0% 5.6% 4.6%i 4.9%
Per agricultural person (in 1994 VND)
na 57,113 49.221 54 020
Per unit of agricultural labor (in 1994VND) na 119.590 103.465 112.437
Sources: Data from 1992 to 1995 are from UNDP (1996), several tables.
Data from 1996 are from the World Bank (1999b) - Table 5.5
Data for 1997 anid 1998 are from the Ministry of Finance.
38
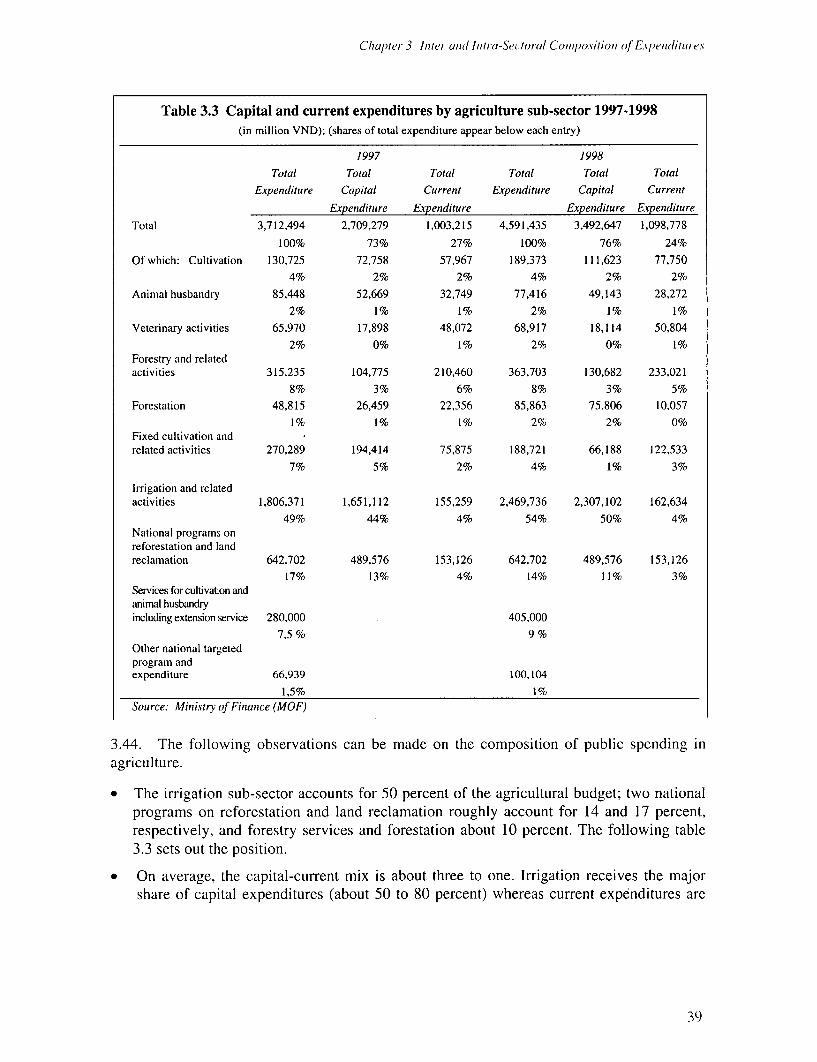
Chapter 3 Inltet ui(1 Iantrc-Sectoral Cotnlposition of Evxpend(litutreS
Table 3.3 Capital and current expenditures by agriculture sub-sector 1997-1998(in million VND); (shares of total expenditure appear below each entry)
1997 1998
Total Total Total Total Total Total
Expenditure Capital Current Expenditure Capital Current
Expenditure Expenditure Expenditure Expenditure
Total 3,712,494 2,709,279 1,003,215 4,591,435 3,492,647 1,098,778
100% 73% 27% 100% 76% 24%
Of which: Cultivation 130,725 72,758 57,967 189,373 111,623 77,7504% 2% 2% 4% 2% 2%
Animal husbandry 85,448 52,669 32,749 77,416 49,143 28,272
2% 1% 1% 2% 1% 1%
Veterinary activities 65,970 17,898 48,072 68,917 18,114 50,804
2% 0% 1% 2% 0% 1%Forestry and relatedactivities 315,235 104,775 210,460 363,703 130,682 233,021
8% 3% 6% 8% 3% 5%Forestation 48,815 26,459 22,356 85,863 75.806 10.057
1% 1% 1% 2% 2% 0%Fixed cultivation andrelated activities 270,289 194,414 75,875 188,721 66,188 122,533
7% 5% 2% 4% 1% 3%
Irrigation and relatedactivities 1,806,371 1,651,112 155,259 2,469,736 2,307,102 162,634
49% 44% 4% 54% 50% 4%National programs onreforestation and landreclamation 642,702 489,576 153,126 642,702 489,576 153,126
17% 13% 4% 14% 11% 3%Services for cultivation andanimal husbandryincluding extension service 280,000 405,000
7,5% 9%Other national targetedprogram andexpenditure 66,939 100,104
1,5% 1%Source: Ministry of Finance (MOF)
3.44. The following observations can be made on the composition of public spending inagriculture.
* The irrigation sub-sector accounts for 50 percent of the agricultural budget; two nationalprograms on reforestation and land reclamation roughly account for 14 and 17 percent,respectively, and forestry services and forestation about 10 percent. The following table3.3 sets out the position.
* On average, the capital-current mix is about three to one. Irrigation receives the majorshare of capital expenditures (about 50 to 80 percent) whereas current expenditures are
39
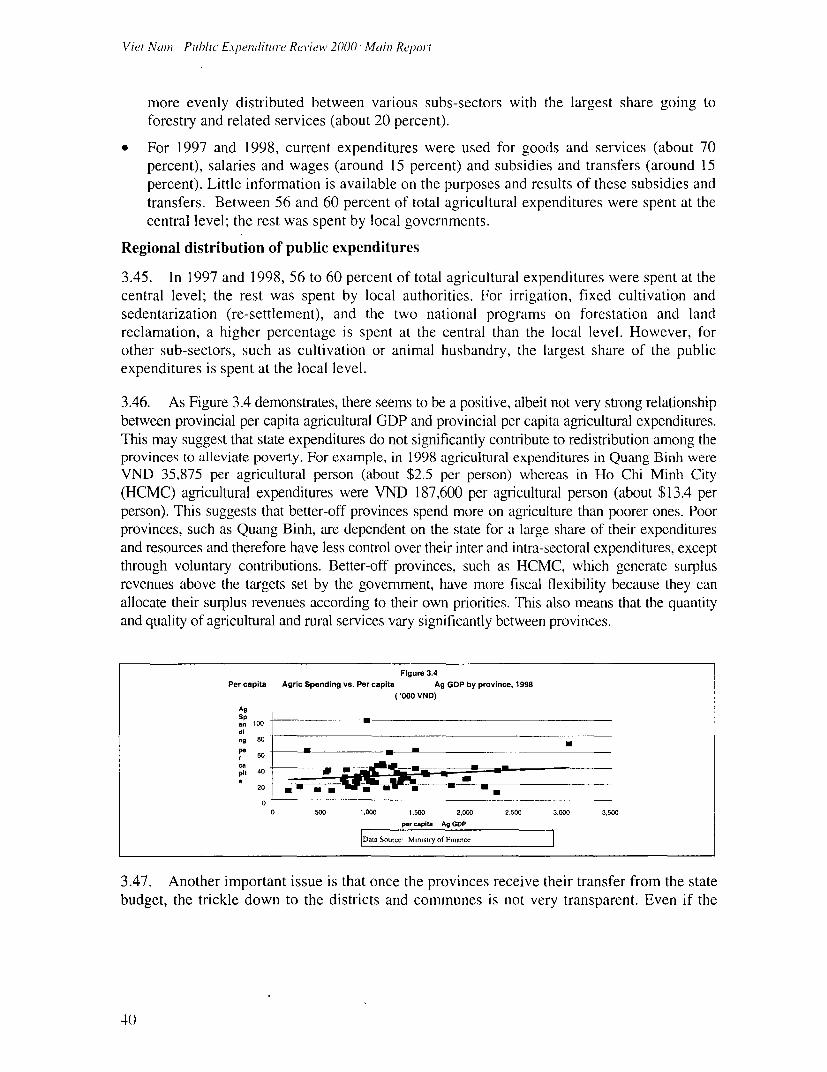
Viet Nain - Public Expenditur,e Rei iew 2000 -MPain Report
more evenly distributed between various subs-sectors with the largest share going toforestry and related services (about 20 percent).
* For 1997 and 1998, current expenditures were used for goods and services (about 70percent), salaries and wages (around 15 percent) and subsidies and transfers (around 15percent). Little information is available on the purposes and results of these subsidies andtransfers. Between 56 and 60 percent of total agricultural expenditures were spent at thecentral level; the rest was spent by local governments.
Regional distribution of public expenditures
3.45. In 1997 and 1998, 56 to 60 percent of total agricultural expenditures were spent at thecentral level; the rest was spent by local authorities. For irrigation, fixed cultivation andsedentarization (re-settlement), and the two national programs on forestation and landreclamation, a higher percentage is spent at the central than the local level. However, forother sub-sectors, such as cultivation or animal husbandry, the largest share of the publicexpenditures is spent at the local level.
3.46. As Figure 3.4 demonstrates, there seems to be a positive, albeit not very strong relationshipbetween provincial per capita agricultural GDP and provincial per capita agricultural expenditures.This may suggest that state expenditures do not significantly contribute to redistribution among theprovinces to alleviate poverty. For example, in 1998 agricultural expenditures in Quang Binh wereVND 35,875 per agricultural person (about $2.5 per person) whereas in Ho Chi Minh City(HCMC) agricultural expenditures were VND 187,600 per agricultural person (about $13.4 perperson). This suggests that better-off provinces spend more on agriculture than poorer ones. Poorprovinces, such as Quang Binh, are dependent on the state for a large share of their expendituresand resources and therefore have less control over their inter and intra-sectoral expenditures, exceptthrough voluntary contributions. Better-off provinces, such as HCMC, which generate surplusrevenues above the targets set by the government, have more fiscal flexibility because they canallocate their surplus revenues according to their own priorities. This also means that the quantityand quality of agricultural and rural services vary significantly between provinces.
Figure 3.4
Per capita Agric Spending vs. Per capita Ag GDP by province, 1998
('000 VND)
Ag
Sn 100ding 80
pit 40 _
20 * a
00 500 1,000 1.500 2,000 2,500 3.000 3,500
p.r r pita Ag GDP
|Data Source Mimstry of Finance
3.47. Another important issue is that once the provinces receive their transfer from the statebudget, the trickle down to the districts and communes is not very transparent. Even if the
4()
Clhapter 3. Initer and1( Intra-Sectoi at Comiposition of Expendflitilu e.\
state government allocates more funds to poorer provinces, these funds will not necessarilyreach the poorest communes or districts.
3.48. However, other GOV mechanisms of public expenditures are currently in place totarget poverty, taking into consideration regional disparities. The HEPR (Hunger Eradicationand Poverty Reduction Program) the Poorest Communes Program, the recently initiated fivemillion hectare Reforestation Program and other programs are more comprehensiveapproaches to poverty issues in less favored regions, as opposed to more specific agriculturalsector programs.
Research and Extension Services
3.49. It is widely recognized in agriculture economics literature that agricultural researchand extension services are public goods. Moreover, in Vietnam there is evidence that itprovides benefits to poor farmers. Vietnam also has a lot of potential to increase its cropproductivity.
3.50. Yet the state contributes very little to research. In the three years 1997-1999, MARDspending on agricultural research was about VND 80 billion, which is equivalent to 1.7percent of the public agriculture expenditures. In comparison, China spends about 6 percentof its agricultural expenditures on research, while Malaysia and Thailand invest about 10percent; other Asian countries spend at least 3 percent.
3.51. Returns to investment in agricultural research are known to be very high world-wide.Thus, one possible way of raising agricultural productivity in Vietnam and enhancing itscompetitiveness in world agricultural markets, is to increase investment in agriculturalresearch.
3.52. There are about 30 agricultural research institutions of which about 18 are operated byMARD, and the rest by agricultural SOEs or by autonomous but state funded institutions. Buteach institution has a fairly narrow research focus, a small budget and staff and littlecoordination with other research institutions. A 1996 GOV decision to substantially re-organize the agricultural research system has been only partially implemented.
3.53. With regard to extension services, according to MOF total public expenditure onagricultural extension in 1998 was VND 405 billion of which MARD spent 27 billion.However reflecting classification problems, this figure is known to include expenditures onother activities and the exact amount relating to agricultural extension is unknown although itcomprises the bulk of this amount. Extension services assist the adoption of improvedtechnology by farmers. The national extension service suffers from a scarcity and poortraining of staff and limited efficiency. Only 70 percent of districts have an extension stationand only 30 percent of communes have an extension unit. A total of 2,757 extension workersat the province and district level serve a farming population of 10 million households. Theextension budget should be increased at least to expand extension services to all districts andcommunes, starting from the poorest communes.
41
Viect Na,,, - Public EApenditul e Review 2000 Meiin RePort
3.54. To achieve better results any budget increase would need to be accompanied byinstitutional strengthening that includes strong linkages between research and extension, areorganization of extension services that avoids the current practice of extension staff beinginvolved in commercial activities such as selling inputs (e.g. fertilizer) to farmers and ensuresparticipation of farmers and agro-industry representatives in extension advisory boards.
Irrigation Sub-Sector
3.55. About 80 percent of the 7 million ha. of cultivated land area in Vietnam is equippedwith some sort of irrigation, the majority of which is dedicatecd to rice. The Ministry ofAgriculture and Rural Development (MARD) is responsible for primary irrigationinfrastructure provision, which is then operated by local government, while localgovernments (provinces, districts and communes) are responsible for secondary and tertiaryinfrastructure. Large and medium scale irrigation works are managed by 172 IrrigationManagement Companies (IMCs). MARD also directly manages three inter-provincialirrigation schemes.
3.56. Of the four million hectare of cultivated paddy, three million are equipped with somekind of irrigation. However, due to incomplete systems, planning or design deficiencies,
deterioration, lack of water and poor operations, only 2 million hectare are actually irrigated.While total public spending on irrigation has almost doubled since 1992, the share dedicatedto recurrent expenditures shrank from about 20 percent in 1992/93 to 10 percent in1997/1998. Although about 50 percent of operation and maintenance (O&M) costs are now
covered by the IMCs-the expenditures of which are not included in the state budget-theallocation to cover the remaining portion of O&M costs is not enough to effectively maintainthe existing systems, resulting in deteriorating infrastructure and low capacity utilization.
3.57. According to MARD experts, the total estilmated value of irrigation works in 1994prices was VND 60 trillion. The estimated regular O&M cost needs of the existing irrigationsystem are VND 1,200-1,500 billion per year. Irrigationi fees collected from water usersrepresent about VND 600 billion per year. The shortfall between irrigation O&M costs anduser fees is partially covered by the budget through state subsidies to the IMCs of about VND100 billion per year, and donor granits. But even after allowing lor voluntary contributionsfrom farmers (either in labor or in cash) to maintaini and repair tertiary canals in the villagesthere is frequently a maintenance gap which results in deterioration of the system.
3.58. Irrigationi fee. The basic guidelines for charging water fees were set in Decree
No.112 enacted in 1984 at the rate of 3 to 8 percent of paddy yields (payable in paddy or inequivalent cash terms). The rates vary by type of irrigation and drainage system used, qualityof service delivery, and by season. They are approved by each Province People's Committeeand can vary quite substantially between regions. Wlile most IMCs incur losses, some havemuch higher levels of cost recovery than others.''
According to a MARD official, a pumpig, station in Ha Giang Povince was iecently sold to a privatecompany. In 1998, this company turned in substantial profits by raising the water fee and imiproving its
collection. This COLIId be an example to set for othier IMCs which could be privatized or their managementcontracted out to private enterprises.
42
Chapter 3: Initer ajn(I Intrto-Sec torai Comn 7Vosition of E.ipenditi, e
3.59. According to the MARD, the irrigation fee would have to be doubled to cover thecurrent needed level of regular O&M costs. But financial and organizational reforms toimprove cost recovery and system performance may avoid or reduce the need for an increasein the level of fees. The collection system itself needs improvement and farmers' willingnessto pay would be increased by an improved quality of service. Raising the irrigation fee shouldonly be instituted once the current collection system and quality of service are improved.
3.60. Onl tlle finiancial side, several measures could be considered.
* The irrigation fee is based on the volume and type of crop production1 2 rather than on thevolume of water use, resulting in excessive and inefficient water usage. Basing the fee onvolume of water consumed would be preferable-as has already been successfullyimplemcnted in some localities.
* Commodity targets by which farmers are encouraged to grow certain crops such as paddythrough increased public investment and support discourage the allocation of water tothose crops with the highest returns from water use and reduce farmers' willingness topay the fee. The need for commonly targets should be reviewed.
* The water fee is collected in paddy or its equivalent in cash. The local council determinesthe price at which measures of rice are converted to cash and sets the price at 10 percentbelow the market price to encourage payment in cash. This means that the fee varies withthe price of paddy rather than being determined by the supply and demand for water. Itwould be preferable to have payment in cash only.
3.61. On the organizational side, institutional reform is needed, so that farmers participatein and contribute to operation and management. At present there is no incentive for thefarmers to pay their fee in full and there is equally no incentive for the local authorities or theIMCs to cover all their O&M costs. An efficiently functioning system would link water usersrights and responsibilities with the benefits and costs of the system. One way is to have wateruser associations where farmers are responsible for financing, operating, and maintaining thesystem and where the benefits from the schemes accrue to them directly.'3
Forestry Sub-Sector
3.62. GOV programs in the forestry sub-sector relate to developing sustainable use ofVietnam's forests, which are located mainly in poor upland areas, and preventingdeforestation. The last decade has seen a proliferation of policies and programs dealing with
12 The water fee for other crops (such as vegetables or sugar cane) is priced at 40 percent of the fee charged forpaddy production.1 Water user organizations have already been successfully implemented in parts of Vietnam. In Tuyen QuangProvince, irrigation systems are now successfully managed and maintained by a water user association that tookover the responsibilities of the previously existing IMC. Similarly, a water user association project that managesthe irrigation systems of North Nghe An and Son Chu, has received very high performance ratings. Theseschemes have been highly effective in terms of increasing farmers' productivity due to more reliable watersupply, reducing maintenance costs, increasing collection of water fees, improving water use and irrigationefficiency, and decreasing subsidies required from the state.
43
Vi.it ANat,7 - Public Expdeniture Review' 2000 -Main Report
to the related issues of forestry, watershed and soil management. In 1993 the Governmentestablished the "Regreening the Barren Hills" program, covering extensive areas of thenorthern uplands and central highlands. This involved transferring parcels of land tohouseholders who were then to be paid by the state for forest protection and replanting.However the program experienced implementation difficulties, with high costs in relation tothe number of trees planted, although the number of trees planted was quite large.
3.63. A new and more ambitious program to speed up reforestration , the Five Million HaReforestration program, was launched in 1998. However a number of issues appear to needaddressing for more effective implementation, including criteria for selecting the land to beused (given possible alternative uses in agriculture or agroforestry activities) and how toprovide appropriate incentives to households for sound forestry management.
3.64. Careful management of this program is needed to ensure it contributes to economicgrowth and the reduction of poverty in the highland regions, and does not lead tounsustainable agricultural practices and environmental degradation and a widening gapbetween highland and lowland incomes.
Contribution To Agricultural Production And Processing Activities
3.65. Rural farm households provide the bulk of agricultural output, but agriculturalprocessing and marketing activities for export are dominated by SOEs. Central and localgovernment own over 1,400 enterprises in the agricultural sector.
3.66. These are involved in a variety of activities including the production and processingof sugar, rubber, coffee, tea, seeds, livestock breeds, fertilizers, etc. While these SOEs nolonger receive direct subsidies from the budget, they receive indirect subsidies such as loansat concessionary interest rates, debt forgiveness, and tax exemptions. A major problem is alack of information concerning their amounts and purposes of such indirect subsidies. Otherindirect subsidies include trade restrictions on some commodities to protect local SOEs. Forexample, the sugar industry is indirectly subsidized through local policies favoringconversion of land to sugar cane production and restrictions on imported sugar which ischeaper than locally produced sugar. According to analysis by Goletti and Rich (1998), thenet cost to society of the government's protection of the sugar industries is about USD 92million per year, mainly through higher consumer prices.
3.67. Evidence from different studies suggests that many of the SOEs in some agriculturesub-sectors are loss-making and are inefficient. In the sugar sector for example, manyrefineries are non-competitive and are located in areas where not enough sugar is beingproduced, resulting in under-utilized capacity. The Government itself recognizes that in thecountryside, agricultural and industrial facilities operate inefficiently (sugar companies,cement, brick making, state-owned farms).
3.68. Table 3.4 shows state budget transfers to support certain SOEs. For example, fertilizerimporting SOEs received an interest rate subsidy of 22 billion VND in 1998, an amountalmost equal to the total MARD budget on agricultural extension in that year. Total subsidies
44
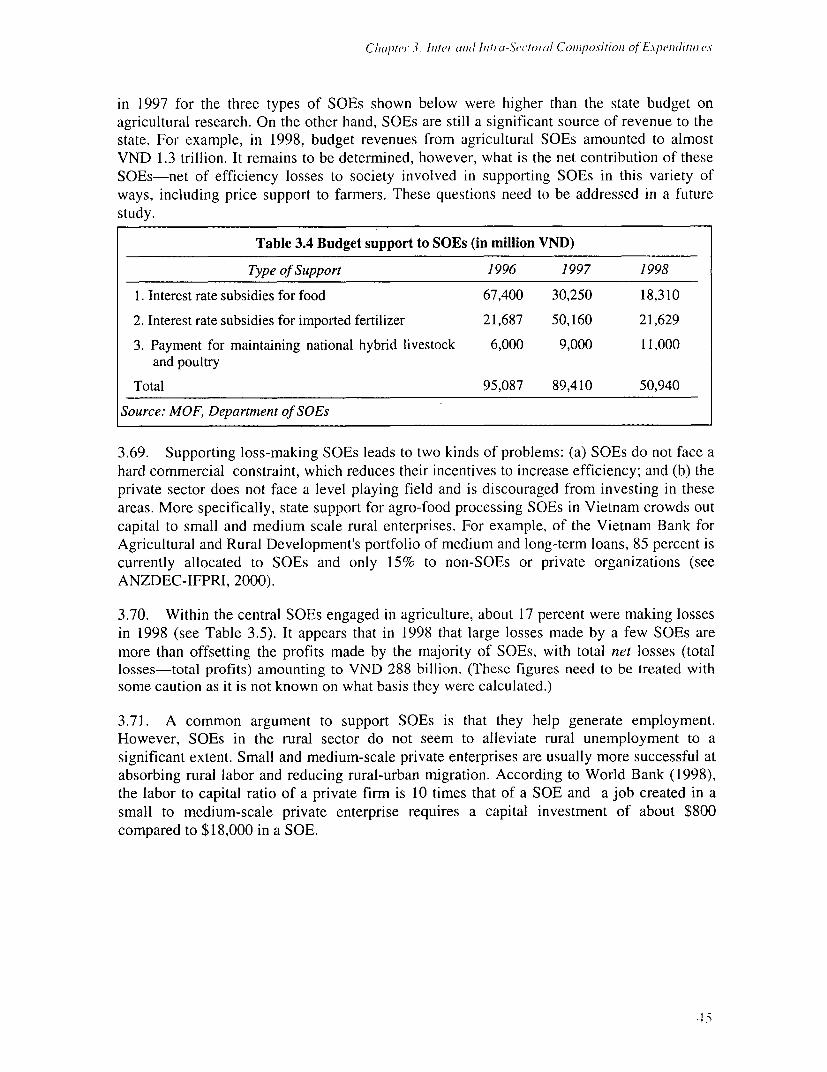
Clwptcr3. iInte (IIil lutru-.S' toi al Composition of Elpu,diul,, es
in 1997 for the three types of SOEs shown below were higher than the state budget onagricultural research. On the other hand, SOEs are still a significant source of revenue to thestate. For example, in 1998, budget revenues from agricultural SOEs amounted to almostVND 1.3 trillion. It remains to be determined, however, what is the net contribution of theseSOEs-net of efficiency losses to society involved in supporting SOEs in this variety ofways, including price support to farmers. These questions need to be addressed in a futurestudy.
Table 3.4 Budget support to SOEs (in million VND)
Type of Support 1996 1997 1998
1. Interest rate subsidies for food 67,400 30,250 18,310
2. Interest rate subsidies for imported fertilizer 21,687 50,160 21,629
3. Payment for maintaining national hybrid livestock 6,000 9,000 11,000and poultry
Total 95,087 89,410 50,940
Source: MOF, Department of SOEs
3.69. Supporting loss-making SOEs leads to two kinds of problems: (a) SOEs do not face ahard commercial constraint, which reduces their incentives to increase efficiency; and (b) theprivate sector does not face a level playing field and is discouraged from investing in theseareas. More specifically, state support for agro-food processing SOEs in Vietnam crowds outcapital to small and medium scale rural enterprises. For example, of the Vietnam Bank forAgricultural and Rural Development's portfolio of medium and long-term loans, 85 percent iscurrently allocated to SOEs and only 15% to non-SOEs or private organizations (seeANZDEC-IFPRI, 2000).
3.70. Within the central SOEs engaged in agriculture, about 17 percent were making lossesin 1998 (see Table 3.5). It appears that in 1998 that large losses made by a few SOEs aremore than offsetting the profits made by the majority of SOEs, with total net losses (totallosses-total profits) amounting to VND 288 billion. (These figures need to be treated withsome caution as it is not known on what basis they were calculated.)
3.71. A common argument to support SOEs is that they help generate employment.However, SOEs in the rural sector do not seem to alleviate rural unemployment to asignificant extent. Small and medium-scale private enterprises are usually more successful atabsorbing rural labor and reducing rural-urban migration. According to World Bank (1998),the labor to capital ratio of a private firm is 10 times that of a SOE and a job created in asmall to medium-scale private enterprise requires a capital investment of about $800compared to $18,000 in a SOE.
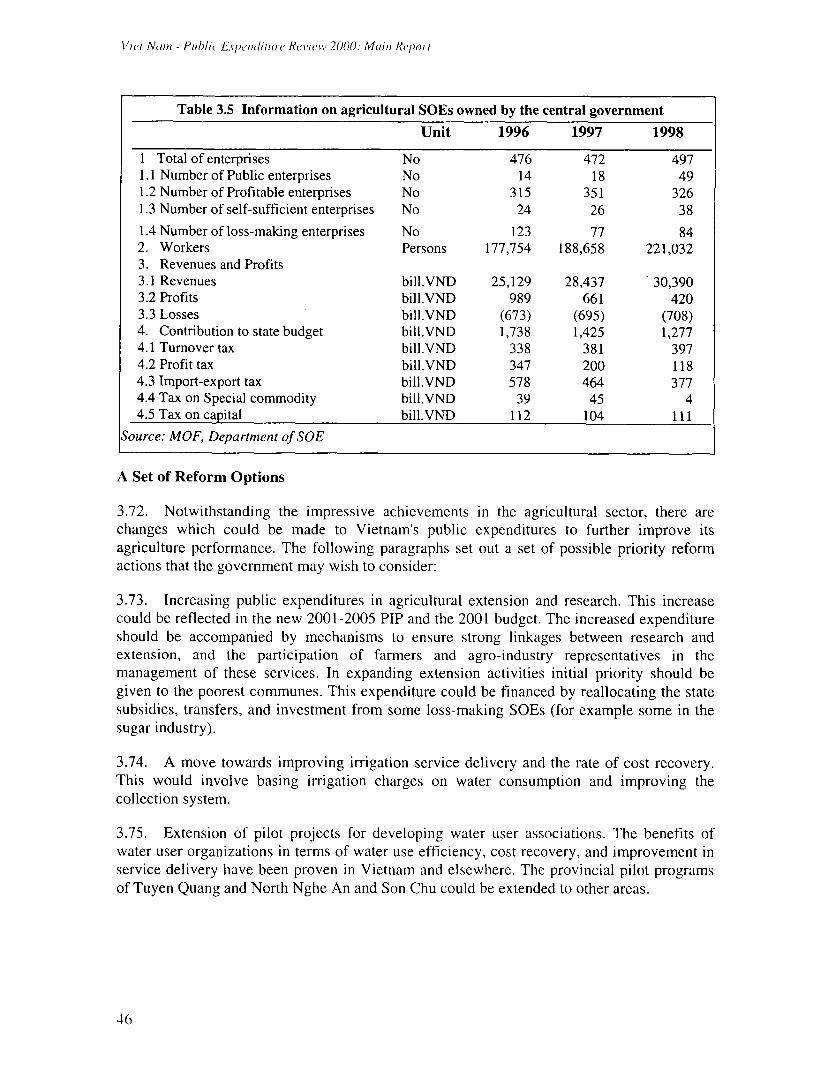
Viet N!am - P11b)lit E.x-"ipuidhre Re,viov 2000: MA,iui Repol t
Table 3.5 Information on agricultural SOEs owned by the central government
Unit 1996 1997 1998
1 Total of enterprises No 476 472 4971.1 Number of Public enterprises No 14 18 491.2 Number of Profitable enterprises No 315 351 3261.3 Number of self-sufficient enterprises No 24 26 38
1.4 Number of loss-making enterprises No 123 77 842. Workers Persons 177,754 188,658 221,0323. Revenues and Profits3.1 Revenues bill.VND 25,129 28,437 - 30,3903.2 Profits bill.VND 989 661 4203.3 Losses bill.VND (673) (695) (708)4. Contribution to state budget bill.VND 1,738 1,425 1,2774.1 Turnover tax bill.VND 338 381 3974.2 Profit tax bill.VND 347 200 1184.3 Import-export tax bill.VND 578 464 3774.4 Tax on Special commodity bill.VND 39 45 44.5 Tax on capital bill.VND 112 104 111
Source: MOF, Department of SOE
A Set of Reform Options
3.72. Notwithstanding the impressive achievements in the agricultural sector, there are
changes which could be made to Vietnam's public expenditures to further improve its
agriculture performance. The following paragraphs set out a set of possible priority reform
actions that the government may wish to consider:
3.73. Increasing public expenditures in agricultural extension and research. This increase
could be reflected in the new 2001-2005 PIP and the 2001 budget. The increased expenditure
should be accompanied by mechanisms to ensure strong linkages between research and
extension, and the participation of farmers and agro-industry representatives in the
management of these services. In expanding extension activities initial priority should be
given to the poorest communes. This expenditure could be financed by reallocating the state
subsidies, transfers, and investment from some loss-making SOEs (for example some in the
sugar industry).
3.74. A move towards improving irrigation service delivery and the rate of cost recovery.
This would involve basing irrigation charges on water consumption and improving the
collection system.
3.75. Extension of pilot projects for developing water user associations. The benefits of
water user organizations in terms of water use efficiency, cost recovery, and improvement in
service delivery have been proven in Vietnam and elsewhere. The provincial pilot programs
of Tuyen Quang and North Nghe An and Son Chu could be extended to other areas.
-16
Chapter 3 -Int(Zer widl hitra-Se( tol (11 Comipostioni otfExpfllitiure.s
3.76. This PER indicates areas where further information and or analysis is desirable. Theseinclude:
* who are the beneficiaries of public spending in the agriculture sector, including ananalysis of whether or not the intended beneficiaries-particularly those living in theremote and mountainous regions-are benefiting from irrigation, fertiliser and pricesupport subsidies;
* the impact of the agriculture SOEs on the economy including their net contribution to thestate budget.
Health sector
3.77. Vietnam has made impressive progress in improving the health of its populationduring the last 3-4 decades and its health indicators and much better than would be expectedfor a country at its level of income per capita. But the analysis below suggests that bothgreater efficiency and equity can be achieved by policy and expenditure changes.
Health Indicators in Vietnam
3.78. Vietnam has achieved impressive gains in the health status of its population:
* Infant Mortality. There has been a sharp decline in the infant mortality rate during the lastfour decades-from about 160 per 1,000 live births in 1960 to 90 in 1975-80, 75 in 1983,45 in 1989, and to 44 in 1989-1993 and the rate may have declined further to 28.2 per forthe period 1992-96. Vietnam's current level of infant mortality is among the lowest in theEast-Asia region and comparable to countries with substantially higher levels of percapita income. However there are large rural-urban, regional and income disparities,mainly due to differences in access to health services, child nutrition, and environmentalhealth (such as availability of safe drinking water and sanitation).
* Morbidity. During the last 20 years there has been a major decline in the share ofcommunicable diseases in morbidity, from 50-56 percent of morbidity in 1976 to 27percent in 1997. This reflects the success of communicable disease-control programs,especially the expanded program of immunization. Despite the relative decline in theincidence of infectious diseases, the latter still remain a public health problem,particularly some new or reemerging diseases, such as tuberculosis, HIV infections,dengue fever and Japanese encephalitis. Malaria remains a major public health problem inthe mountainous and ethnic minority areas of the country.
* Child Malnutrition. But Vietnam's performance in the area of child malnutrition has beenless than impressive. Child malnutrition rates in Vietnam are among the highest in theregion. A recent national survey of nutrition indicates that 39 percent of children underthe age of 5 years are malnourished in terms of weight-for-age and 34 percent areundernourished in terms of height-for-age.
47
'iert N'um - P/ic(' ExPeibtlturl Review 2000 Mc,,,l Repol I
Principles of health service provision in a transition economy
3.79. In a market economy the public sector is not the exclusive provider or financier ofhealth services. As private health providers and drug vendors enter the market, thegovernment needs to establish the legal framework for the private sector, setting minimumquality-of-care standards, promulgating laws and decrees that govern private and publicproviders, and enforcing these through a system of regular inspections and monitoring.
3.80. In the transition to a market economy as in Vietnam, out-of-pocket payments byhouseholds or individuals for utilizing health services typically increase sharply. This oftenleaves the poor in a vulnerable position, unless there are well-functioning mechanisms forexempting the poor from the increase in health-care costs. It is therefore important for thegovernment to take on a direct role in financing health-care expenditures of the poor.
Health Service Delivery in Vietnam
3.81. Service Provision. Service delivery is organized along a four-tiered pyramid, withcommune health centers at the bottom of the pyramid. Above these are the inter-communalpolyclinics and their referral organizations (i.e. the district hospitals), both of which are runby the district health bureaus. Provincial hospitals form the second tier in the pyramid, and atthe very top are central hospitals and specialty institutes, which are run directly by theMinistry of Health. One of Vietnam's major achievements over the last 30 years has been theestablishment of an extensive network of commune health centers throughout the country.With 7,019 persons served by a commune health center on average, Vietnam's ratio issignificantly better than that of neighboring Cambodia (15,000) and comparable to that ofThailand (6,762)-a country having four times its per capita income.
3.82. In the last ten years there has been an significant growth of private health services.According to VHSR, 1999, most of these providers-about 18 percent-are drug commissionsellers, followed by general practitioners' clinics (16 percent), traditional medicine clinics (14percent), private pharmacies (14 percent), and nursing homes (12 percent). Most privatehealth facilities are located in urban areas, although many rural areas have significantnumbers of private health providers as well. While the private provision of primary healthservices has expanded rapidly, that of secondary and tertiary health services has increasedrelatively little during the last 10 years. It is estimated that there are only six private hospitalsin the entire country.
3.83. Service Utilization. Improved health outcomes do not depend on the availability ofhealth services, but their utilization. Data from health facilities indicate that each Vietnamesehas an average of 1.7 annual consultations with the public sector health services, and that theannual hospital inpatient admission rate is 68 per 1,000 persons. This public-sector contactrate of 1.7 per person compares favorably with those countries in the region. Vietnam'sutilization rate is lower than that of Sri Lanka, China and Singapore-all countries that havesubstantially higher per capita income levels-but greater than that of India, Pakistan,Cambodia and Malaysia.
-I
Chapter 3 -ntel tol wd Itru-S('ctoral Compj,ositiomi of Expnditur,es
3.84. Users of Public Health Facilities. Available data from VLSMS indicate that the usersof public hospitals are largely drawn from the highest income quintiles, while communehealth center users are drawn disproportionately from the poorest quintiles. For instance, in1998, 36 percent of all public hospital users were drawn from the 20 percent of the highestincome population and 61 percent were drawn from the 40 percent of the highest incomepopulation. On the other hand, the poorest quintile were heavily under-represented amonghospital users relative to their share in total population, constituting only 8 percent of totalhospital users.
3.85. Several factors are responsible for this pattern of usage. First is the urban location ofthe majority of hospitals, which improves geographical access to hospitals for urban dwellers,who are typically better-off than rural residents. Second, because the direct private cost ofusing hospital services is large, they tend to be used by higher income individuals. Third. thespread of health insurance between 1993 and 1998 may have reinforced this position, sinceindividuals with health insurance coverage tend to be better off than those without insurancecoverage and the health insurance agency largely reimburses hospital costs, but not communehealth center costs.
Levels of and Trends in Health Expenditure
3.86. Total health expenditure-both public and private (household) -was estimated atVND 28,773 billion or VND 383,226 per capita for 1998. This is equivalent to US$27.41 percapita or 8 percent of GDP and places Vietnam among those countries in Asia that spend themost on health care. Only Malaysia, Thailand and South Korea spend more on health percapita than Vietnam.
3.87. Public health expenditure. The public expenditure data show an impressive increasein public spending on health over the 1991-98 period. Both total and per capita publicspending on health increased more than two-fold in real terms-representing an annual rateof growth of around 12-14 percent, while health spending as a share of GDP and as a share oftotal government expenditure also increased, albeit at more modest rates. Such high growthrates in public spending on health reflect a high level of commitment by the government ofVietnam to the health sector.
3.88. But even after these increases, which come on a low base, per capita public healthspending in Vietnam was only VND 80,844 ($5.78)-or 1.4 percent of GDP and 7.0 percentof total government expenditure-in 1998 (if health insurance expenditure and hospital userfees are excluded). In absolute terms, Vietnam's public health expenditure of $5.78 is lessthan one-half of the $12 recommended by the World Development Report 1993 as beingneeded to finance an essential package of health services, including public health, for a low-income country. To achieve this level of spending, Vietnam would need to spend anadditional US$468 million annually.
4)
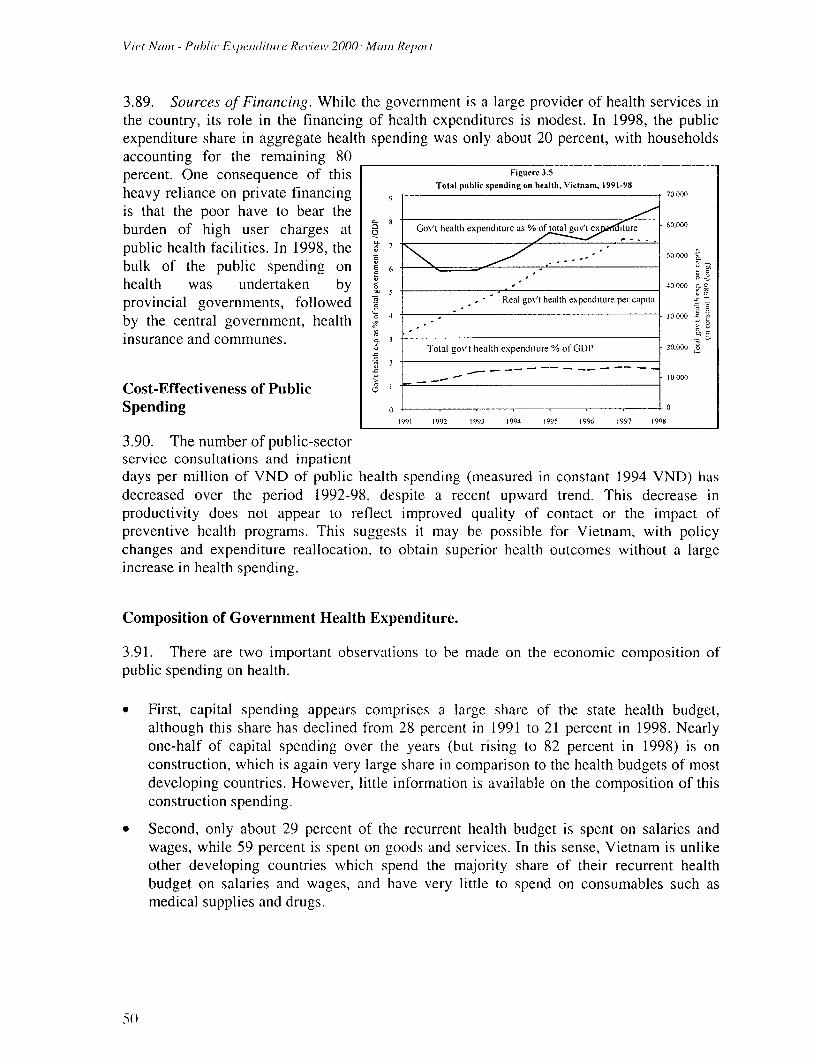
Viet Ncn ,, - Pusblic Expewliti, e Revtiestv 2000 M-,, Repoit
3.89. Sources of Financinig. While the government is a large provider of health services inthe country, its role in the financing of health expenditures is modest. In 1998, the publicexpenditure share in aggregate health spending was only about 20 percent, with householdsaccounting for the remaining 80percent. One consequence of this Figuere 3.5heavy reliance on private financing Total public spending on health, V'ictnan1, 1991-98heavy reliance on private financing 3 00
is that the poor have to bear theburden of high user charges at 8 Gov't health expenditure as % of total go0nt e re
public health facilities. In 1998, the , -\. 50000 -
bulk of the public spending on c 6
health was undertaken by 40000
provincial governments, followed s - ,, Real gov't health expenditure per capita
by the central government, health - -, 30000
insurance and communes. 3 .XTotal gov't health expenditure % of GDI)' 20.000 6
2 - …- -- - 0-
Cost-Effectiveness of PublicSpending 4 . . 0
1991 1992 1993 1994 1995 1996 1997 1998
3.90. The number of public-sectorservice consultations and inpatientdays per million of VND of public health spending (measured in constant 1994 VND) hasdecreased over the period 1992-98, despite a recent upward trend. This decrease inproductivity does not appear to reflect improved quality of contact or the impact ofpreventive health programs. This suggests it may be possible for Vietnam, with policychanges and expenditure reallocation, to obtain superior health outcomes without a largeincrease in health spending.
Composition of Government Health Expenditure.
3.91. There are two important observations to be made on the economic composition ofpublic spending on health.
* First, capital spending appears comprises a large share of the state health budget,although this share has declined from 28 percent in 1991 to 21 percent in 1998. Nearlyone-half of capital spending over the years (but rising to 82 percent in 1998) is onconstruction, which is again very large share in comparison to the health budgets of mostdeveloping countries. However, little information is available on the composition of thisconstruction spending.
* Second, only about 29 percent of the recurrent health budget is spent on salaries andwages, while 59 percent is spent on goods and services. In this sense, Vietnam is unlikeother developing countries which spend the majority share of their recurrent healthbudget on salaries and wages, and have very little to spend on consumables such asmedical supplies and drugs.
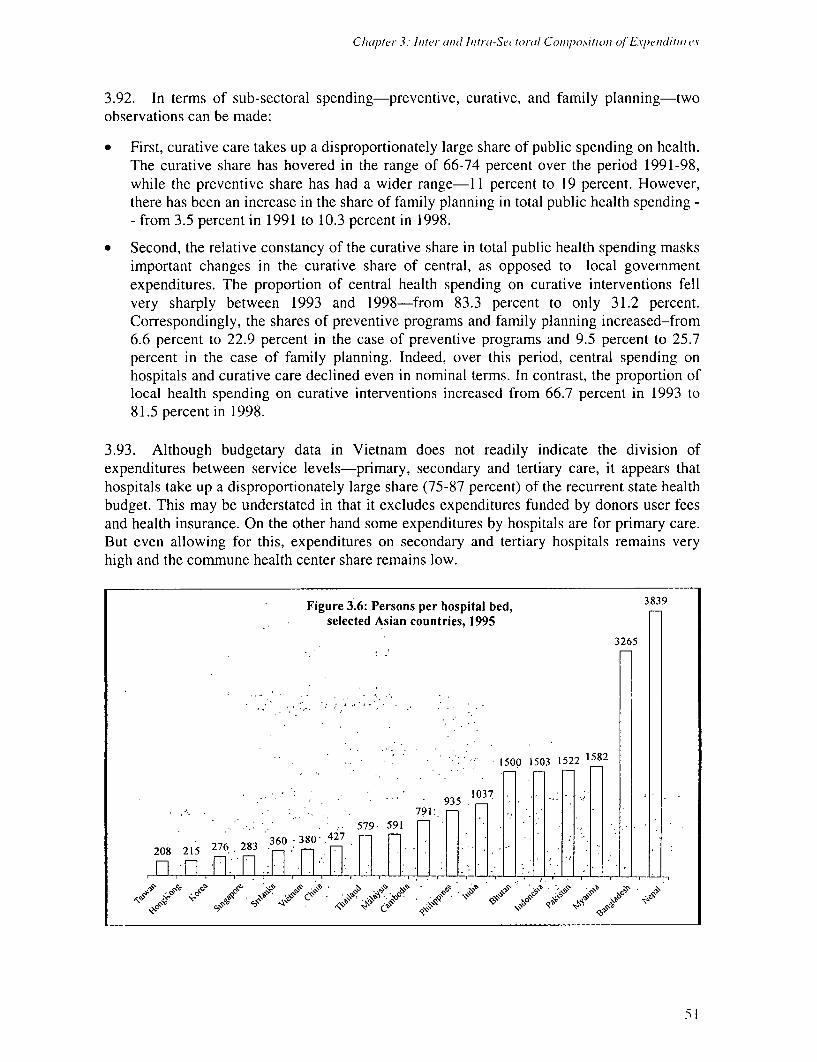
Chapter 3: lute,- au1( Intra-Sec toral Comp.%sitio, of E.vxpenditm es
3.92. In terms of sub-sectoral spending-preventive, curative, and family planning-twoobservations can be made:
* First, curative care takes up a disproportionately large share of public spending on health.The curative share has hovered in the range of 66-74 percent over the period 1991-98,while the preventive share has had a wider range- 1I percent to 19 percent. However,there has been an increase in the share of family planning in total public health spending -- from 3.5 percent in 1991 to 10.3 percent in 1998.
* Second, the relative constancy of the curative share in total public health spending masksimportant changes in the curative share of central, as opposed to local governmentexpenditures. The proportion of central health spending on curative interventions fellvery sharply between 1993 and 1998-from 83.3 percent to only 31.2 percent.Correspondingly, the shares of preventive programs and family planning increased-from6.6 percent to 22.9 percent in the case of preventive programs and 9.5 percent to 25.7percent in the case of family planning. Indeed, over this period, central spending onhospitals and curative care declined even in nominal terms. In contrast, the proportion oflocal health spending on curative interventions increased from 66.7 percent in 1993 to81.5 percent in 1998.
3.93. Although budgetary data in Vietnam does not readily indicate the division ofexpenditures between service levels-primary, secondary and tertiary care, it appears thathospitals take up a disproportionately large share (75-87 percent) of the recurrent state healthbudget. This may be understated in that it excludes expenditures funded by donors user feesand health insurance. On the other hand some expenditures by hospitals are for primary care.But even allowing for this, expenditures on secondary and tertiary hospitals remains veryhigh and the commune health center share remains low.
Figure 3.6: Persons per hospital bed, 3839selected Asian countries, 1995
3265
1500 1503 1522 1582
...',.- ' .-935 -
208 21527283630
FIT~~~~~~~~~~~~~~~~~~~~~~~~~~~~~~~~~~~~~~~~~~~~~~~~~~~~~~~~~~~~~~~~~~~
F1HFTH~~~Fi Fl 'b - pVelH H b
5'1
V'iet ANum, - Public E.yen,ulitm e Review 2000() Ali Report
3.94. The per capita availability of hospital beds in Vietnam is among the highest in theregion. The only countries having a lower ratio of population to hospital beds than Vietnamare Taiwan, Hong Kong, South Korea, Singapore and Sri Lanka, all of which haveconsiderably higher GNP per capita than Vietnam. Indeed, even Malaysia, Thailand and thePhilippines have higher population to hospital bed ratios. Printa facie this suggests that theremay be further scope for reducing the per capita number of hospital beds in Vietnam,primarily by holding back any expansion in the aggregate supply of hospital beds.
3.95. This emphasis on curative expenditure is both inefficient and inequitable. It isinefficient in that preventive care interventions should have first claim on public resources inview of their substantial externalities. It is inequitable in that curative spending is focussedmainly on hospitals, which have a disproportionately large number of users from the moreaffluent sections of the population.
Provincial Distribution of Health Expenditures
3.96. Provincial per capita spending on government health varies greatly across provinces(but with the vast majority of provinces having a public spending level of VND 24,000-50,000), and is strongly related to provincial GDP per capita. This is not unexpected, as aportion of government health expenditures is financed by provinces out of their own revenuesources, allowing richer provinces to spend more. Provinces having higher levels of privatespending on health per capita also have higher levels of government spending per capita. Thismeans that government spending is not being used as a tool to reduce the inequities inherentin a large share of health-care spending being financed by individuals or households.
3.97. While provincial variations in per capita public spending on health have narrowedbetween 1991 and 1998, this trend needs to be accelerated, by reviewing the norms used inallocating state health expenditures across provinces.
Public Expenditure Decision-Making Processes in Health
3.98. In Vietnam, the public health budget covers four levels of government: the centraland the three levels of local governments: provincial, district and commune. Since someexpenditures by communes from their own resources are not included in the State budget, acomprehensive database which aggregates the four levels into a consolidated statement ofsectoral expenditure is lacking. However, central, provincial and district governmentsaccount for about 90 percent of the national budget
3.99. The Ministry of Finance (MOF) and the Ministry of Planning and Investment (MPI)determine the expenditure allocation with limited inputs from the Ministry of Health. (MOH).The overall level of recurrent spending on health is determined by projected growth rates oftotal revenue and of total recurrent expenditures (after subtracting estimated expenditures fornew policies, such as increased salaries, etc.) and the share of health in total recurrentexpenditures. This type of incremental budgeting pays little attention to health goals andhealth priorities set by MOH.
5)
Chapter 3: In/ter- andtl hra-Sc( Itorl Comnpositioii of 'Eienditlui es
3.100. While MOH is in charge of setting health priorities and goals for the country it doesnot control or even have adequate information on the way provinces allocate their healthspending. While it is not desirable that central controls by the MOH should replace provincialautonomy in expenditure decisions, it is important that mechanisms be developed to provideMOH with adequate information to assess health outputs and outcomes at the local level , sothat it can exercise its policy role. (This issue is discussed more generally in chapter 2 of thisPER in relation to the role of sectoral ministries.)
3.101. Resource allocation by norms. The overall budgetary resources allocated to the healthsector are allocated on the basis of certain norms across two dimensions: functional (curativeversus preventive) and sectoral (Ministry of Health, other sector ministries, and theprovinces). These budget transfer norms are based either on the number of hospital bedsbelonging to a ministry (for curative expenditures) or on the population of the province (forboth curative and preventive expenditures). These amounts are supposed to cover salaries fora centrally-determined number of health workers in the provinces, fees and drug exemptionsfor the poor, and other recurrent expenses. The allocation norms vary across fivegeographical regions, presumably to capture variations in the unit cost of delivering servicesin different geographical regions. In general, the norm for curative expenditures is about 3times as high as that for preventive expenditures, reflecting the higher unit cost of curativeinterventions.
3.102. In the annual budget allocation document sent to provinces, only an aggregaterecurrent budget is provided-not its composition across sectors. Thus, provinces make theirown spending decision on each sector, including health. The provinces also can spend onhealth out of their own revenues which is the main reason for large variations in governmenthealth expenditure per capita across provinces, as richer provinces are able to spend morethan poorer provinces.
3.103. In addition, the provinces receive funds from the various national health programssuch as the Expanded Program of Immunization, the Tuberculosis Program, etc which aredesigned to achieve national standards in key areas. However, according to a recent study by
1 4a group of MOH experts , the allocations appear to be more or less evenly distributed acrossprovinces without account of the specific disease profile of a province. This suggests thatthese programs should be reviewed to ensure they are adequately targeted.
Health Financing Policies
3.104. In the last decade, the government has vigorously pursued two important policies forimproved financing of the health sector-greater cost recovery through higher user fees andexpanding health insurance coverage.
3.105. User Fees. Basic health care was formerly free for all, regardless of a patient's abilityto pay some or all of the cost of care. In 1989, a fee system was introduced in the three higher
14 National Health Support Project, Sub-component 3.1.2, "Evaluation of Current Status and Impact of SomeNational Program", Draft Report, December 1999.
53
Vie t Alu,m - Publh Eipt'ditulre Rlvi'w 2000 MaIin Report
(district, provincial and national) levels of the health-care delivery system, requiring thosepatients who are able to do so to pay at least a minimal part of their health care. In 1995, theMinistry of Health issued user fee schedules for each type of consultation and each type ofdiagnostic test and procedure performed in clinics and hospitals. All fees are required to bepaid in advance by non-insured patients and patients not eligible for fee exemption. For themost part, patients are responsible for the purchase of drugs themselves, either from a privatepharmacy or a pharmacy run by the public facility on the public premises. In 1998 user feesaccounted for about 7.4 percent of total public expenditures on health. There are fourimportant observations regarding user fees
* First, because the price schedule issued by the Ministry of Health only indicates a rangeof fees, provinces have discretion over the level of user fees charged, especially fortechnical services and laboratory tests.
* Second, the user fee schedule has not been adjusted since 1995, although the generalprice level has increased by about 23 percent since then. Total user fee collections havegrown rapidly over time, in part because of an increase in the number of patients seen atpublic facilities.
* Third, even though user fee levels may be low, average out-of-pocket costs for publichealth services-particularly, public hospitals-are large, and onerous for the poor. Forinstance, even a single visit to a public hospital takes up 22 percent of all non-foodexpenditure for a year for a typical person in the poorest quintile. A visit of standard(national average) quality would constitute 45 percent of annual non-food expenditure foran individual in the poorest quintile. In contrast, a person in the highest income quintilewould pay only 4 percent of his or her nonfood expenditure on a public hospital visit ofstandard quality.
* Fourth, although there is a formal mechanism in Vietnam for exempting certain classes of
people, such as the poor, handicapped, war veterans, orphans, and individuals sufferingfrom certain ailments (such as tuberculosis and leprosy), from user fees, it does not workwell in practice. One 1996 study found virtually no correlation between fee exemptior,sand household income. Data from the VLSS 1998 show that exemptions from paymentfor drugs are non-existent in both commune health centers and public hospitals, althoughMOH receives reports from hospitals indicating that exemptions from user fees aregranted, which include fees for drugs. The Government has agreed to conduct a reviewon how the exemption mechanism is working in practice.
3.106. Health Insiurance. Formal health insurance began in Vietnam in 1993, and comprises:(i) a compulsory scheme covering primarily current and retired civil servants and employeesof state and large (i.e., having more than 10 employees) private enterprises, and (ii) avoluntary scheme aimed at the remainder of the population. Premiums in the compulsoryscheme are paid from a 3 percent payroll tax, which is shared by employers (two-thirds) andemployees (one-third). Enrollees in the voluntary scheme pay fixed annual premia that varacross provinces and according to benefit coverage chosen. Currently health insurance cQyv_-T.-
54
Chapter 3 l tte, ad Iiit a-Se( toral Compa%itioa/ of Ependitures
about 12 percent of the country's population and in 1998 financed 11 percent of total publicexpenditures on health.
3.107. There are two main issues:
* First, the health insurance program does not benefit many poor or rural dwellers asenrollees in the compulsory health insurance scheme are civil servants and salariedemployees of state and large private enterprises, most of whom are middle-class urbanresidents. Thus, if the social health insurance program is to benefit the poor in Vietnam,there will need to be substantial expansion in coverage of the rural population by thevoluntary insurance scheme, which is in its infancy and covers only five percent of itstarget population.
* Second, the health insurance program has run into financial problems, in part because ofuncontrolled growth of insurance reimbursements. In 1996 and 1997 many of theprovincial health insurance funds were overdrawn in comparison to the premiumsreceived during that year. Although the overall financial integrity of the insurance fundwas not in jeopardy, such problems are likely to recur. To avoid possible over-servicingarising from consumer and provider moral hazard some limitations on reimbursementand a twenty percent co-payment requirement have been introduced.
Improving Health Information
3.108. The information base for analyzing the composition of public health spending and itsincidence is weak. Improvements are needed in the expenditure classification system, forexample between preventive and curative activities and between primary, secondary andtertiary levels. In addition to weaknesses in expenditure information, information on healthservice utilization and the health status of different groups in the population has been lackinguntil recently. The 1998 VLSS and the forthcoming National Health Survey are importantdevelopments in improving this information. However a regular system of household surveyswould enable MOH to more fully monitor the impact and benefit incidence of public healthexpenditures
A Menu of Reform Options
3.109. The above analysis provides a number of reform options for the Government ofVietnam to achieve its stated policy objectives and build upon its remarkable achievements inimproving the health status of its peoples. The options that the government may wish toconsider are:
* A shift from high-cost, hospital-based services to more cost-effective communehealth centers - and clinic-based health services to improve the cost effectiveness ofhealth spending. This current pattern of public spending is also inequitable as thelarger public subsidies go to hospitals which are used more by higher income groupsbenefit the rich, while facilities more used by the poor, such as commune healthcenters, are subsidized to a very small extent by the state budget. The government
55
Viet Na,,, - Public lExjpendituzre Rex'ewh 2000 -MIa,u RePort
may wish to further reduce public subsidies to hospitals, especially at provincial(secondary) and central (tertiary) levels.
Establishing a national strategy for assistance to the poor with their health-care costs.Available data suggest that actual out-of-pocket payments made by poor patients are verylarge in relation to their incomes. While a formal mechanism for exempting poor patientsfrom user fees exists, it appears note work well in practice. The government has alreadybegun moving in this direction-the Ministry of Health, the Ministry of Labor, WarInvalids and Social Affairs (MoLISA), and the Ministry of Finance have issued an inter-ministerial circular, outlining a consistent mechanism for providing free medical servicesto the poor.
* Once such a strategy is in place, the Government should consider raising hospital fees toreduce its subsidies to hospitals.
* A mechanism for ensuring that provinces make their health spending patterns consistentwith national health priorities and strategies is needed. Two-thirds of the state healthbudget spending takes place at the local (provincial) level. The high proportion ofcurative as opposed to preventive expenditure in provincial government healthexpenditures is symptomatic of this general problem of provincial expenditure allocationsnot reflecting practices established at the national level.
* Expansion of the health insurance program, especially the voluntary scheme should alsobe considered as a means of reducing health costs to the budget
* There is also a need to use public spending as a policy tool for reducing inter- provincialdisparities in private health-care spending and access to health care. Currently,government health expenditure reinforces, rather than compensates for, provincialdisparities in private health spending. It should be possible for the central government toreduce these disparities by adjusting the formula (transfer norms) covering healthexpenditures, used by the center in determining transfers to the provinces
* In the longer run (next 5-10 years), the government may want to rethink its roles in thehealth sector. It may make more sense for the government to reduce its role in the directprovision of curative, hospital-based health services, and focus on (i) provision of high-quality preventive health services, (ii) greater financing of health expenditures, especiailyfor the poor, and (iii) improving regulation and monitoring of the growing private sectorin health.
Education sector
Education Provision in Vietnam
3.110. There are four levels of schooling in Vietnam, pre-primary, primary (five years fromage 6), lower secondary (four years), and upper secondary (three years). Vocational educationis offered in a variety of institutions, and is available after primary and lower secondary.Higher education is offered in colleges and universities. offering respectively three anc f iUyear courses.
56
Chapter 3 -In'ter- and I,htra-.Se <oral Coniposition of ExpendIitui res
3.111. The Ministry of Education and Training (MOET) has policy responsibility for theeducation sector and also manages higher and some vocational institutions: Provincesmanage secondary schools, and districts and communes primary schools and pre-primaryfacilities. A small, but increasing element is in semi-public schools where governmentprovides the facilities, but parents meet the operating costs including salaries. The privatesector remains a small provider. Some specialized educational institutions are operated byother sectoral ministries.
Education Achievements
3.112. Vietnam has quite rapidly achieved better education for its citizens and has madeconsiderable progress in increasing enrolments and improving the efficiency and equity ofeducation expenditures. In the past decade net enrolments have improved significantly, dropout and repetition rates have fallen, gender balance has improved and the balance of publicsector spending has shifted more towards the early grades and thus the poor. Thegovernment's education policy objectives and targets are quite realistic and achievable.Nevertheless there are issues needing to be addressed. For example, in terms of educationalquality, the school day is short, there is little information on the quality of educationaloutcomes, there are considerable regional variations in expenditures and results and lowteachers salaries are a continuing concern.
3.113. Enrolments: Vietnam has high enrolment ratios compared to countries of a similarlevel of economic development. Table 3.6 shows the evolution of participation ratios. Theprimary Gross Enrolment Ratio (GER) declined as less over age children enter school, whilethe Net Enrolment Ratio has risen.'5 The post primary enrolment ratios have risensubstantially. At the lower secondary level Vietnam also has a relatively high GER,indicating a strong effort to enroll children in a basic cycle of nine years of education. Thereis a fairly even balance between male and female enrolments in primary and lower secondaryeducation, and girls' participation in upper secondary education is increasing as the improvedgender balance at the lower levels feeds through. The greatest increases in participation rateshave been among lower income groups, although remaining higher overall amongst thewealthier groups. Regional variations in enrolment have narrowed but remain large.
3.114. Dropout and repetition rates are also falling and the transition rates between theprimary, lower secondary and upper secondary levels have been rising, with a consequentrapid growth in post primary numbers. Clearly this development creates future expenditurepressures, as discussed below.
15 Gross Enrolment Ratio is the ratio of all children, including children over school age, in school at a givenlevel to the relevant school age population; Net Enrolment ratio is the share of school age children enrolled inschool, excluding over age children.
7
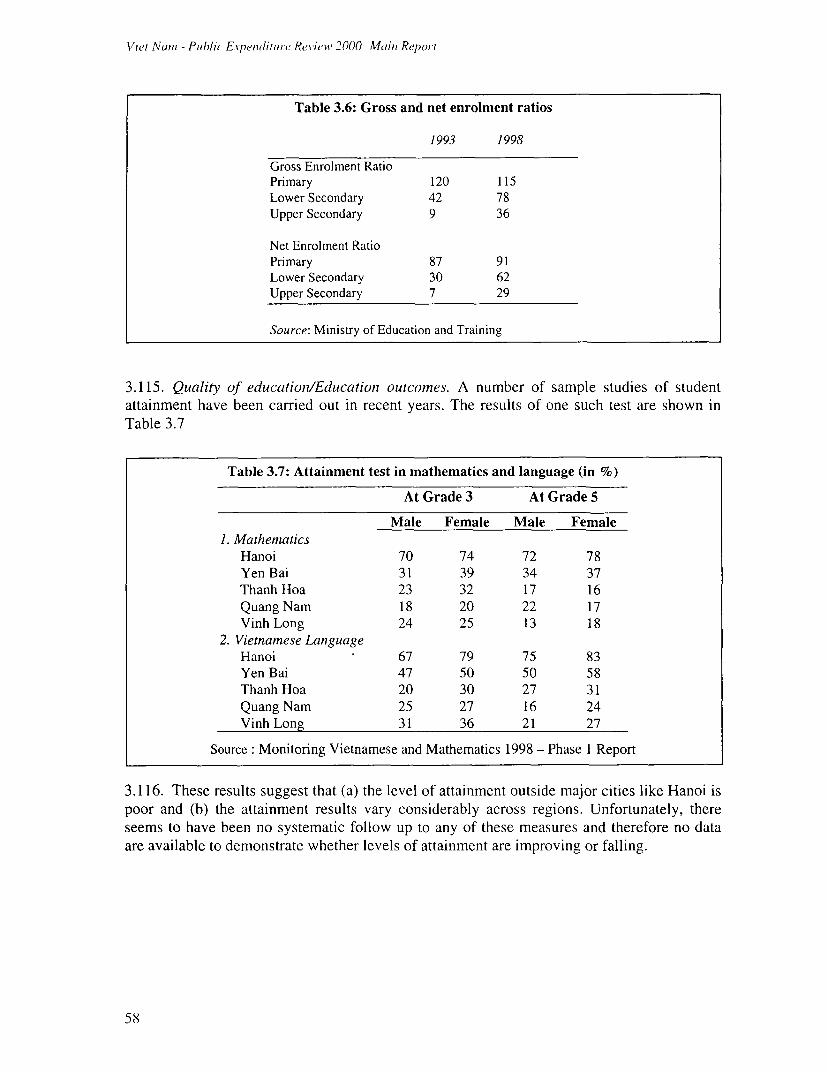
Viet Nanm - Pub/li Expenditure Review 2000 Main, Report
Table 3.6: Gross and net enrolment ratios
1993 1998
Gross Enrolment RatioPrimary 120 115Lower Secondary 42 78Upper Secondary 9 36
Net Enrolment RatioPrimary 87 91Lower Secondary 30 62Upper Secondary 7 29
Source: Ministry of Education and Training
3.115. Quality of education/Eduication outcomes. A number of sample studies of student
attainment have been carried out in recent years. The results of one such test are shown inTable 3.7
Table 3.7: Attainment test in mathematics and language (in %)
At Grade 3 At Grade 5
Male Female Male Female
1. MathernaticsHanoi 70 74 72 78Yen Bai 31 39 34 37Thanh Hoa 23 32 17 16Quang Nam 18 20 22 17Vinh Long 24 25 13 18
2. Vietnarnese LanguageHanoi 67 79 75 83Yen Bai 47 50 50 58Thanh Hoa 20 30 27 31Quang Nam 25 27 16 24Vinh Long 31 36 21 27
Source : Monitoring Vietnamese and Mathematics 1998 - Phase 1 Report
3.116. These results suggest that (a) the level of attainment outside major cities like Hanoi ispoor and (b) the attainment results vary considerably across regions. Unfortunately, thereseems to have been no systematic follow up to any of these measures and therefore no dataare available to demonstrate whether levels of attainment are improving or falling.
58
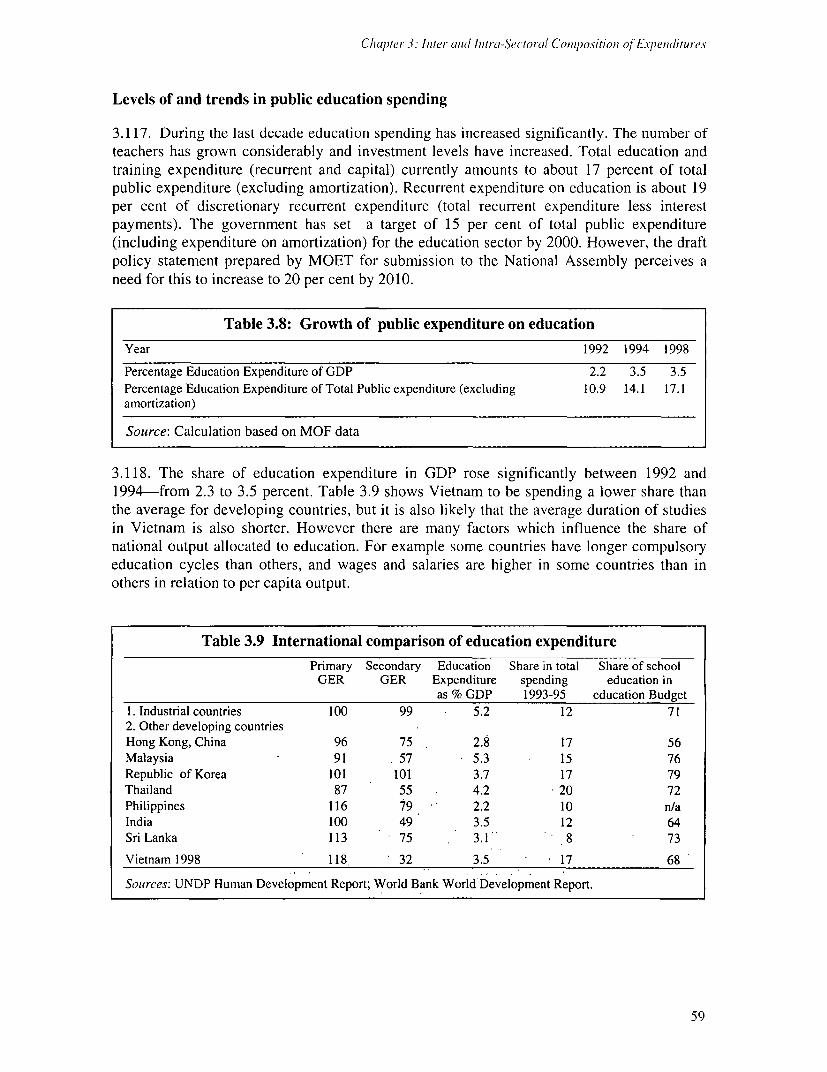
Chapter 3: Inter and hnira-Sectorul Comnposition ot Evpenditures
Levels of and trends in public education spending
3.117. During the last decade education spending has increased significantly. The number ofteachers has grown considerably and investment levels have increased. Total education andtraining expenditure (recurrent and capital) currently amounts to about 17 percent of totalpublic expenditure (excluding amortization). Recurrent expenditure on education is about 19per cent of discretionary recurrent expenditure (total recurrent expenditure less interestpayments). The government has set a target of 15 per cent of total public expenditure(including expenditure on amortization) for the education sector by 2000. However, the draftpolicy statement prepared by MOET for submission to the National Assembly perceives aneed for this to increase to 20 per cent by 2010.
Table 3.8: Growth of public expenditure on education
Year 1992 1994 1998
Percentage Education Expenditure of GDP 2.2 3.5 3.5Percentage Education Expenditure of Total Public expenditure (excluding 10.9 14.1 17.1amortization)
Source: Calculation based on MOF data
3.118. The share of education expenditure in GDP rose significantly between 1992 and1994-from 2.3 to 3.5 percent. Table 3.9 shows Vietnam to be spending a lower share thanthe average for developing countries, but it is also likely that the average duration of studiesin Vietnam is also shorter. However there are many factors which influence the share ofnational output allocated to education. For example some countries have longer compulsoryeducation cycles than others, and wages and salaries are higher in some countries than inothers in relation to per capita output.
Table 3.9 International comparison of education expenditure
Primary Secondary Education Share in total Share of schoolGER GER Expenditure spending education in
as % GDP 1993-95 education Budget
1. Industrial countries 100 99 5.2 12 712. Other developing countriesHong Kong, China 96 75 2.8 17 56Malaysia 91 57 5.3 15 76Republic of Korea 101 101 3.7 17 79Thailand 87 55 4.2 20 72Philippines 116 79 2.2 10 n/aIndia 100 49 3.5 12 64SriLanka 113 75 3.1 8 73
Vietnam 1998 118 32 3.5 17 68
Soturces: UNDP Human Development Report; World Bank World'Development Report.
59
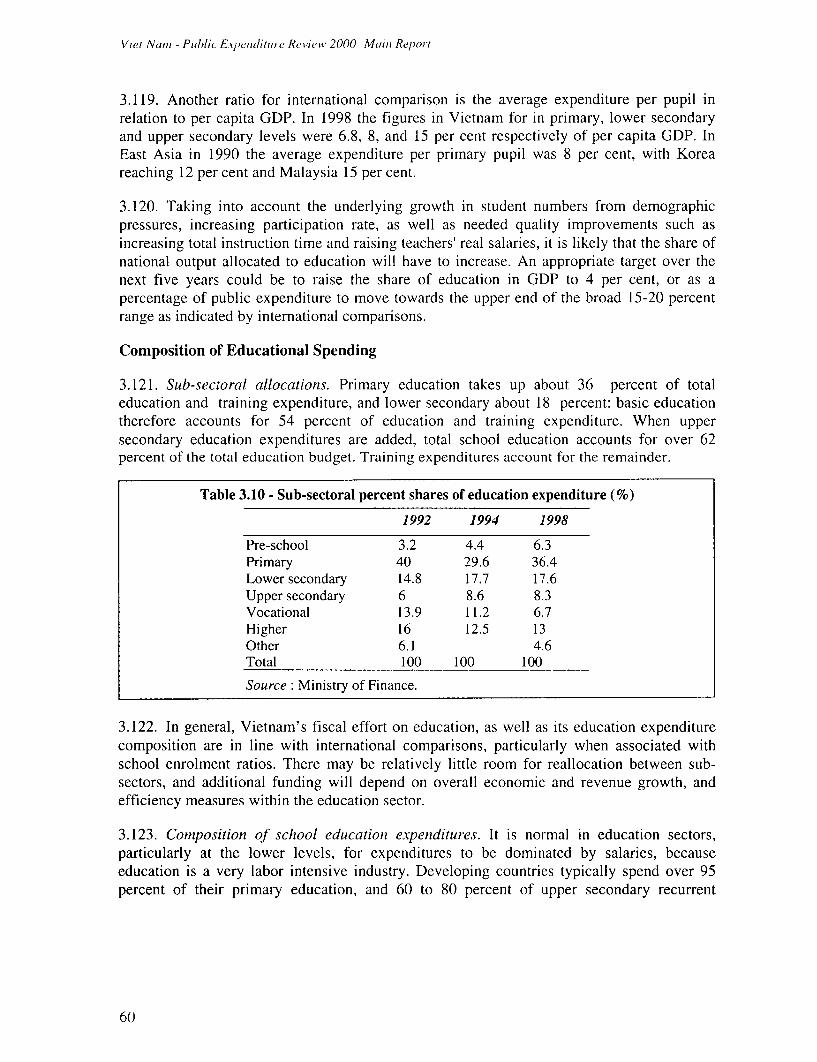
Viet Nanm - Pulb/iL Expenditure Revi.iew 2000 Main Report
3.119. Another ratio for international comparison is the average expenditure per pupil inrelation to per capita GDP. In 1998 the figures in Vietnam for in primary, lower secondaryand upper secondary levels were 6.8, 8, and 15 per cent respectively of per capita GDP. InEast Asia in 1990 the average expenditure per primary pupil was 8 per cent, with Koreareaching 12 per cent and Malaysia 15 per cent.
3.120. Taking into account the underlying growth in student numbers from demographicpressures, increasing participation rate, as well as needed quality improvements such asincreasing total instruction time and raising teachers' real salaries, it is likely that the share ofnational output allocated to education will have to increase. An appropriate target over thenext five years could be to raise the share of education in GDP to 4 per cent, or as apercentage of public expenditure to move towards the upper end of the broad 15-20 percentrange as indicated by international comparisons.
Composition of Educational Spending
3.121. Sub-sectoral allocations. Primary education takes up about 36 percent of totaleducation and training expenditure, and lower secondary about 18 percent: basic educationtherefore accounts for 54 percent of education and training expenditure. When uppersecondary education expenditures are added, total school education accounts for over 62percent of the total education budget. Training expenditures account for the remainder.
Table 3.10 - Sub-sectoral percent shares of education expenditure (%)
1992 1994 1998
Pre-school 3.2 4.4 6.3Primary 40 29.6 36.4Lower secondary 14.8 17.7 17.6Upper secondary 6 8.6 8.3Vocational 13.9 11.2 6.7Higher 16 12.5 13Other 6.1 4.6Total 100 100 100
Source: Ministry of Finance.
3.122. In general, Vietnam's fiscal effort on education, as well as its education expenditurecomposition are in line with international comparisons, particularly when associated withschool enrolment ratios. There may be relatively little room for reallocation between sub-sectors, and additional funding will depend on overall economic and revenue growth, andefficiency measures within the education sector.
3.123. Composition of school education expenditures. It is normal in education sectors,particularly at the lower levels, for expenditures to be dominated by salaries, becauseeducation is a very labor intensive industry. Developing countries typically spend over 95percent of their primary education, and 60 to 80 percent of upper secondary recurrent
60
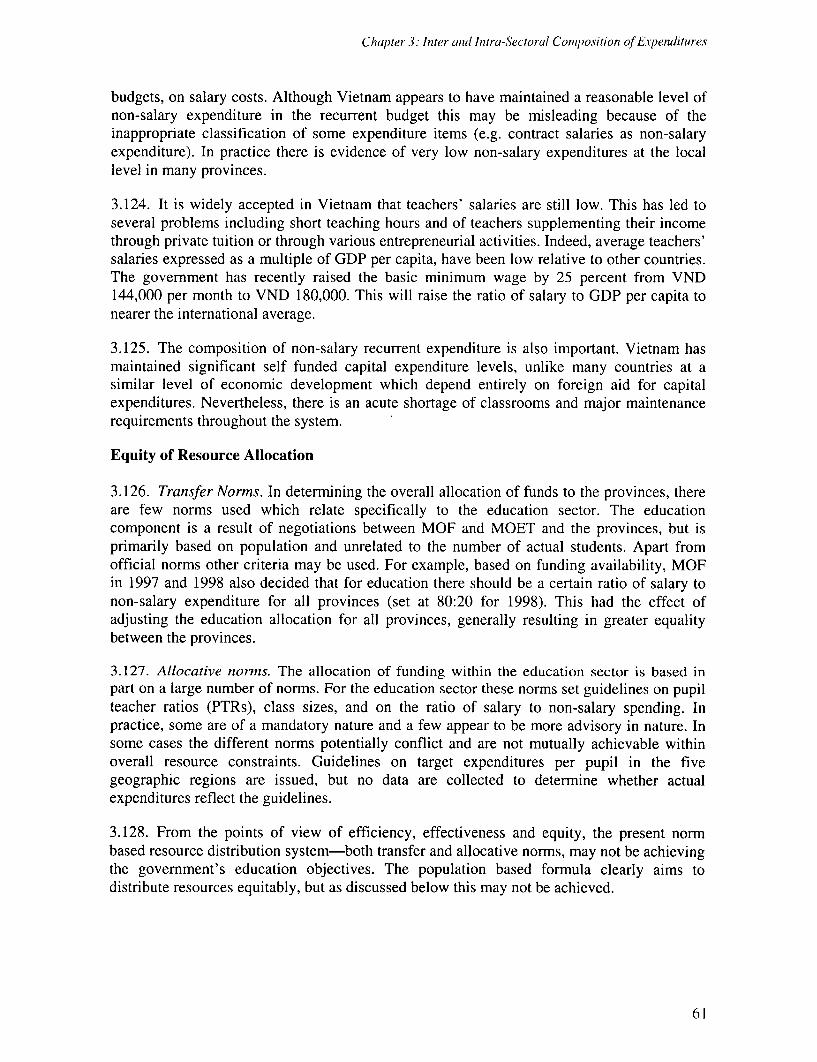
Chapter 3: Inter andt Intru-Sectoral Composition of Expenditures
budgets, on salary costs. Although Vietnam appears to have maintained a reasonable level ofnon-salary expenditure in the recurrent budget this may be misleading because of theinappropriate classification of some expenditure items (e.g. contract salaries as non-salaryexpenditure). In practice there is evidence of very low non-salary expenditures at the locallevel in many provinces.
3.124. It is widely accepted in Vietnam that teachers' salaries are still low. This has led toseveral problems including short teaching hours and of teachers supplementing their incomethrough private tuition or through various entrepreneurial activities. Indeed, average teachers'salaries expressed as a multiple of GDP per capita, have been low relative to other countries.The government has recently raised the basic minimum wage by 25 percent from VND144,000 per month to VND 180,000. This will raise the ratio of salary to GDP per capita tonearer the international average.
3.125. The composition of non-salary recurrent expenditure is also important. Vietnam hasmaintained significant self funded capital expenditure levels, unlike many countries at asirnilar level of economic development which depend entirely on foreign aid for capitalexpenditures. Nevertheless, there is an acute shortage of classrooms and major maintenancerequirements throughout the system.
Equity of Resource Allocation
3.126. Transfer Norms. In determining the overall allocation of funds to the provinces, thereare few norms used which relate specifically to the education sector. The educationcomponent is a result of negotiations between MOF and MOET and the provinces, but isprimarily based on population and unrelated to the number of actual students. Apart fromofficial norms other criteria may be used. For example, based on funding availability, MOFin 1997 and 1998 also decided that for education there should be a certain ratio of salary tonon-salary expenditure for all provinces (set at 80:20 for 1998). This had the effect ofadjusting the education allocation for all provinces, generally resulting in greater equalitybetween the provinces.
3.127. Allocative norms. The allocation of funding within the education sector is based inpart on a large number of norms. For the education sector these norms set guidelines on pupilteacher ratios (PTRs), class sizes, and on the ratio of salary to non-salary spending. Inpractice, some are of a mandatory nature and a few appear to be more advisory in nature. Insome cases the different norms potentially conflict and are not mutually achievable withinoverall resource constraints. Guidelines on target expenditures per pupil in the fivegeographic regions are issued, but no data are collected to determine whether actualexpenditures reflect the guidelines.
3.128. From the points of view of efficiency, effectiveness and equity, the present norrnbased resource distribution system-both transfer and allocative norms, may not be achievingthe government's education objectives. The population based formula clearly aims todistribute resources equitably, but as discussed below this may not be achieved.
61
Viet Nuni - Public Expenditure Review 2000 Main Report
3.129. A recent review'6 of how budgetary resources cascaded through the education systemshowed how decisions about the mix of resources may be affected by the allocativemechanisms used at the different levels of government rather than conscious decisions aboutwhat mix will produce the best service. In particular, staff related costs are treated at eachlevel in the cascade as fixed by the current and planned number of teachers. Investmentexpenditure is subject to a separate, parallel, and sometimes unrelated allocative process fromrecurrent expenditure. As a result, other important expenditure such as teaching and learningmaterials, teacher aids, furniture and equipment and building maintenance are treated asresidual items and are highly vulnerable to overall resource constraints.
3.130. Geographical distribution. There is significant variation between and withinprovinces in the share of school age children in the total population. Thus, a resource transferformula based on population will tend not to provide an equal level of funding per studentresource in the absence of adjustment factors to fully compensate for those variations. This isconfirmed in Table 3.11, where wide variations in average budgeted expenditure per pupil areseen between and within the provinces, with little clear correlation with per capita GDP.
Table 3.11 Regional differences in average school expenditure
Province Per capita GDP Average Expenditures (in '000 VND)
('000 VND)Primary Junior Secondary Senior Secondary
Red River Delta 4,010 340 417 809North East 2,321 374 466 956North West 2,113 490 444 783North Central Coast 2,368 315 346 742South Central Coast 2,998 348 459 1046Central Highlands 3,355 421 325 1124North East South 8,598 423 484 1365Mekong River Delta 3,811 340 401 930
Source: Calculation based on MOF data
3.131. There are a few positive aspects of the population-based assessment of spending needcurrently applied by the center in budget negotiations with provinces. It is relatively simple
for the Ministry of Finance to operate and calculate. It also leaves greater freedom to make
expenditure decisions at the local level and in principle resources are available to fund
development and improvement expenditure in areas with low participation in order to
encourage greater participation. On the other hand, the per capita norm creates some
potentially perverse incentives. In particular, higher pupil numbers do not attract additional
resources so there is no incentive to increase enrolments, both of which may be seen as unfairby managers.
3.132. To deliver an acceptable level of service across the country the following changesseem appropriate:
16 Education Financing Study: Primary Education in Vietnam, A DFID Report, September 1999.
62
Chapter 3: Inter andl Intra-Sectoratl Composition of Eypenditures
* Simplifying and changing the role of the norms, making them guidelines, with localmanagement having discretion as long as educational outcomes are achieved and budgetallocations are not exceeded. As such, ex post analysis of expenditure in relation toeducational outcomes rather than ex ante expenditure norms would become the focus.
* Possibly providing funding on the basis of a core or minimum cost per student whichreaches each school level throughout the country. Separate funds could be allocated forattracting new students, tackling local problems of access and participation andenhancing service quality. These separate elements should have a pro-poor bias-relatingthem to provincial GDP per capita may be appropriate. Setting minimum expenditure perstudent on non-salary expenditures and maintenance would also be appropriate.
3.133. Incidence of public expenditure. The analysis of VLSS data suggests that there hasbeen a shift towards the poor in the benefits from public expenditure on education since 1992,though benefits at post primary levels continue to favor the better-off. Not only haveparticipation rates of the wealthy and the poor moved closer across all grades but the balanceof subsidy has shifted towards lower grades where participation by the poor is strongest.Further improvements can be expected as the pupils in the lower levels containing largernumbers of students from poor families, eventually move through the system-but providedpolicies to improve access to higher grades of education by the poor continue.
3.134. Cost sharing with parents. A high proportion of the total cost of education at all levelsis born by parents through a variety of charges, or directly in meeting costs such as textbooks.However the government meets a greater share of basic education expenditures and a lessershare of expenditure at other levels, as shown in the following table 3.12.
3.135. In addition, it is well known that many teachers provide supplementary education onan informal basis for parents who pay. Over 11 per cent of total expenditure per primary childappears to be accounted for by private tuition charges, with richer households paying onaverage twice that percentage. In many provinces some semi-public places are occupied bythose children who fail graduation tests. Furthermore, post primary level fees are used bysome schools to supplement teachers' salaries.
3.136. While there is provision for exemption from charges, the incidence of exemptions isstill limited and far from pro-poor, with exemptions spread over all consumption quintiles(VLSS, 1993 and 1998). Further narrowing the participation gap will be hindered unlessmeasures are taken to enhance the ability or incentive to waive charges for the less well-off.
3.137. The higher education and vocational sub-sectors have also seen a rise in cost sharingwith parents. In common with higher education institutions, TVET schools generateadditional revenues through privately paying students, contract training and sales of goodsand services. Some schools earn over 75 percent of their operating expenditures in this way.A significant proportion of fees goes to supplementing teachers' salaries. Fees are charged forall short courses, and are paid by employers or students themselves. In addition students areexpected to provide their own books and learning materials.
63
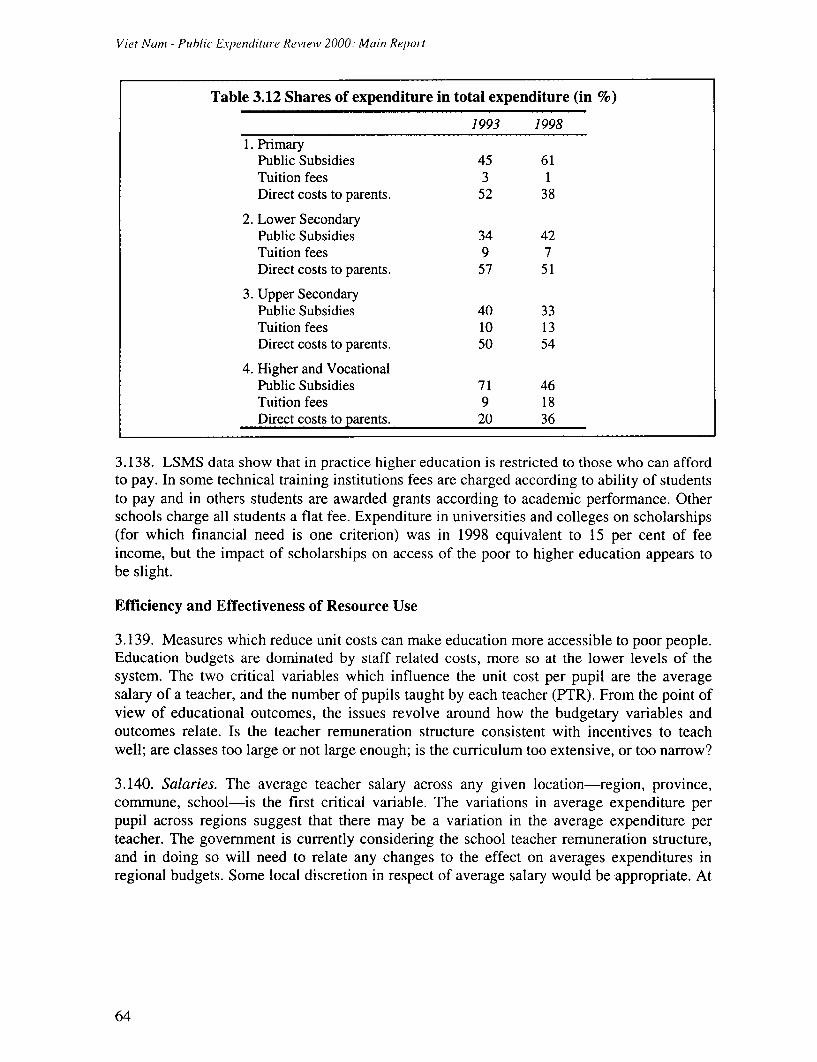
Viet Narn - Public Expenditure Review 2000: Main Report
Table 3.12 Shares of expenditure in total expenditure (in %)
1993 19981. Primary
Public Subsidies 45 61Tuition fees 3 1Direct costs to parents. 52 38
2. Lower SecondaryPublic Subsidies 34 42Tuition fees 9 7Direct costs to parents. 57 51
3. Upper SecondaryPublic Subsidies 40 33Tuition fees 10 13Direct costs to parents. 50 54
4. Higher and VocationalPublic Subsidies 71 46Tuition fees 9 18Direct costs to parents. 20 36
3.138. LSMS data show that in practice higher education is restricted to those who can affordto pay. In some technical training institutions fees are charged according to ability of studentsto pay and in others students are awarded grants according to academic performance. Otherschools charge all students a flat fee. Expenditure in universities and colleges on scholarships(for which financial need is one criterion) was in 1998 equivalent to 15 per cent of feeincome, but the impact of scholarships on access of the poor to higher education appears tobe slight.
Efficiency and Effectiveness of Resource Use
3.139. Measures which reduce unit costs can make education more accessible to poor people.Education budgets are dominated by staff related costs, more so at the lower levels of thesystem. The two critical variables which influence the unit cost per pupil are the averagesalary of a teacher, and the number of pupils taught by each teacher (PTR). From the point ofview of educational outcomes, the issues revolve around how the budgetary variables andoutcomes relate. Is the teacher remuneration structure consistent with incentives to teachwell; are classes too large or not large enough; is the curriculum too extensive, or too narrow?
3.140. Salaries. The average teacher salary across any given location-region, province,commune, school-is the first critical variable. The variations in average expenditure perpupil across regions suggest that there may be a variation in the average expenditure perteacher. The government is currently considering the school teacher remuneration structure,and in doing so will need to relate any changes to the effect on averages expenditures inregional budgets. Some local discretion in respect of average salary would be appropriate. At
64
Chupter 3: Inter- aind hitra-Sectoral Comp7osition? of Expencditures
the higher levels of education the degree of salary supplementation from outside sources isconsiderable, and needs to be taken into account when developing a remuneration policy.
3.141. Pupil teacher ratio (PTR). Pupil teacher ratios are one of the most difficult (andneglected) aspects of education management, but they are at the heart of resource allocationissues. There is always a trade-off between the number of pupils per teacher, and theavailability of resources to finance non-salary items essential for learning and good teaching.Where resources are severely limited, as in Vietnam, management of the PTR is a criticalfactor.
3.142. Internationally, PTRs-where they have been fairly high-decline slowly asresources become available. However, countries with low PTRs have high salary shares intheir budgets, often accompanied by problems of financing other learning inputs. At theprimary education level in Vietnam there is more or less one teacher per class: in other wordsthe PTR is roughly the same as the pupil class ratio. This is because teachers teach allsubjects. At lower secondary level in 1998 the ratio was 1.45 teachers for every class, andupper secondary was 1.6. In other words, post-primary PTRs are curriculum driven, as wellas being influenced by total enrolments in each school.
3.143. Overall the picture in Vietnam is one of increasing PTRs at post primary levels andrelatively static ratios at the primary level. This tendency for PTRs to increase in secondaryeducation likely reflects rapid enrolment growth outstripping teacher availability. MOETpolicy is to train secondary teachers to teach more than one subject which will also cause thePTR to rise.
3.144. More efficient utilization of staff has helped enrolment growth in higher education inthat both teaching hours and class sizes have increased. But there is scope to rationalizeresources used in some areas of vocational and higher education in where pupil teacher ratioscontinue to be low and establishments are small and inefficient.
3.145. Quality of Teaching and Teacher Motivation: Teacher salaries need to be set at alevel which encourages teachers not to seek other work. New salary structures and increasesin the general level of salaries should be related as far as possible to improved competenceand work practices.
3.146. Infrastructure: Infrastructure costs are reduced by the short-school day, whichprovides two shifts per day at schools. In spite of the levels of investment spending there areclear sign that infrastructure is failing to keep pace with the increased participation ineducation. VLSS shows high percentages of classrooms in poor condition, but withconsiderable variation between regions. One way of obtaining additional leverage fromconstruction funds could be to provide such capital funds on a repayable basis to schools andcommunities. This would involve establishing a revolving fund administered by eachprovince. The initial Fund contribution would be replenished by regular re-payments from theschool or community, providing funds to be re-lent on an ongoing basis for furtherconstruction spending.
65
Viet Nanm - Puhblu Expenduitre Review 2()()l- Main Repao t
An Agenda of Reform Options
3.147. The main objective of this sectoral analysis is to help the government in betterachieving its national policy objectives. To this end, the following reform options should beconsidered:
a. To achieve the develop of the education sector planned by the Government there maybe a need to gradually increase public education spending over the period to 2005 to around 4percent of GDP (from the current 3.5 percent level) or to move education expenditures as apercentage of public expenditure from the current level of 15 percent to around 20 percent.The additional resources could be used to improve salaries fund higher participation insecondary and higher grades flowing through from the increased primary enrolments, and toimprove service quality at all levels.
b. There is little scope to shift resources between education sub-sectors withoutdamaging service levels. It is necessary to ensure that the higher salary levels do not squeezeout non-salary and investment expenditures
c. Existing regional variations need to be addressed by reviewing the present system ofnorms. Allocative norms should become more advisory in nature. Funding for students in thesystem should take account of geographic factors such as sparse population. In doing so aminimum amount of funding per student could be guaranteed. Separate funding fordevelopmental and improvement expenditure should reflect a pro-poor bias (provincial GDPper capita is a good measure for this). An element of this latter component of funding couldinclude a fund for measures to attract and retain new pupils. Such a more equitable base offunding would enable more and better targeted waiving of fees at the local level.
d. There is scope for increasing pupil/teacher ratios at all levels. This would help inrestraining the cost of government's (desirably) ambitious education policies. Methods ofachieving higher ratios at post primary levels include increasing the number of subjects ateacher can teach, and the number of hours taught. The opportunity could be taken whenincreasing teacher salaries to relate increases to improved competence and to better workingpractices.
e. There may be scope for leveraging expenditure on school infrastructure throughestablishing a revolving fund under which schools or communities would be lent funds forconstruction. Repayments would be used on an ongoing basis to fund further construction.
f. Testing student attainment-external objective tests of pupil skills-on a sample basis,is important. This outcome infornation is vital to effective policy development and planningthrough building up a, time series have. For example existing information suggestsconsiderable variations between regions in education attainment and the need to ensuregreater evenness in educational quality. The focus could be both on output (students served)and attainment (level and usefulness of skills achieved). Analysis of links betweenexpenditure allocations and educational outcomes will assist in better allocation of educationexpenditures.
66
Ca1apte 3- Initei a;ui lIntra-Set torul Cot?ipositioni of Expenlitures
Transport sector
The Current Transport Infrastructure
3.148. Due to Vietnam's geographical features, and concentration of population andeconomic activity, the transport network is quite concentrated and traffic density is highest inand around the urban centers in the northern and southern delta areas.
3.149. Roads: Roads are by far the most important transport mode. The country has anextensive road network of over 209,000 km, comprising national roads, provincial district,commune and village roads. With a road density of 0.3 km/sq.km, Vietnam's coverage equalsthat of the more developed ASEAN countries of Thailand, Philippines and Brunei. Howeverin terms of quality, Vietnam's road network is not so good. Surveys indicate that almost halfof the national road network is in poor to very poor condition. Moreover, close to one quarterof the bridges have reduced bearing capacity and need to be rehabilitated or replaced. Thesituation of the provincial, district and commune roads is even worse. Earth roads account forthe bulk of rural roads, some of which become impassable during the rainy season. Inaddition more than 600 communes have no road access to district centers.
3.150. Water transport. In the northern and southern deltas of the country, inland waterwaysplay an important role as a low cost mode of transportation for bulk commodities such ascoal, building materials and rice and for the rural population generally. About one quarter ofthe country's total land freight is transported by inland waterways, which are complementaryto road transport. There are about 41,000 km of inland waterways for informal and smallscale commercial transport but of these, only about 10 percent are of sufficient depth to allowindustrial type transport vessels of 50 dwt or more. Maintenance has been inadequate whichhas resulted in siltation and loss of water depth. In turn, this has hampered the utilization oflarge vessels and has led to increased transport costs, particularly to the rural poor.
3.151. Railways. Vietnam Railways (VR) operates a network of 2,832 km from Lao Cai atthe Chinese border and Haiphong in the north to HCMC in the south. The bulk of the railwayinfrastructure and rolling stock have deteriorated and are in need of replacement/repair. Themain short term problem is the large number of deteriorated bridges, some of which are nowbeing repaired with assistance from Japan. VR's share of total land traffic in 1998 was aboutfive percent for freight (17 percent in ton-km) and 1.3 percent for passengers (12.5 percent inpassenger km). The provision and upkeep of the rail infrastructure is funded from the budgetwhile VR is responsible for rail operations.
3.152. Sea Ports. Vietnam has seven national sea ports administered by MOT, 20 municipaland provincial sea ports, administered by localities and a number of ports that are operated byother ministries, including the navy. The most important ports are Haiphong, Da Nang andHCMC which in 1997 handled almost 50 percent of all port throughput. Shallow waterdepths, long access channels (Haiphong and HCMC), narrow port areas, outdated equipmentand poor management have all contributed to low port productivity, high operating costs andunder utilization of capacity.
67
Viet Num - Public Expenditure Rev iew 2000: Maini Report
3.153. From 1994 to 1999, traffic on all land transport modes rose by an average of 10percent a year for freight and over three percent for passengers. Among the different modesmaritime freight traffic increased at a rate of over 25 percent per year, inland waterways at 20percent per year (7.5 percent for passengers), road transport at close to 10 percent (7.2percent for passengers) and rail transport roughly three percent for both freight andpassengers. Throughput of the country's seaports rose by an average 15 percent per year from1995 to 1999, reflecting the Vietnam's successful re-integration into world trade.
Sector performance
3.154. Low transport productivity: Notwithstanding recent progress, the efficiency of thetransport sector remains quite low. The potential for transport cost reductions is considerable,provided management and operations are improved and infrastructure and equipmentcontinues to be modernized.
3.155. In the road sub-sector, the average speed is between 20 to 25 km per hour for freightand 30 km per hour for passengers. The average carrying capacity of a truck is also relativelylow, truck sizes being limited by road conditions which increases unit costs. The poor state ofroads causes additional economic costs to users estimated by the World Bank at up $160million annually. In addition inadequate maintenance means that roads eventually have to berehabilitated at much higher cost.
3.156. A similar picture emerges for sea-ports. The country's two main port complexes ofHaiphong and HCM operate at low capacity, are often congested in storage areas and arepoorly connected with the land transport network. Shallow drafts limit ship size and thusraise shipping costs. The present system of national/regional tariffs and the cross-subsidization of the national shipping line by foreign shipping hamper desirable competitionbetween ports. Absence of a result oriented and accountable management exacerbates thesituation. All these factors contribute to lower port productivity, thereby reducing Vietnam'sinternational competitiveness. According to a recent survey Vietnam's ports are among thehighest cost ports in the Southeast Asian region. For example, transporting of a twenty footcontainer from Tokyo to one of the three economic zones in Vietnam can cost up to US$1,000 more than the cost of transportation to Manila or Bangkok.17
3.157. Vietnam Railways is roughly comparable to most of the other smaller railways in theregion. Although well run in an engineering sense, VR's labor and locomotive productivityare among the lowest in the region, as is its average traffic density.
3.158. In inland waterways the backlog of dredging and lack of navigation aids to permitnight navigation has reduced the size and speed and thus the productivity of inland waterwayvessels.
17 World Bank, Country Framework Report on Private Participation in Infrastructure: The Case of Vietnam,1999.
68
Chapter 3X Iiutel han Inn n-Secto({d Compositioll of'Expend(itures
Government Objectives and Priorities
3.159. The rehabilitation and modernization of the country's dilapidated transportinfrastructure has correctly been the main policy objective of the Government's PublicInvestment Program (PIP) 1996-2000. Priority was assigned to transport infrastructure in thethree strategic economic zones of (i) Hanoi-Haiphong corridor in the north; (ii) Da Nang inthe center; and (iii) HCMC-Vung Tau corridor in the south. Other priorities included creationof links with neighboring countries; integration of transport systems, including portdevelopment to facilitate international trade; and development of urban infrastructure andpublic transport services to reduce congestion.
3.160. These objectives were ambitious and their realization required a large investmentprogram. It soon became obvious that this development program could not be implementedduring the 1996-2000 plan period and had to be broken down into more manageable sub-programs which could then be implemented over a period of 10-15 years. During 1996-2000,the main emphasis was on upgrading the trunk roads and other basic infrastructure in thegrowth triangles of northern, central and southern regions. In 1997 these regions generatedabout 75 percent of the country's GDP, attracted more than 80 percent of foreign directinvestment and accounted for 75 percent of' the country's exports/imports, so thisprioritization reflected an emphasis on economic growth and efficiency. Some provincial orrural projects justified more on equity grounds, had to be deferred.
3.161. Thus progress in improving the nation's rural roads network has been slow and is areflection of the resource constraints faced by the Government-both central and local. Someareas in the Mekong Delta, the North Central Coast and other regions are still completelyinaccessible by road. Despite the resource constraint, the Government, with the activeassistance of the local population, has managed to improve about 11,000 km of rural roads,although in many cases insufficient attention has been paid to quality. To address this andother related issues, the Government (assisted by the donor community) is finalizing acomprehensive rural roads strategy. It is likely that significant increases in investment in ruraltransport will be proposed in the PIP for the 2001-2005 period. Recent ODA funding forlocal entities has been used for large A-type projects in agriculture and rural development, inwhich transport infrastructure repair comprises a large or even dominant role. However, theamount of this expenditure in rural roads is not separately reported, or known to MOT.
3.162. Investment in the railway system has so far been small and is focussed in keeping thesystem operating safely. Urban transport improvement has received little funding so far.
Levels of and trends in state transport spending
3.163. The importance that the GOV attaches to the modernization of the nation's transportinfrastructure is reflected in the State's overall expenditure patterns for the sector. There hasbeen a marked shift of public resources in both nominal and real terms towards transportsince the early nineties and both capital and recurrent expenditures in transport haveincreased faster than in other sectors, as set out in table 3.13. The increase from 1993 to 1994
69
V7iet Nunm - Pu/11i Epeiilditio e R'eviv 2000: Mai, Report
reflects the increased flow of ODA into Vietnam and the priority attached by both donors and
GOV to rehabilitating the basic transport infrastructure. The split of total transportexpenditure between central and local spending units shifted slightly in favor of local
spending entities. About 85 percent of all transport expenditure is capital expenditure. Morethan one half of 1997 and 1998 capital expenditure by the central level was funded by ODAwhile that of the local entities was mainly funded by the Government's own funds and
contributions by the people.
Table 3.13. State transport expenditures (in %)
1993 1994 1997 1998
Capital Expenditure/Total Transport/State Capital 18.8 27.2 26.3 29.0Expenditure.Capital and Recurrent Expenditure: 6.5 9.0 9.5 10.8Transport/StateLocal Transport Expenditure: Share of total 44 64 59 60expenditureTransport Capital and Recurrent Expenditure as 1.7 2.3 2.1 2.2percent of GDP
Soiurce: Ministry of Finance.
3.164. It should be noted that the following analysis is based on expenditure informationfrom MOF and is not consistent with information held by MOT. The expenditure figuresfrom MOT are significantly higher than those reported by MOF, indicating the use of
different data formats by the two ministries. In addition not all state transport expenditure,particularly that undertaken by other ministries such as MARD, can be easily identified in thebudget.
3.165. Sutb-sectortal allocationi. Consistent with its stated objectives and strategies forimplementation, the Government has given priority to the relhabilitationi and modernization ofthe country's trunk road network. Roads have received the bulk of transport funding,
accounting for 94 percent of total transport spending in 1998, up from 74 percent in 1994.
Spending on rail infrastructure accounted for about 5 percent of total spending in each of theyears of 1994-1998. The other sub sectors- inland waterways, sea and coast, air, receivedbetween 2 and 3 percent of total transport expenditure. Howcver, this may not show the fullpicture in that some transport SOEs may receive also investment funldig from the bankingsystem, as well as the budget. The extent of any such borrowing is not known.
70
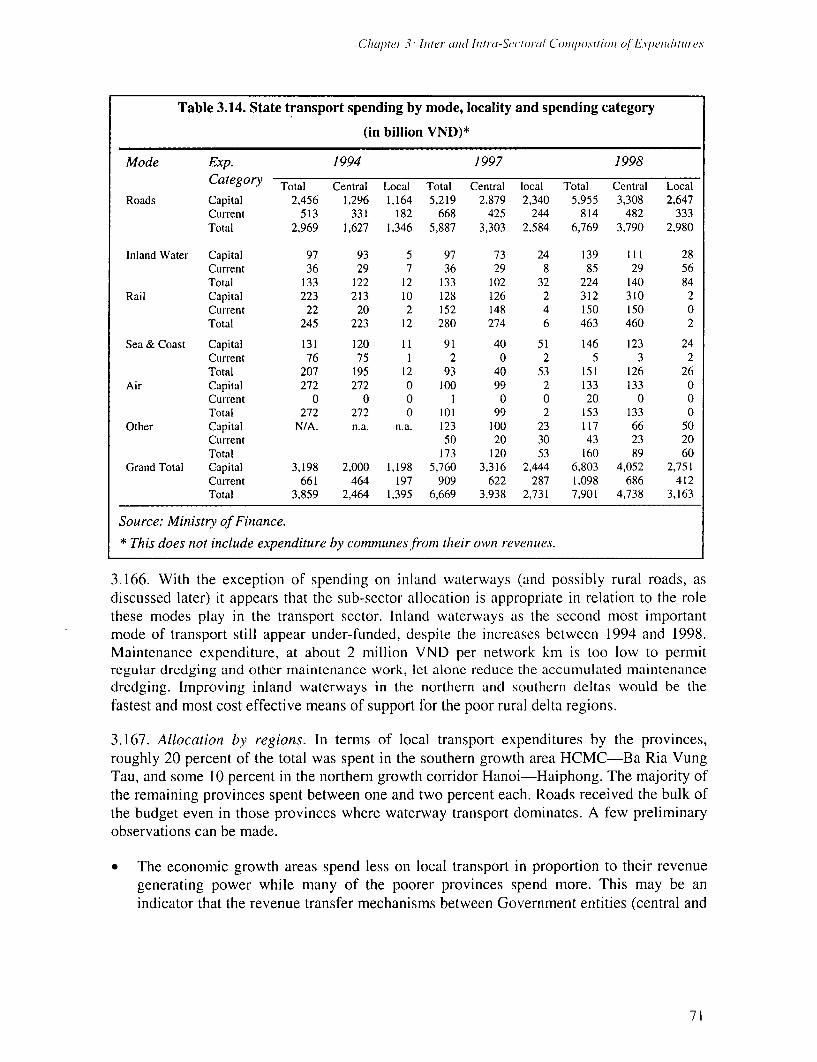
Clhuptei 3 I Inte- and bl,ra-Sectral C'om, positioll ot Ex\/7)lltu/ ts
Table 3.14. State transport spending by mode, locality and spending category
(in billion VND)*
Mode Exp. 1994 1997 1998Category Total Central Local Total Central local Total Central Local
Roads Capital 2,456 1,296 1,164 5,219 2,879 2,340 5,955 3,308 2,647Current 513 331 182 668 425 244 814 482 333Total 2,969 1,627 1,346 5,887 3,303 2,584 6,769 3,790 2,980
Inland Water Capital 97 93 5 97 73 24 139 111 28Current 36 29 7 36 29 8 85 29 56Total 133 122 12 133 102 32 224 140 84
Rail Capital 223 213 10 128 126 2 312 310 2Current 22 20 2 152 148 4 150 150 0Total 245 223 12 280 274 6 463 460 2
Sea & Coast Capital 131 120 11 91 40 51 146 123 24Current 76 75 1 2 0 2 5 3 2Total 207 195 12 93 40 53 151 126 26
Air Capital 272 272 0 100 99 2 133 133 0Current 0 0 0 1 0 0 20 0 0Total 272 272 0 101 99 2 153 133 0
Other Capital N/A. n.a. n.a. 123 100 23 117 66 50Current 50 20 30 43 23 20Total 173 120 53 160 89 60
Grand Total Capital 3,198 2,000 1,198 5,760 3,316 2,444 6,803 4,052 2,751Currenit 661 464 197 909 622 287 1,098 686 412Total 3,859 2,464 1,395 6,669 3,938 2,731 7,901 4,738 3,163
Source: Ministry of Finance.
* This does not include expeniditure by communes from their own reveniues.
3.166. With the exception of spending on inland waterways (and possibly rural roads, asdiscussed later) it appears that the sub-sector allocation is appropriate in relation to the rolethese modes play in the transport sector. Inland waterways as the second most importantmode of transport still appear under-funded, despite the increases between 1994 and 1998.Maintenance expenditure, at about 2 million VND per network km is too low to permitregular dredging and other maintenance work, let alone reduce the accumulatecl maintenancedredging. Improving inland waterways in the northern and southern deltas would be thefastest and most cost effective means of support for the poor rural delta regions.
3.167. Allocationi by regionts. In terms of local transport expenditures by the provinces,roughly 20 percent of the total was spent in the southern growth area HCMC-Ba Ria VungTau, and some 10 percent in the northern growth corridor Hanoi-Haiphong. The majority ofthe remaining provinces spent between one and two percent each. Roads received the bulk ofthe budget even in those provinces where waterway transport dominates. A few preliminaryobservations can be made.
* The economic growth areas spend less on local transport in proportion to their revenuegenerating power while many of the poorer provinces spend more. This may be anindicator that the revenue transfer mechanisms between Government entities (central and
71
V'iet Numi - Pub/li Expe;zditim, e Reul e' 2000: Main Report
provincial) are functioning in that poorer provinces/districts receive funds to undertakehigher spending. However, growth areas also benefited most from central Governmenttransport expenditure in the form of spending on large "A" type projects.
* Second, there is a tendency to distribute funds equitably across "deficit" provinces,reflecting some emphasis on equity as well as econormic growth or efficiency criteria.
Current Expenditure
3.168. Expenditure on roads accounts for about 80 percent of total current expenditure in thetransport sector, and in 1998 was about 482 billion dong (MOF figures). It appears thatperiodic maintenance for national roads covers less than two thirds of the requirement. Thereis lack of information on current expenditure at the local level, but it appears that manydistrict and commune roads are not regularly maintained.
3.169. A number of studies of the Vietnamese road sub-sector have shown that there ispotential for savings of public funds through better cost recovery in the road sector whichwould also increase efficiency. The principle that road users should pay for the use of theroad provided by the state and their maintenance is accepted by the Government and partiallyapplied in the form of tolls charged for the maintenance of specific rehabilitated or newroads. In addition the Government charges a transport fee in the form of a surcharge of 500dong per liter of gasoline, but it is not specifically allocated to road maintenance and does notguarantee the proper maintenance of the road network. The present toll system is inefficient,costly and covers only a small amount of the road network.
3.170. MOT is therefore considering to submit to Government a proposal based on theprinciple that the road user should pay for the maintenance of the road network and have avoice in the administration and use of the funds. The proposed instrument is a levy ongasoline (similar to the one already in place) that would replace the existing tolls and whoseproceeds would flow into a separate road maintenance fund (as is done in the Philippines andis under consideration in Laos), jointly managed by the Government and the representativesof the road users. The fund would be built up gradually so as to minimize economicdislocation. Initially the Governmenit would transfer from the budget to the road fund theresources it now allocates for road maintenance and the road levy wOuld supplement theseresources. In the final stage the road fund would be entirely funded by the levy on road usersand eliminate the need for transfers from the budget. The net impact on consumers andproducers of introducing a road fund should be positive, given the substantial net savings thatare expected from improved road conditions. It has been estimated that the budget requiredfor road maintenance would need to be on the order of US$118-190 million per year ifVietnam's roads were maintained properly.
3.171. There is a range of ways in which such a fund might be structural in terms of whichroads and which costs might be covered, which are set out in the Transport Annex of thisreport. The government should consider this proposal as a way of ensuring future adequatemaintenance of the road network.
72
Chapter 3 - Inite,- eand(i lntra-Se toral Conmposition of E.ypenzditures
Improving the Quality and Management of Transport Infrastructure Projects
3.172. Based on the work for this PER as well other recent work done in the transport sectorin Vietnam, there are a number of ways in which recognized problems in this area may beaddressed.
* Projects should be ranked in order of priority (aided by the economic rate of returncriteria) in the PIP. This implies that Type A projects to be included in the PIP shouldbe well evaluated before being submitted for PIP inclusion. In view of the capacityconstraints, Category B and C projects could be subject to a simplified evaluationmethodology, but there should be a clear rank ordering.
* Line ministries and localities should be given-by MOF and MPI-an estimate of thelikely funding available over a longer period (a desirable period would be five years buta three-year period could be more realistic) which would help these agencies to formulateinvestment programs based on the likely resource constraints.
* All publicly funded projects need to be better coordinated between different governmententities-national, provincial and local-before they are included in the PIP.Coordination of projects between the center and sub-national entities is unsatisfactory atpresent. There also needs to be better horizontal coordination between ministries. Forinstance, MOT has responsibility for all transport planning matters but is rarely consultedon projects of other line ministries (such as a port project or rural roads project).Similarly, district or provincial planning entities are rarely consulted about or concernedwith plans and projects of neighboring local governments.
* Capital and current expenditure planning should be better integrated and be subject tothe same planning cycles. For example, within MOT a five year road maintenanceprogram should be formulated at the same time as its PIP proposals. This would enableMOT planners to take into account the tradeoffs between current and capital expenditureand to avoid the present bias for capital expenditure. This would also assist in ensuringthat projects are not proposed unless adequate operations and maintenance funding islikely to be available. This also needs to be complemented by better coordinationbetween MOF and MPI in the development of the recurrent and development budgets.
* The skills of individuals responsible for the planning and programming process at thecentral and local levels should be upgraded. This requires both increased funding and thedevelopment of training programs. Poorly prepared projects lead to inferior output andultimately to a much higher cost. A fraction of this cost could be spent in upgrading theskills of those who are responsible for project preparation as well as those who selectthem. Finally specific funding allocations are need for project preparation costs.
* Planning and programming should avoid over optimism. Both about stated benefits ofprojects and capacity for implementation. Full account needs to be taken of limitationson absorptive capacity. This requires a change in "mind-set" by officials.
* The project approval process could be streamlined by removing unnecessary layers inthe process. The current project approval process is top heavy and repetitive and different
73
Vieut Na, - Pubhu ELA ,)I,ithi, e R'vuuw 2000 uM,iii Report
funding agencies (including donors) have different requirements. One possible remedy isthat once the PIP is approved line ministries and local entities would be responsible andaccountable for project implementation without the need to pass all projects throughfurther detailed processes of review and approval. Differing funding and review agenciesshould also work together to harmonize their requirements.
MPI slhould conisider expanding its pro gram7? m7lon7itorin1g beyond expenditutre control tomiionitor the efficiency oJ implemiienitationi as wvell as outcomes. The line ministry and thelocal entities should do the same at the project level. This information could be compiledinto a periodic implementation progress report (e.g. annual) which should also flagimplementation issues that might have arisen or possible future risks, and be submitted tothe Prime Minister for review. Moreover, procedures should be developed to ensure thatthe lessons learned are systematically incorporated in ongoing programs/projects andfuture plans. Independent audit of all large projects and a sample of smaller (B and C)projects of the center and localities should also be undertaken.
The Evolving Role of the Private Sector in Transport
3.173. Vietnam is in transition from a command economy to a more market based model andthe public/private mix in the transport sector is still evolving. This has major publicexpenditure implications. On the one hand, divestiture/equitization of public enterprises willresult in an initial reduction in revenue (payments to the budget from SOEs) that is likely tobe replaced by higher tax revenues in the long run. On the other, the sectoral claims on thestate's resources for subsidies and investment capital will also be reducecl. However thecurrent overall budgetary impact of transport SOEs is not known, nor is the potential impactof divestitures.
3.174. There appears to be scope to re-balance the public/private mix in transport to reducethe transport sector's demands on state resources and increase economic efficiency byreducing operating costs, while preserving the role of the state as regulator and guardian ofpublic interests.
3.175. Vietnam's transport sector has undergone significant changes since the move to amore market based economy. For example, in 1998 about 98 percent of the freight, 94percent of passenger road vehicles and 71 percent of inland waterway vessels were operatedby non-state entities. In contrast air, rail and sea transport remain dominated by publicenterprises and private sector participation is negligible.
3.176. This situation is partly a reflection of market realities and partly due to the slowprocess of transformation. After the barriers to private ownership were removed, the privatesector has quickly taken hold in markets with low entr-y barriers such as truck and busoperations in road transport and small vessels in inland waterway transport. While theGovernment has decided to divest the majority of its transport SOEs, only a few have beendivested to date. There are a number of reasons for this slow progress including (i)incomplete or inappropriate legal framework; (ii) lack of experience in the divestitureprocess; (iii) lack of interest and financing capacity in the private sector and (iv) concern
74
Chupter 3 Iltel adl ,,,, Intl(a-Se( t-,alI C 0,n,1,)o.sitlon o/ E en-dli,tlut,, e
about the social consequences of redundancy and lack of social safety nets. Major cities suchas HCMC, Hanoi and Haiphong have been able to divest a number of their enterprises, butlittle progress seems to have been made in the provinces. However it is expected that thedivestiture process will accelerate over the next year as the minister has given it highestpriority. In addition, as discussed in Chapter 1, the Government is about to announce a majorprogram for SOE reform, which will include the transport sector.
3.177. The Government has decided to retain in state ownership, the country's basictransport infrastructure and the related enterprises, which it considers of strategic importance(e.g. ports, airports, sea transport). But at the same time the Government's aim is to improvethe functioning and efficiency of these transport modes. The challenge is to ensure that theprinciple of economic efficiency is applied in the management of transport enterprisesregardless of ownership and industrial organization. This means that the Government couldconsider: (i) expediting the divestiture of non-strategic enterprises; (ii) holding the SOEsremaining in the state sector to the same standards, incentives and disciplines of themarketplace as private sector companies; (iii) ensuring that transport markets are nothampered by restrictive regulations or practices and focussing the role of the Government onestablishing a regulatory framework that fosters efficient markets and fair competitionbetween all market participants.
3.178. If the GOV objective is to exercise overall control of perceived strategic activities-such as sea or air transport, ports and airports-this may be achieved by continuinggovernment ownership, but with some operations contracted out to private interests, whooperate the service on a commercial basis. This would help improve the efficiency of theseactivities. For example provided Vietnam's sea ports are allowed to compete with each other,private operation or BOT type arrangements could be considered by the Government,particularly when considering new investments for port modernization, rehabilitation andexpansion. Examples of this possibility in Vietnam are the small Baria-Serese port complexand the Thuon Dong container port near HCMC. The Government may thus wish togradually involve the private sector in operating and maintaining ports.
3.179. In those SOEs where the Government wishes to retain both ownership and operation,it should consider establishing a performance framework for their operation. This wouldinclude performance targets (financial and service targets), and management autonomy andaccountability in achieving these targets. Payment for any social obligations would benegotiated with the SOE management and paid from the budget.
3.180. Funding requirements for road rehabilitation, modernization and maintenance are aheavy burden on the state budget in Vietnam and only part of these requirements can befunded through the budget. The Government has therefore offered a number of roads to theprivate sector for funding and operation. So far only a few small domestic contractors areinvolved in BOT schemes for small bridges and highway sections, for which they have theright to collect tolls. However foreign enterprises have been reluctant to invest in roadinfrastructure in Vietnam due to low traffic levels and ability of users to pay, lack of anenforceable legal framework and the risks thus involved, high up front costs and the
75
Vict Nani - Public Ependii e Reto iew 200)0) M,Iili Rewpi t
relatively low (risk adjusted) returns to be earned. Only one local/foreign partnership(between a Taiwanese company and the city of HCMC) has materialized so far in the form ofa 17.8 km tolled highway between Tan Thuan Export Processing Zone and highway No. 1.
Future Expenditure Strategy
3.181. In conjunction with the preparation of the 2000-2005 PIP a transport master plan,covering all inter-urban transport, plus separate but related strategies for rural roads andurban transport are being formulated. The master plan addresses the proposed ranking ofmajor projects and sets out a broad strategy for future transport spending over a ten yearperiod. Full cost estimates are incorporated in all these proposed strategies.
3.182. This strategy set out in Box 3.2 is broadly appropriate, but much depends on theavailable level of future funding. It is unrealistic to assume that there can be a substantialincrease in state budget funding for transport and therefore much will need to come fromODA. It is also important that the Government not overcommit itself to, or overestimate itsability to implement a range of large projects.
3.183. Given likely limitation of resources, it is suggested that the Government shouldconsider the following options to maximize use of the limited transport budget.
* Consider an increased role for private operation in the transport sector
* Accelerate the reform of SOEs, including divestiture where appropriate, and develop acommercial performance framework for those SOEs to continue in governmentownership.
* Consider the establishment of a earmarked road fund to provide for user charges in theform of a gasoline levy to fund future road maintenance
* Consider increasing levels of maintenance for inland waterways
* Consider increasing expenditures on the construction and maintenance of rural roads.
* Improve budget and management processes to ensure better quality and management oftransport infrastructure projects.
76
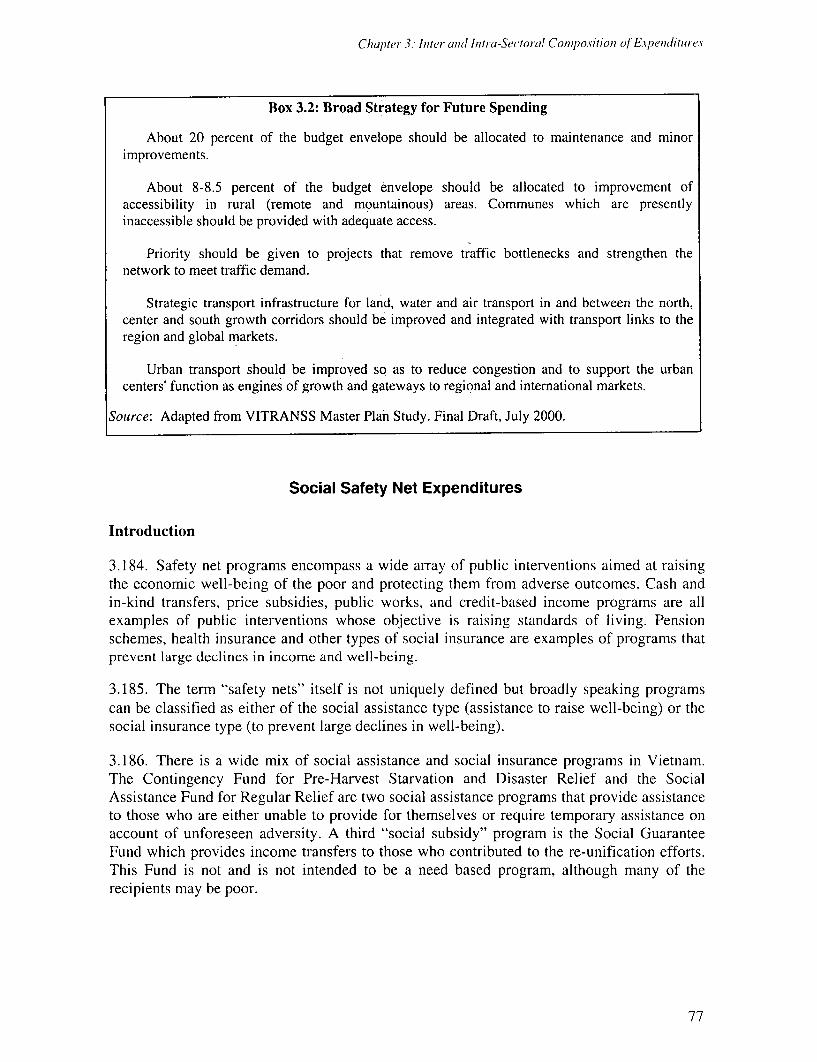
Chapter 3: Inltet uand Intra-Se torul Conmposition of Expendtlitlures
Box 3.2: Broad Strategy for Future Spending
About 20 percent of the budget envelope should be allocated to maintenance and minorimprovements.
About 8-8.5 percent of the budget envelope should be allocated to improvement ofaccessibility in rural (remote and mountainous) areas. Communes which are presentlyinaccessible should be provided with adequate access.
Priority should be given to projects that remove traffic bottlenecks and strengthen thenetwork to meet traffic demand.
Strategic transport infrastructure for land, water and air transport in and between the north,center and south growth corridors should be improved and integrated with transport links to theregion and global markets.
Urban transport should be improved so as to reduce congestion and to support the urbancenters' function as engines of growth and gateways to regional and international markets.
Source: Adapted from VITRANSS Master Plan Study. Final Draft, July 2000.
Social Safety Net Expenditures
Introduction
3.184. Safety net programs encompass a wide array of public interventions aimed at raisingthe economic well-being of the poor and protecting them from adverse outcomes. Cash andin-kind transfers, price subsidies, public works, and credit-based income programs are allexamples of public interventions whose objective is raising standards of living. Pensionschemes, health insurance and other types of social insurance are examples of programs thatprevent large declines in income and well-being.
3.185. The term "safety nets" itself is not uniquely defined but broadly speaking programscan be classified as either of the social assistance type (assistance to raise well-being) or thesocial insurance type (to prevent large declines in well-being).
3.186. There is a wide mix of social assistance and social insurance programs in Vietnam.The Contingency Fund for Pre-Harvest Starvation and Disaster Relief and the SocialAssistance Fund for Regular Relief are two social assistance programs that provide assistanceto those who are either unable to provide for themselves or require temporary assistance onaccount of unforeseen adversity. A third "social subsidy" program is the Social GuaranteeFund which provides income transfers to those who contributed to the re-unification efforts.This Fund is not and is not intended to be a need based program, although many of therecipients may be poor.
77
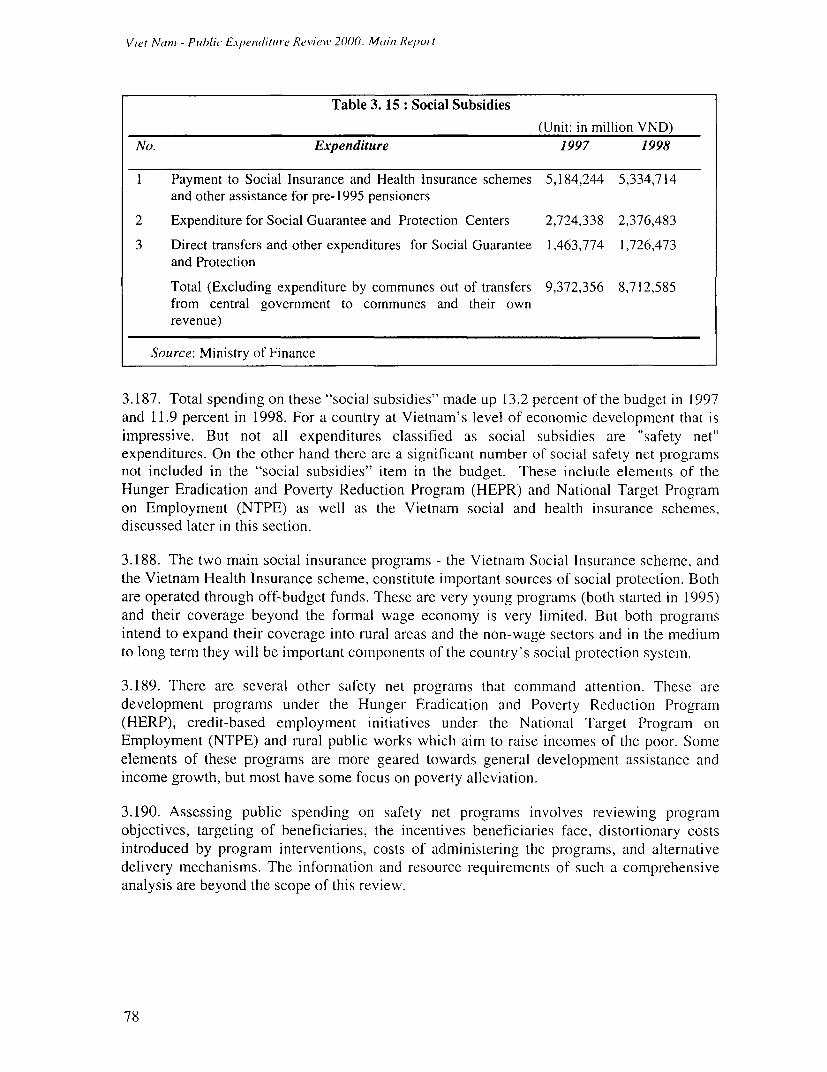
Viet Nani - Public Exp,enditulre Review 2000. Main Report
Table 3. 15: Social Subsidies
(Unit: in million VND)No. Expenditure 1997 1998
1 Payment to Social Insurance and Health Insurance schemes 5,184,244 5,334,714and other assistance for pre-1995 pensioners
2 Expenditure for Social Guarantee and Protection Centers 2,724,338 2,376,483
3 Direct transfers and other expenditures for Social Guarantee 1,463,774 1,726,473and Protection
Total (Excluding expenditure by communes out of transfers 9,372,356 8,712,585from central government to communes and their ownrevenue)
Source: Ministry of Finance
3.187. Total spending on these "social subsidies" made up 13.2 percent of the budget in 1997and 11.9 percent in 1998. For a country at Vietnam's level of economic development that isimpressive. But not all expenditures classified as social subsidies are "safety net"expenditures. On the other hand there are a significant number of social safety net programsnot included in the "social subsidies" item in the budget. These include elements of theHunger Eradication and Poverty Reduction Program (HEPR) and National Target Programon Employment (NTPE) as well as the Vietnam social and health insurance schemes,discussed later in this section.
3.188. The two main social insurance programs - the Vietnam Social Insurance scheme, andthe Vietnam Health Insurance scheme, constitute important sources of social protection. Bothare operated through off-budget funds. These are very young programs (both started in 1995)and their coverage beyond the formal wage economy is very limited. But both programsintend to expand their coverage into rural areas and the non-wage sectors and in the mediumto long term they will be important components of the country's social protection system.
3.189. There are several other safety net programs that command attention . These aredevelopment programs under the Hunger Eradication and Poverty Reduction Program
(HERP), credit-based employment initiatives under the National Target Program onEmployment (NTPE) and rural public works which aim to raise incomes of the poor. Someelements of these programs are more geared towards general development assistance andincome growth, but most have some focus on poverty alleviation.
3.190. Assessing public spending on safety net programs involves reviewing programobjectives, targeting of beneficiaries, the incentives beneficiaries face, distortionary costsintroduced by program interventions, costs of administering the programs, and alternativedelivery mechanisms. The information and resource requirements of such a comprehensiveanalysis are beyond the scope of this review.
78
Chupter 3: lInter and Intra-Sectoral Composition of Expenditures
3.191. This section identifies a range of social safety net programs in Vietnam, which arediscussed in more detail below. However it has not been possible because of limitations inthe expenditure classification systems to obtain expenditure figures on all these programs,and thus to make an assessment of Vietnam's expenditure on social safety nets.
Social Protection Fund for Regular Relief
3.192. This is a mix of regular and temporary social assistance transfers, funded by thecentral government with additional funds provided by local authorities. Regular monthlybenefits are provided to three groups of beneficiaries who are considered to be unable toassist themselves. These are the elderly who are poor and live alone and have no other sourceof support, orphan, and civilians who are disabled. A subset of these beneficiaries is alsoplaced in Social Protection Centers. Temporary benefits are provided to a small set ofhomeless people. Beyond these two types of benefits, the Fund also provides assistance torehabilitation programs dealing with the "social evils" of drug abuse, prostitution, andHIV/AIDs, and some other types of supplementary assistance for schooling expenses andhealth care.
3.193. The elderly and disabled groups together account for around three quarters of allbeneficiaries, with orphans accounting for another 24 percent. The elderly are most likely toreceive assistance, but it is worth noting that the number of elderly receiving assistance makeup only about 1 percent of the elderly in Vietnam; for the vast of the elderly majority theextended family is the main source of support. At the same time, the lower benefit grant rate(the percent of those eligible who receive benefits) for the disabled reflects the fact that alarge proportion of them receive assistance from the Social Guarantee Fund.
3.194. As the primary (regular) component of the official safety net programs, the SocialProtection Fund for Regular Relief is extremely limited, both in its coverage and in the sizeof individual payments. Average transfers are barely adequate to meet basic food needs, andin 1998 only 20 percent of the eligible population was covered by the Fund". This representsonly about 0.2 percent of the total population. At the same time the number of beneficiarieshas grown by 41 percent in 3 years. Available data do not permit any assessment of the extentto which ineligible beneficiaries receive payments, although this may occur in better offprovinces. However, there is considerable variation in payments across communes andprovinces. Some wealthier communes may also pay higher benefits. But all communes mustmeet the minimum standards set by the government.
3.195. As the recently completed study on safety nets by ILO concludes, "In effect, theSocial Protection Fund for Regular Relief is in a state of dynamic tension over beneficiarynumbers. Government policy appears to be to keep numbers at low levels. However, thecommunes keep identifying large numbers of people who appear to be eligible for benefitsunder the existing criteria laid down by the government" (p. 56). In response to this thegovernment has tried to limit the number of beneficiaries by clarifying criteria, providing
18 "Statistics on Social Safety Nets in Vietnam"-Labor and Social Affairs Publishing House, November 1999.
79
Iliet Nani - Pub/li Expendlture R?ei'ie, 2000 Maini Report
guidelines for prioritizing, and fixing financial allocations. At the same time, though,increasing pressure from the communes and improved financial conditions have permittedgreater allocations to the Fund.
3.196. It appears that there is a need for a specialized agency, or specialized personnel toadminister the fund and evaluate its performance. At the current level of funding, however,the higher administrative costs would probably not be justifiable.
Contingency Fund for Pre-Harvest Starvation and Disaster Relief
3.197. This is the primary safety net program which covers the majority of the population. Ithas two components, covering natural disasters and "pre-harvest starvation".
3.198. Natural disasters, such as floods, typhoons, droughts, etc. are fairly frequentoccurrences in Viet Nam. The Contingency Fund aims to mitigate some of the hardshipcaused by these periodic natural disasters, by compensating family members for the loss oflife and property. Each disaster-related death is compensated by a payment of I millionDong. With property damage there is partial compensation based on damage assessmentsundertaken by local authorities, but subject to availability of funds. Compensation for othertypes of losses due to flood damage to land and crops is less likely, though concessionaldevelopment loans might be made available through other sources.
3.199. Obviously, total expenditures on disaster relief vary with the extent of disasters. Forexample, in 1996, total expenditures were 71, 270 million Dong, but in 1997 and 1998 theywere more than 5 times as much at 400, 000 million and 364, 910 million Dong respectively.Much of this expenditure is from the state budget.
3.200. The "pre-harvest starvation" element of the Contingency Fund mainly covers grantsto families at risk of starvation in the pre-harvest period, though it also covers some food aidgiven to poor families for the Tet festival. About one half of all who seek assistance for thiselement of the program are granted assistance. The amount of assistance varies from onecommune (and province) to another, but the average level of the grant seems to be around50,000 Dong. The low coverage of the "pre-harvest starvation" element and the very smallamount of assistance limit the ability of the program to provide meaningful protection to therural population.
3.201. Other than administrative convenience, it is not clear why these two quite differentaspects of income variability are addressed in the same program. A separation would assist tofurther development of specialized administrative capacity, since (disaster) damageassessment is quite different from the targeting and beneficiary-needs skill requirements ofmore typical social assistance programs.
80
Chapter . Inltei anid hrua-Sectoryl Composition of Expendial te.s
Development Assistance Programs under HEPR
3.202. The Hunger Eradication and Poverty Reduction Program encompasses a range ofpolicy and program initiatives aimed at reducing poverty and increasing incomes. There arenine program components:
* construction of basic commune infrastructure
* promotion of agricultural and off-farm production and employment
* credit for the poor
* health care for the poor
* education for the poor
* extension services for agro-forestry and fishing
* training of HEPR staff
* sedenterization, (re-settlement) internal migration, and new economic zones* assistance to ethnic minorities
3.203. The Ministries of Education, Health, Agriculture, and Labor and Social Welfare, areinvolved in this effort as are other organizations such as the Vietnam Bank for Agricultureand Rural Development, Vietnam Bank for the Poor, Vietnam Women's Union, and theCommittee for the Ethnic Minority and Mountainous Areas.
3.204. The focus of the HEPR program is poverty eradication, and in a sense all programcomponents contribute towards this goal. Some of these components, however, are morcgeneralized development initiatives which, while certainly helping the poor, may not alwaysviewed as part of safety net programs. For example, non-targeted agricultural services(promotion and extension), environmental efforts aimed at re-greening mountainous areas,land allocation policy, and prevention of drug abuse all have a broader development focus.But it can be argued that as they aim to prevent people falling into poverty they areappropriately part of social safety nets. On the other hand, the more targeted HEPR programs,such as subsidized credit, fee exemptions for cducation and health are clear candidates forinclusion in the safety net category. In a similar vein employment oriented programs thatmitigate the effects of restructuring of state owned enterprises or create employment viapublic works also form part of the government's effort to provide protection to those withinadequate incomes and those who are most likely to suffer downturns in income.
3.205. One of the major component of the HEPR has been provision of collateral-free,subsidized loans to the poor for income-generating activities. Implementation at thecommune level, by People's Committee officials, permits closer monitoring of activities.However, there are concerns about the adequacy of targeting of the poor, and the long termsustainability of the income-generating activities for which funds are borrowed. GSO datasuggest that only 20 percent of all loans from the Vietnam Bank for the Poor were allocatedto the poorest 40 percent of households, while the better off 40 percent of householdsreceived 30 percent of all loans. Female-headed households were also less likely to receive
81
Viet Nuan - Putblit Expenditllure Review 2000 -Maini Report
loans. There appears to be excessive reliance on credit-based programs, without due attentionto skills training and other technical assistance. Recent studies suggest that the efficacy of thecredit-based approach needs to be evaluated.
National Target Program on Employment'9
3.206. The National Target Program on Employment (NTPE) is a key component of thegovernment's effort at increasing employment during the transition to a market economy.Initiated in 1998, the program aims, in the short term, to create 1.3 to 1.4 million jobsannually, reduce urban unemployment from 6 percent to 5 percent (by the year 2000), andreduce rural underemployment from 30 percent to 25 percent.
3.207. This is a general employment-oriented program financed by the National Fund forEmployment Promotion (NFEP) and it works primarily by providing subsidized credit forself-employment in small scale enterprises such as handicrafts and agro-processing. Theprogram also supports Centres for Employment Service which provide skill training to jobseekers, and serve as bases for matching them with potential employers.
3.208. Roughly two-thirds of the funds from NFEP are allocated to rural areas, and to theextent that animal husbandry activities and small scale handicrafts account for two-thirds oftotal allocations, the program probably benefits women more than men, because women tendto more involved in these activities.
3.209. The NTPE's role as a safety net for the poorest is limited because credit provision isbased on viable proposals, on the borrowers being credit worthy and on seed money from theborrower (almost equal to the borrowed sum). At the same time, the fact that there ispreferential lending to women, the poorest groups, and the unemployed - provided theproject proposal demonstrates employment creation potential -makes it reasonable to includethis program in the safety net category. But it would be worth focussing greater attention inthe NTPE on skill training, and this could be more targeted to poor households and women.
Social Insurance
3.210. The two main social insurance programs in Vietnam are the Vietnam Social Insurance(VSI) scheme and the Vietnam Health Insurance (VHI) scheme. These are relatively newprograms, though VIS builds on an earlier social security scheme that covered stateemployees and the armed forces. Current coverage of both programs is largely restricted tothe formal wage-income sector, though efforts are underway to extend them to the muchlarger self-employed sector. In addition to these two programs, there are other small-scalepension and insurance schemes that operate at the commune level. Since the focus of thisreport is more on social assistance and less on social insurance, attention is restricted to thetwo main insurance programs.
'9 This section draws heavily on the recently completed ILO study on labor markets and National Target Programon Employment and the Hunger Eradication and Poverty Reduction Program (ILO, 2000).
82
Chapter 3: Initer uand( In1ti a-Sec toial Conmposition oqfExpenditures
3.211. Vietnam Social Insurance Sclheme. (VSI) A new self-financing social insurancesystem was established in Vietnam in 1995. It covers the civil service, armed forces,employees of state institutions and SOEs, Vietnamese staff in joint ventures and employees innon-state enterprises with 10 or more workers.20 In 1998, there were 3.2 million contributorsto the new scheme, and according to MoLISA these make up roughly 14 percent of the laborforce.
3.212. The scheme covers sickness, maternity, employment injury, retirement, andsurvivorship. A brief summary of the coverage provided is as follows:
* Sickness benefits, equal to 75 percent of insurable earnings and ranging from 30-60 daysa year depending on type of occupation and length of insurance.
* Maternity benefits, for 4-6 months based on 100 percent of insurable earnings.
* Employment injury and occupational disease benefits based on minimum wages, withbenefits up to 1.6 months, along with death and funeral benefits where appropriate.
* Retirement pensions are paid at the rate of 45 percent of average earnings for 15 years,thereafter rising at the rate of 2 percent up to a maximum of 75 percent, subject tocontributions having been paid for at least 20 years. The pensionable age for at least 20years women is 55 as against 60 for men.
3.213. Employers pay 15 percent of basic salaries, of which 10 percent is allocated topension insurance and 5 percent to sickness, maternity, and employment injury benefits.Employees contribute 5 percent which goes towards pension insurance.
3.214. The scheme is a small beginning in the government's objective of providingcomprehensive social security protection for the entire population. In the past few yearsconsiderable technical assistance has been provided to assist MoLISA in developing a SocialSecurity Act, which would set out a more comprehensive system of coverage. This work isscheduled to be finalized in 2000.
3.215. Vietnamz Health Insurance schenme (VHI ). Health insurance is a relatively recentphenomena, having begun in 1993, but it has grown rapidly since its inception. (This issue isalso discussed in the section of this chapter covering health expenditures).
3.216. There are two components to the Vietnam Health Insurance program: (a) acompulsory scheme that covers current and retired civil service personnel, and employees oflarge state and private enterprises, and (b) a voluntary scheme that seeks to cover the rest ofthe population. Premiums for the compulsory scheme are based on a 3 percent payroll tax(employers 2 percent, and employees 1 percent). Premiums for the voluntary scheme arefixed annually, but vary by province and type of coverage chosen.
20 This new scheme builds on the earlier scheme, which covered only State (governinent staff and SOEpersonnel) employees, and Armed Force personnel, but was an extension of the State employment systeni andhad to rely on the budget to meet deficits; the state is still responsible for pensions arising before 1995.
83
Viet Nain - Pi,blu, Expenditure Reviewi' 2000. Mii, Report
3.217. The VHI is administered by the Vietnam Health Insurance Authority (VHIA), withprovincial health insurance offices recently brought under the control of the VHIA. Facilitiesare paid on a fee-for-service basis and until recently services at only public facilities werecovered by the plans. A natural outcome of insurance is that there are inceintives for bothusers and providers to increase service provision. Indeed since its inception, utilization ratesof the insured have been too high in relation to the revenues of the VHIA and have threatenedthe financial viability of the program. As a result some remedial measures have been includedto restrain payments
3.218. Given the importance of health expenses in household budgets there is little doubt thata wider definition of social protection requires assessing how unexpected health expenses aremet by households. The inception of the health insurance package in the past decade attests tothe recognition, in Vietnam, that society-wide provision of health insurance is necessary. Thereal questions are, therefore, how this is to be achieved, how the system's financial viabilityis to be maintained, and how the twin (insurance) issues of moral hazard and adverseselection are handled.
3.219. Compulsory coverage has expanded rapidly and already covers roughly three fourthsof its target population. The real challenge is extending voluntary coverage, especially inrural areas, where agricultural activities are largely of a self-employed nature. The currentinequity in coverage of the poor and rich stems largely from the nature of income-earningactivities and the rural-urban locational difference. As the system addresses its existingfinancial viability problems (arising from over-prescription and over-utilization), it is likelyto gradually develop the financial capacity and the technical and administrative skills toextend voluntary coverage to rural areas.
Conclusions
3.220. In a country with 30 to 40 percent poverty, the need for public provision of socialprotection is self-evident. Providing safety net programs that serve a redistributive roledirectly addresses humanitarian concerns about poverty and deprivation. In addition toequity, there are efficiency considerations. Programs that help the poor weather incomeshocks prevent asset decumulation, and promote more widely dispersed growth. The role ofthe state in this area is, therefore, quite clear. The real questions are those concerning thechoice of programs, the extent of coverage, and the degree of assistance provided by the state.
3.221. Vietnam's approach to safety nets considers that responsibility for poverty alleviationlies not just with the government, but also with the community, and the poor themselves. As aresult much of the development effort relies on commune-delivered credit, and safety nets areessentially minimalist transfers to those who are really destitute and vulnerable. The effort atpromoting self-help, and avoiding welfare dependency is clear.
84
Chuprte 3 Initel and(i Init; ai-Sectoral Composition of Expendltull es
A Menu of Reform Options
3.222. As discussed above the coverage of the main social assistance programs is low andthe amounts provided are low as well. Existing evidence suggest that these assistanceprograms are not reaching the poor very effectively.
3.223. A final observation concerns the existing system of beneficiary identification andassistance delivery. Commune-level identification of potential beneficiaries and delivery ofassistance does make for better use of information, but it has limitations. There is some cross-commune inconsistency in the way in which beneficiaries are identified, and there tend to belarge differences in the amount of the assistance itself between different communes. Chaangesin program adininistration that nmaintain comniunie-level identification and assistance-delivery but also ensure transmission of information up to the province and central level areworth considering.
85


Available from:Vietnam Development Information Center63 Ly Thai To Street, Hanoi, VietnamTel: (84-4) 9346845 Fax: (84-4) 9346847Website: www.vdic.org.vn


![[Webinar] managing your contacts better](https://img.pdfslide.us/doc/110x75/5554dc4eb4c9051b6e8b50f1/webinar-managing-your-contacts-better.jpg)