Embed Size (px)
Citation preview

Planning and Managing Projects with
Microsoft Project 2013
A UMT Institute Class

Planning and Managing Projects with Microsoft Project Professional 2013 Exercises
© UMT Institute Page 2 of 109
Planning and Managing Projects with Microsoft Project Professional 2013 Exercises
© UMT Institute Page 3 of 109
Table of Contents
Table of Contents ...................................................................................................................................................................................................... 3
Introduction ............................................................................................................................................................................................................... 5
Setup .......................................................................................................................................................................................................................... 6
Defining Deliverables and Tasks ............................................................................................................................................................................ 11 Exercise 1 Customizing the Quick Access Toolbar ............................................................................................................................................ 11 Exercise 2 Creating a New Project .................................................................................................................................................................... 12 Exercise 3 Entering Tasks ................................................................................................................................................................................. 13 Exercise 4 Entering Summary Tasks ................................................................................................................................................................. 14 Exercise 5 Entering Milestones ......................................................................................................................................................................... 15 Exercise 6 Entering Recurring Tasks ................................................................................................................................................................. 16 Exercise 7 Entering Overhead Tasks ................................................................................................................................................................ 17 Exercise 8 Inactivate Tasks ............................................................................................................................................................................... 18 Exercise 9 Deleting Tasks ................................................................................................................................................................................. 19
Entering Estimates .................................................................................................................................................................................................. 20 Exercise 10 Estimating Durations ........................................................................................................................................................................ 20 Exercise 11 Using Estimated Durations ............................................................................................................................................................... 22 Exercise 12 Using Interval Estimates .................................................................................................................................................................. 23 Exercise 13 Entering Contingency Tasks ............................................................................................................................................................ 24 Exercise 14 Entering Work .................................................................................................................................................................................. 25 Exercise 15 Entering Assumptions ...................................................................................................................................................................... 27 Exercise 16 Entering Task Cost .......................................................................................................................................................................... 28
Creating Dependencies ........................................................................................................................................................................................... 29 Exercise 17 Creating Dependencies.................................................................................................................................................................... 29 Exercise 18 Entering Multiple Dependencies ....................................................................................................................................................... 30 Exercise 19 Adding Lead and Lag to Dependencies ........................................................................................................................................... 31 Exercise 20 Managing Dependency Types.......................................................................................................................................................... 32 Exercise 21 Reviewing Successors ..................................................................................................................................................................... 33 Exercise 22 Using the Task Inspector ................................................................................................................................................................. 34 Exercise 23 Viewing the Project as a Network Diagram ...................................................................................................................................... 36
Setting Up and Assigning Resources .................................................................................................................................................................... 37 Exercise 24 Setting Up Resources ...................................................................................................................................................................... 37 Exercise 25 Creating Calendars .......................................................................................................................................................................... 39
Planning and Managing Projects with Microsoft Project Professional 2013 Exercises
© UMT Institute Page 4 of 109
Exercise 26 Applying a Calendar to Resources ................................................................................................................................................... 40 Exercise 27 Changing Resource Calendars ........................................................................................................................................................ 41 Exercise 28 Applying a Calendar to Projects ....................................................................................................................................................... 42 Exercise 29 Applying a Calendar to Tasks .......................................................................................................................................................... 43 Exercise 30 Assigning Resources ....................................................................................................................................................................... 44 Exercise 31 Budgeting Cost ................................................................................................................................................................................ 48 Exercise 32 Managing Task Types ...................................................................................................................................................................... 50 Exercise 33 Managing Effort Driven Tasks .......................................................................................................................................................... 52
Optimizing the Schedule ......................................................................................................................................................................................... 53 Exercise 34 Identifying the Critical Path .............................................................................................................................................................. 53 Exercise 35 Reducing the Project Duration ......................................................................................................................................................... 54 Exercise 36 Entering Deadlines ........................................................................................................................................................................... 57 Exercise 37 Entering Constraints ........................................................................................................................................................................ 58 Exercise 38 Identifying Resource Overallocations ............................................................................................................................................... 59 Exercise 39 Leveling the Workload...................................................................................................................................................................... 61 Exercise 40 Using Work Contours ....................................................................................................................................................................... 66
Updating the Schedule ............................................................................................................................................................................................ 67 Exercise 41 Setting the Baseline ......................................................................................................................................................................... 67 Exercise 42 Updating the Schedule ..................................................................................................................................................................... 69 Exercise 43 Rescheduling Uncompleted Work .................................................................................................................................................... 76 Exercise 44 Analyzing Variance .......................................................................................................................................................................... 78
Reporting ................................................................................................................................................................................................................. 81 Exercise 45 Sorting, Filtering, and Grouping ....................................................................................................................................................... 81 Exercise 46 Formatting........................................................................................................................................................................................ 84 Exercise 47 Customizing Views ........................................................................................................................................................................... 86 Exercise 48 Printing and Exporting ...................................................................................................................................................................... 92
Consolidating Projects .......................................................................................................................................................................................... 102 Exercise 49 Creating a Resource Pool .............................................................................................................................................................. 102 Exercise 50 Creating a Master Plan .................................................................................................................................................................. 106 Exercise 51 Creating Links between Projects .................................................................................................................................................... 108
Planning and Managing Projects with Microsoft Project Professional 2013 Exercises
© UMT Institute Page 5 of 109
Introduction
This document steps you through a series of exercises guiding you in the creation of a project plan using Microsoft Project Professional 2013. The purpose of these exercises is to prepare you for Microsoft Exam 74-343: Microsoft Project 2013, Managing Projects. After passing this exam, you
will be a Microsoft Certified Technology Specialist (MCTS): Managing Projects with Microsoft Project 2013. As you are working through the exercises, you will learn how to:
Define deliverables and tasks
Enter estimates
Create dependencies
Set up and assign resources
Optimize the schedule
Update the schedule
Report
Consolidate projects Across all exercises you will find bold or italic text. Bold text refers to the name of a command, dialog box, or window, whereas italic text refers to text or numbers that need to be entered. You will note that the exercises start with instructions that tell you exactly where to click on the screen. This will help you get used to navigating Microsoft Project Professional 2013. After a number of exercises, the instructions will be more descriptive, for example in an earlier exercise you will read “Click on the File tab in the upper left hand corner of the screen” whereas in a later exercise you will read “Go to the Backstage”. Both instructions are the same and in this example it assumes that you have learned during the earlier exercise what the Backstage is and how to find it. Also note that each exercise is built on the previous one and deviation from the instructions may create results that will not match the associated screenshots. However, each exercise is accompanied by an exercise file that can be used as a reference or as a starting point for the next exercise. For best results, open the exercise file of the matching exercise number to work on the exercises. In case you choose your own file, make sure to save your work after each exercise and after each day. If you are connected to Microsoft Project Server 2013 during training, make sure to click on “Save as File” in the “Save to Project Server” dialog box, in order to save your file to your computer. Last, but not least, if you are using an electronic copy of this document, you may want to display the document’s window and Microsoft Project’s window side by side, such that you can read the instructions and have Microsoft Project’s window overlap the screenshots. In this scenario, you would only look at the screenshots if necessary. Enjoy this UMT Institute class!
Planning and Managing Projects with Microsoft Project Professional 2013 Exercises
© UMT Institute Page 6 of 109
Setup
Setup File tab
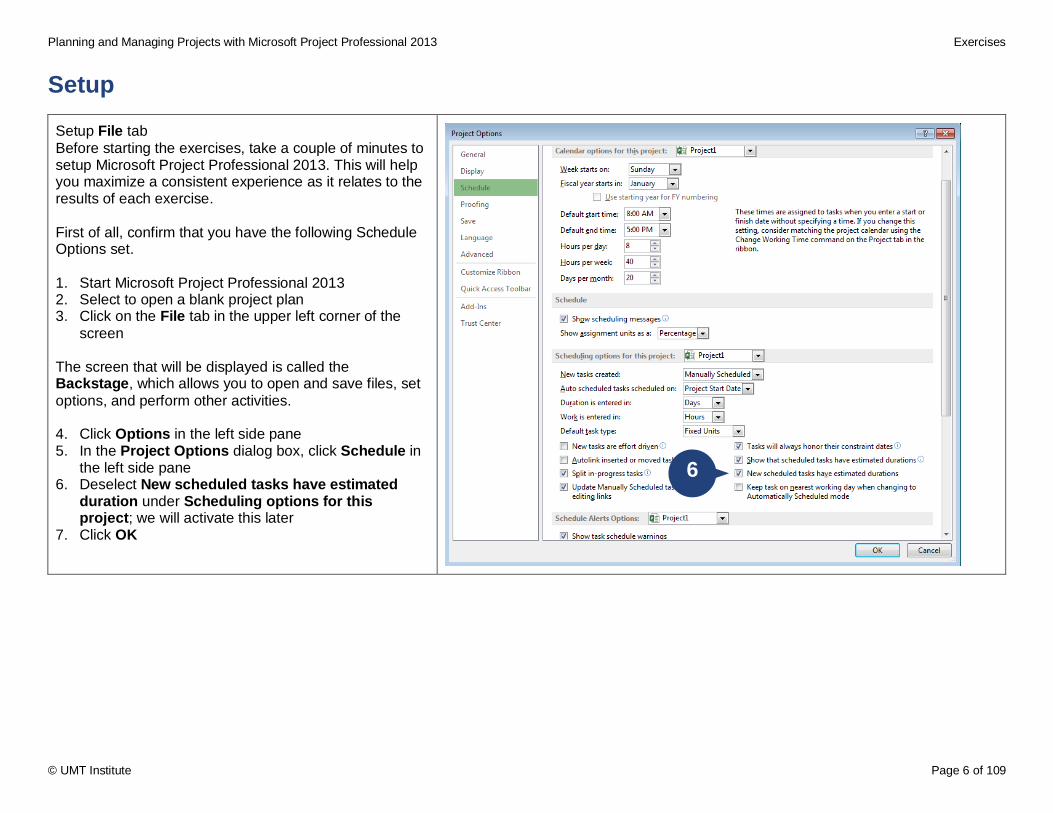
Before starting the exercises, take a couple of minutes to setup Microsoft Project Professional 2013. This will help you maximize a consistent experience as it relates to the results of each exercise. First of all, confirm that you have the following Schedule Options set. 1. Start Microsoft Project Professional 2013 2. Select to open a blank project plan 3. Click on the File tab in the upper left corner of the
screen The screen that will be displayed is called the Backstage, which allows you to open and save files, set
options, and perform other activities. 4. Click Options in the left side pane 5. In the Project Options dialog box, click Schedule in
the left side pane 6. Deselect New scheduled tasks have estimated
duration under Scheduling options for this project; we will activate this later
7. Click OK
6
Planning and Managing Projects with Microsoft Project Professional 2013 Exercises
© UMT Institute Page 7 of 109
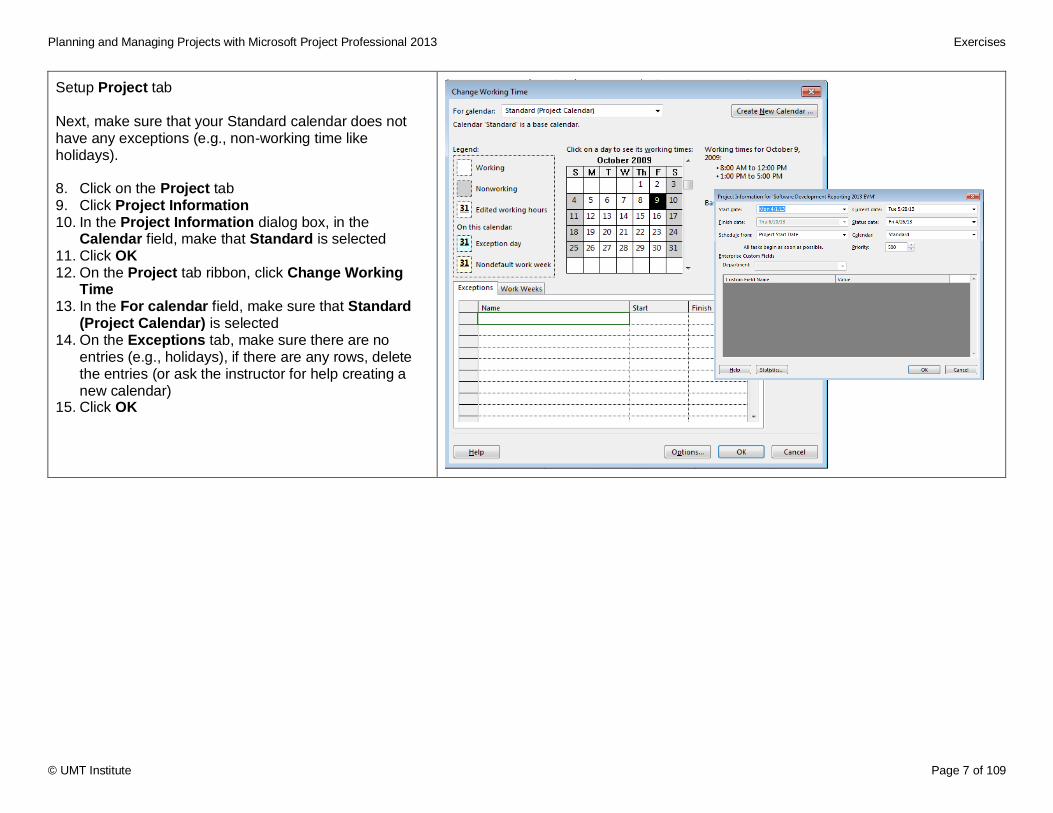
Setup Project tab
Next, make sure that your Standard calendar does not have any exceptions (e.g., non-working time like holidays). 8. Click on the Project tab 9. Click Project Information 10. In the Project Information dialog box, in the
Calendar field, make that Standard is selected 11. Click OK 12. On the Project tab ribbon, click Change Working
Time 13. In the For calendar field, make sure that Standard
(Project Calendar) is selected 14. On the Exceptions tab, make sure there are no
entries (e.g., holidays), if there are any rows, delete the entries (or ask the instructor for help creating a new calendar)
15. Click OK
Planning and Managing Projects with Microsoft Project Professional 2013 Exercises
© UMT Institute Page 8 of 109
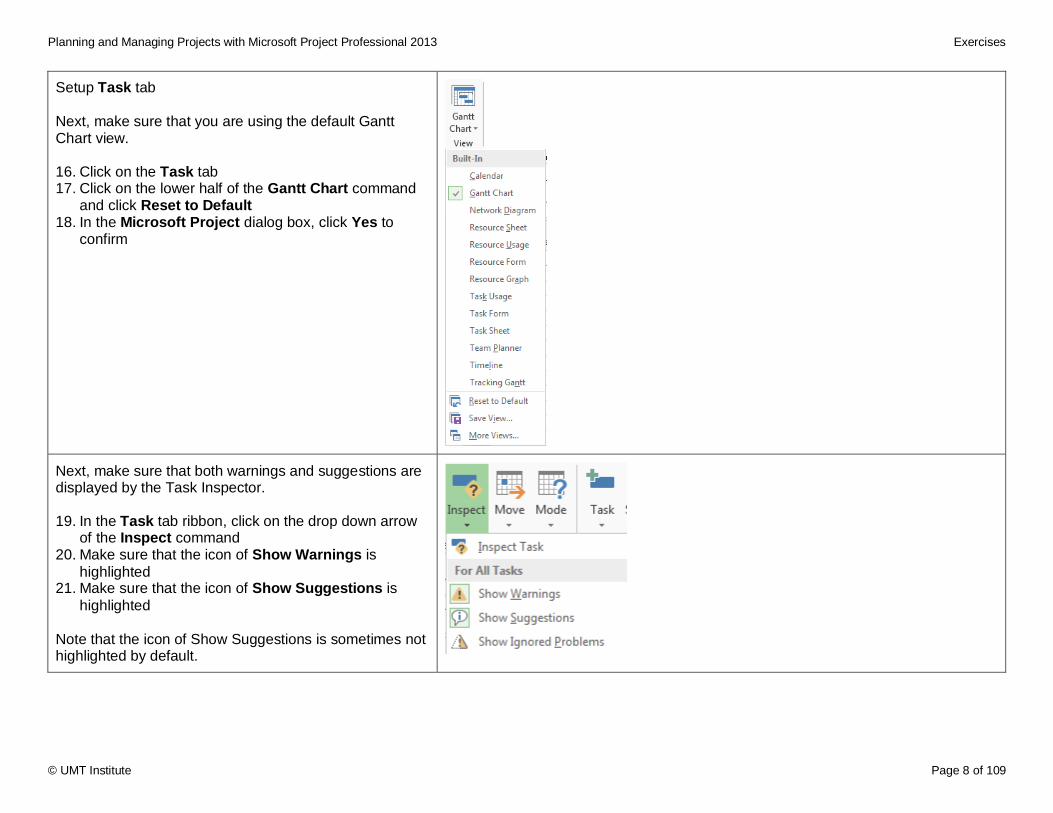
Setup Task tab
Next, make sure that you are using the default Gantt Chart view. 16. Click on the Task tab 17. Click on the lower half of the Gantt Chart command
and click Reset to Default 18. In the Microsoft Project dialog box, click Yes to
confirm
Next, make sure that both warnings and suggestions are displayed by the Task Inspector. 19. In the Task tab ribbon, click on the drop down arrow
of the Inspect command 20. Make sure that the icon of Show Warnings is
highlighted 21. Make sure that the icon of Show Suggestions is
highlighted Note that the icon of Show Suggestions is sometimes not highlighted by default.
Planning and Managing Projects with Microsoft Project Professional 2013 Exercises
© UMT Institute Page 9 of 109
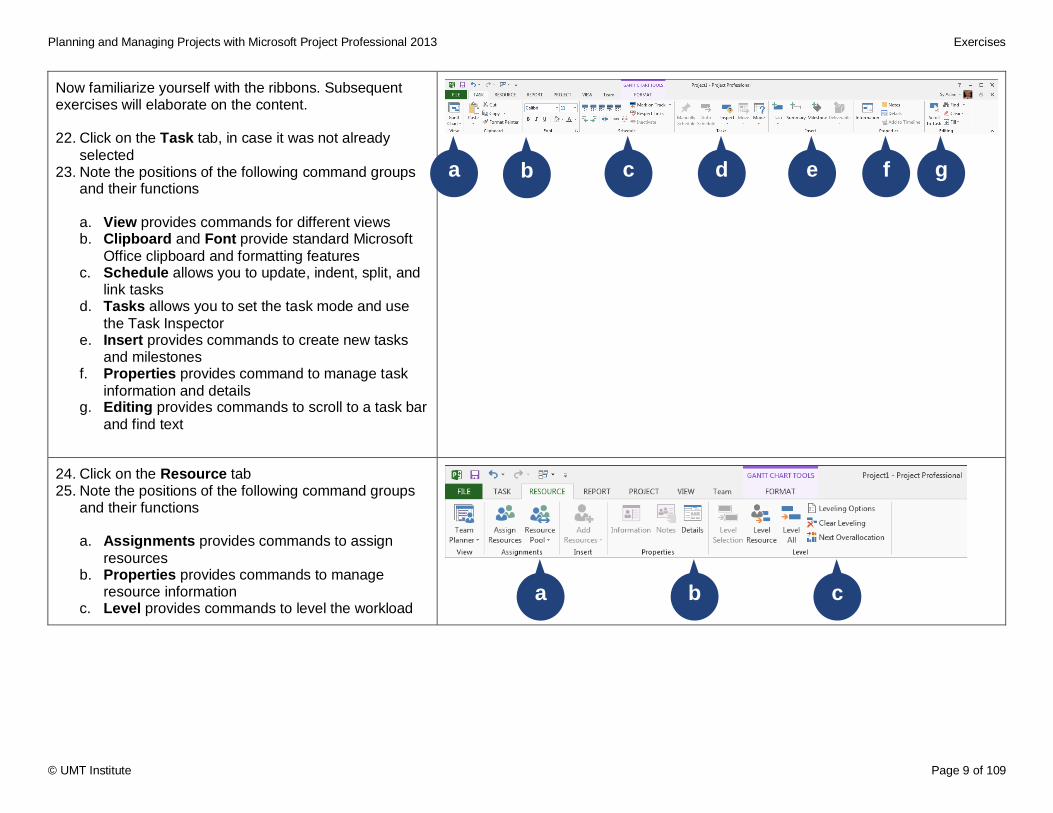
Now familiarize yourself with the ribbons. Subsequent exercises will elaborate on the content. 22. Click on the Task tab, in case it was not already
selected 23. Note the positions of the following command groups
and their functions
a. View provides commands for different views b. Clipboard and Font provide standard Microsoft
Office clipboard and formatting features c. Schedule allows you to update, indent, split, and
link tasks d. Tasks allows you to set the task mode and use
the Task Inspector e. Insert provides commands to create new tasks
and milestones f. Properties provides command to manage task
information and details g. Editing provides commands to scroll to a task bar
and find text
24. Click on the Resource tab 25. Note the positions of the following command groups
and their functions
a. Assignments provides commands to assign
resources b. Properties provides commands to manage
resource information c. Level provides commands to level the workload
a b c d e f g
a b c
Planning and Managing Projects with Microsoft Project Professional 2013 Exercises
© UMT Institute Page 10 of 109
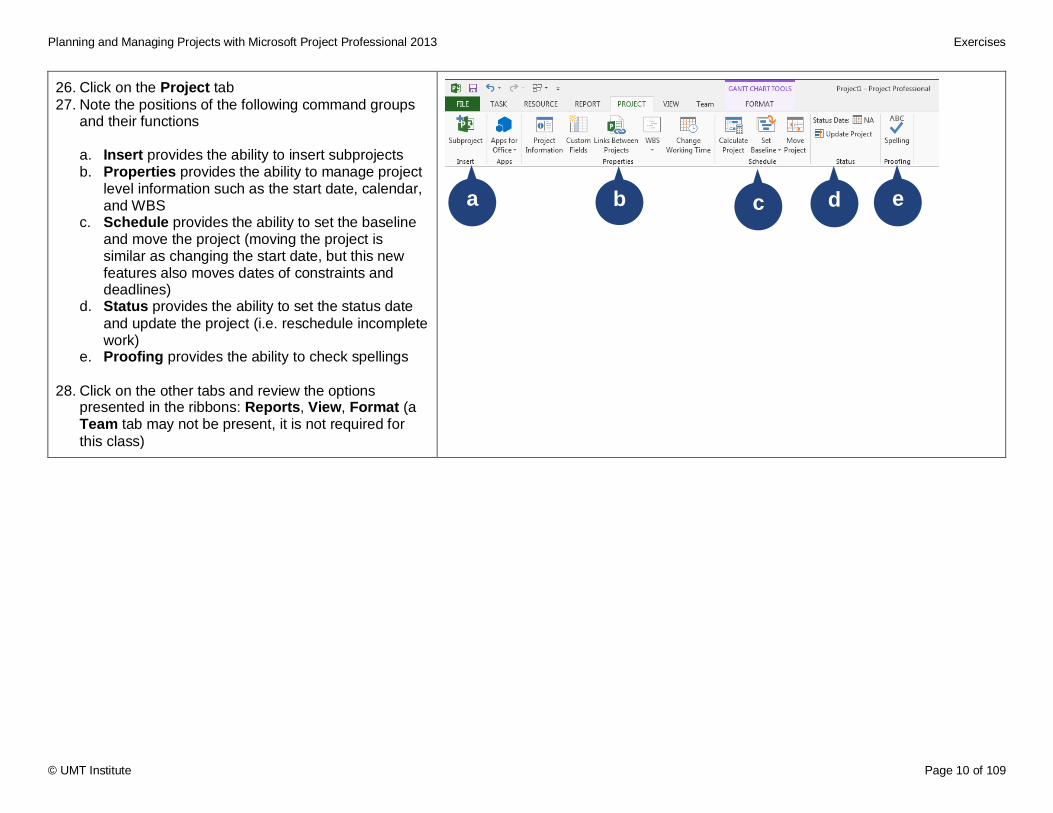
26. Click on the Project tab
27. Note the positions of the following command groups and their functions
a. Insert provides the ability to insert subprojects b. Properties provides the ability to manage project
level information such as the start date, calendar, and WBS
c. Schedule provides the ability to set the baseline and move the project (moving the project is similar as changing the start date, but this new features also moves dates of constraints and deadlines)
d. Status provides the ability to set the status date
and update the project (i.e. reschedule incomplete work)
e. Proofing provides the ability to check spellings
28. Click on the other tabs and review the options presented in the ribbons: Reports, View, Format (a Team tab may not be present, it is not required for
this class)
a b c d e
Planning and Managing Projects with Microsoft Project Professional 2013 Exercises
© UMT Institute Page 11 of 109
Defining Deliverables and Tasks
Exercise 1 Customizing the Quick Access Toolbar
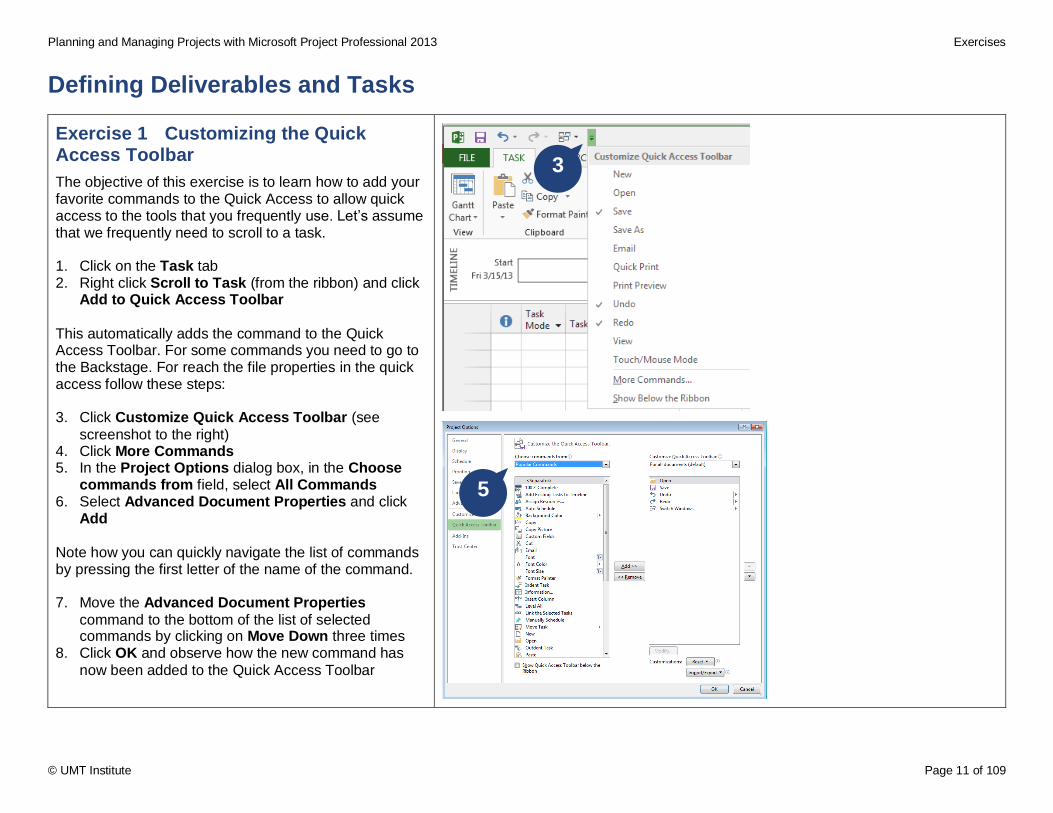
The objective of this exercise is to learn how to add your favorite commands to the Quick Access to allow quick access to the tools that you frequently use. Let’s assume that we frequently need to scroll to a task. 1. Click on the Task tab 2. Right click Scroll to Task (from the ribbon) and click
Add to Quick Access Toolbar
This automatically adds the command to the Quick Access Toolbar. For some commands you need to go to the Backstage. For reach the file properties in the quick access follow these steps: 3. Click Customize Quick Access Toolbar (see
screenshot to the right) 4. Click More Commands 5. In the Project Options dialog box, in the Choose
commands from field, select All Commands 6. Select Advanced Document Properties and click
Add Note how you can quickly navigate the list of commands by pressing the first letter of the name of the command. 7. Move the Advanced Document Properties
command to the bottom of the list of selected commands by clicking on Move Down three times
8. Click OK and observe how the new command has
now been added to the Quick Access Toolbar
5
3
Planning and Managing Projects with Microsoft Project Professional 2013 Exercises
© UMT Institute Page 12 of 109
Exercise 2 Creating a New Project
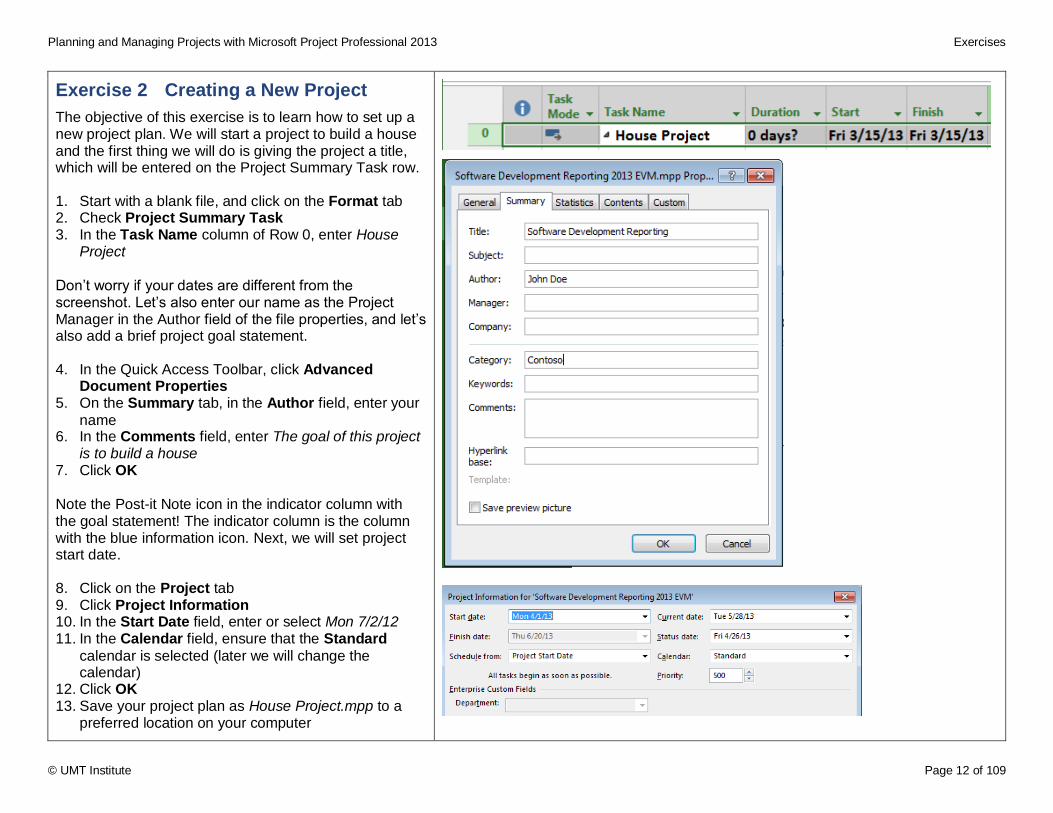
The objective of this exercise is to learn how to set up a new project plan. We will start a project to build a house and the first thing we will do is giving the project a title, which will be entered on the Project Summary Task row. 1. Start with a blank file, and click on the Format tab 2. Check Project Summary Task 3. In the Task Name column of Row 0, enter House
Project Don’t worry if your dates are different from the screenshot. Let’s also enter our name as the Project Manager in the Author field of the file properties, and let’s also add a brief project goal statement. 4. In the Quick Access Toolbar, click Advanced
Document Properties 5. On the Summary tab, in the Author field, enter your
name 6. In the Comments field, enter The goal of this project
is to build a house 7. Click OK
Note the Post-it Note icon in the indicator column with the goal statement! The indicator column is the column with the blue information icon. Next, we will set project start date. 8. Click on the Project tab 9. Click Project Information 10. In the Start Date field, enter or select Mon 7/2/12 11. In the Calendar field, ensure that the Standard
calendar is selected (later we will change the calendar)
12. Click OK 13. Save your project plan as House Project.mpp to a
preferred location on your computer
Planning and Managing Projects with Microsoft Project Professional 2013 Exercises
© UMT Institute Page 13 of 109
Exercise 3 Entering Tasks
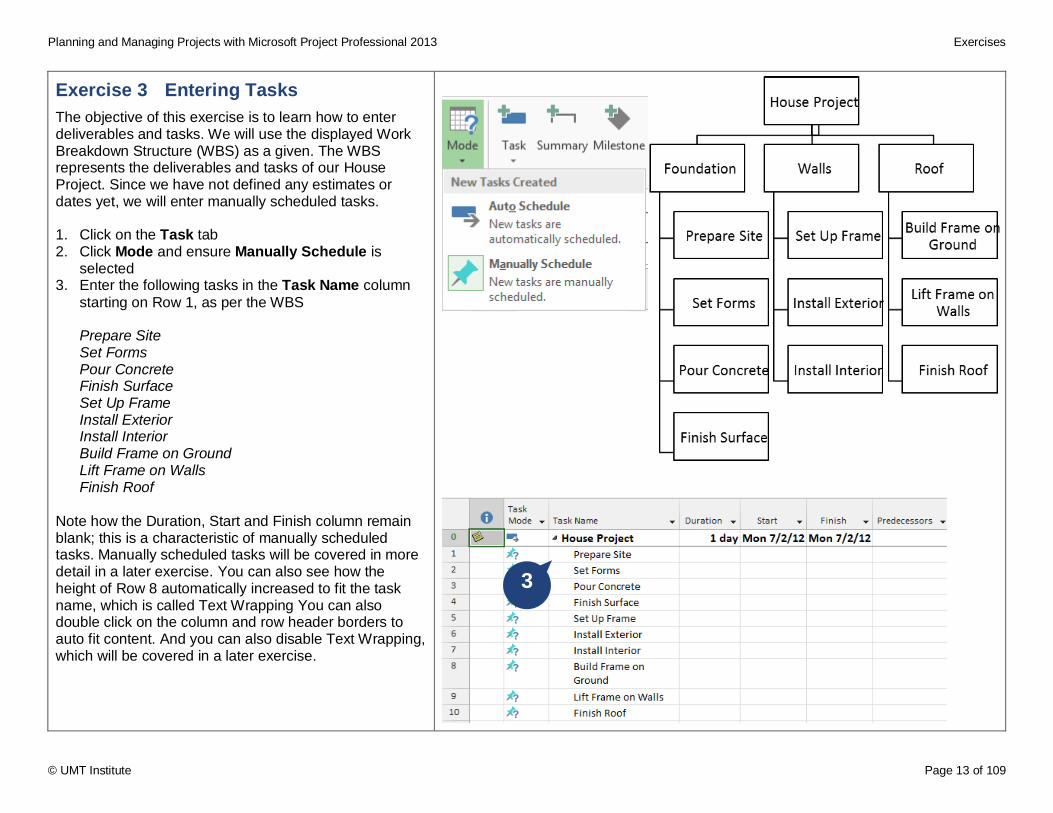
The objective of this exercise is to learn how to enter deliverables and tasks. We will use the displayed Work Breakdown Structure (WBS) as a given. The WBS represents the deliverables and tasks of our House Project. Since we have not defined any estimates or dates yet, we will enter manually scheduled tasks. 1. Click on the Task tab 2. Click Mode and ensure Manually Schedule is
selected 3. Enter the following tasks in the Task Name column
starting on Row 1, as per the WBS
Prepare Site Set Forms Pour Concrete Finish Surface Set Up Frame Install Exterior Install Interior Build Frame on Ground Lift Frame on Walls Finish Roof
Note how the Duration, Start and Finish column remain blank; this is a characteristic of manually scheduled tasks. Manually scheduled tasks will be covered in more detail in a later exercise. You can also see how the height of Row 8 automatically increased to fit the task name, which is called Text Wrapping You can also double click on the column and row header borders to auto fit content. And you can also disable Text Wrapping, which will be covered in a later exercise.
3
Planning and Managing Projects with Microsoft Project Professional 2013 Exercises
© UMT Institute Page 14 of 109
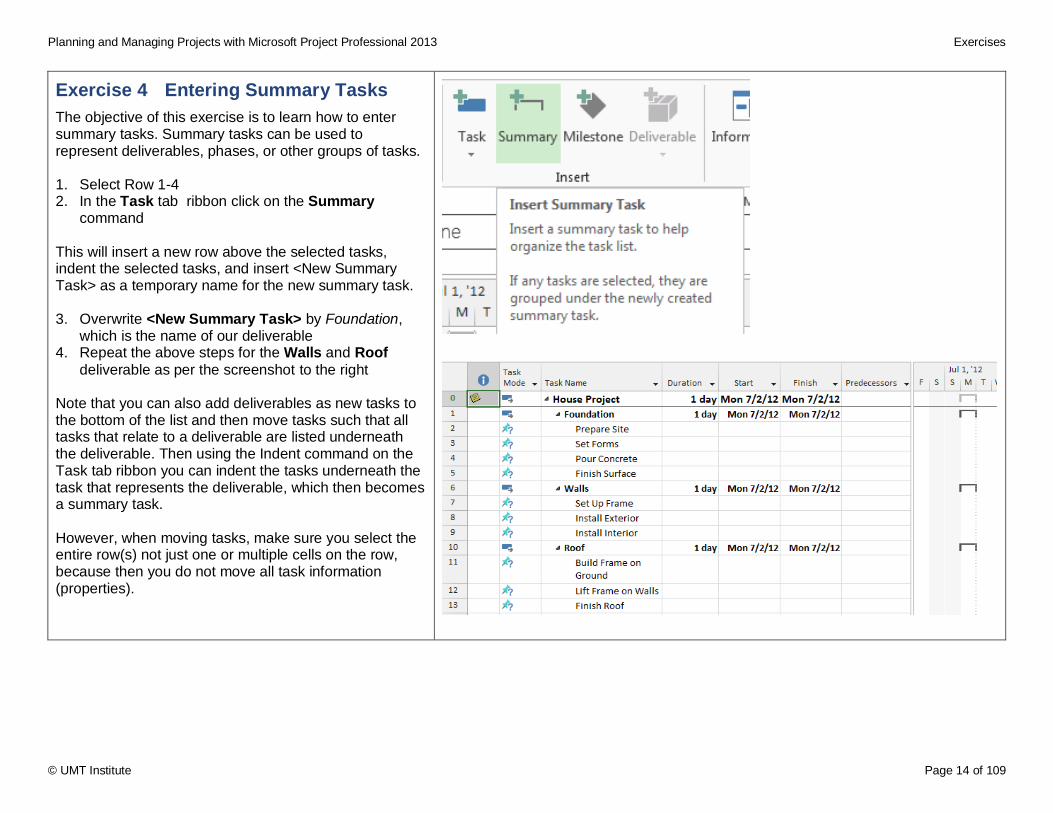
Exercise 4 Entering Summary Tasks
The objective of this exercise is to learn how to enter summary tasks. Summary tasks can be used to represent deliverables, phases, or other groups of tasks. 1. Select Row 1-4 2. In the Task tab ribbon click on the Summary
command This will insert a new row above the selected tasks, indent the selected tasks, and insert <New Summary Task> as a temporary name for the new summary task. 3. Overwrite <New Summary Task> by Foundation,
which is the name of our deliverable 4. Repeat the above steps for the Walls and Roof
deliverable as per the screenshot to the right
Note that you can also add deliverables as new tasks to the bottom of the list and then move tasks such that all tasks that relate to a deliverable are listed underneath the deliverable. Then using the Indent command on the Task tab ribbon you can indent the tasks underneath the task that represents the deliverable, which then becomes a summary task. However, when moving tasks, make sure you select the entire row(s) not just one or multiple cells on the row, because then you do not move all task information (properties).
Planning and Managing Projects with Microsoft Project Professional 2013 Exercises
© UMT Institute Page 15 of 109
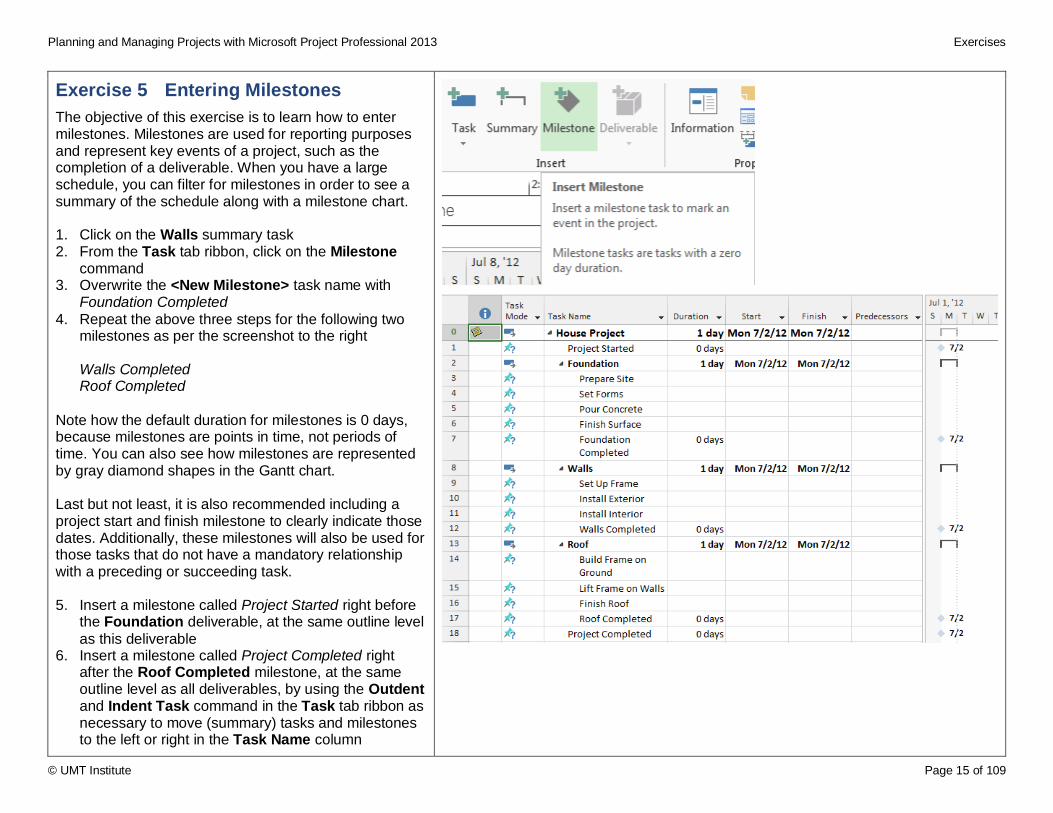
Exercise 5 Entering Milestones
The objective of this exercise is to learn how to enter milestones. Milestones are used for reporting purposes and represent key events of a project, such as the completion of a deliverable. When you have a large schedule, you can filter for milestones in order to see a summary of the schedule along with a milestone chart. 1. Click on the Walls summary task 2. From the Task tab ribbon, click on the Milestone
command 3. Overwrite the <New Milestone> task name with
Foundation Completed
4. Repeat the above three steps for the following two milestones as per the screenshot to the right
Walls Completed Roof Completed
Note how the default duration for milestones is 0 days, because milestones are points in time, not periods of time. You can also see how milestones are represented by gray diamond shapes in the Gantt chart. Last but not least, it is also recommended including a project start and finish milestone to clearly indicate those dates. Additionally, these milestones will also be used for those tasks that do not have a mandatory relationship with a preceding or succeeding task. 5. Insert a milestone called Project Started right before
the Foundation deliverable, at the same outline level
as this deliverable 6. Insert a milestone called Project Completed right
after the Roof Completed milestone, at the same outline level as all deliverables, by using the Outdent and Indent Task command in the Task tab ribbon as necessary to move (summary) tasks and milestones to the left or right in the Task Name column
Planning and Managing Projects with Microsoft Project Professional 2013 Exercises
© UMT Institute Page 16 of 109
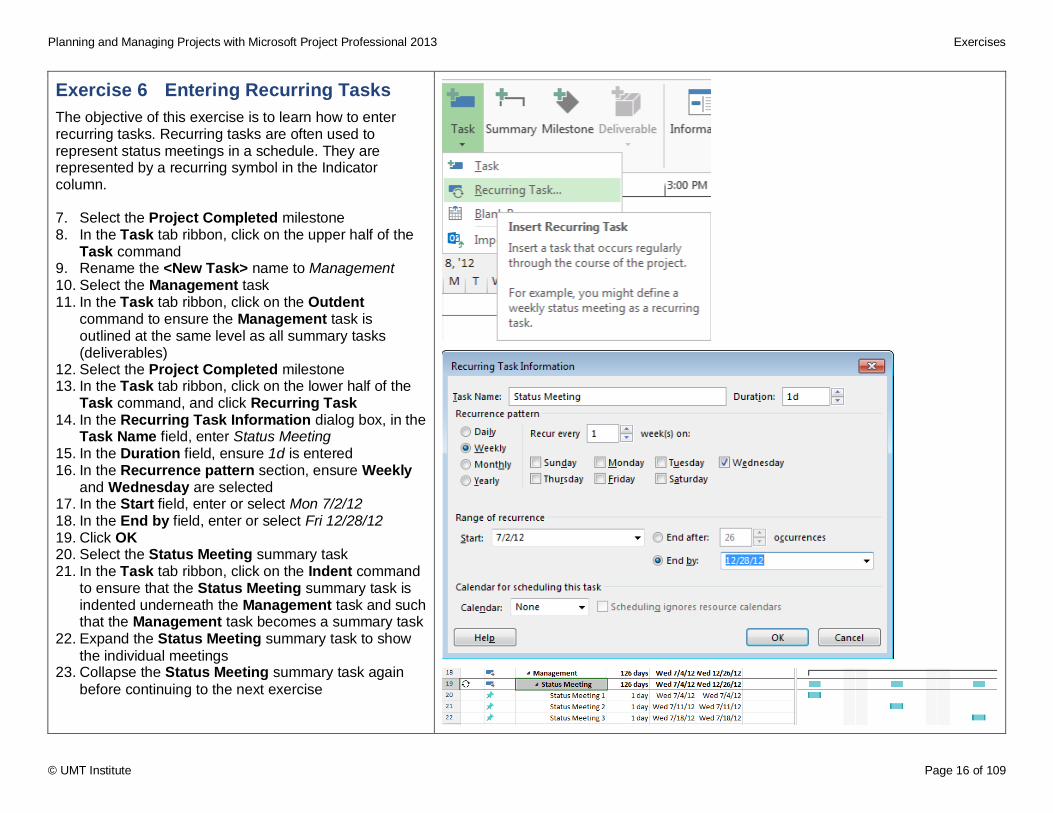
Exercise 6 Entering Recurring Tasks
The objective of this exercise is to learn how to enter recurring tasks. Recurring tasks are often used to represent status meetings in a schedule. They are represented by a recurring symbol in the Indicator column. 7. Select the Project Completed milestone 8. In the Task tab ribbon, click on the upper half of the
Task command 9. Rename the <New Task> name to Management 10. Select the Management task 11. In the Task tab ribbon, click on the Outdent
command to ensure the Management task is outlined at the same level as all summary tasks (deliverables)
12. Select the Project Completed milestone 13. In the Task tab ribbon, click on the lower half of the
Task command, and click Recurring Task 14. In the Recurring Task Information dialog box, in the
Task Name field, enter Status Meeting 15. In the Duration field, ensure 1d is entered 16. In the Recurrence pattern section, ensure Weekly
and Wednesday are selected 17. In the Start field, enter or select Mon 7/2/12 18. In the End by field, enter or select Fri 12/28/12 19. Click OK 20. Select the Status Meeting summary task 21. In the Task tab ribbon, click on the Indent command
to ensure that the Status Meeting summary task is indented underneath the Management task and such that the Management task becomes a summary task
22. Expand the Status Meeting summary task to show
the individual meetings 23. Collapse the Status Meeting summary task again
before continuing to the next exercise
Planning and Managing Projects with Microsoft Project Professional 2013 Exercises
© UMT Institute Page 17 of 109
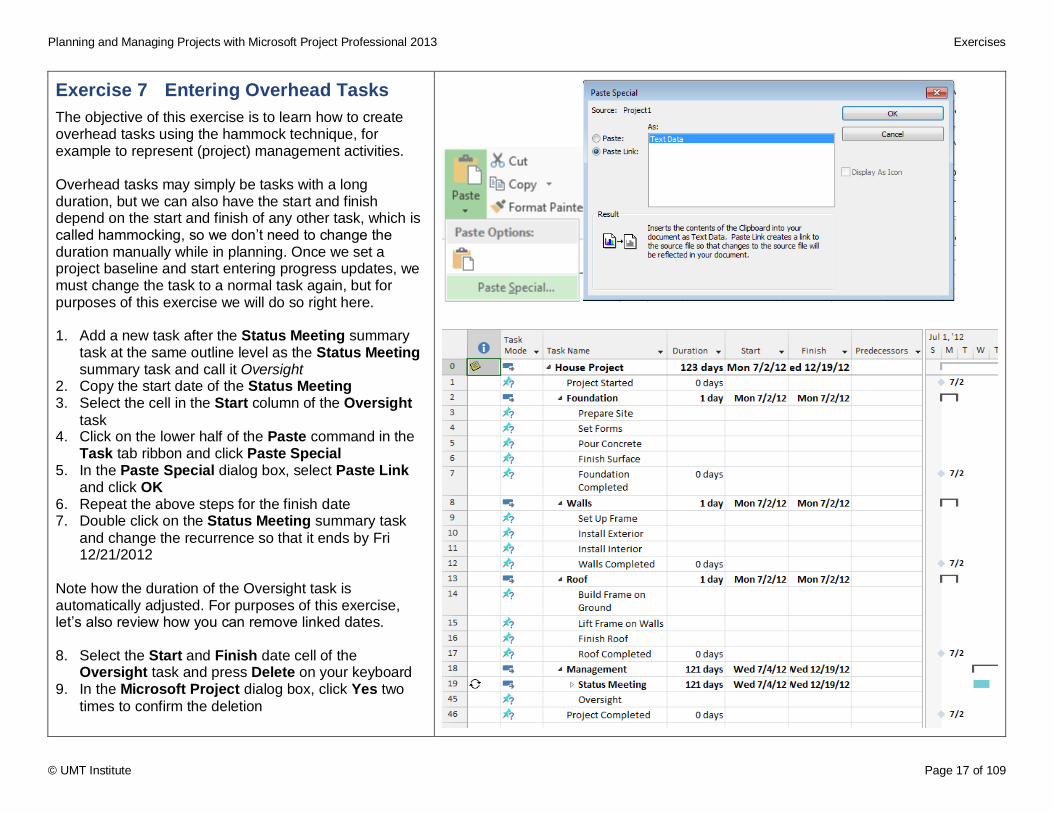
Exercise 7 Entering Overhead Tasks
The objective of this exercise is to learn how to create overhead tasks using the hammock technique, for example to represent (project) management activities. Overhead tasks may simply be tasks with a long duration, but we can also have the start and finish depend on the start and finish of any other task, which is called hammocking, so we don’t need to change the duration manually while in planning. Once we set a project baseline and start entering progress updates, we must change the task to a normal task again, but for purposes of this exercise we will do so right here. 1. Add a new task after the Status Meeting summary
task at the same outline level as the Status Meeting summary task and call it Oversight
2. Copy the start date of the Status Meeting 3. Select the cell in the Start column of the Oversight
task 4. Click on the lower half of the Paste command in the
Task tab ribbon and click Paste Special 5. In the Paste Special dialog box, select Paste Link
and click OK 6. Repeat the above steps for the finish date 7. Double click on the Status Meeting summary task
and change the recurrence so that it ends by Fri 12/21/2012
Note how the duration of the Oversight task is automatically adjusted. For purposes of this exercise, let’s also review how you can remove linked dates. 8. Select the Start and Finish date cell of the
Oversight task and press Delete on your keyboard 9. In the Microsoft Project dialog box, click Yes two
times to confirm the deletion
Planning and Managing Projects with Microsoft Project Professional 2013 Exercises
© UMT Institute Page 18 of 109
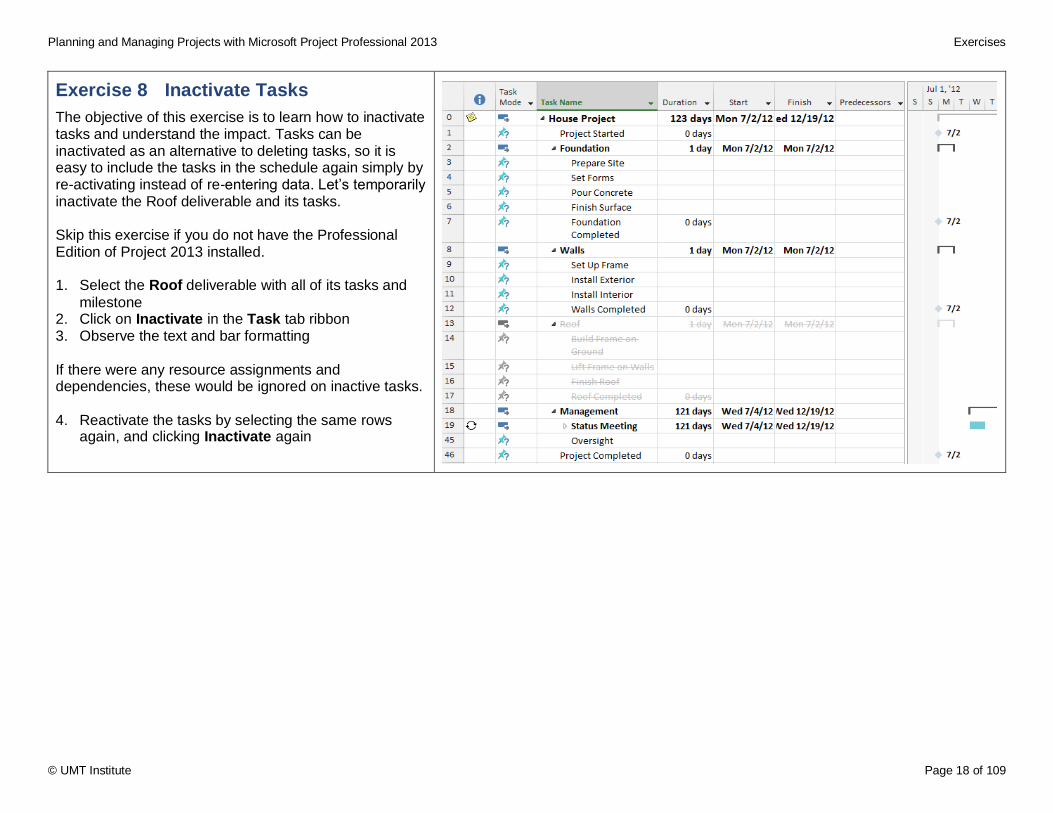
Exercise 8 Inactivate Tasks
The objective of this exercise is to learn how to inactivate tasks and understand the impact. Tasks can be inactivated as an alternative to deleting tasks, so it is easy to include the tasks in the schedule again simply by re-activating instead of re-entering data. Let’s temporarily inactivate the Roof deliverable and its tasks. Skip this exercise if you do not have the Professional Edition of Project 2013 installed. 1. Select the Roof deliverable with all of its tasks and
milestone 2. Click on Inactivate in the Task tab ribbon 3. Observe the text and bar formatting If there were any resource assignments and dependencies, these would be ignored on inactive tasks. 4. Reactivate the tasks by selecting the same rows
again, and clicking Inactivate again
Planning and Managing Projects with Microsoft Project Professional 2013 Exercises
© UMT Institute Page 19 of 109
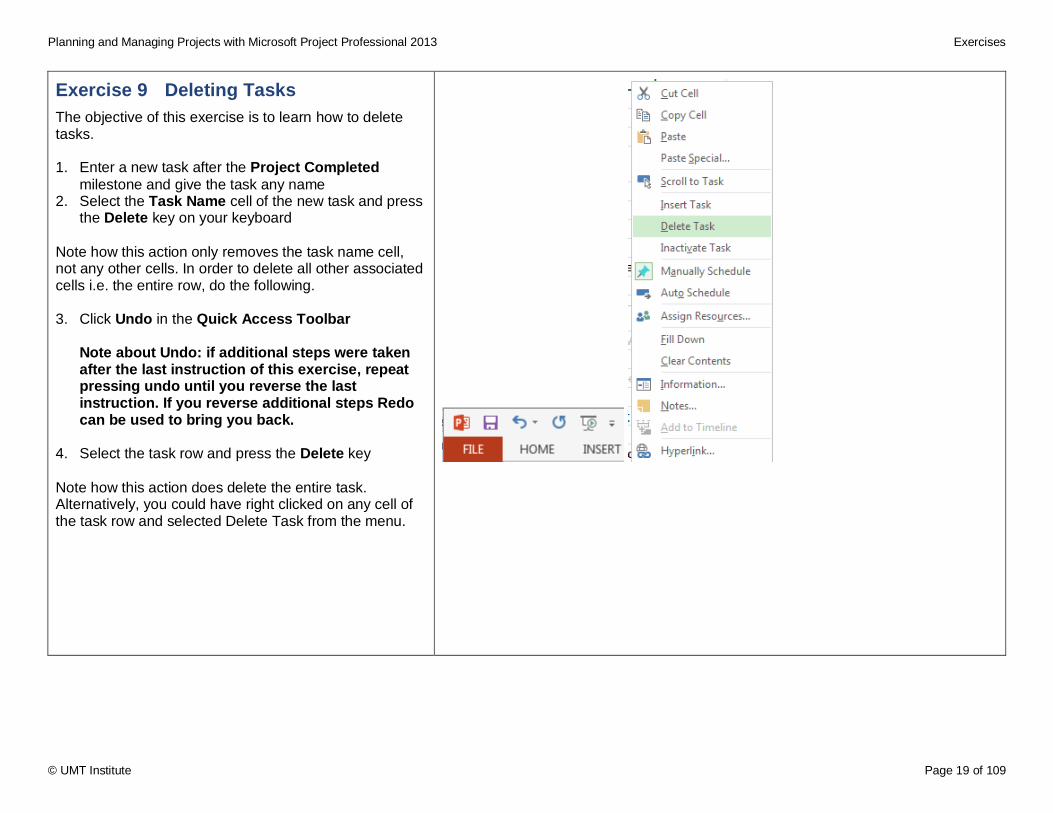
Exercise 9 Deleting Tasks
The objective of this exercise is to learn how to delete tasks. 1. Enter a new task after the Project Completed
milestone and give the task any name 2. Select the Task Name cell of the new task and press
the Delete key on your keyboard
Note how this action only removes the task name cell, not any other cells. In order to delete all other associated cells i.e. the entire row, do the following. 3. Click Undo in the Quick Access Toolbar
Note about Undo: if additional steps were taken after the last instruction of this exercise, repeat pressing undo until you reverse the last instruction. If you reverse additional steps Redo can be used to bring you back.
4. Select the task row and press the Delete key
Note how this action does delete the entire task. Alternatively, you could have right clicked on any cell of the task row and selected Delete Task from the menu.
Planning and Managing Projects with Microsoft Project Professional 2013 Exercises
© UMT Institute Page 20 of 109
Entering Estimates
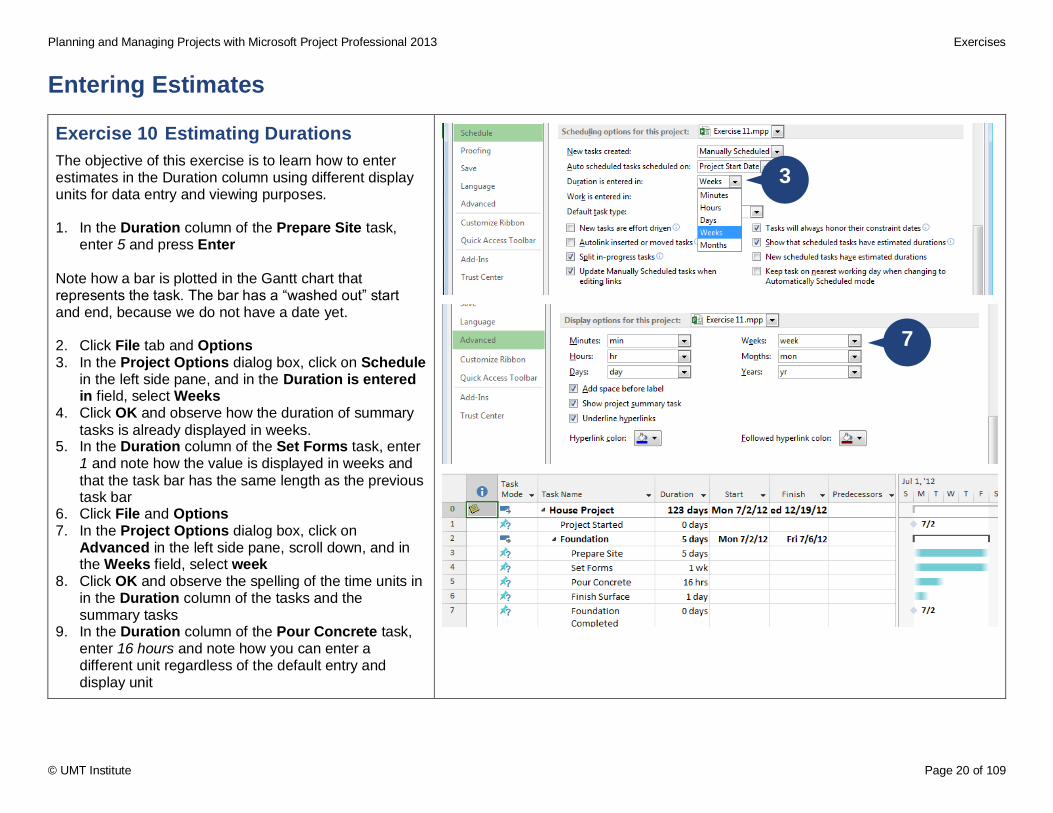
Exercise 10 Estimating Durations
The objective of this exercise is to learn how to enter estimates in the Duration column using different display units for data entry and viewing purposes. 1. In the Duration column of the Prepare Site task,
enter 5 and press Enter
Note how a bar is plotted in the Gantt chart that represents the task. The bar has a “washed out” start and end, because we do not have a date yet. 2. Click File tab and Options 3. In the Project Options dialog box, click on Schedule
in the left side pane, and in the Duration is entered in field, select Weeks
4. Click OK and observe how the duration of summary
tasks is already displayed in weeks. 5. In the Duration column of the Set Forms task, enter
1 and note how the value is displayed in weeks and
that the task bar has the same length as the previous task bar
6. Click File and Options 7. In the Project Options dialog box, click on
Advanced in the left side pane, scroll down, and in the Weeks field, select week
8. Click OK and observe the spelling of the time units in in the Duration column of the tasks and the summary tasks
9. In the Duration column of the Pour Concrete task, enter 16 hours and note how you can enter a different unit regardless of the default entry and display unit
3
7
Planning and Managing Projects with Microsoft Project Professional 2013 Exercises
© UMT Institute Page 21 of 109
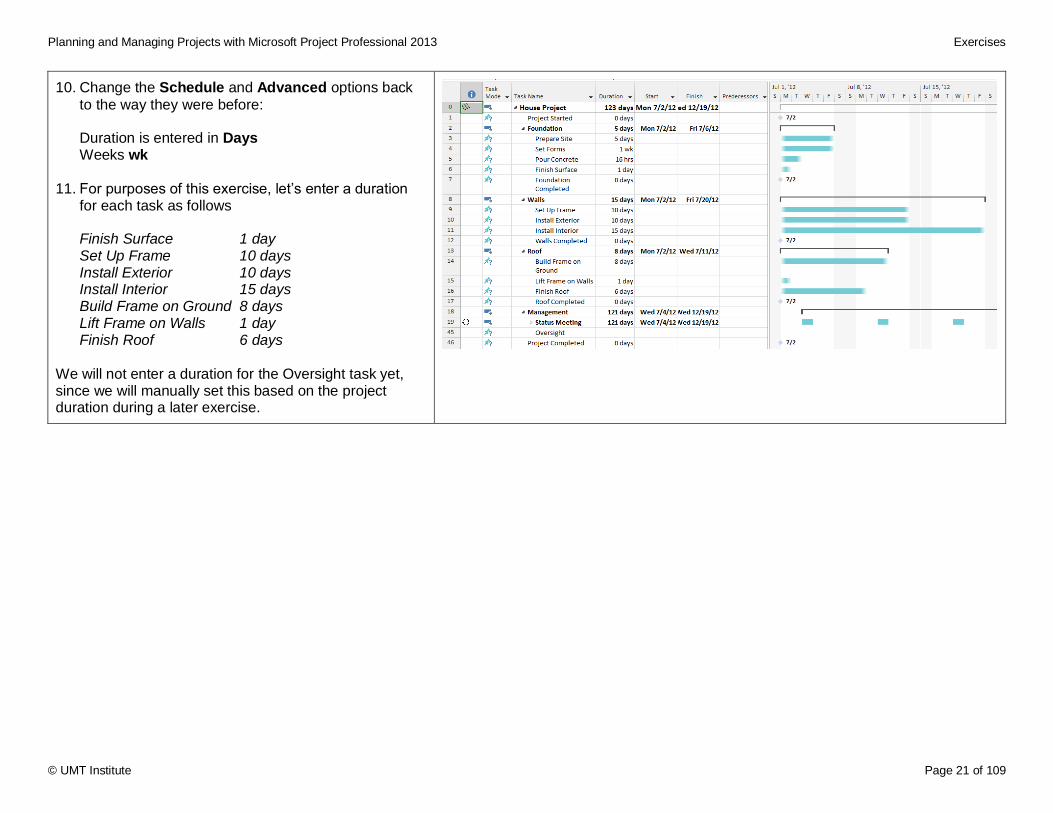
10. Change the Schedule and Advanced options back
to the way they were before:
Duration is entered in Days Weeks wk
11. For purposes of this exercise, let’s enter a duration
for each task as follows
Finish Surface 1 day Set Up Frame 10 days Install Exterior 10 days Install Interior 15 days Build Frame on Ground 8 days Lift Frame on Walls 1 day Finish Roof 6 days
We will not enter a duration for the Oversight task yet, since we will manually set this based on the project duration during a later exercise.
Planning and Managing Projects with Microsoft Project Professional 2013 Exercises
© UMT Institute Page 22 of 109
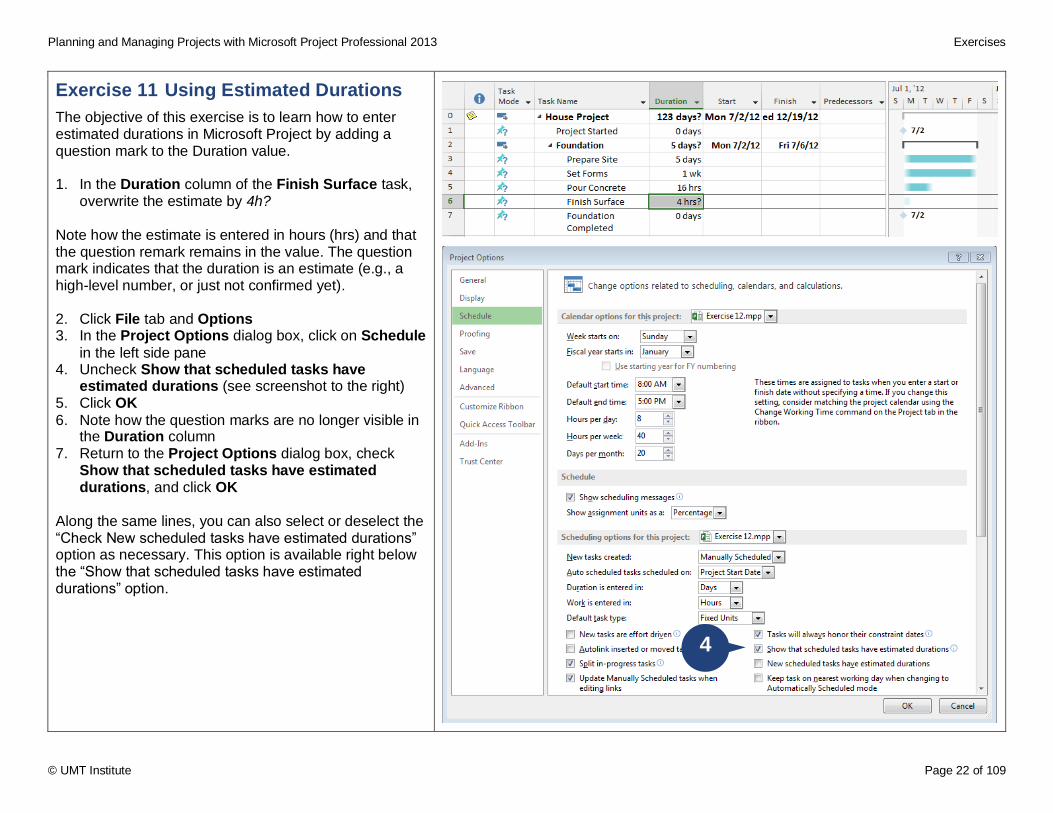
Exercise 11 Using Estimated Durations
The objective of this exercise is to learn how to enter estimated durations in Microsoft Project by adding a question mark to the Duration value. 1. In the Duration column of the Finish Surface task,
overwrite the estimate by 4h? Note how the estimate is entered in hours (hrs) and that the question remark remains in the value. The question mark indicates that the duration is an estimate (e.g., a high-level number, or just not confirmed yet). 2. Click File tab and Options 3. In the Project Options dialog box, click on Schedule
in the left side pane 4. Uncheck Show that scheduled tasks have
estimated durations (see screenshot to the right) 5. Click OK
6. Note how the question marks are no longer visible in the Duration column
7. Return to the Project Options dialog box, check Show that scheduled tasks have estimated durations, and click OK
Along the same lines, you can also select or deselect the “Check New scheduled tasks have estimated durations” option as necessary. This option is available right below the “Show that scheduled tasks have estimated durations” option.
4
Planning and Managing Projects with Microsoft Project Professional 2013 Exercises
© UMT Institute Page 23 of 109
Exercise 12 Using Interval Estimates
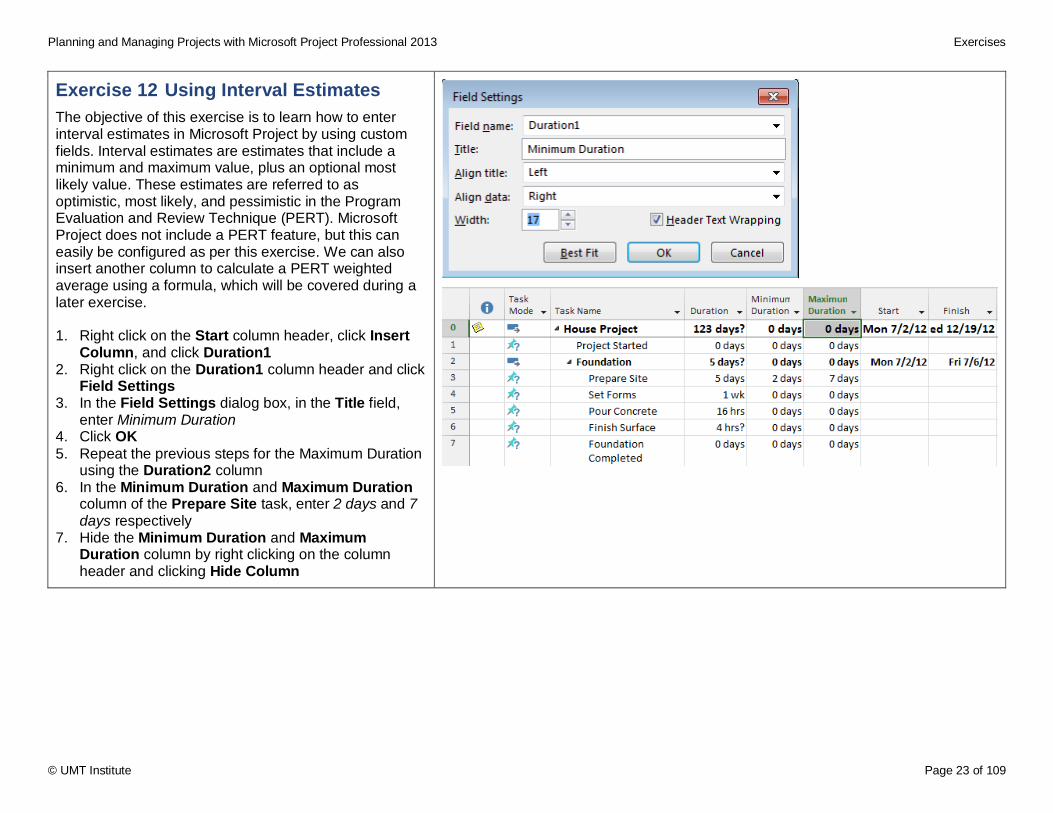
The objective of this exercise is to learn how to enter interval estimates in Microsoft Project by using custom fields. Interval estimates are estimates that include a minimum and maximum value, plus an optional most likely value. These estimates are referred to as optimistic, most likely, and pessimistic in the Program Evaluation and Review Technique (PERT). Microsoft Project does not include a PERT feature, but this can easily be configured as per this exercise. We can also insert another column to calculate a PERT weighted average using a formula, which will be covered during a later exercise. 1. Right click on the Start column header, click Insert
Column, and click Duration1 2. Right click on the Duration1 column header and click
Field Settings 3. In the Field Settings dialog box, in the Title field,
enter Minimum Duration 4. Click OK
5. Repeat the previous steps for the Maximum Duration using the Duration2 column
6. In the Minimum Duration and Maximum Duration column of the Prepare Site task, enter 2 days and 7 days respectively
7. Hide the Minimum Duration and Maximum Duration column by right clicking on the column header and clicking Hide Column
Planning and Managing Projects with Microsoft Project Professional 2013 Exercises
© UMT Institute Page 24 of 109
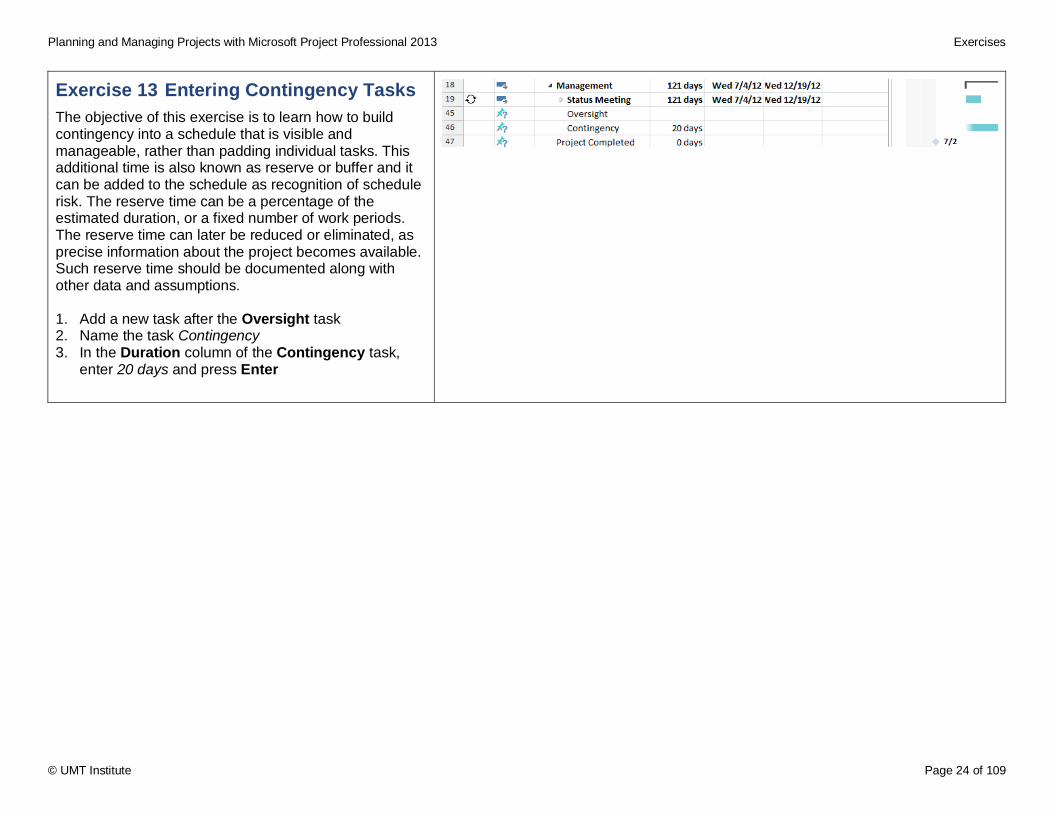
Exercise 13 Entering Contingency Tasks
The objective of this exercise is to learn how to build contingency into a schedule that is visible and manageable, rather than padding individual tasks. This additional time is also known as reserve or buffer and it can be added to the schedule as recognition of schedule risk. The reserve time can be a percentage of the estimated duration, or a fixed number of work periods. The reserve time can later be reduced or eliminated, as precise information about the project becomes available. Such reserve time should be documented along with other data and assumptions. 1. Add a new task after the Oversight task 2. Name the task Contingency 3. In the Duration column of the Contingency task,
enter 20 days and press Enter
Planning and Managing Projects with Microsoft Project Professional 2013 Exercises
© UMT Institute Page 25 of 109
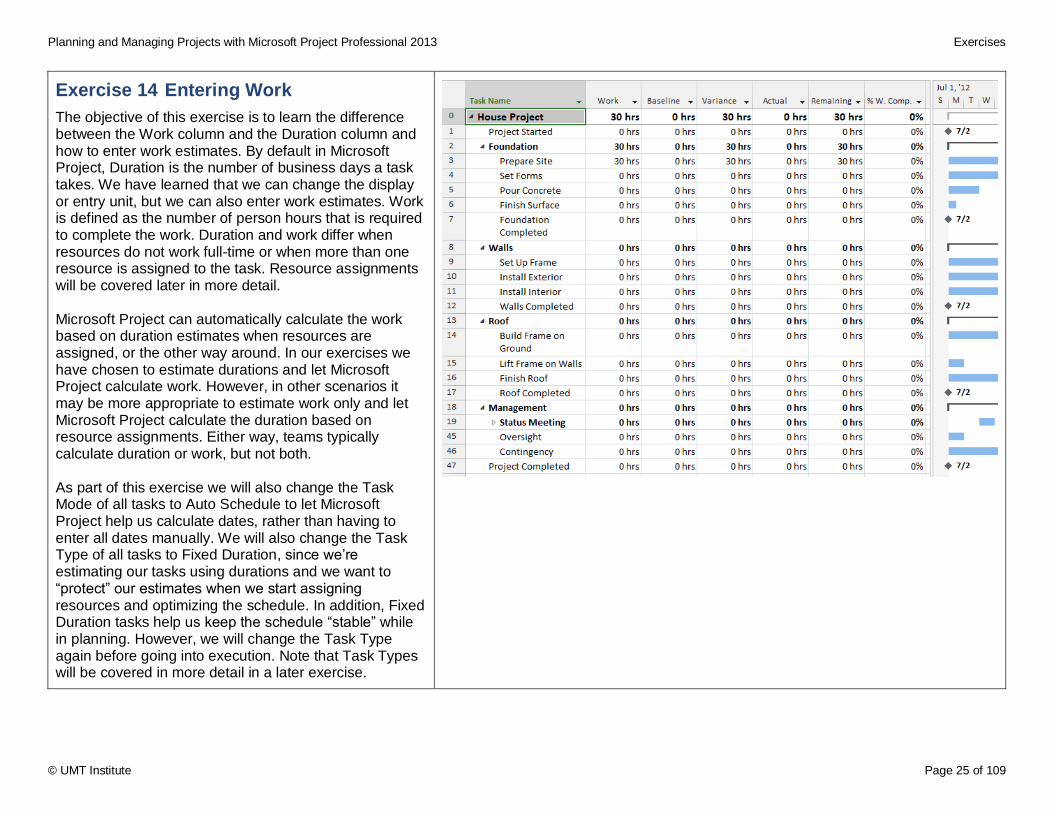
Exercise 14 Entering Work
The objective of this exercise is to learn the difference between the Work column and the Duration column and how to enter work estimates. By default in Microsoft Project, Duration is the number of business days a task takes. We have learned that we can change the display or entry unit, but we can also enter work estimates. Work is defined as the number of person hours that is required to complete the work. Duration and work differ when resources do not work full-time or when more than one resource is assigned to the task. Resource assignments will be covered later in more detail. Microsoft Project can automatically calculate the work based on duration estimates when resources are assigned, or the other way around. In our exercises we have chosen to estimate durations and let Microsoft Project calculate work. However, in other scenarios it may be more appropriate to estimate work only and let Microsoft Project calculate the duration based on resource assignments. Either way, teams typically calculate duration or work, but not both. As part of this exercise we will also change the Task Mode of all tasks to Auto Schedule to let Microsoft Project help us calculate dates, rather than having to enter all dates manually. We will also change the Task Type of all tasks to Fixed Duration, since we’re estimating our tasks using durations and we want to “protect” our estimates when we start assigning resources and optimizing the schedule. In addition, Fixed Duration tasks help us keep the schedule “stable” while in planning. However, we will change the Task Type again before going into execution. Note that Task Types will be covered in more detail in a later exercise.
Planning and Managing Projects with Microsoft Project Professional 2013 Exercises
© UMT Institute Page 26 of 109
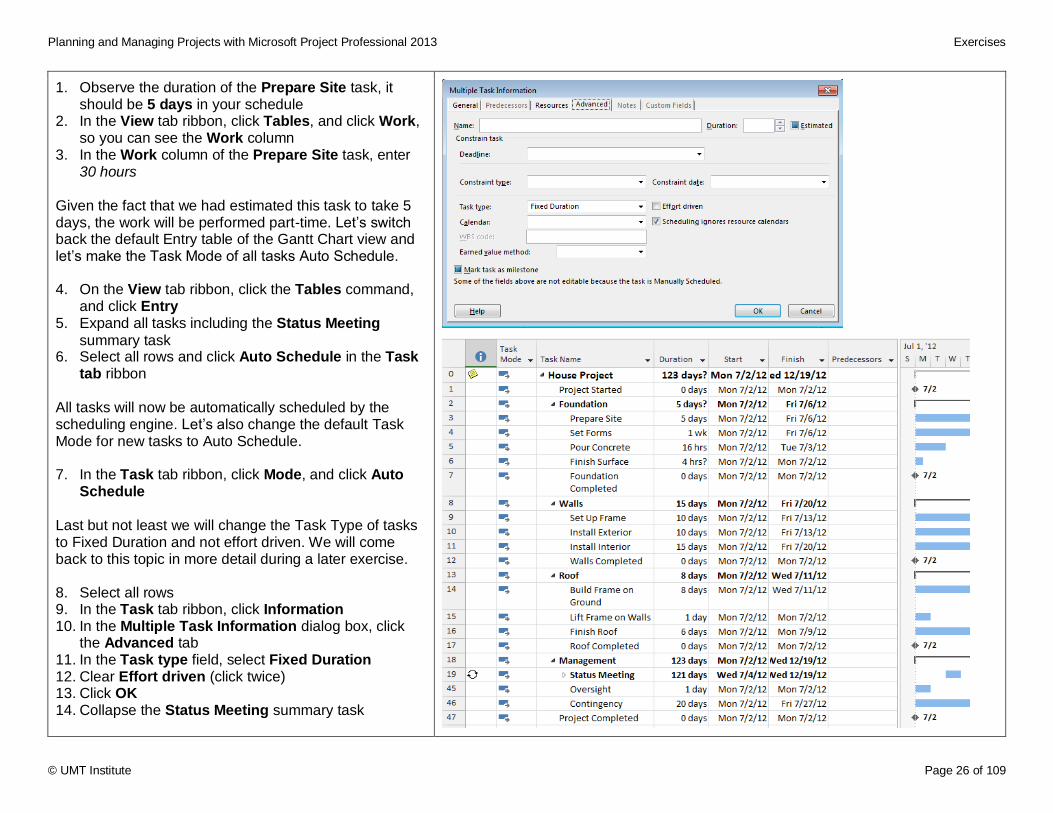
1. Observe the duration of the Prepare Site task, it should be 5 days in your schedule
2. In the View tab ribbon, click Tables, and click Work, so you can see the Work column
3. In the Work column of the Prepare Site task, enter 30 hours
Given the fact that we had estimated this task to take 5 days, the work will be performed part-time. Let’s switch back the default Entry table of the Gantt Chart view and let’s make the Task Mode of all tasks Auto Schedule. 4. On the View tab ribbon, click the Tables command,
and click Entry 5. Expand all tasks including the Status Meeting
summary task 6. Select all rows and click Auto Schedule in the Task
tab ribbon
All tasks will now be automatically scheduled by the scheduling engine. Let’s also change the default Task Mode for new tasks to Auto Schedule. 7. In the Task tab ribbon, click Mode, and click Auto
Schedule
Last but not least we will change the Task Type of tasks to Fixed Duration and not effort driven. We will come back to this topic in more detail during a later exercise. 8. Select all rows 9. In the Task tab ribbon, click Information 10. In the Multiple Task Information dialog box, click
the Advanced tab 11. In the Task type field, select Fixed Duration 12. Clear Effort driven (click twice) 13. Click OK 14. Collapse the Status Meeting summary task
Planning and Managing Projects with Microsoft Project Professional 2013 Exercises
© UMT Institute Page 27 of 109
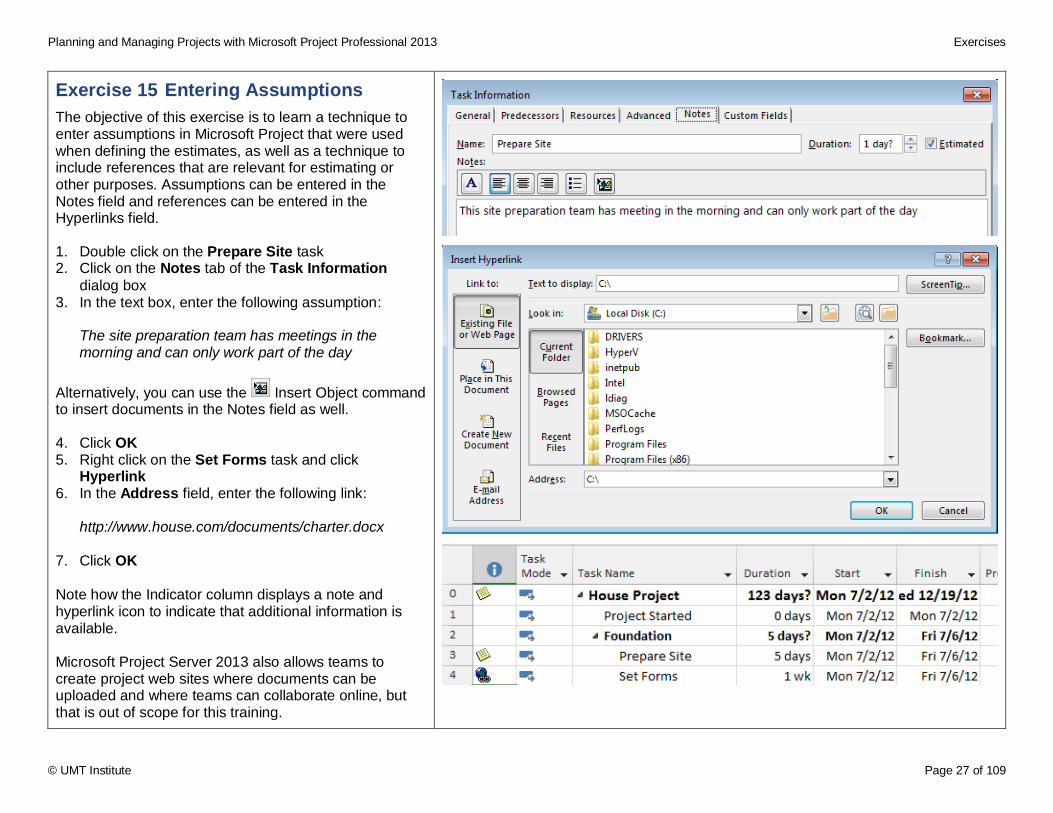
Exercise 15 Entering Assumptions
The objective of this exercise is to learn a technique to enter assumptions in Microsoft Project that were used when defining the estimates, as well as a technique to include references that are relevant for estimating or other purposes. Assumptions can be entered in the Notes field and references can be entered in the Hyperlinks field. 1. Double click on the Prepare Site task 2. Click on the Notes tab of the Task Information
dialog box 3. In the text box, enter the following assumption:
The site preparation team has meetings in the morning and can only work part of the day
Alternatively, you can use the Insert Object command to insert documents in the Notes field as well. 4. Click OK 5. Right click on the Set Forms task and click
Hyperlink 6. In the Address field, enter the following link:
http://www.house.com/documents/charter.docx
7. Click OK Note how the Indicator column displays a note and hyperlink icon to indicate that additional information is available. Microsoft Project Server 2013 also allows teams to create project web sites where documents can be uploaded and where teams can collaborate online, but that is out of scope for this training.
Planning and Managing Projects with Microsoft Project Professional 2013 Exercises
© UMT Institute Page 28 of 109
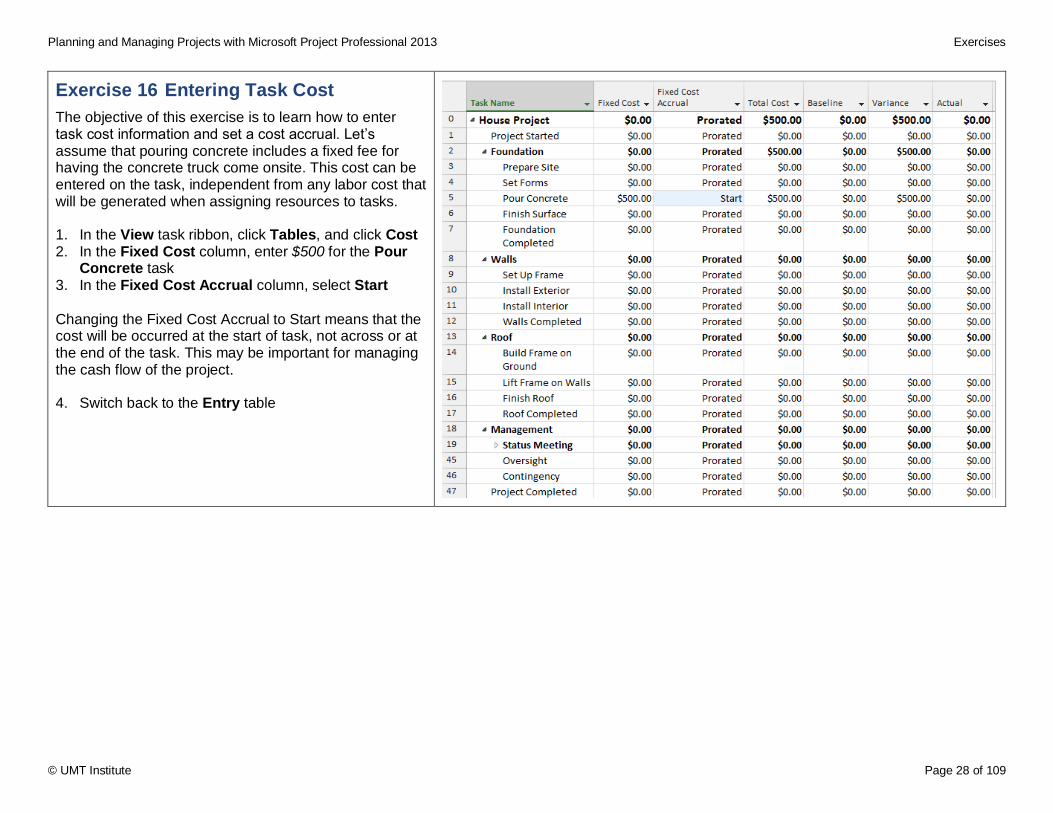
Exercise 16 Entering Task Cost
The objective of this exercise is to learn how to enter task cost information and set a cost accrual. Let’s assume that pouring concrete includes a fixed fee for having the concrete truck come onsite. This cost can be entered on the task, independent from any labor cost that will be generated when assigning resources to tasks. 1. In the View task ribbon, click Tables, and click Cost 2. In the Fixed Cost column, enter $500 for the Pour
Concrete task 3. In the Fixed Cost Accrual column, select Start
Changing the Fixed Cost Accrual to Start means that the cost will be occurred at the start of task, not across or at the end of the task. This may be important for managing the cash flow of the project. 4. Switch back to the Entry table
Planning and Managing Projects with Microsoft Project Professional 2013 Exercises
© UMT Institute Page 29 of 109
Creating Dependencies
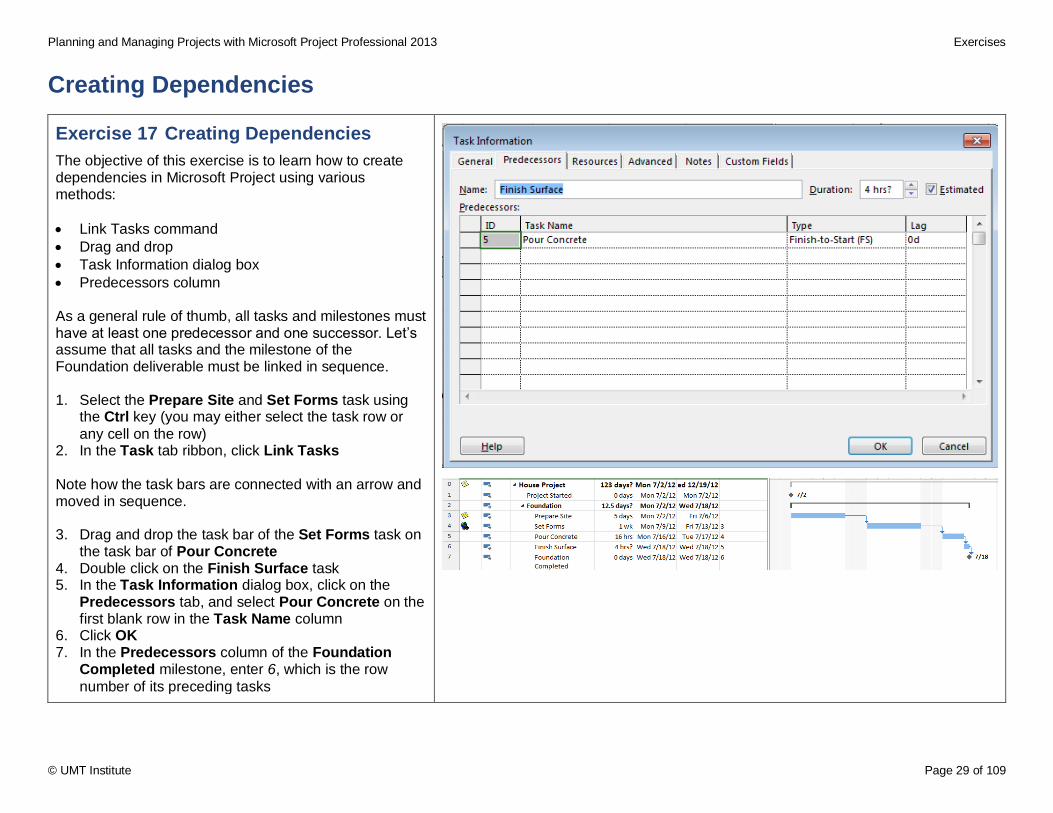
Exercise 17 Creating Dependencies
The objective of this exercise is to learn how to create dependencies in Microsoft Project using various methods:
Link Tasks command
Drag and drop
Task Information dialog box
Predecessors column As a general rule of thumb, all tasks and milestones must have at least one predecessor and one successor. Let’s assume that all tasks and the milestone of the Foundation deliverable must be linked in sequence. 1. Select the Prepare Site and Set Forms task using
the Ctrl key (you may either select the task row or
any cell on the row) 2. In the Task tab ribbon, click Link Tasks Note how the task bars are connected with an arrow and moved in sequence. 3. Drag and drop the task bar of the Set Forms task on
the task bar of Pour Concrete 4. Double click on the Finish Surface task 5. In the Task Information dialog box, click on the
Predecessors tab, and select Pour Concrete on the first blank row in the Task Name column
6. Click OK 7. In the Predecessors column of the Foundation
Completed milestone, enter 6, which is the row
number of its preceding tasks
Planning and Managing Projects with Microsoft Project Professional 2013 Exercises
© UMT Institute Page 30 of 109
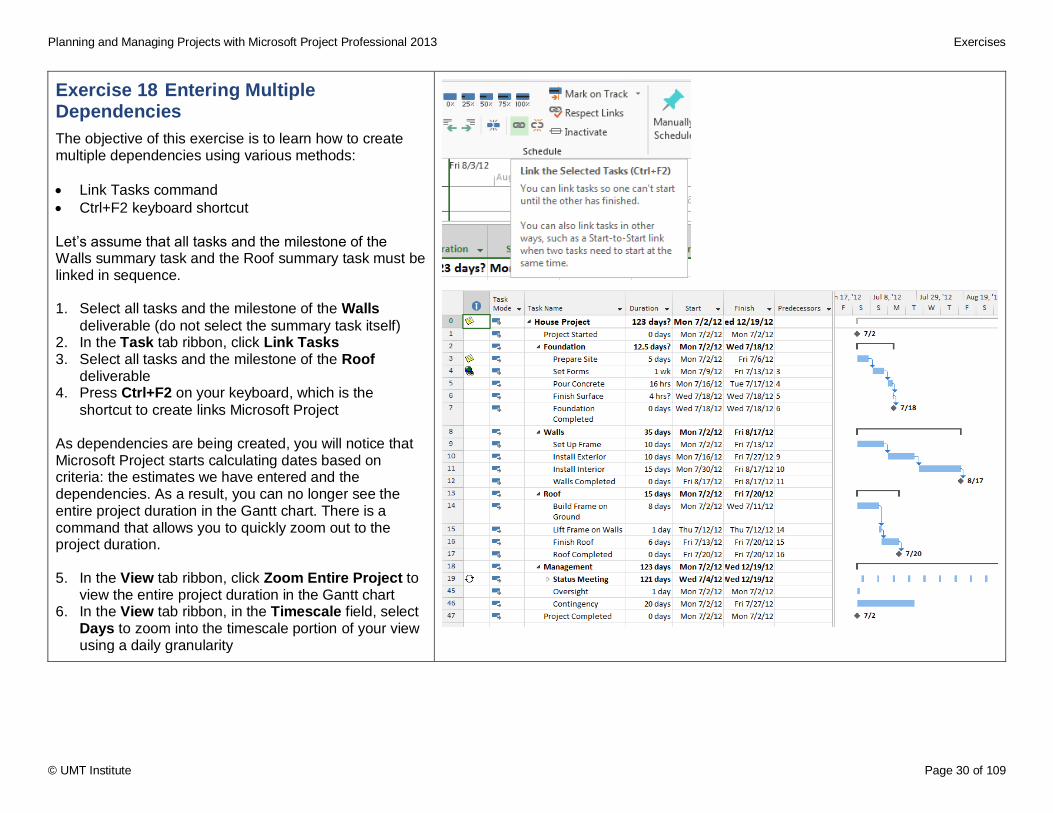
Exercise 18 Entering Multiple Dependencies
The objective of this exercise is to learn how to create multiple dependencies using various methods:
Link Tasks command
Ctrl+F2 keyboard shortcut Let’s assume that all tasks and the milestone of the Walls summary task and the Roof summary task must be linked in sequence. 1. Select all tasks and the milestone of the Walls
deliverable (do not select the summary task itself) 2. In the Task tab ribbon, click Link Tasks 3. Select all tasks and the milestone of the Roof
deliverable 4. Press Ctrl+F2 on your keyboard, which is the
shortcut to create links Microsoft Project As dependencies are being created, you will notice that Microsoft Project starts calculating dates based on criteria: the estimates we have entered and the dependencies. As a result, you can no longer see the entire project duration in the Gantt chart. There is a command that allows you to quickly zoom out to the project duration. 5. In the View tab ribbon, click Zoom Entire Project to
view the entire project duration in the Gantt chart 6. In the View tab ribbon, in the Timescale field, select
Days to zoom into the timescale portion of your view using a daily granularity
Planning and Managing Projects with Microsoft Project Professional 2013 Exercises
© UMT Institute Page 31 of 109
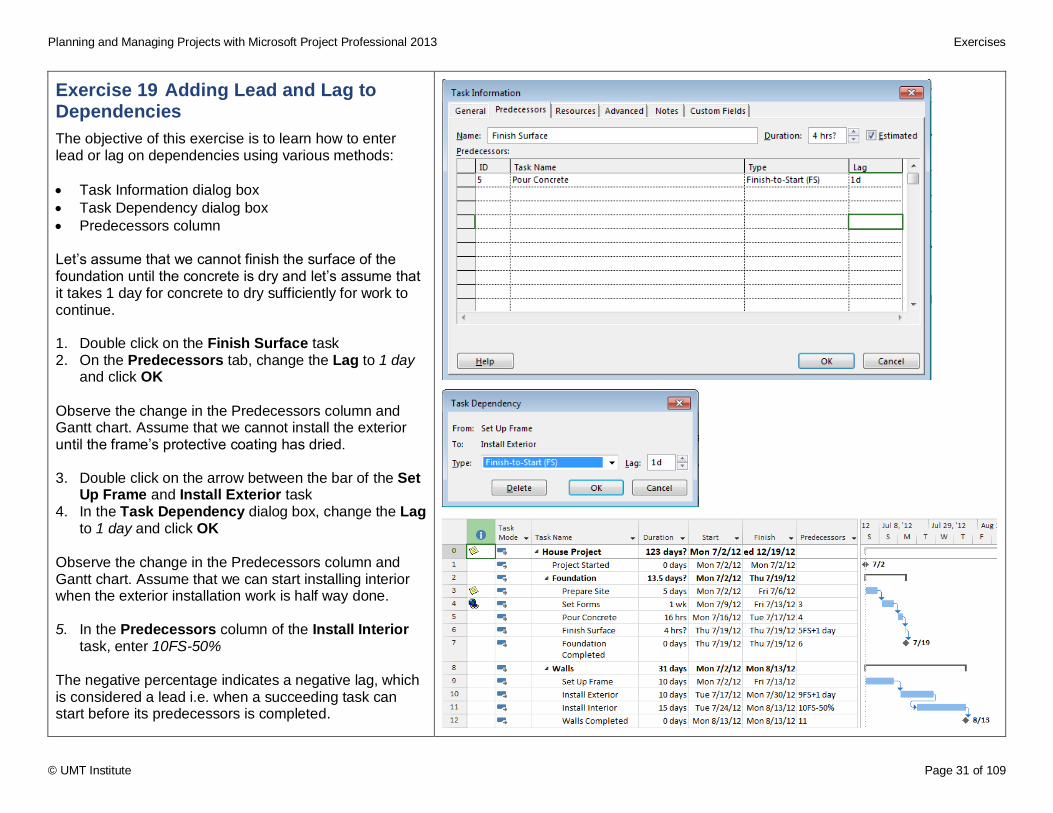
Exercise 19 Adding Lead and Lag to Dependencies
The objective of this exercise is to learn how to enter lead or lag on dependencies using various methods:
Task Information dialog box
Task Dependency dialog box
Predecessors column Let’s assume that we cannot finish the surface of the foundation until the concrete is dry and let’s assume that it takes 1 day for concrete to dry sufficiently for work to continue. 1. Double click on the Finish Surface task 2. On the Predecessors tab, change the Lag to 1 day
and click OK
Observe the change in the Predecessors column and Gantt chart. Assume that we cannot install the exterior until the frame’s protective coating has dried. 3. Double click on the arrow between the bar of the Set
Up Frame and Install Exterior task 4. In the Task Dependency dialog box, change the Lag
to 1 day and click OK
Observe the change in the Predecessors column and Gantt chart. Assume that we can start installing interior when the exterior installation work is half way done. 5. In the Predecessors column of the Install Interior
task, enter 10FS-50% The negative percentage indicates a negative lag, which is considered a lead i.e. when a succeeding task can start before its predecessors is completed.
Planning and Managing Projects with Microsoft Project Professional 2013 Exercises
© UMT Institute Page 32 of 109
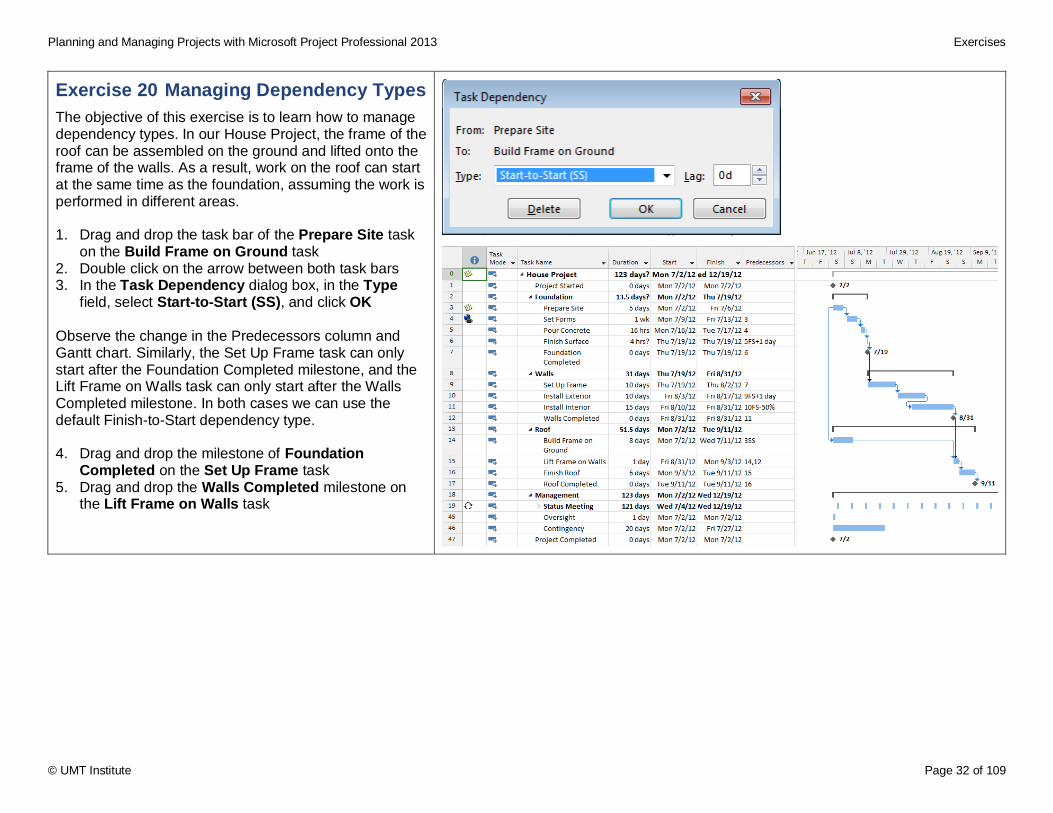
Exercise 20 Managing Dependency Types
The objective of this exercise is to learn how to manage dependency types. In our House Project, the frame of the roof can be assembled on the ground and lifted onto the frame of the walls. As a result, work on the roof can start at the same time as the foundation, assuming the work is performed in different areas. 1. Drag and drop the task bar of the Prepare Site task
on the Build Frame on Ground task 2. Double click on the arrow between both task bars 3. In the Task Dependency dialog box, in the Type
field, select Start-to-Start (SS), and click OK
Observe the change in the Predecessors column and Gantt chart. Similarly, the Set Up Frame task can only start after the Foundation Completed milestone, and the Lift Frame on Walls task can only start after the Walls Completed milestone. In both cases we can use the default Finish-to-Start dependency type. 4. Drag and drop the milestone of Foundation
Completed on the Set Up Frame task 5. Drag and drop the Walls Completed milestone on
the Lift Frame on Walls task
Planning and Managing Projects with Microsoft Project Professional 2013 Exercises
© UMT Institute Page 33 of 109
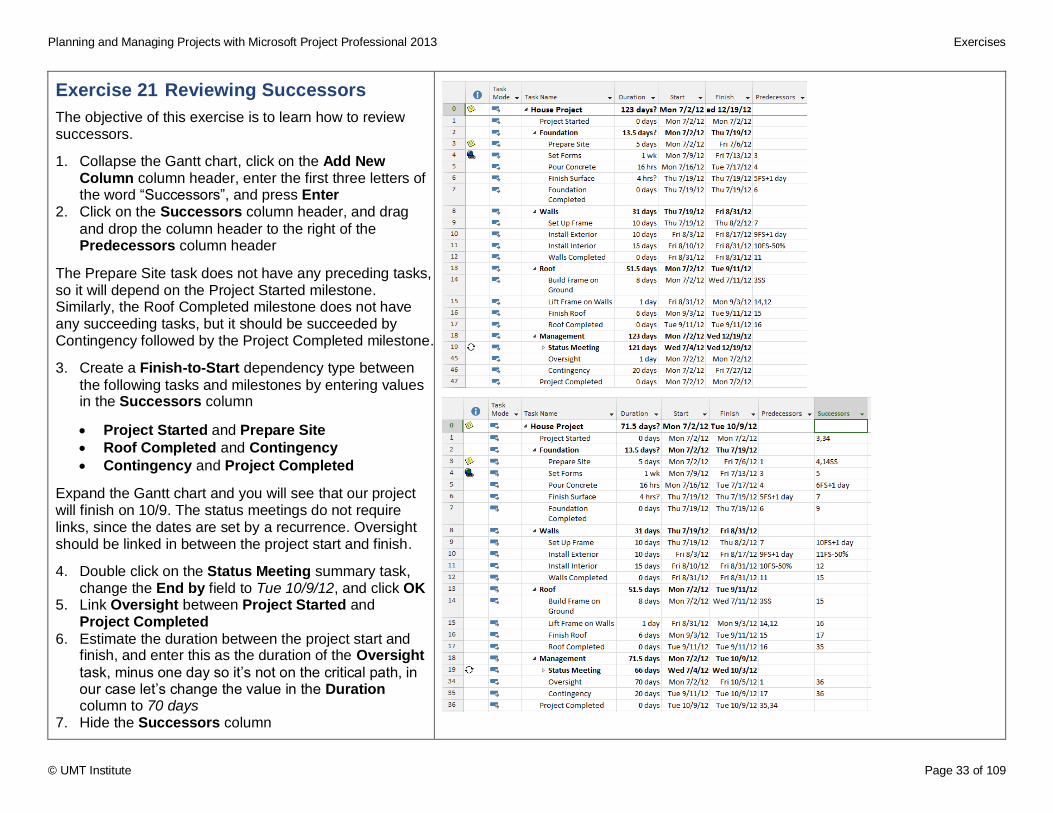
Exercise 21 Reviewing Successors
The objective of this exercise is to learn how to review successors.
1. Collapse the Gantt chart, click on the Add New Column column header, enter the first three letters of the word “Successors”, and press Enter
2. Click on the Successors column header, and drag
and drop the column header to the right of the Predecessors column header
The Prepare Site task does not have any preceding tasks, so it will depend on the Project Started milestone. Similarly, the Roof Completed milestone does not have any succeeding tasks, but it should be succeeded by Contingency followed by the Project Completed milestone.
3. Create a Finish-to-Start dependency type between
the following tasks and milestones by entering values in the Successors column
Project Started and Prepare Site
Roof Completed and Contingency
Contingency and Project Completed
Expand the Gantt chart and you will see that our project will finish on 10/9. The status meetings do not require links, since the dates are set by a recurrence. Oversight should be linked in between the project start and finish.
4. Double click on the Status Meeting summary task, change the End by field to Tue 10/9/12, and click OK
5. Link Oversight between Project Started and Project Completed
6. Estimate the duration between the project start and finish, and enter this as the duration of the Oversight
task, minus one day so it’s not on the critical path, in our case let’s change the value in the Duration column to 70 days
7. Hide the Successors column
Planning and Managing Projects with Microsoft Project Professional 2013 Exercises
© UMT Institute Page 34 of 109
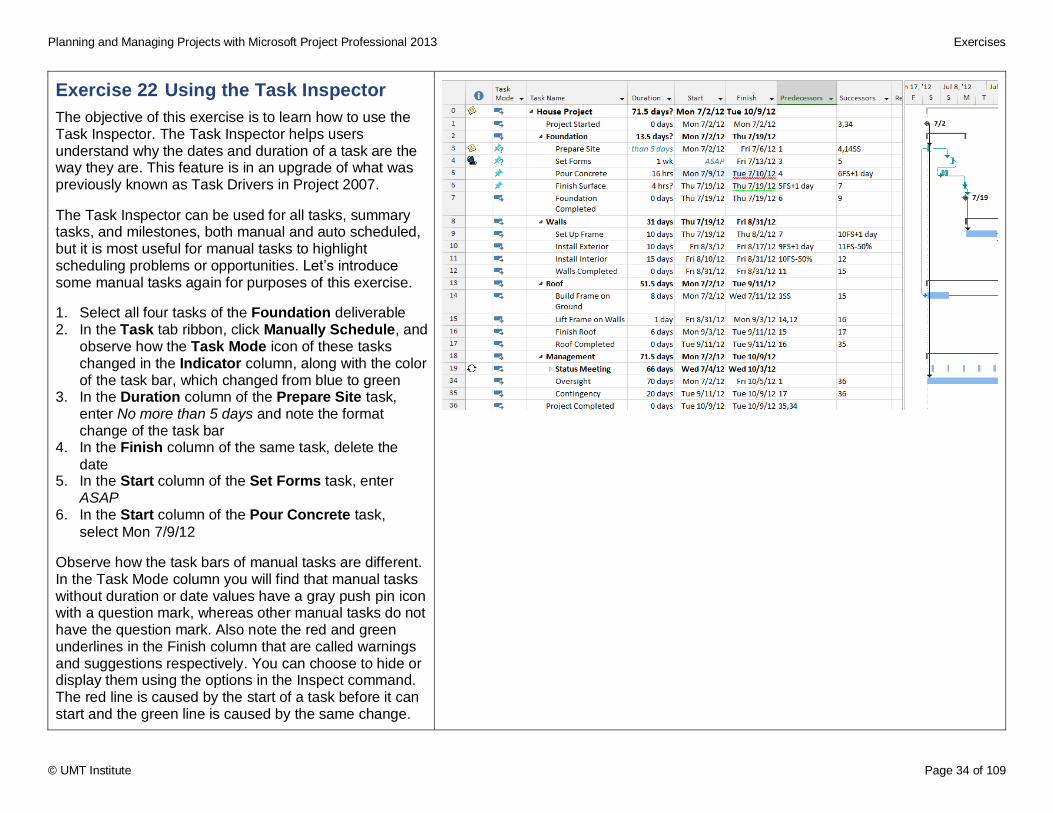
Exercise 22 Using the Task Inspector
The objective of this exercise is to learn how to use the Task Inspector. The Task Inspector helps users understand why the dates and duration of a task are the way they are. This feature is in an upgrade of what was previously known as Task Drivers in Project 2007.
The Task Inspector can be used for all tasks, summary tasks, and milestones, both manual and auto scheduled, but it is most useful for manual tasks to highlight scheduling problems or opportunities. Let’s introduce some manual tasks again for purposes of this exercise.
1. Select all four tasks of the Foundation deliverable 2. In the Task tab ribbon, click Manually Schedule, and
observe how the Task Mode icon of these tasks changed in the Indicator column, along with the color of the task bar, which changed from blue to green
3. In the Duration column of the Prepare Site task, enter No more than 5 days and note the format change of the task bar
4. In the Finish column of the same task, delete the
date 5. In the Start column of the Set Forms task, enter
ASAP 6. In the Start column of the Pour Concrete task,
select Mon 7/9/12
Observe how the task bars of manual tasks are different. In the Task Mode column you will find that manual tasks without duration or date values have a gray push pin icon with a question mark, whereas other manual tasks do not have the question mark. Also note the red and green underlines in the Finish column that are called warnings and suggestions respectively. You can choose to hide or display them using the options in the Inspect command. The red line is caused by the start of a task before it can start and the green line is caused by the same change.
Planning and Managing Projects with Microsoft Project Professional 2013 Exercises
© UMT Institute Page 35 of 109
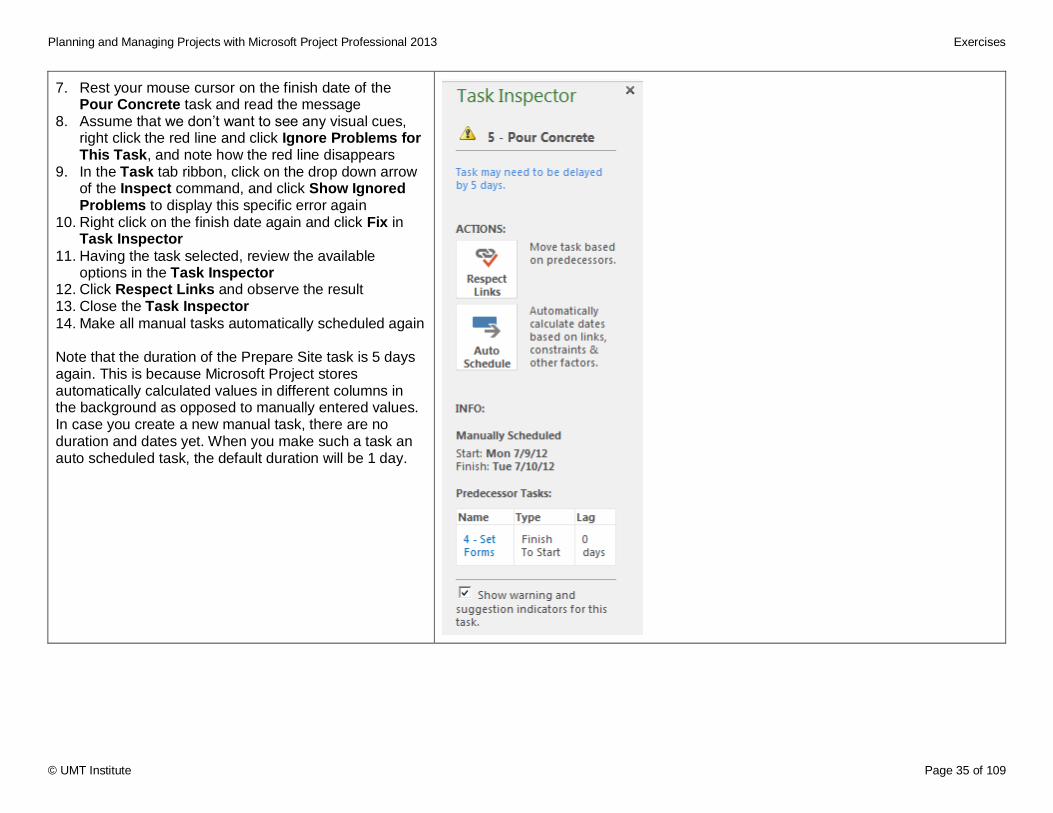
7. Rest your mouse cursor on the finish date of the Pour Concrete task and read the message
8. Assume that we don’t want to see any visual cues, right click the red line and click Ignore Problems for This Task, and note how the red line disappears
9. In the Task tab ribbon, click on the drop down arrow of the Inspect command, and click Show Ignored Problems to display this specific error again
10. Right click on the finish date again and click Fix in Task Inspector
11. Having the task selected, review the available options in the Task Inspector
12. Click Respect Links and observe the result 13. Close the Task Inspector
14. Make all manual tasks automatically scheduled again Note that the duration of the Prepare Site task is 5 days again. This is because Microsoft Project stores automatically calculated values in different columns in the background as opposed to manually entered values. In case you create a new manual task, there are no duration and dates yet. When you make such a task an auto scheduled task, the default duration will be 1 day.
Planning and Managing Projects with Microsoft Project Professional 2013 Exercises
© UMT Institute Page 36 of 109
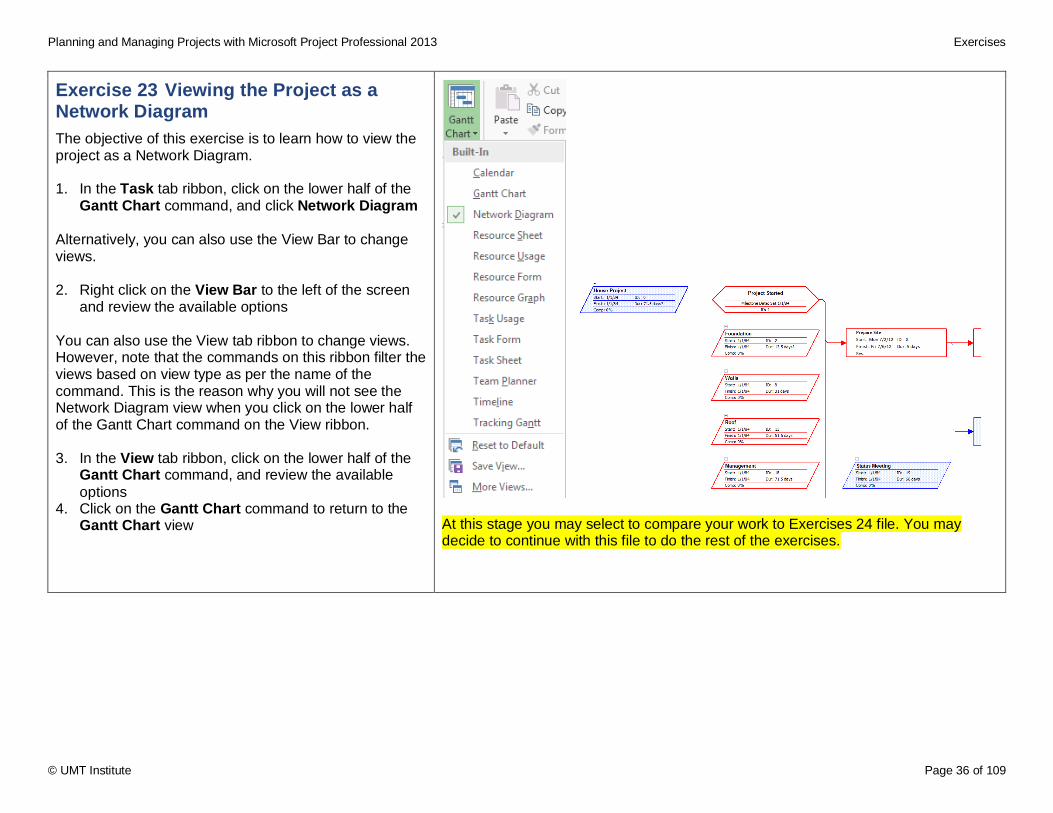
Exercise 23 Viewing the Project as a Network Diagram
The objective of this exercise is to learn how to view the project as a Network Diagram. 1. In the Task tab ribbon, click on the lower half of the
Gantt Chart command, and click Network Diagram
Alternatively, you can also use the View Bar to change views. 2. Right click on the View Bar to the left of the screen
and review the available options You can also use the View tab ribbon to change views. However, note that the commands on this ribbon filter the views based on view type as per the name of the command. This is the reason why you will not see the Network Diagram view when you click on the lower half of the Gantt Chart command on the View ribbon. 3. In the View tab ribbon, click on the lower half of the
Gantt Chart command, and review the available
options 4. Click on the Gantt Chart command to return to the
Gantt Chart view
At this stage you may select to compare your work to Exercises 24 file. You may decide to continue with this file to do the rest of the exercises.
Planning and Managing Projects with Microsoft Project Professional 2013 Exercises
© UMT Institute Page 37 of 109
Setting Up and Assigning Resources
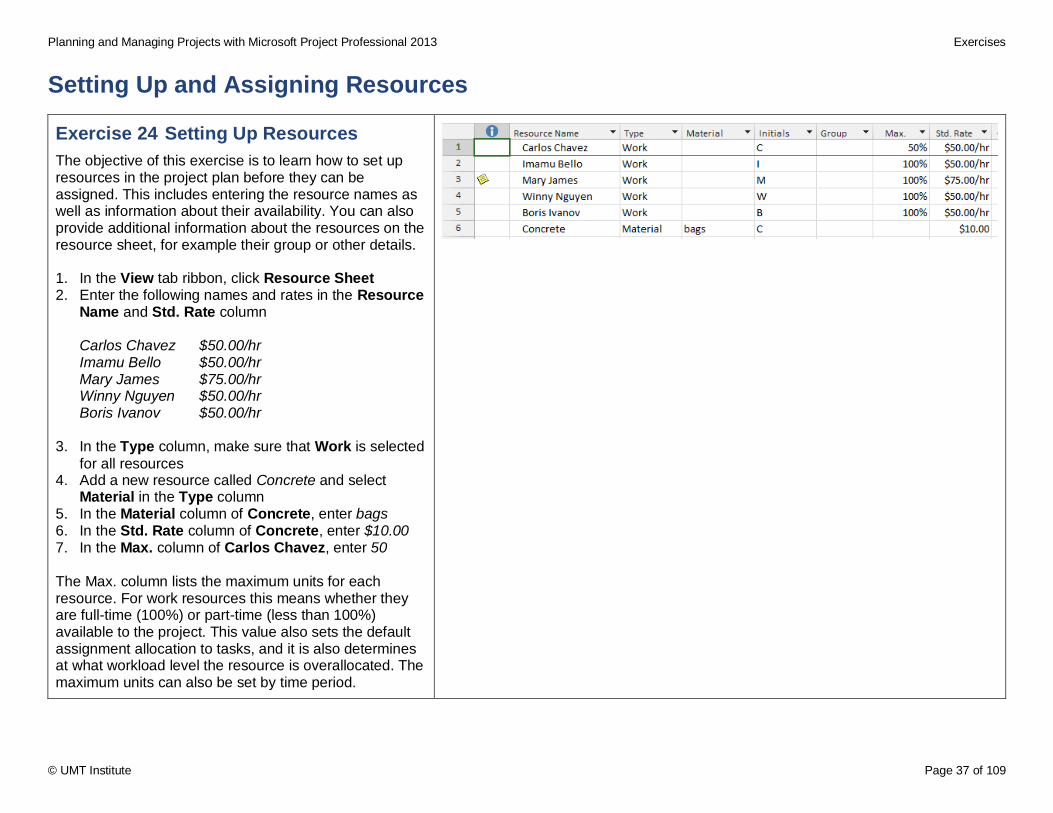
Exercise 24 Setting Up Resources
The objective of this exercise is to learn how to set up resources in the project plan before they can be assigned. This includes entering the resource names as well as information about their availability. You can also provide additional information about the resources on the resource sheet, for example their group or other details. 1. In the View tab ribbon, click Resource Sheet 2. Enter the following names and rates in the Resource
Name and Std. Rate column
Carlos Chavez $50.00/hr Imamu Bello $50.00/hr Mary James $75.00/hr Winny Nguyen $50.00/hr Boris Ivanov $50.00/hr
3. In the Type column, make sure that Work is selected
for all resources 4. Add a new resource called Concrete and select
Material in the Type column 5. In the Material column of Concrete, enter bags 6. In the Std. Rate column of Concrete, enter $10.00 7. In the Max. column of Carlos Chavez, enter 50 The Max. column lists the maximum units for each resource. For work resources this means whether they are full-time (100%) or part-time (less than 100%) available to the project. This value also sets the default assignment allocation to tasks, and it is also determines at what workload level the resource is overallocated. The maximum units can also be set by time period.
Planning and Managing Projects with Microsoft Project Professional 2013 Exercises
© UMT Institute Page 38 of 109
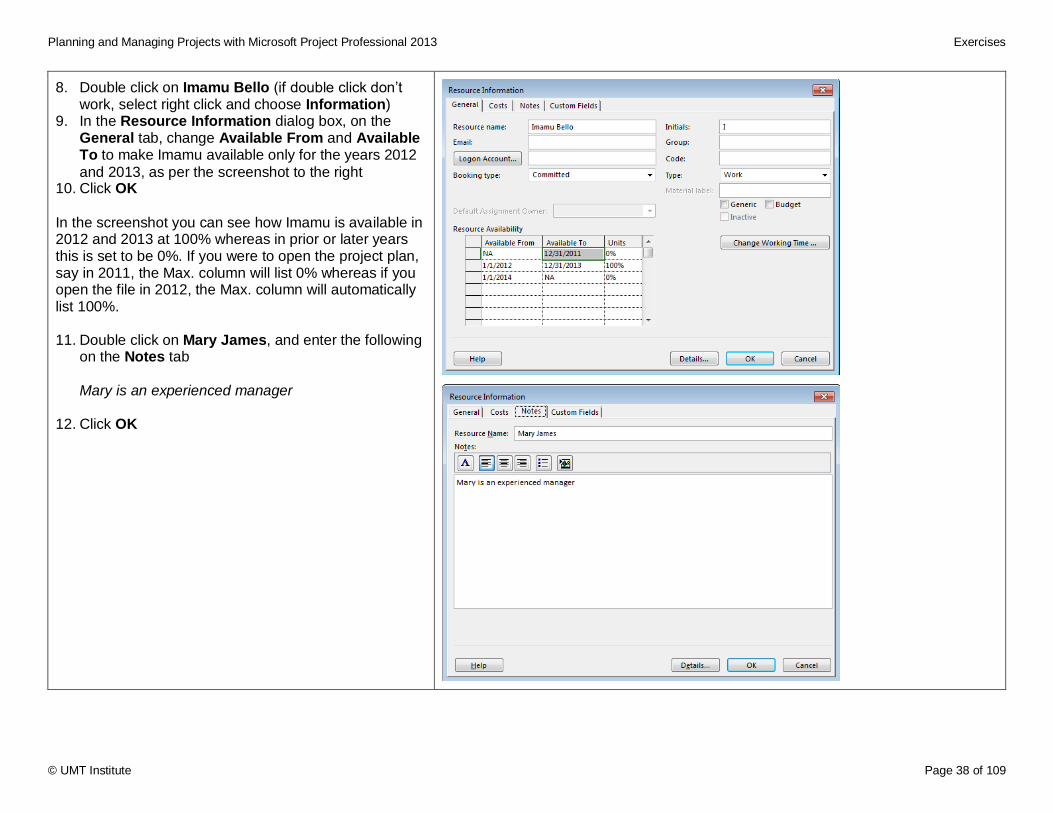
8. Double click on Imamu Bello (if double click don’t work, select right click and choose Information)
9. In the Resource Information dialog box, on the General tab, change Available From and Available To to make Imamu available only for the years 2012
and 2013, as per the screenshot to the right 10. Click OK
In the screenshot you can see how Imamu is available in 2012 and 2013 at 100% whereas in prior or later years this is set to be 0%. If you were to open the project plan, say in 2011, the Max. column will list 0% whereas if you open the file in 2012, the Max. column will automatically list 100%. 11. Double click on Mary James, and enter the following
on the Notes tab
Mary is an experienced manager
12. Click OK
Planning and Managing Projects with Microsoft Project Professional 2013 Exercises
© UMT Institute Page 39 of 109
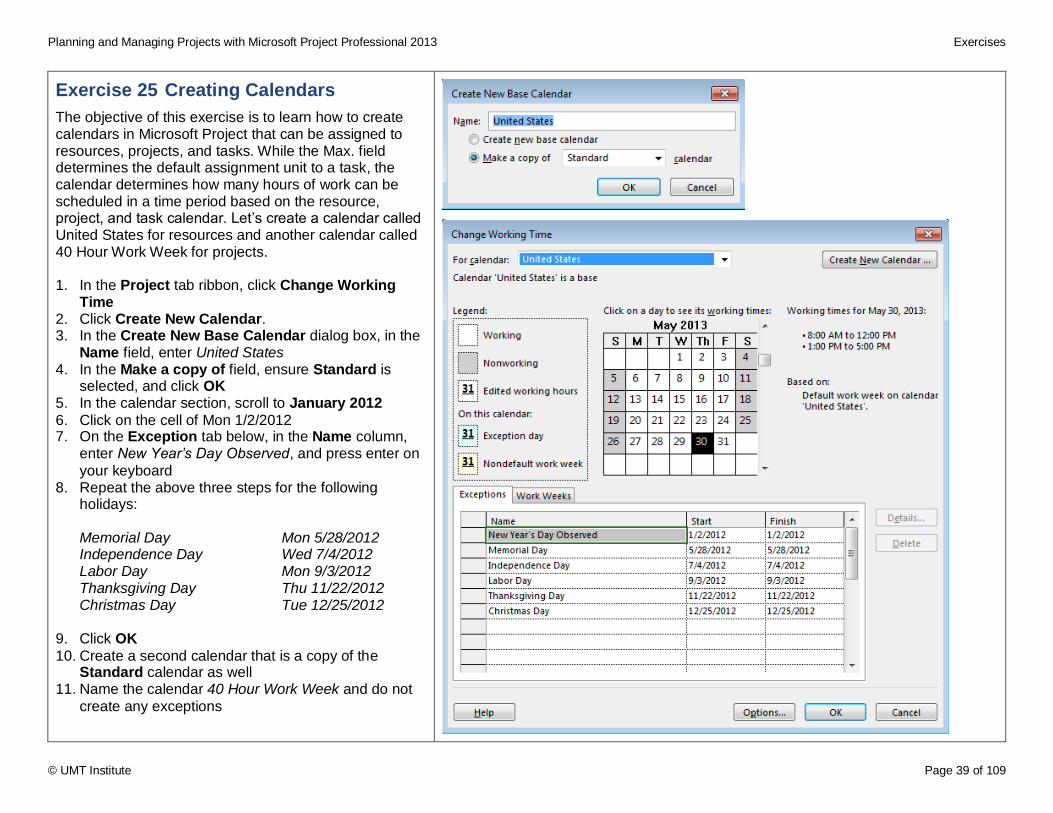
Exercise 25 Creating Calendars
The objective of this exercise is to learn how to create calendars in Microsoft Project that can be assigned to resources, projects, and tasks. While the Max. field determines the default assignment unit to a task, the calendar determines how many hours of work can be scheduled in a time period based on the resource, project, and task calendar. Let’s create a calendar called United States for resources and another calendar called 40 Hour Work Week for projects. 1. In the Project tab ribbon, click Change Working
Time 2. Click Create New Calendar. 3. In the Create New Base Calendar dialog box, in the
Name field, enter United States 4. In the Make a copy of field, ensure Standard is
selected, and click OK 5. In the calendar section, scroll to January 2012
6. Click on the cell of Mon 1/2/2012 7. On the Exception tab below, in the Name column,
enter New Year’s Day Observed, and press enter on
your keyboard 8. Repeat the above three steps for the following
holidays:
Memorial Day Mon 5/28/2012 Independence Day Wed 7/4/2012 Labor Day Mon 9/3/2012 Thanksgiving Day Thu 11/22/2012 Christmas Day Tue 12/25/2012
9. Click OK
10. Create a second calendar that is a copy of the Standard calendar as well
11. Name the calendar 40 Hour Work Week and do not
create any exceptions
Planning and Managing Projects with Microsoft Project Professional 2013 Exercises
© UMT Institute Page 40 of 109
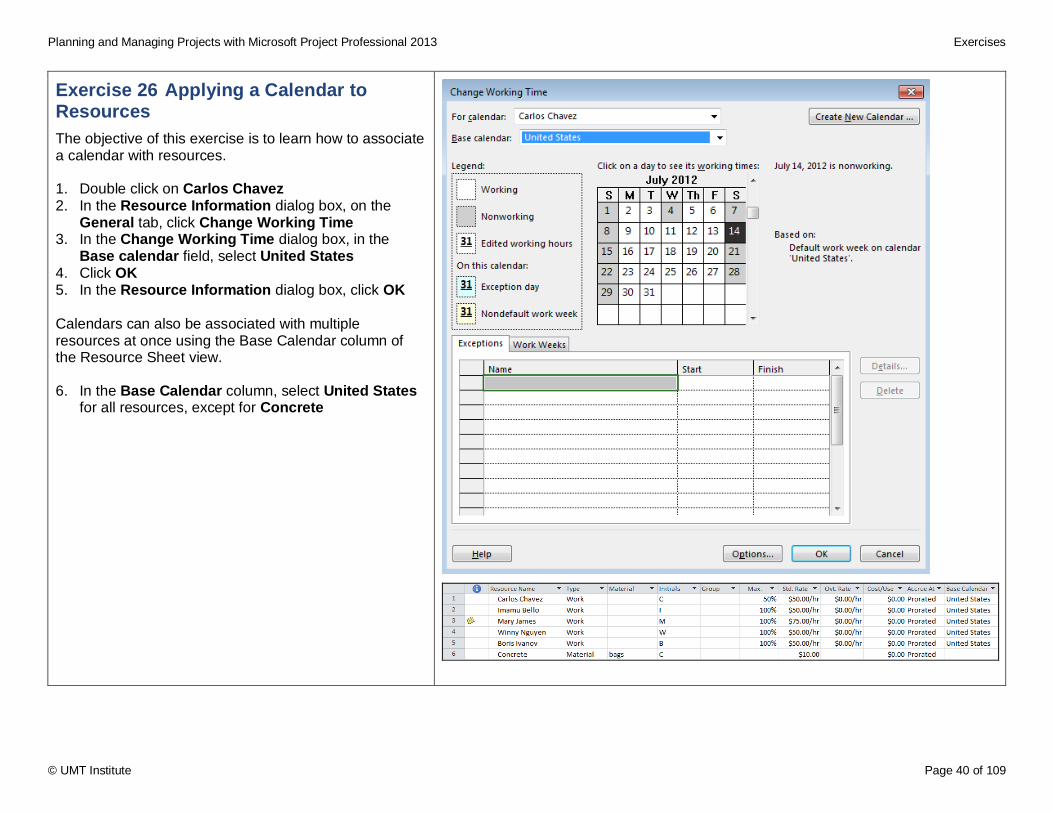
Exercise 26 Applying a Calendar to Resources
The objective of this exercise is to learn how to associate a calendar with resources. 1. Double click on Carlos Chavez 2. In the Resource Information dialog box, on the
General tab, click Change Working Time 3. In the Change Working Time dialog box, in the
Base calendar field, select United States 4. Click OK 5. In the Resource Information dialog box, click OK Calendars can also be associated with multiple resources at once using the Base Calendar column of the Resource Sheet view. 6. In the Base Calendar column, select United States
for all resources, except for Concrete
Planning and Managing Projects with Microsoft Project Professional 2013 Exercises
© UMT Institute Page 41 of 109
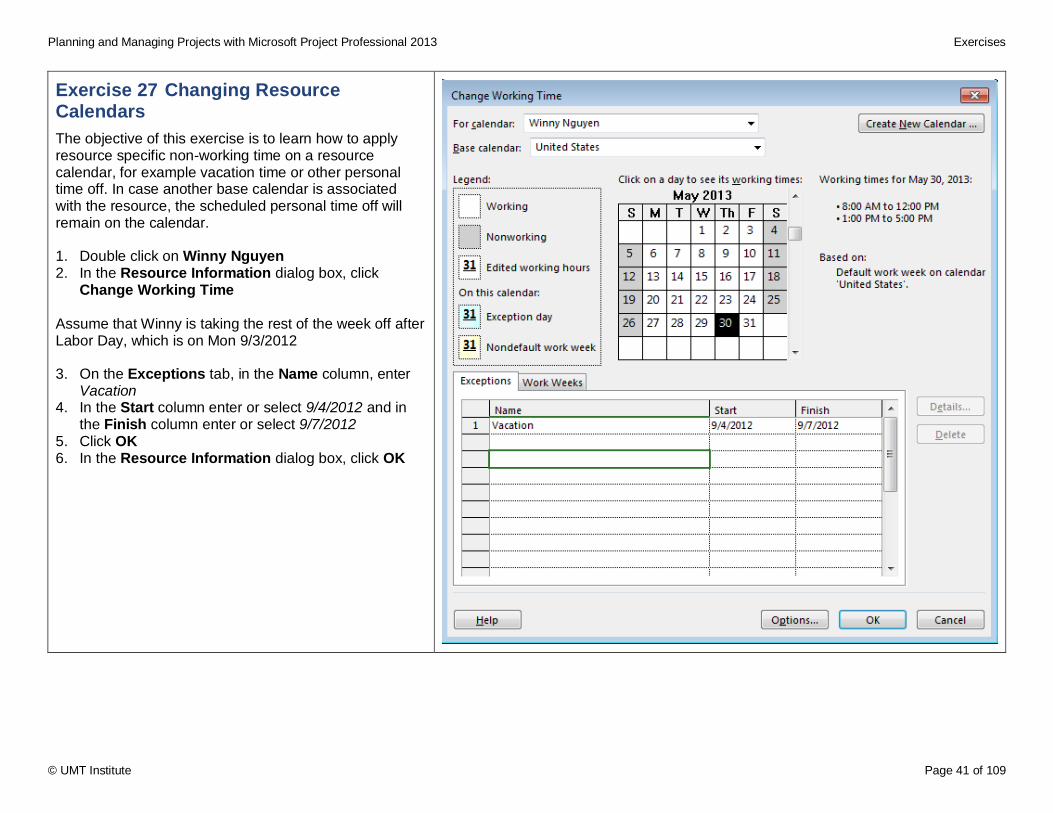
Exercise 27 Changing Resource Calendars
The objective of this exercise is to learn how to apply resource specific non-working time on a resource calendar, for example vacation time or other personal time off. In case another base calendar is associated with the resource, the scheduled personal time off will remain on the calendar. 1. Double click on Winny Nguyen 2. In the Resource Information dialog box, click
Change Working Time Assume that Winny is taking the rest of the week off after Labor Day, which is on Mon 9/3/2012 3. On the Exceptions tab, in the Name column, enter
Vacation 4. In the Start column enter or select 9/4/2012 and in
the Finish column enter or select 9/7/2012 5. Click OK 6. In the Resource Information dialog box, click OK
Planning and Managing Projects with Microsoft Project Professional 2013 Exercises
© UMT Institute Page 42 of 109
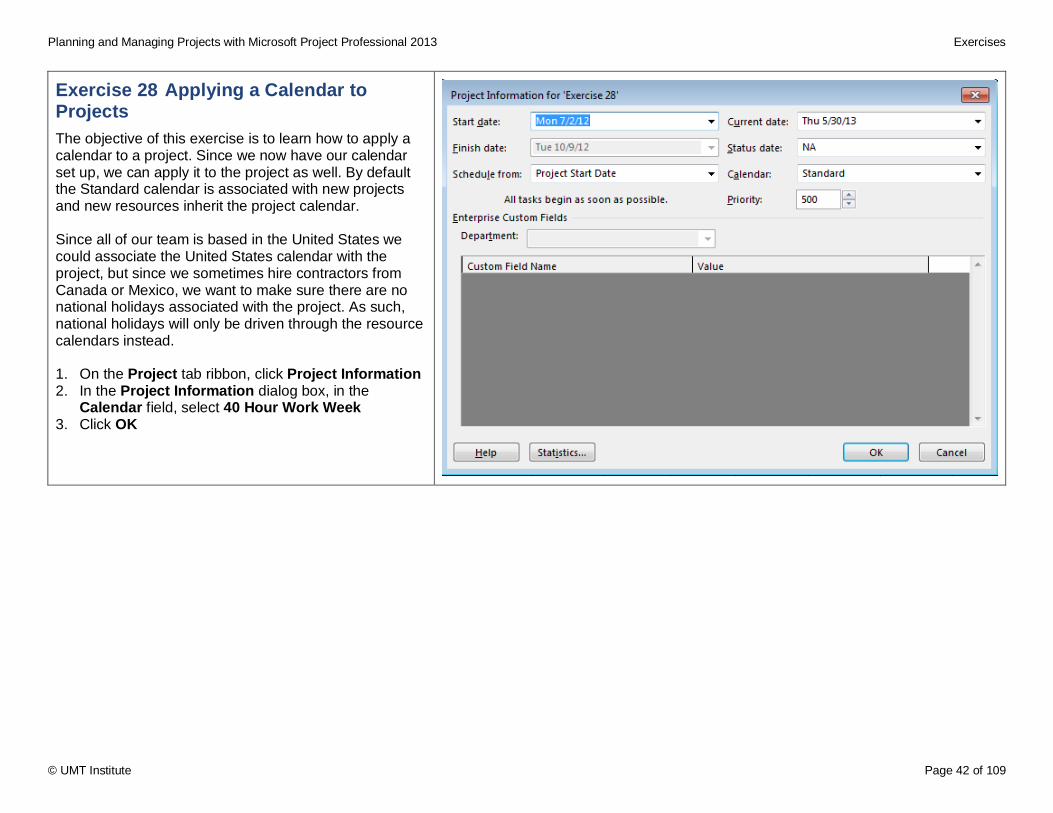
Exercise 28 Applying a Calendar to Projects
The objective of this exercise is to learn how to apply a calendar to a project. Since we now have our calendar set up, we can apply it to the project as well. By default the Standard calendar is associated with new projects and new resources inherit the project calendar. Since all of our team is based in the United States we could associate the United States calendar with the project, but since we sometimes hire contractors from Canada or Mexico, we want to make sure there are no national holidays associated with the project. As such, national holidays will only be driven through the resource calendars instead. 1. On the Project tab ribbon, click Project Information 2. In the Project Information dialog box, in the
Calendar field, select 40 Hour Work Week 3. Click OK
Planning and Managing Projects with Microsoft Project Professional 2013 Exercises
© UMT Institute Page 43 of 109
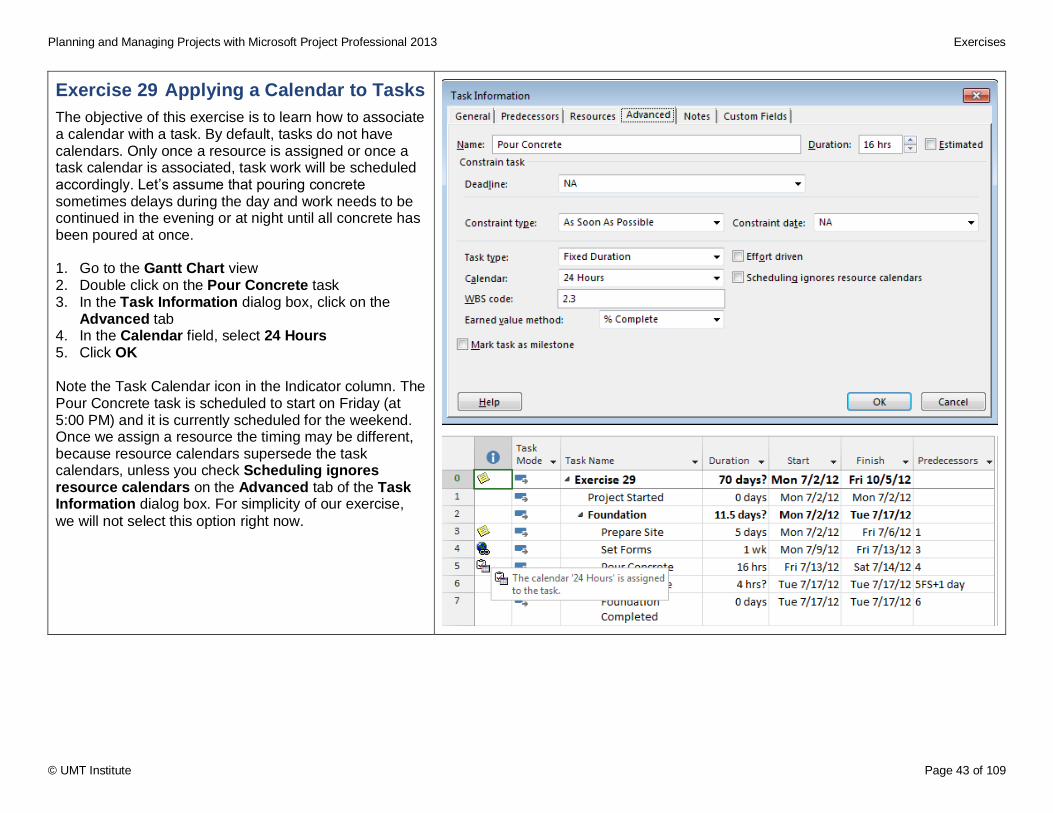
Exercise 29 Applying a Calendar to Tasks
The objective of this exercise is to learn how to associate a calendar with a task. By default, tasks do not have calendars. Only once a resource is assigned or once a task calendar is associated, task work will be scheduled accordingly. Let’s assume that pouring concrete sometimes delays during the day and work needs to be continued in the evening or at night until all concrete has been poured at once. 1. Go to the Gantt Chart view 2. Double click on the Pour Concrete task 3. In the Task Information dialog box, click on the
Advanced tab 4. In the Calendar field, select 24 Hours 5. Click OK
Note the Task Calendar icon in the Indicator column. The Pour Concrete task is scheduled to start on Friday (at 5:00 PM) and it is currently scheduled for the weekend. Once we assign a resource the timing may be different, because resource calendars supersede the task calendars, unless you check Scheduling ignores resource calendars on the Advanced tab of the Task Information dialog box. For simplicity of our exercise,
we will not select this option right now.
Planning and Managing Projects with Microsoft Project Professional 2013 Exercises
© UMT Institute Page 44 of 109
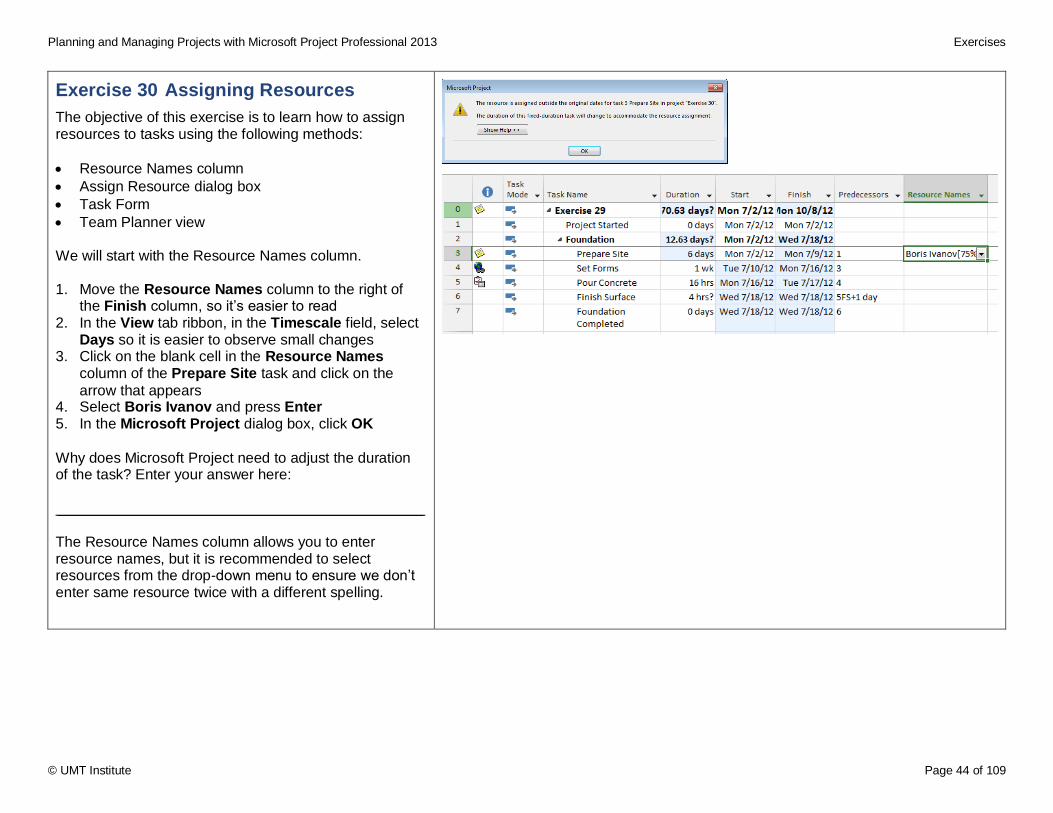
Exercise 30 Assigning Resources
The objective of this exercise is to learn how to assign resources to tasks using the following methods:
Resource Names column
Assign Resource dialog box
Task Form
Team Planner view We will start with the Resource Names column. 1. Move the Resource Names column to the right of
the Finish column, so it’s easier to read 2. In the View tab ribbon, in the Timescale field, select
Days so it is easier to observe small changes 3. Click on the blank cell in the Resource Names
column of the Prepare Site task and click on the
arrow that appears 4. Select Boris Ivanov and press Enter 5. In the Microsoft Project dialog box, click OK
Why does Microsoft Project need to adjust the duration of the task? Enter your answer here: ____________________________________________ The Resource Names column allows you to enter resource names, but it is recommended to select resources from the drop-down menu to ensure we don’t enter same resource twice with a different spelling.
Planning and Managing Projects with Microsoft Project Professional 2013 Exercises
© UMT Institute Page 45 of 109
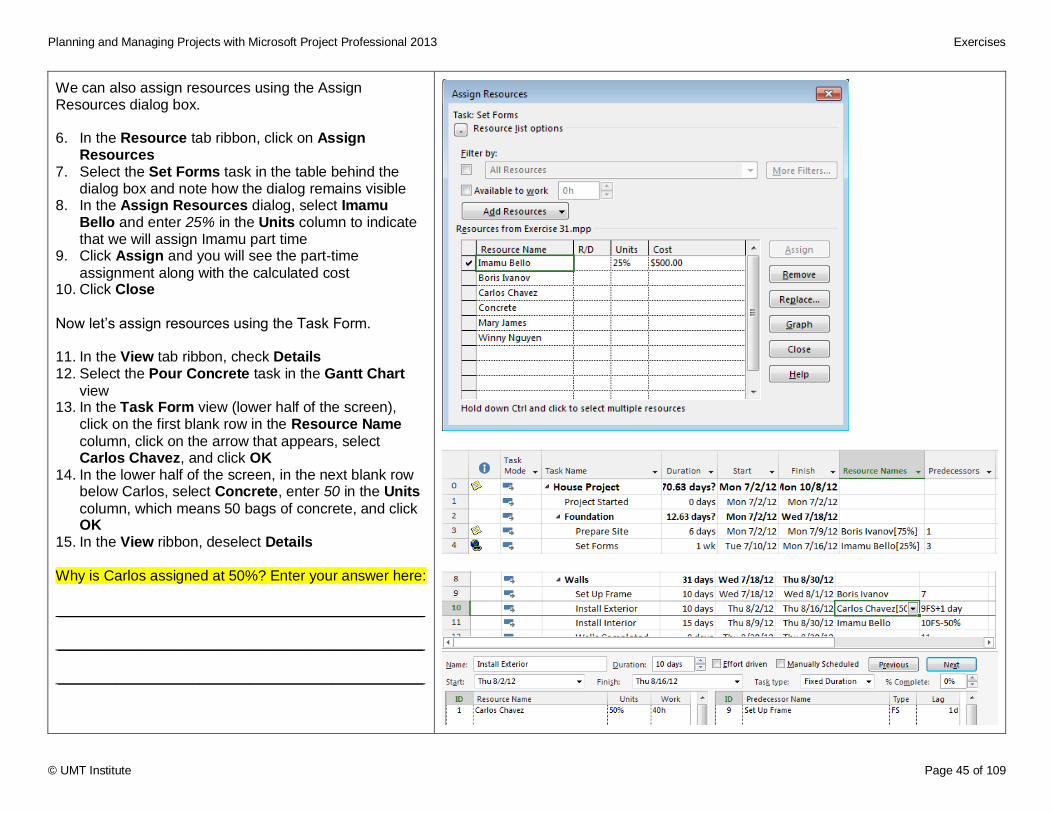
We can also assign resources using the Assign Resources dialog box. 6. In the Resource tab ribbon, click on Assign
Resources 7. Select the Set Forms task in the table behind the
dialog box and note how the dialog remains visible 8. In the Assign Resources dialog, select Imamu
Bello and enter 25% in the Units column to indicate that we will assign Imamu part time
9. Click Assign and you will see the part-time
assignment along with the calculated cost 10. Click Close
Now let’s assign resources using the Task Form. 11. In the View tab ribbon, check Details 12. Select the Pour Concrete task in the Gantt Chart
view 13. In the Task Form view (lower half of the screen),
click on the first blank row in the Resource Name
column, click on the arrow that appears, select Carlos Chavez, and click OK
14. In the lower half of the screen, in the next blank row below Carlos, select Concrete, enter 50 in the Units
column, which means 50 bags of concrete, and click OK
15. In the View ribbon, deselect Details
Why is Carlos assigned at 50%? Enter your answer here: ____________________________________________ ____________________________________________ ____________________________________________
Planning and Managing Projects with Microsoft Project Professional 2013 Exercises
© UMT Institute Page 46 of 109
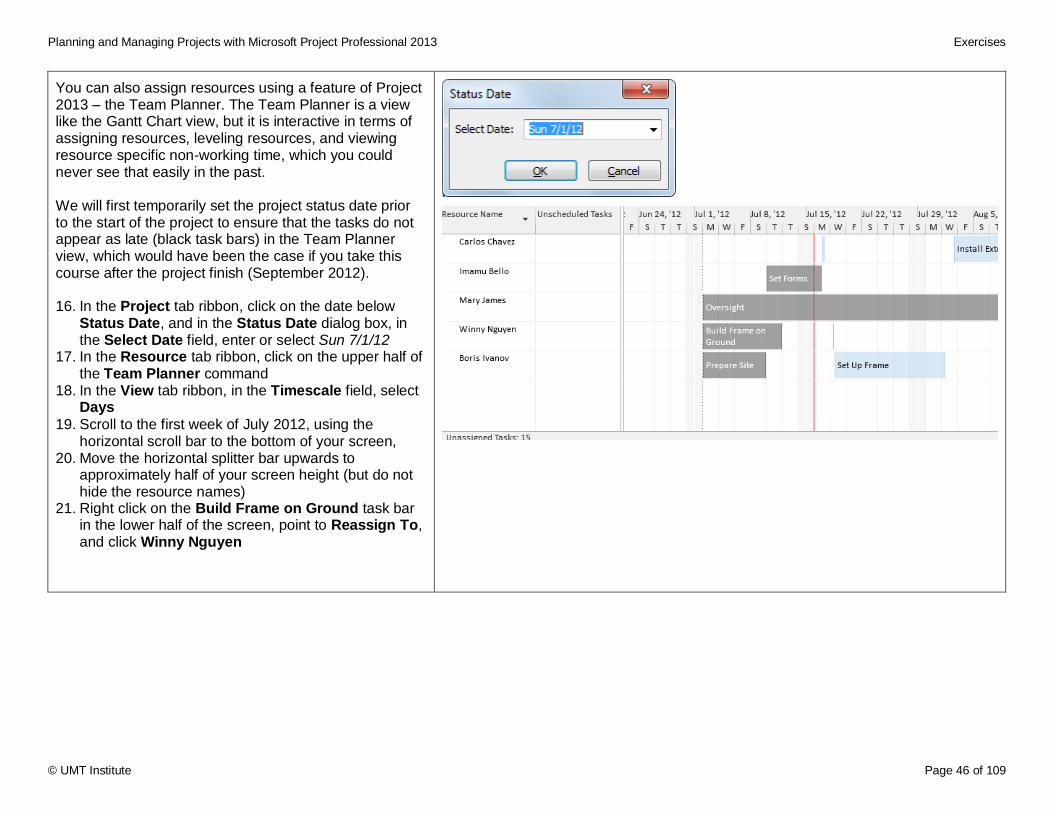
You can also assign resources using a feature of Project 2013 – the Team Planner. The Team Planner is a view like the Gantt Chart view, but it is interactive in terms of assigning resources, leveling resources, and viewing resource specific non-working time, which you could never see that easily in the past. We will first temporarily set the project status date prior to the start of the project to ensure that the tasks do not appear as late (black task bars) in the Team Planner view, which would have been the case if you take this course after the project finish (September 2012). 16. In the Project tab ribbon, click on the date below
Status Date, and in the Status Date dialog box, in the Select Date field, enter or select Sun 7/1/12
17. In the Resource tab ribbon, click on the upper half of the Team Planner command
18. In the View tab ribbon, in the Timescale field, select Days
19. Scroll to the first week of July 2012, using the horizontal scroll bar to the bottom of your screen,
20. Move the horizontal splitter bar upwards to approximately half of your screen height (but do not hide the resource names)
21. Right click on the Build Frame on Ground task bar in the lower half of the screen, point to Reassign To, and click Winny Nguyen
Planning and Managing Projects with Microsoft Project Professional 2013 Exercises
© UMT Institute Page 47 of 109
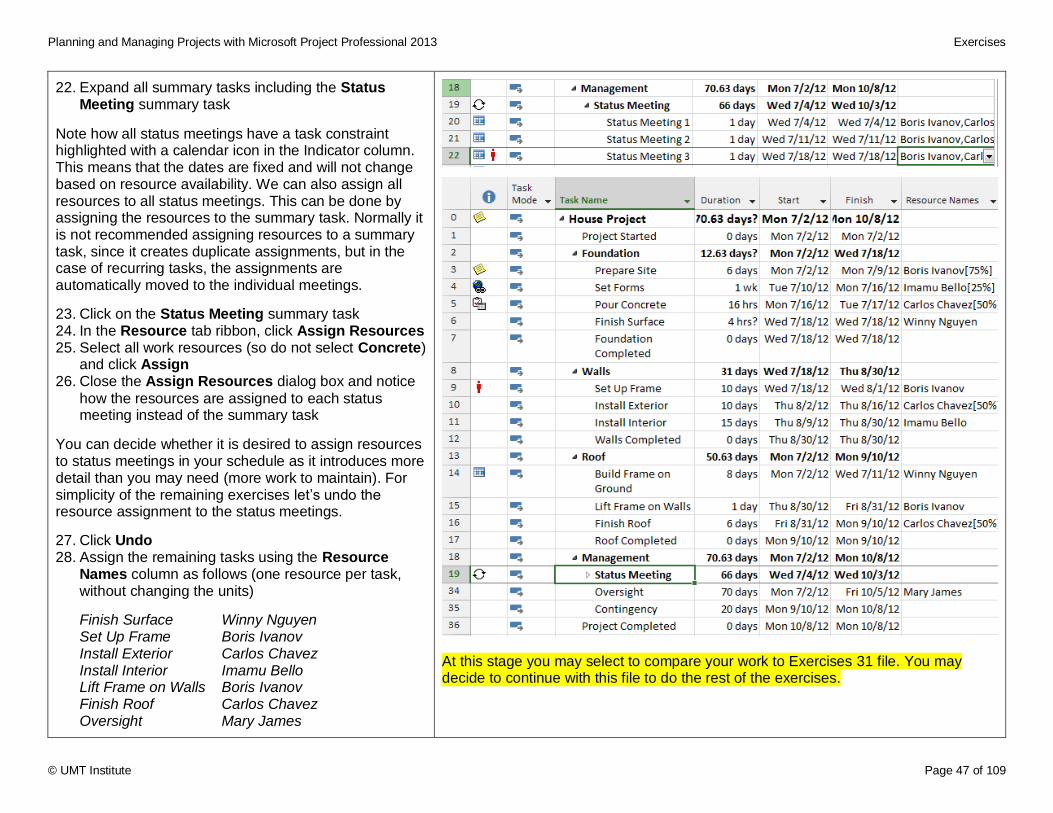
22. Expand all summary tasks including the Status Meeting summary task
Note how all status meetings have a task constraint highlighted with a calendar icon in the Indicator column. This means that the dates are fixed and will not change based on resource availability. We can also assign all resources to all status meetings. This can be done by assigning the resources to the summary task. Normally it is not recommended assigning resources to a summary task, since it creates duplicate assignments, but in the case of recurring tasks, the assignments are automatically moved to the individual meetings.
23. Click on the Status Meeting summary task 24. In the Resource tab ribbon, click Assign Resources 25. Select all work resources (so do not select Concrete)
and click Assign 26. Close the Assign Resources dialog box and notice
how the resources are assigned to each status meeting instead of the summary task
You can decide whether it is desired to assign resources to status meetings in your schedule as it introduces more detail than you may need (more work to maintain). For simplicity of the remaining exercises let’s undo the resource assignment to the status meetings.
27. Click Undo 28. Assign the remaining tasks using the Resource
Names column as follows (one resource per task, without changing the units)
Finish Surface Winny Nguyen Set Up Frame Boris Ivanov Install Exterior Carlos Chavez Install Interior Imamu Bello Lift Frame on Walls Boris Ivanov Finish Roof Carlos Chavez Oversight Mary James
At this stage you may select to compare your work to Exercises 31 file. You may decide to continue with this file to do the rest of the exercises.
Planning and Managing Projects with Microsoft Project Professional 2013 Exercises
© UMT Institute Page 48 of 109
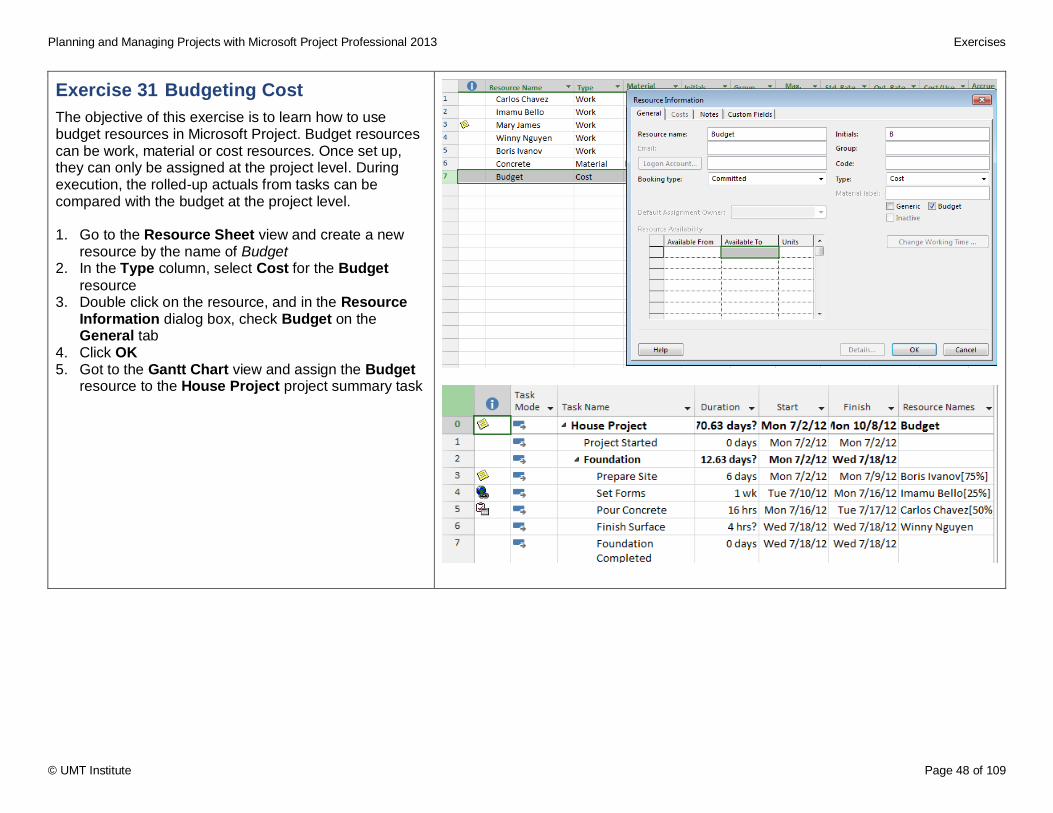
Exercise 31 Budgeting Cost
The objective of this exercise is to learn how to use budget resources in Microsoft Project. Budget resources can be work, material or cost resources. Once set up, they can only be assigned at the project level. During execution, the rolled-up actuals from tasks can be compared with the budget at the project level. 1. Go to the Resource Sheet view and create a new
resource by the name of Budget 2. In the Type column, select Cost for the Budget
resource 3. Double click on the resource, and in the Resource
Information dialog box, check Budget on the General tab
4. Click OK 5. Got to the Gantt Chart view and assign the Budget
resource to the House Project project summary task
Planning and Managing Projects with Microsoft Project Professional 2013 Exercises
© UMT Institute Page 49 of 109
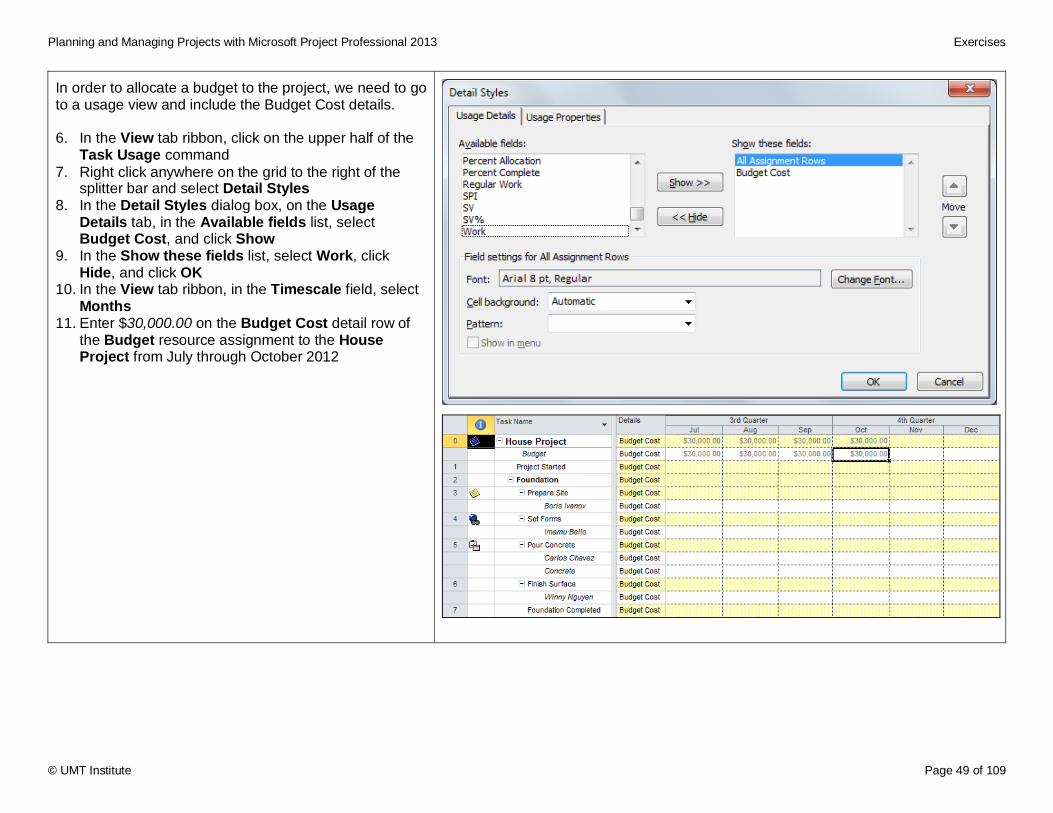
In order to allocate a budget to the project, we need to go to a usage view and include the Budget Cost details. 6. In the View tab ribbon, click on the upper half of the
Task Usage command
7. Right click anywhere on the grid to the right of the splitter bar and select Detail Styles
8. In the Detail Styles dialog box, on the Usage Details tab, in the Available fields list, select Budget Cost, and click Show
9. In the Show these fields list, select Work, click Hide, and click OK
10. In the View tab ribbon, in the Timescale field, select Months
11. Enter $30,000.00 on the Budget Cost detail row of the Budget resource assignment to the House Project from July through October 2012
Planning and Managing Projects with Microsoft Project Professional 2013 Exercises
© UMT Institute Page 50 of 109
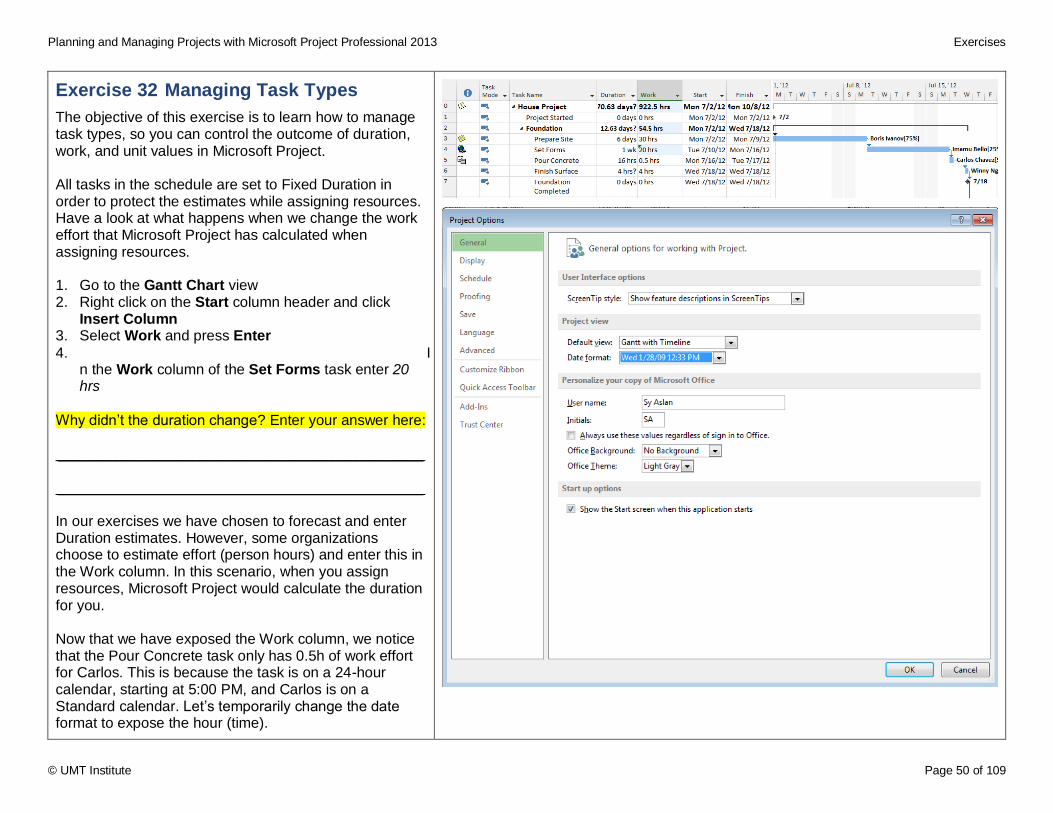
Exercise 32 Managing Task Types
The objective of this exercise is to learn how to manage task types, so you can control the outcome of duration, work, and unit values in Microsoft Project. All tasks in the schedule are set to Fixed Duration in order to protect the estimates while assigning resources. Have a look at what happens when we change the work effort that Microsoft Project has calculated when assigning resources. 1. Go to the Gantt Chart view 2. Right click on the Start column header and click
Insert Column 3. Select Work and press Enter
4. In the Work column of the Set Forms task enter 20 hrs
Why didn’t the duration change? Enter your answer here: ____________________________________________ ____________________________________________ In our exercises we have chosen to forecast and enter Duration estimates. However, some organizations choose to estimate effort (person hours) and enter this in the Work column. In this scenario, when you assign resources, Microsoft Project would calculate the duration for you. Now that we have exposed the Work column, we notice that the Pour Concrete task only has 0.5h of work effort for Carlos. This is because the task is on a 24-hour calendar, starting at 5:00 PM, and Carlos is on a Standard calendar. Let’s temporarily change the date format to expose the hour (time).
Planning and Managing Projects with Microsoft Project Professional 2013 Exercises
© UMT Institute Page 51 of 109
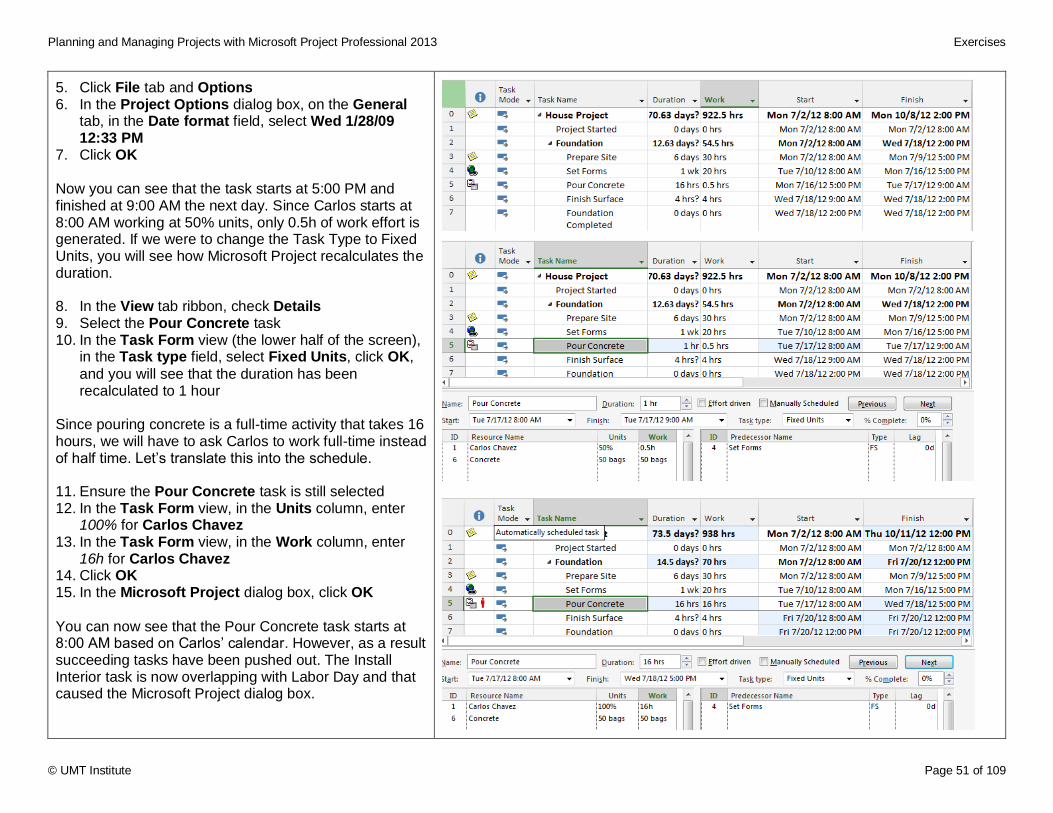
5. Click File tab and Options 6. In the Project Options dialog box, on the General
tab, in the Date format field, select Wed 1/28/09 12:33 PM
7. Click OK
Now you can see that the task starts at 5:00 PM and finished at 9:00 AM the next day. Since Carlos starts at 8:00 AM working at 50% units, only 0.5h of work effort is generated. If we were to change the Task Type to Fixed Units, you will see how Microsoft Project recalculates the duration. 8. In the View tab ribbon, check Details 9. Select the Pour Concrete task 10. In the Task Form view (the lower half of the screen),
in the Task type field, select Fixed Units, click OK,
and you will see that the duration has been recalculated to 1 hour
Since pouring concrete is a full-time activity that takes 16 hours, we will have to ask Carlos to work full-time instead of half time. Let’s translate this into the schedule. 11. Ensure the Pour Concrete task is still selected 12. In the Task Form view, in the Units column, enter
100% for Carlos Chavez 13. In the Task Form view, in the Work column, enter
16h for Carlos Chavez 14. Click OK 15. In the Microsoft Project dialog box, click OK
You can now see that the Pour Concrete task starts at 8:00 AM based on Carlos’ calendar. However, as a result succeeding tasks have been pushed out. The Install Interior task is now overlapping with Labor Day and that caused the Microsoft Project dialog box.
Planning and Managing Projects with Microsoft Project Professional 2013 Exercises
© UMT Institute Page 52 of 109
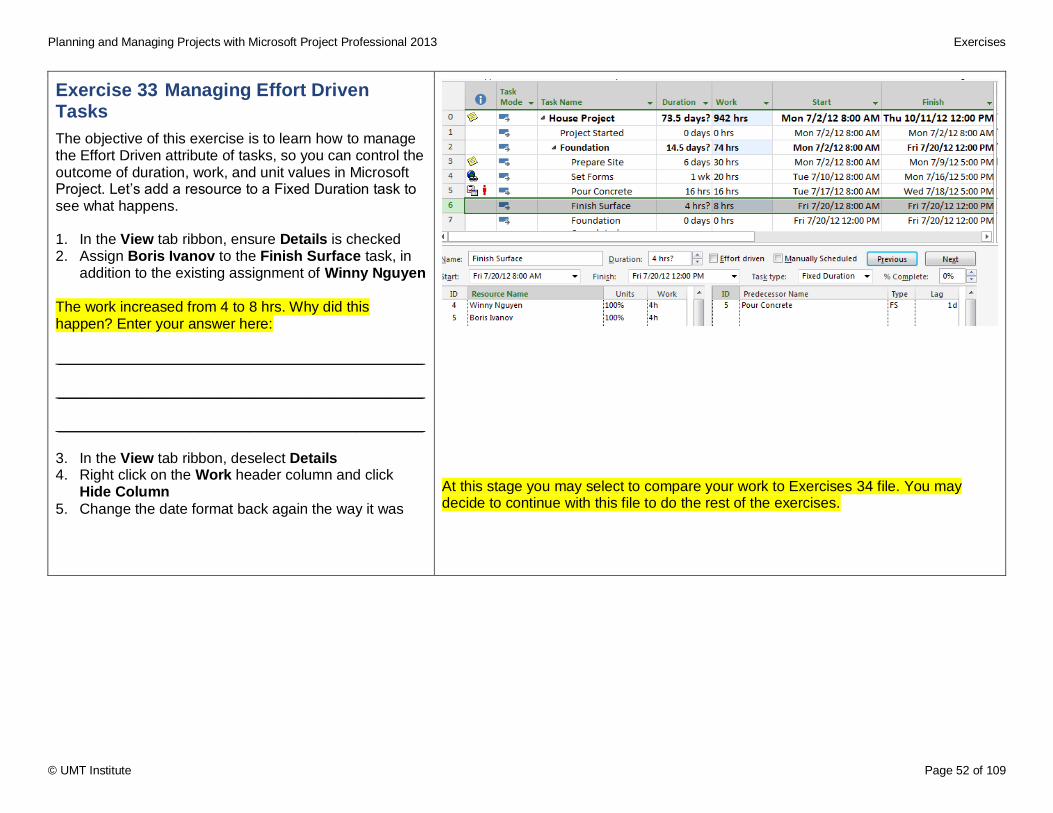
Exercise 33 Managing Effort Driven Tasks
The objective of this exercise is to learn how to manage the Effort Driven attribute of tasks, so you can control the outcome of duration, work, and unit values in Microsoft Project. Let’s add a resource to a Fixed Duration task to see what happens. 1. In the View tab ribbon, ensure Details is checked 2. Assign Boris Ivanov to the Finish Surface task, in
addition to the existing assignment of Winny Nguyen
The work increased from 4 to 8 hrs. Why did this happen? Enter your answer here: ____________________________________________ ____________________________________________ ____________________________________________ 3. In the View tab ribbon, deselect Details 4. Right click on the Work header column and click
Hide Column
5. Change the date format back again the way it was
At this stage you may select to compare your work to Exercises 34 file. You may decide to continue with this file to do the rest of the exercises.
Planning and Managing Projects with Microsoft Project Professional 2013 Exercises
© UMT Institute Page 53 of 109
Optimizing the Schedule
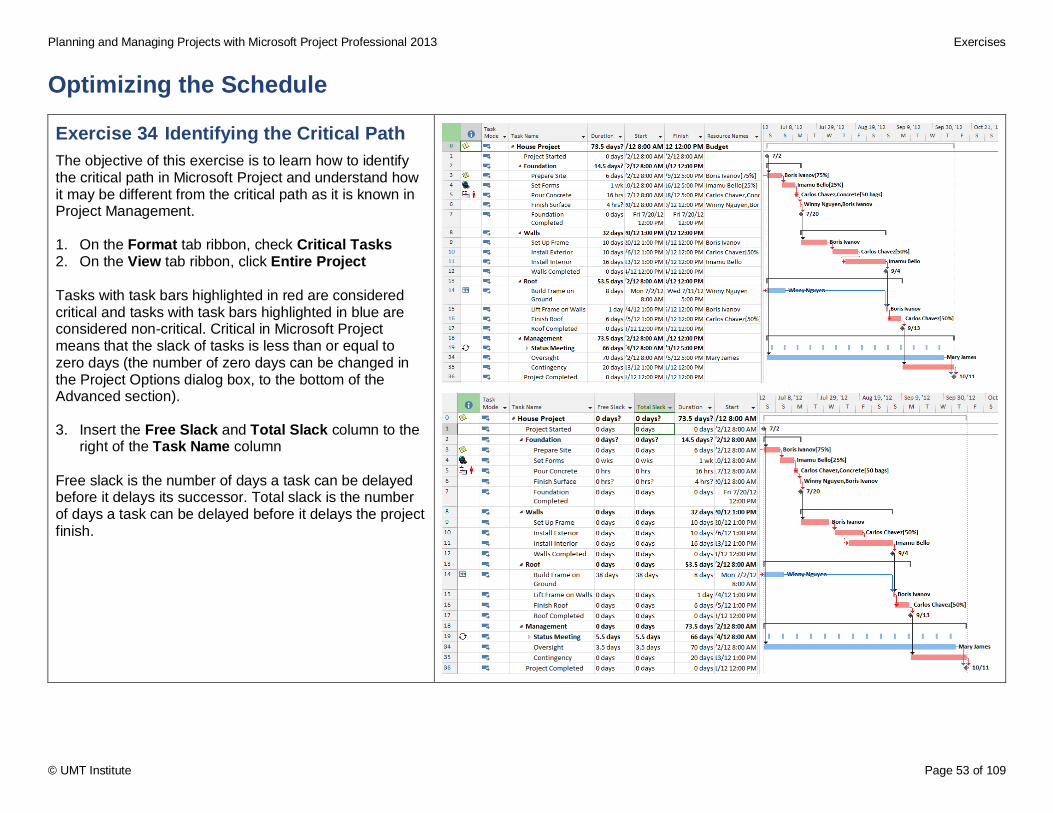
Exercise 34 Identifying the Critical Path
The objective of this exercise is to learn how to identify the critical path in Microsoft Project and understand how it may be different from the critical path as it is known in Project Management. 1. On the Format tab ribbon, check Critical Tasks 2. On the View tab ribbon, click Entire Project Tasks with task bars highlighted in red are considered critical and tasks with task bars highlighted in blue are considered non-critical. Critical in Microsoft Project means that the slack of tasks is less than or equal to zero days (the number of zero days can be changed in the Project Options dialog box, to the bottom of the Advanced section). 3. Insert the Free Slack and Total Slack column to the
right of the Task Name column
Free slack is the number of days a task can be delayed before it delays its successor. Total slack is the number of days a task can be delayed before it delays the project finish.
Planning and Managing Projects with Microsoft Project Professional 2013 Exercises
© UMT Institute Page 54 of 109
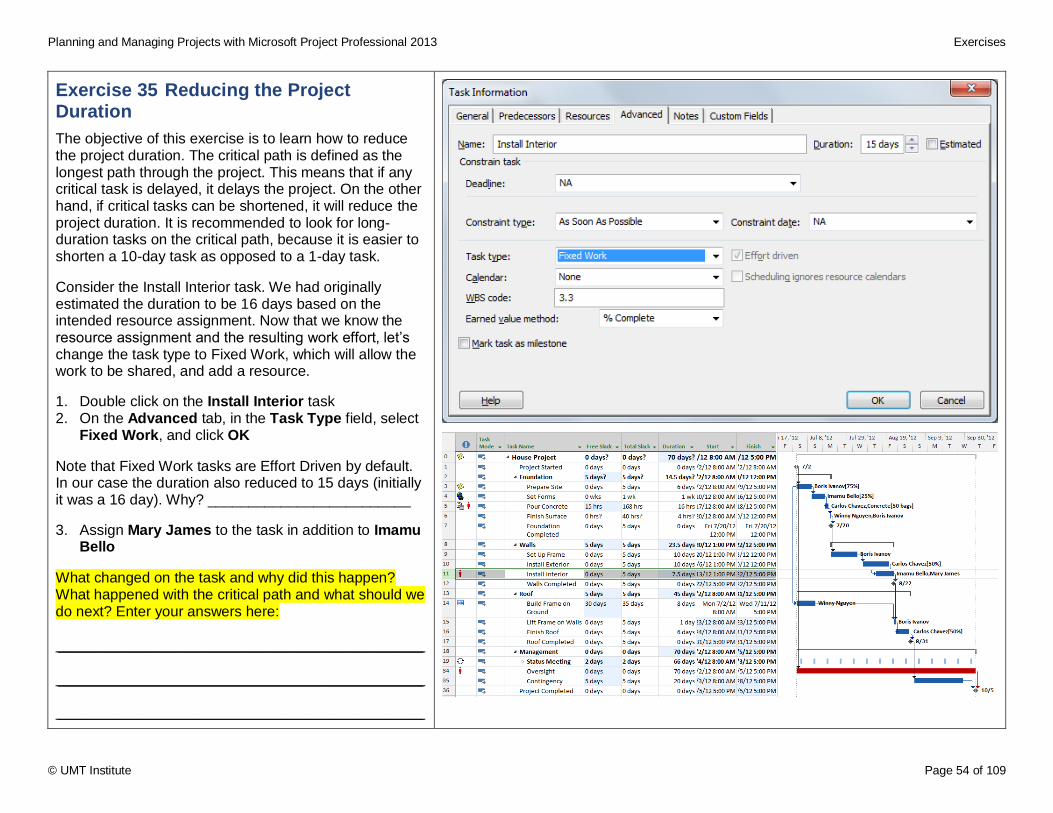
Exercise 35 Reducing the Project Duration
The objective of this exercise is to learn how to reduce the project duration. The critical path is defined as the longest path through the project. This means that if any critical task is delayed, it delays the project. On the other hand, if critical tasks can be shortened, it will reduce the project duration. It is recommended to look for long-duration tasks on the critical path, because it is easier to shorten a 10-day task as opposed to a 1-day task.
Consider the Install Interior task. We had originally estimated the duration to be 16 days based on the intended resource assignment. Now that we know the resource assignment and the resulting work effort, let’s change the task type to Fixed Work, which will allow the work to be shared, and add a resource.
1. Double click on the Install Interior task 2. On the Advanced tab, in the Task Type field, select
Fixed Work, and click OK
Note that Fixed Work tasks are Effort Driven by default. In our case the duration also reduced to 15 days (initially it was a 16 day). Why? _________________________
3. Assign Mary James to the task in addition to Imamu Bello
What changed on the task and why did this happen? What happened with the critical path and what should we do next? Enter your answers here: ____________________________________________ ____________________________________________ ____________________________________________
Planning and Managing Projects with Microsoft Project Professional 2013 Exercises
© UMT Institute Page 55 of 109
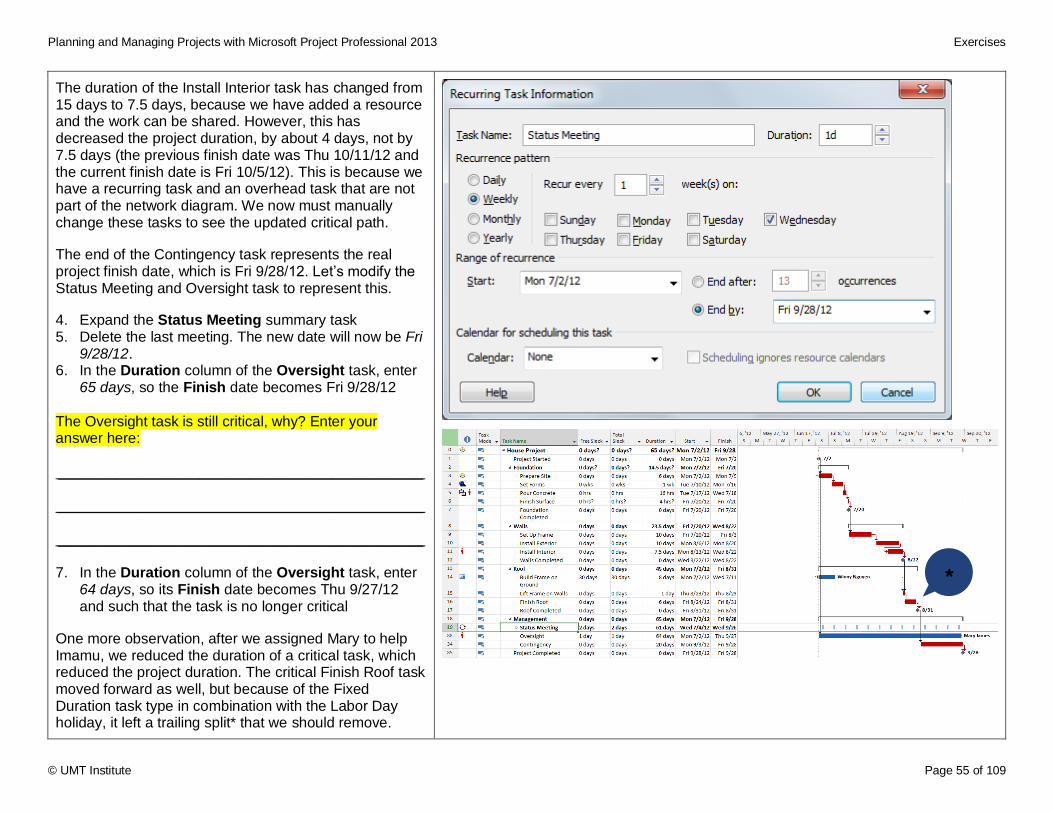
The duration of the Install Interior task has changed from 15 days to 7.5 days, because we have added a resource and the work can be shared. However, this has decreased the project duration, by about 4 days, not by 7.5 days (the previous finish date was Thu 10/11/12 and the current finish date is Fri 10/5/12). This is because we have a recurring task and an overhead task that are not part of the network diagram. We now must manually change these tasks to see the updated critical path.
The end of the Contingency task represents the real project finish date, which is Fri 9/28/12. Let’s modify the Status Meeting and Oversight task to represent this.
4. Expand the Status Meeting summary task 5. Delete the last meeting. The new date will now be Fri
9/28/12. 6. In the Duration column of the Oversight task, enter
65 days, so the Finish date becomes Fri 9/28/12
The Oversight task is still critical, why? Enter your answer here: ____________________________________________ ____________________________________________ ____________________________________________ 7. In the Duration column of the Oversight task, enter
64 days, so its Finish date becomes Thu 9/27/12 and such that the task is no longer critical
One more observation, after we assigned Mary to help Imamu, we reduced the duration of a critical task, which reduced the project duration. The critical Finish Roof task moved forward as well, but because of the Fixed Duration task type in combination with the Labor Day holiday, it left a trailing split* that we should remove.
*
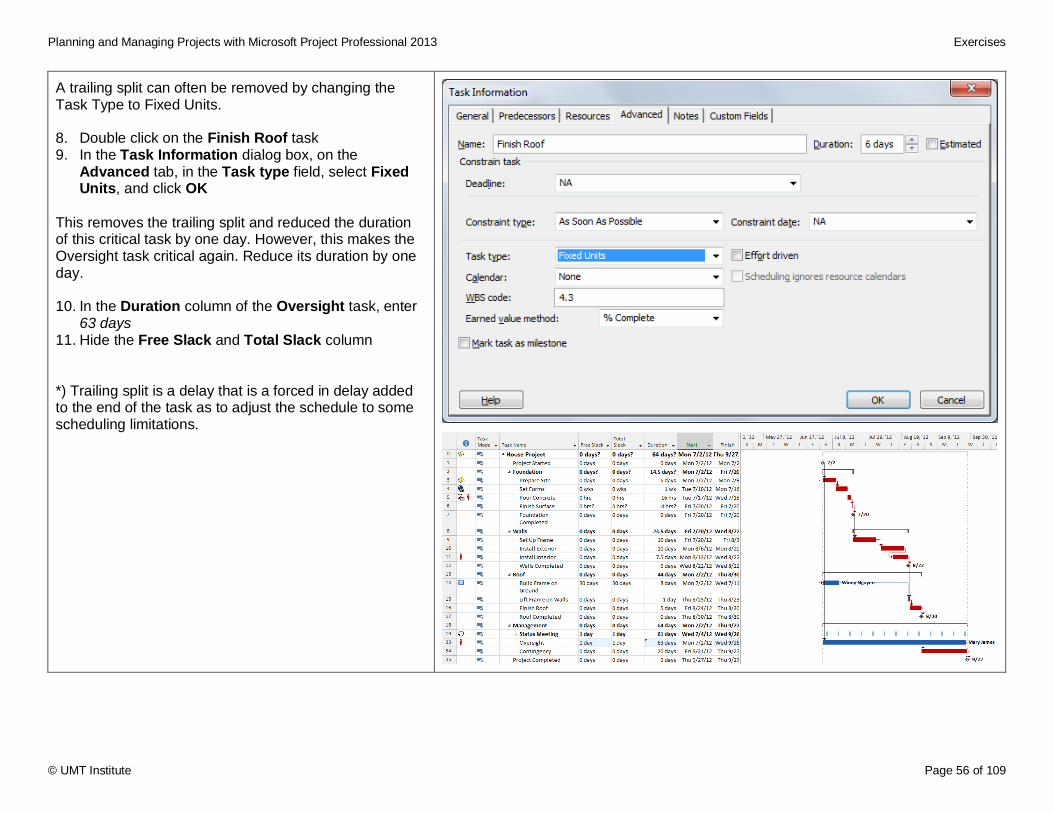
Planning and Managing Projects with Microsoft Project Professional 2013 Exercises
© UMT Institute Page 56 of 109
A trailing split can often be removed by changing the Task Type to Fixed Units. 8. Double click on the Finish Roof task 9. In the Task Information dialog box, on the
Advanced tab, in the Task type field, select Fixed Units, and click OK
This removes the trailing split and reduced the duration of this critical task by one day. However, this makes the Oversight task critical again. Reduce its duration by one day. 10. In the Duration column of the Oversight task, enter
63 days 11. Hide the Free Slack and Total Slack column *) Trailing split is a delay that is a forced in delay added to the end of the task as to adjust the schedule to some scheduling limitations.
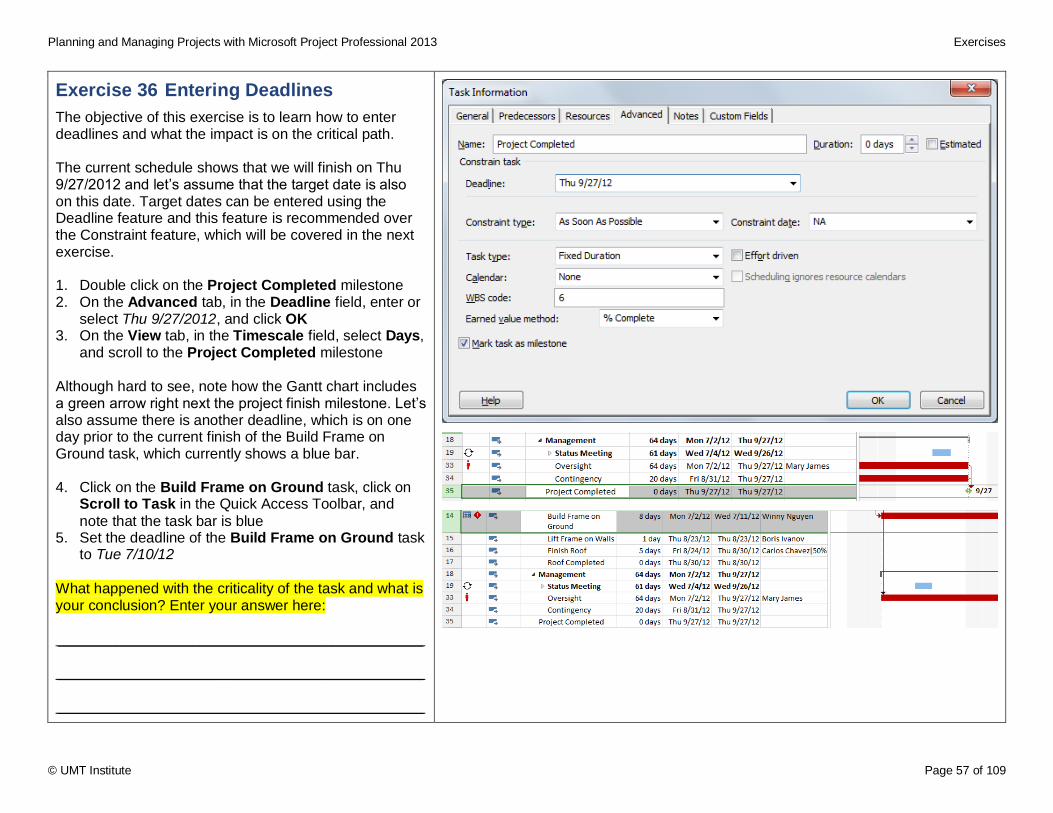
Planning and Managing Projects with Microsoft Project Professional 2013 Exercises
© UMT Institute Page 57 of 109
Exercise 36 Entering Deadlines
The objective of this exercise is to learn how to enter deadlines and what the impact is on the critical path. The current schedule shows that we will finish on Thu 9/27/2012 and let’s assume that the target date is also on this date. Target dates can be entered using the Deadline feature and this feature is recommended over the Constraint feature, which will be covered in the next exercise. 1. Double click on the Project Completed milestone 2. On the Advanced tab, in the Deadline field, enter or
select Thu 9/27/2012, and click OK 3. On the View tab, in the Timescale field, select Days,
and scroll to the Project Completed milestone
Although hard to see, note how the Gantt chart includes a green arrow right next the project finish milestone. Let’s also assume there is another deadline, which is on one day prior to the current finish of the Build Frame on Ground task, which currently shows a blue bar. 4. Click on the Build Frame on Ground task, click on
Scroll to Task in the Quick Access Toolbar, and
note that the task bar is blue 5. Set the deadline of the Build Frame on Ground task
to Tue 7/10/12
What happened with the criticality of the task and what is your conclusion? Enter your answer here: ____________________________________________ ____________________________________________ ____________________________________________
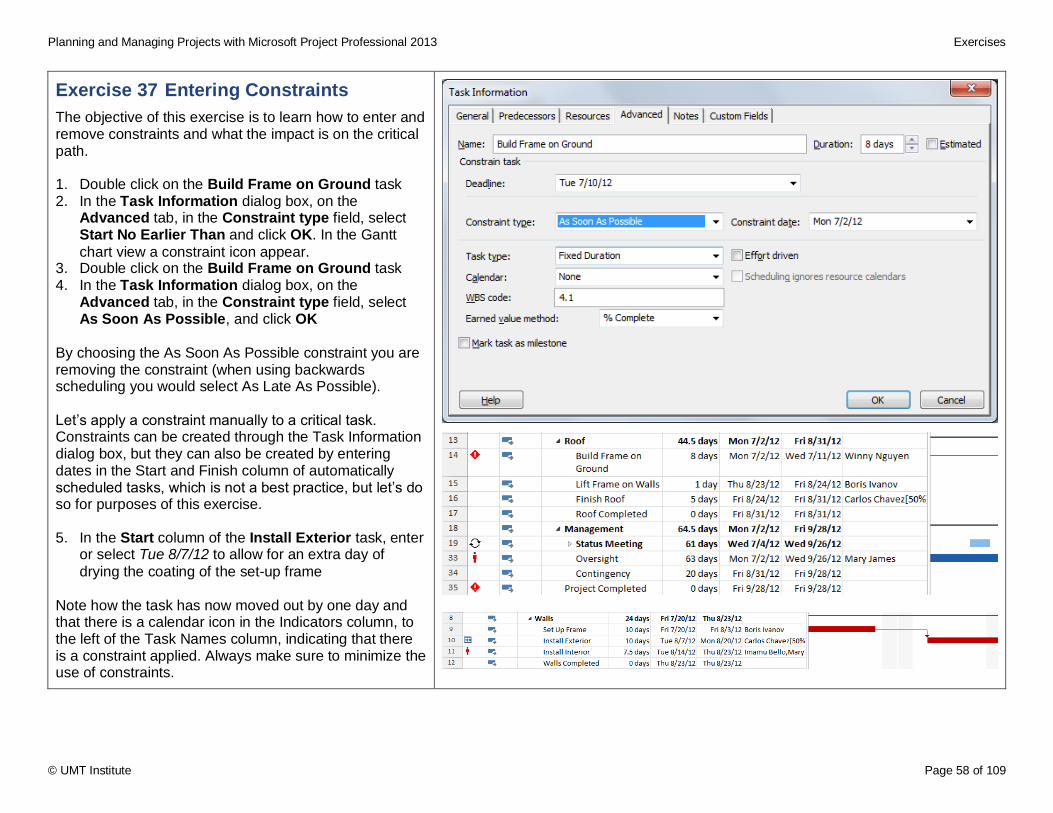
Planning and Managing Projects with Microsoft Project Professional 2013 Exercises
© UMT Institute Page 58 of 109
Exercise 37 Entering Constraints
The objective of this exercise is to learn how to enter and remove constraints and what the impact is on the critical path. 1. Double click on the Build Frame on Ground task 2. In the Task Information dialog box, on the
Advanced tab, in the Constraint type field, select Start No Earlier Than and click OK. In the Gantt
chart view a constraint icon appear. 3. Double click on the Build Frame on Ground task 4. In the Task Information dialog box, on the
Advanced tab, in the Constraint type field, select As Soon As Possible, and click OK
By choosing the As Soon As Possible constraint you are removing the constraint (when using backwards scheduling you would select As Late As Possible). Let’s apply a constraint manually to a critical task. Constraints can be created through the Task Information dialog box, but they can also be created by entering dates in the Start and Finish column of automatically scheduled tasks, which is not a best practice, but let’s do so for purposes of this exercise. 5. In the Start column of the Install Exterior task, enter
or select Tue 8/7/12 to allow for an extra day of
drying the coating of the set-up frame Note how the task has now moved out by one day and that there is a calendar icon in the Indicators column, to the left of the Task Names column, indicating that there is a constraint applied. Always make sure to minimize the use of constraints.
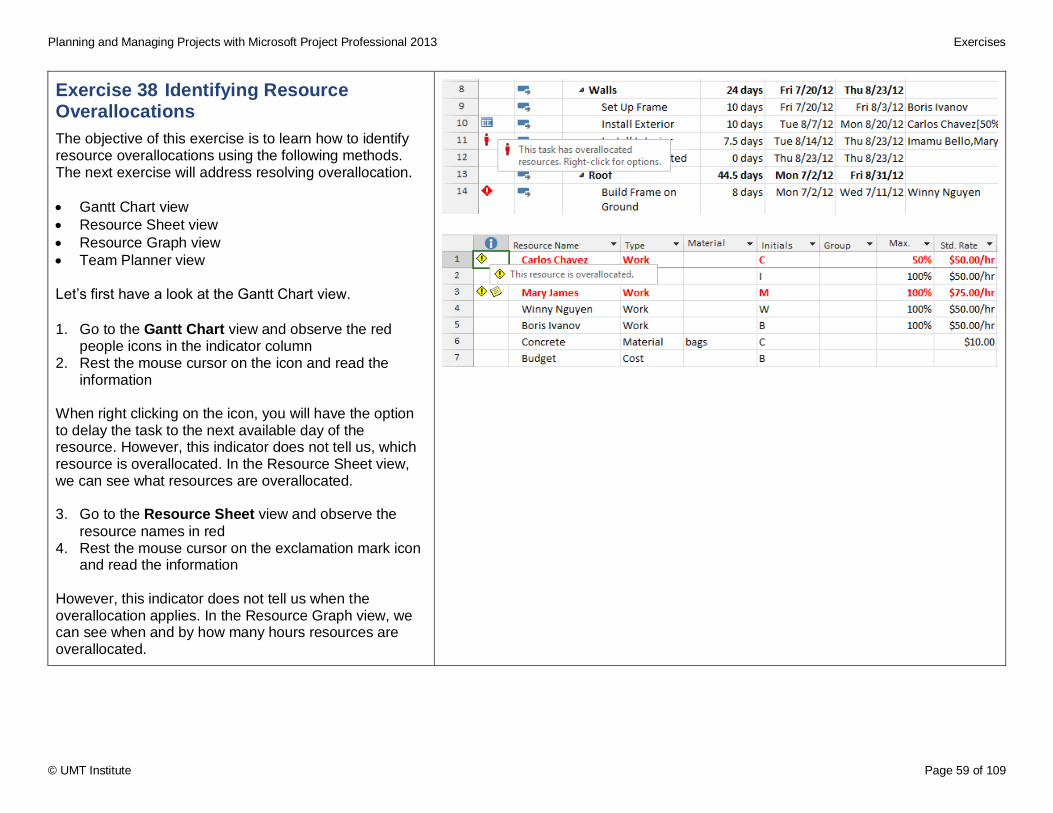
Planning and Managing Projects with Microsoft Project Professional 2013 Exercises
© UMT Institute Page 59 of 109
Exercise 38 Identifying Resource Overallocations
The objective of this exercise is to learn how to identify resource overallocations using the following methods. The next exercise will address resolving overallocation.
Gantt Chart view
Resource Sheet view
Resource Graph view
Team Planner view Let’s first have a look at the Gantt Chart view.
1. Go to the Gantt Chart view and observe the red people icons in the indicator column
2. Rest the mouse cursor on the icon and read the information
When right clicking on the icon, you will have the option to delay the task to the next available day of the resource. However, this indicator does not tell us, which resource is overallocated. In the Resource Sheet view, we can see what resources are overallocated. 3. Go to the Resource Sheet view and observe the
resource names in red 4. Rest the mouse cursor on the exclamation mark icon
and read the information However, this indicator does not tell us when the overallocation applies. In the Resource Graph view, we can see when and by how many hours resources are overallocated.
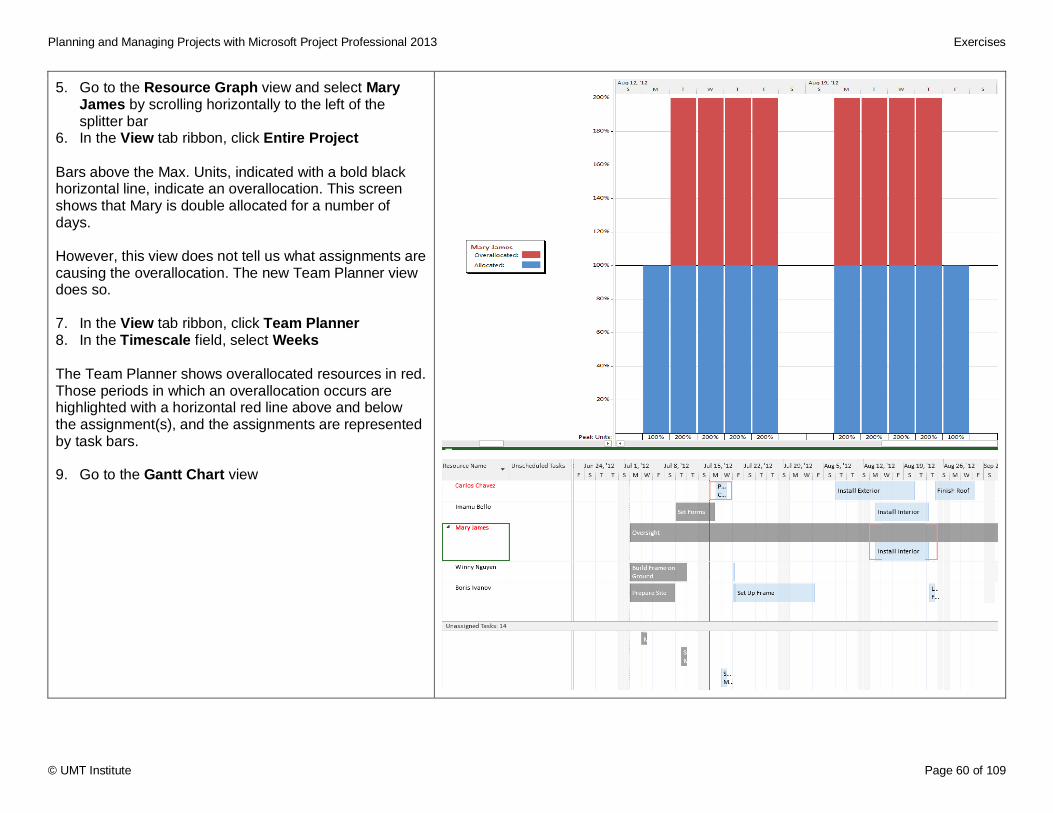
Planning and Managing Projects with Microsoft Project Professional 2013 Exercises
© UMT Institute Page 60 of 109
5. Go to the Resource Graph view and select Mary James by scrolling horizontally to the left of the splitter bar
6. In the View tab ribbon, click Entire Project
Bars above the Max. Units, indicated with a bold black horizontal line, indicate an overallocation. This screen shows that Mary is double allocated for a number of days. However, this view does not tell us what assignments are causing the overallocation. The new Team Planner view does so. 7. In the View tab ribbon, click Team Planner 8. In the Timescale field, select Weeks The Team Planner shows overallocated resources in red. Those periods in which an overallocation occurs are highlighted with a horizontal red line above and below the assignment(s), and the assignments are represented by task bars. 9. Go to the Gantt Chart view
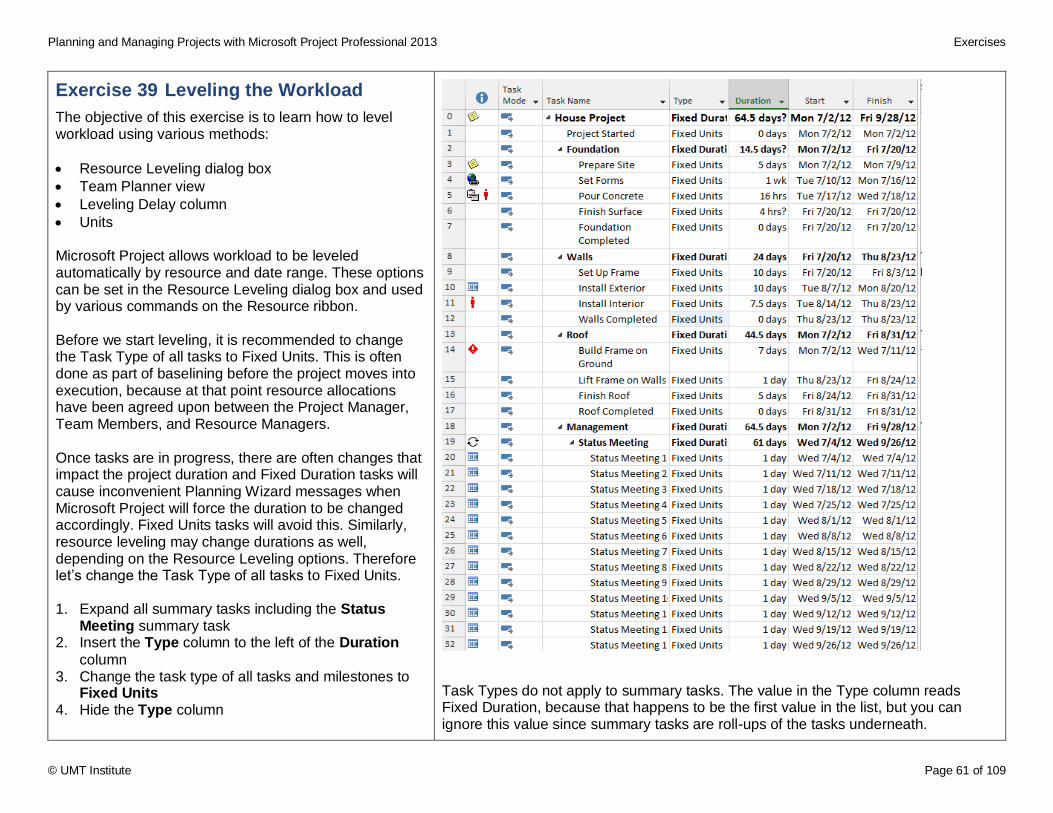
Planning and Managing Projects with Microsoft Project Professional 2013 Exercises
© UMT Institute Page 61 of 109
Exercise 39 Leveling the Workload
The objective of this exercise is to learn how to level workload using various methods:
Resource Leveling dialog box
Team Planner view
Leveling Delay column
Units Microsoft Project allows workload to be leveled automatically by resource and date range. These options can be set in the Resource Leveling dialog box and used by various commands on the Resource ribbon. Before we start leveling, it is recommended to change the Task Type of all tasks to Fixed Units. This is often done as part of baselining before the project moves into execution, because at that point resource allocations have been agreed upon between the Project Manager, Team Members, and Resource Managers. Once tasks are in progress, there are often changes that impact the project duration and Fixed Duration tasks will cause inconvenient Planning Wizard messages when Microsoft Project will force the duration to be changed accordingly. Fixed Units tasks will avoid this. Similarly, resource leveling may change durations as well, depending on the Resource Leveling options. Therefore let’s change the Task Type of all tasks to Fixed Units. 1. Expand all summary tasks including the Status
Meeting summary task 2. Insert the Type column to the left of the Duration
column 3. Change the task type of all tasks and milestones to
Fixed Units 4. Hide the Type column
Task Types do not apply to summary tasks. The value in the Type column reads Fixed Duration, because that happens to be the first value in the list, but you can ignore this value since summary tasks are roll-ups of the tasks underneath.
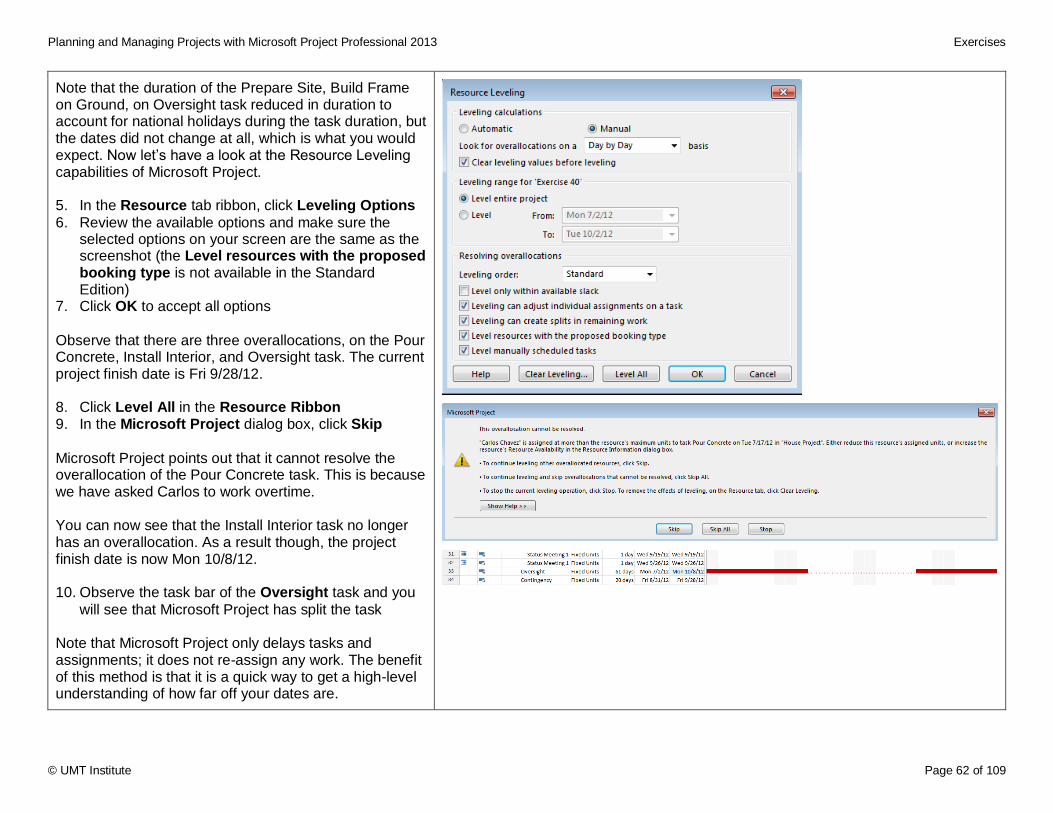
Planning and Managing Projects with Microsoft Project Professional 2013 Exercises
© UMT Institute Page 62 of 109
Note that the duration of the Prepare Site, Build Frame on Ground, on Oversight task reduced in duration to account for national holidays during the task duration, but the dates did not change at all, which is what you would expect. Now let’s have a look at the Resource Leveling capabilities of Microsoft Project. 5. In the Resource tab ribbon, click Leveling Options
6. Review the available options and make sure the selected options on your screen are the same as the screenshot (the Level resources with the proposed booking type is not available in the Standard Edition)
7. Click OK to accept all options
Observe that there are three overallocations, on the Pour Concrete, Install Interior, and Oversight task. The current project finish date is Fri 9/28/12. 8. Click Level All in the Resource Ribbon 9. In the Microsoft Project dialog box, click Skip
Microsoft Project points out that it cannot resolve the overallocation of the Pour Concrete task. This is because we have asked Carlos to work overtime. You can now see that the Install Interior task no longer has an overallocation. As a result though, the project finish date is now Mon 10/8/12. 10. Observe the task bar of the Oversight task and you
will see that Microsoft Project has split the task Note that Microsoft Project only delays tasks and assignments; it does not re-assign any work. The benefit of this method is that it is a quick way to get a high-level understanding of how far off your dates are.
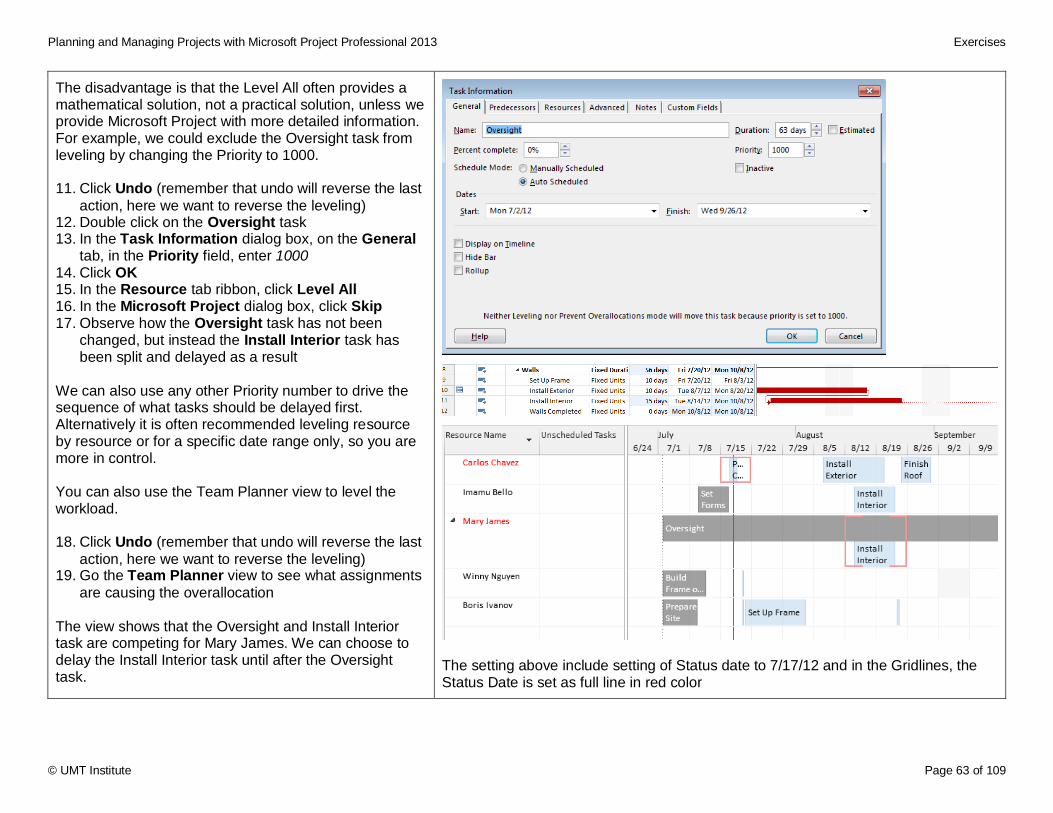
Planning and Managing Projects with Microsoft Project Professional 2013 Exercises
© UMT Institute Page 63 of 109
The disadvantage is that the Level All often provides a mathematical solution, not a practical solution, unless we provide Microsoft Project with more detailed information. For example, we could exclude the Oversight task from leveling by changing the Priority to 1000. 11. Click Undo (remember that undo will reverse the last
action, here we want to reverse the leveling) 12. Double click on the Oversight task 13. In the Task Information dialog box, on the General
tab, in the Priority field, enter 1000 14. Click OK 15. In the Resource tab ribbon, click Level All 16. In the Microsoft Project dialog box, click Skip 17. Observe how the Oversight task has not been
changed, but instead the Install Interior task has been split and delayed as a result
We can also use any other Priority number to drive the sequence of what tasks should be delayed first. Alternatively it is often recommended leveling resource by resource or for a specific date range only, so you are more in control. You can also use the Team Planner view to level the workload. 18. Click Undo (remember that undo will reverse the last
action, here we want to reverse the leveling) 19. Go the Team Planner view to see what assignments
are causing the overallocation The view shows that the Oversight and Install Interior task are competing for Mary James. We can choose to delay the Install Interior task until after the Oversight task.
The setting above include setting of Status date to 7/17/12 and in the Gridlines, the Status Date is set as full line in red color
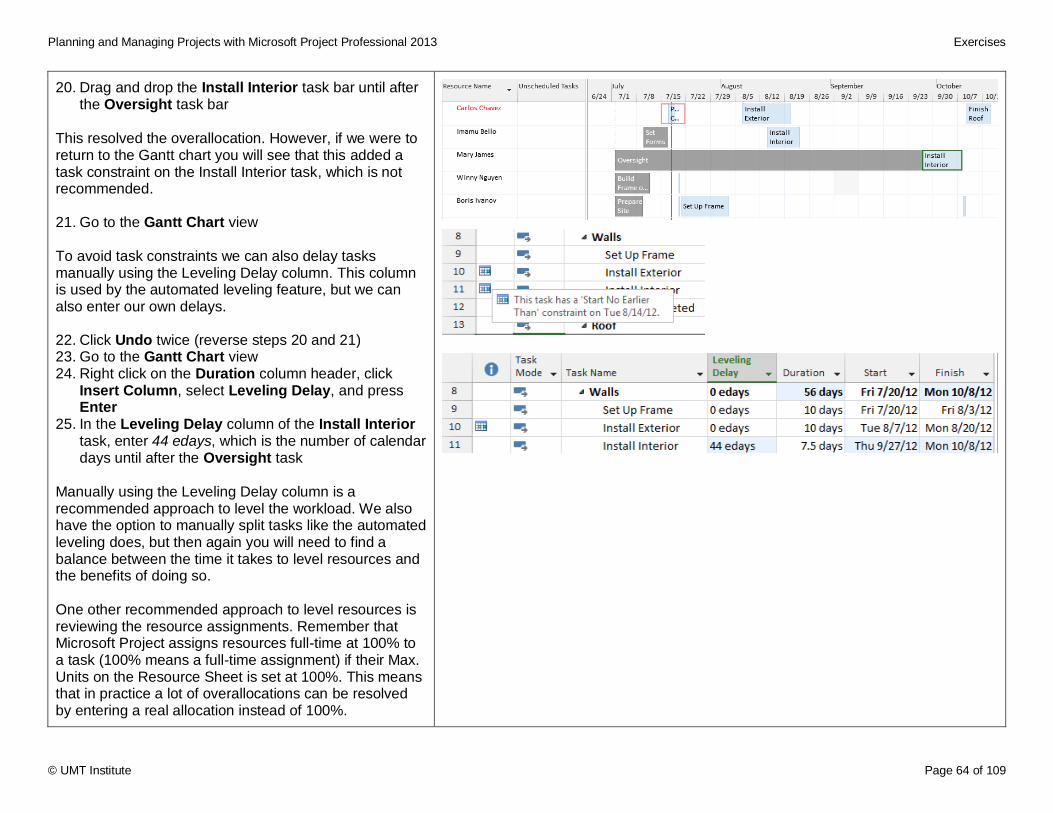
Planning and Managing Projects with Microsoft Project Professional 2013 Exercises
© UMT Institute Page 64 of 109
20. Drag and drop the Install Interior task bar until after the Oversight task bar
This resolved the overallocation. However, if we were to return to the Gantt chart you will see that this added a task constraint on the Install Interior task, which is not recommended. 21. Go to the Gantt Chart view To avoid task constraints we can also delay tasks manually using the Leveling Delay column. This column is used by the automated leveling feature, but we can also enter our own delays. 22. Click Undo twice (reverse steps 20 and 21) 23. Go to the Gantt Chart view 24. Right click on the Duration column header, click
Insert Column, select Leveling Delay, and press Enter
25. In the Leveling Delay column of the Install Interior task, enter 44 edays, which is the number of calendar days until after the Oversight task
Manually using the Leveling Delay column is a recommended approach to level the workload. We also have the option to manually split tasks like the automated leveling does, but then again you will need to find a balance between the time it takes to level resources and the benefits of doing so. One other recommended approach to level resources is reviewing the resource assignments. Remember that Microsoft Project assigns resources full-time at 100% to a task (100% means a full-time assignment) if their Max. Units on the Resource Sheet is set at 100%. This means that in practice a lot of overallocations can be resolved by entering a real allocation instead of 100%.
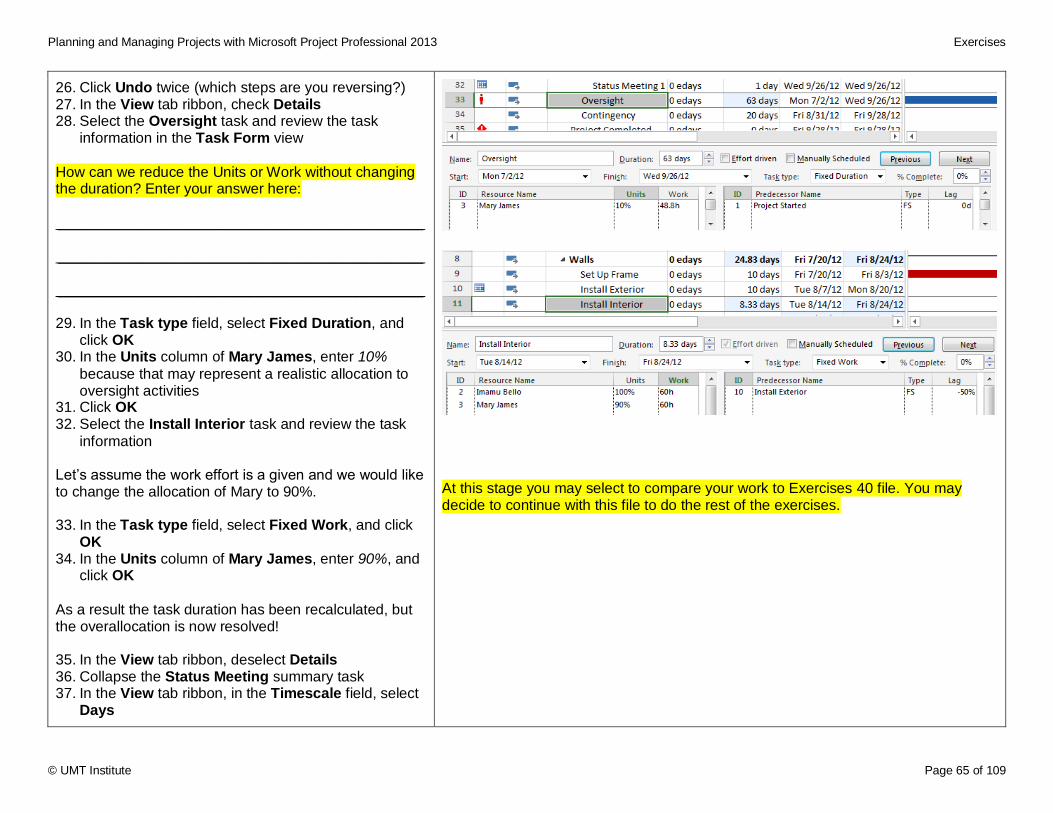
Planning and Managing Projects with Microsoft Project Professional 2013 Exercises
© UMT Institute Page 65 of 109
26. Click Undo twice (which steps are you reversing?) 27. In the View tab ribbon, check Details 28. Select the Oversight task and review the task
information in the Task Form view
How can we reduce the Units or Work without changing the duration? Enter your answer here: ____________________________________________ ____________________________________________ ____________________________________________ 29. In the Task type field, select Fixed Duration, and
click OK 30. In the Units column of Mary James, enter 10%
because that may represent a realistic allocation to oversight activities
31. Click OK 32. Select the Install Interior task and review the task
information Let’s assume the work effort is a given and we would like to change the allocation of Mary to 90%. 33. In the Task type field, select Fixed Work, and click
OK 34. In the Units column of Mary James, enter 90%, and
click OK
As a result the task duration has been recalculated, but the overallocation is now resolved! 35. In the View tab ribbon, deselect Details 36. Collapse the Status Meeting summary task 37. In the View tab ribbon, in the Timescale field, select
Days
At this stage you may select to compare your work to Exercises 40 file. You may decide to continue with this file to do the rest of the exercises.
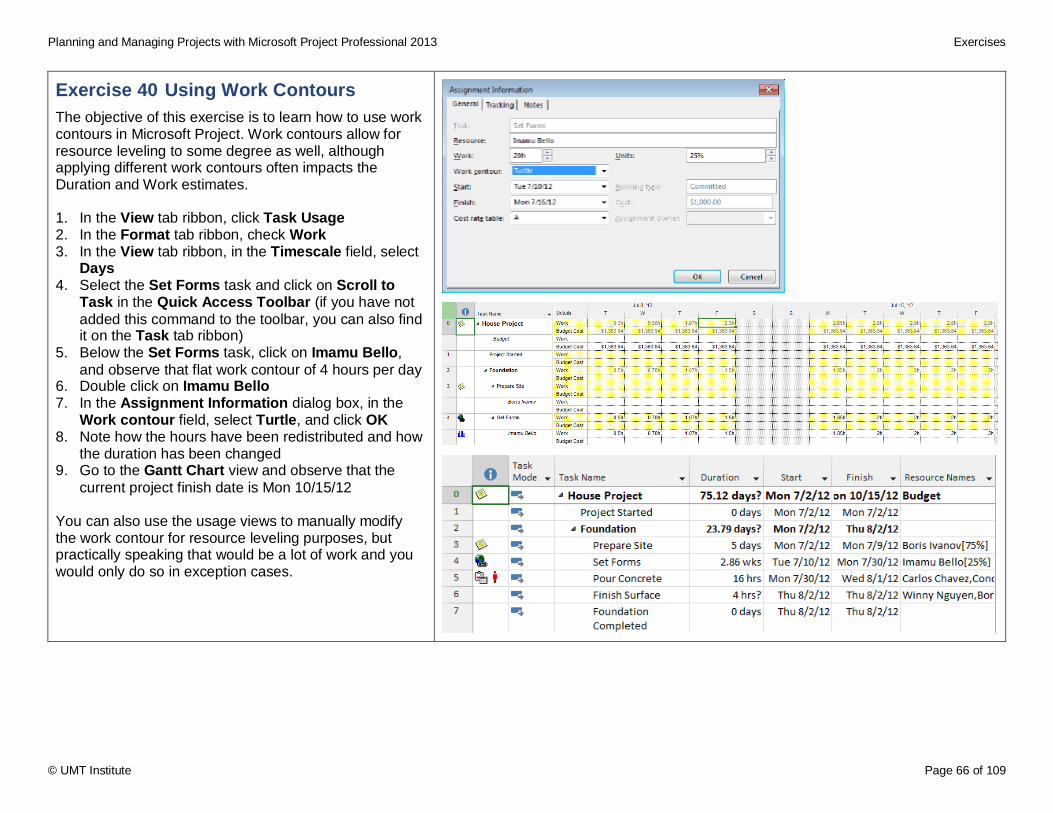
Planning and Managing Projects with Microsoft Project Professional 2013 Exercises
© UMT Institute Page 66 of 109
Exercise 40 Using Work Contours
The objective of this exercise is to learn how to use work contours in Microsoft Project. Work contours allow for resource leveling to some degree as well, although applying different work contours often impacts the Duration and Work estimates. 1. In the View tab ribbon, click Task Usage 2. In the Format tab ribbon, check Work 3. In the View tab ribbon, in the Timescale field, select
Days 4. Select the Set Forms task and click on Scroll to
Task in the Quick Access Toolbar (if you have not
added this command to the toolbar, you can also find it on the Task tab ribbon)
5. Below the Set Forms task, click on Imamu Bello,
and observe that flat work contour of 4 hours per day 6. Double click on Imamu Bello 7. In the Assignment Information dialog box, in the
Work contour field, select Turtle, and click OK 8. Note how the hours have been redistributed and how
the duration has been changed 9. Go to the Gantt Chart view and observe that the
current project finish date is Mon 10/15/12 You can also use the usage views to manually modify the work contour for resource leveling purposes, but practically speaking that would be a lot of work and you would only do so in exception cases.
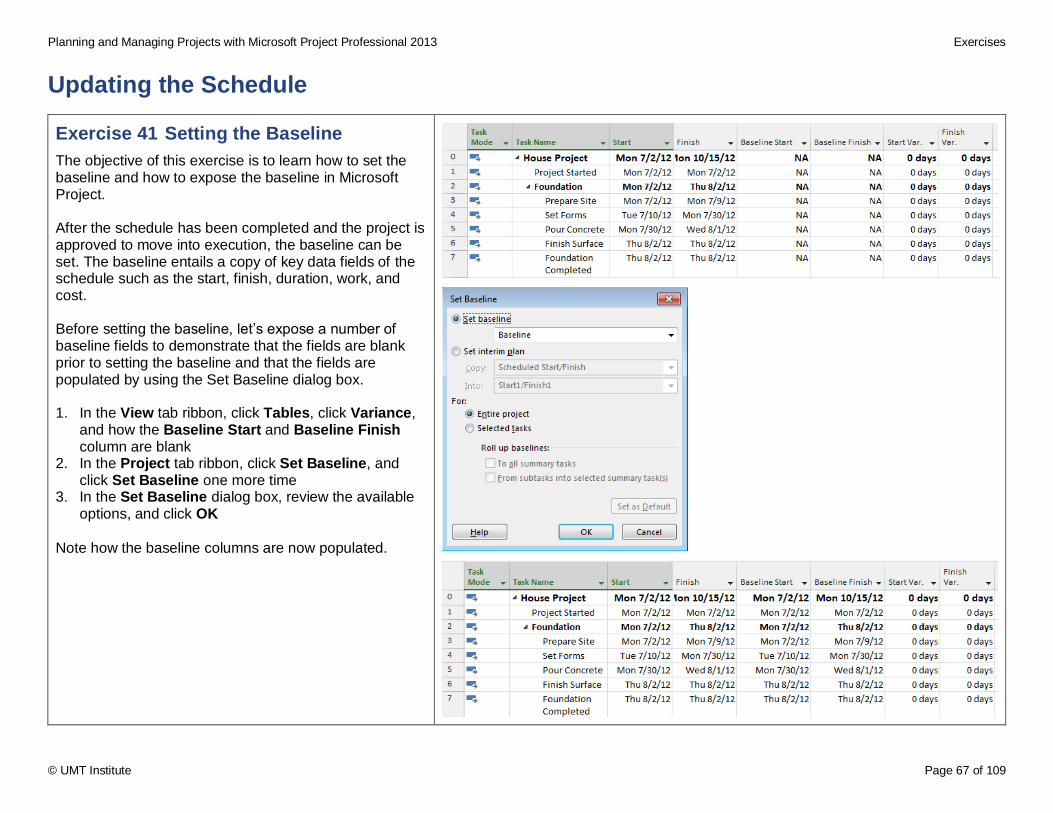
Planning and Managing Projects with Microsoft Project Professional 2013 Exercises
© UMT Institute Page 67 of 109
Updating the Schedule
Exercise 41 Setting the Baseline
The objective of this exercise is to learn how to set the baseline and how to expose the baseline in Microsoft Project. After the schedule has been completed and the project is approved to move into execution, the baseline can be set. The baseline entails a copy of key data fields of the schedule such as the start, finish, duration, work, and cost. Before setting the baseline, let’s expose a number of baseline fields to demonstrate that the fields are blank prior to setting the baseline and that the fields are populated by using the Set Baseline dialog box. 1. In the View tab ribbon, click Tables, click Variance,
and how the Baseline Start and Baseline Finish column are blank
2. In the Project tab ribbon, click Set Baseline, and click Set Baseline one more time
3. In the Set Baseline dialog box, review the available options, and click OK
Note how the baseline columns are now populated.
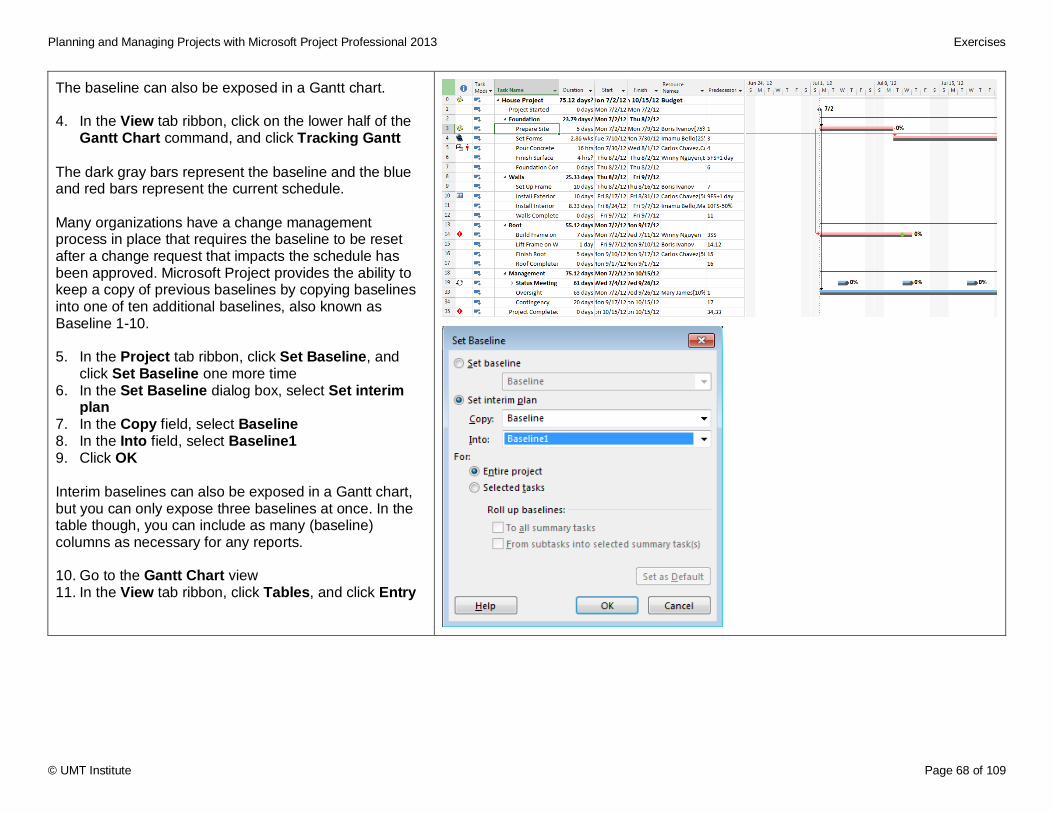
Planning and Managing Projects with Microsoft Project Professional 2013 Exercises
© UMT Institute Page 68 of 109
The baseline can also be exposed in a Gantt chart. 4. In the View tab ribbon, click on the lower half of the
Gantt Chart command, and click Tracking Gantt
The dark gray bars represent the baseline and the blue and red bars represent the current schedule. Many organizations have a change management process in place that requires the baseline to be reset after a change request that impacts the schedule has been approved. Microsoft Project provides the ability to keep a copy of previous baselines by copying baselines into one of ten additional baselines, also known as Baseline 1-10. 5. In the Project tab ribbon, click Set Baseline, and
click Set Baseline one more time 6. In the Set Baseline dialog box, select Set interim
plan 7. In the Copy field, select Baseline 8. In the Into field, select Baseline1 9. Click OK Interim baselines can also be exposed in a Gantt chart, but you can only expose three baselines at once. In the table though, you can include as many (baseline) columns as necessary for any reports. 10. Go to the Gantt Chart view 11. In the View tab ribbon, click Tables, and click Entry
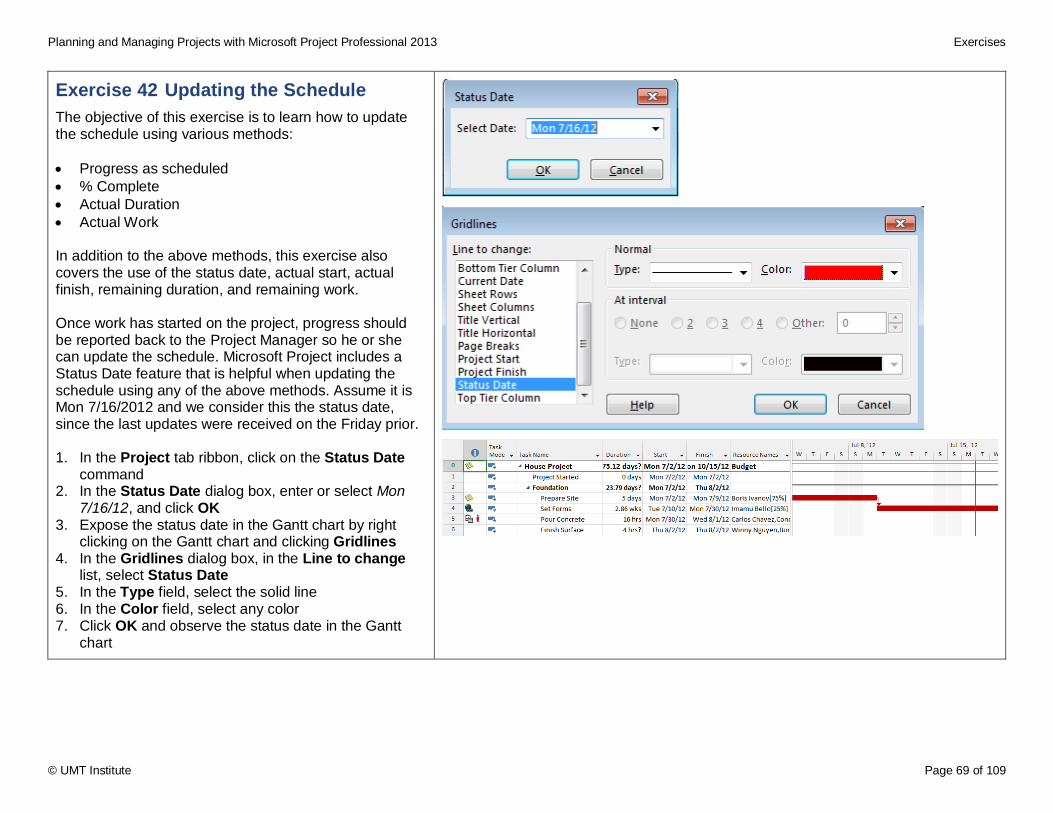
Planning and Managing Projects with Microsoft Project Professional 2013 Exercises
© UMT Institute Page 69 of 109
Exercise 42 Updating the Schedule
The objective of this exercise is to learn how to update the schedule using various methods:
Progress as scheduled
% Complete
Actual Duration
Actual Work In addition to the above methods, this exercise also covers the use of the status date, actual start, actual finish, remaining duration, and remaining work. Once work has started on the project, progress should be reported back to the Project Manager so he or she can update the schedule. Microsoft Project includes a Status Date feature that is helpful when updating the schedule using any of the above methods. Assume it is Mon 7/16/2012 and we consider this the status date, since the last updates were received on the Friday prior. 1. In the Project tab ribbon, click on the Status Date
command 2. In the Status Date dialog box, enter or select Mon
7/16/12, and click OK 3. Expose the status date in the Gantt chart by right
clicking on the Gantt chart and clicking Gridlines 4. In the Gridlines dialog box, in the Line to change
list, select Status Date 5. In the Type field, select the solid line 6. In the Color field, select any color 7. Click OK and observe the status date in the Gantt
chart
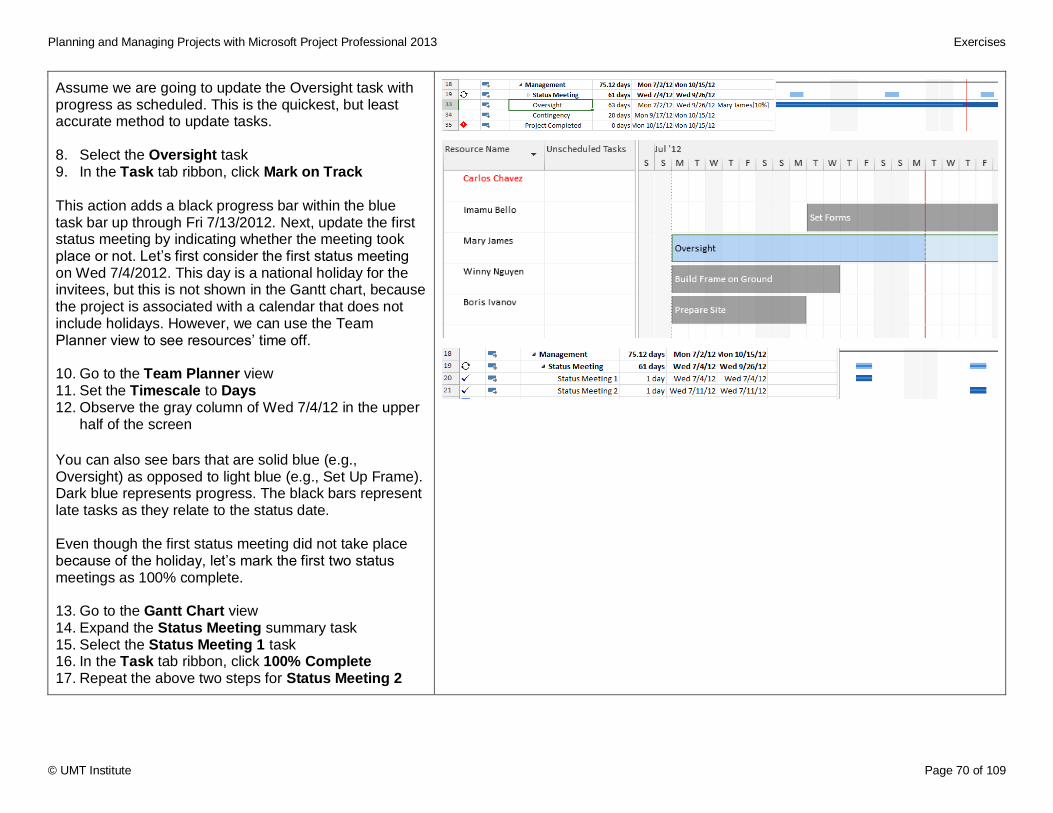
Planning and Managing Projects with Microsoft Project Professional 2013 Exercises
© UMT Institute Page 70 of 109
Assume we are going to update the Oversight task with progress as scheduled. This is the quickest, but least accurate method to update tasks. 8. Select the Oversight task 9. In the Task tab ribbon, click Mark on Track This action adds a black progress bar within the blue task bar up through Fri 7/13/2012. Next, update the first status meeting by indicating whether the meeting took place or not. Let’s first consider the first status meeting on Wed 7/4/2012. This day is a national holiday for the invitees, but this is not shown in the Gantt chart, because the project is associated with a calendar that does not include holidays. However, we can use the Team Planner view to see resources’ time off. 10. Go to the Team Planner view 11. Set the Timescale to Days 12. Observe the gray column of Wed 7/4/12 in the upper
half of the screen
You can also see bars that are solid blue (e.g., Oversight) as opposed to light blue (e.g., Set Up Frame). Dark blue represents progress. The black bars represent late tasks as they relate to the status date. Even though the first status meeting did not take place because of the holiday, let’s mark the first two status meetings as 100% complete. 13. Go to the Gantt Chart view 14. Expand the Status Meeting summary task 15. Select the Status Meeting 1 task 16. In the Task tab ribbon, click 100% Complete 17. Repeat the above two steps for Status Meeting 2
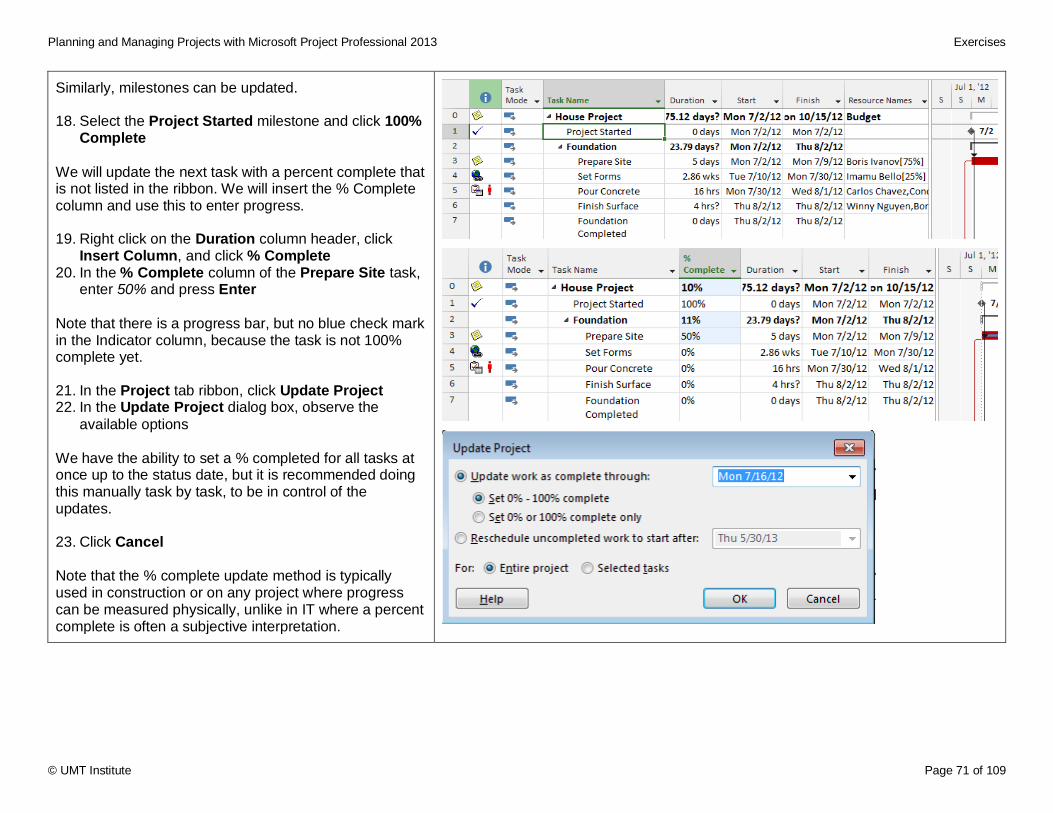
Planning and Managing Projects with Microsoft Project Professional 2013 Exercises
© UMT Institute Page 71 of 109
Similarly, milestones can be updated. 18. Select the Project Started milestone and click 100%
Complete
We will update the next task with a percent complete that is not listed in the ribbon. We will insert the % Complete column and use this to enter progress. 19. Right click on the Duration column header, click
Insert Column, and click % Complete 20. In the % Complete column of the Prepare Site task,
enter 50% and press Enter
Note that there is a progress bar, but no blue check mark in the Indicator column, because the task is not 100% complete yet. 21. In the Project tab ribbon, click Update Project 22. In the Update Project dialog box, observe the
available options We have the ability to set a % completed for all tasks at once up to the status date, but it is recommended doing this manually task by task, to be in control of the updates. 23. Click Cancel
Note that the % complete update method is typically used in construction or on any project where progress can be measured physically, unlike in IT where a percent complete is often a subjective interpretation.
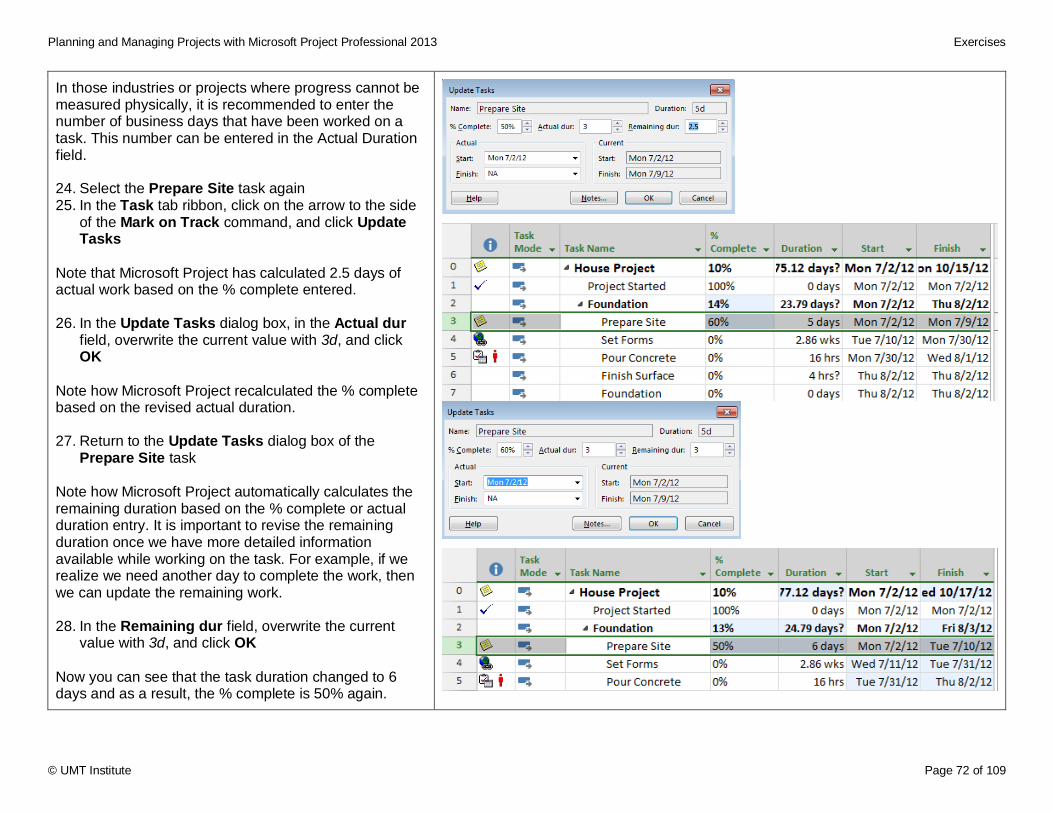
Planning and Managing Projects with Microsoft Project Professional 2013 Exercises
© UMT Institute Page 72 of 109
In those industries or projects where progress cannot be measured physically, it is recommended to enter the number of business days that have been worked on a task. This number can be entered in the Actual Duration field. 24. Select the Prepare Site task again 25. In the Task tab ribbon, click on the arrow to the side
of the Mark on Track command, and click Update Tasks
Note that Microsoft Project has calculated 2.5 days of actual work based on the % complete entered. 26. In the Update Tasks dialog box, in the Actual dur
field, overwrite the current value with 3d, and click OK
Note how Microsoft Project recalculated the % complete based on the revised actual duration. 27. Return to the Update Tasks dialog box of the
Prepare Site task Note how Microsoft Project automatically calculates the remaining duration based on the % complete or actual duration entry. It is important to revise the remaining duration once we have more detailed information available while working on the task. For example, if we realize we need another day to complete the work, then we can update the remaining work. 28. In the Remaining dur field, overwrite the current
value with 3d, and click OK
Now you can see that the task duration changed to 6 days and as a result, the % complete is 50% again.
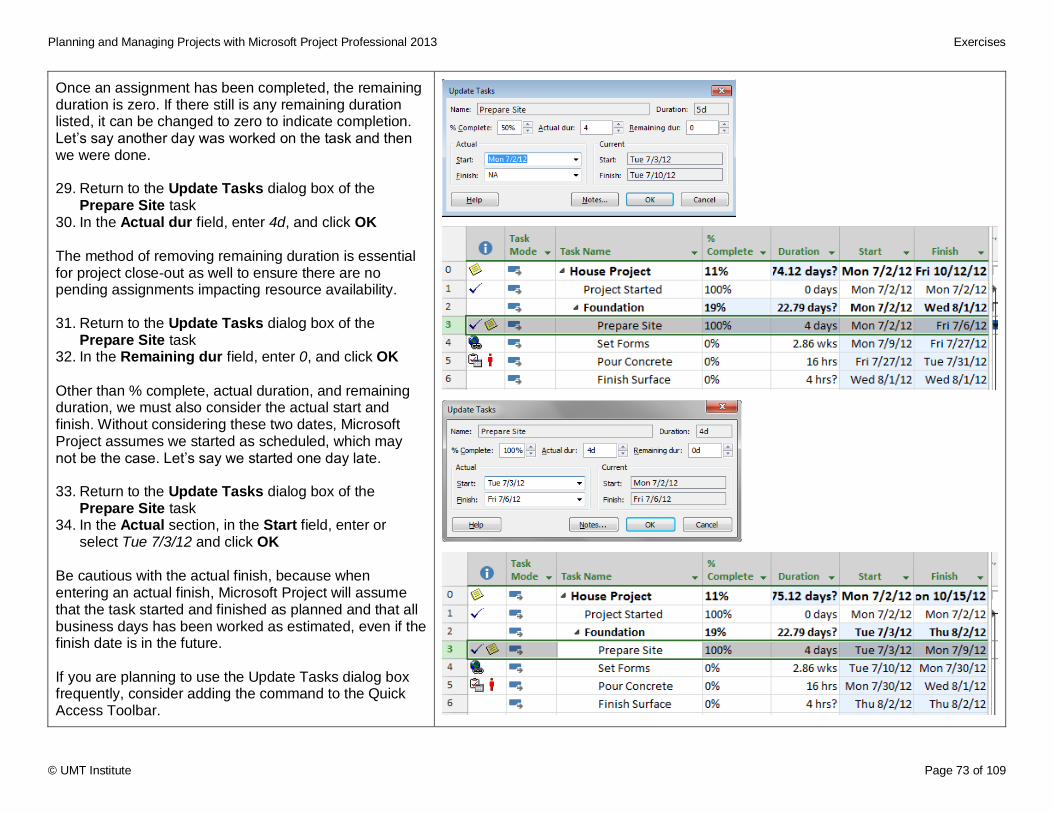
Planning and Managing Projects with Microsoft Project Professional 2013 Exercises
© UMT Institute Page 73 of 109
Once an assignment has been completed, the remaining duration is zero. If there still is any remaining duration listed, it can be changed to zero to indicate completion. Let’s say another day was worked on the task and then we were done. 29. Return to the Update Tasks dialog box of the
Prepare Site task 30. In the Actual dur field, enter 4d, and click OK The method of removing remaining duration is essential for project close-out as well to ensure there are no pending assignments impacting resource availability. 31. Return to the Update Tasks dialog box of the
Prepare Site task 32. In the Remaining dur field, enter 0, and click OK
Other than % complete, actual duration, and remaining duration, we must also consider the actual start and finish. Without considering these two dates, Microsoft Project assumes we started as scheduled, which may not be the case. Let’s say we started one day late. 33. Return to the Update Tasks dialog box of the
Prepare Site task 34. In the Actual section, in the Start field, enter or
select Tue 7/3/12 and click OK
Be cautious with the actual finish, because when entering an actual finish, Microsoft Project will assume that the task started and finished as planned and that all business days has been worked as estimated, even if the finish date is in the future. If you are planning to use the Update Tasks dialog box frequently, consider adding the command to the Quick Access Toolbar.
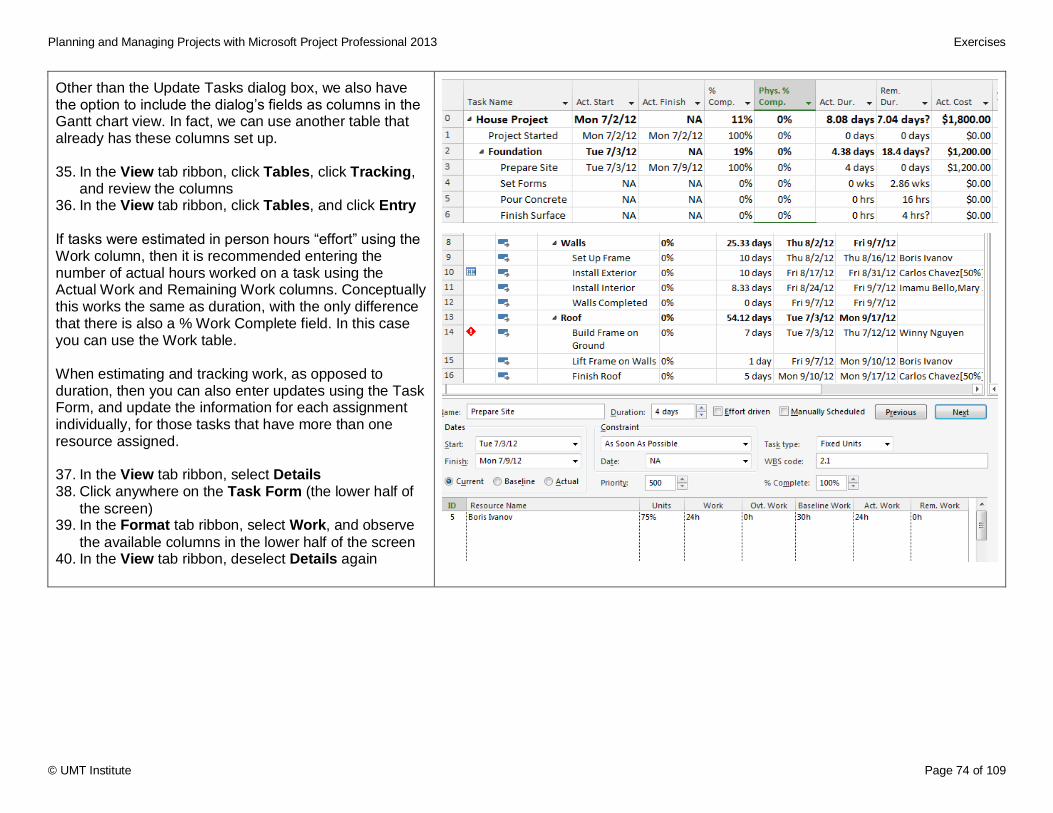
Planning and Managing Projects with Microsoft Project Professional 2013 Exercises
© UMT Institute Page 74 of 109
Other than the Update Tasks dialog box, we also have the option to include the dialog’s fields as columns in the Gantt chart view. In fact, we can use another table that already has these columns set up. 35. In the View tab ribbon, click Tables, click Tracking,
and review the columns 36. In the View tab ribbon, click Tables, and click Entry
If tasks were estimated in person hours “effort” using the Work column, then it is recommended entering the number of actual hours worked on a task using the Actual Work and Remaining Work columns. Conceptually this works the same as duration, with the only difference that there is also a % Work Complete field. In this case you can use the Work table. When estimating and tracking work, as opposed to duration, then you can also enter updates using the Task Form, and update the information for each assignment individually, for those tasks that have more than one resource assigned. 37. In the View tab ribbon, select Details 38. Click anywhere on the Task Form (the lower half of
the screen) 39. In the Format tab ribbon, select Work, and observe
the available columns in the lower half of the screen 40. In the View tab ribbon, deselect Details again
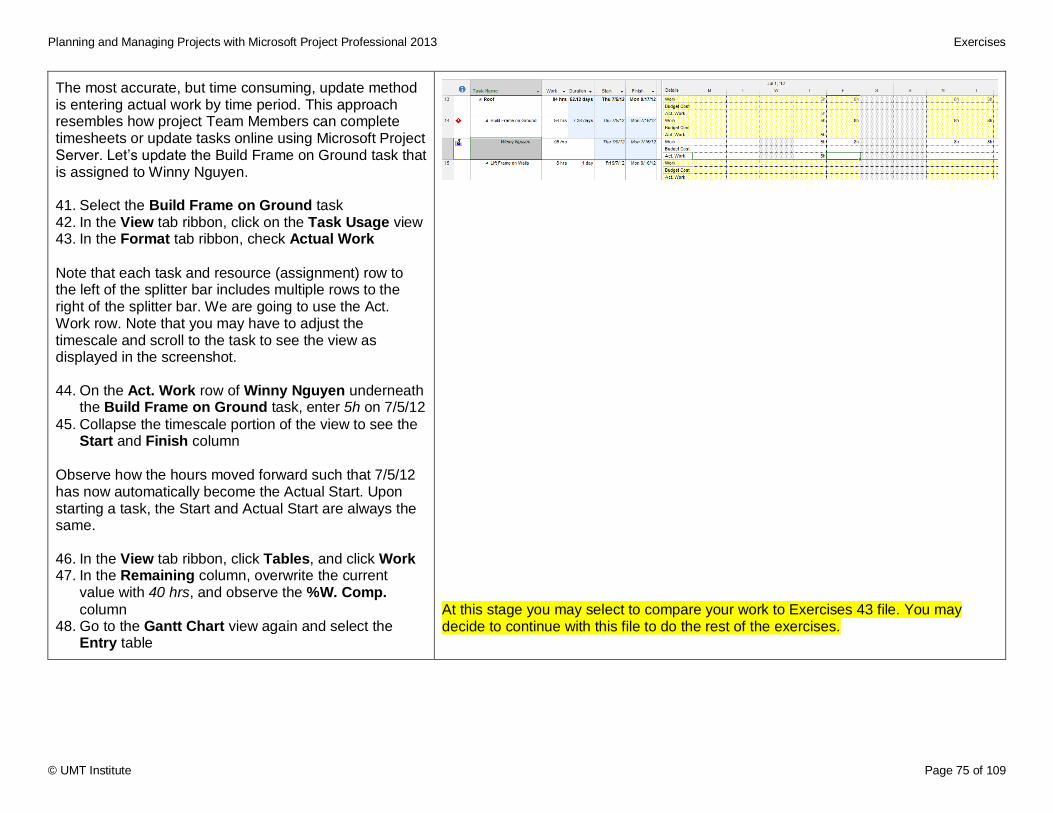
Planning and Managing Projects with Microsoft Project Professional 2013 Exercises
© UMT Institute Page 75 of 109
The most accurate, but time consuming, update method is entering actual work by time period. This approach resembles how project Team Members can complete timesheets or update tasks online using Microsoft Project Server. Let’s update the Build Frame on Ground task that is assigned to Winny Nguyen. 41. Select the Build Frame on Ground task 42. In the View tab ribbon, click on the Task Usage view 43. In the Format tab ribbon, check Actual Work
Note that each task and resource (assignment) row to the left of the splitter bar includes multiple rows to the right of the splitter bar. We are going to use the Act. Work row. Note that you may have to adjust the timescale and scroll to the task to see the view as displayed in the screenshot. 44. On the Act. Work row of Winny Nguyen underneath
the Build Frame on Ground task, enter 5h on 7/5/12
45. Collapse the timescale portion of the view to see the Start and Finish column
Observe how the hours moved forward such that 7/5/12 has now automatically become the Actual Start. Upon starting a task, the Start and Actual Start are always the same. 46. In the View tab ribbon, click Tables, and click Work 47. In the Remaining column, overwrite the current
value with 40 hrs, and observe the %W. Comp.
column 48. Go to the Gantt Chart view again and select the
Entry table
At this stage you may select to compare your work to Exercises 43 file. You may decide to continue with this file to do the rest of the exercises.
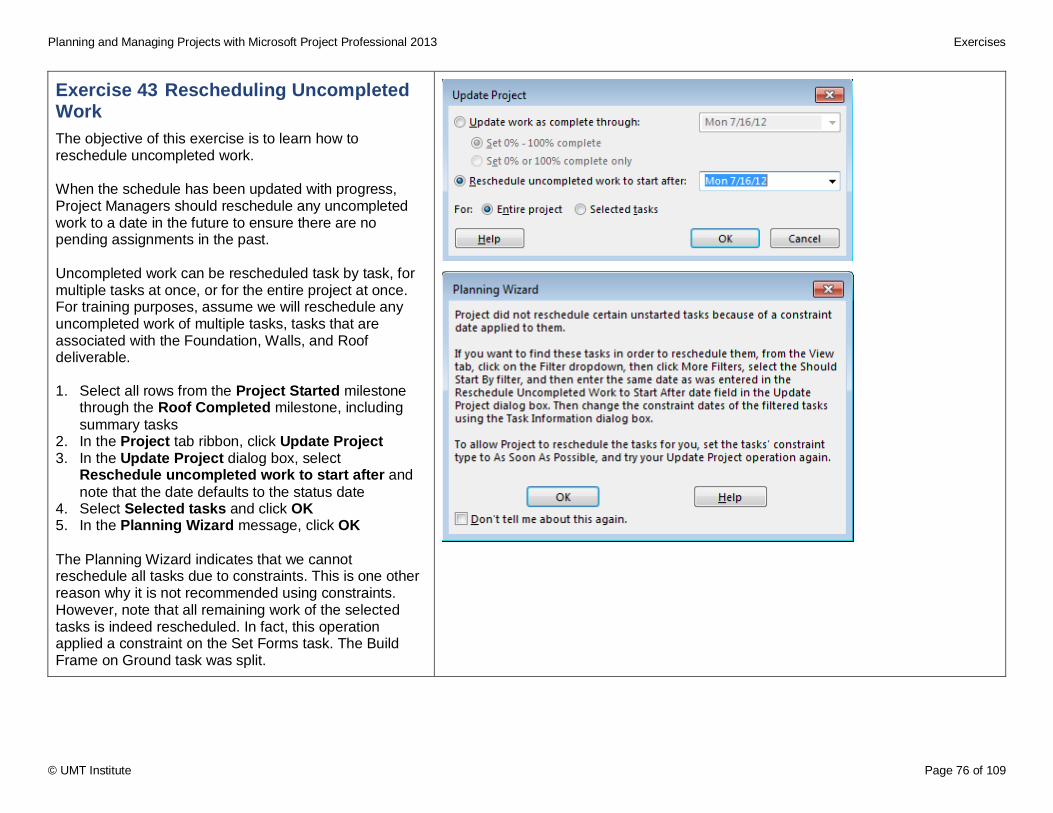
Planning and Managing Projects with Microsoft Project Professional 2013 Exercises
© UMT Institute Page 76 of 109
Exercise 43 Rescheduling Uncompleted Work
The objective of this exercise is to learn how to reschedule uncompleted work. When the schedule has been updated with progress, Project Managers should reschedule any uncompleted work to a date in the future to ensure there are no pending assignments in the past. Uncompleted work can be rescheduled task by task, for multiple tasks at once, or for the entire project at once. For training purposes, assume we will reschedule any uncompleted work of multiple tasks, tasks that are associated with the Foundation, Walls, and Roof deliverable. 1. Select all rows from the Project Started milestone
through the Roof Completed milestone, including
summary tasks 2. In the Project tab ribbon, click Update Project 3. In the Update Project dialog box, select
Reschedule uncompleted work to start after and
note that the date defaults to the status date 4. Select Selected tasks and click OK 5. In the Planning Wizard message, click OK
The Planning Wizard indicates that we cannot reschedule all tasks due to constraints. This is one other reason why it is not recommended using constraints. However, note that all remaining work of the selected tasks is indeed rescheduled. In fact, this operation applied a constraint on the Set Forms task. The Build Frame on Ground task was split.
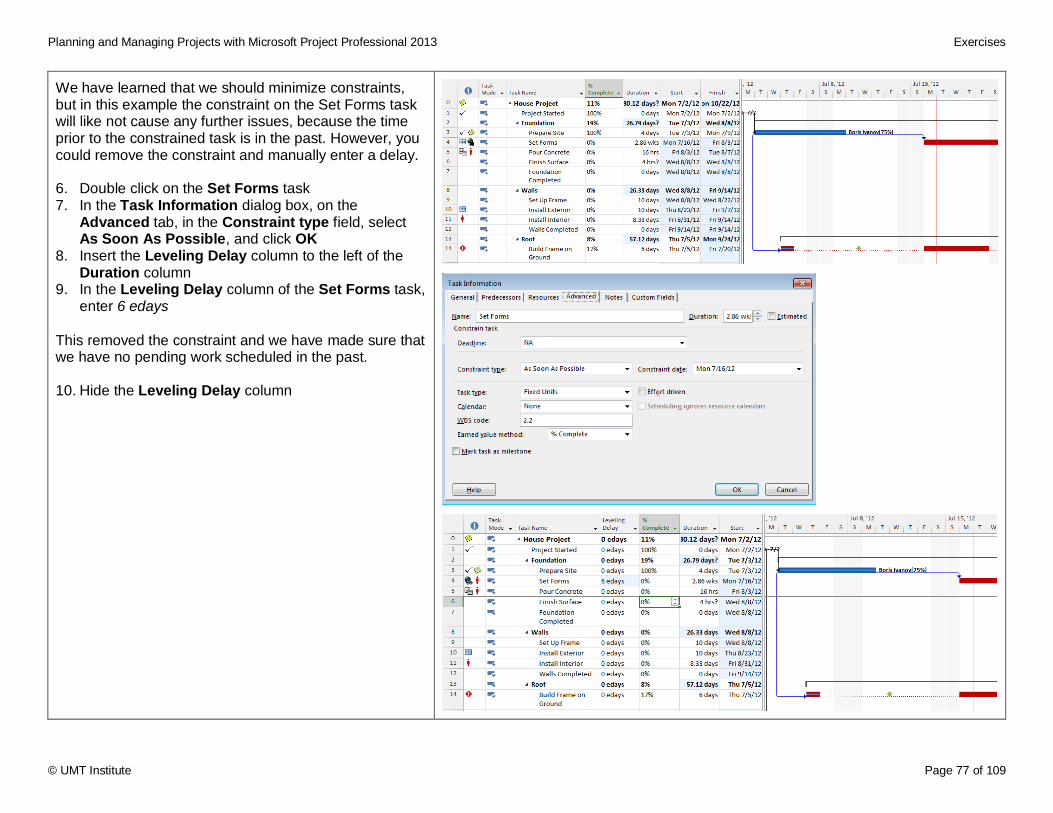
Planning and Managing Projects with Microsoft Project Professional 2013 Exercises
© UMT Institute Page 77 of 109
We have learned that we should minimize constraints, but in this example the constraint on the Set Forms task will like not cause any further issues, because the time prior to the constrained task is in the past. However, you could remove the constraint and manually enter a delay. 6. Double click on the Set Forms task 7. In the Task Information dialog box, on the
Advanced tab, in the Constraint type field, select As Soon As Possible, and click OK
8. Insert the Leveling Delay column to the left of the Duration column
9. In the Leveling Delay column of the Set Forms task, enter 6 edays
This removed the constraint and we have made sure that we have no pending work scheduled in the past. 10. Hide the Leveling Delay column
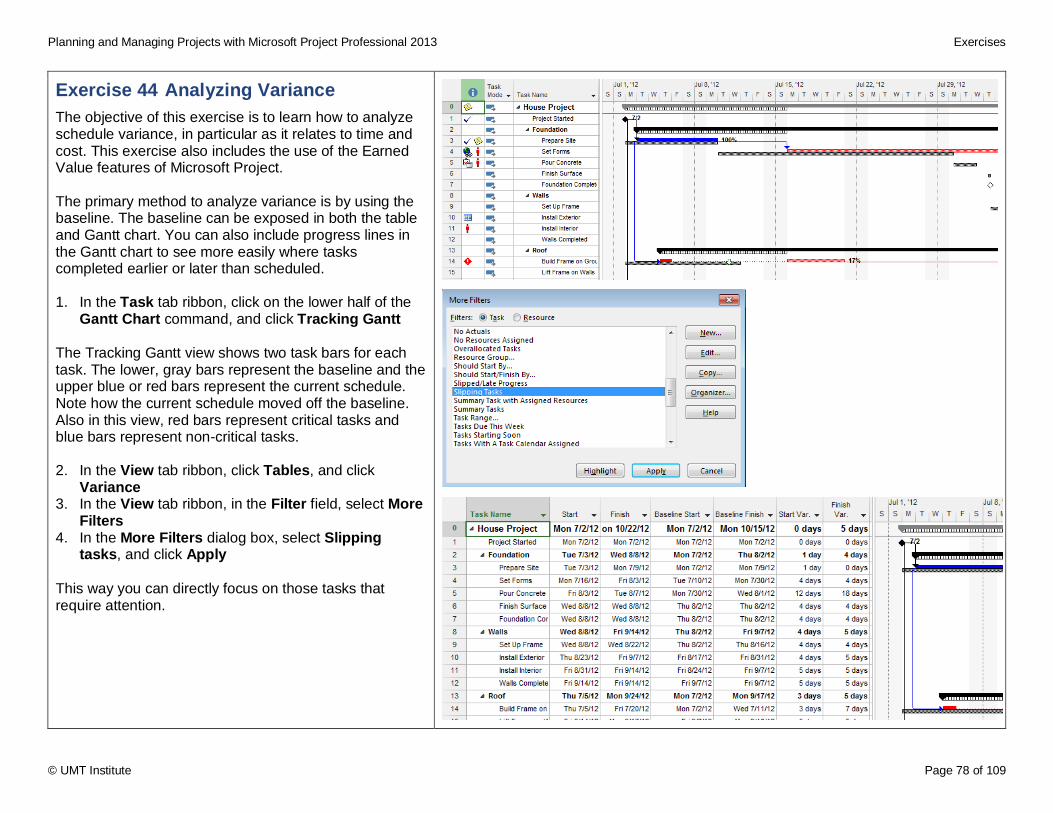
Planning and Managing Projects with Microsoft Project Professional 2013 Exercises
© UMT Institute Page 78 of 109
Exercise 44 Analyzing Variance
The objective of this exercise is to learn how to analyze schedule variance, in particular as it relates to time and cost. This exercise also includes the use of the Earned Value features of Microsoft Project. The primary method to analyze variance is by using the baseline. The baseline can be exposed in both the table and Gantt chart. You can also include progress lines in the Gantt chart to see more easily where tasks completed earlier or later than scheduled. 1. In the Task tab ribbon, click on the lower half of the
Gantt Chart command, and click Tracking Gantt The Tracking Gantt view shows two task bars for each task. The lower, gray bars represent the baseline and the upper blue or red bars represent the current schedule. Note how the current schedule moved off the baseline. Also in this view, red bars represent critical tasks and blue bars represent non-critical tasks. 2. In the View tab ribbon, click Tables, and click
Variance 3. In the View tab ribbon, in the Filter field, select More
Filters 4. In the More Filters dialog box, select Slipping
tasks, and click Apply
This way you can directly focus on those tasks that require attention.
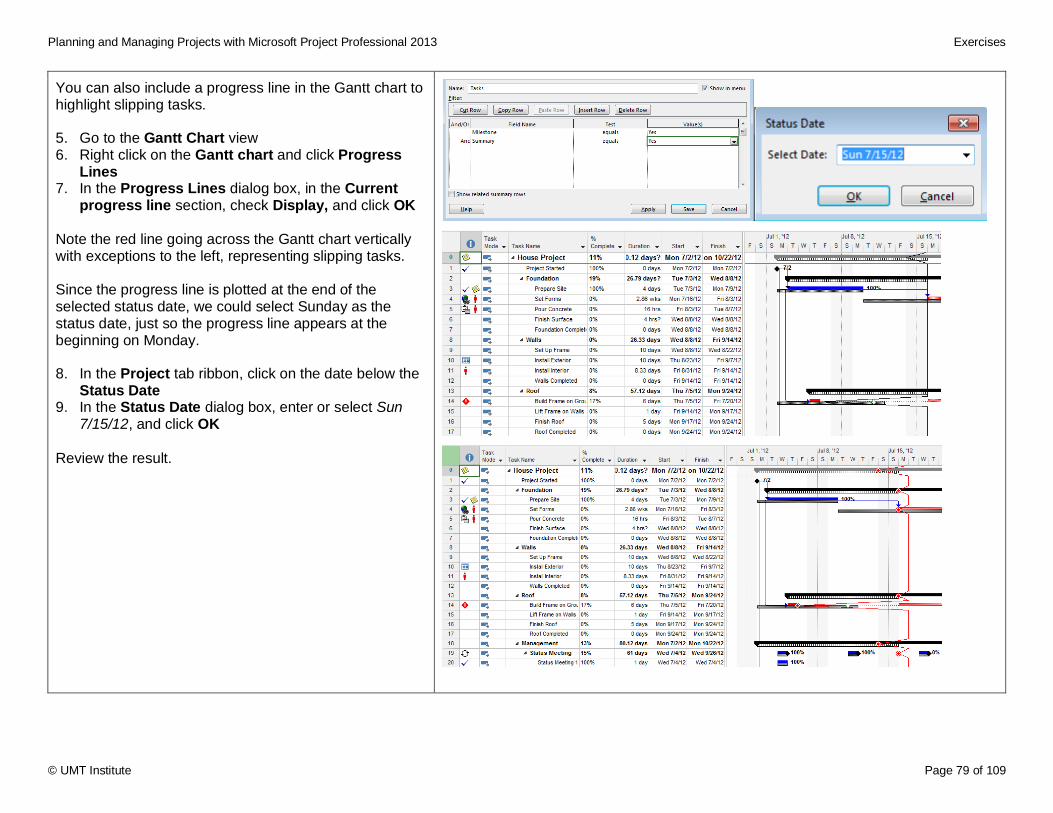
Planning and Managing Projects with Microsoft Project Professional 2013 Exercises
© UMT Institute Page 79 of 109
You can also include a progress line in the Gantt chart to highlight slipping tasks. 5. Go to the Gantt Chart view 6. Right click on the Gantt chart and click Progress
Lines 7. In the Progress Lines dialog box, in the Current
progress line section, check Display, and click OK
Note the red line going across the Gantt chart vertically with exceptions to the left, representing slipping tasks. Since the progress line is plotted at the end of the selected status date, we could select Sunday as the status date, just so the progress line appears at the beginning on Monday. 8. In the Project tab ribbon, click on the date below the
Status Date 9. In the Status Date dialog box, enter or select Sun
7/15/12, and click OK
Review the result.
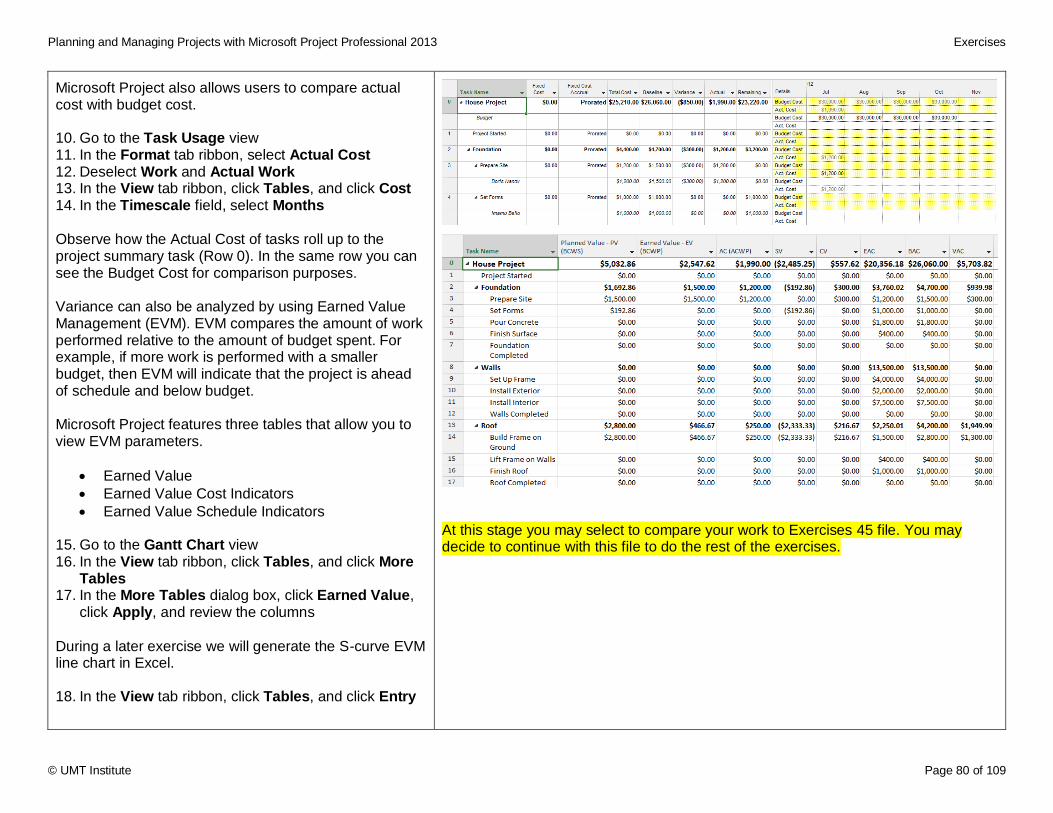
Planning and Managing Projects with Microsoft Project Professional 2013 Exercises
© UMT Institute Page 80 of 109
Microsoft Project also allows users to compare actual cost with budget cost. 10. Go to the Task Usage view 11. In the Format tab ribbon, select Actual Cost 12. Deselect Work and Actual Work 13. In the View tab ribbon, click Tables, and click Cost 14. In the Timescale field, select Months
Observe how the Actual Cost of tasks roll up to the project summary task (Row 0). In the same row you can see the Budget Cost for comparison purposes. Variance can also be analyzed by using Earned Value Management (EVM). EVM compares the amount of work performed relative to the amount of budget spent. For example, if more work is performed with a smaller budget, then EVM will indicate that the project is ahead of schedule and below budget. Microsoft Project features three tables that allow you to view EVM parameters.
Earned Value
Earned Value Cost Indicators
Earned Value Schedule Indicators 15. Go to the Gantt Chart view 16. In the View tab ribbon, click Tables, and click More
Tables 17. In the More Tables dialog box, click Earned Value,
click Apply, and review the columns
During a later exercise we will generate the S-curve EVM line chart in Excel. 18. In the View tab ribbon, click Tables, and click Entry
At this stage you may select to compare your work to Exercises 45 file. You may decide to continue with this file to do the rest of the exercises.
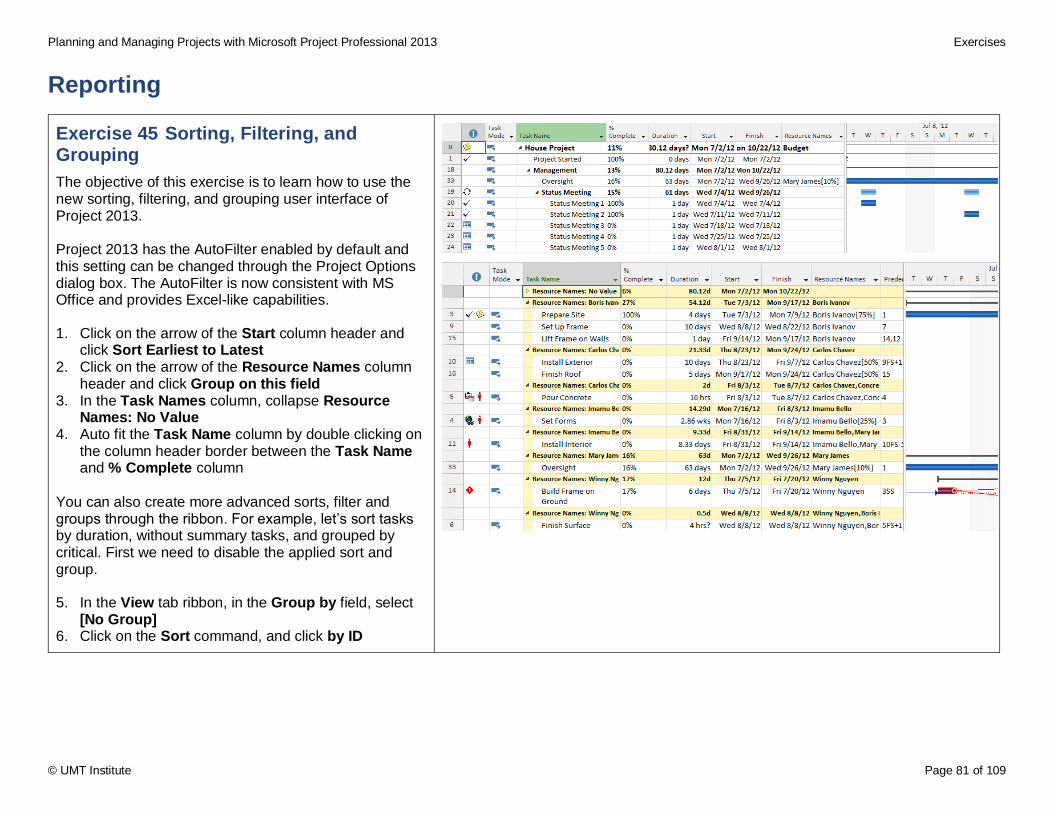
Planning and Managing Projects with Microsoft Project Professional 2013 Exercises
© UMT Institute Page 81 of 109
Reporting
Exercise 45 Sorting, Filtering, and Grouping
The objective of this exercise is to learn how to use the new sorting, filtering, and grouping user interface of Project 2013. Project 2013 has the AutoFilter enabled by default and this setting can be changed through the Project Options dialog box. The AutoFilter is now consistent with MS Office and provides Excel-like capabilities. 1. Click on the arrow of the Start column header and
click Sort Earliest to Latest 2. Click on the arrow of the Resource Names column
header and click Group on this field 3. In the Task Names column, collapse Resource
Names: No Value 4. Auto fit the Task Name column by double clicking on
the column header border between the Task Name and % Complete column
You can also create more advanced sorts, filter and groups through the ribbon. For example, let’s sort tasks by duration, without summary tasks, and grouped by critical. First we need to disable the applied sort and group. 5. In the View tab ribbon, in the Group by field, select
[No Group] 6. Click on the Sort command, and click by ID
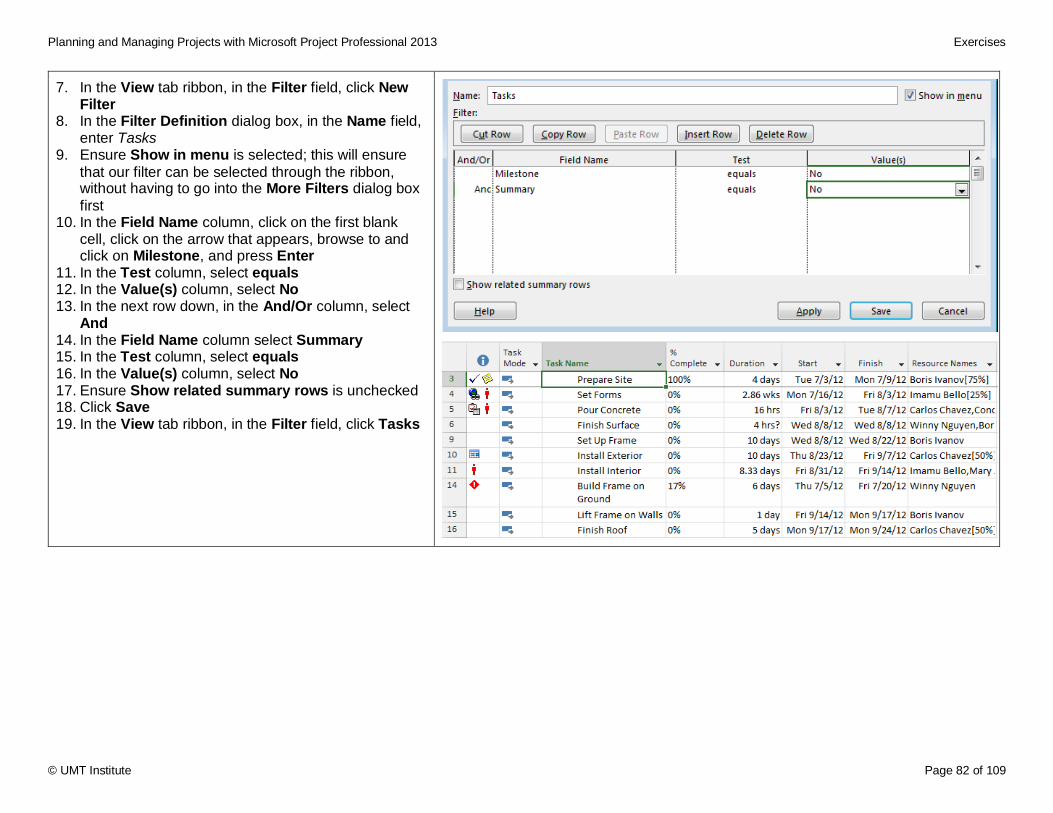
Planning and Managing Projects with Microsoft Project Professional 2013 Exercises
© UMT Institute Page 82 of 109
7. In the View tab ribbon, in the Filter field, click New Filter
8. In the Filter Definition dialog box, in the Name field, enter Tasks
9. Ensure Show in menu is selected; this will ensure
that our filter can be selected through the ribbon, without having to go into the More Filters dialog box
first 10. In the Field Name column, click on the first blank
cell, click on the arrow that appears, browse to and click on Milestone, and press Enter
11. In the Test column, select equals 12. In the Value(s) column, select No 13. In the next row down, in the And/Or column, select
And 14. In the Field Name column select Summary 15. In the Test column, select equals 16. In the Value(s) column, select No 17. Ensure Show related summary rows is unchecked 18. Click Save 19. In the View tab ribbon, in the Filter field, click Tasks
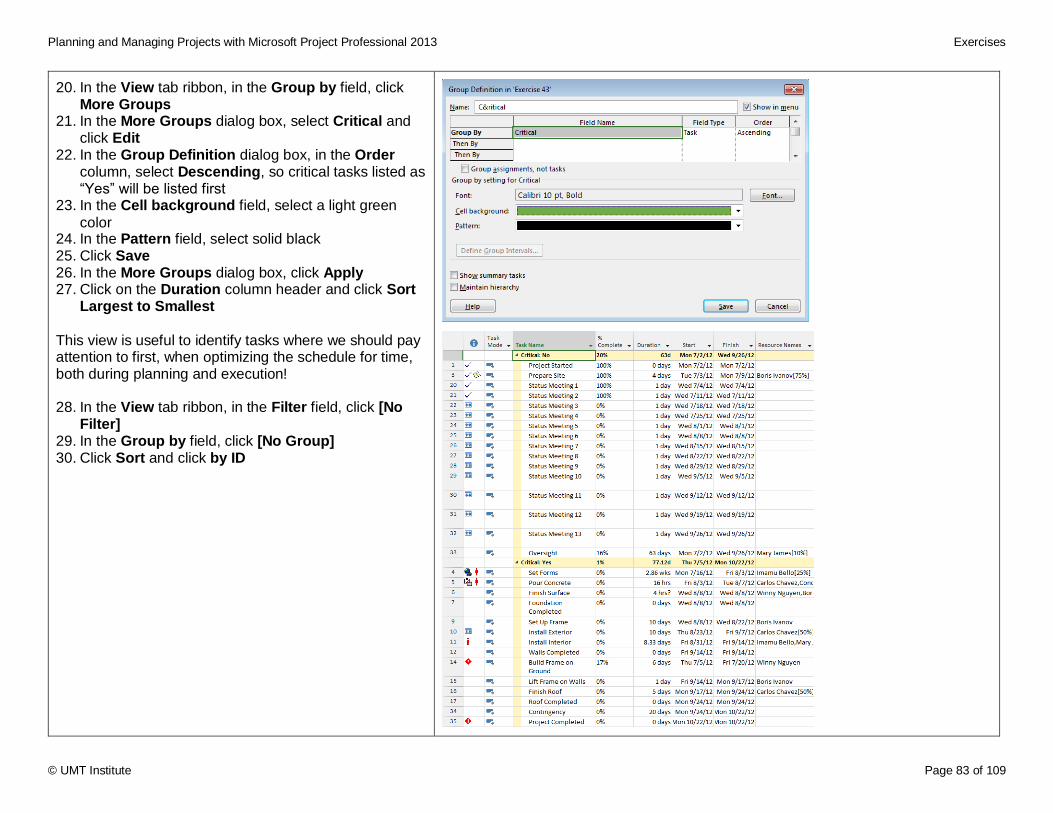
Planning and Managing Projects with Microsoft Project Professional 2013 Exercises
© UMT Institute Page 83 of 109
20. In the View tab ribbon, in the Group by field, click More Groups
21. In the More Groups dialog box, select Critical and click Edit
22. In the Group Definition dialog box, in the Order column, select Descending, so critical tasks listed as “Yes” will be listed first
23. In the Cell background field, select a light green
color 24. In the Pattern field, select solid black 25. Click Save 26. In the More Groups dialog box, click Apply 27. Click on the Duration column header and click Sort
Largest to Smallest
This view is useful to identify tasks where we should pay attention to first, when optimizing the schedule for time, both during planning and execution! 28. In the View tab ribbon, in the Filter field, click [No
Filter] 29. In the Group by field, click [No Group] 30. Click Sort and click by ID
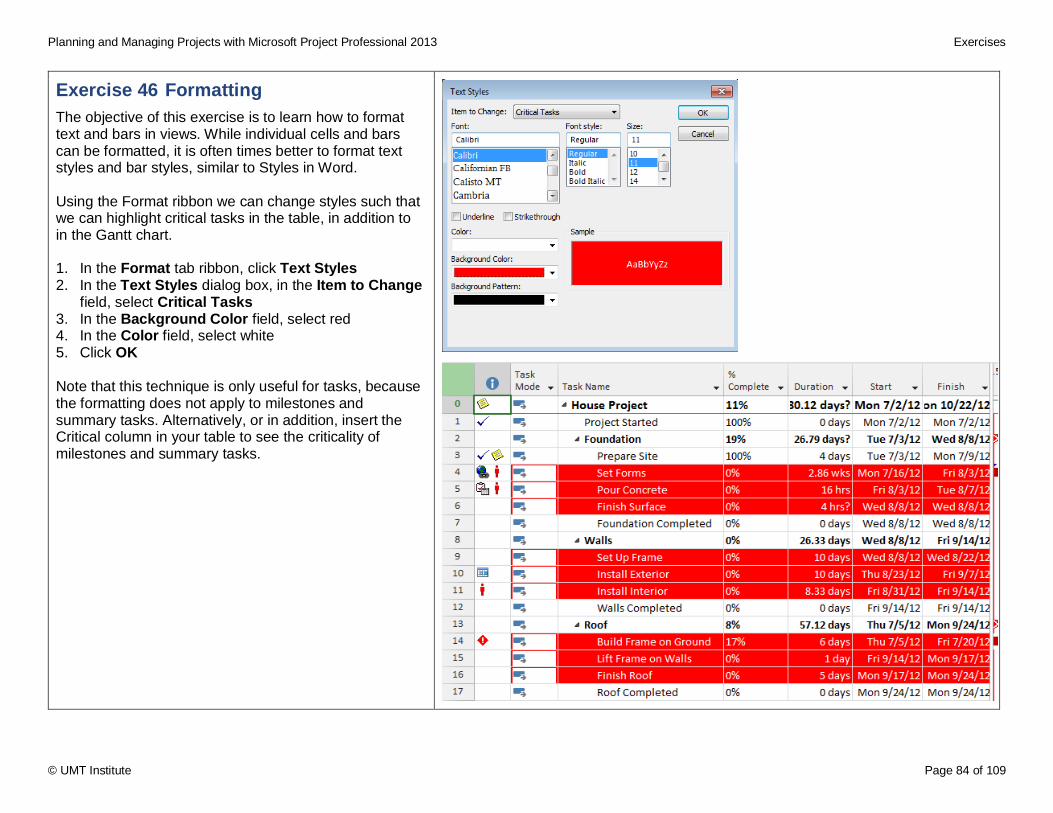
Planning and Managing Projects with Microsoft Project Professional 2013 Exercises
© UMT Institute Page 84 of 109
Exercise 46 Formatting
The objective of this exercise is to learn how to format text and bars in views. While individual cells and bars can be formatted, it is often times better to format text styles and bar styles, similar to Styles in Word. Using the Format ribbon we can change styles such that we can highlight critical tasks in the table, in addition to in the Gantt chart. 1. In the Format tab ribbon, click Text Styles 2. In the Text Styles dialog box, in the Item to Change
field, select Critical Tasks 3. In the Background Color field, select red 4. In the Color field, select white 5. Click OK
Note that this technique is only useful for tasks, because the formatting does not apply to milestones and summary tasks. Alternatively, or in addition, insert the Critical column in your table to see the criticality of milestones and summary tasks.
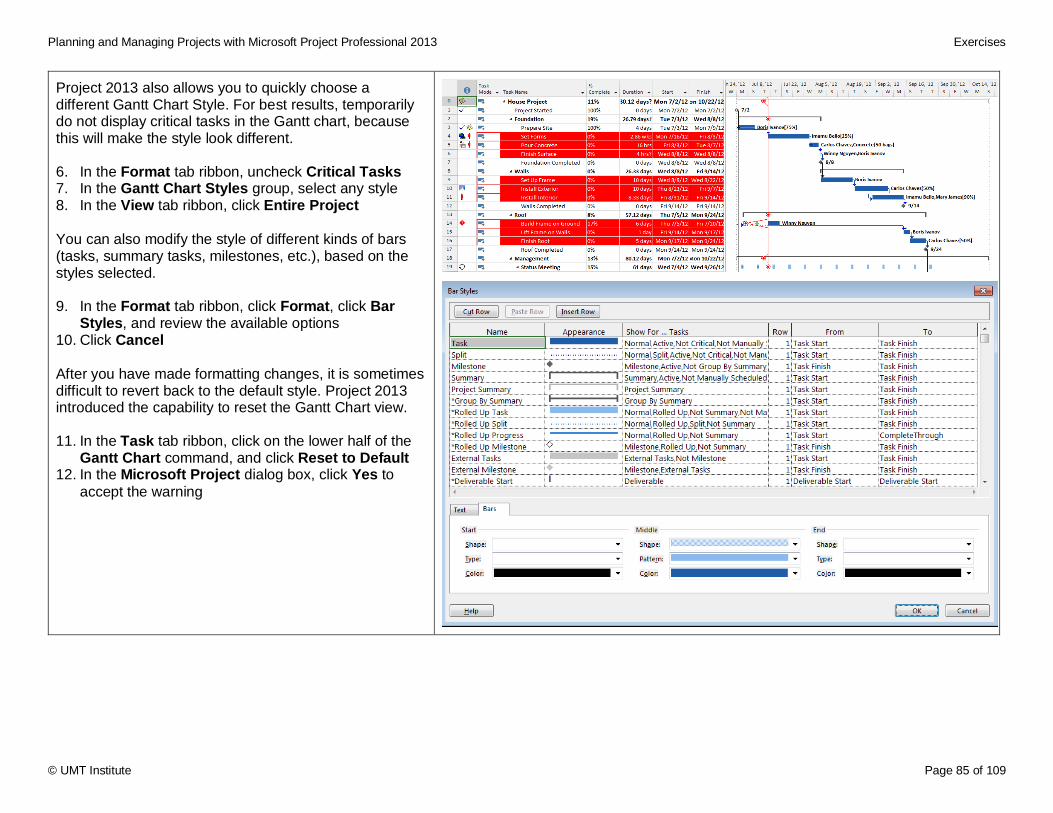
Planning and Managing Projects with Microsoft Project Professional 2013 Exercises
© UMT Institute Page 85 of 109
Project 2013 also allows you to quickly choose a different Gantt Chart Style. For best results, temporarily do not display critical tasks in the Gantt chart, because this will make the style look different. 6. In the Format tab ribbon, uncheck Critical Tasks 7. In the Gantt Chart Styles group, select any style 8. In the View tab ribbon, click Entire Project
You can also modify the style of different kinds of bars (tasks, summary tasks, milestones, etc.), based on the styles selected. 9. In the Format tab ribbon, click Format, click Bar
Styles, and review the available options 10. Click Cancel After you have made formatting changes, it is sometimes difficult to revert back to the default style. Project 2013 introduced the capability to reset the Gantt Chart view. 11. In the Task tab ribbon, click on the lower half of the
Gantt Chart command, and click Reset to Default 12. In the Microsoft Project dialog box, click Yes to
accept the warning
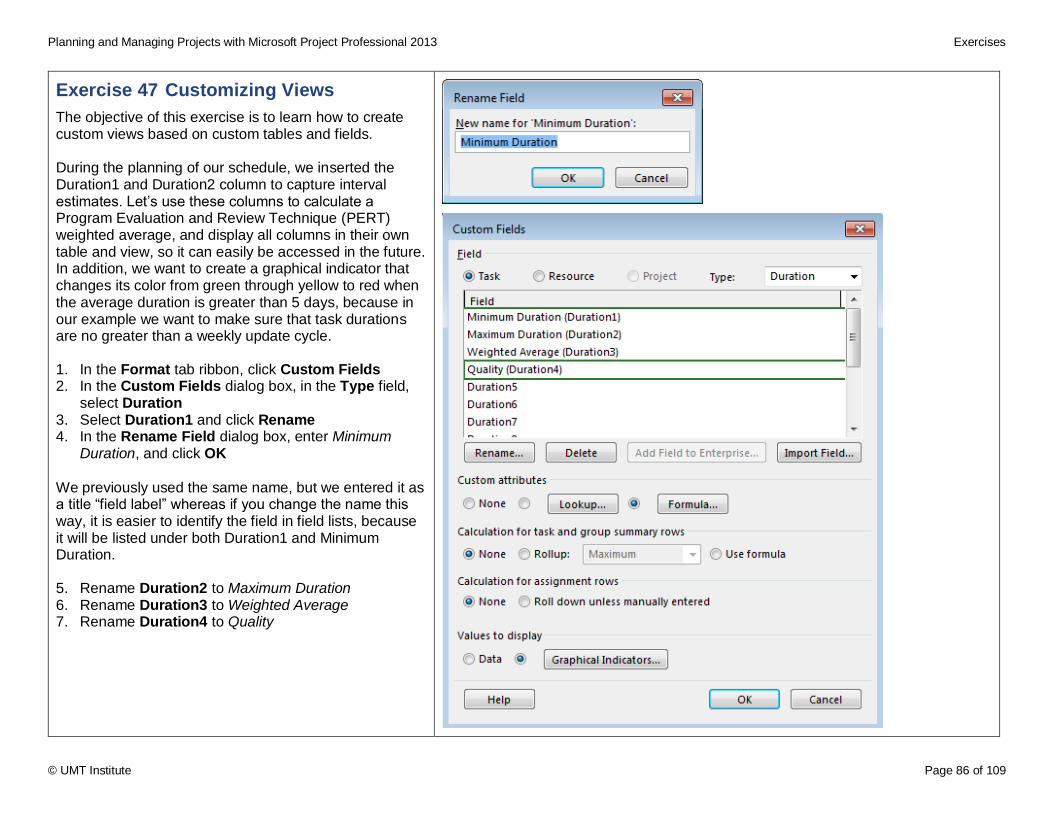
Planning and Managing Projects with Microsoft Project Professional 2013 Exercises
© UMT Institute Page 86 of 109
Exercise 47 Customizing Views
The objective of this exercise is to learn how to create custom views based on custom tables and fields. During the planning of our schedule, we inserted the Duration1 and Duration2 column to capture interval estimates. Let’s use these columns to calculate a Program Evaluation and Review Technique (PERT) weighted average, and display all columns in their own table and view, so it can easily be accessed in the future. In addition, we want to create a graphical indicator that changes its color from green through yellow to red when the average duration is greater than 5 days, because in our example we want to make sure that task durations are no greater than a weekly update cycle. 1. In the Format tab ribbon, click Custom Fields 2. In the Custom Fields dialog box, in the Type field,
select Duration 3. Select Duration1 and click Rename 4. In the Rename Field dialog box, enter Minimum
Duration, and click OK
We previously used the same name, but we entered it as a title “field label” whereas if you change the name this way, it is easier to identify the field in field lists, because it will be listed under both Duration1 and Minimum Duration. 5. Rename Duration2 to Maximum Duration 6. Rename Duration3 to Weighted Average 7. Rename Duration4 to Quality
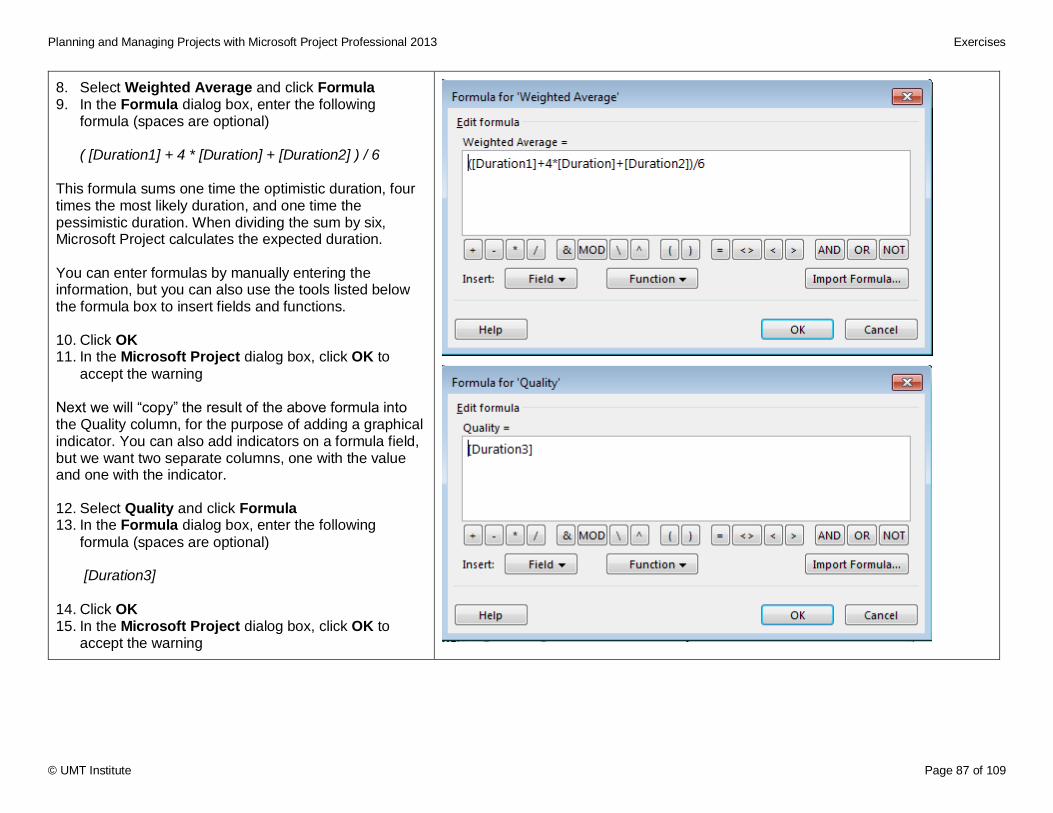
Planning and Managing Projects with Microsoft Project Professional 2013 Exercises
© UMT Institute Page 87 of 109
8. Select Weighted Average and click Formula 9. In the Formula dialog box, enter the following
formula (spaces are optional)
( [Duration1] + 4 * [Duration] + [Duration2] ) / 6
This formula sums one time the optimistic duration, four times the most likely duration, and one time the pessimistic duration. When dividing the sum by six, Microsoft Project calculates the expected duration. You can enter formulas by manually entering the information, but you can also use the tools listed below the formula box to insert fields and functions. 10. Click OK 11. In the Microsoft Project dialog box, click OK to
accept the warning Next we will “copy” the result of the above formula into the Quality column, for the purpose of adding a graphical indicator. You can also add indicators on a formula field, but we want two separate columns, one with the value and one with the indicator. 12. Select Quality and click Formula 13. In the Formula dialog box, enter the following
formula (spaces are optional)
[Duration3]
14. Click OK 15. In the Microsoft Project dialog box, click OK to
accept the warning
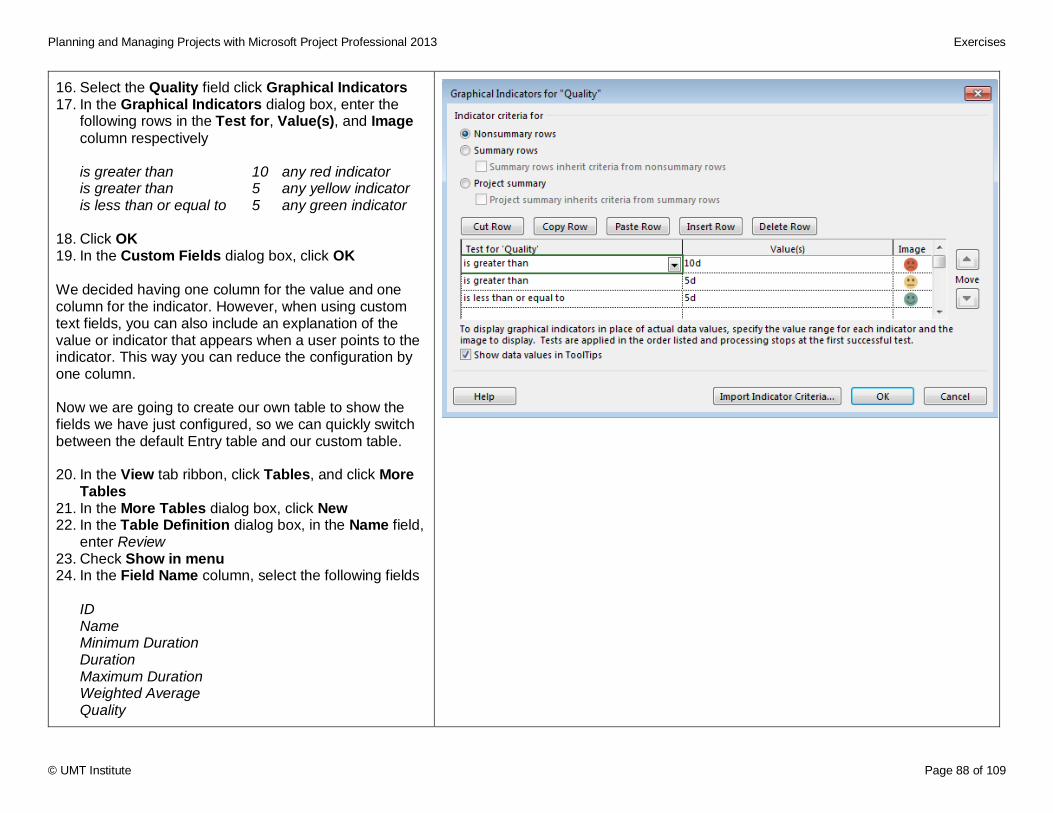
Planning and Managing Projects with Microsoft Project Professional 2013 Exercises
© UMT Institute Page 88 of 109
16. Select the Quality field click Graphical Indicators 17. In the Graphical Indicators dialog box, enter the
following rows in the Test for, Value(s), and Image
column respectively
is greater than 10 any red indicator is greater than 5 any yellow indicator is less than or equal to 5 any green indicator
18. Click OK 19. In the Custom Fields dialog box, click OK
We decided having one column for the value and one column for the indicator. However, when using custom text fields, you can also include an explanation of the value or indicator that appears when a user points to the indicator. This way you can reduce the configuration by one column. Now we are going to create our own table to show the fields we have just configured, so we can quickly switch between the default Entry table and our custom table. 20. In the View tab ribbon, click Tables, and click More
Tables 21. In the More Tables dialog box, click New 22. In the Table Definition dialog box, in the Name field,
enter Review 23. Check Show in menu 24. In the Field Name column, select the following fields
ID Name Minimum Duration Duration Maximum Duration Weighted Average Quality
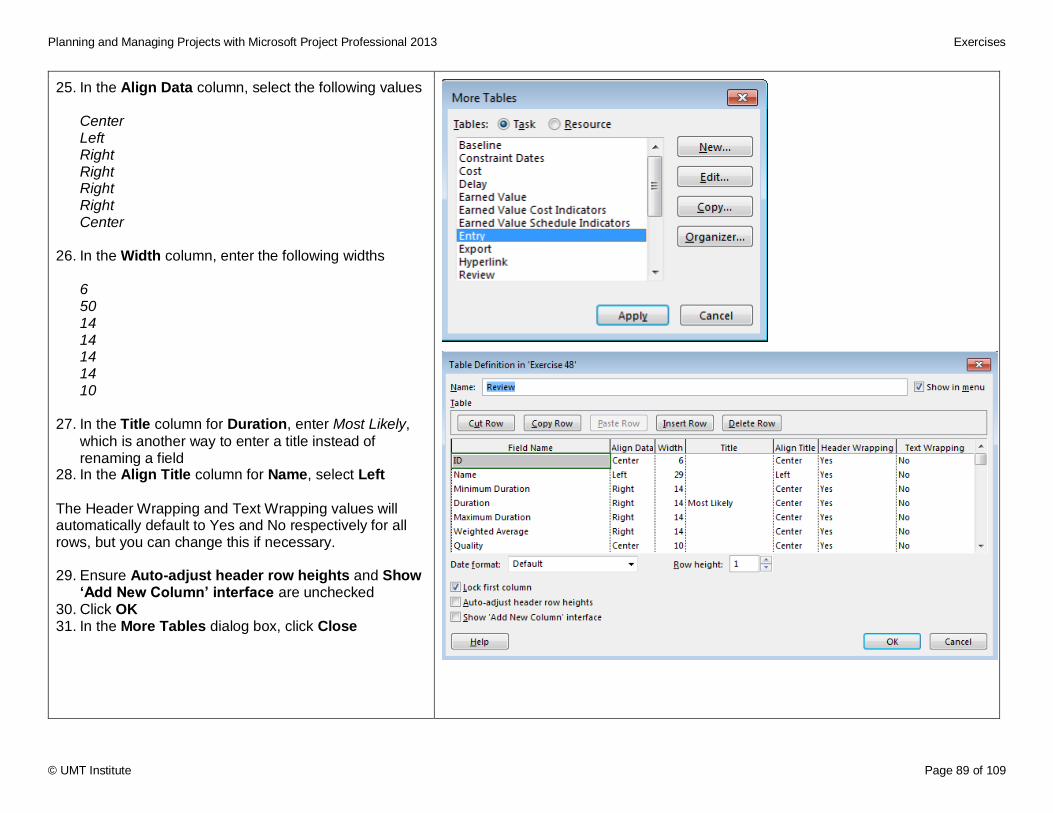
Planning and Managing Projects with Microsoft Project Professional 2013 Exercises
© UMT Institute Page 89 of 109
25. In the Align Data column, select the following values
Center Left Right Right Right Right Center
26. In the Width column, enter the following widths
6 50 14 14 14 14 10
27. In the Title column for Duration, enter Most Likely,
which is another way to enter a title instead of renaming a field
28. In the Align Title column for Name, select Left
The Header Wrapping and Text Wrapping values will automatically default to Yes and No respectively for all rows, but you can change this if necessary. 29. Ensure Auto-adjust header row heights and Show
‘Add New Column’ interface are unchecked 30. Click OK 31. In the More Tables dialog box, click Close
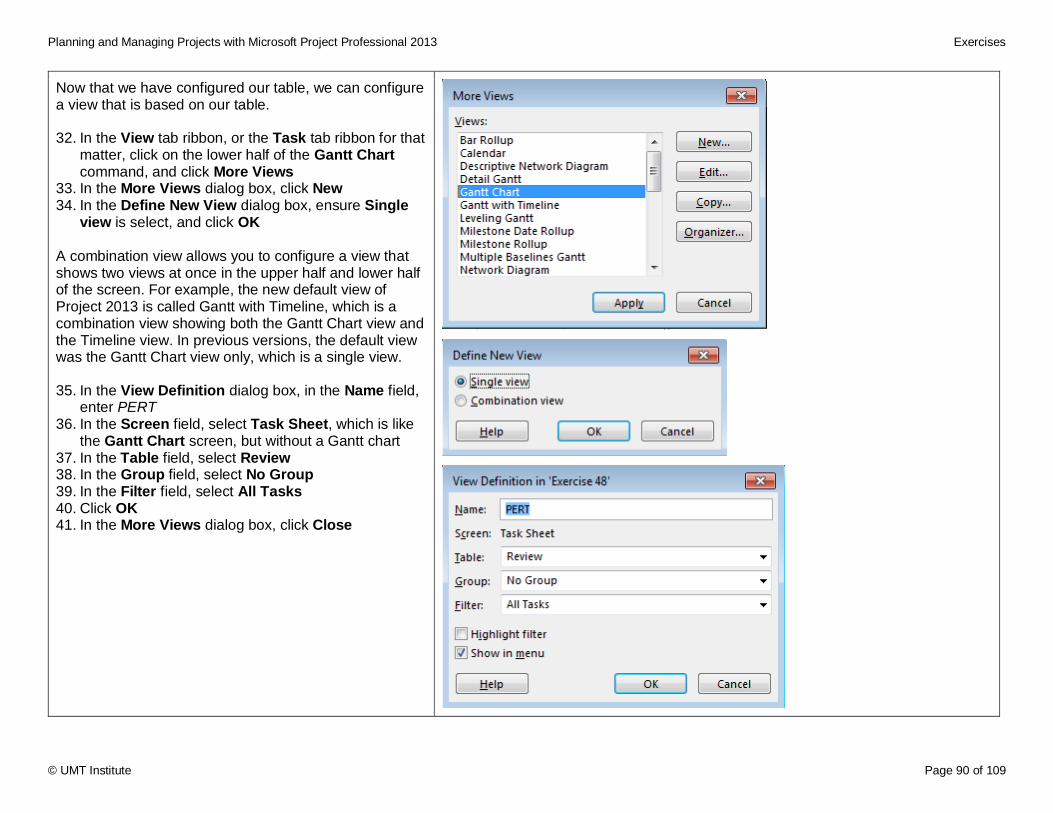
Planning and Managing Projects with Microsoft Project Professional 2013 Exercises
© UMT Institute Page 90 of 109
Now that we have configured our table, we can configure a view that is based on our table. 32. In the View tab ribbon, or the Task tab ribbon for that
matter, click on the lower half of the Gantt Chart command, and click More Views
33. In the More Views dialog box, click New 34. In the Define New View dialog box, ensure Single
view is select, and click OK A combination view allows you to configure a view that shows two views at once in the upper half and lower half of the screen. For example, the new default view of Project 2013 is called Gantt with Timeline, which is a combination view showing both the Gantt Chart view and the Timeline view. In previous versions, the default view was the Gantt Chart view only, which is a single view. 35. In the View Definition dialog box, in the Name field,
enter PERT 36. In the Screen field, select Task Sheet, which is like
the Gantt Chart screen, but without a Gantt chart 37. In the Table field, select Review 38. In the Group field, select No Group 39. In the Filter field, select All Tasks 40. Click OK 41. In the More Views dialog box, click Close
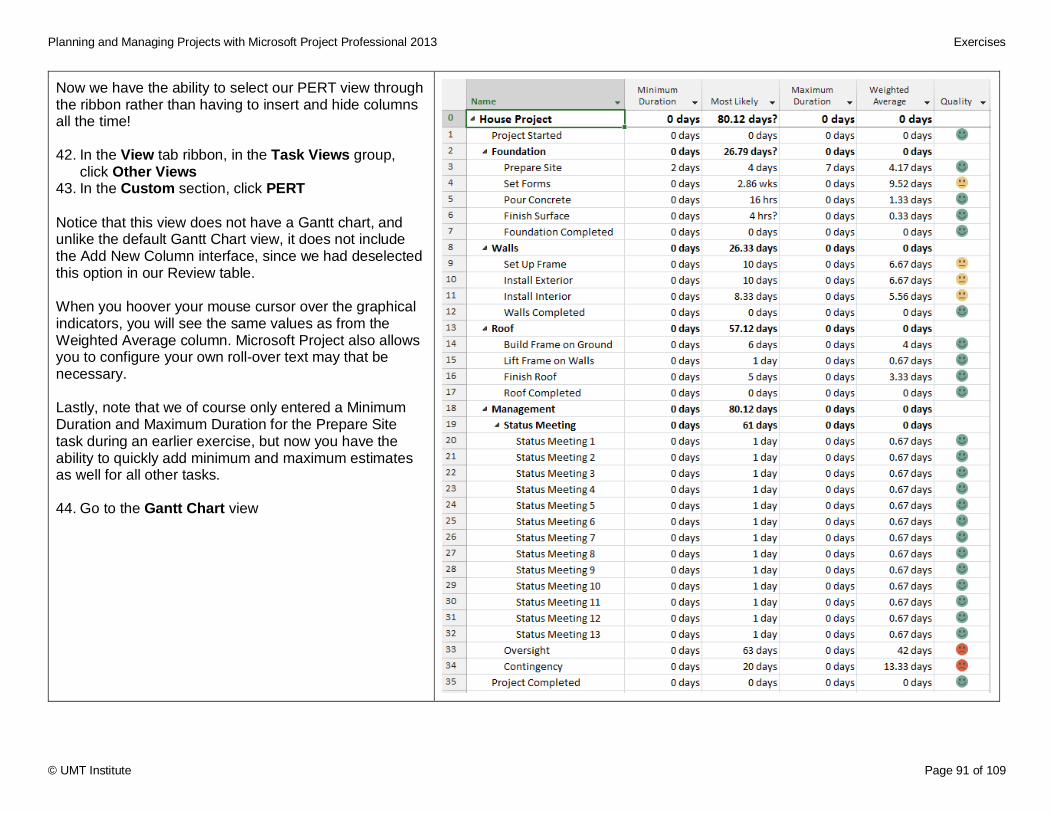
Planning and Managing Projects with Microsoft Project Professional 2013 Exercises
© UMT Institute Page 91 of 109
Now we have the ability to select our PERT view through the ribbon rather than having to insert and hide columns all the time! 42. In the View tab ribbon, in the Task Views group,
click Other Views 43. In the Custom section, click PERT
Notice that this view does not have a Gantt chart, and unlike the default Gantt Chart view, it does not include the Add New Column interface, since we had deselected this option in our Review table. When you hoover your mouse cursor over the graphical indicators, you will see the same values as from the Weighted Average column. Microsoft Project also allows you to configure your own roll-over text may that be necessary. Lastly, note that we of course only entered a Minimum Duration and Maximum Duration for the Prepare Site task during an earlier exercise, but now you have the ability to quickly add minimum and maximum estimates as well for all other tasks. 44. Go to the Gantt Chart view
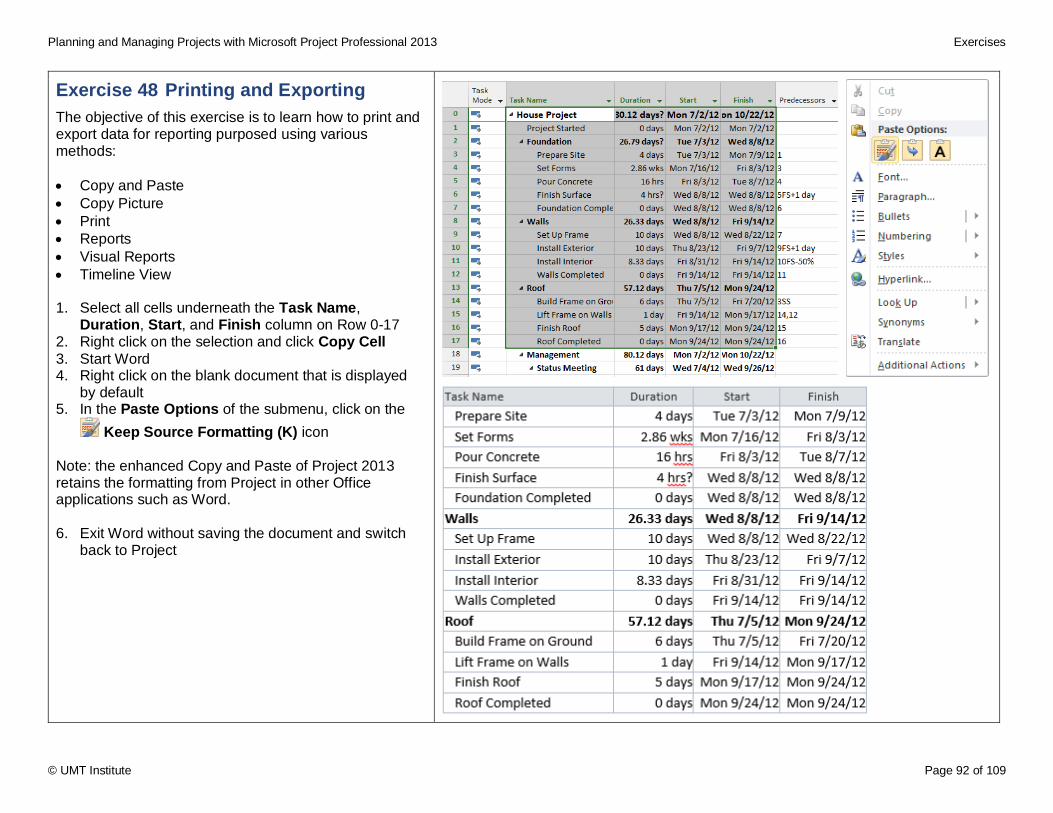
Planning and Managing Projects with Microsoft Project Professional 2013 Exercises
© UMT Institute Page 92 of 109
Exercise 48 Printing and Exporting
The objective of this exercise is to learn how to print and export data for reporting purposed using various methods:
Copy and Paste
Copy Picture
Reports
Visual Reports
Timeline View 1. Select all cells underneath the Task Name,
Duration, Start, and Finish column on Row 0-17 2. Right click on the selection and click Copy Cell
3. Start Word 4. Right click on the blank document that is displayed
by default 5. In the Paste Options of the submenu, click on the
Keep Source Formatting (K) icon Note: the enhanced Copy and Paste of Project 2013 retains the formatting from Project in other Office applications such as Word. 6. Exit Word without saving the document and switch
back to Project
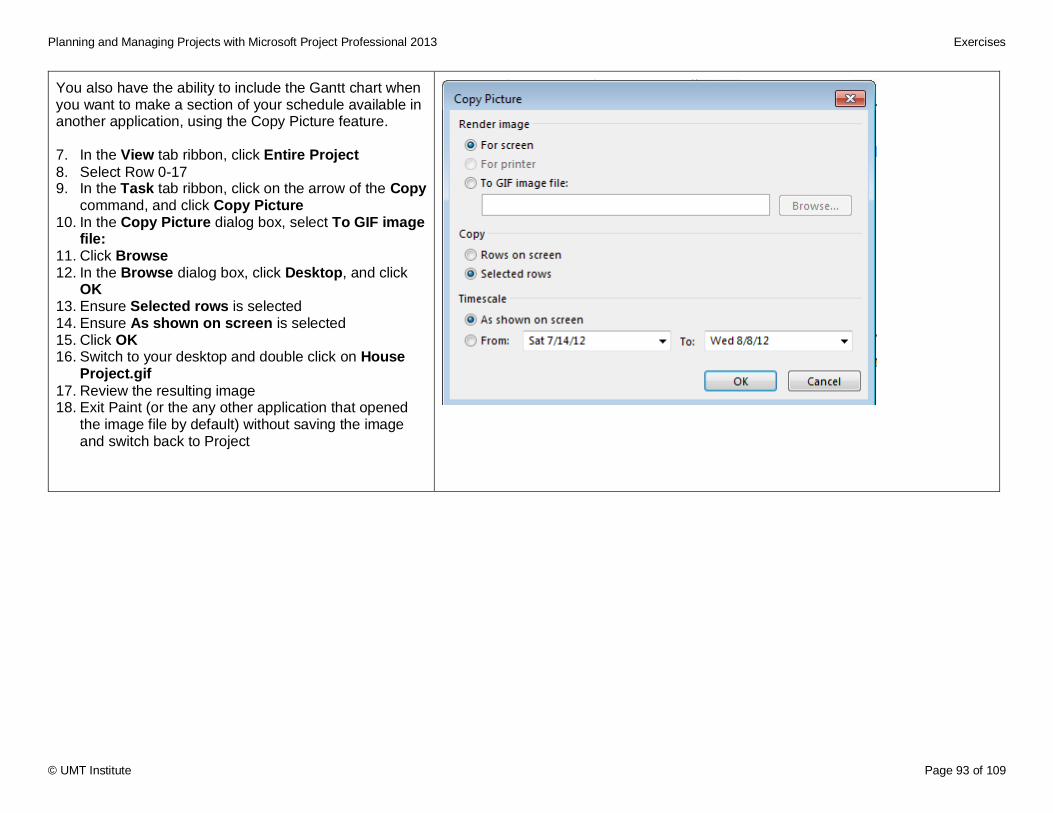
Planning and Managing Projects with Microsoft Project Professional 2013 Exercises
© UMT Institute Page 93 of 109
You also have the ability to include the Gantt chart when you want to make a section of your schedule available in another application, using the Copy Picture feature. 7. In the View tab ribbon, click Entire Project
8. Select Row 0-17 9. In the Task tab ribbon, click on the arrow of the Copy
command, and click Copy Picture 10. In the Copy Picture dialog box, select To GIF image
file: 11. Click Browse 12. In the Browse dialog box, click Desktop, and click
OK 13. Ensure Selected rows is selected 14. Ensure As shown on screen is selected 15. Click OK 16. Switch to your desktop and double click on House
Project.gif
17. Review the resulting image 18. Exit Paint (or the any other application that opened
the image file by default) without saving the image and switch back to Project
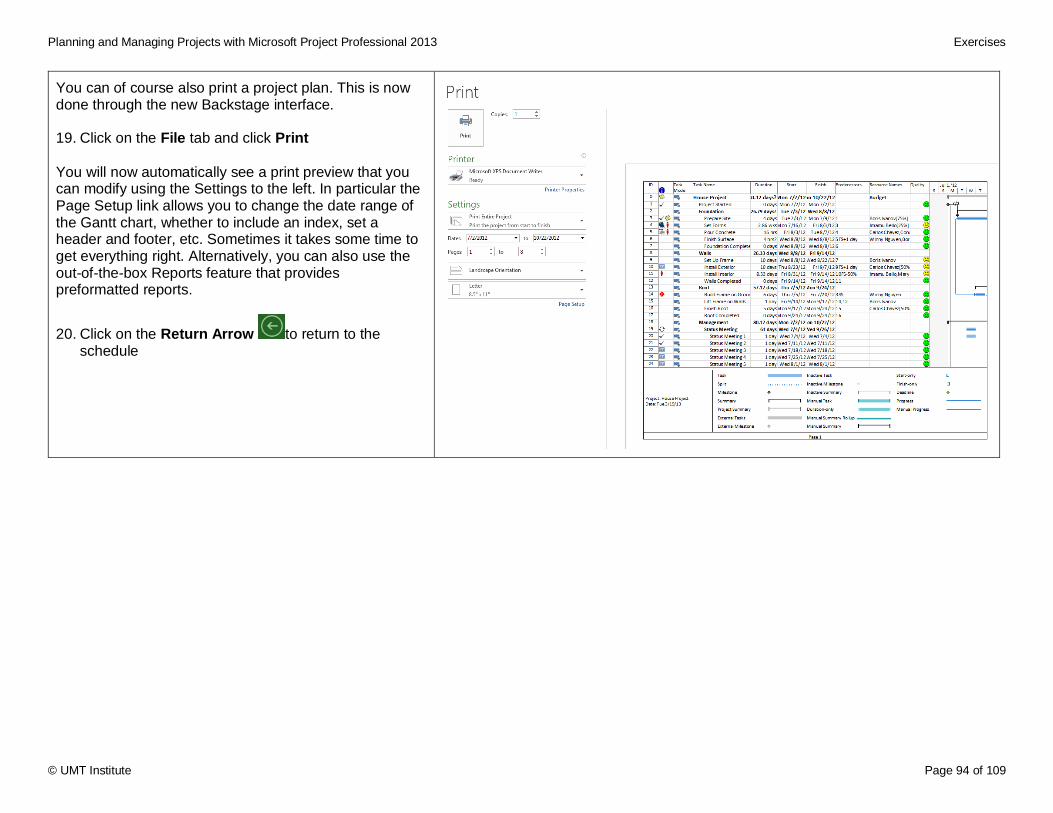
Planning and Managing Projects with Microsoft Project Professional 2013 Exercises
© UMT Institute Page 94 of 109
You can of course also print a project plan. This is now done through the new Backstage interface. 19. Click on the File tab and click Print
You will now automatically see a print preview that you can modify using the Settings to the left. In particular the Page Setup link allows you to change the date range of the Gantt chart, whether to include an index, set a header and footer, etc. Sometimes it takes some time to get everything right. Alternatively, you can also use the out-of-the-box Reports feature that provides preformatted reports.
20. Click on the Return Arrow to return to the schedule
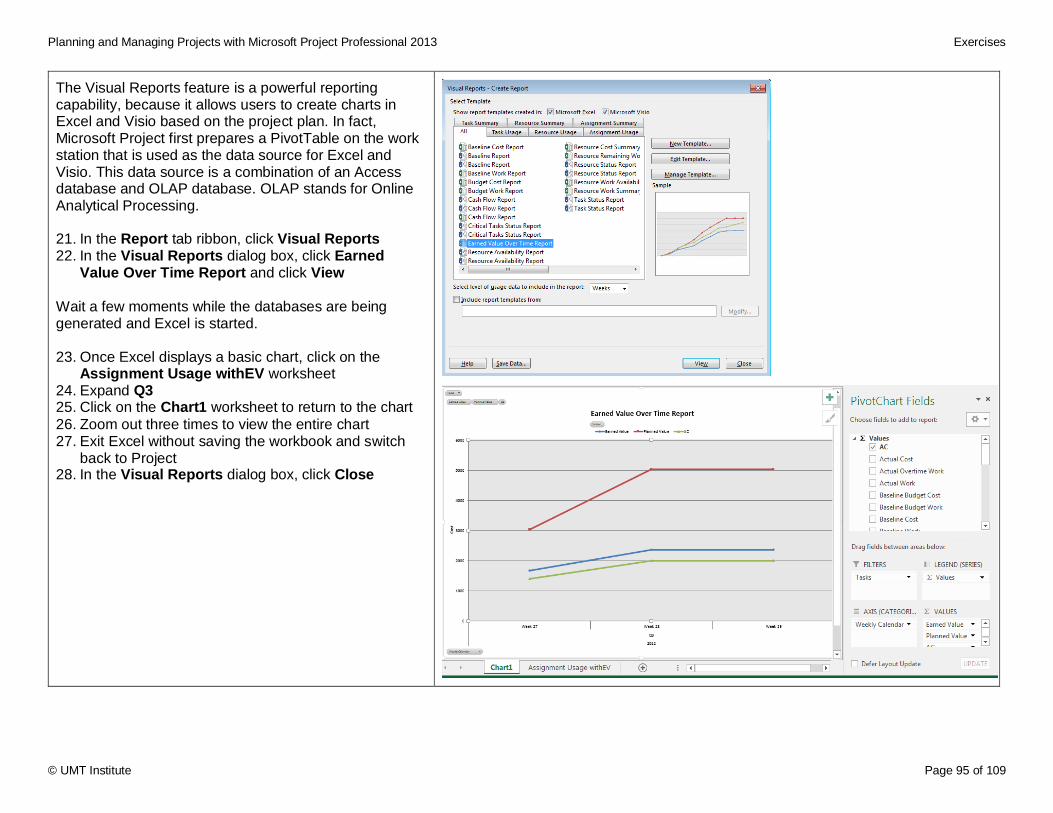
Planning and Managing Projects with Microsoft Project Professional 2013 Exercises
© UMT Institute Page 95 of 109
The Visual Reports feature is a powerful reporting capability, because it allows users to create charts in Excel and Visio based on the project plan. In fact, Microsoft Project first prepares a PivotTable on the work station that is used as the data source for Excel and Visio. This data source is a combination of an Access database and OLAP database. OLAP stands for Online Analytical Processing. 21. In the Report tab ribbon, click Visual Reports 22. In the Visual Reports dialog box, click Earned
Value Over Time Report and click View Wait a few moments while the databases are being generated and Excel is started. 23. Once Excel displays a basic chart, click on the
Assignment Usage withEV worksheet 24. Expand Q3 25. Click on the Chart1 worksheet to return to the chart
26. Zoom out three times to view the entire chart 27. Exit Excel without saving the workbook and switch
back to Project 28. In the Visual Reports dialog box, click Close
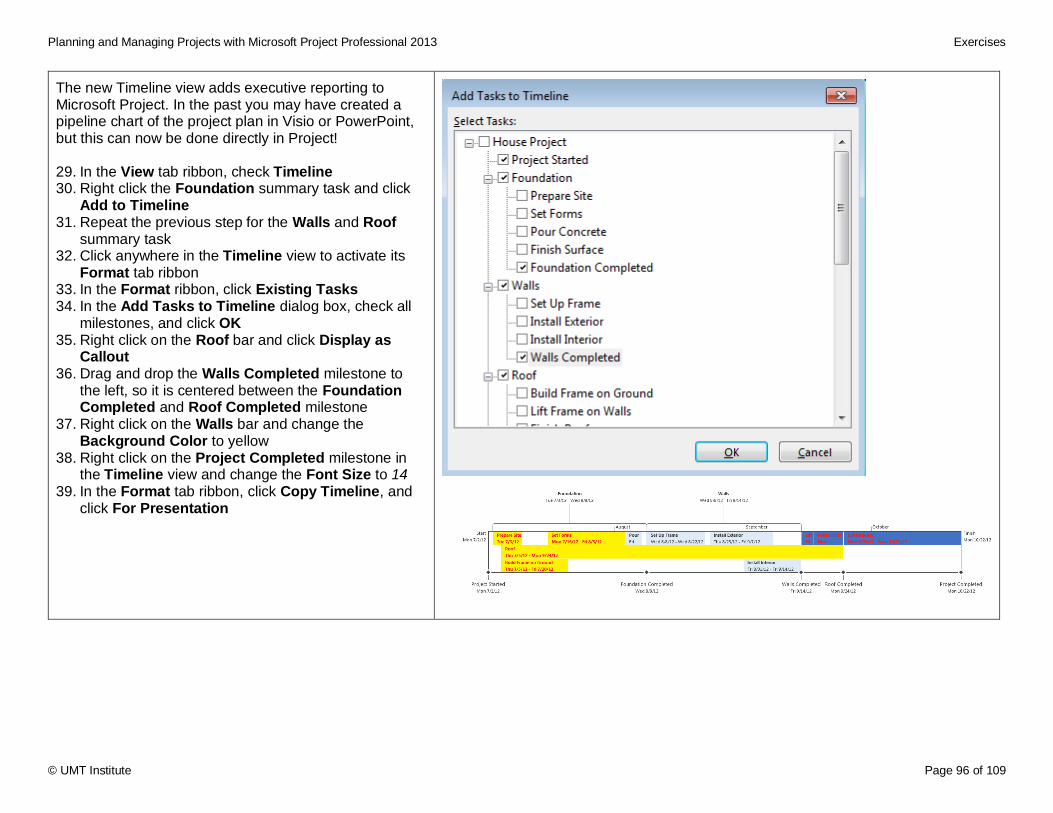
Planning and Managing Projects with Microsoft Project Professional 2013 Exercises
© UMT Institute Page 96 of 109
The new Timeline view adds executive reporting to Microsoft Project. In the past you may have created a pipeline chart of the project plan in Visio or PowerPoint, but this can now be done directly in Project! 29. In the View tab ribbon, check Timeline 30. Right click the Foundation summary task and click
Add to Timeline 31. Repeat the previous step for the Walls and Roof
summary task 32. Click anywhere in the Timeline view to activate its
Format tab ribbon 33. In the Format ribbon, click Existing Tasks 34. In the Add Tasks to Timeline dialog box, check all
milestones, and click OK 35. Right click on the Roof bar and click Display as
Callout 36. Drag and drop the Walls Completed milestone to
the left, so it is centered between the Foundation Completed and Roof Completed milestone
37. Right click on the Walls bar and change the Background Color to yellow
38. Right click on the Project Completed milestone in the Timeline view and change the Font Size to 14
39. In the Format tab ribbon, click Copy Timeline, and click For Presentation
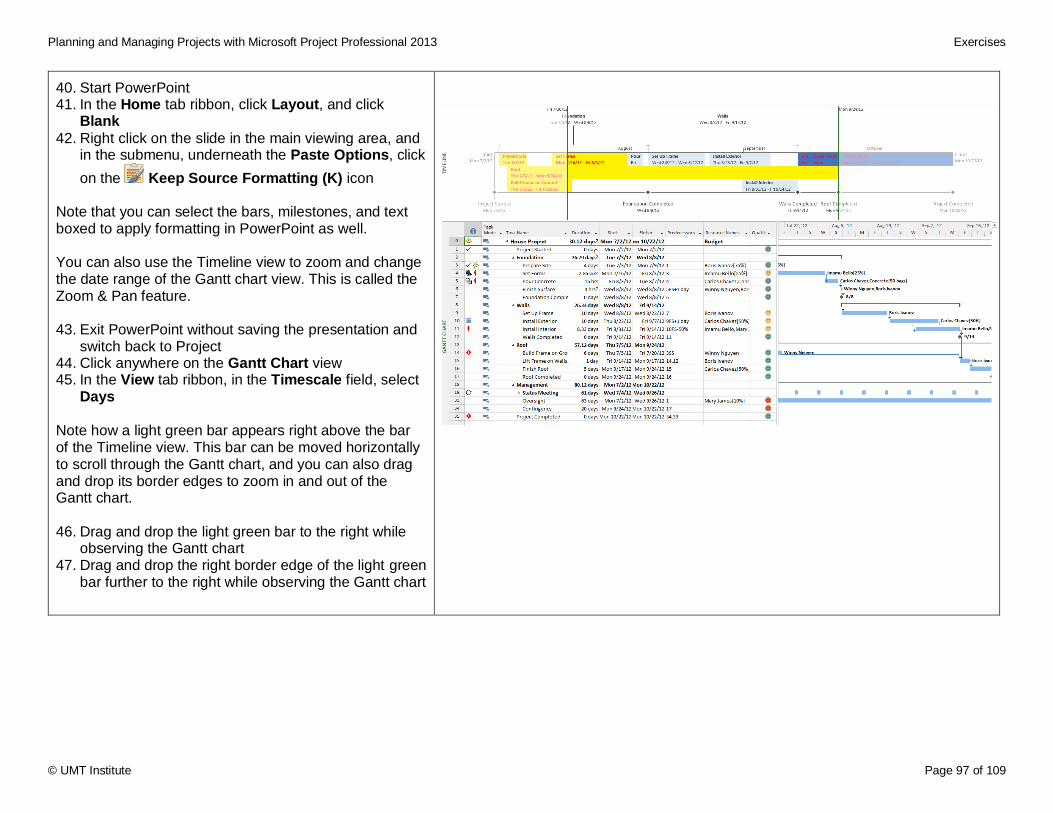
Planning and Managing Projects with Microsoft Project Professional 2013 Exercises
© UMT Institute Page 97 of 109
40. Start PowerPoint 41. In the Home tab ribbon, click Layout, and click
Blank
42. Right click on the slide in the main viewing area, and in the submenu, underneath the Paste Options, click
on the Keep Source Formatting (K) icon Note that you can select the bars, milestones, and text boxed to apply formatting in PowerPoint as well. You can also use the Timeline view to zoom and change the date range of the Gantt chart view. This is called the Zoom & Pan feature. 43. Exit PowerPoint without saving the presentation and
switch back to Project 44. Click anywhere on the Gantt Chart view 45. In the View tab ribbon, in the Timescale field, select
Days
Note how a light green bar appears right above the bar of the Timeline view. This bar can be moved horizontally to scroll through the Gantt chart, and you can also drag and drop its border edges to zoom in and out of the Gantt chart. 46. Drag and drop the light green bar to the right while
observing the Gantt chart 47. Drag and drop the right border edge of the light green
bar further to the right while observing the Gantt chart
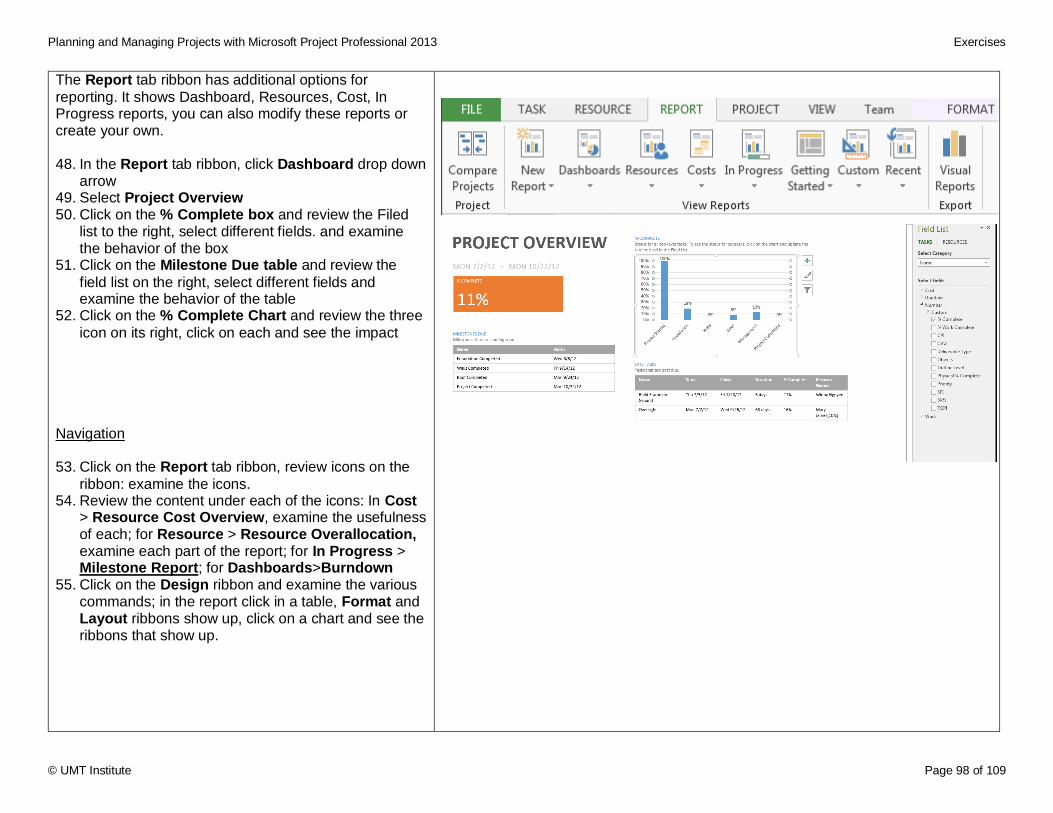
Planning and Managing Projects with Microsoft Project Professional 2013 Exercises
© UMT Institute Page 98 of 109
The Report tab ribbon has additional options for
reporting. It shows Dashboard, Resources, Cost, In Progress reports, you can also modify these reports or create your own. 48. In the Report tab ribbon, click Dashboard drop down
arrow 49. Select Project Overview 50. Click on the % Complete box and review the Filed
list to the right, select different fields. and examine the behavior of the box
51. Click on the Milestone Due table and review the
field list on the right, select different fields and examine the behavior of the table
52. Click on the % Complete Chart and review the three
icon on its right, click on each and see the impact Navigation 53. Click on the Report tab ribbon, review icons on the
ribbon: examine the icons. 54. Review the content under each of the icons: In Cost
> Resource Cost Overview, examine the usefulness of each; for Resource > Resource Overallocation, examine each part of the report; for In Progress > Milestone Report; for Dashboards>Burndown
55. Click on the Design ribbon and examine the various commands; in the report click in a table, Format and Layout ribbons show up, click on a chart and see the ribbons that show up.
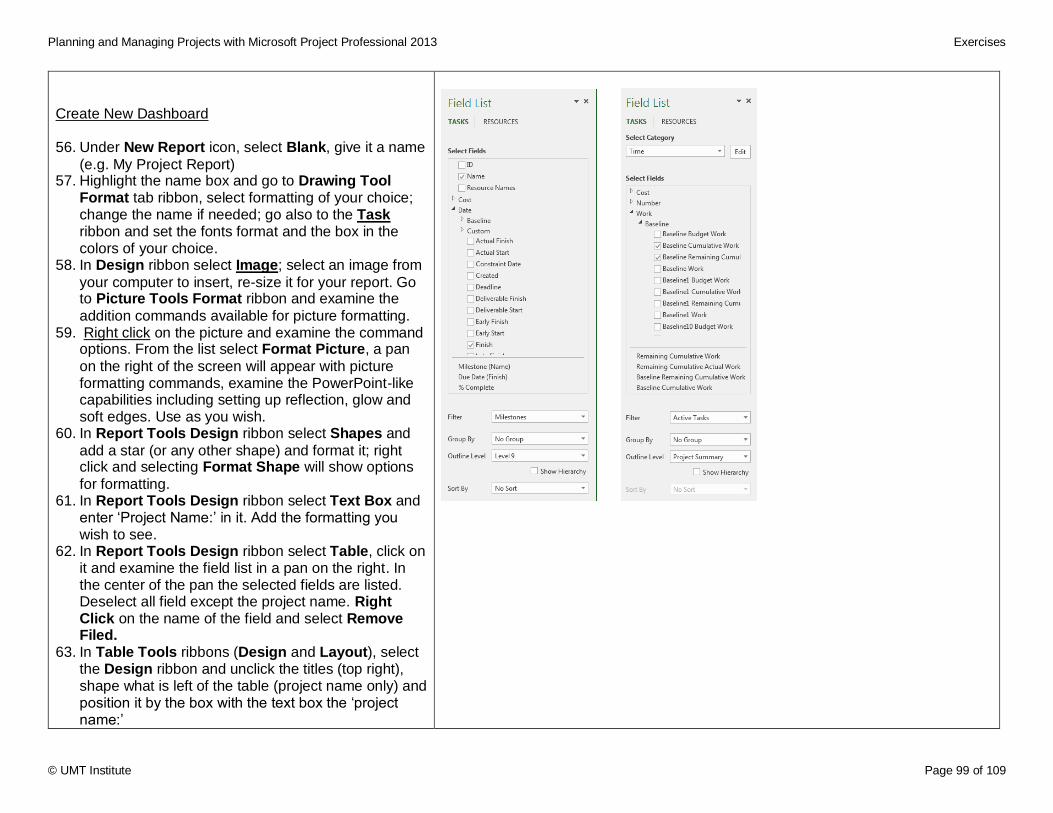
Planning and Managing Projects with Microsoft Project Professional 2013 Exercises
© UMT Institute Page 99 of 109
Create New Dashboard 56. Under New Report icon, select Blank, give it a name
(e.g. My Project Report) 57. Highlight the name box and go to Drawing Tool
Format tab ribbon, select formatting of your choice; change the name if needed; go also to the Task ribbon and set the fonts format and the box in the colors of your choice.
58. In Design ribbon select Image; select an image from
your computer to insert, re-size it for your report. Go to Picture Tools Format ribbon and examine the
addition commands available for picture formatting. 59. Right click on the picture and examine the command
options. From the list select Format Picture, a pan
on the right of the screen will appear with picture formatting commands, examine the PowerPoint-like capabilities including setting up reflection, glow and soft edges. Use as you wish.
60. In Report Tools Design ribbon select Shapes and
add a star (or any other shape) and format it; right click and selecting Format Shape will show options
for formatting. 61. In Report Tools Design ribbon select Text Box and
enter ‘Project Name:’ in it. Add the formatting you wish to see.
62. In Report Tools Design ribbon select Table, click on it and examine the field list in a pan on the right. In the center of the pan the selected fields are listed. Deselect all field except the project name. Right Click on the name of the field and select Remove Filed.
63. In Table Tools ribbons (Design and Layout), select the Design ribbon and unclick the titles (top right), shape what is left of the table (project name only) and position it by the box with the text box the ‘project name:’
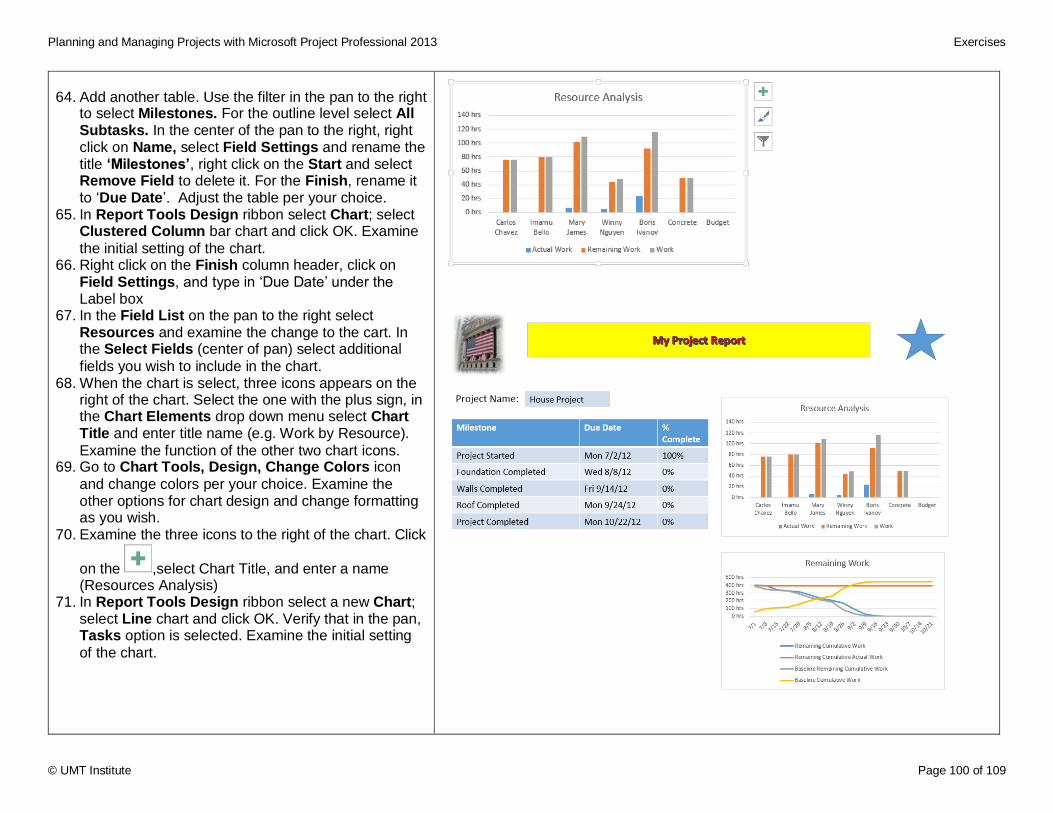
Planning and Managing Projects with Microsoft Project Professional 2013 Exercises
© UMT Institute Page 100 of 109
64. Add another table. Use the filter in the pan to the right
to select Milestones. For the outline level select All Subtasks. In the center of the pan to the right, right click on Name, select Field Settings and rename the title ‘Milestones’, right click on the Start and select Remove Field to delete it. For the Finish, rename it to ‘Due Date’. Adjust the table per your choice.
65. In Report Tools Design ribbon select Chart; select Clustered Column bar chart and click OK. Examine
the initial setting of the chart. 66. Right click on the Finish column header, click on
Field Settings, and type in ‘Due Date’ under the Label box
67. In the Field List on the pan to the right select Resources and examine the change to the cart. In the Select Fields (center of pan) select additional
fields you wish to include in the chart. 68. When the chart is select, three icons appears on the
right of the chart. Select the one with the plus sign, in the Chart Elements drop down menu select Chart Title and enter title name (e.g. Work by Resource).
Examine the function of the other two chart icons. 69. Go to Chart Tools, Design, Change Colors icon
and change colors per your choice. Examine the other options for chart design and change formatting as you wish.
70. Examine the three icons to the right of the chart. Click
on the ,select Chart Title, and enter a name (Resources Analysis)
71. In Report Tools Design ribbon select a new Chart; select Line chart and click OK. Verify that in the pan, Tasks option is selected. Examine the initial setting
of the chart.
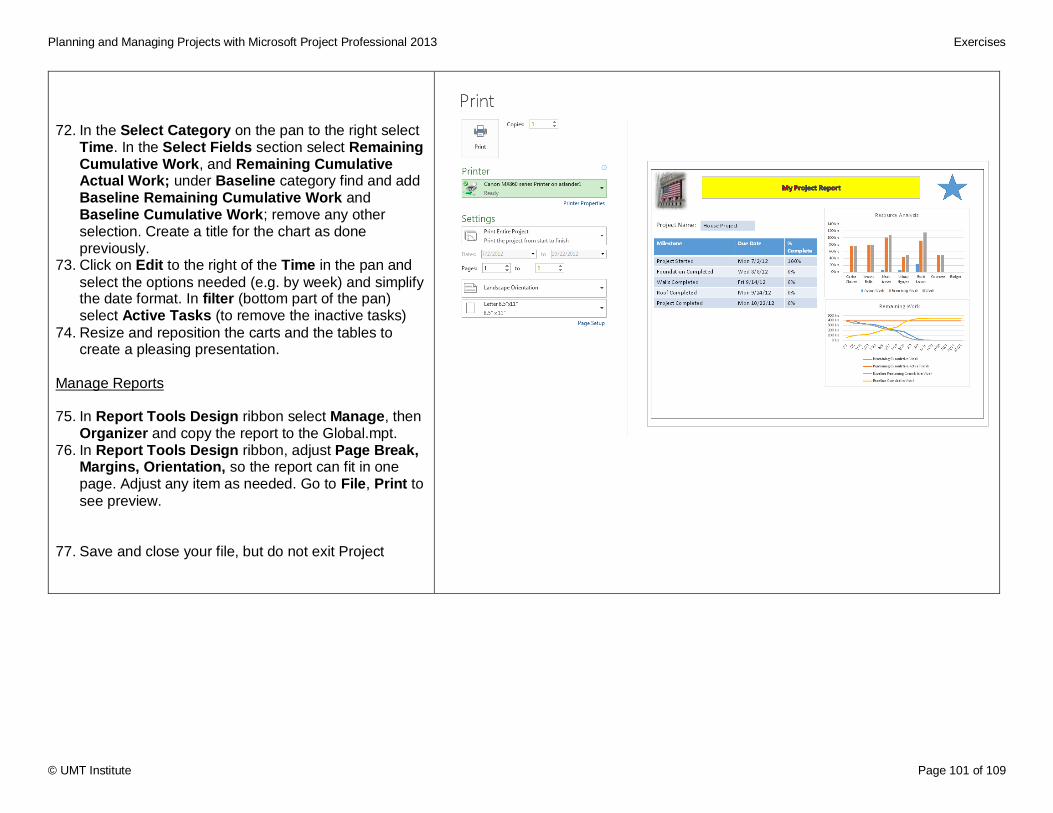
Planning and Managing Projects with Microsoft Project Professional 2013 Exercises
© UMT Institute Page 101 of 109
72. In the Select Category on the pan to the right select Time. In the Select Fields section select Remaining Cumulative Work, and Remaining Cumulative Actual Work; under Baseline category find and add Baseline Remaining Cumulative Work and Baseline Cumulative Work; remove any other selection. Create a title for the chart as done previously.
73. Click on Edit to the right of the Time in the pan and
select the options needed (e.g. by week) and simplify the date format. In filter (bottom part of the pan) select Active Tasks (to remove the inactive tasks)
74. Resize and reposition the carts and the tables to create a pleasing presentation.
Manage Reports 75. In Report Tools Design ribbon select Manage, then
Organizer and copy the report to the Global.mpt. 76. In Report Tools Design ribbon, adjust Page Break,
Margins, Orientation, so the report can fit in one page. Adjust any item as needed. Go to File, Print to
see preview.
77. Save and close your file, but do not exit Project
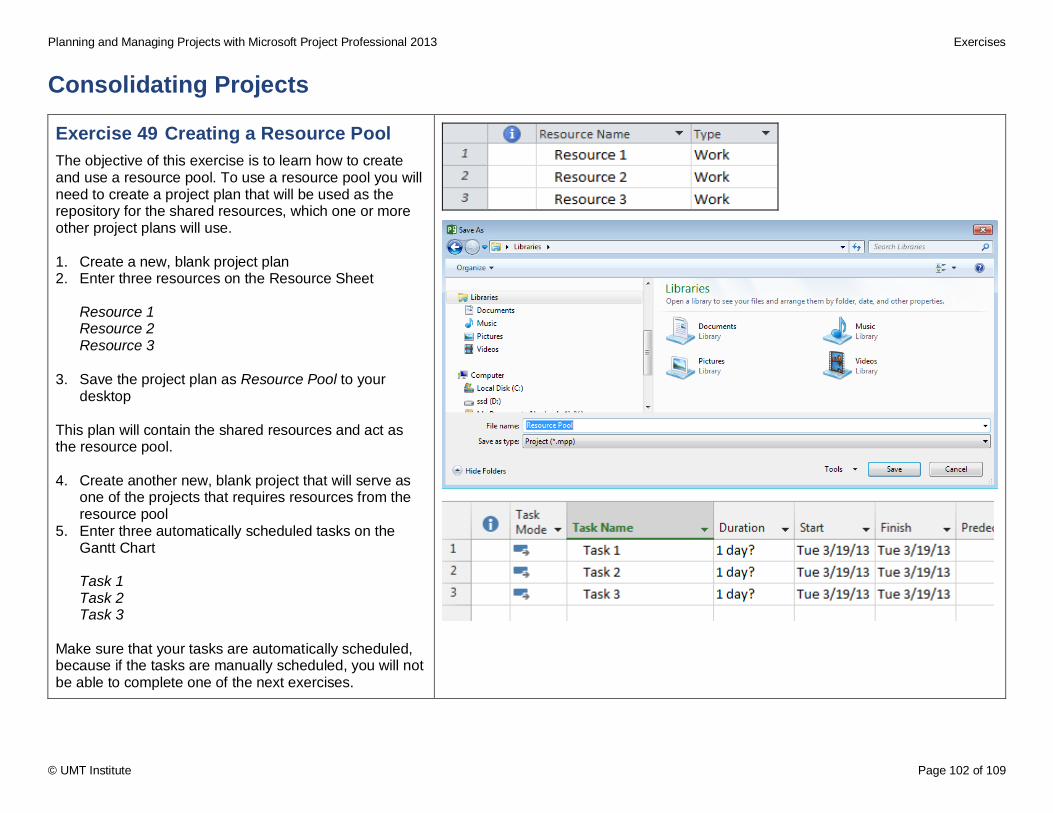
Planning and Managing Projects with Microsoft Project Professional 2013 Exercises
© UMT Institute Page 102 of 109
Consolidating Projects
Exercise 49 Creating a Resource Pool
The objective of this exercise is to learn how to create and use a resource pool. To use a resource pool you will need to create a project plan that will be used as the repository for the shared resources, which one or more other project plans will use. 1. Create a new, blank project plan 2. Enter three resources on the Resource Sheet
Resource 1 Resource 2 Resource 3
3. Save the project plan as Resource Pool to your
desktop This plan will contain the shared resources and act as the resource pool. 4. Create another new, blank project that will serve as
one of the projects that requires resources from the resource pool
5. Enter three automatically scheduled tasks on the Gantt Chart
Task 1 Task 2 Task 3
Make sure that your tasks are automatically scheduled, because if the tasks are manually scheduled, you will not be able to complete one of the next exercises.
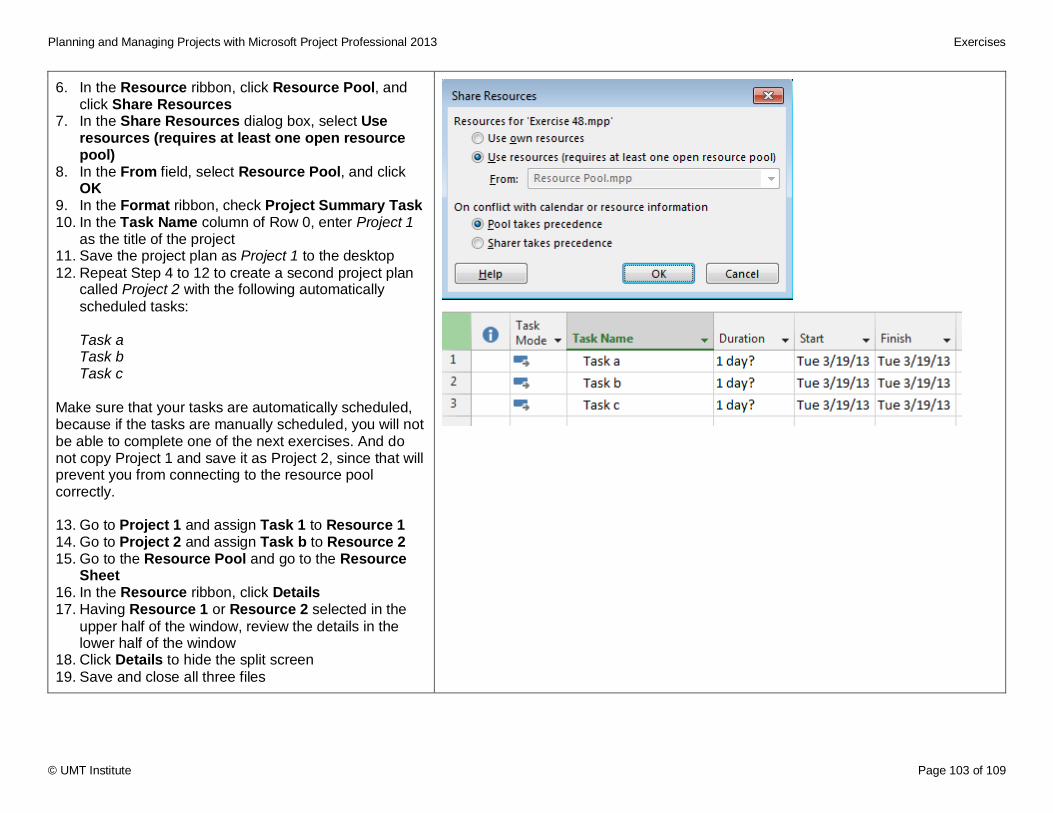
Planning and Managing Projects with Microsoft Project Professional 2013 Exercises
© UMT Institute Page 103 of 109
6. In the Resource ribbon, click Resource Pool, and click Share Resources
7. In the Share Resources dialog box, select Use resources (requires at least one open resource pool)
8. In the From field, select Resource Pool, and click OK
9. In the Format ribbon, check Project Summary Task 10. In the Task Name column of Row 0, enter Project 1
as the title of the project 11. Save the project plan as Project 1 to the desktop
12. Repeat Step 4 to 12 to create a second project plan called Project 2 with the following automatically
scheduled tasks:
Task a Task b Task c
Make sure that your tasks are automatically scheduled, because if the tasks are manually scheduled, you will not be able to complete one of the next exercises. And do not copy Project 1 and save it as Project 2, since that will prevent you from connecting to the resource pool correctly. 13. Go to Project 1 and assign Task 1 to Resource 1 14. Go to Project 2 and assign Task b to Resource 2 15. Go to the Resource Pool and go to the Resource
Sheet 16. In the Resource ribbon, click Details 17. Having Resource 1 or Resource 2 selected in the
upper half of the window, review the details in the lower half of the window
18. Click Details to hide the split screen
19. Save and close all three files
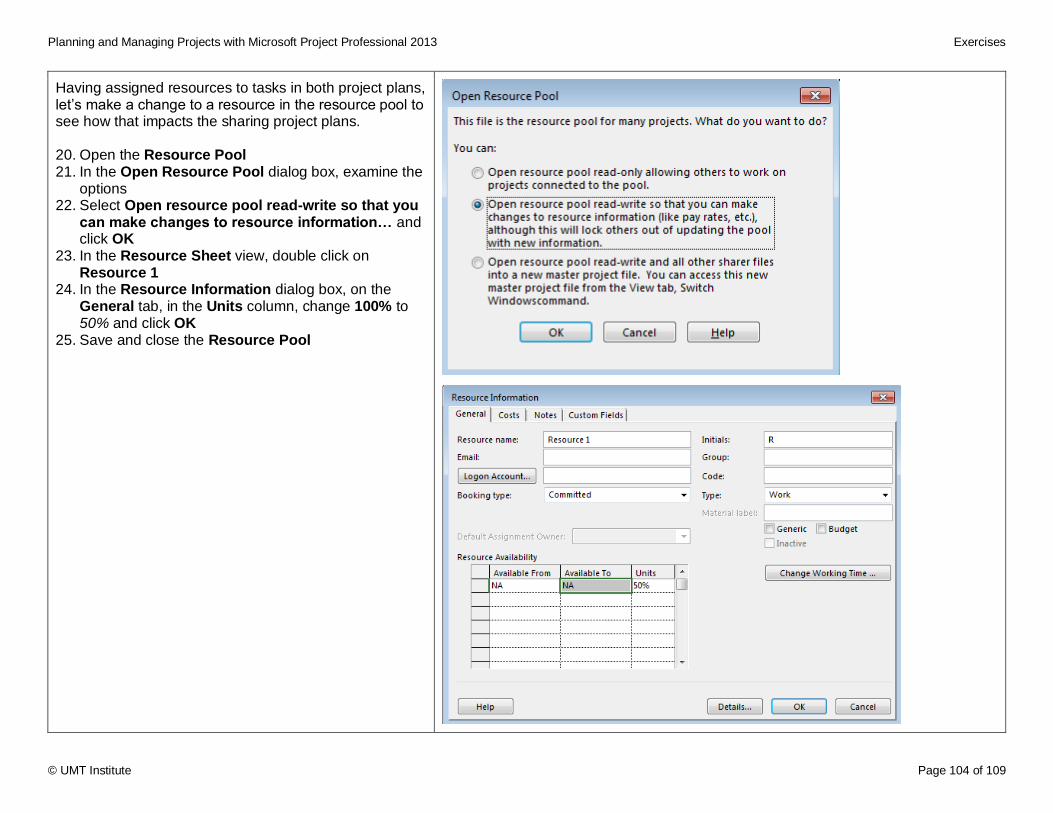
Planning and Managing Projects with Microsoft Project Professional 2013 Exercises
© UMT Institute Page 104 of 109
Having assigned resources to tasks in both project plans, let’s make a change to a resource in the resource pool to see how that impacts the sharing project plans. 20. Open the Resource Pool 21. In the Open Resource Pool dialog box, examine the
options 22. Select Open resource pool read-write so that you
can make changes to resource information… and click OK
23. In the Resource Sheet view, double click on Resource 1
24. In the Resource Information dialog box, on the General tab, in the Units column, change 100% to 50% and click OK
25. Save and close the Resource Pool
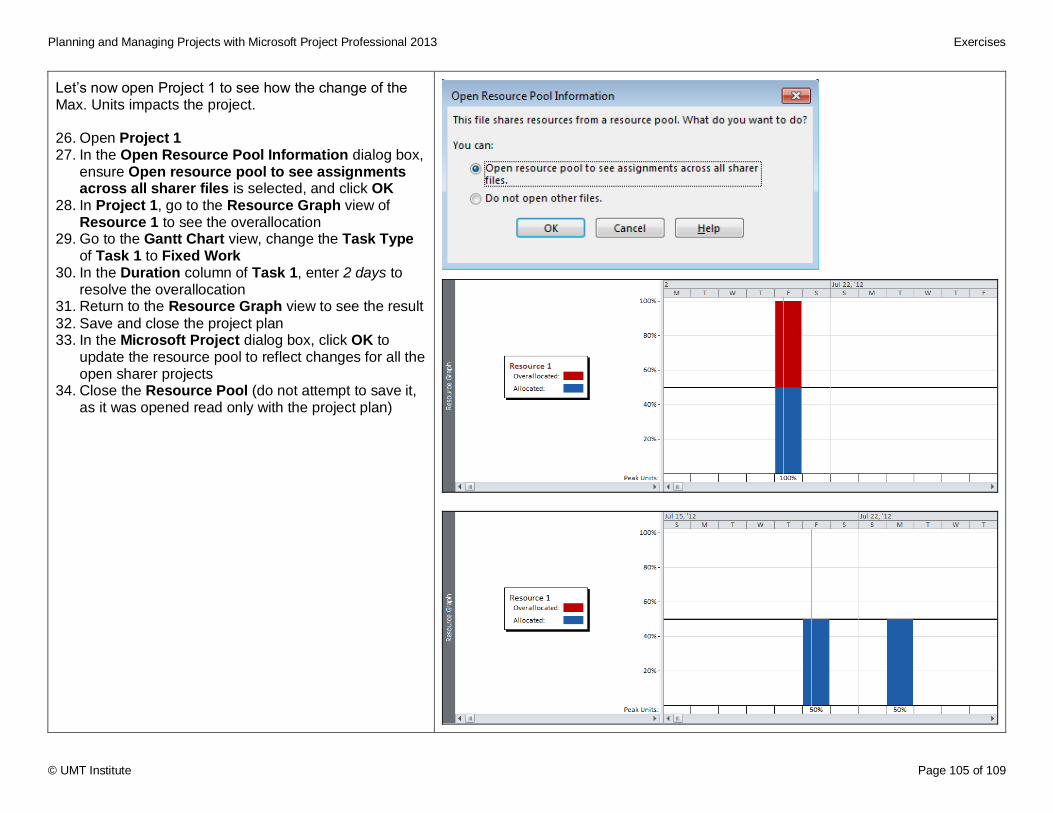
Planning and Managing Projects with Microsoft Project Professional 2013 Exercises
© UMT Institute Page 105 of 109
Let’s now open Project 1 to see how the change of the Max. Units impacts the project. 26. Open Project 1 27. In the Open Resource Pool Information dialog box,
ensure Open resource pool to see assignments across all sharer files is selected, and click OK
28. In Project 1, go to the Resource Graph view of Resource 1 to see the overallocation
29. Go to the Gantt Chart view, change the Task Type of Task 1 to Fixed Work
30. In the Duration column of Task 1, enter 2 days to resolve the overallocation
31. Return to the Resource Graph view to see the result
32. Save and close the project plan 33. In the Microsoft Project dialog box, click OK to
update the resource pool to reflect changes for all the open sharer projects
34. Close the Resource Pool (do not attempt to save it, as it was opened read only with the project plan)
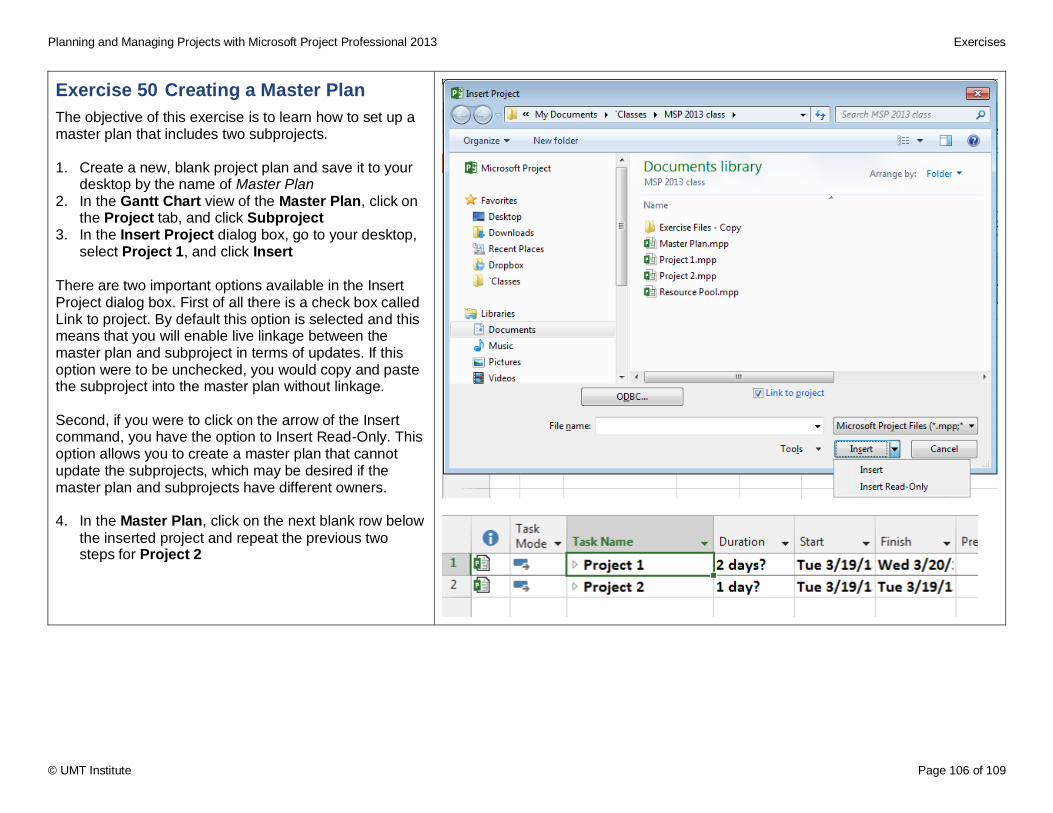
Planning and Managing Projects with Microsoft Project Professional 2013 Exercises
© UMT Institute Page 106 of 109
Exercise 50 Creating a Master Plan
The objective of this exercise is to learn how to set up a master plan that includes two subprojects. 1. Create a new, blank project plan and save it to your
desktop by the name of Master Plan 2. In the Gantt Chart view of the Master Plan, click on
the Project tab, and click Subproject 3. In the Insert Project dialog box, go to your desktop,
select Project 1, and click Insert There are two important options available in the Insert Project dialog box. First of all there is a check box called Link to project. By default this option is selected and this means that you will enable live linkage between the master plan and subproject in terms of updates. If this option were to be unchecked, you would copy and paste the subproject into the master plan without linkage. Second, if you were to click on the arrow of the Insert command, you have the option to Insert Read-Only. This option allows you to create a master plan that cannot update the subprojects, which may be desired if the master plan and subprojects have different owners. 4. In the Master Plan, click on the next blank row below
the inserted project and repeat the previous two steps for Project 2
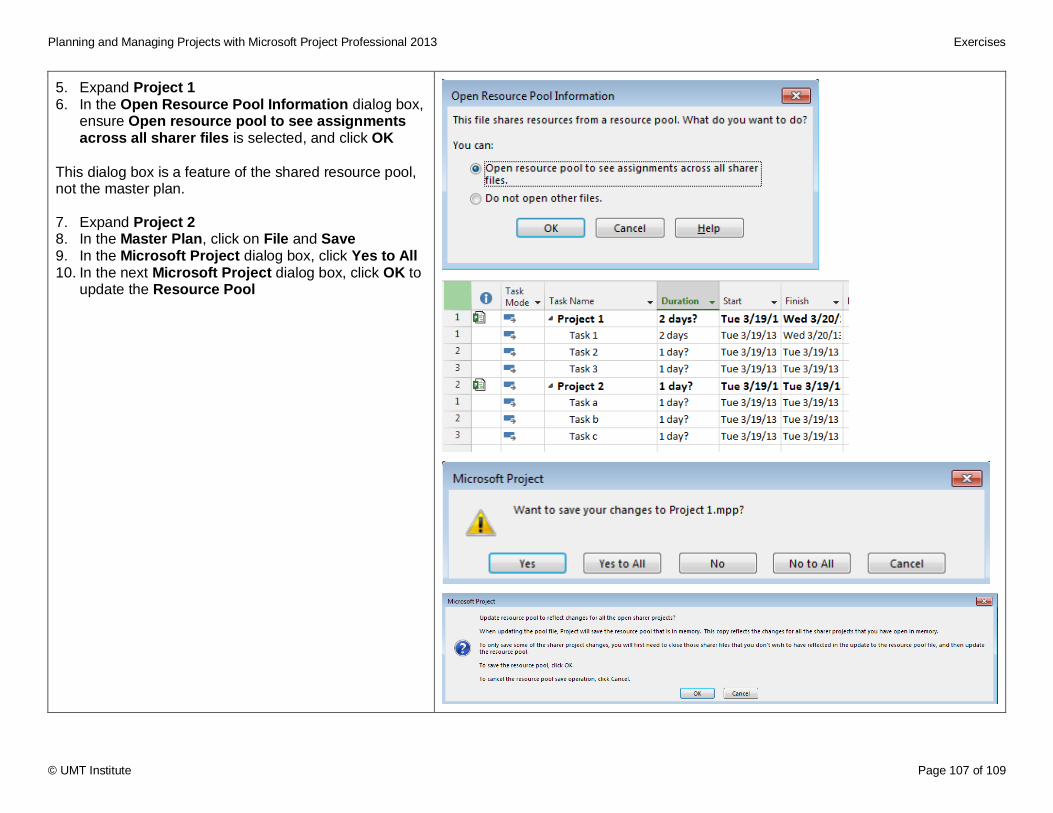
Planning and Managing Projects with Microsoft Project Professional 2013 Exercises
© UMT Institute Page 107 of 109
5. Expand Project 1 6. In the Open Resource Pool Information dialog box,
ensure Open resource pool to see assignments across all sharer files is selected, and click OK
This dialog box is a feature of the shared resource pool, not the master plan. 7. Expand Project 2 8. In the Master Plan, click on File and Save 9. In the Microsoft Project dialog box, click Yes to All 10. In the next Microsoft Project dialog box, click OK to
update the Resource Pool
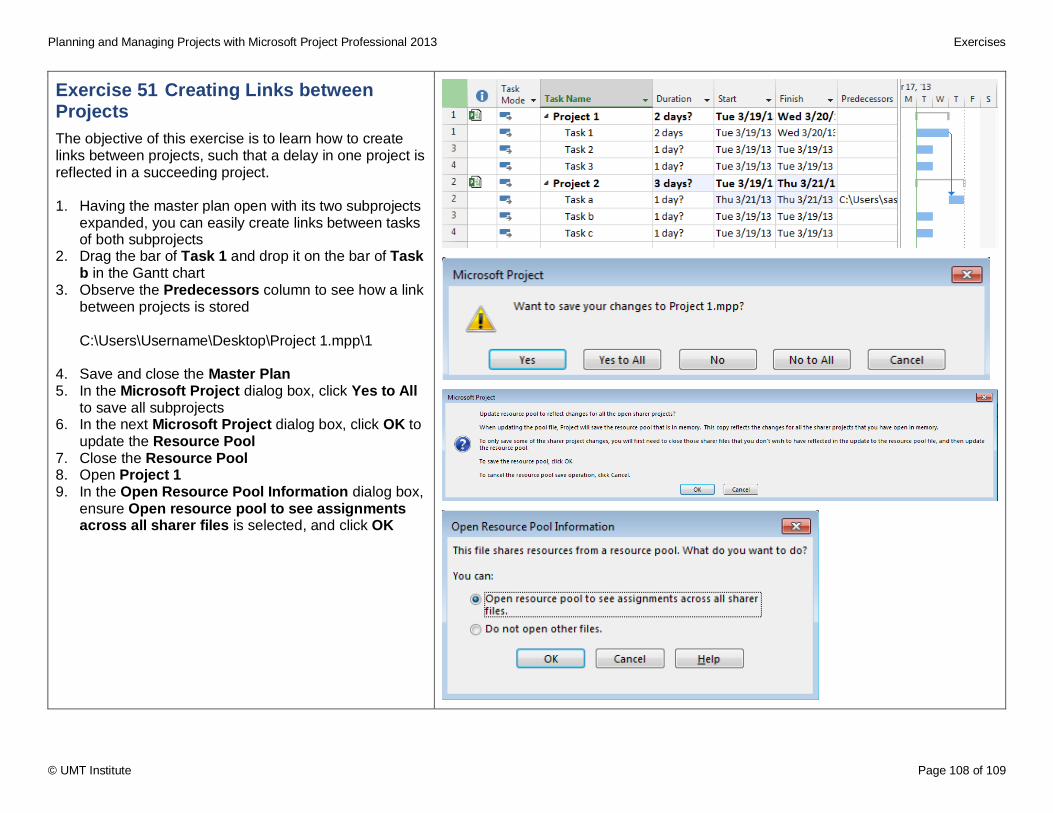
Planning and Managing Projects with Microsoft Project Professional 2013 Exercises
© UMT Institute Page 108 of 109
Exercise 51 Creating Links between Projects
The objective of this exercise is to learn how to create links between projects, such that a delay in one project is reflected in a succeeding project. 1. Having the master plan open with its two subprojects
expanded, you can easily create links between tasks of both subprojects
2. Drag the bar of Task 1 and drop it on the bar of Task b in the Gantt chart
3. Observe the Predecessors column to see how a link between projects is stored
C:\Users\Username\Desktop\Project 1.mpp\1
4. Save and close the Master Plan 5. In the Microsoft Project dialog box, click Yes to All
to save all subprojects 6. In the next Microsoft Project dialog box, click OK to
update the Resource Pool 7. Close the Resource Pool 8. Open Project 1 9. In the Open Resource Pool Information dialog box,
ensure Open resource pool to see assignments across all sharer files is selected, and click OK
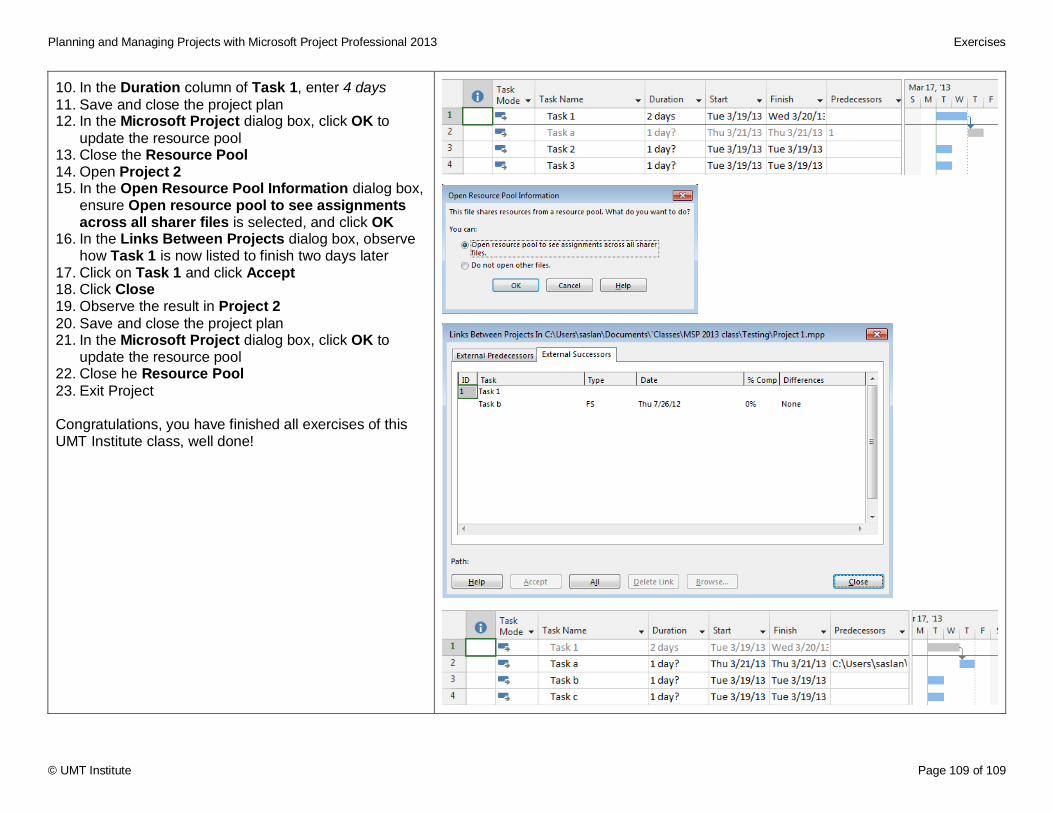
Planning and Managing Projects with Microsoft Project Professional 2013 Exercises
© UMT Institute Page 109 of 109
10. In the Duration column of Task 1, enter 4 days
11. Save and close the project plan 12. In the Microsoft Project dialog box, click OK to
update the resource pool 13. Close the Resource Pool 14. Open Project 2 15. In the Open Resource Pool Information dialog box,
ensure Open resource pool to see assignments across all sharer files is selected, and click OK
16. In the Links Between Projects dialog box, observe how Task 1 is now listed to finish two days later
17. Click on Task 1 and click Accept 18. Click Close 19. Observe the result in Project 2
20. Save and close the project plan 21. In the Microsoft Project dialog box, click OK to
update the resource pool 22. Close he Resource Pool
23. Exit Project Congratulations, you have finished all exercises of this UMT Institute class, well done!