Embed Size (px)
Citation preview

Managing P & N Nutrient Resources
Agronomy In-serviceJanuary 3, 2013
Greg LaBarge, Field Specialist, Agronomic Systems

Discussion
• Why be concerned with nutrient/sediment
• Phosphorus – What do we want farmers to do– Tri-state Philosophy and Status
• Nitrogen– Economic rate calculator
• Other Issues

Why be concerned about nutrients/sedimentation leaving edge of field?
• Water Quality Concerns in water bodies– EPA water quality measured as “intended use”– Regulation
• Ohio Ag Pollution Abatement
from “manure and sediment
bound nutrients” to “nutrients”
– Sedimentation removal• Cost Maumee and Harbor
($5,000,000 annual)
• Good Stewards
and Public Pressure• Economic Cost (Loss) of Nutrients
Value of Nutrient In Maumee River
• Average value of nutrient lost WY2008-2011 – based on $650 per ton P2O5 & $0.65 cent
Nitrogen
Nutrient Value
Phosphorous $ 4,129,291
Nitrogen (Nitrate) $39,694,230
Total $43,823,521
Per acre $13.52
Phosphorus
• Soil reactions of phosphorous • Nutrient Movement • What do we want farmers to do• Do the tri-state recommendations still work• Recommendation resources

Three Important Soil P Fraction for Plant Nutrition
Soil Solution Labile P Nonlabile P

Nutrient Movement
Solution PSolution P
HH22POPO44--
HPOHPO442-2-
<0.3 ppm<0.3 ppm
Solution PSolution P
HH22POPO44--
HPOHPO442-2-
<0.3 ppm<0.3 ppm
AdsorbedP
Labile P
Secondary MineralsFe/AlPO4
CaHPO4
Nonlabile P
Primary Minerals
Nonlabile P
OrganicMatterBound
PNonlabile P
Fertilizer Manure
Adsorption
Desorption
Dissolution
Precipitation
Dissolution
Mineralization
Immobilization
Plant uptake
Leaching
Total P in soil – 50-1500 ppm ~ 100-3000 lb/acre
Labile P
Leaching

Water Definitions
• Total Phosphorus"Total" phosphorus is largely defined on the basis of how much phosphorus in its various forms will be oxidized into orthophosphate by a
specific oxidant.
• Water soluble P–Dissolved reactive phosphorus (DRP)–Bioavailable Phosphorus The soluble form of the nutrient phosphorus, which is readily available for use by plants. consist largely of the inorganic orthophosphate (PO4) form of phosphorus.
• Particulate P Soil attached P

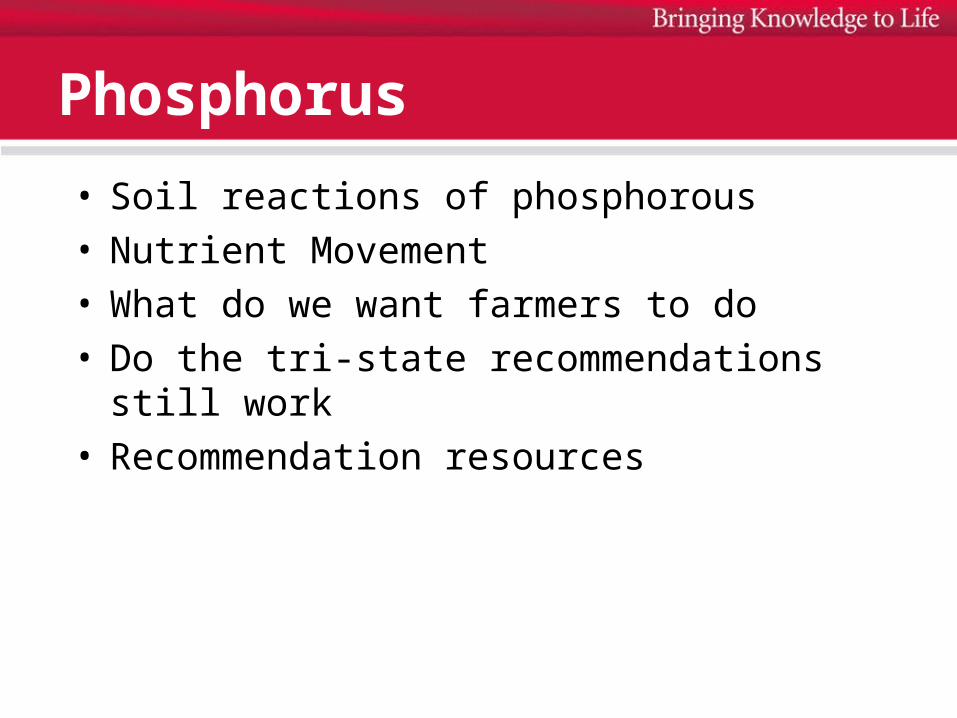
Source: Heidelberg University
Maumee River Gauging Station
Source: Hiedelberg University
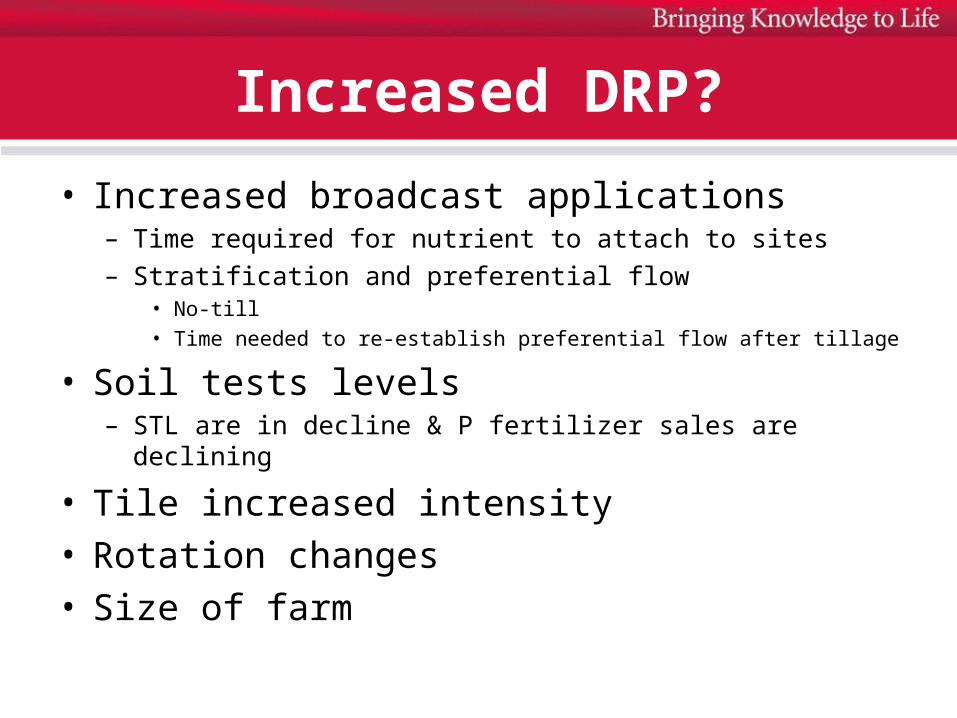
Increased DRP?
• Increased broadcast applications– Time required for nutrient to attach to sites– Stratification and preferential flow
• No-till• Time needed to re-establish preferential flow after tillage
• Soil tests levels– STL are in decline & P fertilizer sales are declining
• Tile increased intensity• Rotation changes• Size of farm
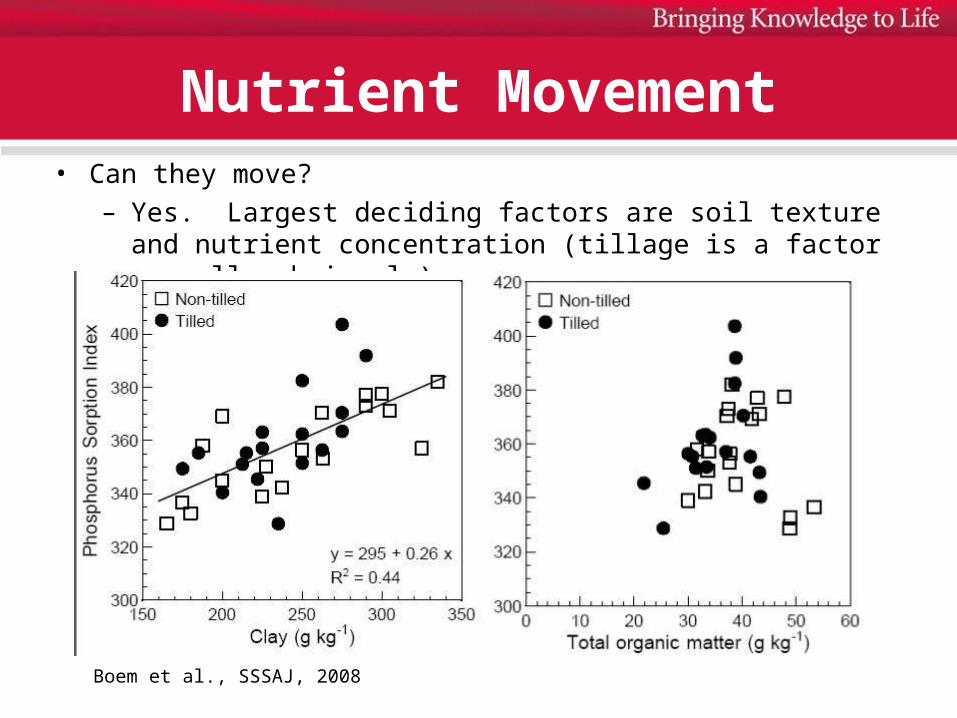
Nutrient Movement• Can they move?
– Yes. Largest deciding factors are soil texture and nutrient concentration (tillage is a factor as well, obviously)
Boem et al., SSSAJ, 2008

Nutrient Movement
• Nutrient concentration causing nutrient leaching
Mehlich-3 soil P, mg/kg
Dissolved P,mg/L
0.5
0
1.5
1
0 200 400 800600
Drainage from 50-cm undisturbed soil lysimeters

Discussions agricultural reductions
• Five month public process
• 100 plus individuals involved
• Final report• http://
www.dnr.state.oh.us/portals/12/docs/waterqualityreport.pdf

What contribution to reduction can agriculture make?
• 4R Nutrient Stewardship– ‘Right’ Rate, ‘Right’ Timing, ‘Right’ Placement & ‘Right’
Source
• Industry Developed Program – Global– http://www.nutrientstewardship.com/
• Goals– Increase crop production & improve profitability– Minimize nutrient loss & maintain soil fertility– Ensure sustainable agriculture for generations to come

Recommendations to Reduce Nutrient
Movement off -site
• The ‘Right’ Rate.– Good representative soil sample should be the basis
for fertilizer application.– Utilize Ohio State University Extension Agronomic
Recommendations for nutrient application.– Records should be kept for all soil tests,
recommendations and applications as well as crop and resulting yields.
– http://agcrops.osu.edu/specialists/fertility/fertility-fact-sheets-and-bulletins Source: Ohio Director’s Working Group on Ag Nutrients 4/12
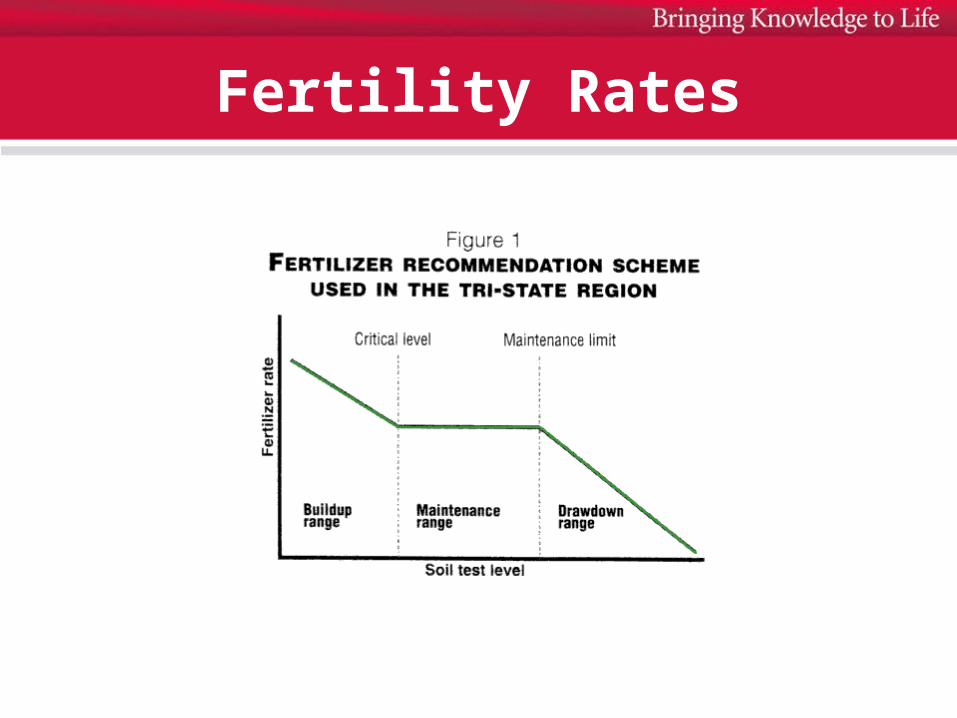
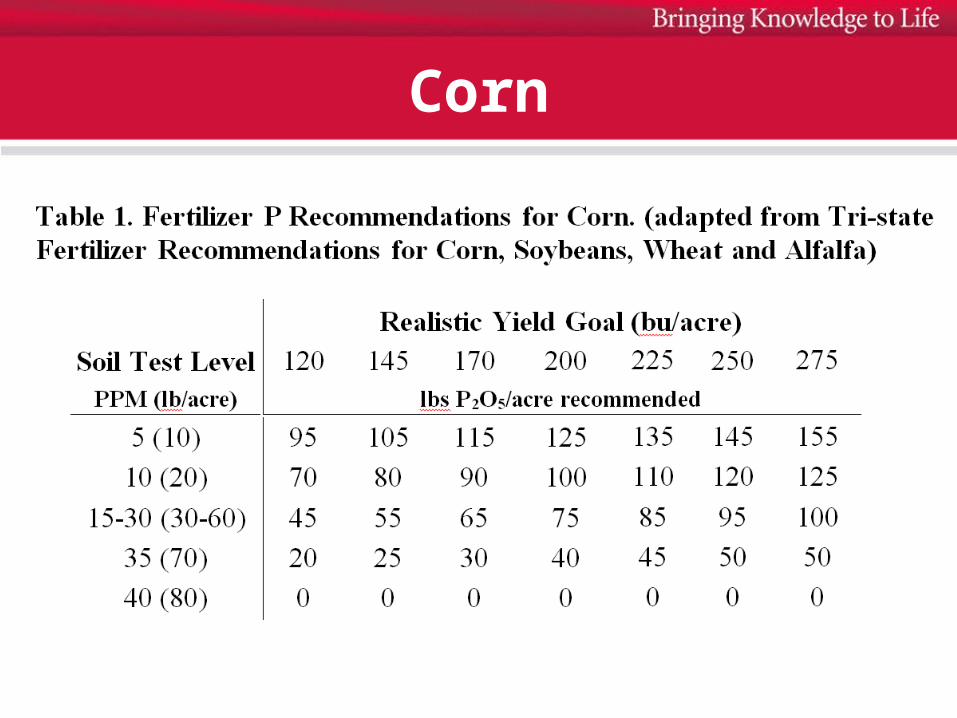
Fertility Rates

Critical Level
• “…the soil test level above which the soil can supply adequate quantities of a nutrient to support optimum economic growth.”
• Below the CL”…the soil is not able to provide P and K requirements of the crop.”
• Above the CL”…the soil is capable of supplying the nutrient required by the crop and no response to fertilizer would be expected.”
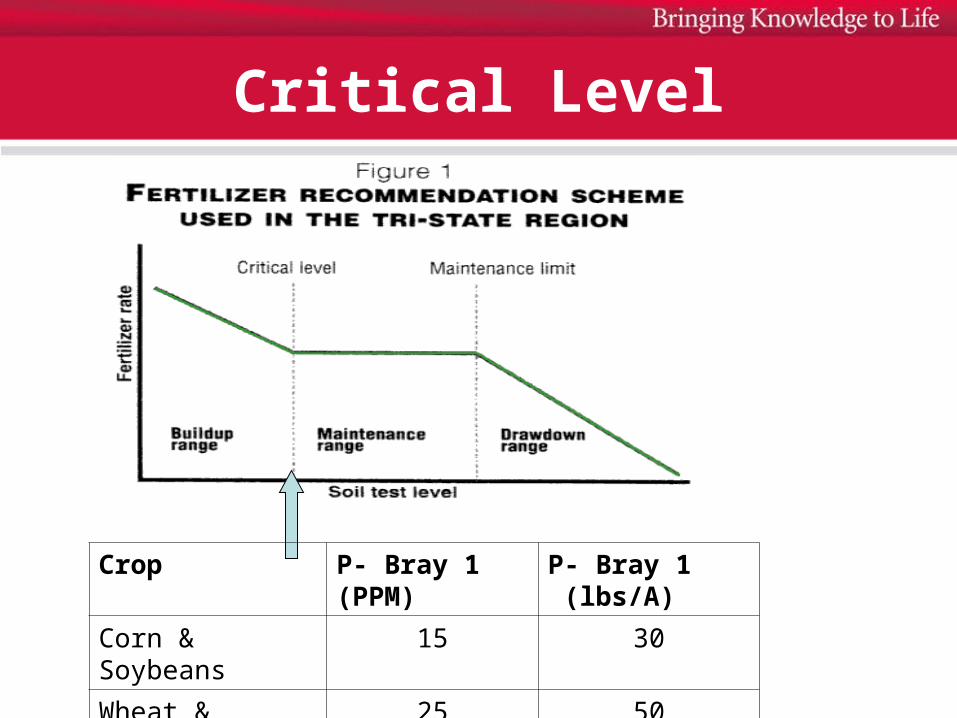
Critical Level
Crop P- Bray 1(PPM)
P- Bray 1 (lbs/A)
Corn & Soybeans 15 30
Wheat & Alfalfa 25 50

2104/19/23
Spatial Variation
0-15 15-30 30-45 45-60 60-75 75-90 90-105 105-120 120-135
Soil test P

22 04/19/23
Nutrient Distribution• Mean soil test P – 18 ppm• Median soil test P – 16 ppm

Maintenance Plateau Range
• “Designed to replace nutrient lost each year through crop removal.”
• “…no response to fertilizer in the year of application expected.”
• “No response to placement technique such as banding or stripping or the use of P and K starter fertilizer…”
Corn

Maintenance Limit
Crop P- Bray 1(PPM)
P- Bray 1 (lbs/A)
Corn & Soybeans 30 60
Wheat & Alfalfa 40 80

Drawdown
• “When soil test levels exceed maintenance plateau level (Maintenance Limit), the objective of the fertilizer recommendation is to utilize residual soil nutrients….There is no agronomic reason to apply fertilizer when soil test are above the maintenance plateau level.”

Drawdown
Crop P- Bray 1(PPM)
P- Bray 1 (lbs/A)
Corn & Soybeans 40 80
Wheat & Alfalfa 50 100

Corn

"What do you mean do not put any P on, won't my soil test drop?"
Two part answer. First yes, soil test levels will drop, but if you are above the crop response range for the crop it really is not a problem crop production wise. If you are above 30 PPM there is no yield benefit and if you are way above this level there is an economic benefit to using this soil stored P.
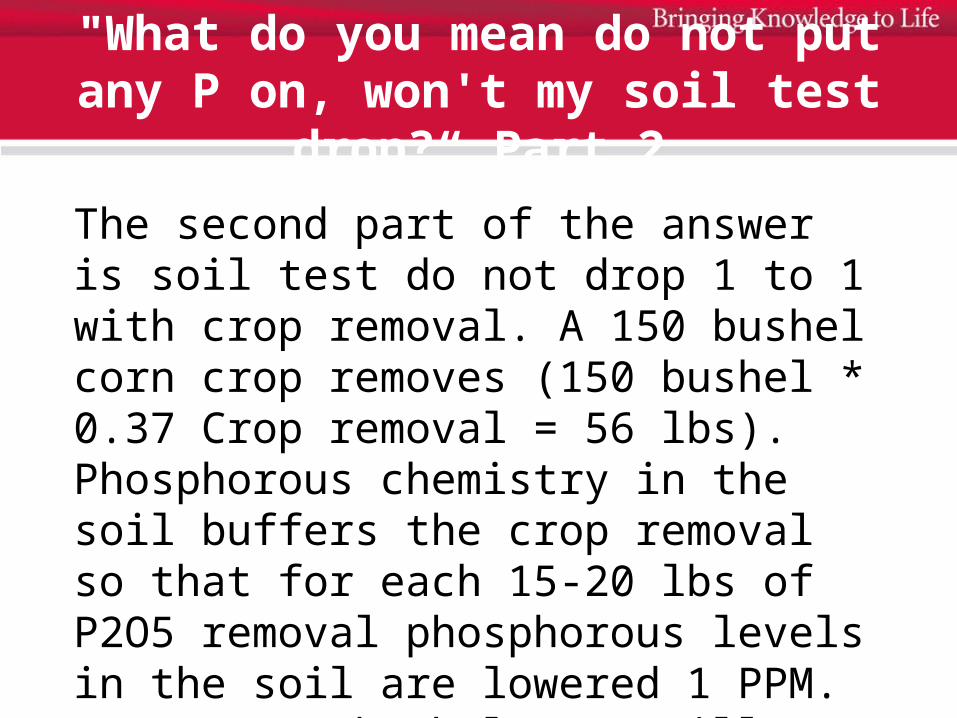
"What do you mean do not put any P on, won't my soil test drop?“ Part 2
The second part of the answer is soil test do not drop 1 to 1 with crop removal. A 150 bushel corn crop removes (150 bushel * 0.37 Crop removal = 56 lbs). Phosphorous chemistry in the soil buffers the crop removal so that for each 15-20 lbs of P2O5 removal phosphorous levels in the soil are lowered 1 PPM. So our 150 bushel crop will lower the soil test at around 3-4 PPM.

Expected Soil Test Changes
• The buildup equations in the Tri-states
• 20 lbs./A of P2O5 to change soil test P levels one ppm.
• 6 to 10 lbs./A of K2O are required to change soil test 1 ppm depending upon the soil CEC.

Equations
BUILDUP EQUATION for P: lb P2O5/A to apply = [(CL - STL) x 5] (YP x CR) MAINTENANCE EQUATION for P: lb P2O5/A to apply = YP x CR DRAWDOWN EQUATION for P: lb P2O5/A to apply = (YP x CR) - [(YP x CR) x (STL - CL 15))/10]
CL = critical soil test level (ppm) STL = existing soil test level (ppm) YP = crop yield potential (bu per acre for grains, tons per acre for forages) CR = nutrient removed per unit yield (lb/unit) CEC = soil cation exchange capacity (meq/100g)
Recommendation Resources
Recent looks at Tri-state Critical Values
• 1993-1999. Dr. Jay Johnson study at Western Branch relative yield without fertilizer
• 2006-present. Dr. Robert Mullen study at Western, Northwest and Wooster fertilizer at 0, 1X, 2X rate based on tri-state

Critical Levels• Ohio State data – relative corn yield and STP
50
60
70
80
90
100
110
0 20 40 60 80
Soil test P, lb/acre
Rel
ativ
e yi
eld
, %
of
max
Critical Value – 30 lb/ac

Critical Levels
• Ohio State data – relative soybean yield and STP
0
20
40
60
80
100
120
140
0 20 40 60 80
Soil test P, lb/acre
Rel
ativ
e yi
eld
, %
of
max
Critical Value – 30 lb/ac

Iowa
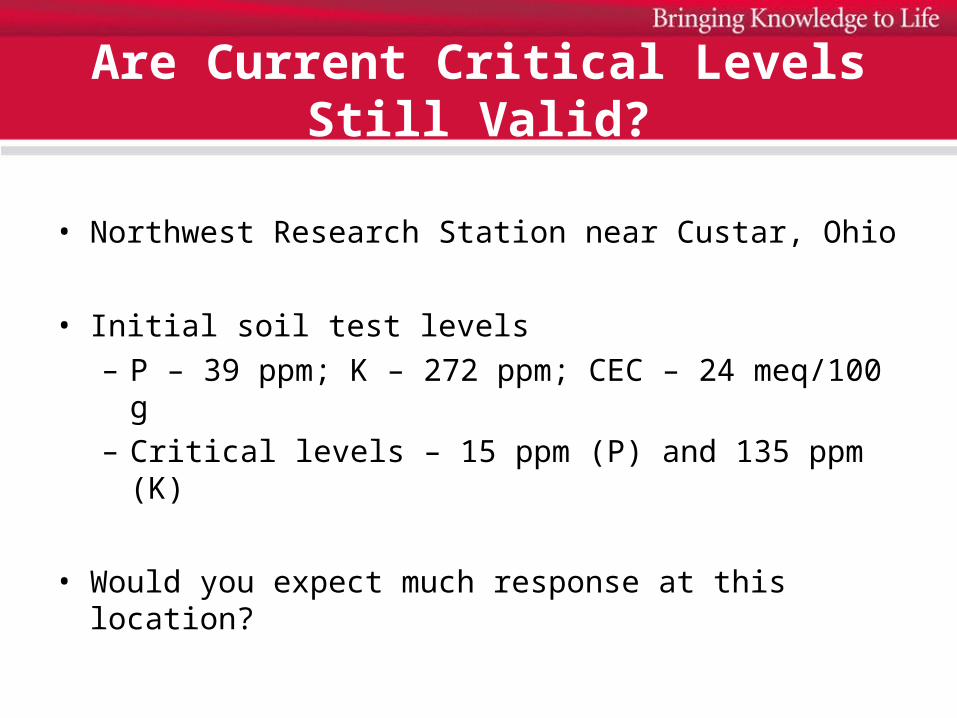
Are Current Critical Levels Still Valid?
• Northwest Research Station near Custar, Ohio
• Initial soil test levels– P – 39 ppm; K – 272 ppm; CEC – 24 meq/100 g– Critical levels – 15 ppm (P) and 135 ppm (K)
• Would you expect much response at this location?
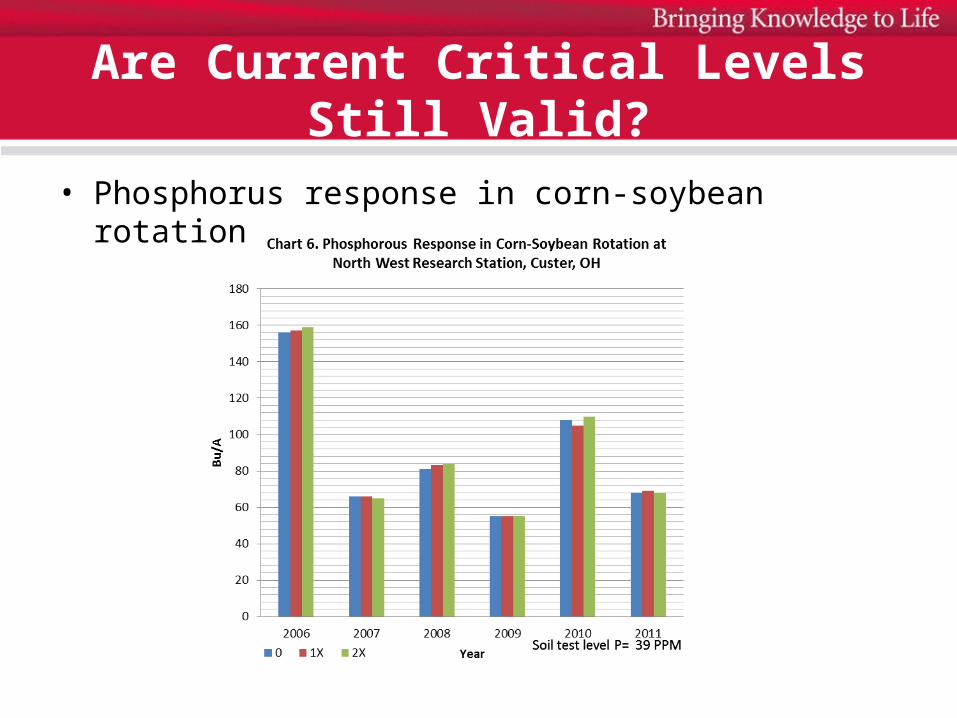
Are Current Critical Levels Still Valid?
• Phosphorus response in corn-soybean rotation

Are Current Critical Levels Still Valid?
• Phosphorus response in corn-corn-soybean rotation

Are Current Critical Levels Still Valid?
• Western Research Station near Springfield, Ohio
• Initial soil test levels– P – 20 ppm; K – 102 ppm; CEC – 14 meq/100 g– Critical levels – 15 ppm (P) and 110 ppm (K)
• Would you expect much response at this location?
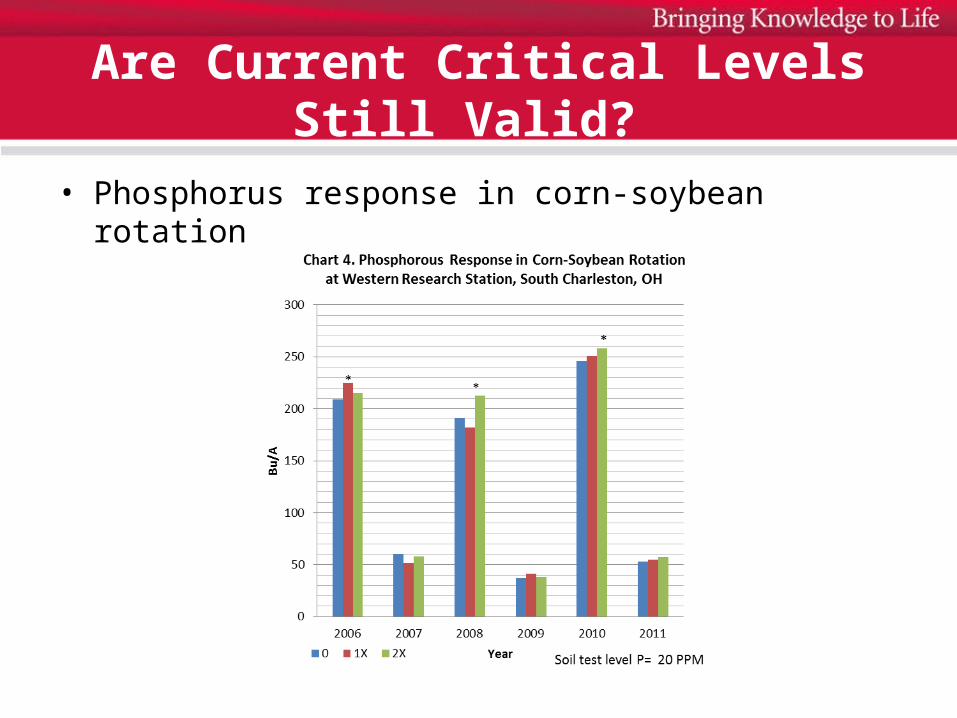
Are Current Critical Levels Still Valid?
• Phosphorus response in corn-soybean rotation

Are Current Critical Levels Still Valid?
• Phosphorus response in corn-corn-soybean rotation

Are Current Critical Levels Still Valid?
• East Badger Farm near Wooster, OH
• Initial soil test levels– P – 17 ppm; K – 109 ppm; CEC – 11 meq/100 g– Critical levels – 15 ppm (P) and 103 ppm (K)
• Would you expect much response at this location?

Are Current Critical Levels Still Valid?
• Phosphorus response in corn-soybean rotation

Are Current Critical Levels Still Valid?
• Phosphorus response in corn-corn-soybean rotation

Other Rate Considerations
• Product Margin vs Service
• Consider all nutrient sources

Other Rate Considerations
• Precision Application– Sampling scheme– Variable rate across
field• Goal• Even levels across
field-good for pH• Application rate
based on crop response
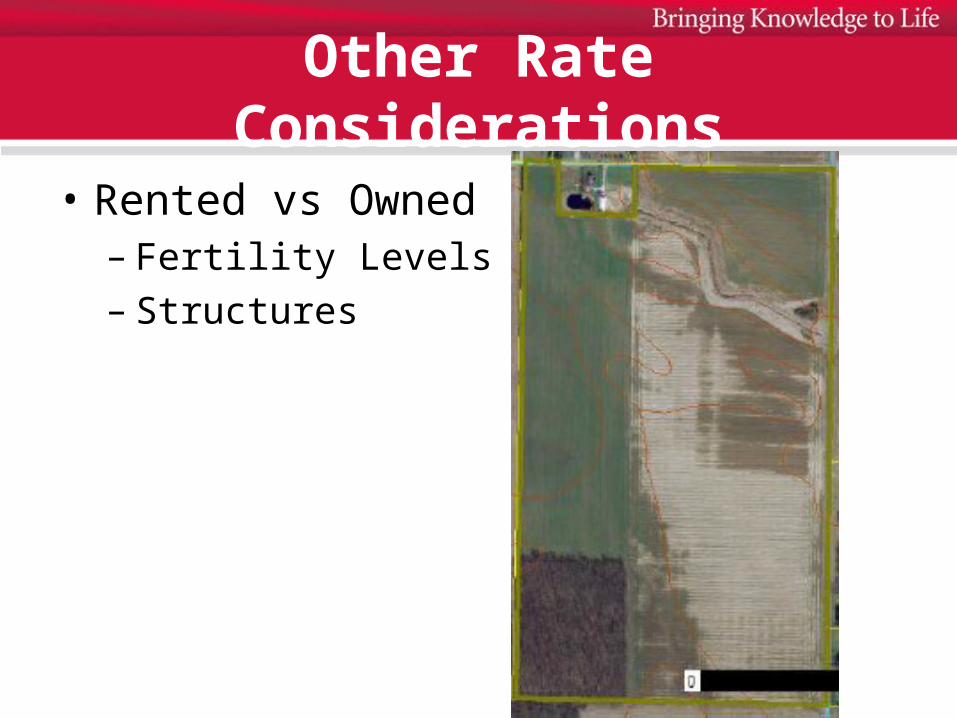
Other Rate Considerations
• Rented vs Owned– Fertility Levels– Structures

Recommendations to Reduce Nutrient
Movement off -site
• The ‘Right’ Time.– Nutrients should not be applied to frozen or
snow covered ground.– Nutrients should be applied as close to crop
utilization as possible.– Or if not applied close to utilization practices
should be used to keep it in forms that limit movement offsite
Source: Ohio Director’s Working Group on Ag Nutrients 4/12

Recommendations to Reduce Nutrient
Movement off -site
• The ‘Right’ Place.– Phosphorous applications should be injected
or incorporated whenever possible.– If surface applications are made, it should
have a growing crop or cover as soon as possible.
Source: Ohio Director’s Working Group on Ag Nutrients 4/12

0
2
4
6
8
10
12
14
16
Tilled-incorporated Tilled-surface No-till cover No-till
Dis
solv
ed P,
ppm
Control
DAP
Poultry litter
Mullen, 2011, unpublished
Rainfall simulator study, NW Ohio, Nov 2009
• P sources applied at 80 lb P2O5 per acre• Total P loss < 2% of amount applied• Rain @ 2.4”/hour; first 30 minutes runoff

Placement
• Row Starter
• Foliar
• Strip Tillage
• Other banded application
• Incorporation
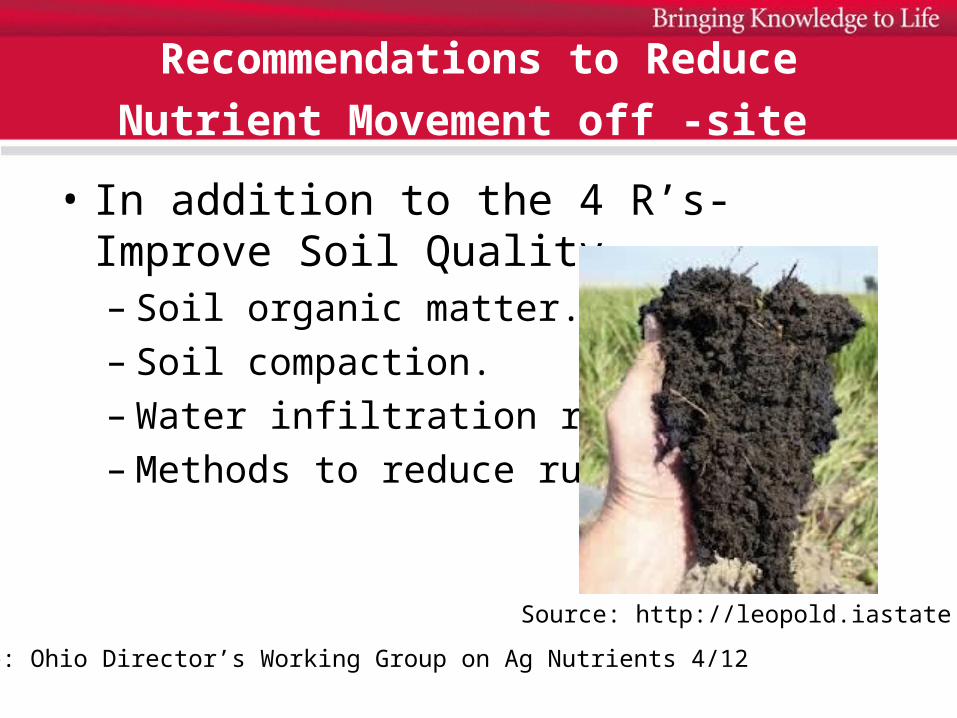
Recommendations to Reduce Nutrient
Movement off -site
• In addition to the 4 R’s- Improve Soil Quality.– Soil organic matter.– Soil compaction.– Water infiltration rates.– Methods to reduce runoff.
Source: Ohio Director’s Working Group on Ag Nutrients 4/12
Source: http://leopold.iastate.edu

Tiling

Blind Inlets

Contribution
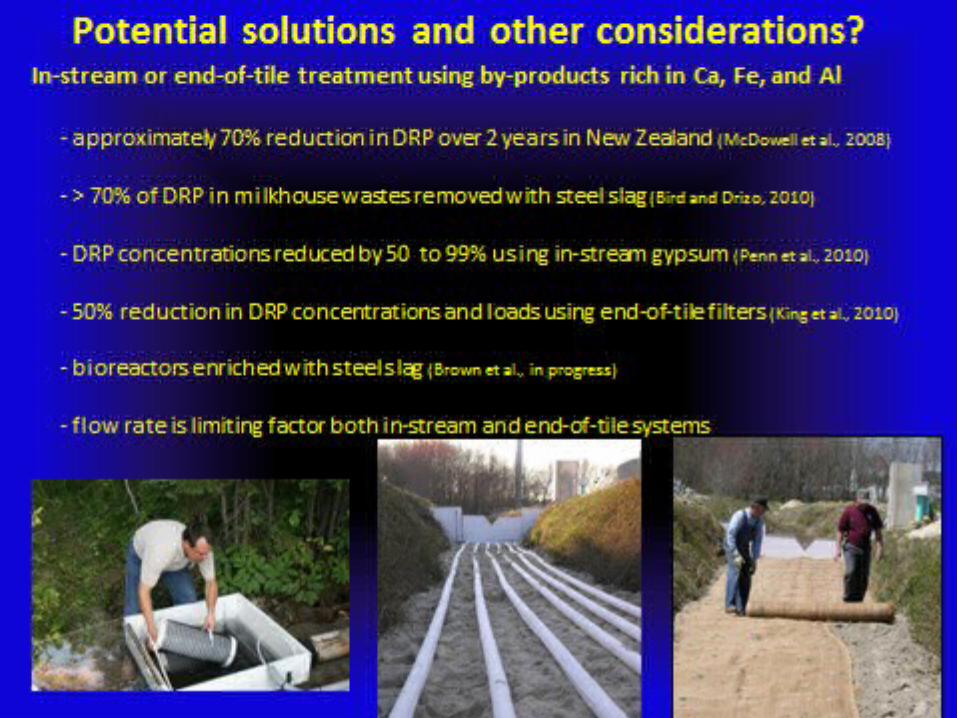
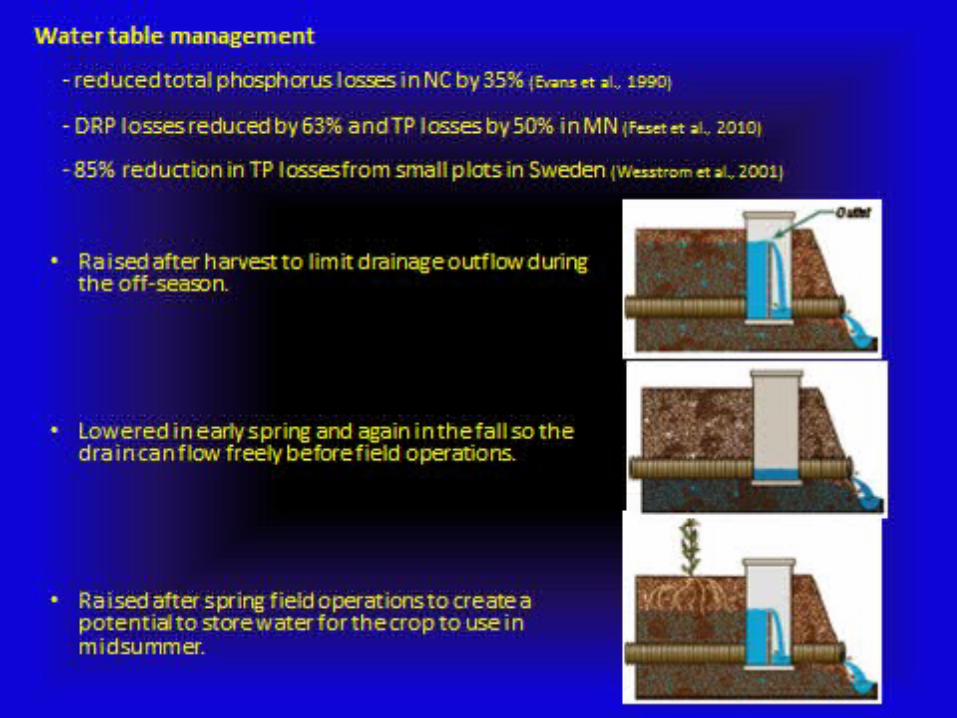

Recommendations to Reduce Nutrient
Movement off-site • In addition to the 4 R’s- Improve Water Management and
Possible Treatment of Drainage Water.– Repair broken subsurface drainage.– Treating surface inlets runoff into subsurface drainage
systems.– Treating concentrated surface runoff areas.– Controlled drainage.– Constructed wetlands for treatment– Improved designed filtered areas, biofilters– Alternative drainage ditch designs
Source: Ohio Director’s Working Group on Ag Nutrients 4/12

Nitrogen Recommendations
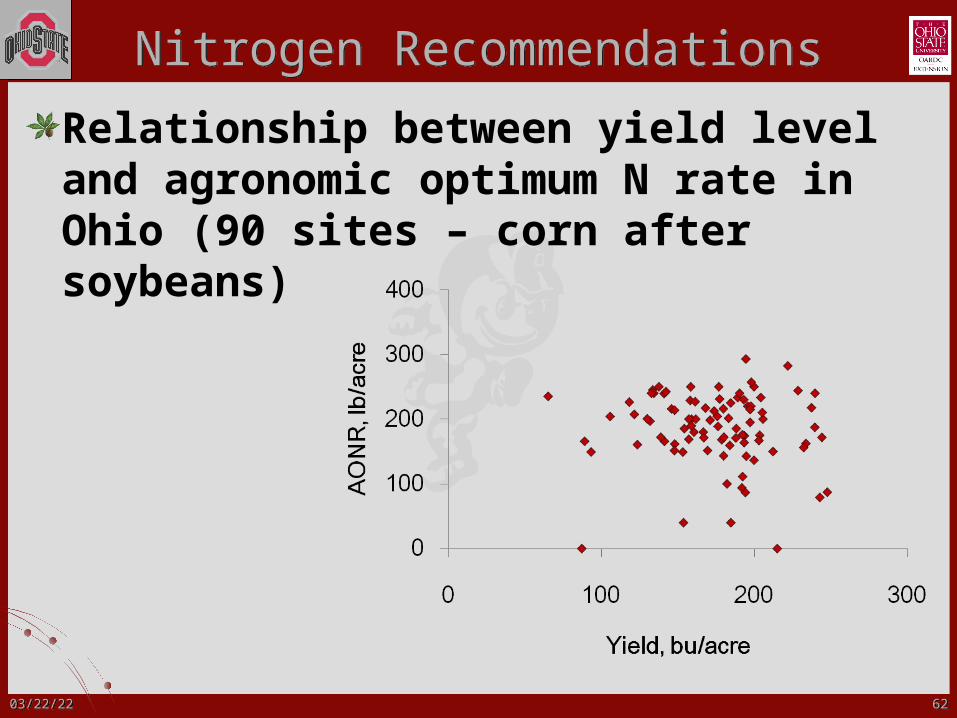
Nitrogen RecommendationsNitrogen Recommendations
Relationship between yield level and agronomic optimum N rate in Ohio (90 sites – corn after soybeans)
626204/19/2304/19/23

Nitrogen RecommendationsNitrogen Recommendations
So…Land Grant Universities (in the Midwest) have moved away from yield goal based recommendations as a result of this informationWhat are we left with?
It’s a risk model, what is the risk of a certain N rate with regard to agronomic performance while considering the economic factors
636304/19/2304/19/23
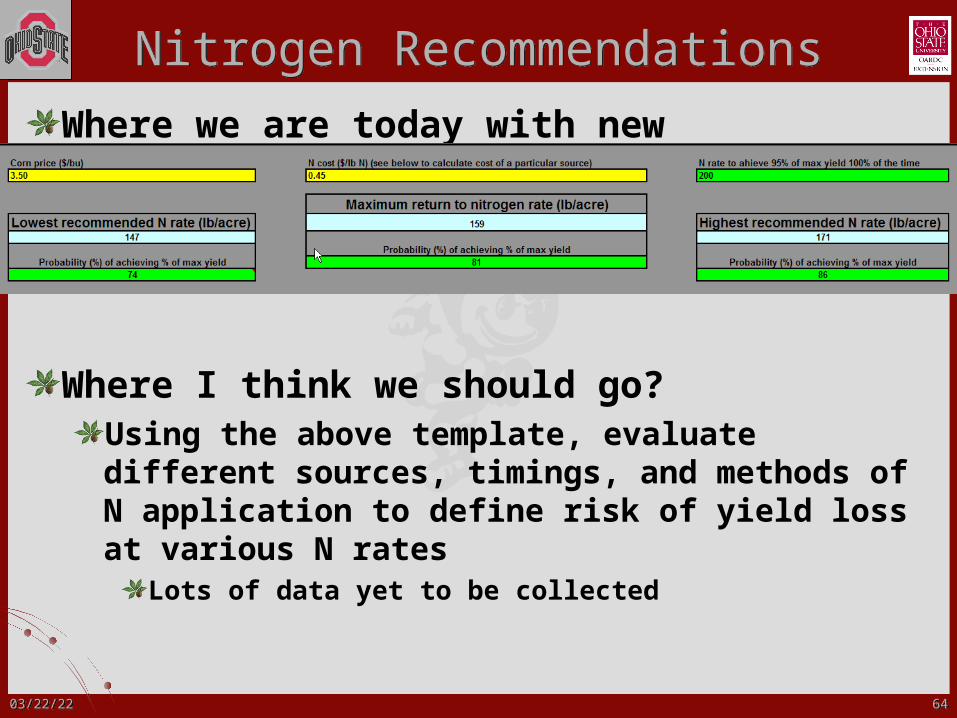
Where we are today with new recommendations
Where I think we should go?Using the above template, evaluate different sources, timings, and methods of N application to define risk of yield loss at various N rates
Lots of data yet to be collected
Nitrogen RecommendationsNitrogen Recommendations
646404/19/2304/19/23

Economic Nitrogen Rate Calculators
• Mullen Developed http://agcrops.osu.edu/specialists/fertility/fertility-fact-sheets-and-bulletins Will be updated by 3/1/2013
• Iowa State (houses midwest verson) http://extension.agron.iastate.edu/soilfertility/nrate.aspx

Iowa Site

Other Issues
• NRCS 590 Nutrient Management and 633 Manure Nutrients was combined into one 590 standard
• NRCS CAPS (Conservation Activity Plan)– 102 Comprehensive Nutrient Management Plan– 104 Nutrient Management Plan– Systems Soil testing, precision application, cover
crops, controlled traffic, strip tillagehttp://www.nrcs.usda.gov/wps/portal/nrcs/main/national/programs/technical/tsp/

Summary
• Building case for better nutrient management-economic and environmental
• Tri-state Philosophy– Tri-state P & K Recommendations are sound
• What do we want farmers to do:– 4R Nutrient Stewardship
• Introduction to Nitrogen– This is an area we need to more in moving
forward. Economic implications are greater.


![PAINTINGS [ODETTE LABARGE]](https://img.pdfslide.us/doc/110x75/55d49c95bb61ebaa2c8b4589/paintings-odette-labarge.jpg)


![LABARGE DESIGN PROFILE [PORTFOLIIO]](https://img.pdfslide.us/doc/110x75/54b339794a79594e7d8b4584/labarge-design-profile-portfoliio.jpg)