Embed Size (px)
Citation preview
US
Equities
Managing Market Structure Risk:
Flash Back
Sayena Mostowfi | V13:044 | October 2015 | www.tabbgroup.com
2015 The Tabb Group, LLC. All Rights Reserved. May not be reproduced by any means without express permission. | 2
US Equity Market Structure Risk: Flash Back | October 2015
Vision It has been five years since the Flash Crash. The industry has implemented a number of market structure
changes, but there is still more to do. While industry regulators and participants have put in place some
effective safeguards, there remain a number of gaps. Many of these gaps can be addressed through
uniformity across safeguard rules (e.g., reference price calculations) and exchange functionalities (e.g.,
risk monitoring/detection, kill switches, etc.), while other gaps would benefit from consolidation and
integration of existing tools (e.g., DTCC consolidated limit monitor and exchange kill switches). In order
for the aforementioned uniformity and consolidation to be feasible, however, there needs to be further
reconciliation and mapping of market participant IDs and trade and clearing files across all venues.
None of these measures, though, would be optimized without regular industry-wide testing and
established communication protocols enabling market participants to strengthen operational muscle
memory of disaster recovery procedures across asset classes. In this paper, we will review the regulatory
changes and areas for improvement summarized below.
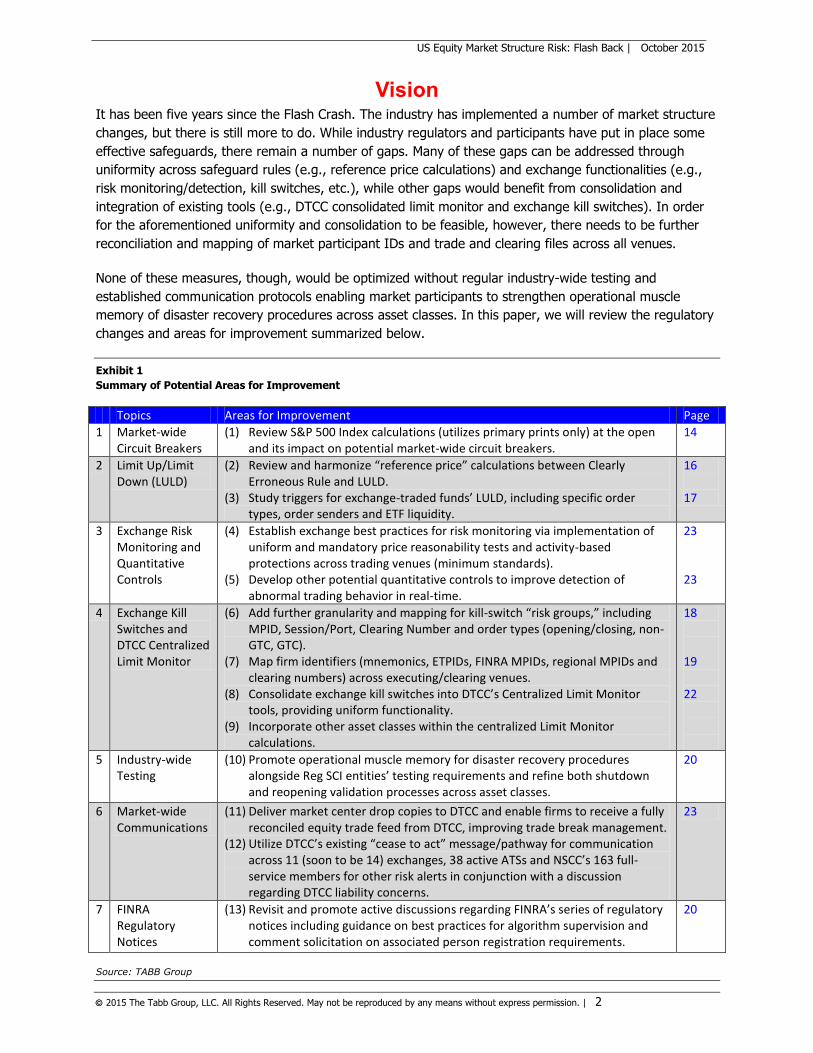
Exhibit 1
Summary of Potential Areas for Improvement
Topics Areas for Improvement Page
1 Market-wide Circuit Breakers
(1) Review S&P 500 Index calculations (utilizes primary prints only) at the open and its impact on potential market-wide circuit breakers.
14
2 Limit Up/Limit Down (LULD)
(2) Review and harmonize “reference price” calculations between Clearly Erroneous Rule and LULD.
(3) Study triggers for exchange-traded funds’ LULD, including specific order types, order senders and ETF liquidity.
16 17
3 Exchange Risk Monitoring and Quantitative Controls
(4) Establish exchange best practices for risk monitoring via implementation of uniform and mandatory price reasonability tests and activity-based protections across trading venues (minimum standards).
(5) Develop other potential quantitative controls to improve detection of abnormal trading behavior in real-time.
23 23
4 Exchange Kill Switches and DTCC Centralized Limit Monitor
(6) Add further granularity and mapping for kill-switch “risk groups,” including MPID, Session/Port, Clearing Number and order types (opening/closing, non-GTC, GTC).
(7) Map firm identifiers (mnemonics, ETPIDs, FINRA MPIDs, regional MPIDs and clearing numbers) across executing/clearing venues.
(8) Consolidate exchange kill switches into DTCC’s Centralized Limit Monitor tools, providing uniform functionality.
(9) Incorporate other asset classes within the centralized Limit Monitor calculations.
18 19 22
5 Industry-wide Testing
(10) Promote operational muscle memory for disaster recovery procedures alongside Reg SCI entities’ testing requirements and refine both shutdown and reopening validation processes across asset classes.
20
6 Market-wide Communications
(11) Deliver market center drop copies to DTCC and enable firms to receive a fully reconciled equity trade feed from DTCC, improving trade break management.
(12) Utilize DTCC’s existing “cease to act” message/pathway for communication across 11 (soon to be 14) exchanges, 38 active ATSs and NSCC’s 163 full-service members for other risk alerts in conjunction with a discussion regarding DTCC liability concerns.
23
7 FINRA Regulatory Notices
(13) Revisit and promote active discussions regarding FINRA’s series of regulatory notices including guidance on best practices for algorithm supervision and comment solicitation on associated person registration requirements.
20
Source: TABB Group
2015 The Tabb Group, LLC. All Rights Reserved. May not be reproduced by any means without express permission. | 3
US Equity Market Structure Risk: Flash Back | October 2015
Table of Contents
VISION ....................................................................................................................................... 2
INTRODUCTION ......................................................................................................................... 4
MARKET STRUCTURE RISK: A 5-YEAR FLASH BACK .................................................................. 6
FLASH CRASH – MAY 6, 2010 ............................................................................................................... 6 FACEBOOK IPO - MAY 18, 2012 ........................................................................................................... 7 KNIGHT CAPITAL – AUG. 1, 2012 .......................................................................................................... 7 OTHER GLITCHES AND NSCC RISK WATERFALL ......................................................................................... 8
REGULATORY ACTIONS .............................................................................................................. 9
CLEARLY ERRONEOUS ........................................................................................................................ 11 STUB QUOTE PROHIBITION ................................................................................................................. 12 MARKET ACCESS RULE ....................................................................................................................... 12 MARKET-WIDE CIRCUIT BREAKERS ....................................................................................................... 13 LIMIT UP/LIMIT DOWN ...................................................................................................................... 14 EXCHANGE KILL SWITCHES ................................................................................................................. 17 DTCC LIMIT MONITOR ..................................................................................................................... 19 FINRA’S SERIES OF NOTICES ON REGULATORY INITIATIVES ....................................................................... 19 SEC REG SCI ................................................................................................................................. 20 CONSOLIDATED AUDIT TRAIL .............................................................................................................. 21
CROSS-ASSET INDUSTRY-DRIVEN SOLUTIONS ......................................................................22
ONE TYPE OF SAFEGUARD DOES NOT FIT ALL: DTCC AS BROADCAST CONDUIT .............................................. 22 ASSET CLASSES: OCC RISK CONTROLS TAKEAWAYS ................................................................................. 23 REAL-TIME DETECTION OF ABNORMAL TRADING ACTIVITY .......................................................................... 23
CONCLUSION............................................................................................................................24
APPENDIX ................................................................................................................................25
ABOUT ......................................................................................................................................26
TABB GROUP ................................................................................................................................. 26 THE AUTHOR .................................................................................................................................. 26 DTCC ........................................................................................................................................... 26
2015 The Tabb Group, LLC. All Rights Reserved. May not be reproduced by any means without express permission. | 4
US Equity Market Structure Risk: Flash Back | October 2015
Introduction US equity market stability is tied as much to market structure (number of venues, types of market
participants, matching logics, etc.) as it is to market infrastructure (trading systems coding, connectivity,
etc.). With automation and market center interconnectivity comes further propensity for cascading
system problems. At the October 2012 Technology and Trading Roundtable, then-Securities and
Exchange Commission Chair Mary Shapiro used the analogy of how a single automated stop light turning
green instead of red could cause a massive accident at a busy intersection just as a single venue’s
matching system or participant’s infrastructure failure could cause massive financial harm not only to the
firm, but to its customers and other investors.
The US equity markets have experienced a sweeping transformation over the past decade with the
convergence of highly automated systems via approval of the SEC’s Reg NMS in 2005 (implemented in
2007) and the ensuing waves of market center competition. These changes are in part evident in a surge
in trade volumes. Average daily trades for the first eight months of 2015 versus the first eight months of
2005 increased to 31.6 million trades, from 10 million.
The May 2010 Flash Crash magnified US equity markets’ systematic risk when stressed market conditions
met automated systems. On May 6, the automated execution of a large order without a price parameter
in the futures market severely exasperated already volatile market conditions as it interacted with other
multi-asset-class algorithmic trading strategies, resulting in disorderly markets. The industry responded
with new and revised market system rules and more stringent enforcement of pre-existing rules.
Post May 6, 2010, technology failures continue to exist at broker-dealers, exchanges, security information
processors (SIP) and trade reporting facilities (TRF). With each incident, the industry strives to improve
the mechanics of trading with improved communications, technology safeguards and regulations.
Most people would agree that safeguarding US equity markets is a continuous work in progress. In this
paper, we will review the significant system glitches over the last five years, and report on
industry/regulatory responses and identify areas for more in-depth discussions and improvements.
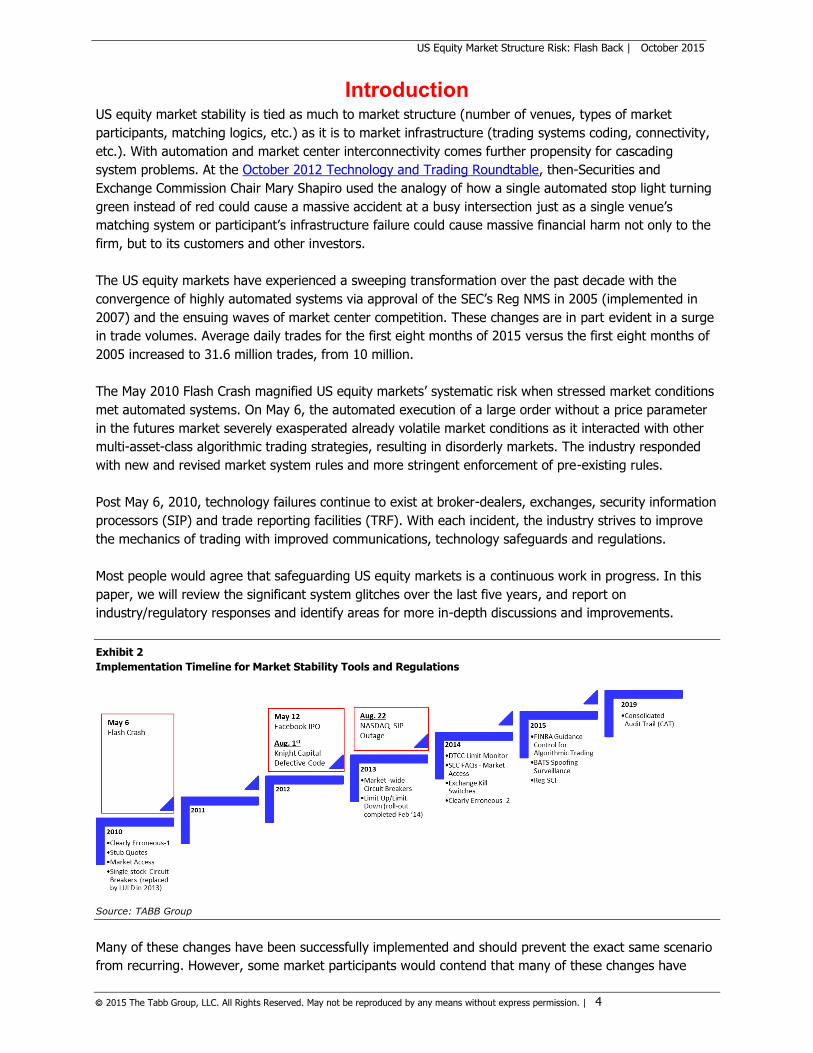
Exhibit 2
Implementation Timeline for Market Stability Tools and Regulations
Source: TABB Group
Many of these changes have been successfully implemented and should prevent the exact same scenario
from recurring. However, some market participants would contend that many of these changes have

2015 The Tabb Group, LLC. All Rights Reserved. May not be reproduced by any means without express permission. | 5
US Equity Market Structure Risk: Flash Back | October 2015
been developed and implemented in isolation and have not been fully integrated into the risk
management policies and procedures at firms active in the marketplace. Others would state that some of
the solutions have deviated from the original intentions. As Voltaire once said, “Don’t let perfect get in
the way of good.” We have a national market system comprised of many interconnected components.
While there is no golden solution for our complex equity market structure, there is always room for
improvement.
2015 The Tabb Group, LLC. All Rights Reserved. May not be reproduced by any means without express permission. | 6
US Equity Market Structure Risk: Flash Back | October 2015
Market Structure Risk: A 5-Year Flash Back
Our markets are complex. There are 11 (and soon to be 14) exchanges, 38 ATSs and 8 active retail
wholesalers (see Appendix). In the first eight months of 2015, we averaged 6.8 billion shares a day,
which is approximately $279 billion in equity changing hands each day. By all accounts, why this doesn’t
break daily is due to the hard work of thousands of industry technologists. That said, when the market
does break, it does so in a spectacular fashion.
While markets have never been incident-free, since 2010, it seems as if technology issues have been
much more regular the past five years. During this time, major incidents resulting in significant financial
losses for market participants have helped highlight and shape market safeguards regulations. The most
significant include the Flash Crash (May 6, 2010), Facebook IPO (May 18, 2012) and Knight Capital
trading incident (August 1, 2012).
This piece will highlight some of the most significant challenges and what the markets, regulators, and
industry firms have done to solve these challenges and create a structure in which these issues are not
readily repeated.
Flash Crash – May 6, 20101
What happened: According to the SEC-CFTC staff report, on the afternoon of May 6, 2010, major equity
indices in both the futures and stock markets, already down over 4% from their prior-day close, suddenly
plummeted a further 5-6% in a matter of minutes before rebounding almost as quickly. Stocks and
exchange-traded funds also suffered extreme declines before prices returned to their “pre-crash” levels.
By the end of the day, major futures and equities indices “recovered” to close with losses of about 3%
from the prior day.
Why it happened: Against the backdrop of unusually high volatility and thinning liquidity, a large
fundamental trader (a mutual fund) initiated a sell program at 2:32 p.m. for a total of 75,000 E-Mini
contracts (valued at approximately $4.1 billion) as a hedge to an existing equity position. This large
fundamental trader chose to execute the entire sell program via an algorithm that was programmed to
feed orders into the June 2010 E-Mini market to target an execution rate set to 9% of the trading volume
calculated over the previous minute, but without regard to price or time.
In the 12 months prior to May 6, 2010, only two single-day sell programs of equal or larger size – one of
which was by the same large fundamental trader – were executed. In trading the previous sell program,
this large fundamental trader used a combination of manual trading over the course of a day and several
algorithms that took into account price, time and volume. It took more than five hours to execute the
first 75,000 contracts. However, on May 6, when markets were already under stress, the sell algorithm
chosen by the large trader to only target trading volume and neither price nor time, executed in just 20
minutes.
What resulted: By approximately 3:00 p.m., after market participants verified the integrity of their data
and systems, most stocks had reverted back to trading at prices reflecting true values. Nevertheless,
during the 20 minute period between 2:40 p.m. and 3:00 p.m., over 20,000 trades in more than 300
1 CFTC and SEC Staff Report to the Join Advisory Committee on Emerging Regulatory Issues:
https://www.sec.gov/news/studies/2010/marketevents-report.pdf
2015 The Tabb Group, LLC. All Rights Reserved. May not be reproduced by any means without express permission. | 7
US Equity Market Structure Risk: Flash Back | October 2015
separate stocks and ETFs were executed at prices 60% or more away from their 2:40 p.m. prices, with
some at a penny or less, or as high as $100,000. After the market closed, the exchanges and FINRA
jointly agreed to break all such trades under their respective “clearly erroneous” trade rules.
Almost five years after the CFTC-SEC staff report on the events of May 6 (published on Sept. 30, 2010),
the US Justice Department filed allegations in court against British trader Navinder Sarao, stating that his
market manipulation (“spoofing activity”) also contributed to the US market plunge that temporarily
wiped out almost $1 trillion of the value of US equities.
Facebook IPO - May 18, 20122
What happened: On May 18, 2012, a design limitation in NASDAQ’s system to match initial public offering
(IPO) buy and sell orders caused disruptions to the Facebook (FB) IPO. With the expectation that they
had fixed the system limitation by removing a few lines of computer code, NASDAQ’s senior leadership
team decided not to further delay the opening in the IPO. NASDAQ’s systems problems caused the
Facebook IPO crossing application to fall 19 minutes behind the orders received by NASDAQ. The system
based the cross on the orders and cancellations received up until 11:11 a.m.
This time discrepancy caused more than 38,000 marketable Facebook orders placed between 11:11 a.m.
and 11:30:09 a.m. not to be included in the cross. Approximately 8,000 of those orders were entered into
the market at 11:30 a.m. when continuous trading commenced, and the remaining 30,000 were “stuck”
in NASDAQ’s system for more than two hours when they should have been promptly executed or
cancelled.
Why it happened: According to the SEC, “Too often in today’s markets, systems disruptions are written
off as mere technical ‘glitches’ when it’s the design of the systems and the response of exchange officials
that cause us the most concern.” In this case, the root cause of the problem was not clearly identified.
What resulted: Almost a year later, on May 29, 2013, the SEC charged NASDAQ with securities law
violations resulting from its poor systems and decision-making during the IPO and secondary market
trading of Facebook shares. NASDAQ agreed to settle the SEC’s charges by paying a $10 million penalty.
The reported losses incurred by market makers exceeded $300 million.
Knight Capital – Aug. 1, 20123
What happened: During the first 45 minutes after the market opened on Aug. 1, 2012, Knight’s router
rapidly sent more than 4 million orders into the market when attempting to fill just 212 customer orders.
The error caused Knight to trade more than 397 million shares, acquire several billion dollars in unwanted
positions and cause it to suffer a loss of more than $460 million.
Why it happened: According to the SEC’s order, Knight made two critical technology missteps that led to
the trading incident. In 2005, Knight moved a section of computer code to an earlier point in the code
sequence in an automated equity router, rendering a function of the router ineffective. In late July 2012,
when preparing for participation in the NYSE’s new Retail Liquidity Program, Knight incorrectly deployed
new code on the same router.
2 SEC Order in the Matter of NASDAQ Stock Market LLC: www.sec.gov/litigation/admin/2013/34-69655.pdf 3 SEC Order in the Matter of Knight Capital Americas : http://www.sec.gov/News/PressRelease/Detail/PressRelease/1370539879795
2015 The Tabb Group, LLC. All Rights Reserved. May not be reproduced by any means without express permission. | 8
US Equity Market Structure Risk: Flash Back | October 2015
As a result, according to the SEC, “certain orders eligible for the NYSE’s program triggered the defective
function in Knight’s router, which was then unable to recognize when orders had been filled.”
What resulted: The subsequent SEC investigation found that Knight did not have adequate safeguards in
place to limit the risks posed by its access to the markets, and failed as a result to prevent the entry of
millions of erroneous orders. Knight also failed to conduct adequate reviews of the effectiveness of its
controls. On Oct. 16, 2013 (almost a year after the incident), Knight Capital Americas LLC agreed to pay
$12 million to settle charges that it violated the agency’s market access rule in connection with the firm’s
Aug. 1, 2012 trading incident that disrupted the markets.
Other Glitches and NSCC Risk Waterfall
In addition to the breakdowns noted above, market participants’ and market centers’ operational
resiliencies have been challenged with system issues involving the SIPs (On Aug. 22, 2012, NASDAQ SIP's
back-up failure resulted in a three-hour outage), exchange systems (BATS' IPO), trade reporting facilities,
data feeds, broker systems and even natural disasters. The systematic risk associated with highly
automated and interconnected markets presents a great challenge for regulators, market participants and
clearing entities. In the end, clearing members bear the risk for a catastrophic system error.
In the US, NSCC acts as the central counterparty for clearance and settlement for virtually all broker-to-
broker stock transaction (the guarantee is typically reached at midnight of T+1). Thus far, none of these
system disruptions have tested the NSCC’s Trade Guaranty and hopefully none will. To ensure the US
equity clearing systems’ stability, NSCC has built many layers of protection into its risk management
program designed to mitigate credit (client defaults), market (client’s portfolio is under-collateralized) and
liquidity (lack resources to cover defaulted client) risk. However, if, despite the various tools NSCC
employs to minimize the possibility, a client default becomes necessary, the following NSCC’s loss
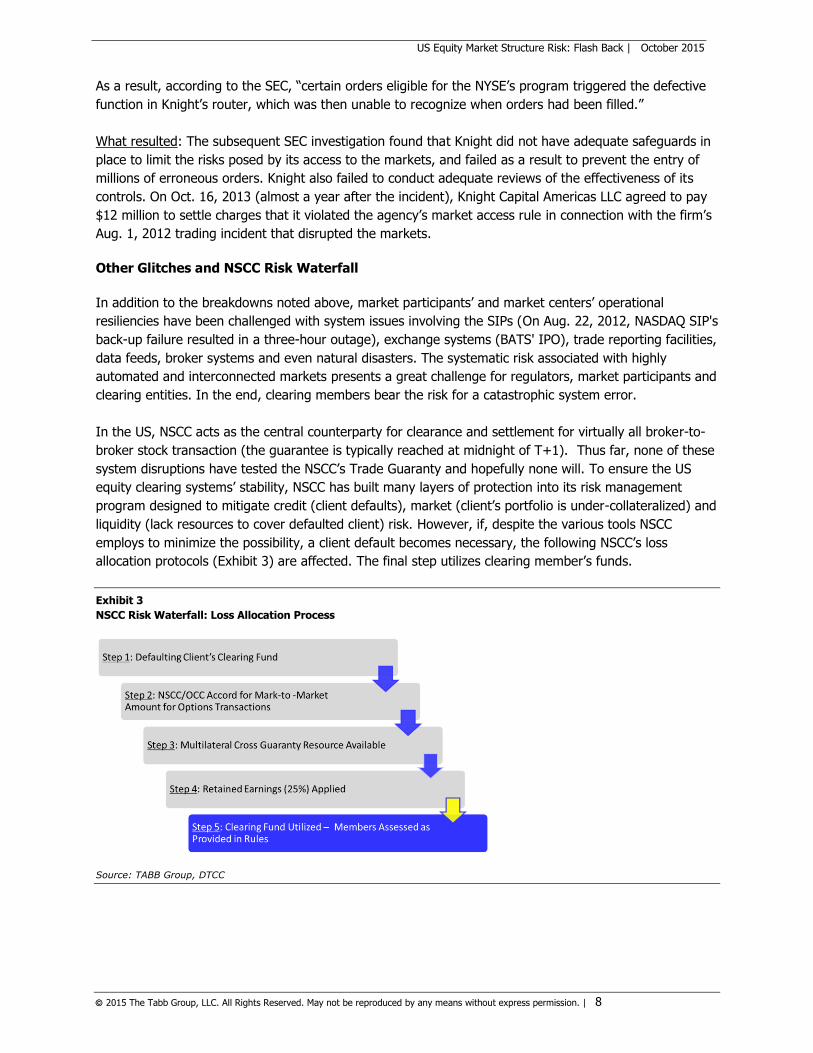
allocation protocols (Exhibit 3) are affected. The final step utilizes clearing member’s funds.
Exhibit 3
NSCC Risk Waterfall: Loss Allocation Process
Source: TABB Group, DTCC
2015 The Tabb Group, LLC. All Rights Reserved. May not be reproduced by any means without express permission. | 9
US Equity Market Structure Risk: Flash Back | October 2015
Regulatory Actions The industry infrastructure breakdowns have not gone unnoticed by the regulators. With each event,
brokers and regulators have initiated regulations and/or implemented additional layers of resiliencies in
order to reduce future incidents. While not perfect, the industry continually seeks to improve existing
market infrastructure and regulations in an effort to increase fairness, transparency and investor
confidence. Given the implementation timeline for these measures, each solution presents its own
challenges, from retrofitting its original purpose to presenting a practical solution based on business and
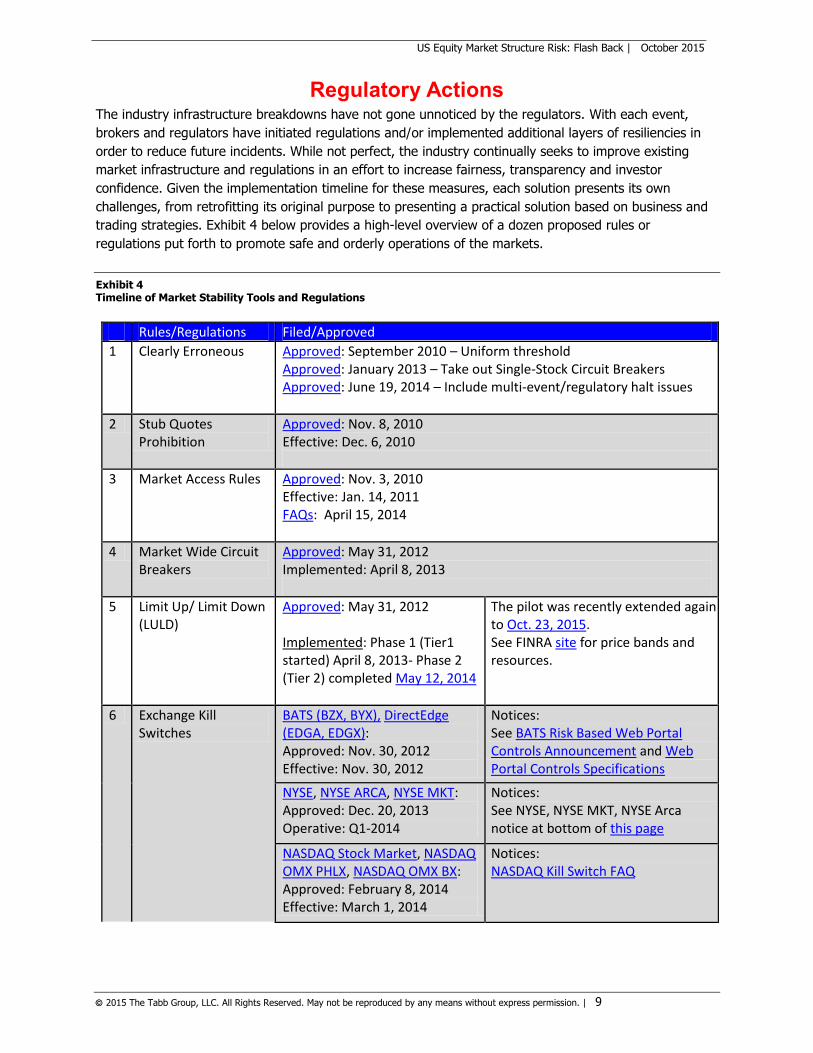
trading strategies. Exhibit 4 below provides a high-level overview of a dozen proposed rules or
regulations put forth to promote safe and orderly operations of the markets.
Exhibit 4 Timeline of Market Stability Tools and Regulations
Rules/Regulations Filed/Approved
1 Clearly Erroneous Approved: September 2010 – Uniform threshold Approved: January 2013 – Take out Single-Stock Circuit Breakers Approved: June 19, 2014 – Include multi-event/regulatory halt issues
2 Stub Quotes Prohibition
Approved: Nov. 8, 2010 Effective: Dec. 6, 2010
3 Market Access Rules Approved: Nov. 3, 2010 Effective: Jan. 14, 2011 FAQs: April 15, 2014
4 Market Wide Circuit Breakers
Approved: May 31, 2012 Implemented: April 8, 2013
5 Limit Up/ Limit Down (LULD)
Approved: May 31, 2012 Implemented: Phase 1 (Tier1 started) April 8, 2013- Phase 2 (Tier 2) completed May 12, 2014
The pilot was recently extended again to Oct. 23, 2015. See FINRA site for price bands and resources.
6 Exchange Kill Switches
BATS (BZX, BYX), DirectEdge (EDGA, EDGX): Approved: Nov. 30, 2012 Effective: Nov. 30, 2012
Notices: See BATS Risk Based Web Portal Controls Announcement and Web Portal Controls Specifications
NYSE, NYSE ARCA, NYSE MKT: Approved: Dec. 20, 2013 Operative: Q1-2014
Notices: See NYSE, NYSE MKT, NYSE Arca notice at bottom of this page
NASDAQ Stock Market, NASDAQ OMX PHLX, NASDAQ OMX BX: Approved: February 8, 2014 Effective: March 1, 2014
Notices: NASDAQ Kill Switch FAQ
2015 The Tabb Group, LLC. All Rights Reserved. May not be reproduced by any means without express permission. | 10
US Equity Market Structure Risk: Flash Back | October 2015
CHX Approved: Jan. 27, 2014 Operative: April 23, 2014
Notices: (1) CHX Technical User Guide – Select the CHX Risk Management Tools Technical UI Guide and (2) CHX Signup/Registration Request/Memo
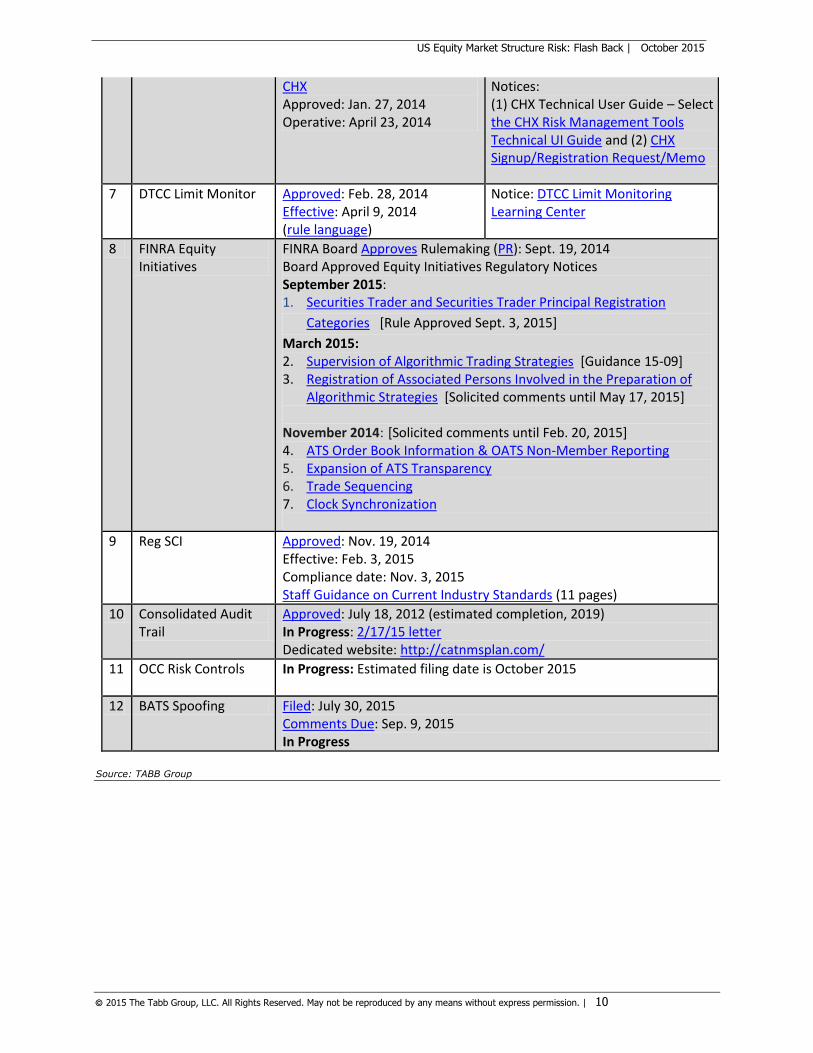
7 DTCC Limit Monitor Approved: Feb. 28, 2014 Effective: April 9, 2014 (rule language)
Notice: DTCC Limit Monitoring Learning Center
8 FINRA Equity Initiatives
FINRA Board Approves Rulemaking (PR): Sept. 19, 2014 Board Approved Equity Initiatives Regulatory Notices September 2015: 1. Securities Trader and Securities Trader Principal Registration
Categories [Rule Approved Sept. 3, 2015]
March 2015: 2. Supervision of Algorithmic Trading Strategies [Guidance 15-09] 3. Registration of Associated Persons Involved in the Preparation of
Algorithmic Strategies [Solicited comments until May 17, 2015] November 2014: [Solicited comments until Feb. 20, 2015] 4. ATS Order Book Information & OATS Non-Member Reporting 5. Expansion of ATS Transparency 6. Trade Sequencing 7. Clock Synchronization
9 Reg SCI Approved: Nov. 19, 2014 Effective: Feb. 3, 2015 Compliance date: Nov. 3, 2015 Staff Guidance on Current Industry Standards (11 pages)
10 Consolidated Audit Trail
Approved: July 18, 2012 (estimated completion, 2019) In Progress: 2/17/15 letter Dedicated website: http://catnmsplan.com/
11 OCC Risk Controls In Progress: Estimated filing date is October 2015
12 BATS Spoofing Filed: July 30, 2015 Comments Due: Sep. 9, 2015 In Progress
Source: TABB Group
2015 The Tabb Group, LLC. All Rights Reserved. May not be reproduced by any means without express permission. | 11
US Equity Market Structure Risk: Flash Back | October 2015
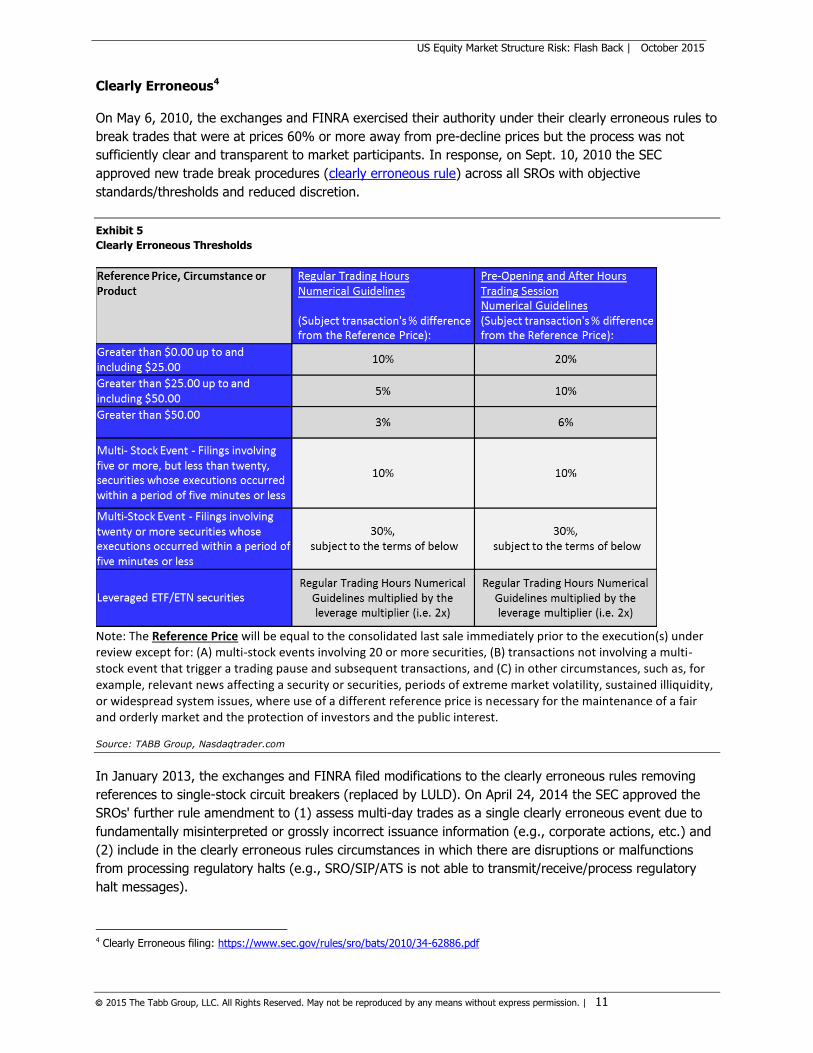
Clearly Erroneous4
On May 6, 2010, the exchanges and FINRA exercised their authority under their clearly erroneous rules to
break trades that were at prices 60% or more away from pre-decline prices but the process was not
sufficiently clear and transparent to market participants. In response, on Sept. 10, 2010 the SEC
approved new trade break procedures (clearly erroneous rule) across all SROs with objective
standards/thresholds and reduced discretion.
Exhibit 5
Clearly Erroneous Thresholds
Note: The Reference Price will be equal to the consolidated last sale immediately prior to the execution(s) under review except for: (A) multi-stock events involving 20 or more securities, (B) transactions not involving a multi-stock event that trigger a trading pause and subsequent transactions, and (C) in other circumstances, such as, for example, relevant news affecting a security or securities, periods of extreme market volatility, sustained illiquidity, or widespread system issues, where use of a different reference price is necessary for the maintenance of a fair and orderly market and the protection of investors and the public interest. Source: TABB Group, Nasdaqtrader.com
In January 2013, the exchanges and FINRA filed modifications to the clearly erroneous rules removing
references to single-stock circuit breakers (replaced by LULD). On April 24, 2014 the SEC approved the
SROs' further rule amendment to (1) assess multi-day trades as a single clearly erroneous event due to
fundamentally misinterpreted or grossly incorrect issuance information (e.g., corporate actions, etc.) and
(2) include in the clearly erroneous rules circumstances in which there are disruptions or malfunctions
from processing regulatory halts (e.g., SRO/SIP/ATS is not able to transmit/receive/process regulatory
halt messages).
4 Clearly Erroneous filing: https://www.sec.gov/rules/sro/bats/2010/34-62886.pdf
2015 The Tabb Group, LLC. All Rights Reserved. May not be reproduced by any means without express permission. | 12
US Equity Market Structure Risk: Flash Back | October 2015
Stub Quote Prohibition5
On Nov. 6, 2010, the SEC approved new minimum market making obligations and prohibited stub quotes.
Stub quotes are offers to buy and sell a stock at prices far away from the prevailing market, such as an
offer to buy at $.01 and sell at $100,000. On May 6, 2010, a significant number of stub quotes were
executed and subsequently broken. The new rule aims to reduce the risk of trades executing at irrational
prices when markets become volatile.
Market makers in NMS securities must maintain continuous two-sided quotations during regular market
hours that are within a certain percentage band of the national best bid and offer (NBBO). The band
would vary based on different criteria:
For Tier 1 securities (S&P 500, Russell 1000 and selected ETFs) subject to the LULD pilot
program, market makers must enter quotes that are not more than 8% away from the NBBO.
For Tier 2 securities (priced equal or greater $1/priced less than $1), market makers must enter
quotes not more than 28%/30% away from the NBBO.
In each of these cases, a market maker's quote will be allowed to "drift" an additional 1.5% away
from the NBBO before a new quote within the applicable band must be entered.
The new market maker quoting requirements became effective on Dec. 6, 2010.
Market Access Rule6
In 2010, the SEC approved regulations to systematically limit financial exposure via the Market Access
Rule (15c3-5). Among other requirements, the rule requires that broker-dealers:
(1) “Create financial risk management controls reasonably designed to prevent the entry of orders
that exceed appropriate pre-set credit or capital thresholds, or that appear to be erroneous.
(2) Have certain financial and regulatory risk management controls applied automatically on a pre-
trade basis before orders route to an exchange or ATS.
(3) Maintain risk management controls and supervisory procedures under the direct and exclusive
control of the broker-dealer with market access (with limited exceptions).
(4) Establish, document and maintain a system for regularly reviewing the effectiveness of its risk
management controls and for promptly addressing any issues.”
Four years after the initial compliance date of the Market Access Rule, April 15, 2014, the SEC provided
market participants a list of Frequently Asked Question (FAQ). Around the same time the agency
completed investigations and levied fines that have raised market participants’ concerns, specifically
around routing in IPOs and pre-market orders. Some have argued that these fines were justified but
others have suggested that, in light of the delay in publishing the FAQ, the SEC was regulating by
enforcement in some cases.
5 Stub Quote Prohibition: https://www.sec.gov/news/press/2010/2010-216.htm 6 Market Access Rule: https://www.sec.gov/rules/final/2010/34-63241.pdf
2015 The Tabb Group, LLC. All Rights Reserved. May not be reproduced by any means without express permission. | 13
US Equity Market Structure Risk: Flash Back | October 2015
Market-wide Circuit Breakers7
On May 31, 2012, the SEC approved the proposal from the exchanges and FINRA to revise existing equity
market-wide circuit breakers (halts all NMS securities) to be more meaningful given high speed electronic
markets and more coordinated with options and futures markets. The following changes took effect on
April 8, 2013:
(1) replaced the Dow Jones Industrial Average with the S&P 500 Index as the reference index;
(2) recalculate the values of the triggers daily (vs. previous closing) instead of each calendar quarter;
(3) reduced the 10%, 20% and 30% market decline trigger percentages to 7%, 13% and 20%;
(4) shortened the length of trading halts associated with each market decline level (15 minutes
versus 30 minutes/one hour/two hours depending on time); and
(5) modified the times when a trading halt may be triggered.
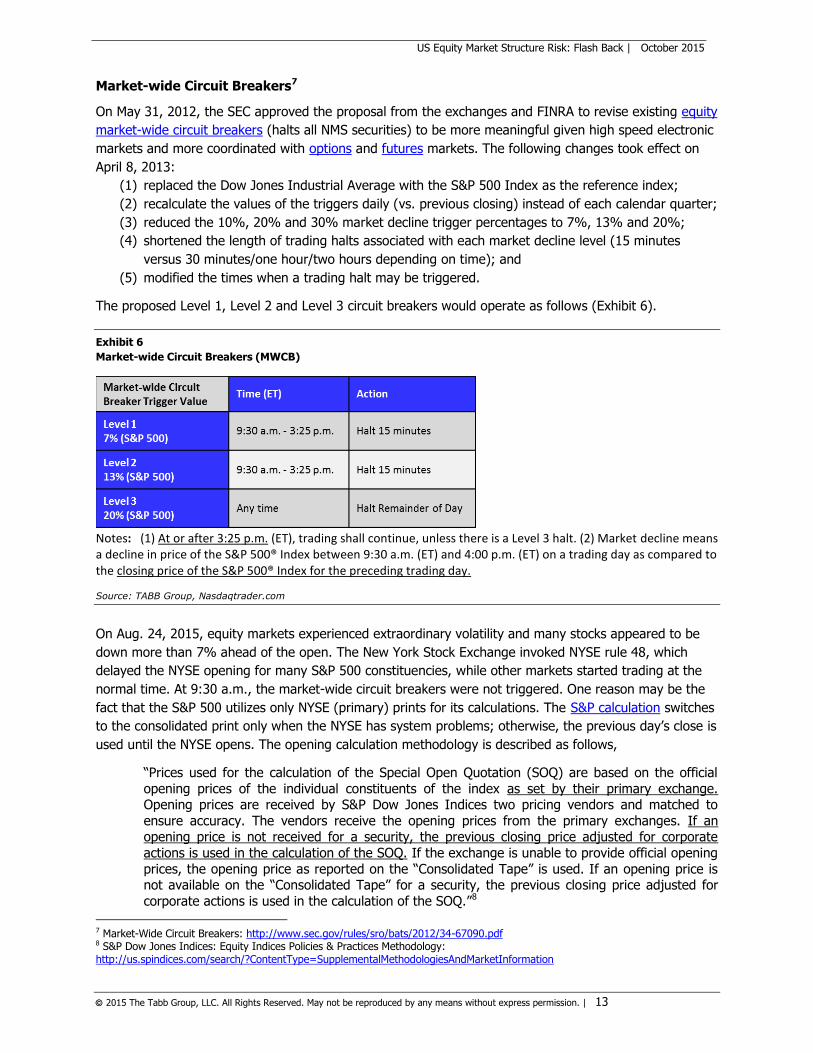
The proposed Level 1, Level 2 and Level 3 circuit breakers would operate as follows (Exhibit 6).
Exhibit 6
Market-wide Circuit Breakers (MWCB)
Notes: (1) At or after 3:25 p.m. (ET), trading shall continue, unless there is a Level 3 halt. (2) Market decline means a decline in price of the S&P 500® Index between 9:30 a.m. (ET) and 4:00 p.m. (ET) on a trading day as compared to the closing price of the S&P 500® Index for the preceding trading day.
Source: TABB Group, Nasdaqtrader.com
On Aug. 24, 2015, equity markets experienced extraordinary volatility and many stocks appeared to be
down more than 7% ahead of the open. The New York Stock Exchange invoked NYSE rule 48, which
delayed the NYSE opening for many S&P 500 constituencies, while other markets started trading at the
normal time. At 9:30 a.m., the market-wide circuit breakers were not triggered. One reason may be the
fact that the S&P 500 utilizes only NYSE (primary) prints for its calculations. The S&P calculation switches
to the consolidated print only when the NYSE has system problems; otherwise, the previous day’s close is
used until the NYSE opens. The opening calculation methodology is described as follows,
“Prices used for the calculation of the Special Open Quotation (SOQ) are based on the official
opening prices of the individual constituents of the index as set by their primary exchange. Opening prices are received by S&P Dow Jones Indices two pricing vendors and matched to
ensure accuracy. The vendors receive the opening prices from the primary exchanges. If an opening price is not received for a security, the previous closing price adjusted for corporate
actions is used in the calculation of the SOQ. If the exchange is unable to provide official opening
prices, the opening price as reported on the “Consolidated Tape” is used. If an opening price is not available on the “Consolidated Tape” for a security, the previous closing price adjusted for
corporate actions is used in the calculation of the SOQ.”8
7 Market-Wide Circuit Breakers: http://www.sec.gov/rules/sro/bats/2012/34-67090.pdf 8 S&P Dow Jones Indices: Equity Indices Policies & Practices Methodology: http://us.spindices.com/search/?ContentType=SupplementalMethodologiesAndMarketInformation
2015 The Tabb Group, LLC. All Rights Reserved. May not be reproduced by any means without express permission. | 14
US Equity Market Structure Risk: Flash Back | October 2015
On Aug. 24, it appears that the delayed NYSE opening for certain S&P 500 constituencies forced the S&P
500 Index calculations to be based off of the previous closing price even though other market centers
had commenced trading in those stocks.
A review of S&P 500 Index’s utilization of only primary prints in calculation and its potential
impact on market-wide circuit breakers would be worthwhile.
Limit Up/Limit Down9
In conjunction with the revised market-wide circuit breakers on May 31, 2012, the SEC approved a new
Limit Up/Limit Down (LULD) mechanism to replace the single-stock circuit breakers (the transition period
was April 8, 2013 to May 12, 2014). These procedures were in response to the unusually volatile trading
on May 6, 2010, that affected a large number of individual securities but was not broad enough to trigger
the existing market-wide circuit breakers.
The initial stock circuit breakers (pilot started on limited basis on June 10, 2010 and later expanded)
paused trading in a security for five minutes if that security had experienced a 10% price change over
the preceding five minutes. The single-stock circuit breakers were triggered after a trade occurred at or
outside of the applicable percentage threshold (circuit breakers were triggered by erroneous trades). In
contrast, the new LULD mechanism was intended to prevent trades in individual securities from occurring
outside of a specified price band.
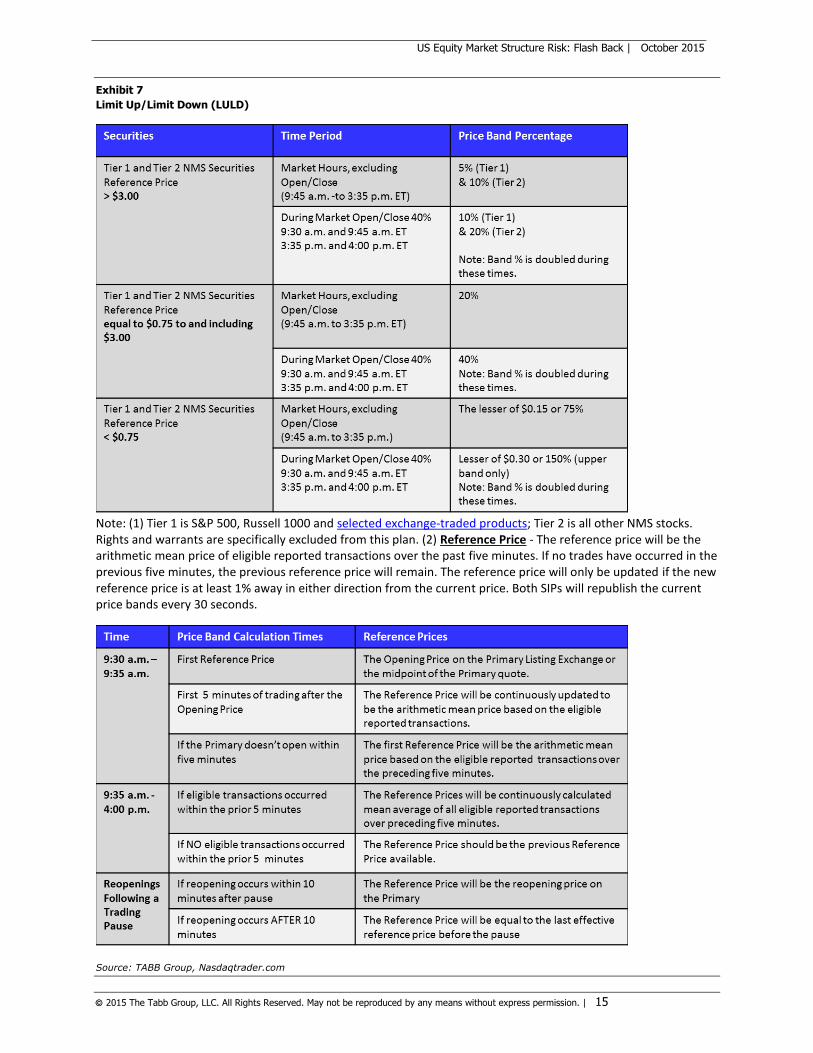
As summarized in Exhibit 7, LULD price bands are set at a percentage level above and below the average
price of the stock over the immediately preceding five-minute trading period. These price limit bands are
5%, 10% and 20% or the lesser of $0.15 or 75%, depending on the price of the stock. Additionally,
these price bands are doubled during the opening and closing periods of the trading day. If the stock’s
price does not naturally move back within the price bands within 15 seconds, there is a five-minute
trading pause.
9 Limit Up/Limit Down: https://www.finra.org/industry/trf/limit-uplimit-down-luld-plan
2015 The Tabb Group, LLC. All Rights Reserved. May not be reproduced by any means without express permission. | 15
US Equity Market Structure Risk: Flash Back | October 2015
Exhibit 7
Limit Up/Limit Down (LULD)
Note: (1) Tier 1 is S&P 500, Russell 1000 and selected exchange-traded products; Tier 2 is all other NMS stocks. Rights and warrants are specifically excluded from this plan. (2) Reference Price - The reference price will be the arithmetic mean price of eligible reported transactions over the past five minutes. If no trades have occurred in the previous five minutes, the previous reference price will remain. The reference price will only be updated if the new reference price is at least 1% away in either direction from the current price. Both SIPs will republish the current price bands every 30 seconds.
Source: TABB Group, Nasdaqtrader.com
2015 The Tabb Group, LLC. All Rights Reserved. May not be reproduced by any means without express permission. | 16
US Equity Market Structure Risk: Flash Back | October 2015
The LULD mechanism commenced its roll out on April 8, 2013 and was completed on May 12, 2014. The
LULD pilot was recently extended again to Oct. 23, 2015. It should be noted that although LULD is
intended to prevent erroneous trades before they occur, the calculation of the “reference price” for each
calculations differs (see Exhibits 5 and 7).
A review and harmonization of reference price calculations between Clearly Erroneous Rule
and Limit Up/Limit Down would be worthwhile.
The extreme volatility of Aug. 24, 2015, resulted in more than 1,200 LULD halts (the Wall Street Journal
reported that 80% of these halts were in ETFs), leaving practitioners wondering whether the existing
parameters are too tight for all products. The conundrum with changing LULD parameters is that the
circuit breaker should be the pause that refreshes, not the mechanism that prevents buying and selling.
Media coverage of the August 24th volatility included an interview with NASDAQ chief executive, Robert
Greifeld, comparing US circuit breakers to other regions. He stated that absolute circuit breakers
(preventing trading), such as the ones in the Chinese Stock Market, could actually have a negative long-
term impact.
Markets outside of the US are also reviewing their circuit breakers. In China, stocks and index futures are
only allowed a daily maximum move of 10% from the previous closing level in either direction. In a new
proposal announced on Sept. 11, 2015, the Shanghai Stock Exchange (SSE), the Shenzhen Stock
Exchange (SZSE) and the China Financial Futures Exchange (CFFEX) stated that they are considering
adding a market-wide circuit breaker layer via CSI300 Index. A 5% move of CSI300 index would trigger a
30-minute market-wide halt if it occurs before 2:30 p.m. local time and after that, a freeze on trading
until the end of the day. A 7% move in the CSI300 would halt trading for the rest of the day. Market
participants had until Sept. 21, 2015 to comment on the proposal.
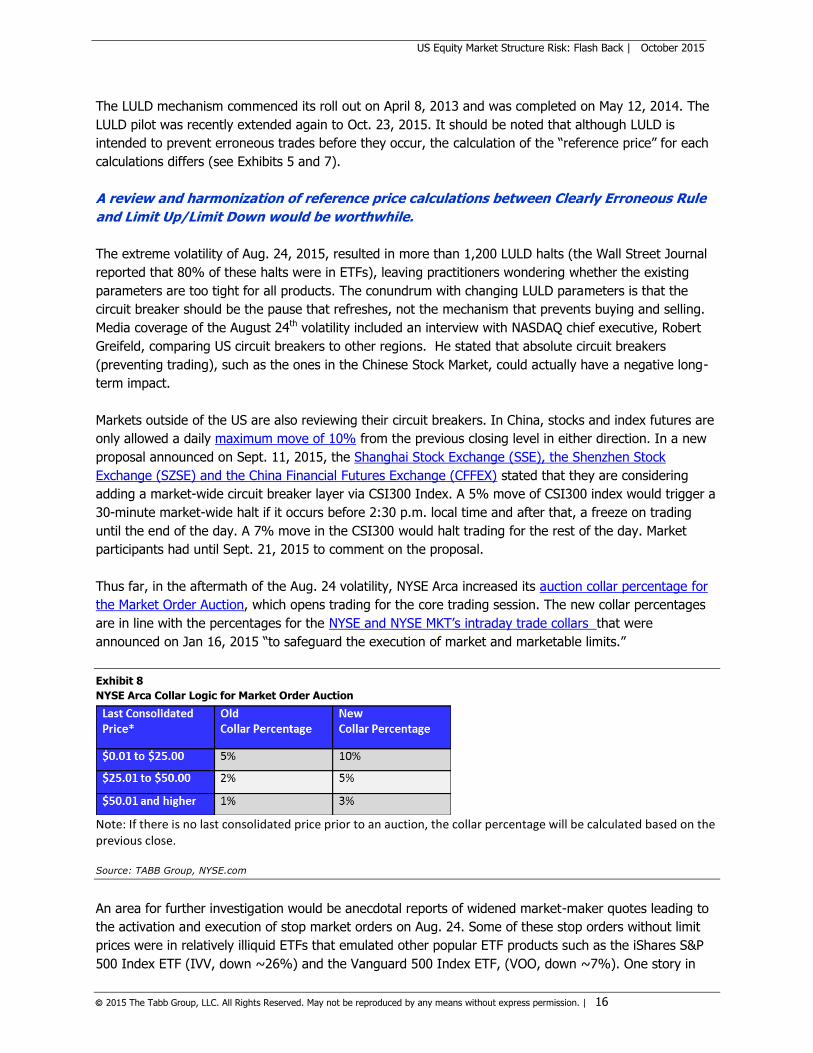
Thus far, in the aftermath of the Aug. 24 volatility, NYSE Arca increased its auction collar percentage for
the Market Order Auction, which opens trading for the core trading session. The new collar percentages
are in line with the percentages for the NYSE and NYSE MKT’s intraday trade collars that were
announced on Jan 16, 2015 “to safeguard the execution of market and marketable limits.”
Exhibit 8
NYSE Arca Collar Logic for Market Order Auction
Note: If there is no last consolidated price prior to an auction, the collar percentage will be calculated based on the previous close.
Source: TABB Group, NYSE.com
An area for further investigation would be anecdotal reports of widened market-maker quotes leading to
the activation and execution of stop market orders on Aug. 24. Some of these stop orders without limit
prices were in relatively illiquid ETFs that emulated other popular ETF products such as the iShares S&P
500 Index ETF (IVV, down ~26%) and the Vanguard 500 Index ETF, (VOO, down ~7%). One story in
2015 The Tabb Group, LLC. All Rights Reserved. May not be reproduced by any means without express permission. | 17
US Equity Market Structure Risk: Flash Back | October 2015
the market suggested that the origin of many of these orders may have been wealth management
companies.
While the responsibility or fault of product selection, order sender, order type or executing venue can be
debated in the context of suitability and/or fiduciary duty, most would agree that order senders and
clients would benefit from further ETF education and/or disclosures.
A study of the triggers of the ETF LULD halts on Aug. 24, including specific order types, ETF
product characteristics and order senders would be worthwhile.
Exchange Kill Switches10
The Oct. 2, 2012 SEC roundtable Technology and Trading: Promoting Stability in Today’s Markets,
focused on error prevention and responses:
(1) Error Prevention - “focusing on current best practices and practical constraints for creating,
deploying and operating mission-critical systems, including those used to automatically generate
and route orders, match trades, confirm transactions and disseminate data.”
(2) Error Response - “employ[ing] independent filters, objective tests and other real-time
processes or crisis-management procedures to detect, limit and possibly terminate erroneous
market activities when they occur, thereby limiting the impact of such errors.”
Prior to the roundtable, an industry working group consisting of broker-dealers and buy-side firms
submitted a comment letter with the following primary recommendations in order to construct
complementary tools to potentially help isolate extreme events and prevent market disruptions:
“(1) Establish limits at individual SROs that track the “Peak Net Notional Exposure” for each
individual participant member firm that would allow limits to be placed on overall and/or categories of activity. These triggers would measure post-trade exposure on an automated
basis, would be mandatory for all broker-dealer SRO participants, and would potentially be accessible to members’ clearing firms.
(2) Further study to develop other potential quantitative controls to better detect abnormal
trading behavior in real-time; (3) Evaluate whether a longer-term consolidated control mechanism could be built at DTCC’s
clearing agency subsidiaries.”
The roundtable participants and the industry working group generally favored a “kill-switch” mechanism
to cancel all orders if such activity were posing a threat to market integrity. However, there was concern
that firms would be reluctant to systematically cut themselves off from the market and therefore, any kill-
switch-triggering threshold would be set by the firm at a conservative level such that the automated
disconnect would not occur when actually needed.
Three years later, these conversations led to each of the exchanges building their own versions of non-
mandatory kill switches for their members, while DTCC built its own Limit Monitor tool. The kill switch
functionalities (e.g., some automated cancels with NNRE breach, others only provide alert) are not
uniform across market centers and further granularity in mapping risk groups is desired. For example,
some market participants would like to see the current risk group (firm ID) selection expanded to one
being mapped by IDs with the clearing firm, specific ports/sessions and order types (e.g., non-GTC).
Exhibit 9 provides a summary of existing kill-switch attributes.
10 SEC Roundtable: http://www.sec.gov/news/otherwebcasts/2012/ttr100212.shtml; Roundtable comment letters: https://www.sec.gov/comments/4-652/4-652.shtml
2015 The Tabb Group, LLC. All Rights Reserved. May not be reproduced by any means without express permission. | 18
US Equity Market Structure Risk: Flash Back | October 2015
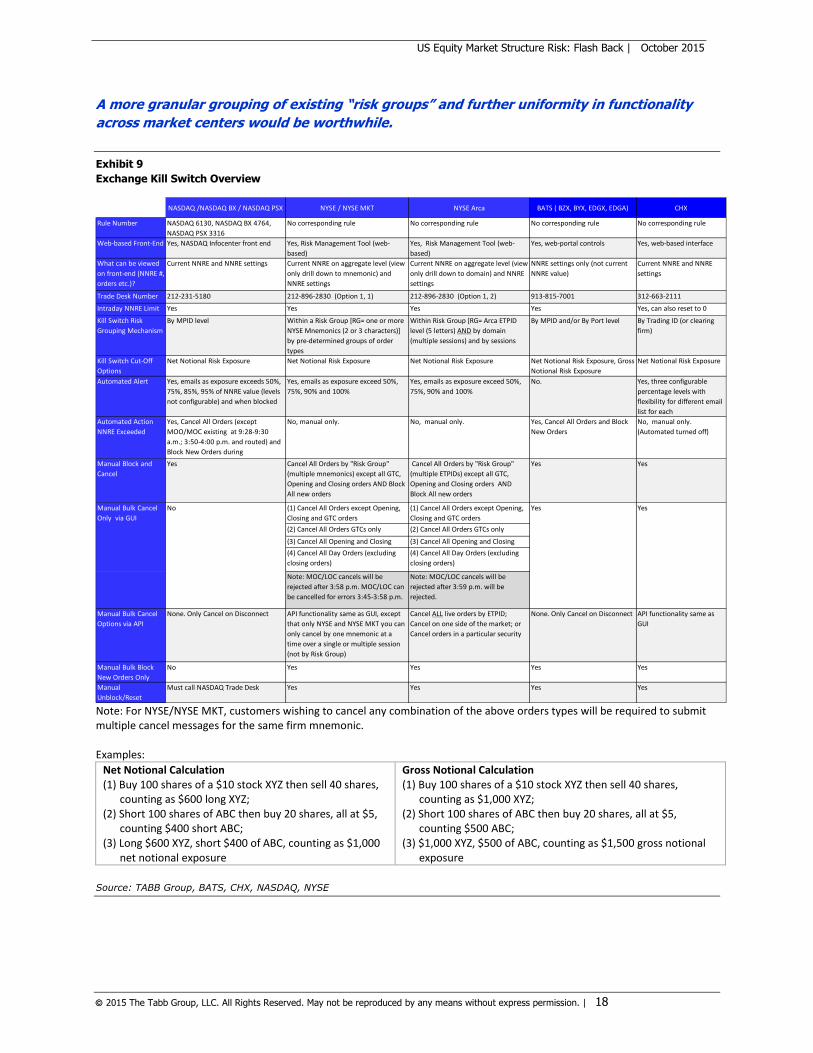
A more granular grouping of existing “risk groups” and further uniformity in functionality
across market centers would be worthwhile.
Exhibit 9
Exchange Kill Switch Overview
Note: For NYSE/NYSE MKT, customers wishing to cancel any combination of the above orders types will be required to submit multiple cancel messages for the same firm mnemonic. Examples:
Net Notional Calculation (1) Buy 100 shares of a $10 stock XYZ then sell 40 shares,
counting as $600 long XYZ; (2) Short 100 shares of ABC then buy 20 shares, all at $5,
counting $400 short ABC; (3) Long $600 XYZ, short $400 of ABC, counting as $1,000
net notional exposure
Gross Notional Calculation (1) Buy 100 shares of a $10 stock XYZ then sell 40 shares,
counting as $1,000 XYZ; (2) Short 100 shares of ABC then buy 20 shares, all at $5,
counting $500 ABC; (3) $1,000 XYZ, $500 of ABC, counting as $1,500 gross notional
exposure
Source: TABB Group, BATS, CHX, NASDAQ, NYSE
NASDAQ /NASDAQ BX / NASDAQ PSX NYSE / NYSE MKT NYSE Arca BATS ( BZX, BYX, EDGX, EDGA) CHX
Rule Number NASDAQ 6130, NASDAQ BX 4764,
NASDAQ PSX 3316
No corresponding rule No corresponding rule No corresponding rule No corresponding rule
Web-based Front-End Yes, NASDAQ Infocenter front end Yes, Risk Management Tool (web-
based)
Yes, Risk Management Tool (web-
based)
Yes, web-portal controls Yes, web-based interface
What can be viewed
on front-end (NNRE #,
orders etc.)?
Current NNRE and NNRE settings Current NNRE on aggregate level (view
only drill down to mnemonic) and
NNRE settings
Current NNRE on aggregate level (view
only drill down to domain) and NNRE
settings
NNRE settings only (not current
NNRE value)
Current NNRE and NNRE
settings
Trade Desk Number 212-231-5180 212-896-2830 (Option 1, 1) 212-896-2830 (Option 1, 2) 913-815-7001 312-663-2111
Intraday NNRE Limit
Changes
Yes Yes Yes Yes Yes, can also reset to 0
Kill Switch Risk
Grouping Mechanism
By MPID level Within a Risk Group [RG= one or more
NYSE Mnemonics (2 or 3 characters)]
by pre-determined groups of order
types
Within Risk Group [RG= Arca ETPID
level (5 letters) AND by domain
(multiple sessions) and by sessions
By MPID and/or By Port level By Trading ID (or clearing
firm)
Kill Switch Cut-Off
Options
Net Notional Risk Exposure Net Notional Risk Exposure Net Notional Risk Exposure Net Notional Risk Exposure, Gross
Notional Risk Exposure
Net Notional Risk Exposure
Automated Alert Yes, emails as exposure exceeds 50%,
75%, 85%, 95% of NNRE value (levels
not configurable) and when blocked
Yes, emails as exposure exceed 50%,
75%, 90% and 100%
Yes, emails as exposure exceed 50%,
75%, 90% and 100%
No. Yes, three configurable
percentage levels with
flexibility for different email
list for each
Automated Action
NNRE Exceeded
Yes, Cancel All Orders (except
MOO/MOC existing at 9:28-9:30
a.m.; 3:50-4:00 p.m. and routed) and
Block New Orders during
No, manual only. No, manual only. Yes, Cancel All Orders and Block
New Orders
No, manual only.
(Automated turned off)
Manual Block and
Cancel
Yes Cancel All Orders by "Risk Group"
(multiple mnemonics) except all GTC,
Opening and Closing orders AND Block
All new orders
Cancel All Orders by "Risk Group"
(multiple ETPIDs) except all GTC,
Opening and Closing orders AND
Block All new orders
Yes Yes
(1) Cancel All Orders except Opening,
Closing and GTC orders
(1) Cancel All Orders except Opening,
Closing and GTC orders
(2) Cancel All Orders GTCs only (2) Cancel All Orders GTCs only
(3) Cancel All Opening and Closing (3) Cancel All Opening and Closing
(4) Cancel All Day Orders (excluding
closing orders)
(4) Cancel All Day Orders (excluding
closing orders)
Note: MOC/LOC cancels will be
rejected after 3:58 p.m. MOC/LOC can
be cancelled for errors 3:45-3:58 p.m.
Note: MOC/LOC cancels will be
rejected after 3:59 p.m. will be
rejected.
Manual Bulk Cancel
Options via API
None. Only Cancel on Disconnect API functionality same as GUI, except
that only NYSE and NYSE MKT you can
only cancel by one mnemonic at a
time over a single or multiple session
(not by Risk Group)
Cancel ALL live orders by ETPID;
Cancel on one side of the market; or
Cancel orders in a particular security
None. Only Cancel on Disconnect API functionality same as
GUI
Manual Bulk Block
New Orders Only
No Yes Yes Yes Yes
Manual
Unblock/Reset
Must call NASDAQ Trade Desk Yes Yes Yes Yes
No YesManual Bulk Cancel
Only via GUI
Yes
2015 The Tabb Group, LLC. All Rights Reserved. May not be reproduced by any means without express permission. | 19
US Equity Market Structure Risk: Flash Back | October 2015
DTCC Limit Monitor 11
DTCC Limit Monitor is a mandatory risk management tool that delivers message alerts for both early
warning and breaches of established credit limits. In near real time, it leverages the Universal Trade
Capture (UTC) platform to bring members aggregated exposure for broker-to-broker equity, listed
corporate and municipal bond and unit investment trust trading. Clearing firms can set limits at the
executing broker level and modify such limits intraday. The DTCC Limit Monitor enables firms to receive
early warning alerts from set limits when they approach credit limits for their own account,
correspondents and/or created risk entity groups.
NSCC members are responsible for establishing the appropriate risk entities and ensuring they are
maintained and that alerts are reviewed. NSCC members also have access to historical data of risk
entities to establish the net notional limits (sum of the absolute value of net executed dollar volume for a
security). They have the net notional high for each day and the month. Once risk entities are established
(NSCC can provide a daily output of unassigned activity) and net notional limits are set, alerts can be
received on screen (they must be refreshed), via email alerts and/or via MQ systematic message alert.
Any actions based on the alerts are at discretion of the member. NSCC will continue to accept trades
even if the established limit is breached.
Some market participants believe that credit limit alerts only become valuable once they are combined or
compared across asset classes, otherwise the setting can be arbitrary. But others think that even with the
information from other asset classes, a large undertaking is required to map MPIDs, risk entities and
clearing firms properly across the industry. The ID mapping and integration of executing firm/clearing
firms across asset classes would be extremely valuable but quite a large undertaking that has not been
initiated by any of the clearinghouses.
Initiating a project to map firm identifiers across equity markets with the goal of expanding
the DTCC centralized limit monitor to include other asset classes would be worthwhile.
FINRA’s Series of Notices on Regulatory Initiatives12
In response to SEC Chair White's call to action in her two landmark speeches (Focusing on Fundamentals:
The Path to Address Equity Market Structure, October 2013, and Enhancing Our Equity Market Structure,
June 2014), on Sept. 19, 2014, the FINRA Board authorized a series of regulatory notices on the
following regulatory initiatives: supervision of algorithmic trading strategies; registration of associated
persons involved in the preparation of algorithmic strategies; supervision of algorithmic trading
strategies; registration of associated persons involved in the preparation of algorithmic strategies;
expansion of ATS transparency; clock synchronization; and trade sequencing.
In March 2015, FINRA published its guidance on the effective supervision and control practices of firms
engaging in algorithmic trading strategies (Equity Trading Initiatives: Supervision and Control Practices
for Algorithmic Trading Strategies). The publication reviewed a number of existing FINRA rules that
govern trading strategies and suggested effective practices for firms engaging in algorithmic trading
strategies based on FINRA staff’s examinations and investigative work related to algorithmic strategies.
11 DTCC Limit Monitor: https://dtcclearning.com/learning/clearance/topics/dtcc-limit-monitoring/learn-about-dtcc-limit-monitoring.html 12 FINRA Regulatory Initiative: http://www.finra.org/newsroom/2014/finra-board-approves-series-equity-trading-and-fixed-income-rulemaking-items
2015 The Tabb Group, LLC. All Rights Reserved. May not be reproduced by any means without express permission. | 20
US Equity Market Structure Risk: Flash Back | October 2015
The existing FINRA rules reviewed included Rule 5210 (Publication of Transactions and Quotations), Rule
6140 (Other Trading Practices), Rule 2010 (Standards for Commercial Honor and Principles of Trades),
along with SEC’s Market Access Rule 15c3-5, Reg NMS and Reg SHO. These rules prohibit fictitious
quoting, spoofing, layering of quotes, self-trades, improperly influencing market price and
locking/crossing markets. The rules also require establishing reasonable policies and procedures to
prevent execution at inferior prices to the protected quotations and preventing the execution or display of
a short sale order in a covered security that’s declined 10% or more from the prior day’s close.
The effective practices described were focused on five general areas: (1) General Risk Assessment and
Response; (2) Software/Code Development and Implementation; (3) Software Testing and System
Validation; (4) Trading Systems; and (5) Compliance. It was noted that although these supervision and
control suggestions may not anticipate every potential failure or prevent every undesirable consequence,
its efforts are aimed at reducing future occurrences.
Also in March 2015, FINRA solicited comments and later approved a proposal to require registration as a
Securities Trader of associated persons primarily responsible for the design, development or significant
modification of algorithmic trading strategies, or who are responsible for supervising or directing such
activities.
Revisiting and promoting active discussions regarding FINRA’s series of regulatory notices
including guidance on best practices for algorithm supervision and comment solicitation on
associated person registration requirements by market participants would be worthwhile.
SEC Reg SCI13
The SEC adopted Regulation Systems Compliance and Integrity (Reg SCI) on Nov. 19, 2014 and
published Staff Guidance on Current Industry Standards. The rule became effective on Feb. 3, 2015 and
compliance date is scheduled for Nov. 3, 2015. Reg SCI entities include SROs, plan processors, clearing
agencies and ATSs that exceed volume thresholds.
The rules aim to develop a uniform regulatory framework to maintain the integrity and resiliency of
automated systems in US equity markets and ensure it meets certain standards. Identified SCI entities
are required to design, develop, test, maintain and surveil systems that are integral to their operations.
These requirements cover software development, stress tests, collection of market data, system
monitoring, cybersecurity, business continuity and disaster recovery planning, periodic reviews, and plans
to promptly remedy any deficiencies (including SEC notifications for systems disruption events).
Furthermore, SCI entities must also identify and periodically update “SCI personnel” responsible for SCI
systems.
Reg SCI’s rule 1004 (business continuity and disaster recovery plans) requires Reg SCI entities to, among
other things, conduct industry- or sector-wide exercises with coordinated scripts and timing of testing.
Given the inherent complexities, this component will not be enforced until 21 months after the effective
date, which was Feb. 3, 2015.
Market participants would be well-served to promote operational muscle memory for
disaster recovery procedures alongside Reg SCI entities’ testing requirements14 and refine
both shutdown and reopening validation processes across asset classes.
13 Reg SCI: http://www.sec.gov/rules/final/2014/34-73639.pdf
2015 The Tabb Group, LLC. All Rights Reserved. May not be reproduced by any means without express permission. | 21
US Equity Market Structure Risk: Flash Back | October 2015
Consolidated Audit Trail15
On July 11, 2012, more than two years after the events of May 6, 2010, the SEC adopted Rule 613 to
require SROs “’to jointly file a national market system plan to create, implement and maintain a
consolidated audit trail and central repository.” The Consolidated Audit Trail is supposed to substantially
enhance the ability of SROs and the SEC to oversee today’s securities markets and fulfill their
responsibilities under the federal securities laws. According to the agency’s adopting release, the CAT
“will allow for the prompt and accurate recording of material information about all orders in NMS
securities, including the identity of customers, as these orders are generated and then routed throughout
the U.S. markets until execution, cancellation or modification.”
Since the adoption of Rule 613, SROs have developed a plan for selecting the Plan processor, solicited
and evaluated bids, and engaged diverse industry participants in its development. As of February 2015,
participants have reported holding approximately 608 meetings related to the CAT. The current list of
CAT bidders16 along with SROs will create both the technical and operational reporting specifications for
broker-dealers and exchanges. Once the vendor is selected, the specification and implementation timeline
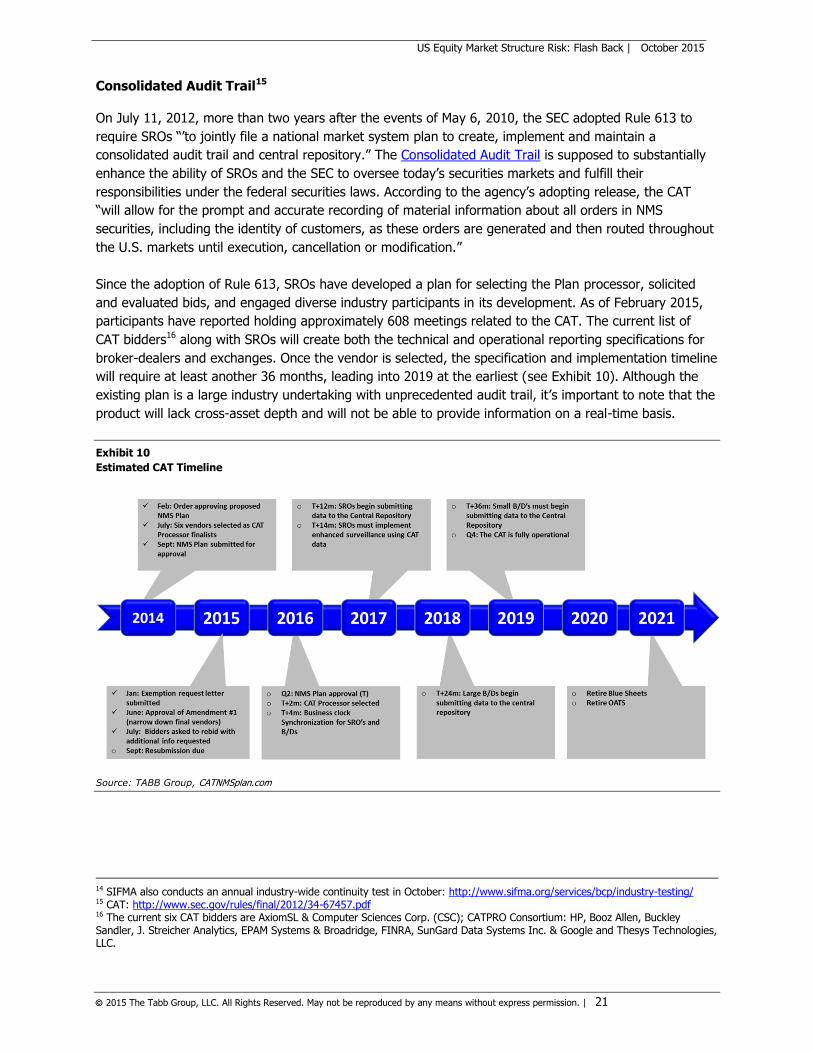
will require at least another 36 months, leading into 2019 at the earliest (see Exhibit 10). Although the
existing plan is a large industry undertaking with unprecedented audit trail, it’s important to note that the
product will lack cross-asset depth and will not be able to provide information on a real-time basis.
Exhibit 10
Estimated CAT Timeline
Source: TABB Group, CATNMSplan.com
14 SIFMA also conducts an annual industry-wide continuity test in October: http://www.sifma.org/services/bcp/industry-testing/ 15 CAT: http://www.sec.gov/rules/final/2012/34-67457.pdf 16 The current six CAT bidders are AxiomSL & Computer Sciences Corp. (CSC); CATPRO Consortium: HP, Booz Allen, Buckley Sandler, J. Streicher Analytics, EPAM Systems & Broadridge, FINRA, SunGard Data Systems Inc. & Google and Thesys Technologies, LLC.
2015 The Tabb Group, LLC. All Rights Reserved. May not be reproduced by any means without express permission. | 22
US Equity Market Structure Risk: Flash Back | October 2015
Cross-Asset Industry-Driven Solutions
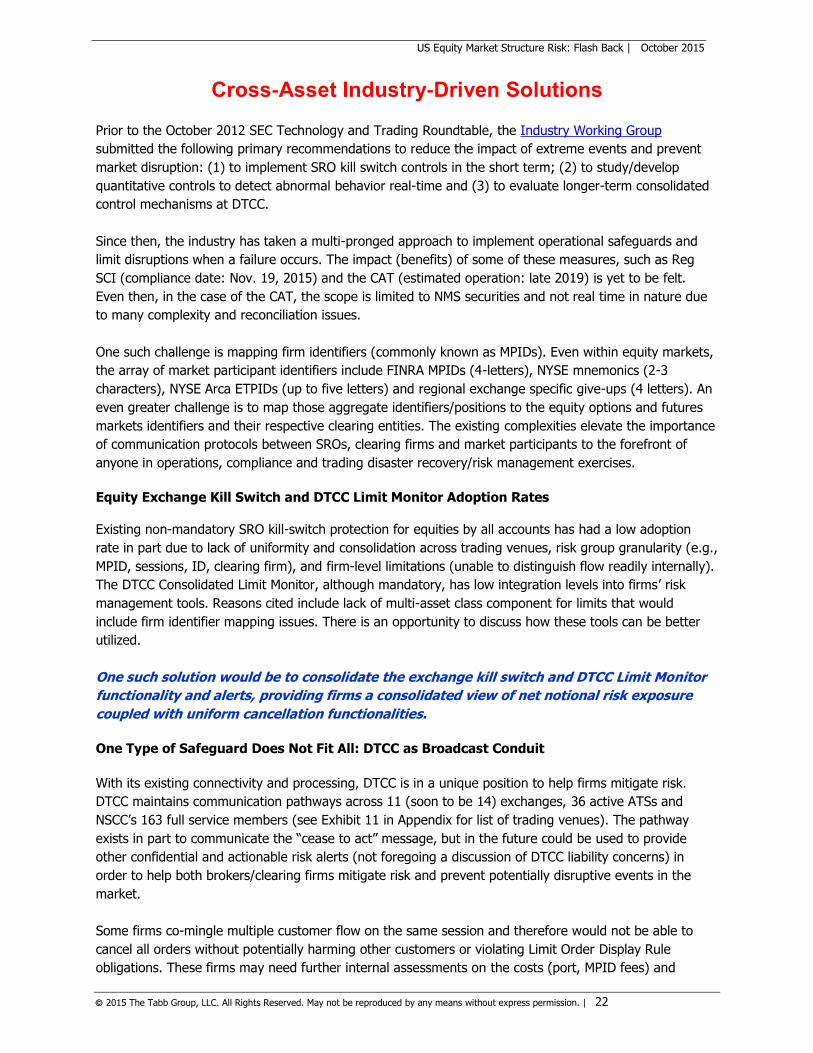
Prior to the October 2012 SEC Technology and Trading Roundtable, the Industry Working Group
submitted the following primary recommendations to reduce the impact of extreme events and prevent
market disruption: (1) to implement SRO kill switch controls in the short term; (2) to study/develop
quantitative controls to detect abnormal behavior real-time and (3) to evaluate longer-term consolidated
control mechanisms at DTCC.
Since then, the industry has taken a multi-pronged approach to implement operational safeguards and
limit disruptions when a failure occurs. The impact (benefits) of some of these measures, such as Reg
SCI (compliance date: Nov. 19, 2015) and the CAT (estimated operation: late 2019) is yet to be felt.
Even then, in the case of the CAT, the scope is limited to NMS securities and not real time in nature due
to many complexity and reconciliation issues.
One such challenge is mapping firm identifiers (commonly known as MPIDs). Even within equity markets,
the array of market participant identifiers include FINRA MPIDs (4-letters), NYSE mnemonics (2-3
characters), NYSE Arca ETPIDs (up to five letters) and regional exchange specific give-ups (4 letters). An
even greater challenge is to map those aggregate identifiers/positions to the equity options and futures
markets identifiers and their respective clearing entities. The existing complexities elevate the importance
of communication protocols between SROs, clearing firms and market participants to the forefront of
anyone in operations, compliance and trading disaster recovery/risk management exercises.
Equity Exchange Kill Switch and DTCC Limit Monitor Adoption Rates
Existing non-mandatory SRO kill-switch protection for equities by all accounts has had a low adoption
rate in part due to lack of uniformity and consolidation across trading venues, risk group granularity (e.g.,
MPID, sessions, ID, clearing firm), and firm-level limitations (unable to distinguish flow readily internally).
The DTCC Consolidated Limit Monitor, although mandatory, has low integration levels into firms’ risk
management tools. Reasons cited include lack of multi-asset class component for limits that would
include firm identifier mapping issues. There is an opportunity to discuss how these tools can be better
utilized.
One such solution would be to consolidate the exchange kill switch and DTCC Limit Monitor
functionality and alerts, providing firms a consolidated view of net notional risk exposure
coupled with uniform cancellation functionalities.
One Type of Safeguard Does Not Fit All: DTCC as Broadcast Conduit
With its existing connectivity and processing, DTCC is in a unique position to help firms mitigate risk.
DTCC maintains communication pathways across 11 (soon to be 14) exchanges, 36 active ATSs and
NSCC’s 163 full service members (see Exhibit 11 in Appendix for list of trading venues). The pathway
exists in part to communicate the “cease to act” message, but in the future could be used to provide
other confidential and actionable risk alerts (not foregoing a discussion of DTCC liability concerns) in
order to help both brokers/clearing firms mitigate risk and prevent potentially disruptive events in the
market.
Some firms co-mingle multiple customer flow on the same session and therefore would not be able to
cancel all orders without potentially harming other customers or violating Limit Order Display Rule
obligations. These firms may need further internal assessments on the costs (port, MPID fees) and
2015 The Tabb Group, LLC. All Rights Reserved. May not be reproduced by any means without express permission. | 23
US Equity Market Structure Risk: Flash Back | October 2015
benefits of reorganizing customer flow. In other cases, a firm may have a robust structure and controls in
place, but the end customer may be incurring massive positions via another broker-dealer and/or clearing
firm, leaving the first broker in the dark. Although there may be scenarios in which the end customer
(non-broker-dealer) is not readily identifiable, a fully reconciled (with execution drop copies), near real-
time feed of all equity activity from DTCC could enable firms to reduce overall risk and improve trade
break management. Such a data feed could eventually be used to consolidate cross asset class risk
management efforts, possibly integrating select products. E-minis as a pilot would be a starting point.
Considering DTCC as a central communication conduit to mitigate risk and provide a near
real time, consolidated, reconciled view of equity executions and possibly cross-assets in the
near future would be worthwhile.
Asset Classes: OCC Risk Controls Takeaways
The options industry is also revisiting risk control standards; however, unlike the equities market these
initiatives will be put forth by the Options Clearing Corporation (OCC). In October 2015, OCC will propose
the following four mandatory risk control pillar for exchanges: (1) price reasonability checks; (2) drill-
through protections; (3) activity-based protections – including maximum contracts and orders over a
period of time; and (4) kill-switch protections – including cancel on disconnect, single message cancel,
heartbeat monitoring and restricted re-entry post trigger. There are key differences between US equity
and options markets such as quote versus order-driven markets and off-exchange trading. Still,
developing equity specific exchange best practices for risk management could improve the national
market system resiliency.
Prescribing minimum risk checks, including price reasonability tests at order entry and
activity-based protections across trading venues, for US exchanges via an NMS plan and/or
DTCC rule making would be worthwhile.
Real-time Detection of Abnormal Trading Activity
As noted by the 2012 Industry Working Group, further study to improve surveillance and detection of
abnormal trading behaviors would help safeguard the market on a real-time basis. One such example is
the BATS rule filed on July 30, 2015. The BATS Client Suspension Rule “would enable the company to
take swifter action to prohibit manipulative behavior such as spoofing and layering, on the BATS
Exchanges.” According to BATS, the timeline from identification to resolution of disruptive activity can be
up to several years.
Further developments with quantitative controls and detection metrics can help the industry
ensure that market surveillance is sufficiently robust.
2015 The Tabb Group, LLC. All Rights Reserved. May not be reproduced by any means without express permission. | 24
US Equity Market Structure Risk: Flash Back | October 2015
Conclusion
The benefits of automation are diminished without effective risk controls and can lead to unintended
malfunctions. In today’s highly automated environment, trading venues and market participants need to
implement a multi-layer approach to risk with coordinated risk checks. To that end, recently adopted
exchange functionalities such as so-called kill-switches at the platform level are not replacements for
each firm’s internal risk controls but rather a necessary backup. To be sure, existing solutions are not
perfect. There is room for improvement in terms of consolidation/granularity of functionalities, mapping
critical data points and integration across asset classes for both executing and clearing firms. However,
market participants shouldn’t let perfect get in the way of good and instead should promote industry
discussions to drive new and improved risk control mechanisms.
Every new disruption is an opportunity to evaluate existing measures. The extreme spike in volatility on
Aug. 24 led some to question whether there were too many LULD pauses for ETFs. The analysis of that
question will be a valuable exercise. In any case, market participants can create their own pauses in
uncertain market conditions, leading to a potential liquidity crisis. Therefore, the focus should be on
resolving the core issues and not just market structure regulation. For instance, it would be worthwhile to
decipher the symptom from the cause when it comes to ETF activity (e.g., order sender motivations,
order type mechanics) and possibly consider the impact of more complex active ETF products vying to
enter the market.
The US equity national market system’s stability is tied as much to market structure as it is to market
infrastructure. Industry-driven solutions should leverage rules-based systems and market center
interconnectivity to enhance market resiliency. In all these cases, effective communication remains
paramount and practice in managing system disruptions gives market players a significant advantage.
The fact of the matter is that bad things are going to happen; it is how participants respond that
becomes important.
2015 The Tabb Group, LLC. All Rights Reserved. May not be reproduced by any means without express permission. | 25
US Equity Market Structure Risk: Flash Back | October 2015
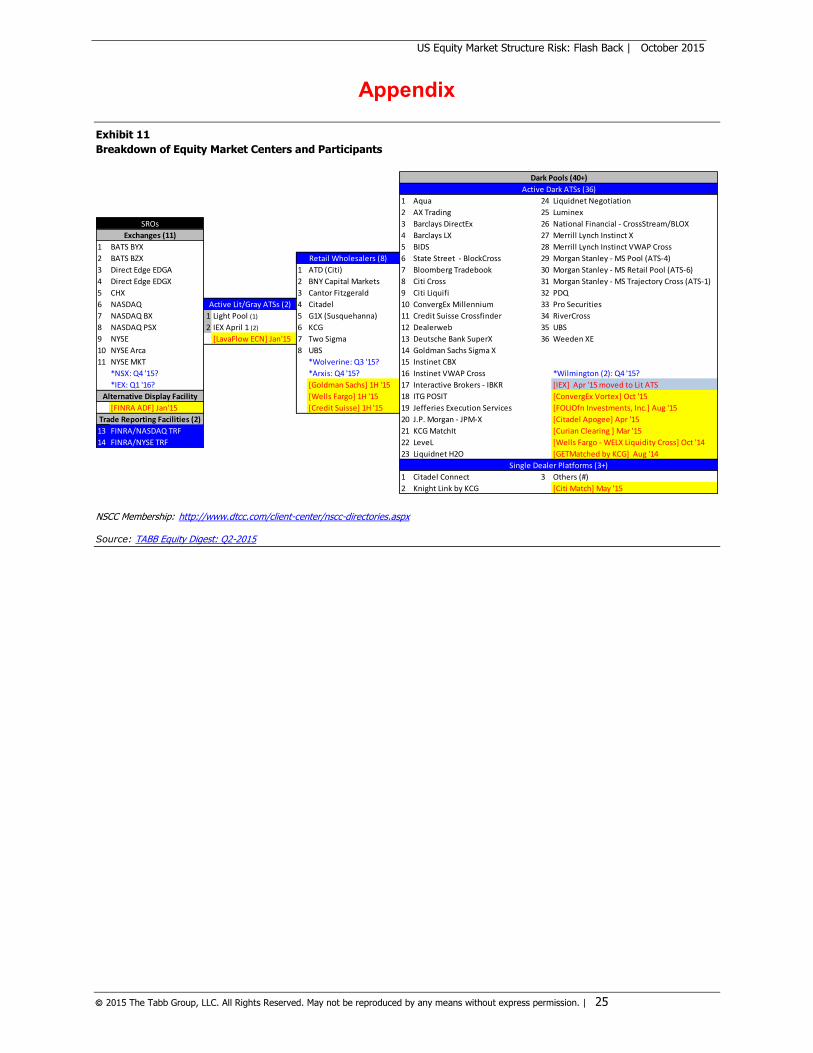
Appendix
Exhibit 11
Breakdown of Equity Market Centers and Participants
NSCC Membership: http://www.dtcc.com/client-center/nscc-directories.aspx Source: TABB Equity Digest: Q2-2015
1 Aqua 24 Liquidnet Negotiation
2 AX Trading 25 Luminex
3 Barclays DirectEx 26 National Financial - CrossStream/BLOX
4 Barclays LX 27 Merrill Lynch Instinct X
1 BATS BYX 5 BIDS 28 Merrill Lynch Instinct VWAP Cross
2 BATS BZX 6 State Street - BlockCross 29 Morgan Stanley - MS Pool (ATS-4)
3 Direct Edge EDGA 1 ATD (Citi) 7 Bloomberg Tradebook 30 Morgan Stanley - MS Retail Pool (ATS-6)
4 Direct Edge EDGX 2 BNY Capital Markets 8 Citi Cross 31 Morgan Stanley - MS Trajectory Cross (ATS-1)
5 CHX 3 Cantor Fitzgerald 9 Citi Liquifi 32 PDQ
6 NASDAQ 4 Citadel 10 ConvergEx Millennium 33 Pro Securities
7 NASDAQ BX 1 Light Pool (1) 5 G1X (Susquehanna) 11 Credit Suisse Crossfinder 34 RiverCross
8 NASDAQ PSX 2 IEX April 1 (2) 6 KCG 12 Dealerweb 35 UBS
9 NYSE [LavaFlow ECN] Jan'15 7 Two Sigma 13 Deutsche Bank SuperX 36 Weeden XE
10 NYSE Arca 8 UBS 14 Goldman Sachs Sigma X
11 NYSE MKT *Wolverine: Q3 '15? 15 Instinet CBX
*NSX: Q4 '15? *Arxis: Q4 '15? 16 Instinet VWAP Cross *Wilmington (2): Q4 '15?
*IEX: Q1 '16? [Goldman Sachs] 1H '15 17 Interactive Brokers - IBKR [IEX] Apr '15 moved to Lit ATS
[Wells Fargo] 1H '15 18 ITG POSIT [ConvergEx Vortex] Oct '15
[FINRA ADF] Jan'15 [Credit Suisse] 1H '15 19 Jefferies Execution Services [FOLIOfn Investments, Inc.] Aug '15
20 J.P. Morgan - JPM-X [Citadel Apogee] Apr '15
13 FINRA/NASDAQ TRF 21 KCG MatchIt [Curian Clearing ] Mar '15
14 FINRA/NYSE TRF 22 LeveL [Wells Fargo - WELX Liquidity Cross] Oct '14
23 Liquidnet H2O [GETMatched by KCG] Aug '14
1 Citadel Connect 3 Others (#)
2 Knight Link by KCG [Citi Match] May '15
Alternative Display Facility
Single Dealer Platforms (3+)
Dark Pools (40+)
Active Dark ATSs (36)
SROs
Exchanges (11)
Retail Wholesalers (8)
Active Lit/Gray ATSs (2)
Trade Reporting Facilities (2)
2015 The Tabb Group, LLC. All Rights Reserved. May not be reproduced by any means without express permission. | 26
US Equity Market Structure Risk: Flash Back | October 2015
About
TABB Group TABB Group is a research and strategic advisory firm focused exclusively on capital markets. Founded in
2003 and based on the methodology of first-person knowledge, TABB Group analyzes and quantifies the investing value chain, from the fiduciary and investment manager, to the broker, exchange and
custodian. Our goal is to help senior business leaders gain a truer understanding of financial markets
issues and trends so they can grow their businesses. TABB Group members are regularly cited in the press and speak at industry conferences. In 2010, TABB launched TabbFORUM, the online capital
markets community for peer-to-peer contributed opinion and analysis covering current industry issues, tracked daily by 24,000-plus professionals. For more information about TABB Group, visit
www.tabbgroup.com.
The Author Sayena Mostowfi
Sayena Mostowfi, Principal and Head of Equities Research, has more than a decade of experience in the
securities business, with expertise in market structure, electronic trading and trading systems. Prior to joining TABB, Mostowfi was managing director of strategy and business development at Sun Trading LLC,
a proprietary trading firm. During her three years at Sun, she developed and optimized US and European trading relationships with exchanges, dark pools, index providers and other broker-dealers. Mostowfi
started her career at the Chicago Stock Exchange (CHX) in 2000. During eight years at the exchange, she held relationship management, product management and strategic planning positions. As vice president
of strategic planning, she participated in historic market structure changes at the exchange, including
pre-Regulation NMS inter-market negotiations, demutualization from membership structure, and the transformation from a floor-based exchange to an ECN model. Mostowfi received a B.A. in English from
the University of Michigan.
DTCC
With over 40 years of experience, DTCC is the premier post-trade market infrastructure for the global financial services industry. From operating facilities, data centers and offices in 16 countries, DTCC,
through its subsidiaries, automates, centralizes, and standardizes the post-trade processing of financial transactions, mitigating risk, increasing transparency and driving efficiency for thousands of
broker/dealers, custodian banks and asset managers worldwide. User owned and industry governed, the
firm simplifies the complexities of clearing, settlement, asset servicing, data management and information services across asset classes, bringing increased security and soundness to the financial markets. In
2014, DTCC’s subsidiaries processed securities transactions valued at approximately US$1.6 quadrillion. Its depository provides custody and asset servicing for securities issues from over 130 countries and
territories valued at US$64 trillion. DTCC’s global trade repository maintains approximately 40 million open OTC positions and processes roughly 280 million messages a week. To learn more, please visit
http://dtcc.com/ or follow us on Twitter @The_DTCC.
2015 The Tabb Group, LLC. All Rights Reserved. May not be reproduced by any means without express permission. | 27
US Equity Market Structure Risk: Flash Back | October 2015
See
www.tabbgroup.com
Westborough, MA
+1.508.836.2031
New York
+1.646.722.7800
London +44 (0) 203 207 9027


![Contents [Hide] 1 Paint Market Structure 2 Paint Industry Definitions](https://img.pdfslide.us/doc/110x75/5468d5f8b4af9fd90e8b45fc/contents-hide-1-paint-market-structure-2-paint-industry-definitions.jpg)

