Embed Size (px)
Citation preview
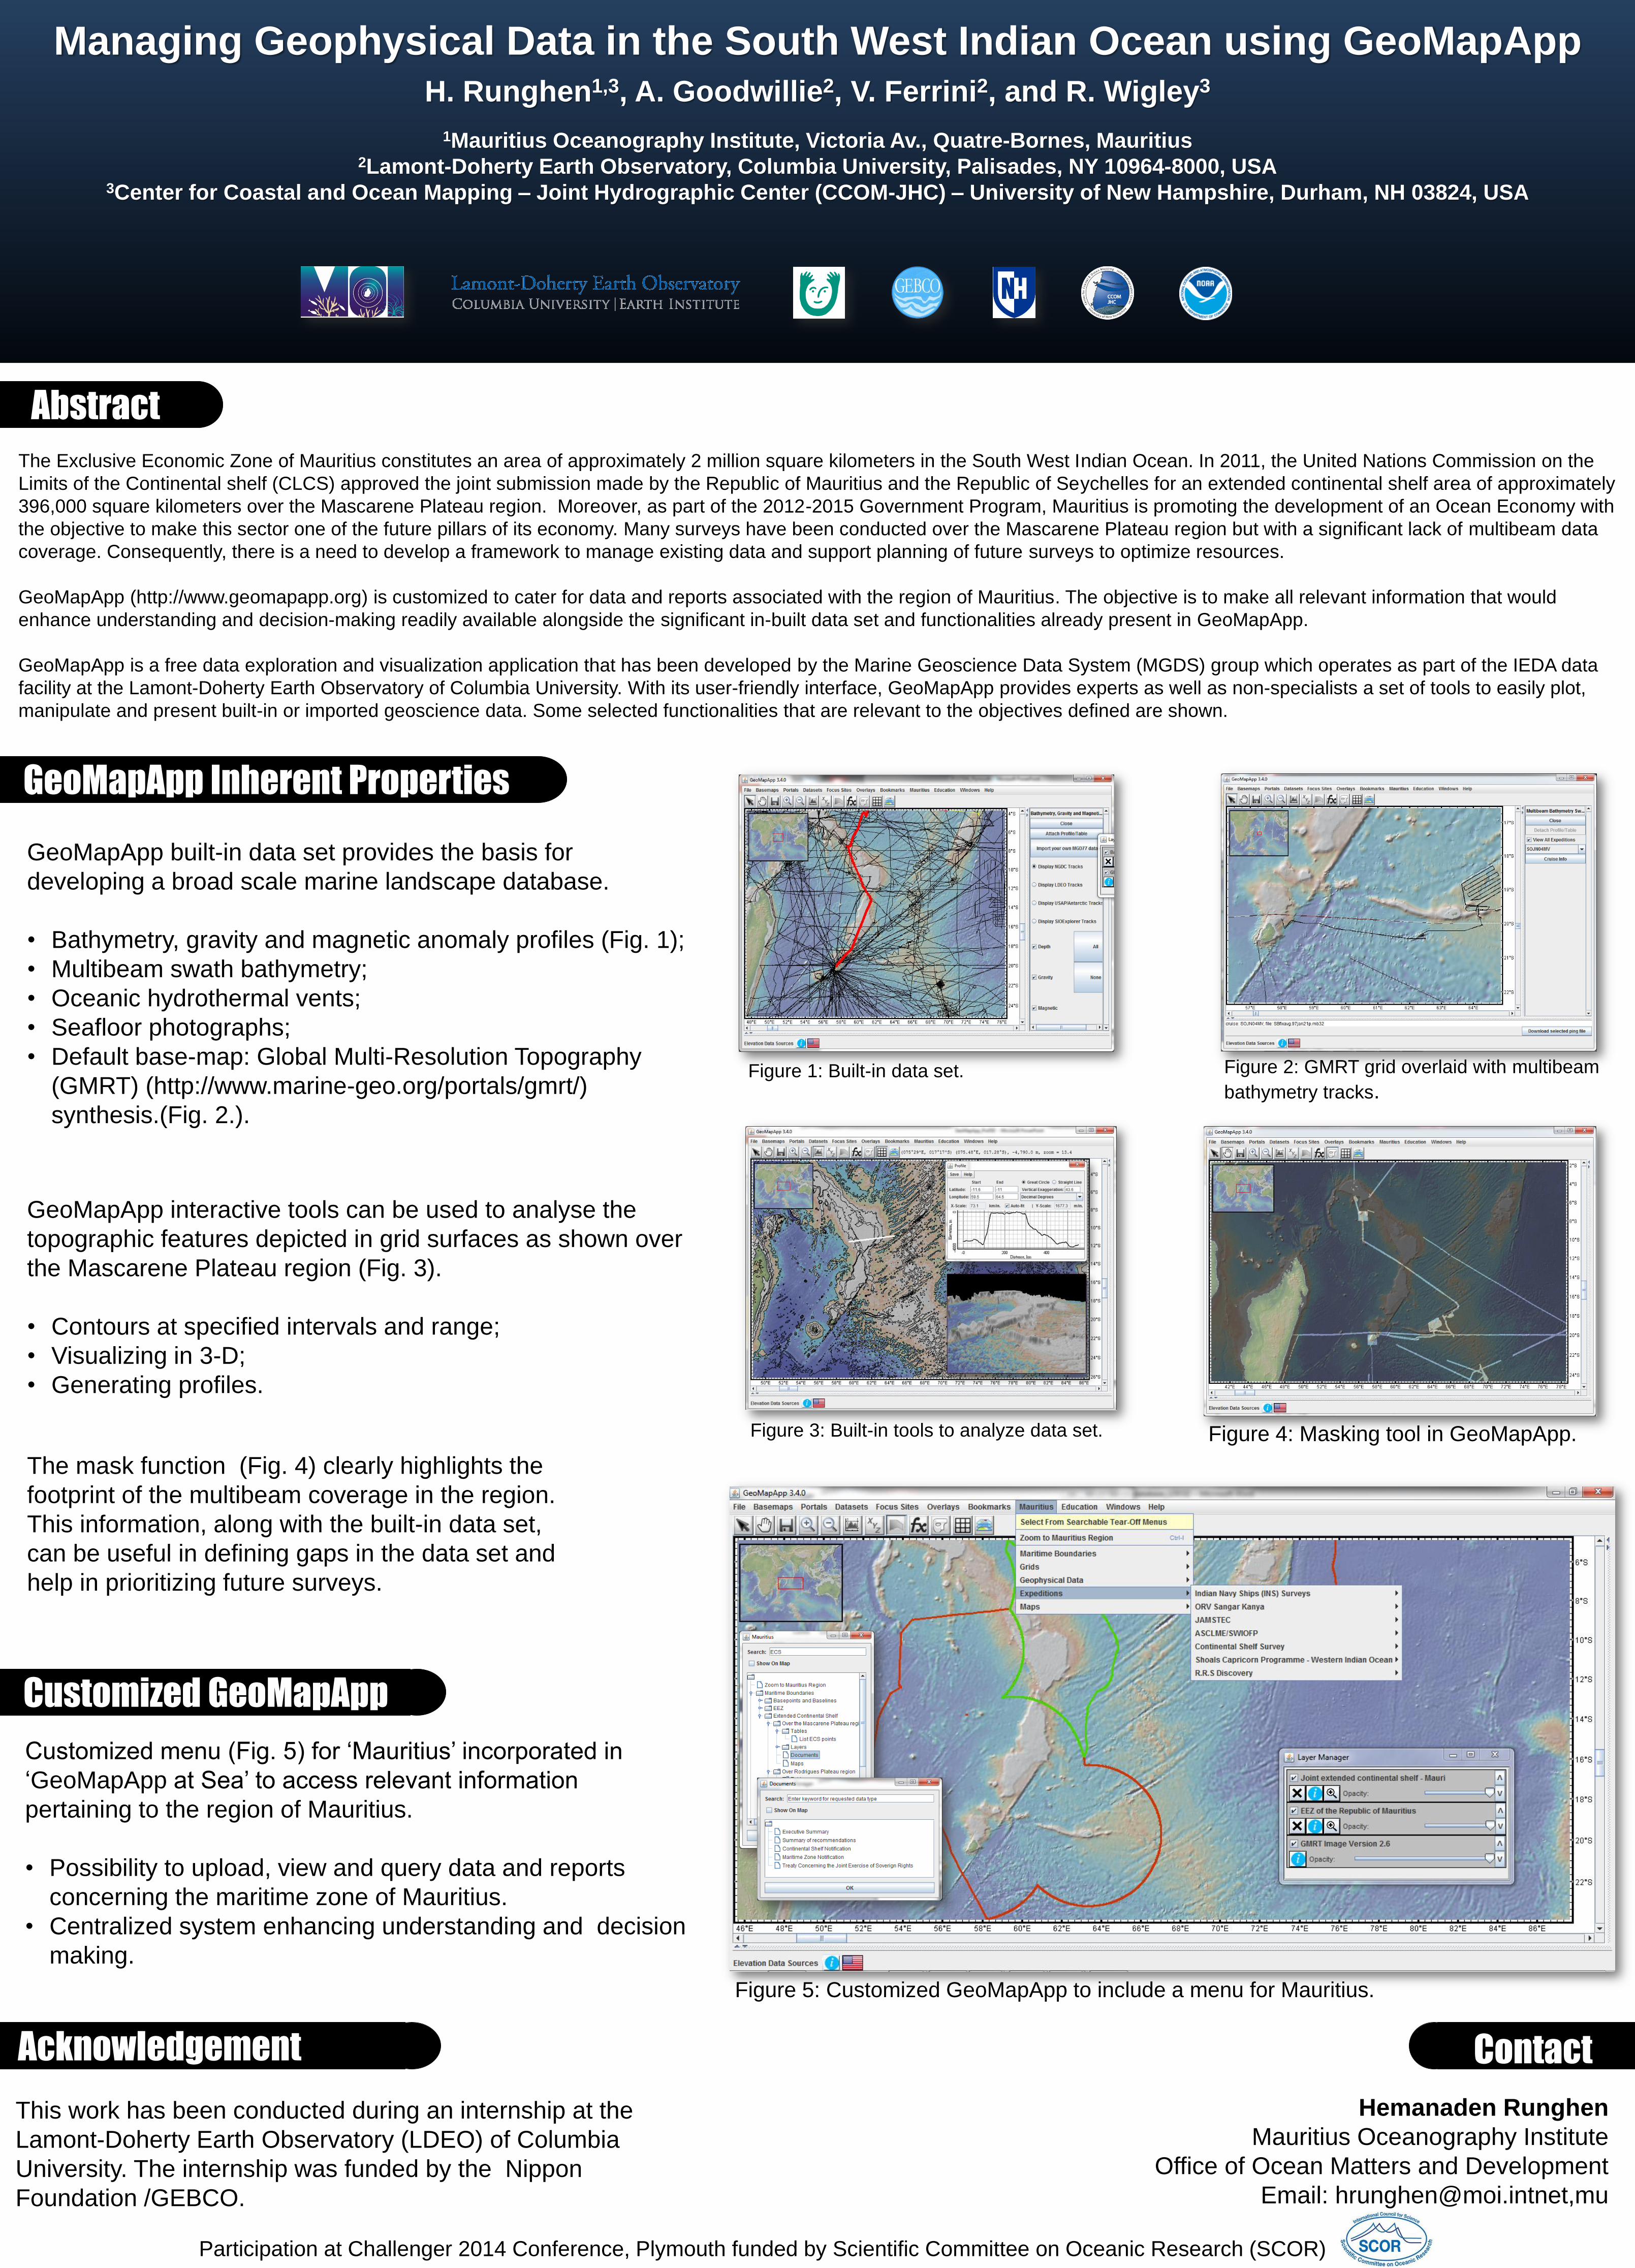
Managing Geophysical Data in the South West Indian Ocean using GeoMapApp
H. Runghen1,3, A. Goodwillie2, V. Ferrini2, and R. Wigley3
1Mauritius Oceanography Institute, Victoria Av., Quatre-Bornes, Mauritius 2Lamont-Doherty Earth Observatory, Columbia University, Palisades, NY 10964-8000, USA
3Center for Coastal and Ocean Mapping – Joint Hydrographic Center (CCOM-JHC) – University of New Hampshire, Durham, NH 03824, USA
Abstract
The Exclusive Economic Zone of Mauritius constitutes an area of approximately 2 million square kilometers in the South West Indian Ocean. In 2011, the United Nations Commission on the
Limits of the Continental shelf (CLCS) approved the joint submission made by the Republic of Mauritius and the Republic of Seychelles for an extended continental shelf area of approximately
396,000 square kilometers over the Mascarene Plateau region. Moreover, as part of the 2012-2015 Government Program, Mauritius is promoting the development of an Ocean Economy with
the objective to make this sector one of the future pillars of its economy. Many surveys have been conducted over the Mascarene Plateau region but with a significant lack of multibeam data
coverage. Consequently, there is a need to develop a framework to manage existing data and support planning of future surveys to optimize resources.
GeoMapApp (http://www.geomapapp.org) is customized to cater for data and reports associated with the region of Mauritius. The objective is to make all relevant information that would
enhance understanding and decision-making readily available alongside the significant in-built data set and functionalities already present in GeoMapApp.
GeoMapApp is a free data exploration and visualization application that has been developed by the Marine Geoscience Data System (MGDS) group which operates as part of the IEDA data
facility at the Lamont-Doherty Earth Observatory of Columbia University. With its user-friendly interface, GeoMapApp provides experts as well as non-specialists a set of tools to easily plot,
manipulate and present built-in or imported geoscience data. Some selected functionalities that are relevant to the objectives defined are shown.
GeoMapApp Inherent Properties
GeoMapApp built-in data set provides the basis for
developing a broad scale marine landscape database.
• Bathymetry, gravity and magnetic anomaly profiles (Fig. 1);
• Multibeam swath bathymetry;
• Oceanic hydrothermal vents;
• Seafloor photographs;
• Default base-map: Global Multi-Resolution Topography
(GMRT) (http://www.marine-geo.org/portals/gmrt/)
synthesis.(Fig. 2.).
GeoMapApp interactive tools can be used to analyse the
topographic features depicted in grid surfaces as shown over
the Mascarene Plateau region (Fig. 3).
• Contours at specified intervals and range;
• Visualizing in 3-D;
• Generating profiles.
Customized GeoMapApp
Customized menu (Fig. 5) for ‘Mauritius’ incorporated in
‘GeoMapApp at Sea’ to access relevant information
pertaining to the region of Mauritius.
• Possibility to upload, view and query data and reports
concerning the maritime zone of Mauritius.
• Centralized system enhancing understanding and decision
making.
Acknowledgement Contact
Hemanaden Runghen
Mauritius Oceanography Institute
Office of Ocean Matters and Development
Email: [email protected],mu
This work has been conducted during an internship at the
Lamont-Doherty Earth Observatory (LDEO) of Columbia
University. The internship was funded by the Nippon
Foundation /GEBCO.
Figure 1: Built-in data set. Figure 2: GMRT grid overlaid with multibeam
bathymetry tracks.
Figure 3: Built-in tools to analyze data set. Figure 4: Masking tool in GeoMapApp.
The mask function (Fig. 4) clearly highlights the
footprint of the multibeam coverage in the region.
This information, along with the built-in data set,
can be useful in defining gaps in the data set and
help in prioritizing future surveys.
Figure 5: Customized GeoMapApp to include a menu for Mauritius.
Participation at Challenger 2014 Conference, Plymouth funded by Scientific Committee on Oceanic Research (SCOR)