Embed Size (px)
Citation preview
Working Paper No. 630
Managing Finance in Emerging Economies: The Case of India
by
Sunanda Sen Levy Economics Institute of Bard College
October 2010
The Levy Economics Institute Working Paper Collection presents research in progress by Levy Institute scholars and conference participants. The purpose of the series is to disseminate ideas to and elicit comments from academics and professionals.
Levy Economics Institute of Bard College, founded in 1986, is a nonprofit, nonpartisan, independently funded research organization devoted to public service. Through scholarship and economic research it generates viable, effective public policy responses to important economic problems that profoundly affect the quality of life in the United States and abroad.
Levy Economics Institute P.O. Box 5000
Annandale-on-Hudson, NY 12504-5000 http://www.levyinstitute.org
Copyright © Levy Economics Institute 2010 All rights reserved
1
ABSTRACT
India has been experiencing rising inflows of overseas capital since the deregulation of its
financial sector. Often looked upon as a success story among other emerging economies, the
country has been subject to pitfalls and trilemmas that deserve attention. It has been officially
recognized by the Governors of RBI that the financial crisis in India reflects the “dirty face” of
what is described in the literature as the impossible trinity, along with the volatility in the
markets that was caused by speculative capital in search of profits. However, Joseph Stiglitz
observed that India’s policymakers, “particularly the Reserve Bank of India, are already doing a
great job. I wish the U.S. Federal Reserve displayed the same understanding of the role of
regulation that the RBI has done, at least so far.” Recently, the United States made a path-
breaking move with the launching of the recent bill on the regulation of Wall Street, which was
passed by a majority of the Senate on May 20, 2010. We urge the implementation of similar
laws in India and other emerging economies, especially in view of the fact that the recent moves
for financial deregulation in these countries have, rather, been in the opposite direction.
Keywords: Money Market; Speculation; Derivatives; Financial Liberalization; Futures Markets
JEL Classifications: G15, E51, E52
2
Like a few other developing nations that are identified as “emerging economies,” India has been
experiencing rising inflows of overseas capital since the gradual deregulation of its financial
sector, which started in the early 1990s. Unlike what is claimed by those who abide by the neo-
liberal norms of “efficiency” in deregulated financial markets, what is being experienced by
these emerging economies in reality is ridden with pitfalls, trade-offs, and trilemmas that come
in the process causing a lot of concern. We propose to have a fresh look at the related issues for
India, a country often looked upon as a “success story” by many (Stiglitz 2010a), not only in the
context of the country’s financial management policies during the Asian crisis, but even in terms
of the handling of the current global crisis. Contesting such claims, we would report in this
paper the traps and pitfalls encountered by the country in implementing such policies, a matter
that deserves attention.
The paper has four major sections, followed by one that offers the conclusion. Section I
deals with the pattern of India’s integration with the global financial market since 1991, tracing
back the policy changes that initiated this process. Section II dwells on the hurdles faced in the
management of India’s financial sector, in particular, with the following as competing demands:
a) maintaining price stability by using controls on domestic monetary policy;
b) achieving competitive real exchange rates; and
c) ensuring uninterrupted flows of capital from abroad.
The three issues, often identified as “impossible trinity” in the literature (Lemgruber
2008), question the feasibility of achieving domestic targets in monetary and exchange rate
policies, along with maintaining free capital flows to/from abroad. Section III of the paper
brings up two other concerns that are hardly noticed. These include:
a) the fiscal implications of monetary management, which inflict social costs to
the economy; and
b) financialization in deregulated markets, as it spills over to commodity markets
with futures trading.
As for the first, efforts on the part of the government to sterilize the cash inflows (caused
by the rising capital inflows) led to the sale of government bonds. The latter, in turn, tends to
3
inflate the interest burden in the fiscal budget. With fiscal deficit as a proportion of GDP subject
to compression in terms of the ongoing official Fiscal Responsibility and Budget Management
Act (FRBMA), the primary deficit shrinks proportionately, given that it is even less than the
fiscal deficit. 1 With defense expenditure subject to strategic concerns, the end result is one
where cuts take place in the other two components of expenditure in the primary budget, which
include capital expenditure and subsidies. The social consequences of the above are no less a
cause of concern than those arising from financial crisis and lack of stability. As for
financialization, we draw attention to speculation, not only in equity market, but also in
commodities, with futures trading providing further opportunities for profits in the sharp uptrend
and fluctuation in commodity prices. Section IV provides a perspective as to how the Indian
policy moves are viewed by different commentators. It also provides an account of the current
moves and roadblocks in advanced countries in reinstituting regulation in financial markets,
problems that incidentally compare with the Indian scene. We end with a concluding note in
section V.
I. FINANCIAL DEREGULATION IN INDIA AND LINKS TO GLOBAL FINANCIAL
MARKETS
Financial opening was initiated as part of a package of economic reforms launched in India in
1991. This brought an end to a policy regime that had been subject to segregated banking,
complimented by manifold restrictions on the flow of overseas capital. Successive reforms,
implemented over the next decade and half, introduced several changes in India’s financial
sector. 2 The more important of those included the following:
a) Free access of FII investments to stock markets since 1992;
b) Bans lifted in 1999 on derivative trading. The latter henceforth were to be
treated at par with securities in stock markets, thus ending the restrictions
1 In terms budget classification in India, Fiscal Deficit = Total Expenditure – Total Receipts = [Revenue Expenditure + Capital Expenditure] – Total Receipts or, Fiscal Deficit = [Interest Payments + Subsidies + Defense Expenditure + Capital Expenditure] – Total Receipts Primary Deficit = Fiscal Deficit – Interest Payments = [Subsidies + Defense Expenditure + Capital Expenditure] – Total Receipts 2 This section relies on an earlier paper by the author (Sen 2008). For an overview, see also Sen (2007).
4
imposed earlier in terms of the Securities Contract and Regulation Act of 1956.
Exchange traded derivative markets were simultaneously opened where options,
futures, and swaps on interest rates and currencies could be traded. These
transactions were to be regulated by the Securities and Exchange Board of India
(SEBI);
(c) The ban on commodity futures was also lifted in 1999, followed by use of
“badla” (margin based trading) in 2001;
(d) Over-the-counter (OTC) trading was legalized in 2006, which included
interest rate swaps (IRS) and forward rate agreements (FRA), subject to the
condition that one of the parties had to be subject to RBI regulation;
(e) IRS and FRAs under the OTC were to be regulated by the Centralised
Clearing Corporation of India (CCIL) in 2007, thus providing a Centralised
Counterparty (CCP) guarantee;
(f) Reduction of capital requirements for banks up to 80% (and for currency
swaps up to 90%), which related to the eliminated counterparty risks as there
were earlier on these OTCs. However, credit derivative swaps were not allowed;
(g) Liberalized norms offered to corporate business (and mutual fund) for
overseas investments and external commercial borrowings (ECBs);
(h) Exchange traded currency futures allowed in all stock exchanges which
included the Multi Commodity Exchange (MCX); and
(i) Futures trade opened for a large number of commodities in commodity
exchanges over the next few years.
Successive rounds of liberalization, as above, have changed the pattern as well as the
magnitude of turnover in India’s financial sector. One thus observes:
(a) increased turnovers in the major secondary stock exchanges, which include the
Bombay Stock Exchange (BSE) and the National Stock Exchange (NSE);
(b) volatility in stock turnovers and stock prices;
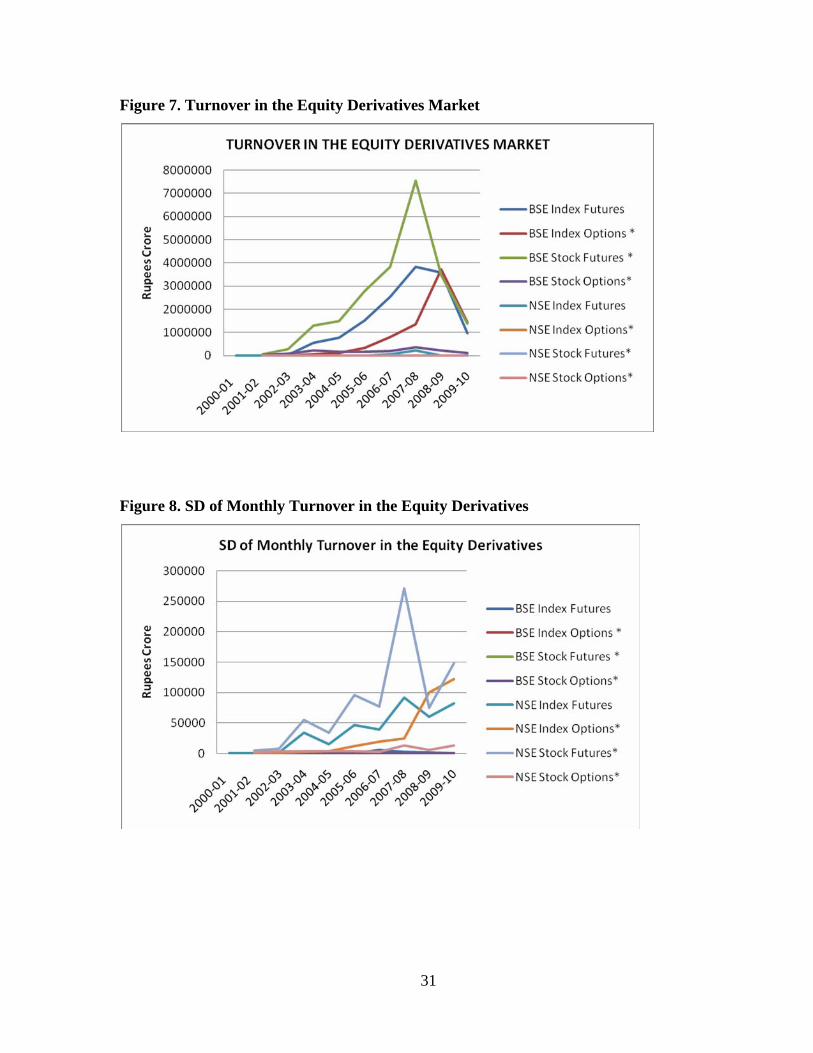
(c) increased volume of trading of derivatives at stock exchanges, along with increased
OTC trading for derivatives;
5
(d) increased inflows of Foreign Institutional Investments (FII), both on a gross and net
basis;
(e) rise in price/earnings (P/E) ratios of stocks traded, often at levels higher than
compared to those in overseas stock markets;
(f) value of stocks sold in the primary market at levels much lower than those in the
secondary market; and
(g) rising trading activity in the commodity futures market for a large number of
commodities.3
Observations in this section are based on statistics appended at end to the paper in
appendix charts 1–7.
2. MANAGING THE FINANCIAL SECTOR: TRAPS ON WAY?
As has been the case with other emerging economies (which have been exposed to the recent
turbulence in global financial markets), cross-border flows of capital, especially short term, have
gained a large presence in India’s capital market. Unlike what it is with flows of long-term
foreign direct investments, short-term capital flows can cause a lot of problems to monetary
authorities in achieving the twin goals of managing a competitive real exchange rate along with
some degree of autonomy in maintaining monetary policy—especially in catering to the goals
set for the real activities in the domestic economy. Goals as above are often difficult to achieve
in terms of what has been identified in the related literature as an “impossible trinity.”4
With large inflows of short-term capital, which have been both unpredictable and large,
monetary authorities in India have been active in arresting what they consider as untoward
effects of these flows on the money supply or exchange rates. The outcome has been a “stop-
and-go” strategy that included the sterilization or injection of funds in the market to arrest the
related impact on the money supply. However, policies to deregulate and reform the financial
sector, as documented above, initiated large inflows of FII investments. The latter, mostly of the
short-term variety, were deployed to trade in India’s secondary markets for equities (BSE and
3 For some details, see Sen and Paul (2010). 4 For some comments, see Palley (2009), Lemgruber (2008), and Mishra (2007).
6
NSE). As can be seen from the statistics provided in table 3 and figures 1, 3, 4, 5, 6, and 7 of the
appendix, these short-term flows of capital generated both wide swings and spurts for equities
and derivatives traded in stock markets. It is noticeable that the boom in the country’s stock
markets also spilled over to its commodity exchanges (including the MCX), trading in which
had official sanction since 2003. Trade in derivatives (especially the currency futures) had a
major presence in these transactions, both in stock markets as well as the MCX.
A. Monetary Management in India: 1991–2008
Rising inflows of short-term capital, as mentioned above, had been entering India’s financial
markets since the early 1990s, a development that prompted the monetary authorities to monitor
and take the requisite steps to contain inflation, as well as an appreciation of the real exchange
rate. A tight monetary policy was adopted by the country’s central bank, RBI, which initiated
the Liquidity Adjustment Facility (LAF) in the year 2000. The step provided for RBI’s control
over liquidity in the market with frequent upward revisions in repo and reverse repo rates5 as
were applicable to commercial banks. Repos were the rates at which banks could refinance
against securities used as collaterals with the RBI, and also to park funds with RBI to get back
the securities. The opposite was the case with reverse repos, which were used to pay back to
RBI. Upward revisions were there in the limits to LAF along with the frequent hikes in repo, as
well as reverse repo, rates during the following years, which aimed to curtail excess liquidity in
the market. Use also was made of the Monetary Stabilisation Scheme (MSS) with several
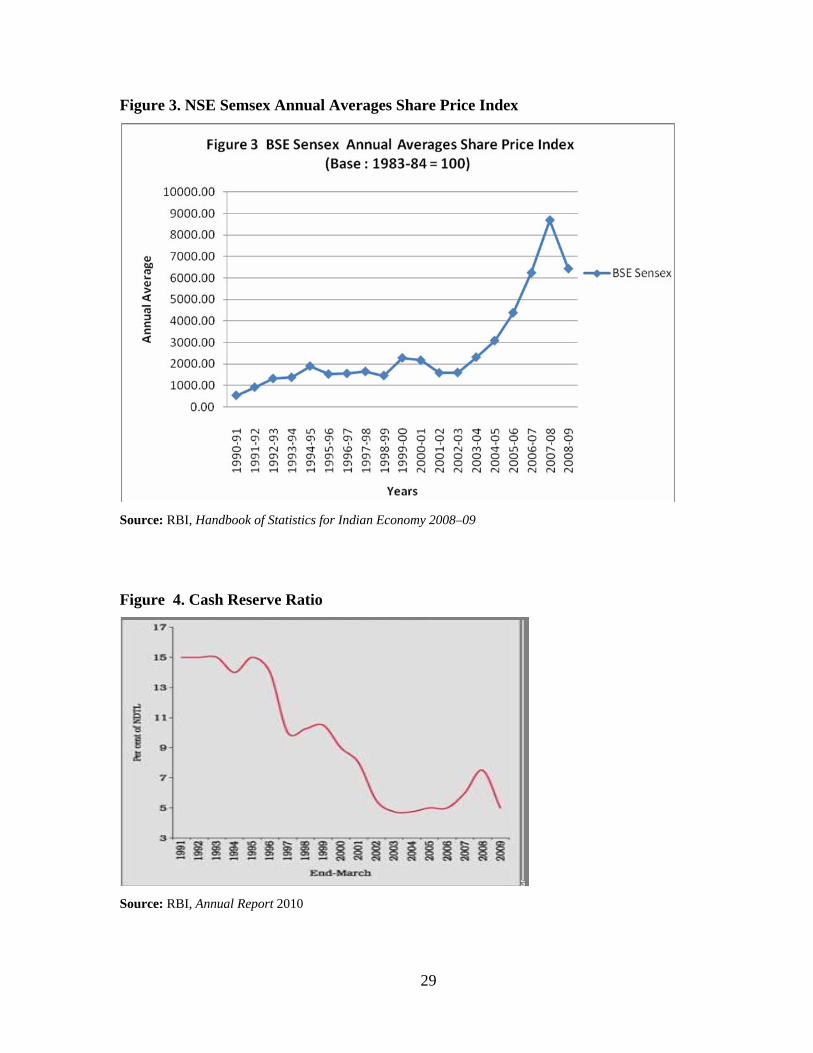
measures including: (a) a steep rise in cash reserve ratios (CRR) from 4.50% in March 2004 to
9.0% by August 2008; (b) the sale of government bonds to mop-up excess liquidity via open
market operations (OMO); and (c) a raise in overnight call rates and cuts in bid-ask spread in
5 Amongst its many functions, the Reserve Bank of India also acts as the banker of last resort. In this role, the central bank has to ensure that it can inject funds into the system to help participants tide over temporary mismatches of funds. Refinance, as it used to happen earlier, was at a fixed rate that was largely divorced from the cost of equivalent short-term funds in the market. This gave rise to a nonegalitarian distribution of interest rates in the short end of the curve. Further, the amounts that could be borrowed were determined by a preset limit. To do away with the deficiencies, in 2000, the RBI moved to an auction system of repos and reverse repos to suck out from and inject liquidity into the market. The three broad objectives of LAF included: a greater flexibility for the RBI in determining both the quantum of adjustment, as also the rates by responding to the system on a daily basis; to ensure that the injected funds were being used to fund day-to-day liquidity mismatches and not to finance more permanent assets; and finally, to help RBI set a corridor for short-term rates, ideally governed by the reverse-repo (top band) and repo (lower band) rates. This would impart greater stability in the markets. For more information, see www.debtonnet.com.
7
call rates (Leeladhar 2008). We provide in tables 1–3 of the appendix the details of these
measures, as well as their impact on liquidity, according to official estimates.
However, despite these measures, monetary authorities failed to achieve many of their
goals. We notice, from available statistics, the upward trend in the real exchange rates of the
rupee. Barring one or two years, and notwithstanding the efforts on the part of the RBI to
contain those movements by using LAF, MSS, and even direct purchases of a part of the foreign
currency inflows (which were absorbed in official reserves), the real exchange rate appreciation
has been continuing for the rupee since 1991 (see appendix chart 9). Again, accumulation of
official reserves (of foreign exchange), which are part of reserve money, potentially contributed
to expansions in the domestic money supply (M2, as well as M3), which called for further
sterilization. Moreover, selling government securities had to be competitive in the domestic
market, thus setting a floor for the interest rate in the market. However, the upward push in
interest rate was, to a certain extent, in accord with the dear money policy the RBI was pursuing
since the mid-1990s, especially in the context of the surge in forex-led expansion of domestic
liquidity, which continued until the onset of the global financial crisis during the third quarter of
2008. With moves as above defying other goals, domestic monetary policy became a captive of
external economic developments and far removed from what could otherwise be identified as an
autonomous national policy. This defines the “trap” the country has faced in liberalizing the
financial sector.
With the successive deregulation of the capital account, which had led to excessive
inflows of short-term capital to the country since the early 1990, policies in India to manage the
financial sector restrained officials from having full sway over what could be considered as
more appropriate from the point of view of domestic output growth, employment, or even
distribution of credit.6 In addition, as already mentioned above, efforts to counter the impact of
foreign currency inflows on the exchange rate of the domestic currency also failed to arrest the
unwanted appreciations in the real exchange rate that took place over those years, thus
undermining the cost competiveness of Indian goods in the domestic, as well as overseas,
markets.
6 Thus the distribution of bank credit in terms of the globalized norms of the risk-adjusted credit under Basel II intensifies financial exclusion, especially for the poor and SMEs in the country. For details, see Gottschalk (2010).
8
B. Monetary Management in India since the Beginning of Global Crisis in October 2008
We now pay attention to more recent years of monetary management in India, starting from the
bankruptcy of Lehman Brothers in the United States in the third quarter of 2008. Policies
continued with similar strategies of monetary management as used earlier, but in a reverse gear,
using LAF, MSS, and other direct official intervention in the foreign exchange market. With
global recession at the corner and dwindling capital flows creating downturns in stock markets,
tools as used earlier now moved in the opposite direction, this time to revamp the sagging
financial sector. Attempts were also made to arrest the volatility in interest rates, exchange rates,
and stock prices, which were rising along with the crisis in the world economy (RBI 2009b and
2010).
One notices that between the third quarter of 2008 (when the crisis in the U.S. housing
market was spreading all over) and the quarter ending in March 2010, several regulatory
measures were introduced by monetary authorities in India to inject credit (Thorat 2009). Thus
the LAF repo rates were sharply downgraded from 9% to 4.25% between October 2008 and
June 2009, while the reverse repos were lowered from 6% to 3.25% over the same period. Other
measures to ease liquidity in the market included the special 14-day repo facilities with up to $4
billion allowed to mutual funds and banks to use their deposits with the RBI under statutory
liquidity ratios (SLR) on a temporary basis. Use was also made of MSS to downgrade CRR and
SLR, from 9% and 25% in October 2008 to 5% and 24% in June 2009. (The latter, according to
official statement, added $50 billion liquidity in the market). Similar use was made of MSS (in a
reverse gear), with the RBI buying back government securities from public. The measures also
included:
(a) capping of interest rates applicable to NRI deposits in a bid to discourage
their outflow;
(b) direct sales of dollar in the foreign exchange market to arrest untoward
depreciation of the rupee;
(c) rupee-dollar swap facilities for banks;
(d) larger limits of remittances up to $100,000 allowed to residents; and
(e) corporate overseas investments up to 300% of their net worth (Reddy 2007;
Subramanian 2007). (Details of some of these measures are provided in tables 1–
3 of the appendix.)
9
Measures to steer through the crisis that erupted in 2008 (and even earlier when the
country was experiencing the problems caused by excessive inflows of short-term capital) per
force had to encounter what is identified in the literature as an “impossible trilemma” (Reddy
2007). Difficulties in achieving the three targets—maintaining monetary autonomy along with
exchange rate stability and free capital flows—were officially recognized even before the crisis,
with the governor of RBI mentioning “the dirty face of trinity” in 2007! More recently the
present RBI chief has come out openly on his concerns for what he observes as “volatility of
speculative capital flows in search of profit.”7 Capital flows of late have been far in excess of
the current account deficit, thus affecting the stock market, exchange rate, and/or official
reserves (Rao 2010), while the additions to reserves are creating the need for monetary
sterilization. Policy measures have sought to plug in levers to control “volatility in the debt side
of the flows.” In our judgment, one cannot expect much of a solution from those measures alone
unless these also address the problems with short-term flows of portfolio capital!
On the whole, policies to manage the deregulated financial sector in India have faced
hurdles, as was to be expected, with free movements of short-term capital across the board
inflicting volatility in the foreign exchange market as well as in stock exchanges. A surge in
capital inflows, matched by a current account deficit of smaller magnitudes, spilled over to the
entire economy, which started experiencing appreciations in the real exchange rate, a rise in
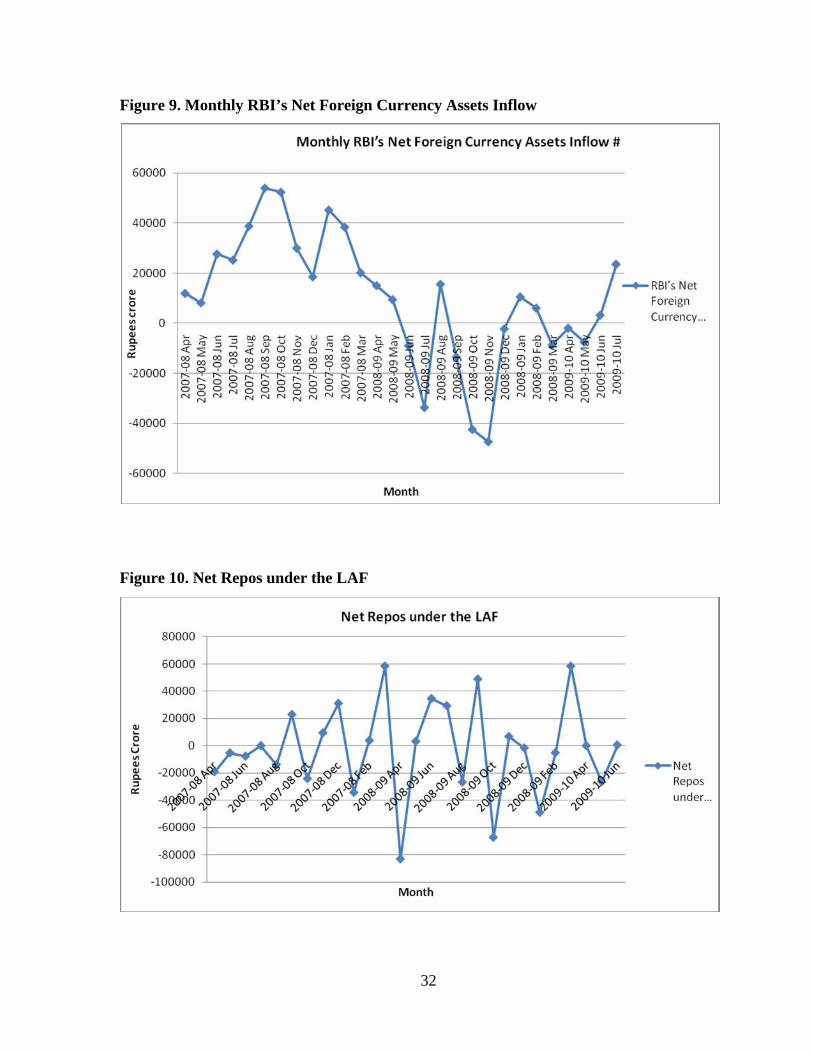
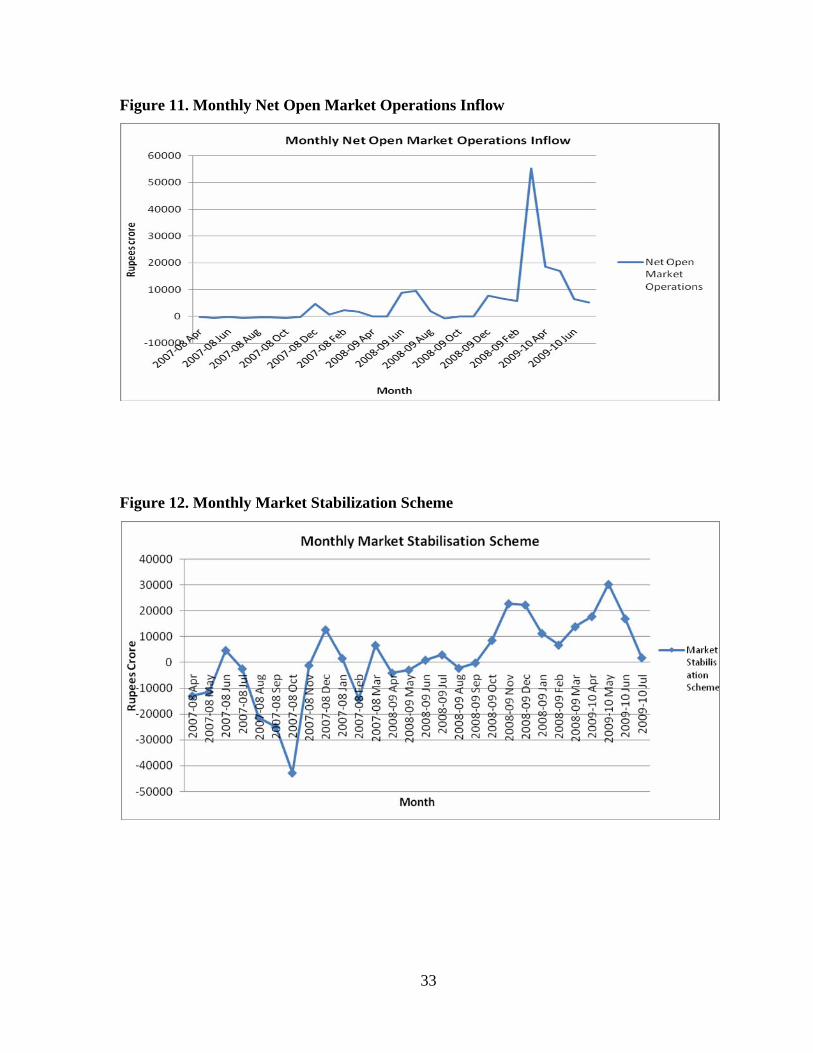
official reserves, and sterilization of liquidity via OMOs, etc. (appendix figures 9–11). With
uncertainty in deregulated financial markets, developments as above create further opportunities
for speculative profits, often laden with massive investments in derivative instruments
(appendix figure 6).8 The end result is often other than what is desired by the policymakers, a
story that reflects the Indian experience.
Summing up, analysis in this section indicates that:
(a) the nominal exchange rate of the rupee has been volatile with moderate
appreciation, and that the real rate has been steadily moving up;
7 “...India has experienced both ‘floods’ and ‘sudden stops’ of capital flows. Net capital flows to India increased from as low as US$7 billion in 1990–91 to US$45 billion in 2006–07, and further to US$107 billion during 2007–08, the year just before the crisis. They dropped to as low as US$7 billion in 2008–09 at the height of the crisis. Capital flows are estimated to have recovered to around US$50 billion in 2009–10” (Rao 2010). 8 For an elaboration, see Sen (2003 and 2010)
10
(b) additions to official reserves have continued unabated despite their use in
stabilizing the rupee rate with direct interventions in the foreign exchange
market;
(c) that FIIs have continued to impact the stock market, both in terms of higher
turnover and increased volatility;
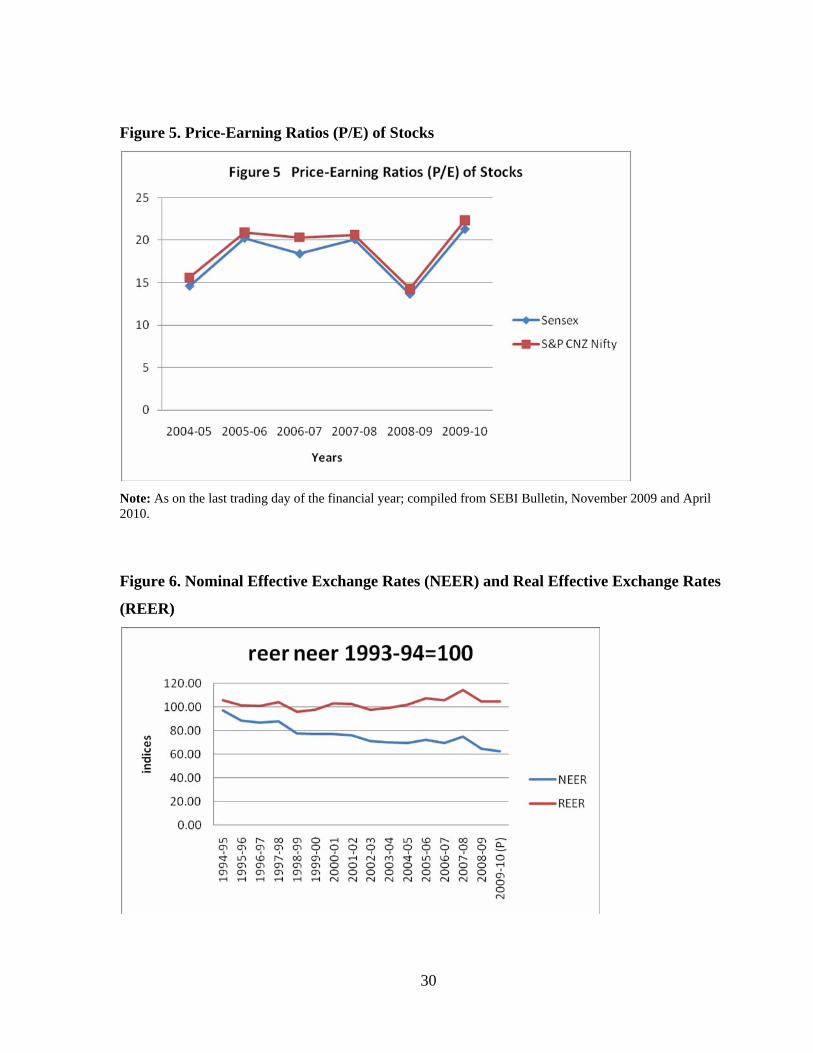
(d) the P/E ratios of stocks have moved up accordingly;
(e) attempts to sterilize additions to liquidity in the market by means of LAF as
well as MSS contributed to sharp increases in publicly held rupee debt (appendix
figures 5,6,7, and 9);
(f) as a result, the rising debt service liabilities tend to preempt other heads of
fiscal expenditure in the budget. Sales of government securities on a large scale
also crowds out the debt market, often pitching the interest rate higher than what
otherwise would have prevailed in the market; and
(g) the financialization process also affects commodity prices, by spilling over to
the commodity futures market. The operation of the MCX of India in futures
trading on currency, as mentioned above, provides an instance of the interlink
between the commodity futures and the stock markets.
We would discuss the two aspects of monetary management mentioned above in the
following section, pointing at further problems and dilemmas that remain rather neglected in the
literature.
III. MANAGING THE FINANCIAL SECTOR: SOME MORE ISSUES
Financialization of markets, an offshoot of financial deregulation, does not remain confined to
financial assets alone, a fact that is evident in the much talked about subprime loan crisis in the
housing market of the United States. With channels of speculation opening up for short-term
capital, the flows spill over across markets that include financial assets, real estate, and
commodity exchanges, along with various types of OTCs.
Financialization today pervades the commodity markets, thus affecting spot and futures
trading in commodities (UNCTAD 2009). As held by UNCTAD in its latest Trade and
Development Report (2009) “…a major new element in commodity trading over the past few
11
years is the greater presence on commodity futures exchanges of financial investors that treat
commodities as an asset class. The fact that these market participants do not trade on the basis
of fundamental supply and demand relationships and that they hold, on average, very large
positions in commodity markets, implies that they can exert considerable influence on
commodity price developments.” The report points at the sharp rise in commodity prices
between 2002 and mid-2008, which, in turn, have been followed by a reversal at the beginning
of the financial crisis. The sequence, as pointed out by UNCTAD, was related to the booming
financial market and its crash by October 2008 (UNCTAD 2009: 54). As pointed out,
“financialization” also increases price volatility and “…hedging becomes more expensive and
perhaps unaffordable for developing country users, as they no longer are able to finance margin
calls” (UNCTAD: 74). The argument probably also holds for intracountry futures trade, where
use of high margins can deter small traders or even producers, especially in developing
countries.9
Concerns over rising commodity prices in advanced countries like France have recently
prompted the French ministry, led by Cristine Lagarde, to argue for “standardizing the principle
of position limits” in “financialized” commodity markets “...not only to prevent market
manipulations but also to reduce the macroeconomic, even systemic risks.” She also calls for an
“…in-depth study on the use of margin call and capital requirement mechanisms as instruments
to increase liquidity in the longest terms to maturity on the futures curve.” The appeal suggests a
new commodity market watchdog similar to the Commodity Futures Trading Commission of
the United States (Bloomberg 2010).
A rise in commodity prices and the use of futures and forward trading in global markets
have also been prominent in India. Thus one can observe parallel movements in commodity
price indices in India and overseas, as reflected in the MXC of India and the international
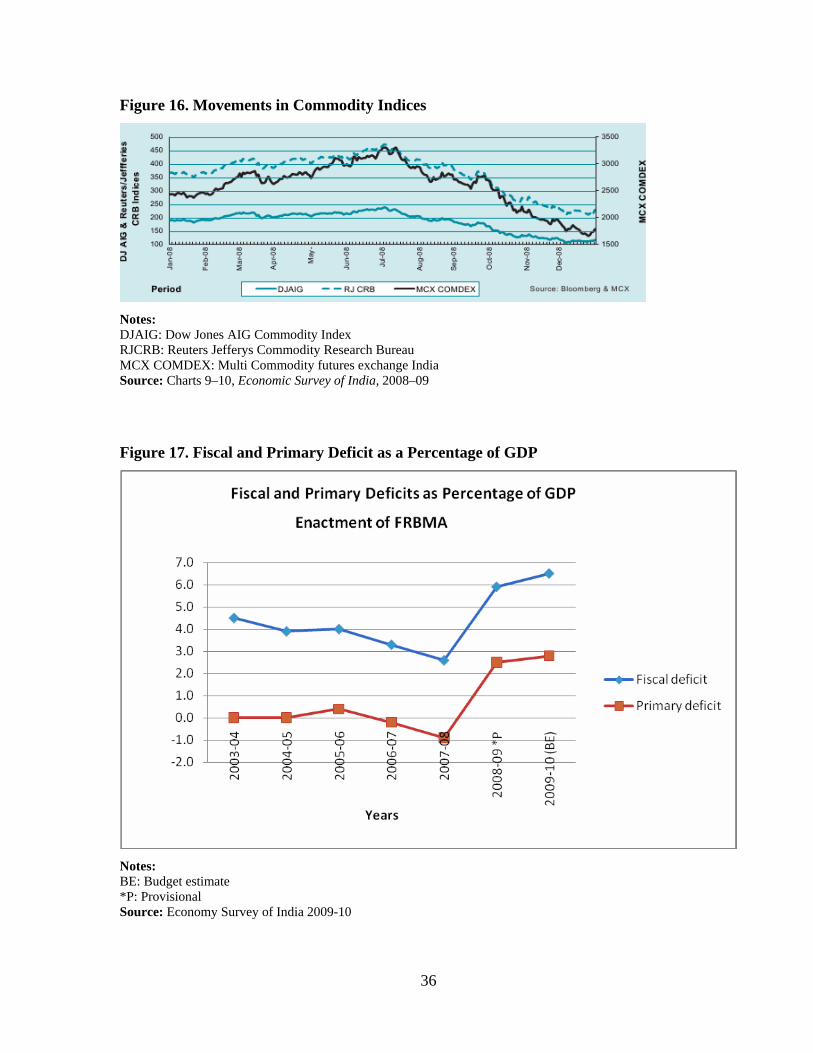
commodity futures exchange (appendix figure 16) (Sen and Paul 2010). The phenomenon seems
to have pervaded the Indian commodity market, both by pushing up prices and by linking the
commodity market to those for financial stocks, via the portfolio decisions of those who
speculate on both. Equity and commodity futures markets often move together, especially as the
financiers reallocate their respective portfolios by switching between the markets. In the study
9 For a recent study that points to the inability of small traders and producers of soybean to gain access to commodity future markets, see Kumar (2010).
12
mentioned above, we tried to find the relation (Sen and Paul 2010), if any, between movements
in the total stock exchange (TSE) turnover and spot-price indices for individual commodities in
India (see appendix figures 15 and 16). Our tests of a regression analysis indicate strong
negative relation between the two for urad, rice, and wheat, if we consider the period between
May 2008 to May 2009. It may be mentioned here that this also covers the period when global
stock markets collapsed, affecting the Indian market as well. Redoing the exercise over a longer
period from May 2003 to May 2009, during which the stock market was at its boom until the
crash began in mid-2008, we got a positive link between the TSE and individual spot prices for
the same set of commodities, with TSE regressed on the latter (Sen and Paul 2010). We observe,
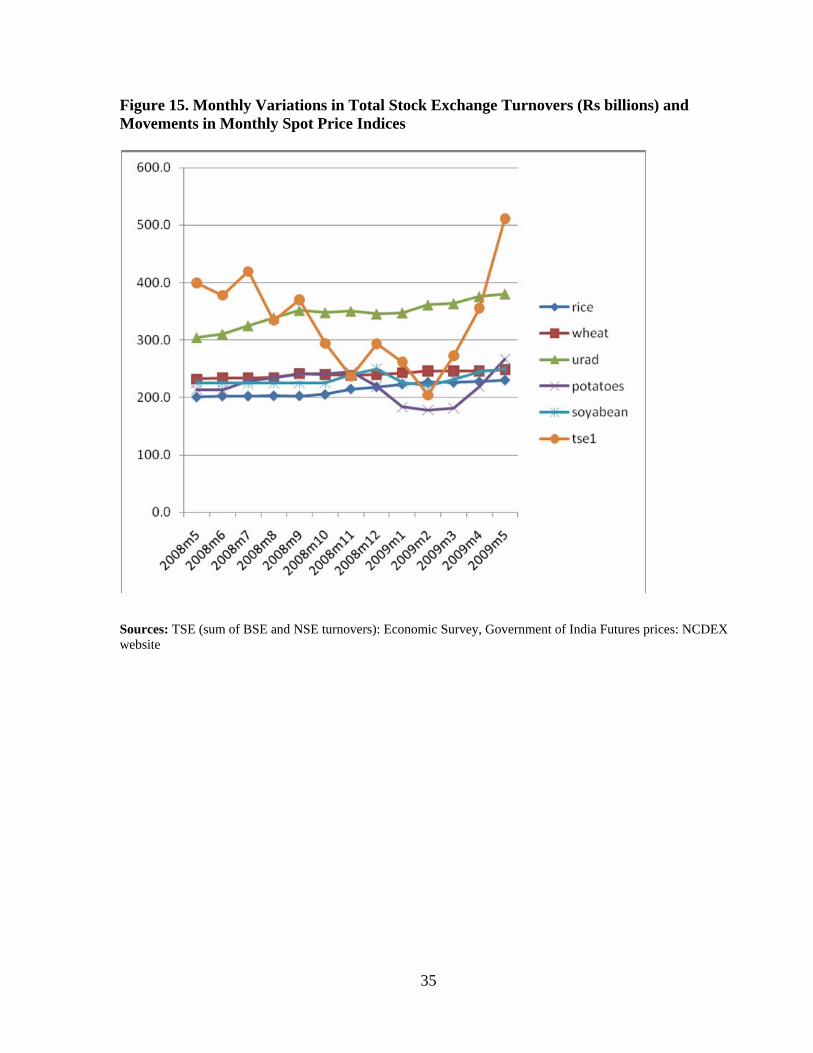
in appendix figure 15, strong parallels between the monthly vartions in TSE and futures prices,
for at least two items (potato and urad) during the first ten months of the fiscal year 2006–07
when both were open to futures trading.10
An outcome as above can be related to the observations we made earlier in this paper
relating to the “financialization” of the commodity market. Speculation and portfolio
adjustments across markets on part of financial agents led, as a contagion, to spurts in
commodity markets when the financial market was also at its boom. Thereafter the crash in
financial asset prices and in its turnover has led the same agents to look to commodities again as
alternative sources of returns on their funds, with investments in commodity futures. The latter,
as observed, pushed up the spot prices, implying a betting on rising prices with speculators
holding long positions.11
With rising food prices, futures markets in agricultural commodities, especially in
cereals, pulses, and other essential food items, are currently subject to public debates in India,
especially when it relates to the fresh opening of those markets for essential food items that
earlier had been delisted. Even international organizations have drawn attention to the pitfalls
that lie ahead for countries (including India) in trying to open futures trading in commodities.
As held for India by the international think-tank IFPRI, “rising expectations, hoarding, and
10 Food items that have been traded in future markets of India in recent years include (among others) coffee, barley, ground nuts, sugar, desi, tur, urad, and rice (until January 2007); castor seed, guar gum, gur, jeera, maize, masoor, gram, mustard seed, pepper, oil cake, and soya oil (until January 2008); sugar (until January 2009); and, finally, chili, castor seed, coriander, potato, dhania, and wheat (until now). Futures trading, in earlier months but discontinued now, can still be identifies a factor explaining the current spate of price increases in the commodity markets. Speculation in commodity trading also has been a major component in the OTC trading with forward contracts that, as mentioned earlier, are legalized (Sen and Paul 2010). 11 Paavo Suni, “Commodity Future Prices as Predictors of Spot Prices” etla.fi/files/1659_SUH_06_2
13
hysteria played a role in increasing the level and volatility of food prices, as did the flow of
speculative capital from financial investors” (IFRI 2009). A similar view was held by the
Washington-based Institute of Agriculture and Trade Policy (IATP 2008).
On the whole, official policies in India to manage the surges in speculative short-term
capital inflows in the money market have not been able to arrest its spill-over to the commodity
market, which continues to provide profits to financiers on futures and forward trading. The end
result has been the unrelenting inflation in food prices, which affects the survival of large
sections of population in India
We now pay attention to one more effect of deregulation in financial markets, which, as
we point out, has often been neglected. The issue relates to interventions of monetary
authorities, initially in the forex market (to acquire the additional supply of exchange in order to
prevent appreciation of the domestic currency), and later in the domestic money market, to mop
up liquidity that may be generated by such additions to high-powered money. The above
involves sale of government securities, which, sold at market rates, adds to the interest bill as a
fixed charge under the head of the expenditure for the primary budget. With official
commitments in India in terms of the Fiscal Responsibility and Budget Management Bill
(FRBMB)—which, since the year 2003, limits the size of the fiscal deficit as a proportion of
GDP—a rising interest bill can only be met with a cut in other heads of expenditure in the
primary budget (it may be recalled here that the primary budget consists of the fiscal budget less
expenditure on interest bill). With defense as an inflexible component of official expenditure
that has remained at around 9% of revenue expenditure since 2007–08 (Government of India
2010: 49), this meant that cuts on other heads of expenditure in the primary budget had to fall on
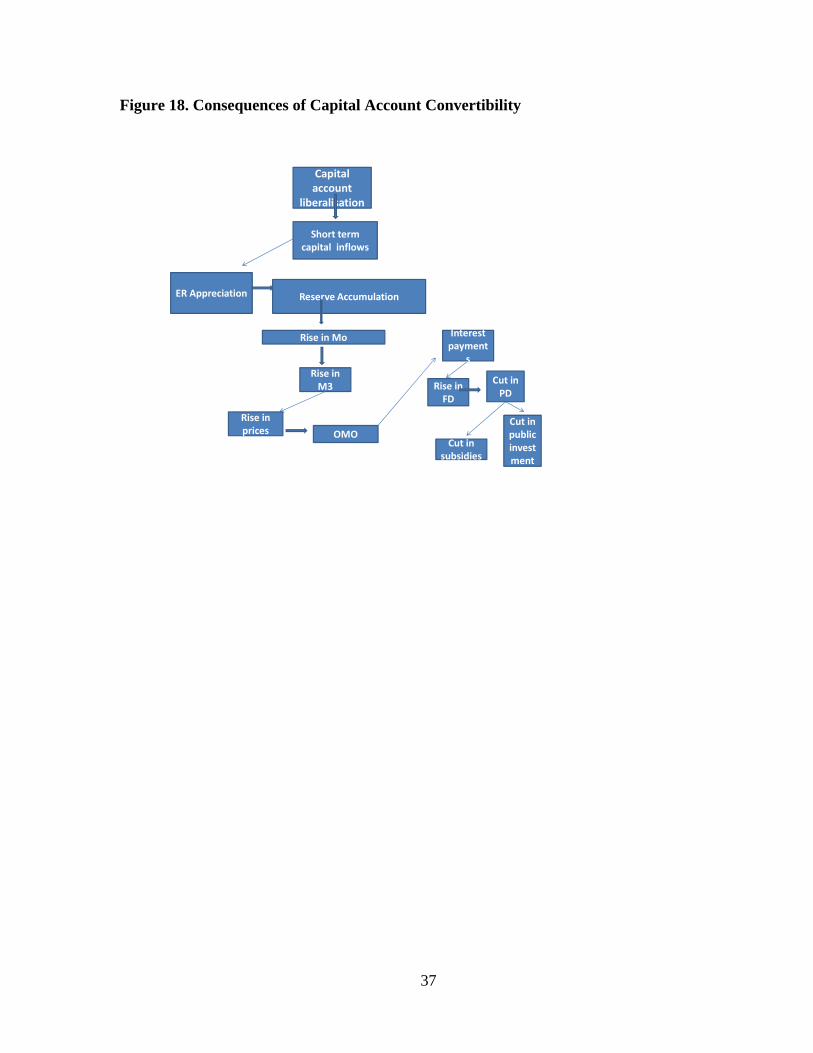
subsidies and capital expenditure, which are of social concern (see appendix figure 18 for the
sequences following capital account convertibility). One can figure out the large proportion of
the interest-related payments in nonplan expenditure as compared to subsidies over 2004–05 to
2009–10 (see appendix figure 18). Comparing the ratios, major subsidies fell from 15.6% as
proportions of revenue expenditure in 2008–09 to 11.8% in 2009–10. The ratio of aggregate
subsidies to GDP has declined from 2.2% in 2008–09 to 1.7% in 2009–10 (Government of India
2010: 50). Comparing the changes in expenditure between 2008–09 (April–December) and
2009–10 (April–December), interest payments have risen by 5.1%, while major subsidies have
dropped by 6.3% (Government of India 2010: 54). Accordingly the primary deficit, which
measures the excess of aggregate public expenditure (on subsidies, capital expenditure, and
14
defense) over total public revenue, perforce fell relative to fiscal deficit as proportion of GDP.
The more recent moves of the government to come out of the stimulus package that has
sustained the fiscal deficit at higher levels over the last two fiscal years may further harden the
picture. We provide the figures for the share of the primary as well as the fiscal deficit as
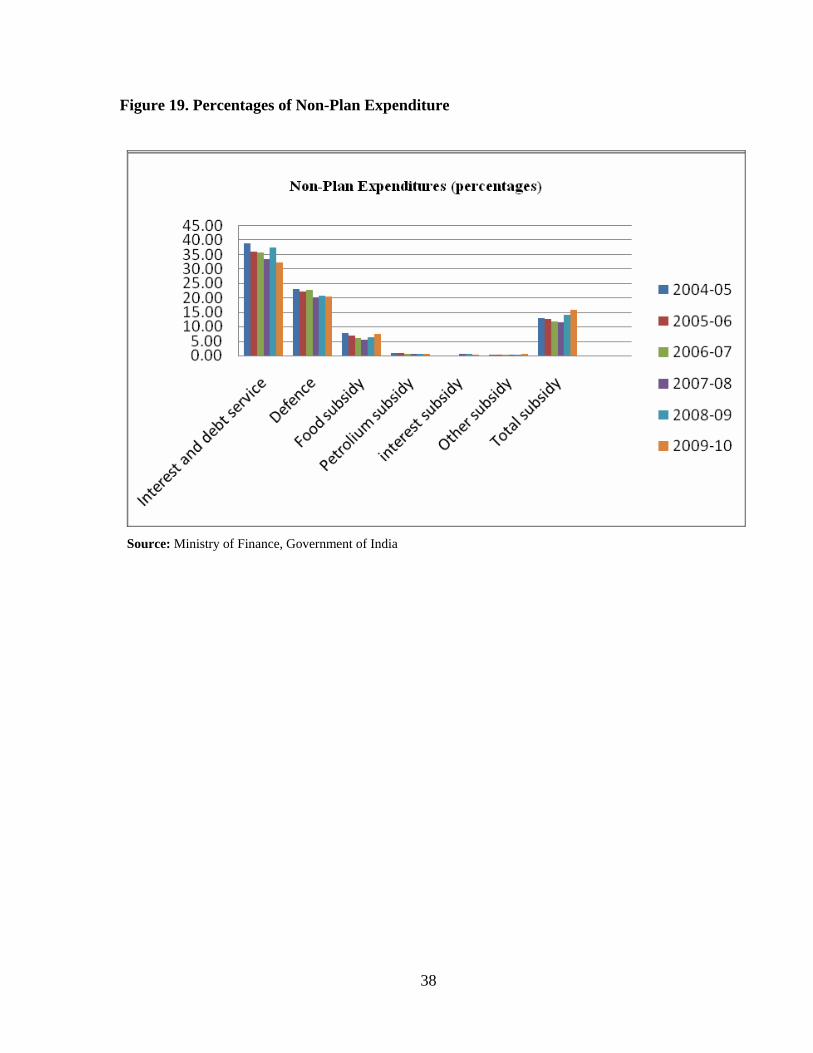
proportions of GDP in appendix figure 17. One also gets an idea, in figure 19, of the rising share
on interest rate charges and debt servicing as a proportion of nonplan expenditure, especially in
contrast to the low share of food subsidies.
Aspects as above deserve attention, and more so because the benefits of financial
deregulation remain confined to those who can speculate in markets, while the costs are borne
by those who are affected by speculation on commodity prices and cuts in social sector spending
by the government, as we point out above.
IV. PERSPECTIVES ON MONETARY MANAGEMENT IN INDIA
Of late, India has been receiving considerable attention as one of the few countries that has
managed to successfully withstand the consequences of the latest global crisis. Much of it is
attributed to successful management by the country’s monetary authorities, and especially by
the RBI. Quoting a statement from Joseph Stiglitz, one of the staunch critics of globalization,
“...your policymakers, particularly the Reserve Bank of India, are already doing a great job. I
wish the U.S. Federal Reserve displayed the same understanding of the role of regulation that
the RBI has done, at least so far” (Stiglitz 2010a). He further remarks, “India was one of the
countries that resisted the wholesale deregulation movement that the United States had been
exporting… They [India] did it against political pressure… and now I think the financial
markets are thankful that they did resist those pressures. The result is that India’s financial
markets are in better shape than they would have been if they had engaged in the kind of
wholesale deregulation that the United States engaged in” (Stiglitz 2010b). The argument rests
on what he notices as India’s ability to continue with regulations in the banking sector, in
contrast to the wide-ranging deregulations in the banking sector of the United States (and
Europe as well) (Stiglitz 2010a and 2010b).
A rather similar view has recently been aired by Gerald Epstein, another leading critic of
the theory behind financial deregulation and its application in the United States and elsewhere.
Mentioning the restraints in India on trading of derivatives by banks, Epstein commends the role
15
of the RBI in monetary management, thus mentioning “... Reddy [the RBI governor] who was
the devil… now... has turned a hero who saved the Indian financial system” (Epstein 2010). The
observation is based on what Epstein believes as the ability of the RBI, first, to judge the quality
of new financial products (derivatives, etc.) in the market and issue approvals solely on that
basis, and second, the monitoring by RBI of bank performance while issuing “guidelines and
safeguards.” At end of the Asian crisis, India’s strategy of capital flow management was
appreciated as a success story by Epstein, Grabel, and Jomo (2003). However, since then the
pace of deregulation in the financial sphere has been much faster and more pervading, a fact that
speaks for the discordant notes we have offered in this paper.
In our judgment, observations as above underestimate the potentials of systemic risk and
its social cost as are embedded in India’s liberalized financial sector. Our analysis of the
successive stages in the near-full liberalization of external capital flows and the domestic
financial market—with explosion of short-term flows of capital, as are driven by speculation
across markets of financial assets and commodities, the wide-ranging use of exchange traded, as
well as OTC derivatives, and finally, the incidence of financial liberalization in terms of cuts in
social sector spending—all bear testimony to the lack of reality of those positions.
However, one observes an element of unanimity on the volatility aspect of short-term
capital flows. Thus, concerns are shared by Stiglitz as he points out that “... this crisis should
send three strong messages to India. One, think very carefully about financial market regulation.
Full capital market liberalization should clearly be put off. Two, be prepared to take offsetting
actions to counter volatility flowing in from abroad. Finally, pursue growth from a diversified
economic base, which includes developing countries and your own huge domestic potential”
(Stiglitz 2010a). Echoing the same sentiment, Epstein concludes on a discerning note on risky
toxic assets, and he points out “...If you cannot figure out how risky the asset is within
reasonable limits, do not approve it” (Epstein 2010). It echoes the much-quoted cautionary note
from George Soros, the billionaire investor in capital markets who claimed that derivatives (and
especially credit-default swaps) are “weapons of mass destruction.” The warning, initially put
forth in 2003, was recently reiterated by Soros in 2006.12 Concerns as above on the current
volatility of capital flows are also voiced in India, with the present RBI chief publicly
acknowledging the dangers of volatile capital flows (Rao 2010), as already mentioned in this
12 “Soros slams ‘instruments of destruction’.” CNNMONEY.com June 12, 2009: 6:46 AM ET
16
paper. Others also come up with anxiety on the volatility aspect of capital flows, especially with
crisis in global markets. 13 However, the free flow of capital across and within the country
encourages speculation under uncertainty. The latter is bound to generate volatility in financial
markets, providing sources of profits under speculation. Thus it requires action that goes beyond
words, especially from official agencies, to successfully manage and counter the consequences
of excess capital inflows subject to volatility.
We may mention here a path-breaking move in the United States with the recent bill on
the regulation of Wall Street that was passed by a majority in the Senate on May 20, 2010. As
put by a commentator, “...prodded by national anger at Wall Street, the Senate on Thursday
passed the most far-reaching restraints on big banks since the Great Depression” (Kuhnhenn NO
DATE). The bill, accepted by the House, will be a landmark victory of regulatory bodies over
the free-for-all reign of speculation in the U.S. financial market, by restraining banks from
dealing in risky assets and providing a lot of protection to the retail investor or the individual
homeowner on mortgages. As put by President Obama, “Over the last year, the financial
industry has repeatedly tried to end this reform with hordes of lobbyists and millions of dollars
in ads, and when they couldn’t kill it they tried to water it down. Today, I think it’s fair to say
these efforts have failed” (Drawbaugh and Sullivan 2010).
We draw attention to the above step taken by the U.S. administration in order to urge
upon a need for similar actions in India and other emerging economies where the recent moves
for financial deregulation have been in the opposite direction.
V. CONCLUSION
What can be concluded from our analysis of monetary management since the start of financial
deregulation in India? We think it can be summed up in the following six observations and
policy conclusions:
a) The extent of monetary management in India has not been in keeping up with the
need to control the rising inflows of short-term capital, often led by the FIIs, which
destabilizes stock markets and the exchange rate of the domestic currency.
13 “India's Financial Secret Weapon” Arvind Panagariya, Foreign Policy Magazine www.brookings.edu
17
b) Net flows of overseas capital, in excess of the sum absorbed to finance the current
account deficit, has put upward pressures on the real exchange rate of the rupee. To
counter the latter, monetary authorities have been mopping up foreign currency with
direct purchases of latter, along with sales of government securities to absorb excess
liquidity. Also the exchange, converted to rupees in the domestic market, is sought to
be sterilized by sales of government securities to absorb excess liquidity. While
purchase of foreign currency contributes to rising official reserves (and thus to high-
powered money), it has the potential of adding further to the money supply. As for
absorption (or sterilization) of liquidity by selling securities to public, the act adds to
the interest bill for the government in its budget, which in turn entails social costs by
inducing cuts in public expenditure on social programs and investments, with ongoing
restraints on the fiscal deficits.
c) Sterilization of excess liquidity, by means of sales of government securities (or
borrowing), to be attractive needs to be offered at interest rates that make them
saleable in the credit market. This constrains the national autonomy of authorities to
fix interest rates at levels otherwise considered desirable in the interest of real
activities.
d) Sterilization by means of adjustments in the repo and reverse repo rates further limits
autonomy in monetary policy by pitching the rates as well as the reserve requirements
higher/lower according to whether capital inflows are considered to be drying up or
excessive. Changes as above are guided by circumstances in global financial markets
rather than by domestic exigencies.
e) Monetary management in India has not been able to control the flow of funds to
finance derivatives, both exchange traded and OTCs, which also enters the
commodity futures and forward markets. As in other countries, commodity markets
today are overtly financialized, with free flow of excess short-term funds in search of
profit. This entails further social costs, with futures prices pushing up spot prices of
commodities in markets for daily necessities.
f) Monetary management has not been able to prevent steady appreciation in the real
exchange rate of rupee, a fact that is visible in the appreciation of the real effective
exchange rate (REER). This has made Indian goods less competitive in relation to
18
foreign products, both with exports in overseas markets and with imports in domestic
markets.
Concluding, one does not see much logic or an awareness of the social costs in pushing further
the agenda of monetary management in the direction of full capital account convertibility in
India. To allow the free flow of finance to feed transactions in the country’s secondary stock
markets, and also to permit the use of derivative instruments to hedge and speculate, has created
further space for those who want to use money to make more money while contributing little to
growth and stability in the real economy.
19
REFERENCES Drawbaugh, K., and A. Sullivan. 2010. “Senate Approves Sweeping Wall Street Bill.” May 22.
Available at: in.reuters.com/article/idUSTRE64I5JQ20100521. Epstein, G. 2010. “A Financial Pre-Cautionary Principle: New Rules for Financial Product
Safety.” Power Point Presentation at IDEAS Conference, Chennai, India, January 24–27. Available at: www.networkideas.com
Epstein, G., I. Grabel, and K.S. Jomo. 2003. “Capital Management Techniques in Developing
Countries: Managing Outflows in Malaysia, India and China.” Working Paper 56. Amherst, MA: Political Economy Research Institute (PERI).
Government of India. 2010. Economic Survey 2009–10. New Delhi: Government of India.
Available at: http://indiabudget.nic.in/es2009-10/esmain.htm Robles, M., M. Torero, and J. von Braun. 2009. “When Speculation Matters.” Mimeo.
Washington, DC: International Food Policy Research (IFPRI). IATP. 2008. “Commodities Market Speculation: The Rise to Food Security and Agriculture.”
November (mimeo) Kuhnhenn, J. 2010.“Senate passes massive Wall Street regulation bill.” Available at:
abcnews.go.com/Business/wireStory?id=10696150 - 76k. Kumar, R. 2010. “Mandi Traders and the Dabba: ON-line traders in Commodity Futures
Markets in India.” Economic and Political Weekly 45(33). Leeladhar, V. 2008. “Consolidation in the Financial Sector.” Speech. April. Available at:
www.rbi.org. Lemgruber. A.C. 2008. “The Impossible Trinity.” RGE Monitor, May 16. Palley, T. 2009. “Rethinking the Economics of Capital Mobility and Capital Controls.” Working
Paper 193. Amherst, MA: Political Economy Research Institute (PERI). Panagariya, A. 2009. “India’s Financial Secret Weapon” Foreign Policy Magazine, January 22. Rao, D.S. 2010. “Volatility in Capital Flows: Some Perspectives.” Speech delivered in Zurich,
May 11. Available at: www.rbi.org. Reddy, Y.S. 2007. “Globalisation and Monetary Policy: Some Emerging Issues.” RBI Bulletin,
April. Available at: www.rbi.org. Reserve Bank of India. 2010. Financial Stability Report. Available at: www.rbi.org.
20
Reserve Bank of India. 2009a. Annual Report. Available at: www.rbi.org. Reserve Bank of India. 2009b. Forex Management Report: Half-Yearly Report on Management
of Forex Reserves. April–September. Available at: www.rbi.org. Sen, S. 2010a. “Basel Norms in India and Brazil.” in Ricardo Gottschalk (ed.), Basel II and
Developing Countries. London: Palgrave Macmillan. Sen, S. 2010b. “The Melt-down of the Global Economy: A Keynes-Minsky Episode.” Working
Paper 623. Annandale-on-Hudson, NY: Levy Economics Institute of Bard College. Sen, S. 2008. “De-regulated Finance in Indian Economy.” in Alternative Economic Survey,
Delhi. Also available as “La desregulació financier de la economía India,” Economía Informa 355. Mexico City: Universidad Nacional Autonoma Mexico.
Sen, S. 2007. Globalisation and Development. New Delhi: National Book Trust of India. Sen, S. 2003. Global Finance at Risk: On Real Stagnation and Instability. London: Palgrave
Macmillan. Sen, S., and R. Ghottschalk. 2010. “Basel Norms in India and Brazil.” in Ricardo Gottschalk
(ed.), Basel II and Developing Countries. London: Palgrave Macmillan. Sen, S., and M. Paul. 2010. “Trading in India’s Commodity Markets.” Working Paper 2010/03.
New Delhi: Institute for Studies in Industrial Development (ISID). Stiglitz, J. 2010a. “India is well placed to take on round 2 of recession.” Times of India, May 10. Stiglitz, J. 2010b. “India still on Track for Growth.” Columbia Business School Public Offering.
Available at: http://www4.gsb.columbia.edu/publicoffering/topics/business Subramanian, K. 2007. “One Face of the Impossible Trinity” Hindu Business Line April 28.
Available at: www.thehindubusinessline.com/2007/04/28/stories/2007042800360800.htm.
Suni, P. 2006. “Commodity Futures Prices as Predictors of Spot Prices.” Available at:
etla.fi/files/1659_SUH_06_2 Thorat, U. 2009. “Impact of global crisis on RBI as a national regulator.” Speech. Seoul, June
29. Available at: www.rbi.org. UNCTAD. 2009. Trade and Development Report. Geneva: United Nations Conference on Trade
and Development (UNCTAD). “France to Seek Commodity Position Limits, Margin Calls at G-20.” Bloomberg, April 15,
2010. Available at: www.Businessweek.com
21
“Soros slams ‘instruments of destruction’.” CNNMONEY.com June 12, 2009: “The Impossible Trinity: Why RBI has an impossible job.” BLAHLA, August 13, 2007.
Available at: http://blahla.wordpress.com/2007/08/13/the-impossible-trinity-why-rbi-has-an-impossible-job/
22
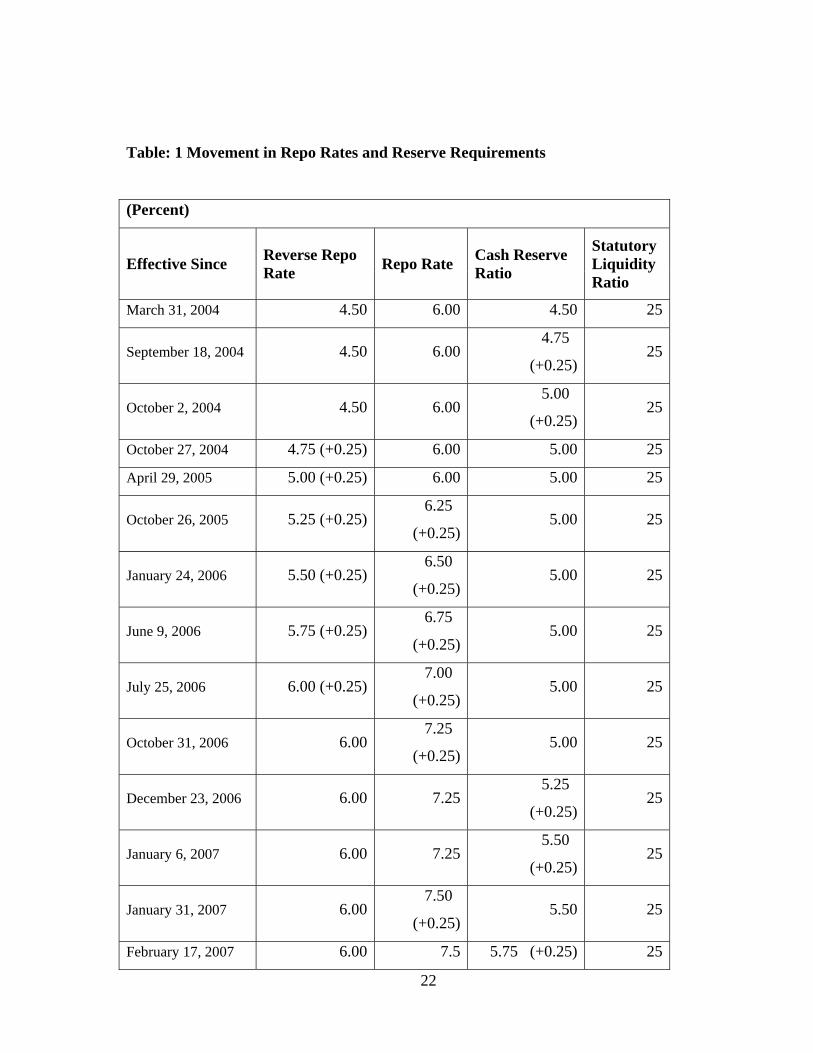
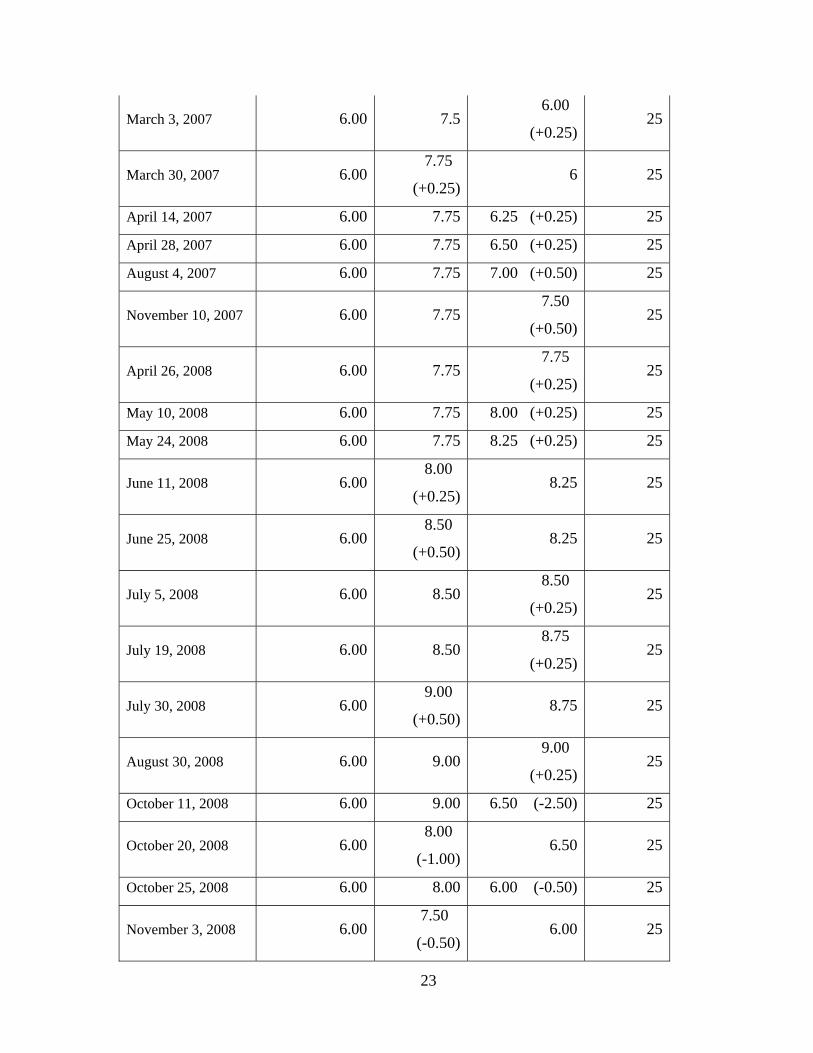
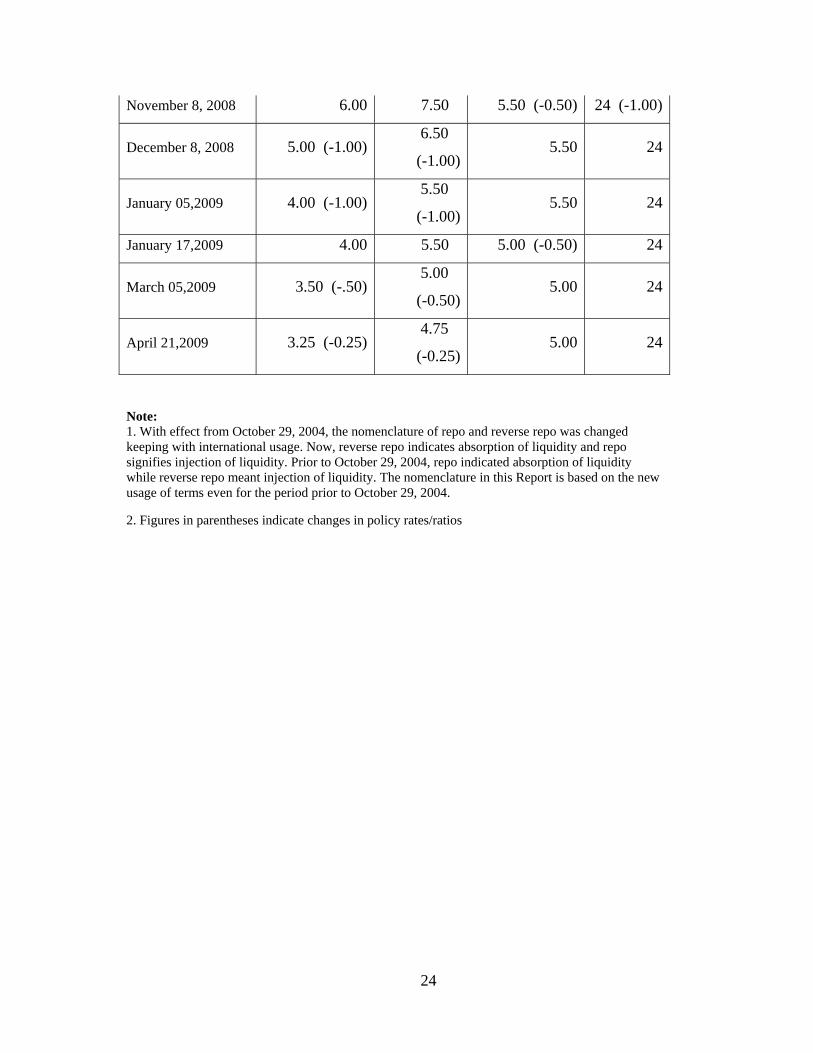
Table: 1 Movement in Repo Rates and Reserve Requirements
(Percent)
Effective Since Reverse Repo Rate Repo Rate Cash Reserve
Ratio
Statutory Liquidity Ratio
March 31, 2004 4.50 6.00 4.50 25
September 18, 2004 4.50 6.00 4.75
(+0.25) 25
October 2, 2004 4.50 6.00 5.00
(+0.25) 25
October 27, 2004 4.75 (+0.25) 6.00 5.00 25
April 29, 2005 5.00 (+0.25) 6.00 5.00 25
October 26, 2005 5.25 (+0.25)6.25
(+0.25)5.00 25
January 24, 2006 5.50 (+0.25)6.50
(+0.25)5.00 25
June 9, 2006 5.75 (+0.25)6.75
(+0.25)5.00 25
July 25, 2006 6.00 (+0.25)7.00
(+0.25)5.00 25
October 31, 2006 6.007.25
(+0.25)5.00 25
December 23, 2006 6.00 7.25 5.25
(+0.25) 25
January 6, 2007 6.00 7.25 5.50
(+0.25) 25
January 31, 2007 6.007.50
(+0.25)5.50 25
February 17, 2007 6.00 7.5 5.75 (+0.25) 25
23
March 3, 2007 6.00 7.5 6.00
(+0.25) 25
March 30, 2007 6.007.75
(+0.25)6 25
April 14, 2007 6.00 7.75 6.25 (+0.25) 25
April 28, 2007 6.00 7.75 6.50 (+0.25) 25
August 4, 2007 6.00 7.75 7.00 (+0.50) 25
November 10, 2007 6.00 7.75 7.50
(+0.50) 25
April 26, 2008 6.00 7.75 7.75
(+0.25) 25
May 10, 2008 6.00 7.75 8.00 (+0.25) 25
May 24, 2008 6.00 7.75 8.25 (+0.25) 25
June 11, 2008 6.008.00
(+0.25)8.25 25
June 25, 2008 6.008.50
(+0.50)8.25 25
July 5, 2008 6.00 8.50 8.50
(+0.25) 25
July 19, 2008 6.00 8.50 8.75
(+0.25) 25
July 30, 2008 6.009.00
(+0.50)8.75 25
August 30, 2008 6.00 9.00 9.00
(+0.25) 25
October 11, 2008 6.00 9.00 6.50 (-2.50) 25
October 20, 2008 6.008.00
(-1.00)6.50 25
October 25, 2008 6.00 8.00 6.00 (-0.50) 25
November 3, 2008 6.007.50
(-0.50)6.00 25
24
November 8, 2008 6.00 7.50 5.50 (-0.50) 24 (-1.00)
December 8, 2008 5.00 (-1.00)6.50
(-1.00)5.50 24
January 05,2009 4.00 (-1.00) 5.50
(-1.00)5.50 24
January 17,2009 4.00 5.50 5.00 (-0.50) 24
March 05,2009 3.50 (-.50)5.00
(-0.50)5.00 24
April 21,2009 3.25 (-0.25)4.75
(-0.25)5.00 24
Note: 1. With effect from October 29, 2004, the nomenclature of repo and reverse repo was changed keeping with international usage. Now, reverse repo indicates absorption of liquidity and repo signifies injection of liquidity. Prior to October 29, 2004, repo indicated absorption of liquidity while reverse repo meant injection of liquidity. The nomenclature in this Report is based on the new usage of terms even for the period prior to October 29, 2004.
2. Figures in parentheses indicate changes in policy rates/ratios
25
Source: Annual Report 2009, RBI
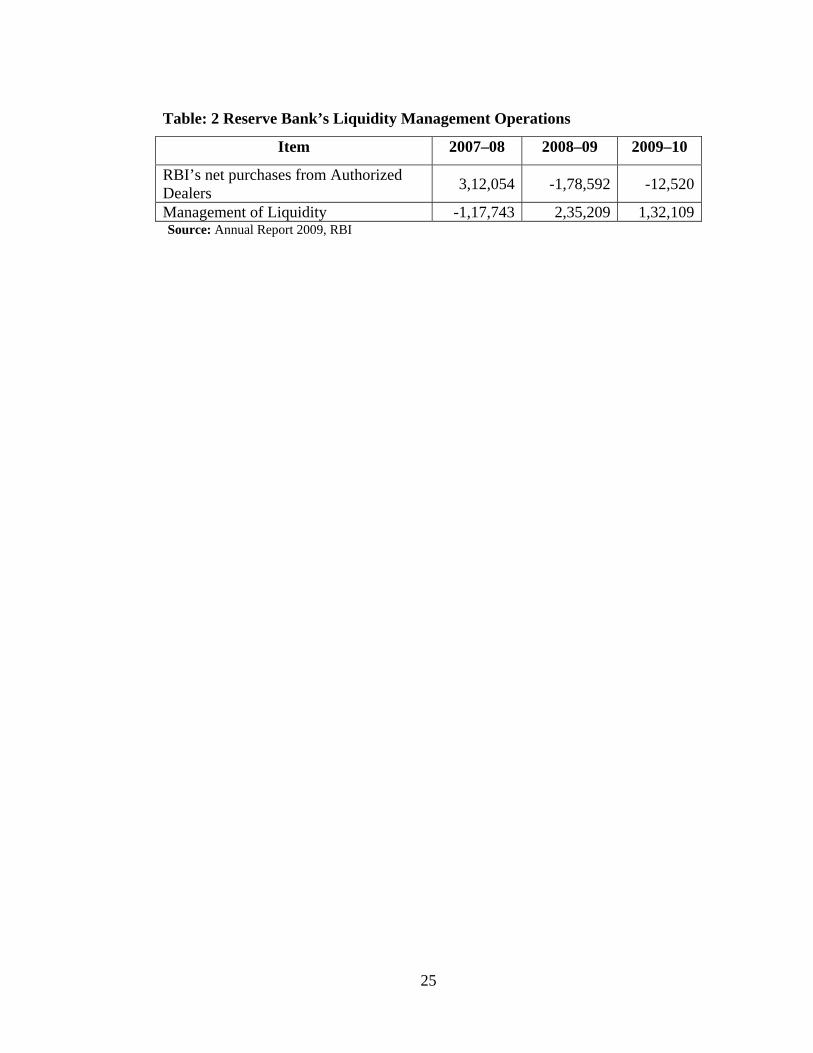
Table: 2 Reserve Bank’s Liquidity Management Operations
Item 2007–08 2008–09 2009–10
RBI’s net purchases from Authorized Dealers 3,12,054 -1,78,592 -12,520
Management of Liquidity -1,17,743 2,35,209 1,32,109
26
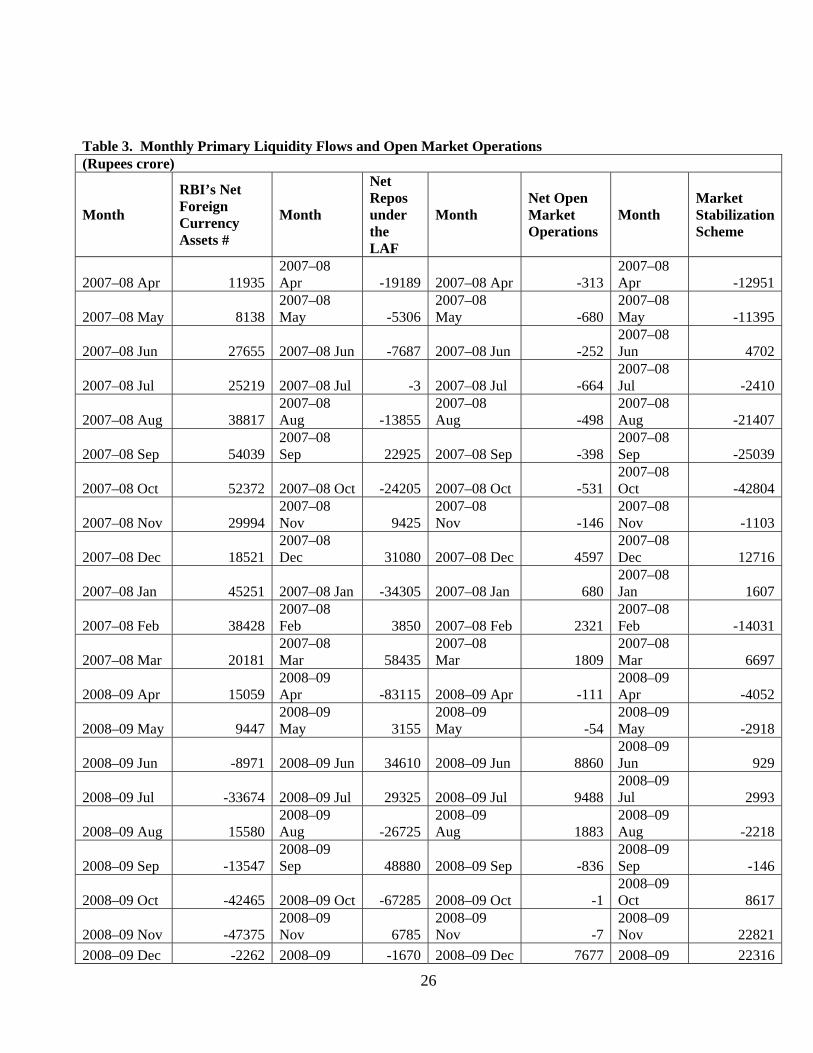
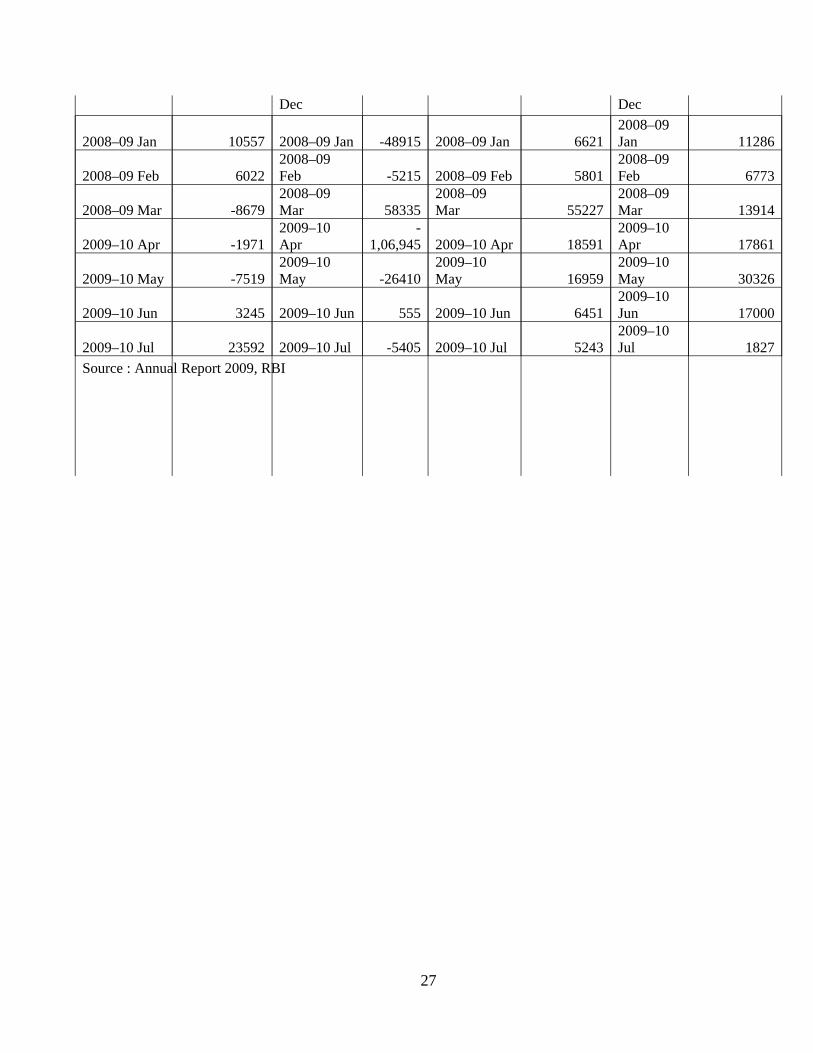
Table 3. Monthly Primary Liquidity Flows and Open Market Operations (Rupees crore)
Month
RBI’s Net Foreign Currency Assets #
Month
Net Repos under the LAF
Month Net Open Market Operations
Month Market Stabilization Scheme
2007–08 Apr 11935 2007–08 Apr -19189 2007–08 Apr -313
2007–08 Apr -12951
2007–08 May 8138 2007–08 May -5306
2007–08 May -680
2007–08 May -11395
2007–08 Jun 27655 2007–08 Jun -7687 2007–08 Jun -252 2007–08 Jun 4702
2007–08 Jul 25219 2007–08 Jul -3 2007–08 Jul -664 2007–08 Jul -2410
2007–08 Aug 38817 2007–08 Aug -13855
2007–08 Aug -498
2007–08 Aug -21407
2007–08 Sep 54039 2007–08 Sep 22925 2007–08 Sep -398
2007–08 Sep -25039
2007–08 Oct 52372 2007–08 Oct -24205 2007–08 Oct -531 2007–08 Oct -42804
2007–08 Nov 29994 2007–08 Nov 9425
2007–08 Nov -146
2007–08 Nov -1103
2007–08 Dec 18521 2007–08 Dec 31080 2007–08 Dec 4597
2007–08 Dec 12716
2007–08 Jan 45251 2007–08 Jan -34305 2007–08 Jan 680 2007–08 Jan 1607
2007–08 Feb 38428 2007–08 Feb 3850 2007–08 Feb 2321
2007–08 Feb -14031
2007–08 Mar 20181 2007–08 Mar 58435
2007–08 Mar 1809
2007–08 Mar 6697
2008–09 Apr 15059 2008–09 Apr -83115 2008–09 Apr -111
2008–09 Apr -4052
2008–09 May 9447 2008–09 May 3155
2008–09 May -54
2008–09 May -2918
2008–09 Jun -8971 2008–09 Jun 34610 2008–09 Jun 8860 2008–09 Jun 929
2008–09 Jul -33674 2008–09 Jul 29325 2008–09 Jul 9488 2008–09 Jul 2993
2008–09 Aug 15580 2008–09 Aug -26725
2008–09 Aug 1883
2008–09 Aug -2218
2008–09 Sep -13547 2008–09 Sep 48880 2008–09 Sep -836
2008–09 Sep -146
2008–09 Oct -42465 2008–09 Oct -67285 2008–09 Oct -1 2008–09 Oct 8617
2008–09 Nov -47375 2008–09 Nov 6785
2008–09 Nov -7
2008–09 Nov 22821
2008–09 Dec -2262 2008–09 -1670 2008–09 Dec 7677 2008–09 22316
27
Dec Dec
2008–09 Jan 10557 2008–09 Jan -48915 2008–09 Jan 6621 2008–09 Jan 11286
2008–09 Feb 6022 2008–09 Feb -5215 2008–09 Feb 5801
2008–09 Feb 6773
2008–09 Mar -8679 2008–09 Mar 58335
2008–09 Mar 55227
2008–09 Mar 13914
2009–10 Apr -1971 2009–10 Apr
-1,06,945 2009–10 Apr 18591
2009–10 Apr 17861
2009–10 May -7519 2009–10 May -26410
2009–10 May 16959
2009–10 May 30326
2009–10 Jun 3245 2009–10 Jun 555 2009–10 Jun 6451 2009–10 Jun 17000
2009–10 Jul 23592 2009–10 Jul -5405 2009–10 Jul 5243 2009–10 Jul 1827
Source : Annual Report 2009, RBI
28
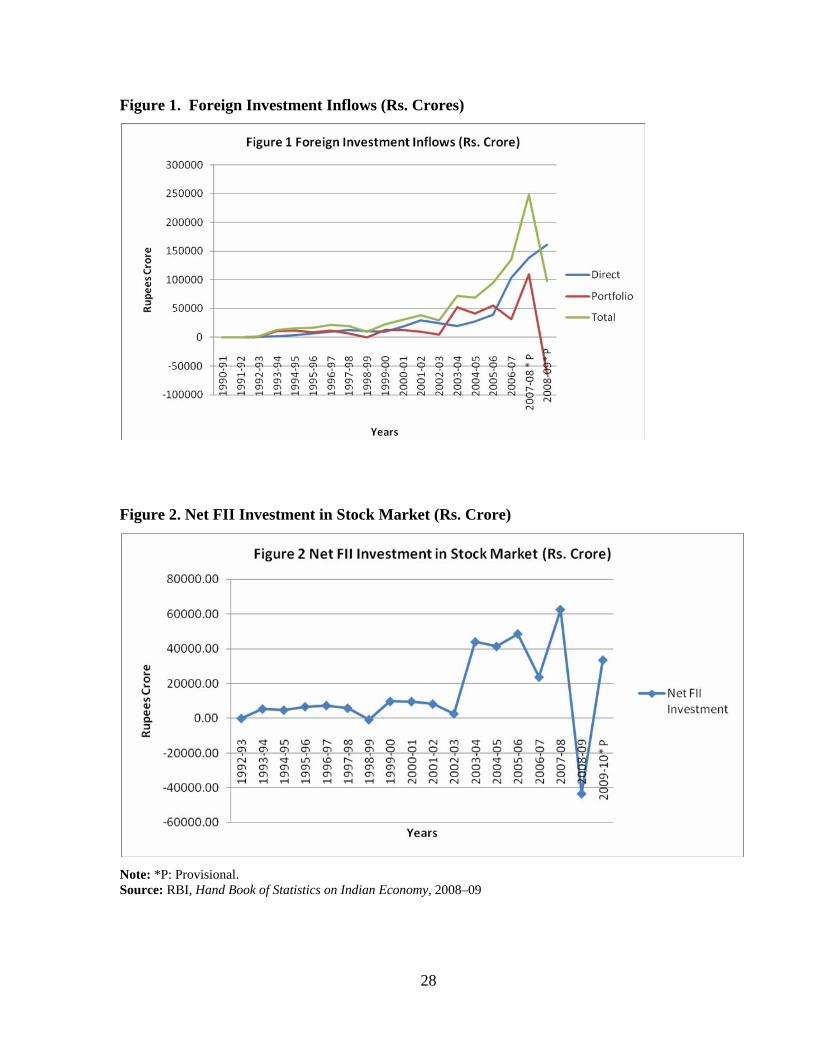
Figure 1. Foreign Investment Inflows (Rs. Crores)
Figure 2. Net FII Investment in Stock Market (Rs. Crore)
Note: *P: Provisional. Source: RBI, Hand Book of Statistics on Indian Economy, 2008–09
29
Figure 3. NSE Semsex Annual Averages Share Price Index
Source: RBI, Handbook of Statistics for Indian Economy 2008–09
Figure 4. Cash Reserve Ratio
Source: RBI, Annual Report 2010
30
Figure 5. Price-Earning Ratios (P/E) of Stocks
Note: As on the last trading day of the financial year; compiled from SEBI Bulletin, November 2009 and April 2010.
Figure 6. Nominal Effective Exchange Rates (NEER) and Real Effective Exchange Rates
(REER)
31
Figure 7. Turnover in the Equity Derivatives Market
Figure 8. SD of Monthly Turnover in the Equity Derivatives
32
Figure 9. Monthly RBI’s Net Foreign Currency Assets Inflow
Figure 10. Net Repos under the LAF
33
Figure 11. Monthly Net Open Market Operations Inflow
Figure 12. Monthly Market Stabilization Scheme
34
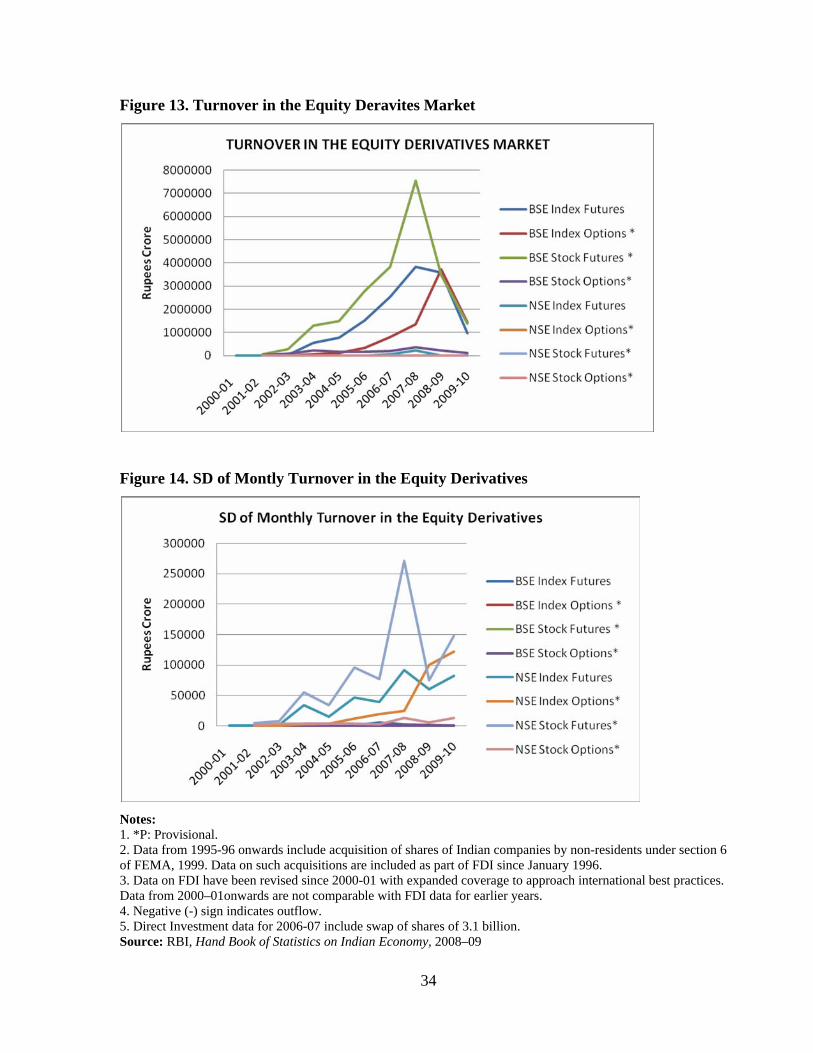
Figure 13. Turnover in the Equity Deravites Market
Figure 14. SD of Montly Turnover in the Equity Derivatives
Notes: 1. *P: Provisional. 2. Data from 1995-96 onwards include acquisition of shares of Indian companies by non-residents under section 6 of FEMA, 1999. Data on such acquisitions are included as part of FDI since January 1996. 3. Data on FDI have been revised since 2000-01 with expanded coverage to approach international best practices. Data from 2000–01onwards are not comparable with FDI data for earlier years. 4. Negative (-) sign indicates outflow. 5. Direct Investment data for 2006-07 include swap of shares of 3.1 billion. Source: RBI, Hand Book of Statistics on Indian Economy, 2008–09
35
Figure 15. Monthly Variations in Total Stock Exchange Turnovers (Rs billions) and Movements in Monthly Spot Price Indices
Sources: TSE (sum of BSE and NSE turnovers): Economic Survey, Government of India Futures prices: NCDEX website
36
Figure 16. Movements in Commodity Indices
Notes: DJAIG: Dow Jones AIG Commodity Index RJCRB: Reuters Jefferys Commodity Research Bureau MCX COMDEX: Multi Commodity futures exchange India Source: Charts 9–10, Economic Survey of India, 2008–09
Figure 17. Fiscal and Primary Deficit as a Percentage of GDP
Notes: BE: Budget estimate *P: Provisional Source: Economy Survey of India 2009-10
37
Figure 18. Consequences of Capital Account Convertibility
4
Capital account
liberalisation
Short term capital inflows
ER Appreciation Reserve Accumulation
Rise in Mo
Rise in M3
Rise in prices OMO
Interest payment
s
Rise in FD
Cut in PD
Cut in subsidies
Cut in public investment
38
Figure 19. Percentages of Non-Plan Expenditure
Source: Ministry of Finance, Government of India