Embed Size (px)
Citation preview

Managing Excess LiquidityInvestment Trends & Insights For Credit Unions
Jason Haley, Chief Investment Officer, ALM First Financial Advisors
Sam Taft, AVP Business Development, Trust for Credit Unions

Today’s Agenda
• ALM First Market Update
• Credit Union Investment Trends
• TCU Portfolios Progress Report
About Trust for Credit Unions
• Institutional investment
options, created specifically
for credit unions
• ALM First serves as
investment advisor
• Callahan Financial Services
serves as distributor
• Hundreds of credit union
investors in our 30+ year
history

ALM First Market Update
Jason HaleyChief Investment OfficerALM First Financial Advisors
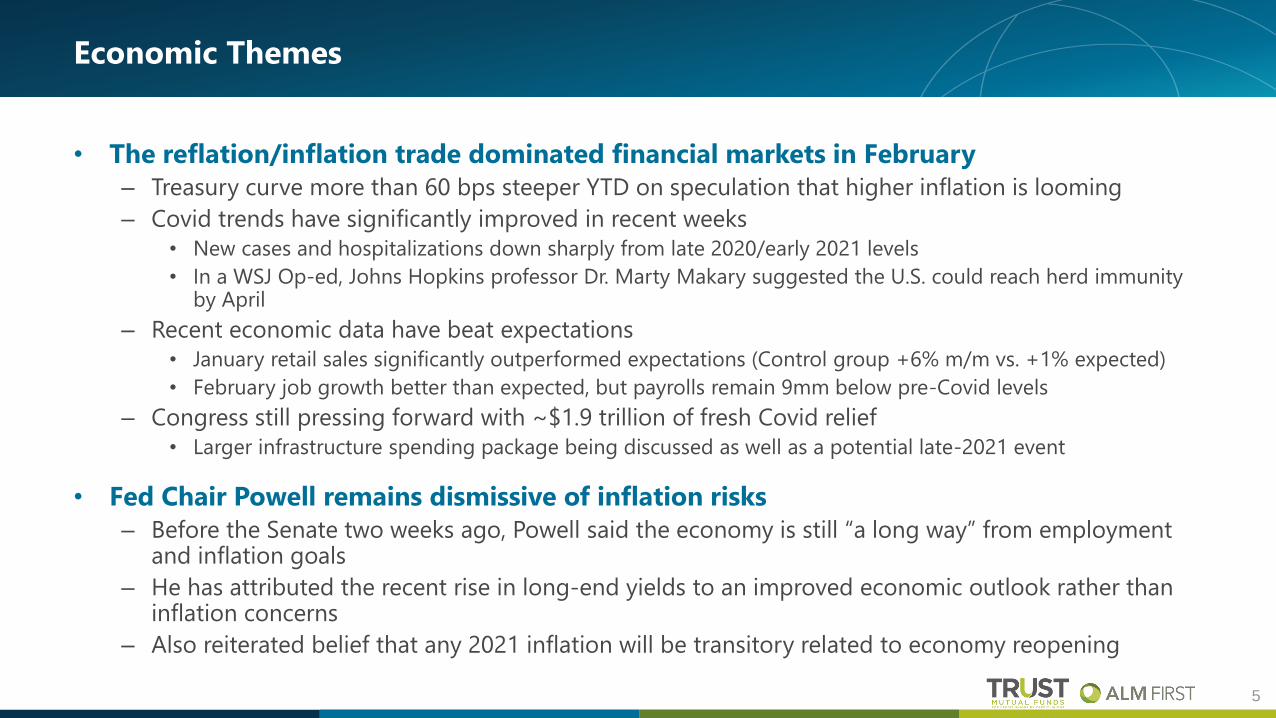
Economic Themes
• The reflation/inflation trade dominated financial markets in February
– Treasury curve more than 60 bps steeper YTD on speculation that higher inflation is looming
– Covid trends have significantly improved in recent weeks
• New cases and hospitalizations down sharply from late 2020/early 2021 levels
• In a WSJ Op-ed, Johns Hopkins professor Dr. Marty Makary suggested the U.S. could reach herd immunity by April
– Recent economic data have beat expectations
• January retail sales significantly outperformed expectations (Control group +6% m/m vs. +1% expected)
• February job growth better than expected, but payrolls remain 9mm below pre-Covid levels
– Congress still pressing forward with ~$1.9 trillion of fresh Covid relief
• Larger infrastructure spending package being discussed as well as a potential late-2021 event
• Fed Chair Powell remains dismissive of inflation risks
– Before the Senate two weeks ago, Powell said the economy is still “a long way” from employment and inflation goals
– He has attributed the recent rise in long-end yields to an improved economic outlook rather than inflation concerns
– Also reiterated belief that any 2021 inflation will be transitory related to economy reopening
5
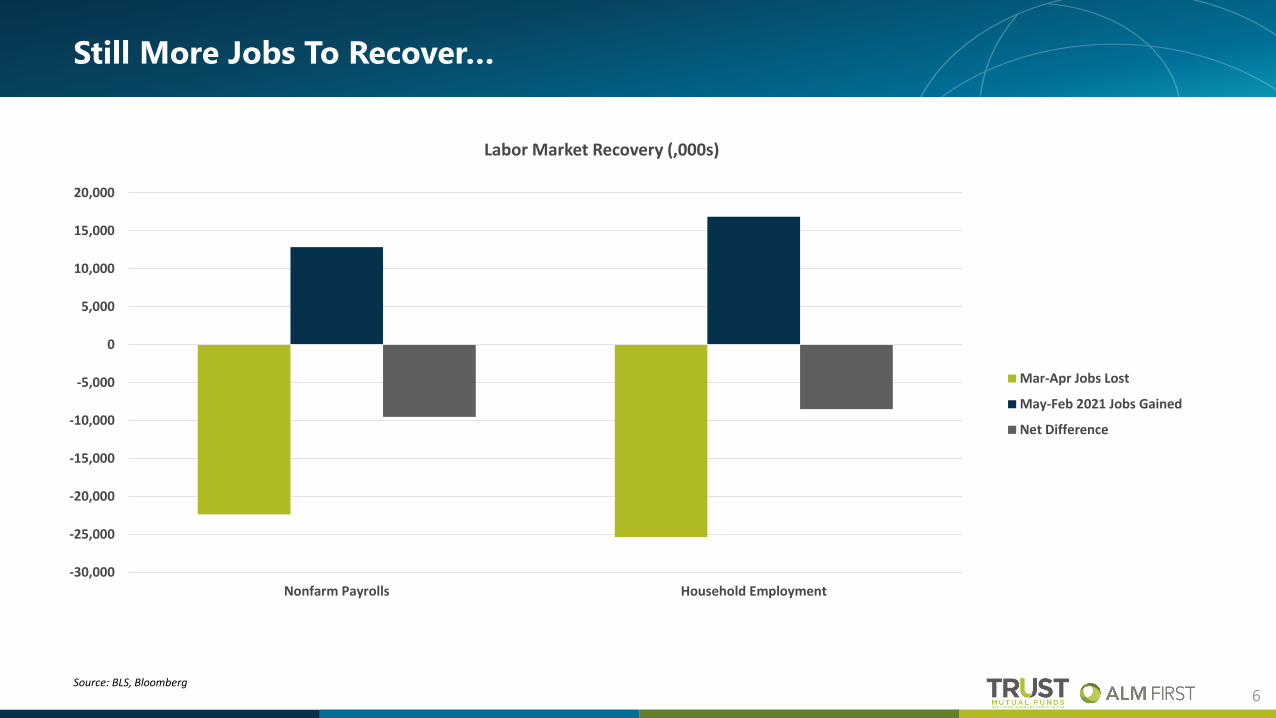
Still More Jobs To Recover…
6
-30,000
-25,000
-20,000
-15,000
-10,000
-5,000
0
5,000
10,000
15,000
20,000
Nonfarm Payrolls Household Employment
Labor Market Recovery (,000s)
Mar-Apr Jobs Lost
May-Feb 2021 Jobs Gained
Net Difference
Source: BLS, Bloomberg

Market Pricing for Forward Fed Funds
7
0.00
0.20
0.40
0.60
0.80
1.00
1.20
1.40
1.60
OIS Forward Curve
12/31/2020
3/8/2021
Source: Bloomberg

Market Tends To Prematurely Price Fed Action
8Source: J.P. Morgan
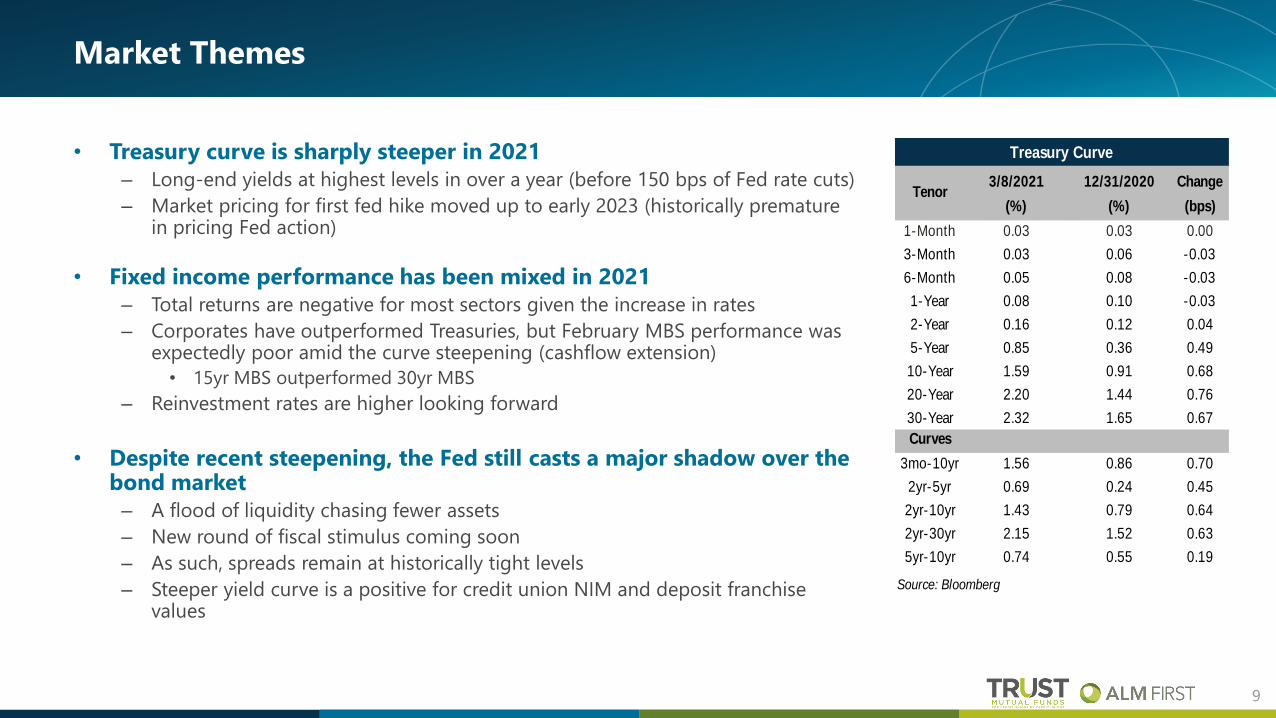
Market Themes
• Treasury curve is sharply steeper in 2021
– Long-end yields at highest levels in over a year (before 150 bps of Fed rate cuts)
– Market pricing for first fed hike moved up to early 2023 (historically premature in pricing Fed action)
• Fixed income performance has been mixed in 2021
– Total returns are negative for most sectors given the increase in rates
– Corporates have outperformed Treasuries, but February MBS performance was expectedly poor amid the curve steepening (cashflow extension)
• 15yr MBS outperformed 30yr MBS
– Reinvestment rates are higher looking forward
• Despite recent steepening, the Fed still casts a major shadow over the bond market
– A flood of liquidity chasing fewer assets
– New round of fiscal stimulus coming soon
– As such, spreads remain at historically tight levels
– Steeper yield curve is a positive for credit union NIM and deposit franchise values
9
3/8/2021 12/31/2020 Change
(%) (%) (bps)
1-Month 0.03 0.03 0.00
3-Month 0.03 0.06 -0.03
6-Month 0.05 0.08 -0.03
1-Year 0.08 0.10 -0.03
2-Year 0.16 0.12 0.04
5-Year 0.85 0.36 0.49
10-Year 1.59 0.91 0.68
20-Year 2.20 1.44 0.76
30-Year 2.32 1.65 0.67
Curves
3mo-10yr 1.56 0.86 0.70
2yr-5yr 0.69 0.24 0.45
2yr-10yr 1.43 0.79 0.64
2yr-30yr 2.15 1.52 0.63
5yr-10yr 0.74 0.55 0.19
Source: Bloomberg
Tenor
Treasury Curve

Credit Union
Investment Trends
Sam TaftAVP, Business DevelopmentTrust for Credit Unions
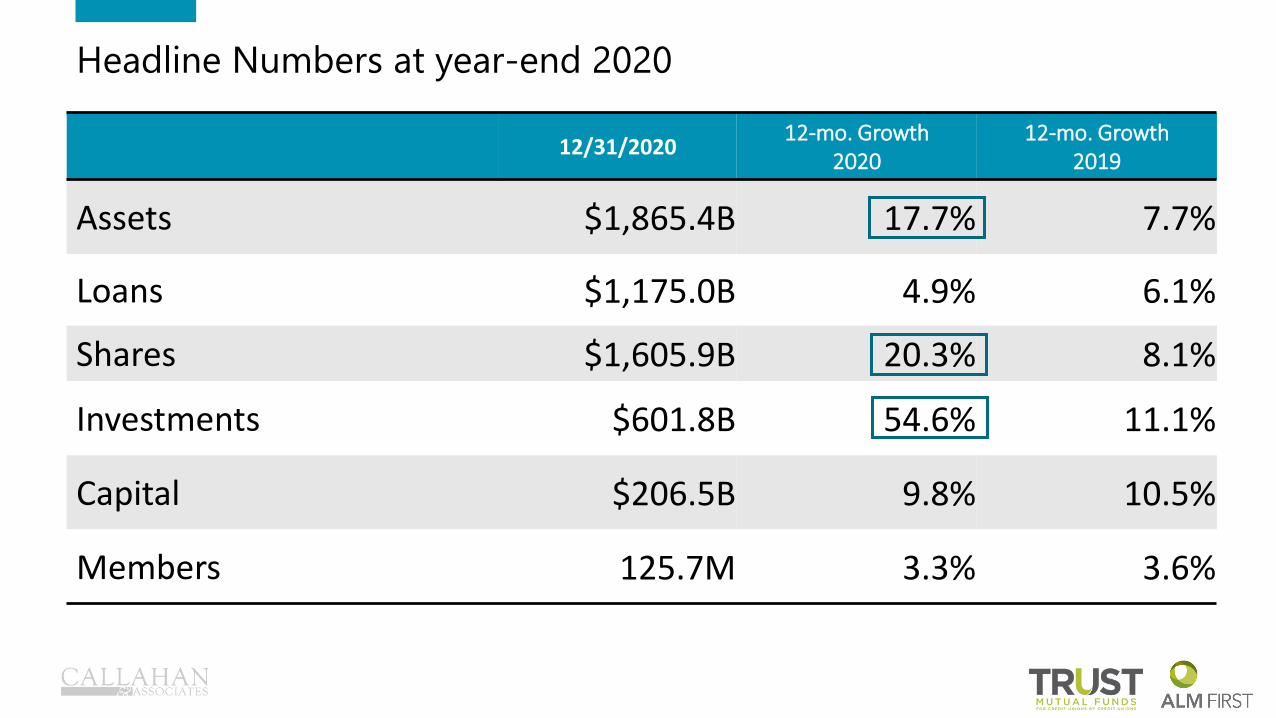
12/31/202012-mo. Growth
202012-mo. Growth
2019
Assets $1,865.4B 17.7% 7.7%
Loans $1,175.0B 4.9% 6.1%
Shares $1,605.9B 20.3% 8.1%
Investments $601.8B 54.6% 11.1%
Capital $206.5B 9.8% 10.5%
Members 125.7M 3.3% 3.6%
Headline Numbers at year-end 2020

$66.0$78.0 $66.6
$61.0
$100.6
$270.5
-$10
$40
$90
$140
$190
$240
$290
$340
2015 2016 2017 2018 2019 2020
Bill
ion
s12-Mo. Change in Share Balances by Product
Data as of 12.31.20
Share Certs IRA/Keogh MMA Share Drafts Reg. Sh. & Dep.
Core deposits drive the saving surge, growing nearly 6 times 2019’s results

Mortgage lending drives origination growth, though consumer lending remains credit unions’ primary business
$125.8 $143.3 $140.8 $139.2 $179.0
$291.6$26.4 $29.0 $33.8 $35.8$35.7
$34.8
$18.8 $21.2 $21.4 $22.2$24.7
$30.0$239.7 $267.8 $289.6 $313.9
$311.5
$321.7$411
$461 $486 $511
$551
$678
$0
$100
$200
$300
$400
$500
$600
$700
$800
2015 2016 2017 2018 2019 2020
Bill
ion
s
YTD Loan OriginationsData as of 12.31.20
Consumer Commercial Other Real Estate 1st Mortgages

Credit unions purchase nearly $16.4B in participation loans in 2020 to combat margin compression
$3.1 $3.1
$5.2 $5.0
$0.0
$1.0
$2.0
$3.0
$4.0
$5.0
$6.0
4Q15 2Q16 4Q16 2Q17 4Q17 2Q18 4Q18 2Q19 4Q19 2Q20 4Q20
Bill
ion
s
Quarterly Participation PurchasesData as of 12.31.20

77.4%79.5%
82.5%
85.5%83.9%
73.2%
50.0%
55.0%
60.0%
65.0%
70.0%
75.0%
80.0%
85.0%
90.0%
4Q15 4Q16 4Q17 4Q18 4Q19 4Q20
Loan-to-Share RatioData as of 12.31.20
Rapid deposit growth quickly pushed the loan-to-share ratio lower in 2020
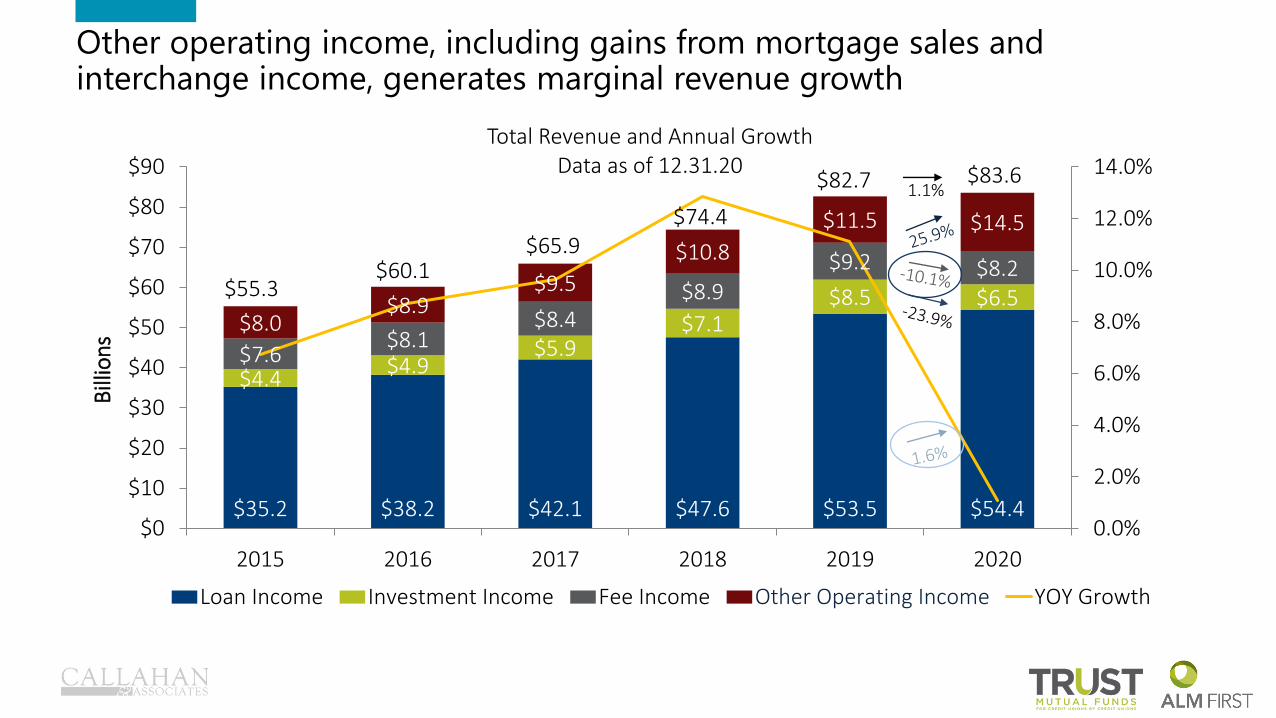
Other operating income, including gains from mortgage sales and interchange income, generates marginal revenue growth
$35.2 $38.2 $42.1 $47.6 $53.5 $54.4
$4.4$4.9
$5.9$7.1
$8.5 $6.5
$7.6$8.1
$8.4$8.9
$9.2 $8.2
$8.0$8.9
$9.5
$10.8
$11.5 $14.5
$55.3$60.1
$65.9$74.4
$82.7 $83.6
0.0%
2.0%
4.0%
6.0%
8.0%
10.0%
12.0%
14.0%
$0
$10
$20
$30
$40
$50
$60
$70
$80
$90
2015 2016 2017 2018 2019 2020
Bill
ion
s
Total Revenue and Annual GrowthData as of 12.31.20
Loan Income Investment Income Fee Income Other Operating Income YOY Growth
1.1%

Credit unions post $8.5 billion in provision for loan losses in 2020, the highest ever
$1.3
$1.8
$1.4$1.6
$2.7
$2.2
$1.4
$0.0
$0.5
$1.0
$1.5
$2.0
$2.5
$3.0
4Q15 2Q16 4Q16 2Q17 4Q17 2Q18 4Q18 2Q19 4Q19 2Q20 4Q20
Bill
ion
s
Quarterly Provision for Loan & Lease LossesData as of 12.31.20

1.23% 1.35%
0.59% 0.80%
4.64% 4.74%
0.0%
1.0%
2.0%
3.0%
4.0%
5.0%
6.0%
4Q15 2Q16 4Q16 2Q17 4Q17 2Q18 4Q18 2Q19 4Q19 2Q20 4Q20
Yield on Investments Cost of Funds Yield on Loans
Yield AnalysisData as of 12.31.20
Returns decline across the balance sheet following spring rate cuts

$257 $262 $265 $264 $267 $282 $317 $341 $358
$94 $133 $122 $117 $123
$165
$217 $212
$243
-0.6%
19.4%
8.9%
-5.0%
0.0%
5.0%
10.0%
15.0%
20.0%
25.0%
$0
$100
$200
$300
$400
$500
$600
$700
4Q18 1Q19 2Q19 3Q19 4Q19 1Q20 2Q20 3Q20 4Q20
Bill
ion
s
Total Investments & Cash and Quarterly GrowthData as of 12.31.20
Investments Cash Quarterly Invest & Cash Growth
Cash rises 15.0% in final three months+98% in 2020
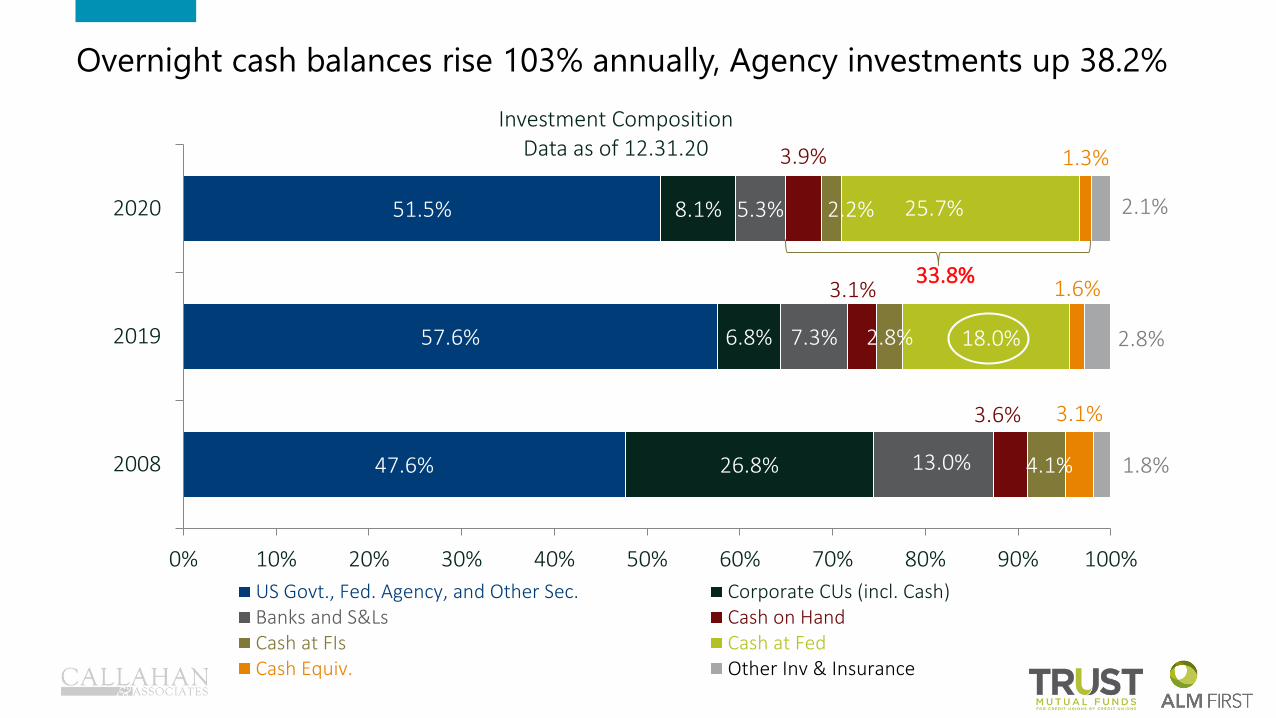
47.6%
57.6%
51.5%
26.8%
6.8%
8.1%
13.0%
7.3%
5.3%
3.6%
3.1%
3.9%
4.1%
2.8%
2.2%
3.1%
1.6%
1.3%
1.8%
2.8%
2.1%
2008
2019
2020
0% 10% 20% 30% 40% 50% 60% 70% 80% 90% 100%
Investment CompositionData as of 12.31.20
US Govt., Fed. Agency, and Other Sec. Corporate CUs (incl. Cash)Banks and S&Ls Cash on HandCash at FIs Cash at FedCash Equiv. Other Inv & Insurance
25.7%
33.8%
Overnight cash balances rise 103% annually, Agency investments up 38.2%
18.0%

55.9%
52.3%
57.2%
26.5%
23.9%
19.1%
11.8%
14.3%
12.5%
4.4%
8.1%
9.0%
1.5%
1.5%
2.2%
0% 10% 20% 30% 40% 50% 60% 70% 80% 90% 100%
2008
2019
2020
Investment Maturities Over TimeData as of 12.31.20
Less than 1 Yr 1-3 Years 3-5 Years 5-10 Years > 10 Years
76.3%
76.2%
82.4%
Portfolios lengthen from 3Q20 – weighted average life increases to 1.86 years

TCU Portfolios
Progress Report
Jason HaleyChief Investment OfficerALM First Financial Advisors
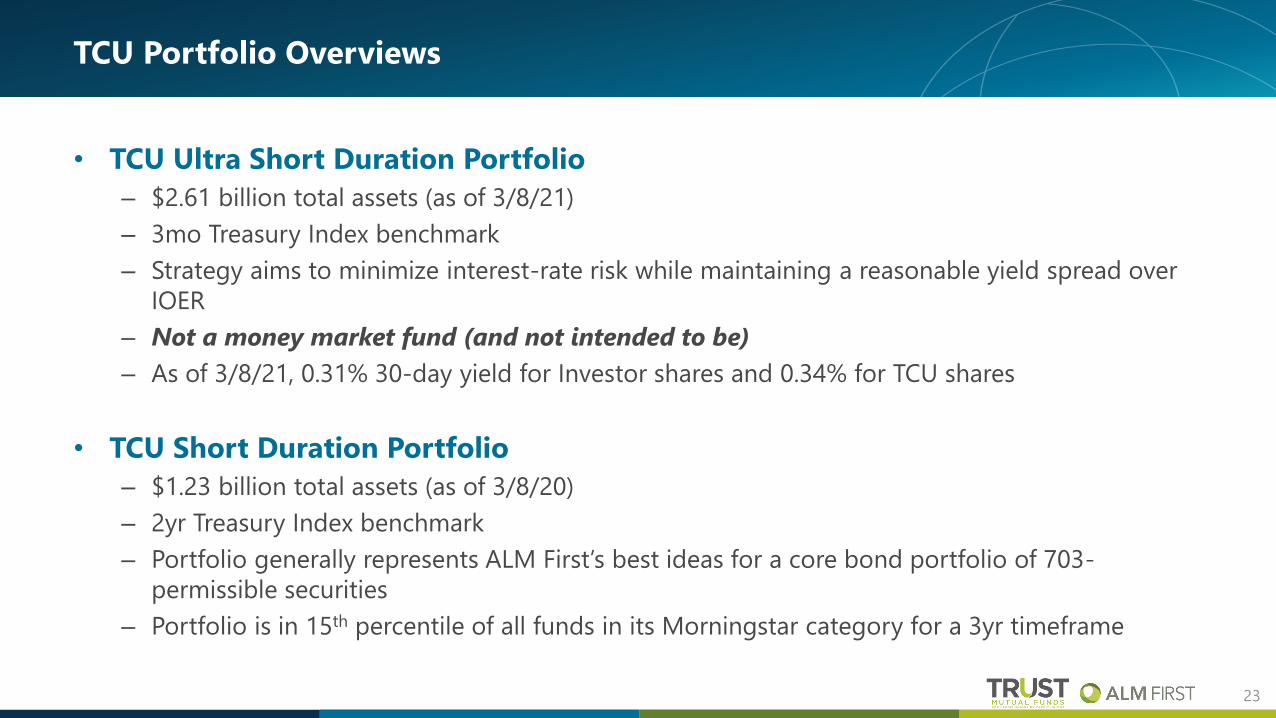
TCU Portfolio Overviews
• TCU Ultra Short Duration Portfolio
– $2.61 billion total assets (as of 3/8/21)
– 3mo Treasury Index benchmark
– Strategy aims to minimize interest-rate risk while maintaining a reasonable yield spread over
IOER
– Not a money market fund (and not intended to be)
– As of 3/8/21, 0.31% 30-day yield for Investor shares and 0.34% for TCU shares
• TCU Short Duration Portfolio
– $1.23 billion total assets (as of 3/8/20)
– 2yr Treasury Index benchmark
– Portfolio generally represents ALM First’s best ideas for a core bond portfolio of 703-
permissible securities
– Portfolio is in 15th percentile of all funds in its Morningstar category for a 3yr timeframe
23
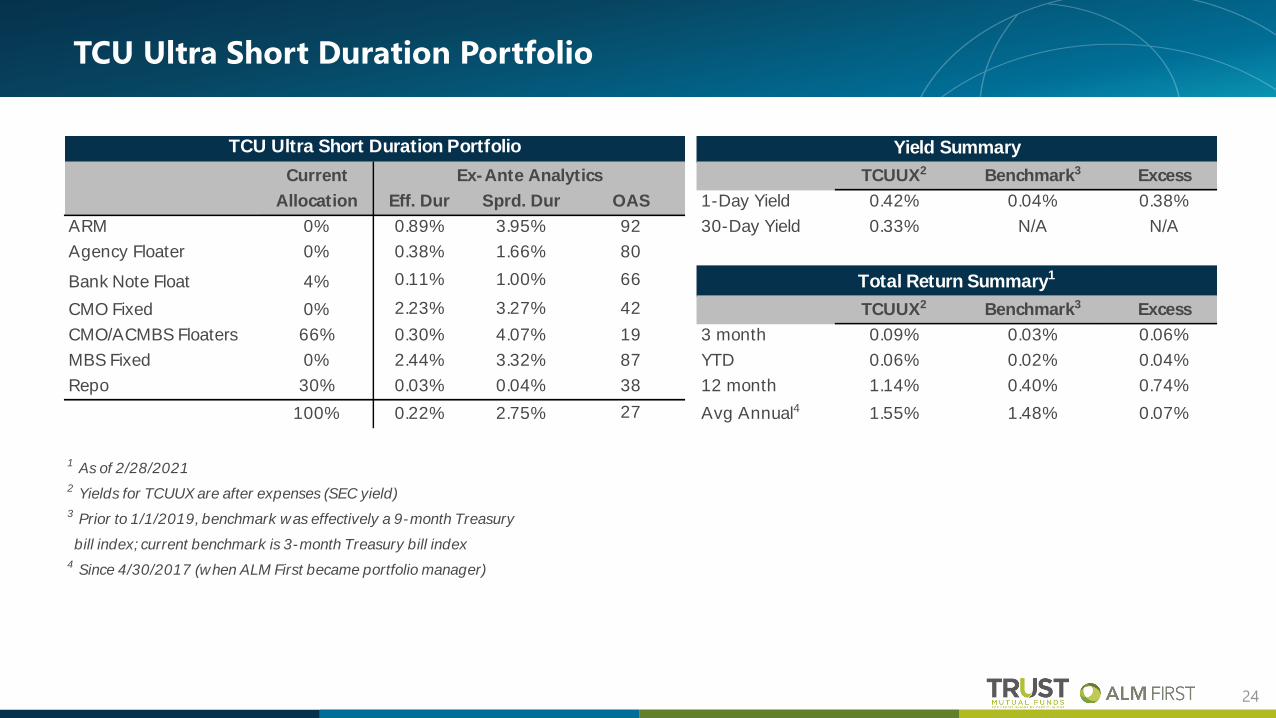
TCU Ultra Short Duration Portfolio
24
Current TCUUX2 Benchmark3 Excess
Allocation Eff. Dur Sprd. Dur OAS 1-Day Yield 0.42% 0.04% 0.38%
ARM 0% 0.89% 3.95% 92 30-Day Yield 0.33% N/A N/A
Agency Floater 0% 0.38% 1.66% 80
Bank Note Float 4% 0.11% 1.00% 66
CMO Fixed 0% 2.23% 3.27% 42 TCUUX2 Benchmark3 Excess
CMO/ACMBS Floaters 66% 0.30% 4.07% 19 3 month 0.09% 0.03% 0.06%
MBS Fixed 0% 2.44% 3.32% 87 YTD 0.06% 0.02% 0.04%
Repo 30% 0.03% 0.04% 38 12 month 1.14% 0.40% 0.74%
100% 0.22% 2.75% 27 Avg Annual4 1.55% 1.48% 0.07%
1 As of 2/28/2021
2 Yields for TCUUX are after expenses (SEC yield)
3 Prior to 1/1/2019, benchmark was effectively a 9-month Treasury
bill index; current benchmark is 3-month Treasury bill index
4 Since 4/30/2017 (when ALM First became portfolio manager)
Ex-Ante Analytics
Total Return Summary1
TCU Ultra Short Duration Portfolio Yield Summary
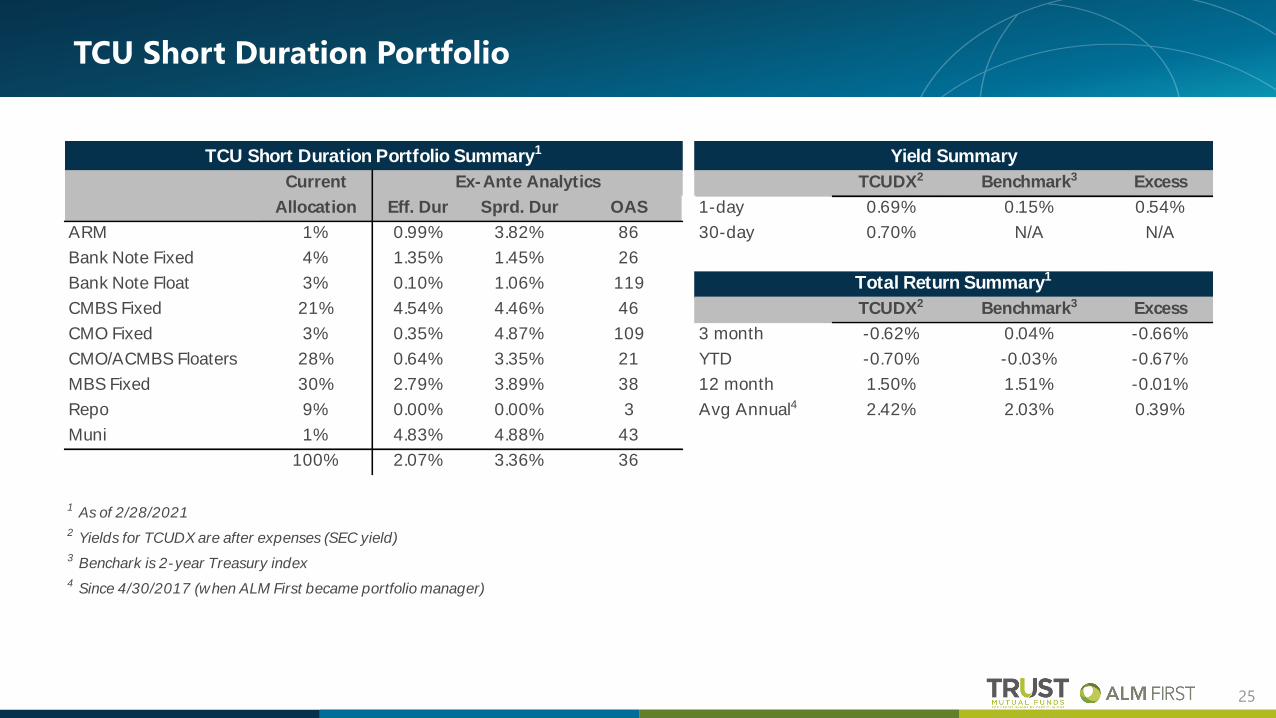
TCU Short Duration Portfolio
25
Current TCUDX2 Benchmark3 Excess
Allocation Eff. Dur Sprd. Dur OAS 1-day 0.69% 0.15% 0.54%
ARM 1% 0.99% 3.82% 86 30-day 0.70% N/A N/A
Bank Note Fixed 4% 1.35% 1.45% 26
Bank Note Float 3% 0.10% 1.06% 119
CMBS Fixed 21% 4.54% 4.46% 46 TCUDX2 Benchmark3 Excess
CMO Fixed 3% 0.35% 4.87% 109 3 month -0.62% 0.04% -0.66%
CMO/ACMBS Floaters 28% 0.64% 3.35% 21 YTD -0.70% -0.03% -0.67%
MBS Fixed 30% 2.79% 3.89% 38 12 month 1.50% 1.51% -0.01%
Repo 9% 0.00% 0.00% 3 Avg Annual4 2.42% 2.03% 0.39%
Muni 1% 4.83% 4.88% 43
100% 2.07% 3.36% 36
1 As of 2/28/2021
2 Yields for TCUDX are after expenses (SEC yield)
3 Benchark is 2-year Treasury index
4 Since 4/30/2017 (when ALM First became portfolio manager)
TCU Short Duration Portfolio Summary1 Yield Summary
Ex-Ante Analytics
Total Return Summary1
Closing Thoughts
• February curve steepening was sharp and sudden
– Ultra-short portfolio has minimal sensitivity to rate changes
– In order to generate reasonable long-run returns, the short duration portfolio will maintain a
diversified mix of 703-permissible assets and actively manage non-rate related risks
• Fund balances, liquidity, etc.
– TCU balances continue to grow amid flood of liquidity from monetary and fiscal stimulus
• 14 new investors and +$800M since Jan. 1
– Portfolios are well positioned from a liquidity management perspective to manage volatile
inflows/outflows
26

Questions & Discussion
• Returns are gross of fees, unaudited, and estimated using the Modified Dietz method. ALM First does not have complete discretionary trading authority over each account reflected in the performance discussed herein. Some clients had investment results materially different from those portrayed in this document. These data were compiled from client portfolios that consistently accepted ALM First investment advice.
• Investments in securities are valued based on quotations obtained from independent pricing services or independent dealers. With respect to securities where independent valuations are not available on the valuation date, or where a valuation is not deemed reasonable by ALM First, ALM First will determine the fair value. The fair valuation process requires judgment and estimation by ALM First. Although ALM First uses its best judgment in estimating the fair value of investments, there are inherent limitations in any estimation technique. Future events may affect the estimates of fair value and the effect of such events on the estimates of fair value, including the ultimate liquidation of investments, could be material to returns. The production and delivery of this material to any investor/recipient does not establish any express or implied duty or obligation between ALM First and any such investor/recipient, including (without limitation) any duty to determine fair market value or update such material.
• Moreover, this report was prepared as of the date indicated herein. No representation or warranty is made by ALM First that any of the returns or financial metrics detailed herein will be achieved in the future, as past performance is not a reliable indicator of future results. Certain assumptions may have been made in preparing this material which have resulted in the returns and financial metrics detailed herein. Changes to the assumptions may have a material impact on any returns or financial metrics herein. Furthermore, ALM First gives no representation, warranty or undertaking, or accepts any liability, as to the accuracy or completeness of the information contained this report.
• This report was prepared for informational purposes only without regard to any particular user’s investment objectives, financial situation, or means, and ALM First is not soliciting any action based upon it. This material is not intended as, nor should it be construed in any way as accounting, tax, legal, or investment advice including within the meaning of Section 975 of the Dodd-Frank Wall Street Reform and Consumer Protection Act. Certain transactions give rise to substantial risk and are not suitable for all investors. The strategies discussed herein can have volatile performance and may employ leverage. Moreover, investment advisory fees and expenses may offset trading gains.
• This report was prepared by ALM First Financial Advisors, LLC. The hereto mentioned report contains information which is confidential and may also be privileged. It is for the exclusive use of the intended recipient(s). If you are not the intended recipient(s), please note that any distribution, copying, or use of this report or the information contained herein is strictly prohibited. If you have received this report in error, please notify the sender immediately and then destroy any copies of it. ALM First neither owes nor accepts any duty or responsibility to the unauthorized reader. ALM First shall not be liable in respect of any loss, damage, or expense of whatsoever nature which is caused by any use the unauthorized reader may choose to make of this report, or which is otherwise a result of gaining access to the report by the unauthorized reader.
• The Trust for Credit Unions (TCU) is a family of institutional mutual funds offered exclusively to credit unions. Callahan Financial Services is a wholly-owned subsidiary of Callahan & Associates and is the distributor of the TCU mutual funds. ALM First Financial Advisors, LLC is the advisor of the TCU mutual funds. Please read the prospectus carefully before investing or sending money. Units of the Trust portfolios are not endorsed by, insured by, or otherwise supported by the U.S. Government, the NCUSIF, the NCUA or any other governmental agency. An investment in the portfolios involves risk including possible loss of principal.
Disclaimer

THANK YOU
FOR WATCHING