Embed Size (px)
Citation preview
Managing educational success: school principals’
managerial behaviors and students’ test scores
Tommaso Agasistia
Politecnico di Milano, School of Management
Department of Management, Economics and Industrial Engineering
Patrizia Falzettib
INVALSI
Istituto Nazionale per la Valutazione del Sistema Educativo di Istruzione e Formazione
Mara Soncina
Politecnico di Milano, School of Management
Department of Management, Economics and Industrial Engineering
Abstract.
This research investigates the impact of managerial practices implemented by Italian school principals on students’ outcomes. We use micro-data provided by the National Evaluation Committee for Education (INVALSI) for 2013/14 school year. Employing an educational production function, we regress a set of student and school’s characteristics, enriched by information from a questionnaire filled by school principals to estimate student’s score at grade 8 (last year of junior secondary school), also taking into account student’s prior achievement (at grade 6 – first year of junior secondary school). We find that the model well fits for student’s characteristics, while managerial practices tend to have positive effects, but low statistical significance. Stronger associations between management variables and test scores are detected for low-SES schools.
Keywords.
Policy analysis, school principals, school managerial practices, Value Added Model
JEL codes.
I21, I28
A preliminary version of this paper has been presented at the 2016 AEFP (Association for Education Finance and Policy)
in Denver, USA, at the 2015 EGPA (European Group for Public Administration) Annual Conference in Toulouse, France,
and at the 2015 AiIG (Associazione Italiana Ingegneria Gestionale) Annual Conference in Vicenza, Italy. This research
has been supported by Politecnico di Milano through the Grant FARB (Fondo d’Ateneo per la Ricerca di Base). All
eventual errors are our only responsibility.
This version is a draft [15/06/2016]
2
1. Motivation and objectives
Measuring the impact of management quality in the public sector is a key purpose for policymakers;
in this perspective, education is an interesting sub-sector due to the high number of outcome measures
to be considered (for example, test scores and non-cognitive skills acquired by students). The
challenging aspect of measuring management quality in schools is to identify the mostly ‘indirect’
effect that principals, as school managers, have on educational outcomes. Indeed, principals’ effect
on learning is mainly mediated by the activities realized in the classroom and by teachers, whose role
in influencing students’ achievement has been broadly investigated through “value-added” measures
(e. g. Hanushek & Rivkin, 2010). Far less empirical evidence exists on the impact of principals,
though their role as decision-makers place them at the top of school organization, with high potential
effect on school productivity through their managerial attitudes and practices (Leithwood & Jantzi,
1999; Quinn, 2002; Waters et al., 2003). These considerations are particularly relevant in the Italian
context, where principals’ freedom of choice is highly influenced by the institutional environment
and strict regulation, especially when considering human resource management. Moreover, a major
reform approved by the national government in Spring 2015 has increased, starting from September
2015, the autonomy of principals in several managerial areas. In this sense, a performance
measurement system, which aims at evaluating the performance of schools, should adequately
consider the role of school principals as key actors who drive (part of) institutions’ results.
The aim of this paper is to explain how school management is correlated with Italian students’
achievement, once that individual and school characteristics have been taken into account. In order
to pursue this objective, we use data from the Italian National Evaluation Committee for Education
(hereafter INVALSI) about standardized tests that assess both mathematical and reading skills. The
test is conducted at national level, but every year a random group of schools is chosen to be part of
the National Sample (NS), the reference group where the assessment is monitored by external
inspectors. From 2013/14 school year, NS school principals are also provided with a detailed
questionnaire about their career and their activities in practical school management. Thanks to these
additional information, it is possible to conduct an empirical evaluation of the relationship between
managerial practices and students’ test score when students attend the last year of junior secondary
school (grade 8), also taking into proper account their previous test scores at grade 6 – thus, we test
the potential association between principals’ managerial practices and the value ‘added’ to students’
results. Also, the questionnaire involves data about personal features of the principal such as his/her
experience, degree etc. – and previous contributions revealed how these characteristics can have some
role in explaining part of test scores’ variation. Precisely, our research question is:
This version is a draft [15/06/2016]
3
Is there a relationship between the managerial practices implemented by the school principal, his/her
characteristics and the students’ results in a standardized test, once that individual-level, contextual
and school factors are considered?
As a preview of the results, we find a high relevance of student-level characteristics, while the
relationship with the managerial practices and principals’ features is not clear and not statistically
significant. From our viewpoint, one possible explanation is in the structure of the questionnaire,
which fails to catch the most relevant aspects of managerial practices. One of our main suggestions
is to revise the questionnaire for future editions, taking into account the emerging framework for
properly measuring management practices in education (see for instance Bloom et al., 2015, and Di
Liberto et al., 2015).
The research presented here is particularly innovative in the Italian context, where little evidence
exists about the impact of managerial skills in education, though institutional reforms are leading
towards a strengthening of school principal’s leadership role. In this paper we move a first step, by
describing managerial practices and their diffusion in different schools and geographical areas within
the country. As we specify in the next sections, we focus the attention on the role of managerial
practices (what principals do) and not on managerial skills (what principals are able to do).
The remainder of the paper is organized as follows. Section 2 presents an introduction about the role
of school principals in Italy, section 3 contains the state-of-art on this topic and the theoretical
framework. Section 4 describes the dataset and the methodology implemented, whose results are
discussed in section 5. Finally, conclusions and policy implications are presented in section 6.
2. Research context
It is worth to provide an outline of the role and the selection process of school principals, as well as
of the main changes the recent school reform is going to introduce. In 2013/14 school year (the period
our data refer to) there are 8,644 public schools across Italy, divided into 41,483 school complexes,
and 13,847 private schools, 72% of which are kindergartens. In the same year, public school
principals are 8,053, a smaller number than the amount of public schools because of the decision to
aggregate small schools (in mountain areas or small islands) under the management of the same
school principal that becomes the “regent” of a group of schools. This procedure of aggregation can
pose a problem of complexity of school management as well as a matter of time dedicated to the
single school by the school principal, with possible repercussions on the quality of managerial
practices implemented in the school.
The selection process reflects the centralization of the Italian educational system. It is based on an
open competitive exam announced by the National School of Administration, the governmental
This version is a draft [15/06/2016]
4
authority in charge of selecting and training public officials and managers. All the teachers with a
Master degree who are permanent members of the teaching staff since at least 5 years are allowed to
participate. The fact that school principals are only chosen among teachers ensures the possession of
instructional competencies but not of managerial skills, which are tested at a second stage of the
selection process and enhanced during the training. In fact, the competitive exam consists of four
stages that include: (1) a pre-selective test (only if applicants are at least five times more than open
positions) with multiple choice questions on cultural and professional contents, (2) a theoretical
written composition about the national education system or about financial, technical and
administrative management of schools, (3) a practical case study on school management and (4) a
final multidisciplinary interview. The examination board is appointed by the Regional School
Authority (RSA), which is also in charge of releasing the final ranking. In fact, until the last
competitive exam, applicants can only apply for positions in a specific Region, and the RSA allocates
principals to the various schools in a specific Region on the basis of the score obtained in the exam
and additional professional titles. Starting from this year, applicants will be allowed to apply in more
than one Region, but the allocation process remains unvaried (i.e. under the responsibility of the
Regional Authority). A last step entails a 4-months course and a 2-months training in a school, with
a final exam.
At the time data used in this research are collected (2013/14 school year), the role of school principal
deals with several tasks, such as (i) being responsible for the management of financial and
instrumental resources of the school, which are mainly provided by the national government; (ii)
being the legal representative of the school; (iii) promoting interventions in order to ensure the quality
of pedagogical processes and the partnership with cultural, professional and economical resources of
the local area; (iv) being in charge of the leadership and coordination of human resource, in
accordance with governmental constraints (that do not allow to hire of fire teaching staff, who is hired
and allocated through a centralized process based on a competitive exam and directly paid by the
Ministry of Treasury).
Schools’ autonomy, firstly introduced by the law 275/99 and then reinforced by the law 165/01,
represents the first step to increase school principal’s decision power moving some responsibilities
from the central government to schools, even though within specific limitations. First, instructional
autonomy is limited within the definition of the Formative Offer Plan, specific for each school and
yearly approved by the Board of Teachers. It explicates curricular and extra-curricular projects as
well as organizational guidelines. Second, organizational autonomy is restricted to the possibility of
adapting the school calendar and scheduling the number of lesson hours per week (in accordance with
the yearly amount of hours defined nationally). Third, autonomy of research is defined as the
This version is a draft [15/06/2016]
5
possibility to test and develop instructional tools and models. Finally, financial autonomy just
involves the use of money allocated by the central government (that therefore is a small part of the
total school budget), giving priority to instructional and formative activities.
The school reform approved in July this year (law 107/2015) points at empowering the role of the
school principal in Italy, especially in the field of human resource management. Starting from
2016/17 school year (2015/16 will be a transition year) school principals will be allowed to choose
teachers to hire from territorial registers formed by networks of schools, also taking into account
teachers’ applications. Teachers will be reconfirmed every three years, in accordance with the
Formative Offer Plan of the school (that will become triennial instead of yearly). In addition, teachers
will be evaluated (with criteria that are not still clear) in order to receive a yearly bonus decided by
the school principal under parameters defined by an internal Evaluation Committee composed by
teachers, parents and (in secondary schools) students. A similar process will also involve school
principals, who will be evaluated upon students’ improvement, managerial and organizational
competencies and the valorization of human resource abilities. Moreover, every school principal will
have the possibility to be assisted in organizational activities by a group of teachers, with a maximum
of the 10% of the teaching staff.
In the light of the upcoming changes, the discussion concerning how measuring the managerial
practices implemented in the school and how ensuring a close relationship between autonomy and
evaluation has become a central debate in Italy. Our paper provides an example of the use of
administrative data in a framework aimed at investigating the relationship between such managerial
practices and students’ performance: relying on the current tool for measuring school managerial
practices (a questionnaire developed by INVALSI), we suggest the possible advantages and threats
of this tool, as well as pathways for fostering the diffusion of these analysis in the next future.
3. Prior research
From the academic literature, two different streams about school management’s effects on students
achievement has been selected. The first stream deals with measuring the quantitative impact of
principals on students’ scores (in other words, how the students’ test scores vary when they are
exposed to different school principals). Though analytical approaches to this research question are
varied, results tend to confirm the relevance that principal’s action has on different measures of
students’ outcome. The methodological challenge consists in the ability to disentangle the principal
effect from the effect of other school-level factors that are outside the principal’s control or from the
current effect of decisions taken before the principal’s tenure. Four interesting research move a step
in this direction, also taking advantage of recently available large datasets with information about
This version is a draft [15/06/2016]
6
principals’ features. Branch et al. (2012) measure principal’s value-added on Texas (USA) students’
test scores between 1995 and 2001, finding that a principal ranked one standard deviation above the
average of the quality distribution leads to an annual gain of 0.05 standard deviation above average
for all the students in the school. As a measure of principal leadership, they focus on teachers’
turnover, under the assumption that highly rated principals are more successful in retaining highly
effective teachers. They actually find that teacher turnover is highest in schools with least effective
principals. The magnitude of principal effect is similar in most studies, though it is highly dependent
on the model implemented. Dhuey & Smith (2014), using data from North Carolina (USA), find an
effect of 0.13 standard deviation in math and 0.10 in reading, raising to 0.18 and 0.14 when
considering school fixed effect because of the negative relationship between principal and school
effect. This is explained as a compensatory matching, where best principals are intentionally allocated
to less effective schools. Nevertheless, they state that most of the principal effect is actually the result
of a match effect between principal and school, stressing the importance of the interaction with the
staff and the student body, that could take time to happen. For this reason, the approach used by Coelli
& Green (2012) on data from British Columbia is particularly interesting for the use of dynamic
principal effect that considers a cumulative effect of the principal over time, relaxing the assumption
of time-invariant effects. Under the assumption that the principal leads the school long enough to
completely realize his/her effect (time needed also depends on the effectiveness of the prior principal),
a one standard deviation difference in effectiveness distribution makes English exam scores raise by
2.5% and graduation rates by 2.6%. Grissom et al. (2015) employ three alternative models in order
to catch the impact of principal performance on student achievement in Miami-Dade County (USA)
public schools between 2003/04 and 2010/11 school year. They observe a high variation of principal
effects depending on the model: from 0.18 standard deviations in math and 0.12 in reading, to 0.05
in math and 0.03 in reading for the same principals.
From a modelling point of view, the way through which school leadership influences students’ output
has been investigated by several studies attempting to provide a framework of this phenomenon.
Leithwood et al. (2004, p. 19) try to formalize the effect that leadership has on learning: “School
leadership from both formal and informal sources helps to shape the nature of school conditions such
as goals, culture, structure and classroom conditions – the content of instruction, the size of
classrooms, the forms of pedagogy used by teachers, etc. A wide array of factors, including those in
the school and classroom, help shape teachers’ sense of professional community. School and
classroom conditions, teachers’ professional community and student/family background conditions
are directly responsible for the learning of students”. In this vein, Leithwood & Levin (2005) carry
out a review in the UK context, suggesting a division of these variables between mediators and
This version is a draft [15/06/2016]
7
moderators of leadership effect. Mediator factors entail school and classroom conditions, teachers
individual skills and professional community factors. Moderator variables involve pupils’
background and personal characteristics, teachers’ individual characteristics and values, leaders’
gender and hierarchical level, organizational structure and context.
A second stream of the literature focuses on the characteristics of the educational leader, in particular
describing the managerial practices implemented in the school with the aim of defining archetypes of
managerial attitudes and activities. In this direction, Leithwood and Jantzi (1999) conduct a survey
in 94 Canadian elementary schools looking for the effect of a particular leadership style, the so-called
“transformational leadership”, on student engagement. In accordance with the literature on this topic,
they define transformational leadership the ability of the school head to “foster capacity development
and higher levels of personal commitment of organizational goals” p. 453. Through a structural
equation modeling approach, they show how the school principal can play a role in this process,
operating on organizational conditions at school level, once that a mediating variable – family
educational culture – is taken into account. On the other hand, Quinn (2002) investigates the role of
school principal as “instructional leader” in 24 project schools in Missouri (USA), measuring
principal’s impact on instructional practice of teachers and on student engagement. He finds a
powerful correlational relationship between the dimensions of instructional leadership (which involve
the role of principal as resource provider, instructional resource, communicator and visible presence)
and student engagement. This final output is considered as totally mediated by the role of teachers,
who can influence student commitment with their instructional practice. Waters et al. (2003)
implement a meta-analysis on 70 studies about the effect of leadership on achievement, classifying
21 principal leadership responsibilities and asserting that a standard deviation increase in all 21 areas
corresponds to a gain in average student achievement of 10 percentage points from the mean. Among
the several types of school leadership that the literature identifies (e.g. Bush & Glover, 2002, provide
an overview), instructional leadership is described as the most related to students’ outcome.
According to Robinson et al. (2008), who provide a meta-analysis on 27 studies between 1978 and
2006, the effect of instructional leadership on student achievement is three to four times that of
transformational leadership, defined as the most studied approach to leadership after that the
instructional perspective came into the scene.
We move from this design integrating the role of the school principal in the economic framework
concerning the determinants of student achievement, which relies upon the concept of “educational
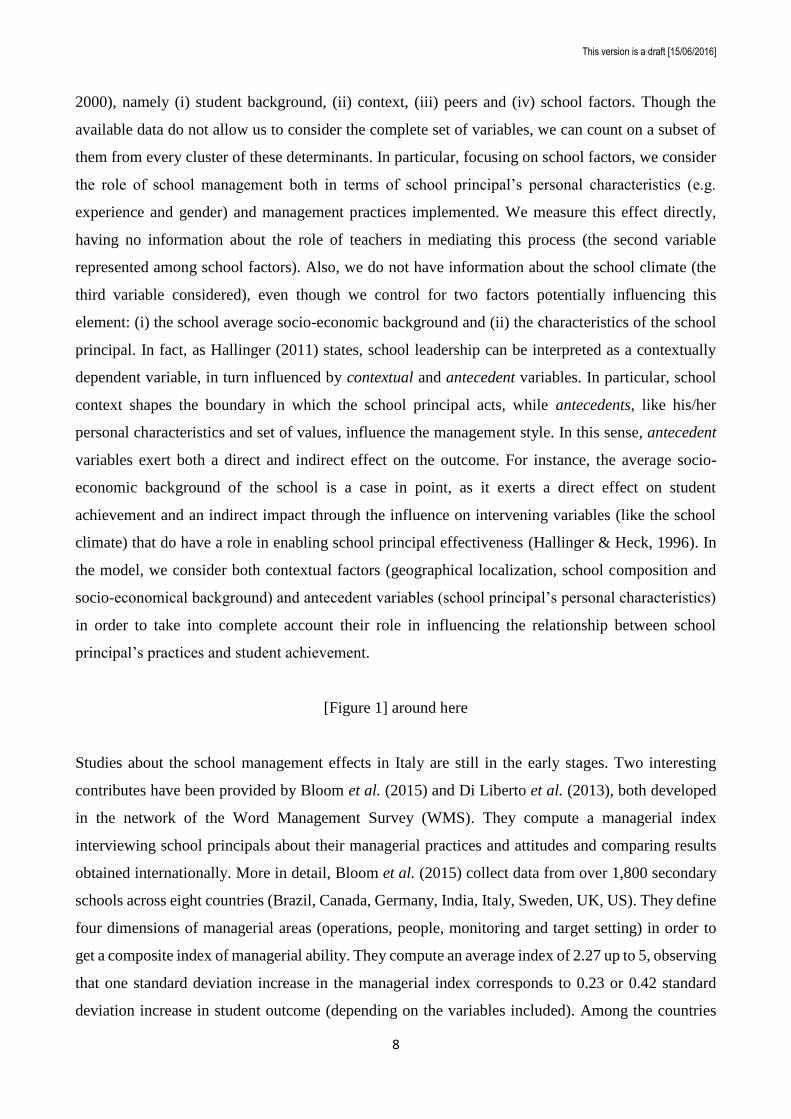
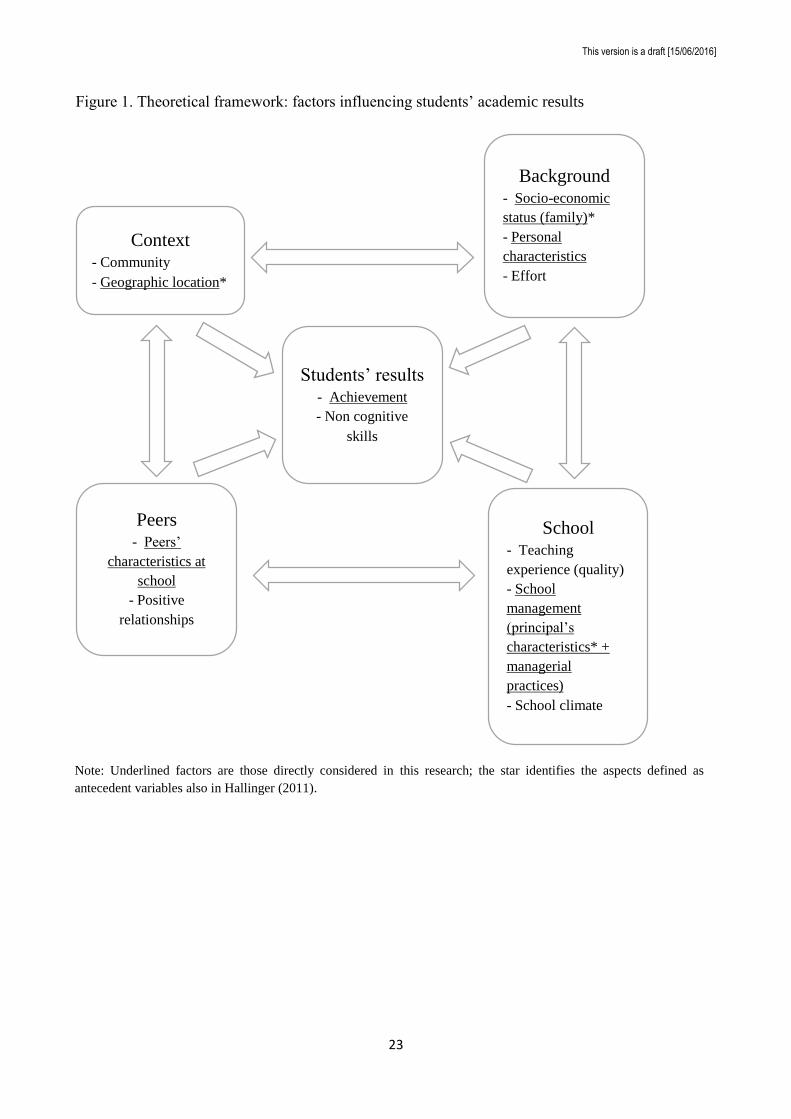
production function” (EPF) (e.g. Hanushek & Woessman, 2011). Figure 1 presents the clusters of
variables interacting and influencing students’ results according to the academic literature in the
economics of education field (e.g. van Ewijk & Sleegers, 2010; Rasbash et al., 2010; Vignoles et al.,
This version is a draft [15/06/2016]
8
2000), namely (i) student background, (ii) context, (iii) peers and (iv) school factors. Though the
available data do not allow us to consider the complete set of variables, we can count on a subset of
them from every cluster of these determinants. In particular, focusing on school factors, we consider
the role of school management both in terms of school principal’s personal characteristics (e.g.
experience and gender) and management practices implemented. We measure this effect directly,
having no information about the role of teachers in mediating this process (the second variable
represented among school factors). Also, we do not have information about the school climate (the
third variable considered), even though we control for two factors potentially influencing this
element: (i) the school average socio-economic background and (ii) the characteristics of the school
principal. In fact, as Hallinger (2011) states, school leadership can be interpreted as a contextually
dependent variable, in turn influenced by contextual and antecedent variables. In particular, school
context shapes the boundary in which the school principal acts, while antecedents, like his/her
personal characteristics and set of values, influence the management style. In this sense, antecedent
variables exert both a direct and indirect effect on the outcome. For instance, the average socio-
economic background of the school is a case in point, as it exerts a direct effect on student
achievement and an indirect impact through the influence on intervening variables (like the school
climate) that do have a role in enabling school principal effectiveness (Hallinger & Heck, 1996). In
the model, we consider both contextual factors (geographical localization, school composition and
socio-economical background) and antecedent variables (school principal’s personal characteristics)
in order to take into complete account their role in influencing the relationship between school
principal’s practices and student achievement.
[Figure 1] around here
Studies about the school management effects in Italy are still in the early stages. Two interesting
contributes have been provided by Bloom et al. (2015) and Di Liberto et al. (2013), both developed
in the network of the Word Management Survey (WMS). They compute a managerial index
interviewing school principals about their managerial practices and attitudes and comparing results
obtained internationally. More in detail, Bloom et al. (2015) collect data from over 1,800 secondary
schools across eight countries (Brazil, Canada, Germany, India, Italy, Sweden, UK, US). They define
four dimensions of managerial areas (operations, people, monitoring and target setting) in order to
get a composite index of managerial ability. They compute an average index of 2.27 up to 5, observing
that one standard deviation increase in the managerial index corresponds to 0.23 or 0.42 standard
deviation increase in student outcome (depending on the variables included). Among the countries
This version is a draft [15/06/2016]
9
observed, Italy is far below the average, with a value of 2.1 (behind UK, Sweden, Canada, US and
Germany) which suggests a lack of adequate managerial skills of Italian school principals. Similar
results are obtained by Di Liberto et al. (2015) who interview 338 secondary school principals in Italy
comparing results with those collected from the same network in Canada, Germany, Sweden, UK and
US. They compute an average managerial index of Italian principals of 2.01 up to 5, the lowest among
the countries analyzed. Moreover, observing the distribution of the index, they highlight a pronounced
asymmetry towards lower values with respect to the distributions of other countries. They also try to
investigate if this gap is due to higher institutional constraints that Italian principals have to face,
finding that this is not the case. Indeed, the lowest score appears to be caused by a lack of managerial
competences among school principals.
Our work extends the existent literature about Italian school principals, by investigating the
association of school principal’s managerial practices with students’ outcome. In this sense, our
research differs from those using a school/principal fixed effect to measure this impact, as we do not
aim at catching the overall effect of the school head, but the influence of what he or she does, which
entails the specific managerial practices implemented. Moreover, we measure this effect using data
collected through an administrative process and not a specifically developed survey with research
purposes. Thus, this is a first attempt to systematically collect these kinds of administrative data in
the Italian context, and to explore the potential institutional use of results.
4. Research design
4.1 The dataset
The original dataset has been provided by the INVALSI, which yearly assesses the competencies of
Italian students in both reading and mathematics. Tests are taken at given grades (2, 5, 6 – suppressed
since 2013/14 school year – 8 and 10) and at national level, though a representative random sample
of schools is selected every year to be part of the National Sample (NS), where tests are monitored
by external evaluators. In this paper, we have information about test results taken by the National
Sample in 2013/14 school year at grade 8, which is composed by 28,145 students across 1,414
schools. We are also provided with information about test scores of the same cohort of students two
years before, when they attended grade 6: this is an innovative element per se, given that usually
INVALSI databases are analyzed as single cross-sections. Such characteristic of the dataset allows
the formulation of a value-added model (VAM), where we can control for prior achievement (e.g.
Todd & Wolpin, 2007). The fact that make this dataset brand new is the availability of a set of
additional information from a questionnaire filled by school principals (introduced from 2013/14
school year), concerning their career and their activities in practical school management. For this
This version is a draft [15/06/2016]
10
reason, our final dataset is the result of a three-steps merger that involve (i) results from tests assessing
mathematical and reading skills of students at grade 8 (2013/14 school year, last year of junior
secondary school) (ii) results from tests assessing mathematical and reading skills of the same
students at grade 6 (2011/12 school year, first year of junior secondary school) (iii) school
questionnaire filled by school principals. The building of such an integrated dataset is a substantial
innovation that allows exploring for the first time the role of student and school variable in a value-
added setting, considering simultaneously the role of school management.
Administrative problems related to the merge procedure cause a series of missing data1, so that our
final sample is formed by 8,946 students across 586 schools. In a comparison paper, Masci et al.
(2015) demonstrate that resulting (reduced) sample is representative of the NS.
Our dataset allows a two-level investigation:
at individual-level, we have information about student’s test score at grade 8 and his/her prior
achievement at grade 6, but also about the socio-economic background (measured by an index
for the Economic, Social and Cultural status, ESCS), gender, immigration status and age of
schooling (if the student is early or late-enrolled, that is to say in a different cohort from that
expected for his/her age);
at school-level, we have information about the average socio-economic background, the
proportion of female and immigrant students, the status of private or public school and its
geographical localization (in Northern, Central or Southern Italy).
In addition, we have information about the questionnaire filled by school principals, composed by 32
questions that can be clustered into five main classes:
i. Principal’s attitude towards standardized tests, which entails the opinion about INVALSI
tests and the level of sharing and discussion about the results obtained by the school.
ii. Stakeholder’s engagement in school issues, which refer to the opinion perceived in the school
about INVALSI tests and parents’ involvement in school activities.
iii. Contextual information about the availability of instructional and infrastructural resources and
about the kind of relationships within the school and between the school and external actors.
iv. Personal information about the principal such as gender, age, education, specialization and
experience.
1The main problem of missing data is due to the lack of students’ prior achievement (grade 6) information. This data
should be available for each student through a code that univocally identifies the student, and that has to be transmitted
from the school to INVALSI. This procedure, which allows to trace the student through the years, started in 2010.
Originally, the collection of students’ codes did not happen systematically, so that the loss of information is very high for
the first years (practically, in this first step, 47% of the sample was lost). Moreover, part of the school principals does not
answer the questionnaire, reducing the size of the sample with complete information to the final dimension described in
this paper.
This version is a draft [15/06/2016]
11
v. Managerial practices implemented in the school, such as the decision-making process, the
definition of clear targets for the school, the monitoring of educational activities, the
implementation of the teaching plan and the human resource management.
These two last parts (#4 and #5) of the questionnaire are the main objects of attention in our research.
We are aware of the fact that, when exploring the associations between principal’s characteristics and
practices with student achievement, both of these sets of variables are affected by endogeneity
problems, and so we consider all the results that we will present later as correlational and not as causal
(future research will be devoted to apply IV strategies, when possible, to future editions of the
dataset). In particular, section 4 contains a large set of questions useful to control for the antecedent
variables related to school principal’s characteristics. Section 5 entails two questions with a number
of sub-questions each, for a total amount of 29. We pay particular attention to this set of questions as
they are related to the specific management practices implemented in the school. For each question,
the respondent can choose among four possible answers concerning the level of use of the practice or
agreement with the statement. The range varies from “I never use this practice” (which corresponds
to a value of 1) to “I always use it” (equal to 4) or from “I completely disagree with this statement”
(=1) to “I completely agree” (=4). Across the questionnaire, other questions can be attributed different
values (from 1 to 10, for instance) or be a dummy variable when the answer has two only options
(typically yes or no). As a self-assessment questionnaire, we have to deal with all the possible threats
that this entails, mainly related to the validity of the answers given.
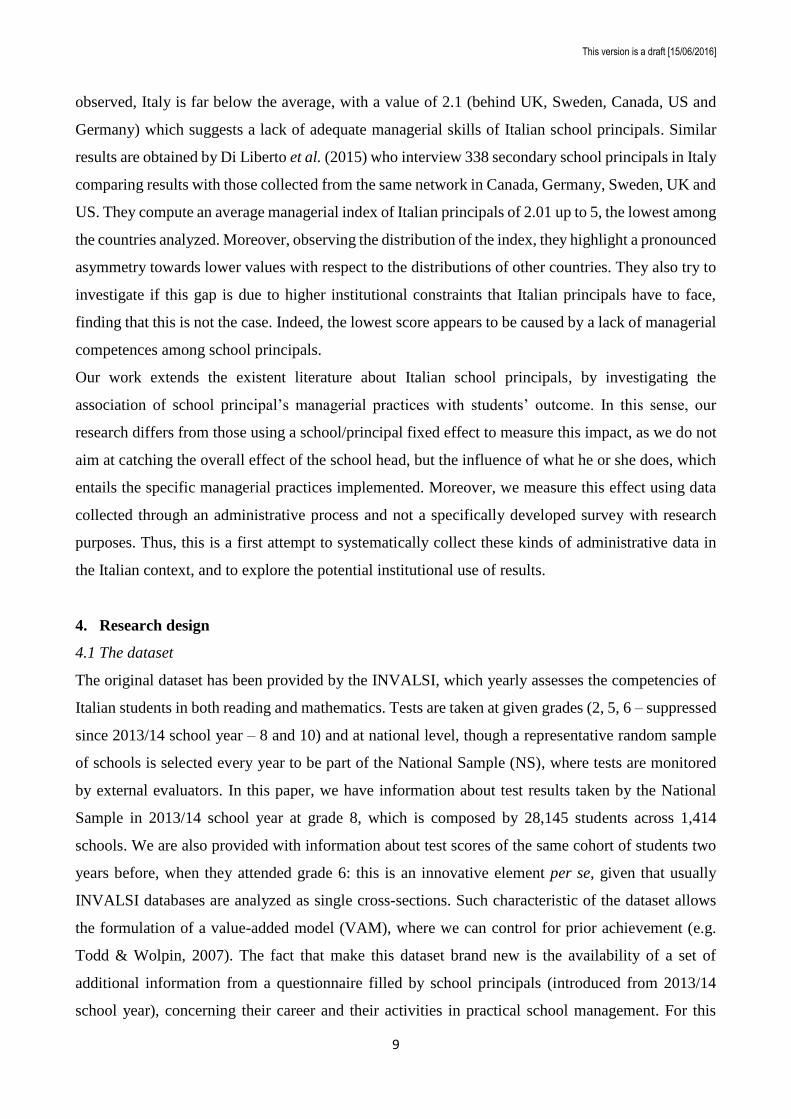
4.2 Descriptive statistics and measurement of managerial practices
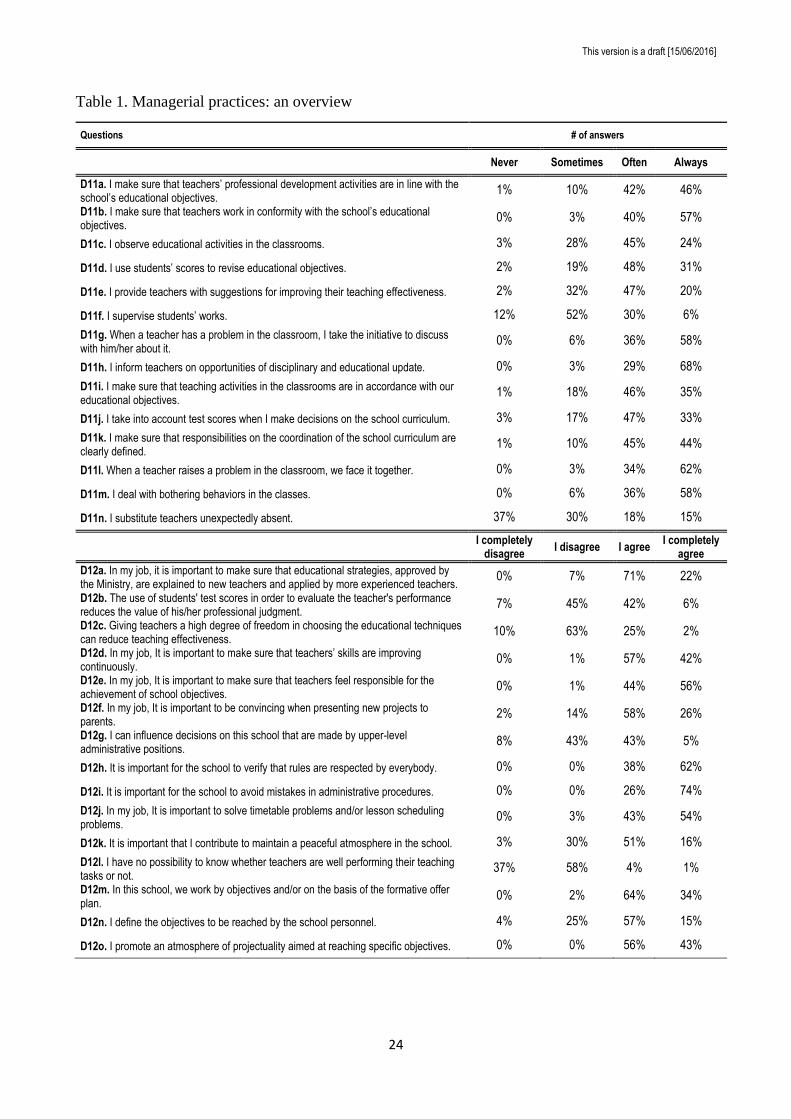
In order to understand how managerial practices and attitudes influence student achievement, we start
describing how school principal answers to the two central questions (in section #5) about
management practices. The first question, D11, is particularly focused on instructional leadership and
asks how often specific practices are implemented; the second, D12, contains a set of statements on
leadership attitudes, asking to express the level of agreement. From table 1, showing the frequency
of answers, we notice an asymmetric distribution that tends to concentrate towards the right tail. In
fact, every question has a positive meaning, so that answering “always” or “I completely agree” is
interpreted positively. The only questions whose meaning cannot be uniquely interpreted are: D12b,
about the use of test scores to evaluate teachers’ performance; D12c, about the degree of instructional
freedom teachers should have; D12l, about the ability of school principal to understand if teachers
are performing well or not.
[Table 1] around here
This version is a draft [15/06/2016]
12
In order to have a measure of the managerial practices implemented by school principals, we follow
the literature on this theme, in particular the framework adopted by Bloom et al. (2015) and Di Liberto
et al. (2015) and developed by the World Management Survey, an organization which aim at
measuring and benchmarking management practices across different sectors (researches have been
conducted in manufacturing, retail, healthcare and education). Their framework relies on the
identification of the 5 main areas of management, characterized according to the sector analyzed. In
the case of education, this entails:
1. Operations that refers to process standardization, use of best practices and school curriculum
decisions.
2. Monitoring that indicates the supervision of school activities and performances and
management of anomalies in school processes.
3. Targets setting that refers to the ability of setting clear goals for the school and managing
resources in order to reach them.
4. People that indicates the ability to guarantee professional development of teachers and to
retain best teachers in the school.
5. Leadership that measures leadership skills and the ability to clearly define roles and
responsibilities in the school.
Following this framework, we classify the questions described above into the 5 clusters of managerial
areas. On a practical side, we decide how the questions better fits into these broad categories. Four of
the questions have been excluded from this part of the analysis as it was not possible to clearly define
a correlation with one of the management dimensions (excluded questions are: D11n, D12b, D12c
and D12l). The result is a set of 25 questions: seven questions refer to operations, four refer to
monitoring, four refer to targets setting, five questions refer to people and five to leadership. This
attempt is innovative because, following our proposal, administrative data can be interpreted in a
managerial framework, so that the questionnaire can be used for investigating the role of managerial
practices as classified in a more standardized way, by means of a simple ex-post reclassification of
original questions.
Every question is formulated so that a low value (with a minimum of 1) means a sporadic use of the
managerial practice, a high value (with a maximum of 4) means a frequent implementation of the
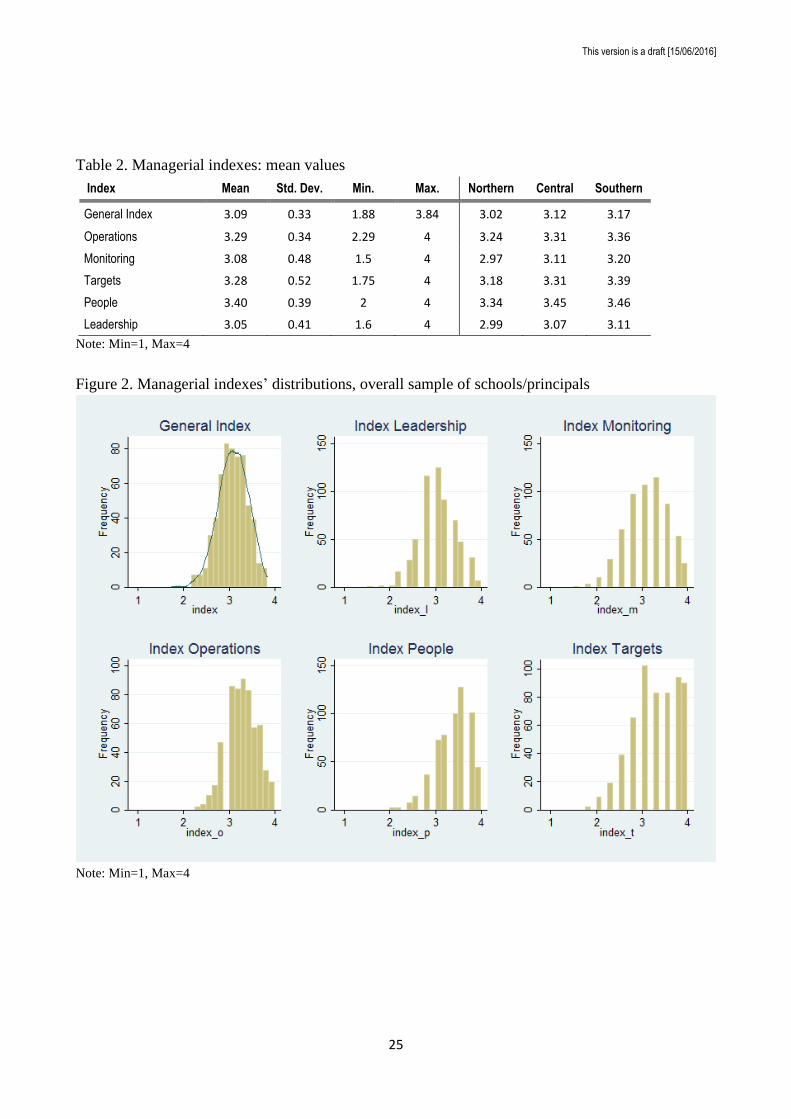
practice. Starting from this point, we compute a general managerial index (MGT), which is the mean
of the 25 questions that compose this part of the analysis, and 5 specific indexes that refer to the
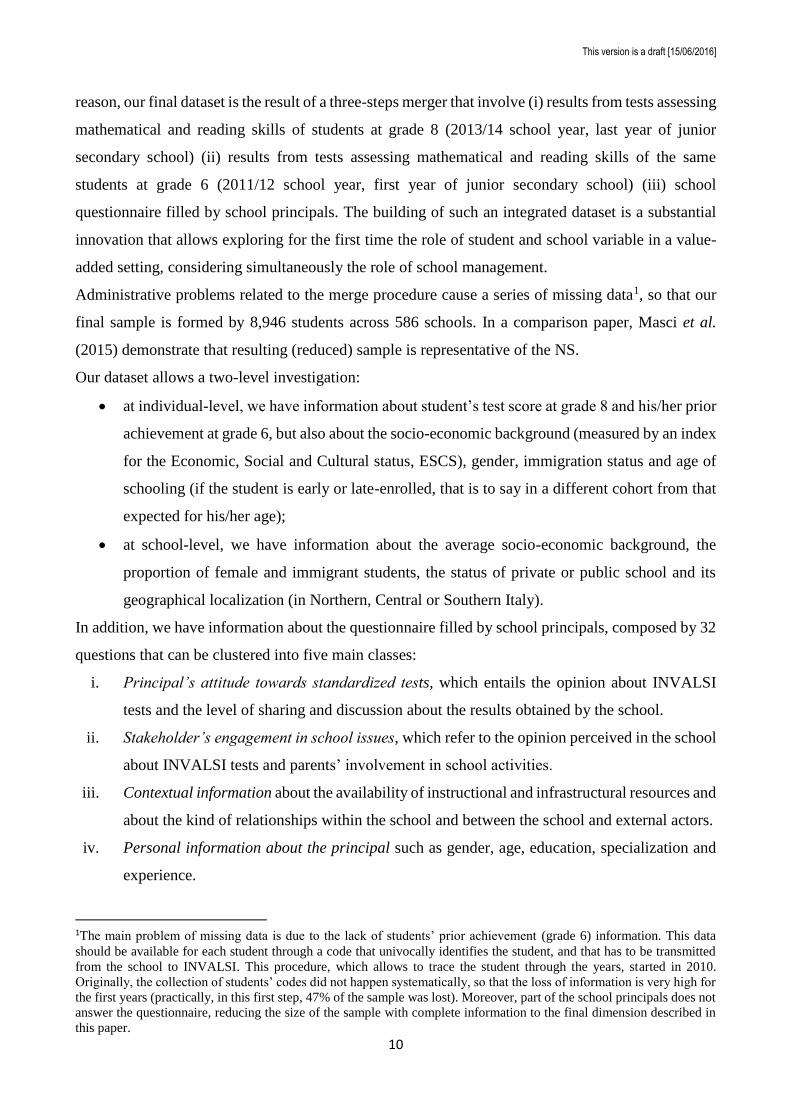
managerial area of interest. Table 2 presents the descriptive statistics about the indexes: the general
index has a mean of 3.09, which corresponds to a frequent use of managerial practices. All other
This version is a draft [15/06/2016]
13
values are in line or higher than the value of the general index, especially with reference to people
management. In fact, this index has a mean of 3.40, which is particularly counterintuitive in the Italian
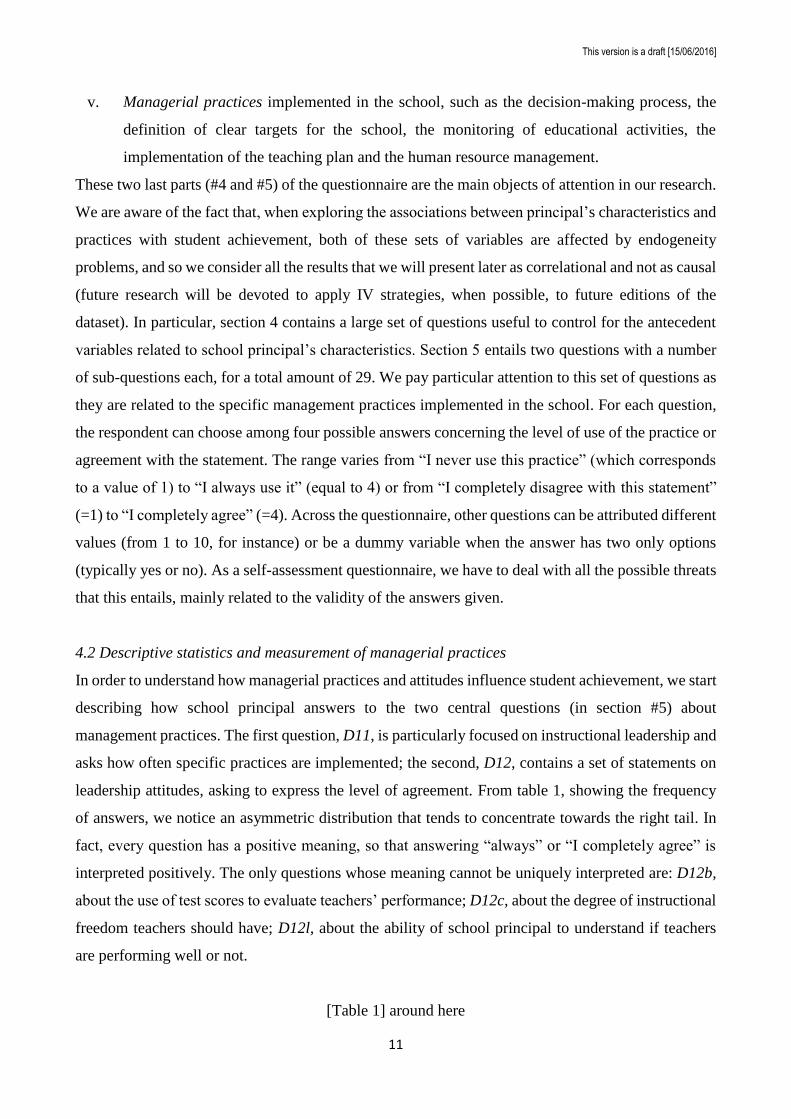
context, where institutional constraints are considered to limit people management practice. The shift
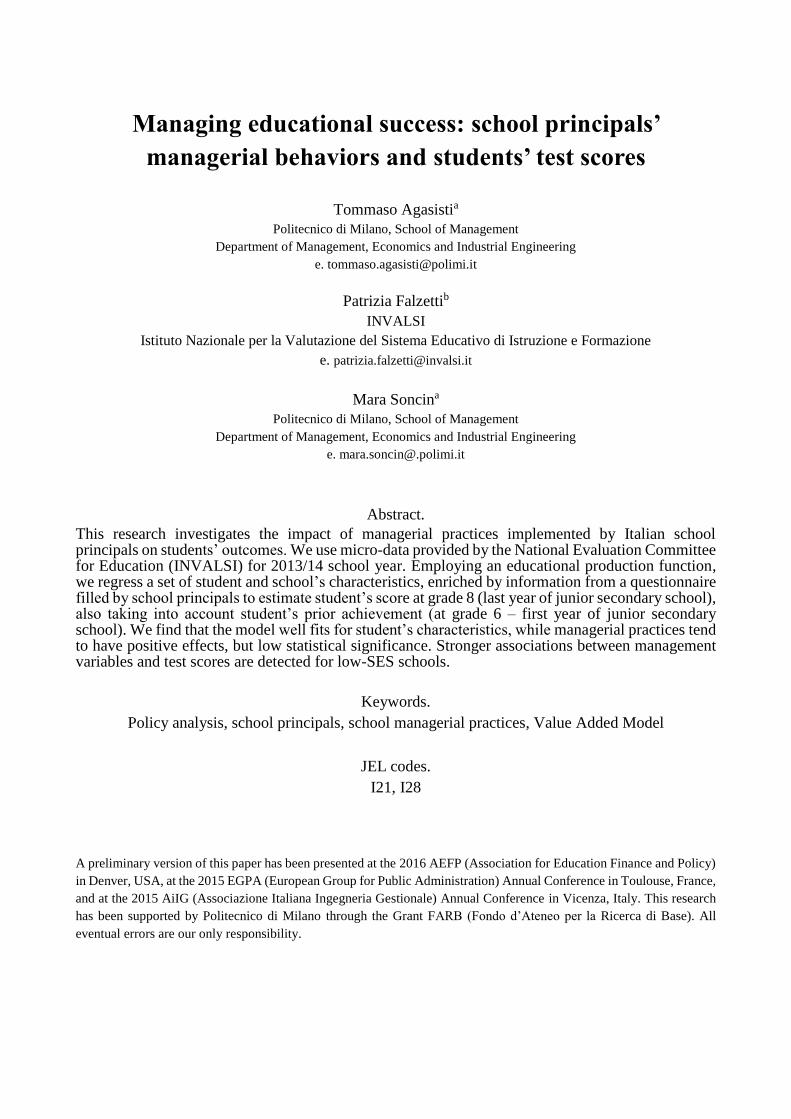
of the mean towards high values of managerial practice also appears from the representation of
indexes distribution (Figure 2). Moreover, observing index values across the three geographical areas
appointed, we notice that principals serving in schools located in the South assert to make a higher
use of managerial practices. This is in contrast with what Di Liberto et al. (2015) find in their research
and can be due to a set of possible factors: (i) the questionnaire is posing the wrong questions, without
catching the key of managerial practices, (ii) the questionnaire is posing different questions from
those of the WMS research, catching different aspects or (iii) it could be the case that self-assessment
questionnaire actually do not provide information that reflect the real implementation of these kind
of practices. While we are not able to investigate these alternative explanations with data at-hand, we
suspect that the questionnaire is not perfectly-suited for the purpose of measuring management
activities. Some results presented later in this paper corroborates this feeling. Also, we try to
investigate if there is a possible correlation between managerial indexes and the average school score.
[Table 2 and Figure 2] around here
4.4 School principal’s characteristics and student achievement
In this section, we take into consideration the individual characteristics of the school principal in
order to study if they correlate with both student achievement and managerial practices implemented.
When exploring simple graphical analysis, we cannot observe any evident pattern, though some
aspects are noteworthy.
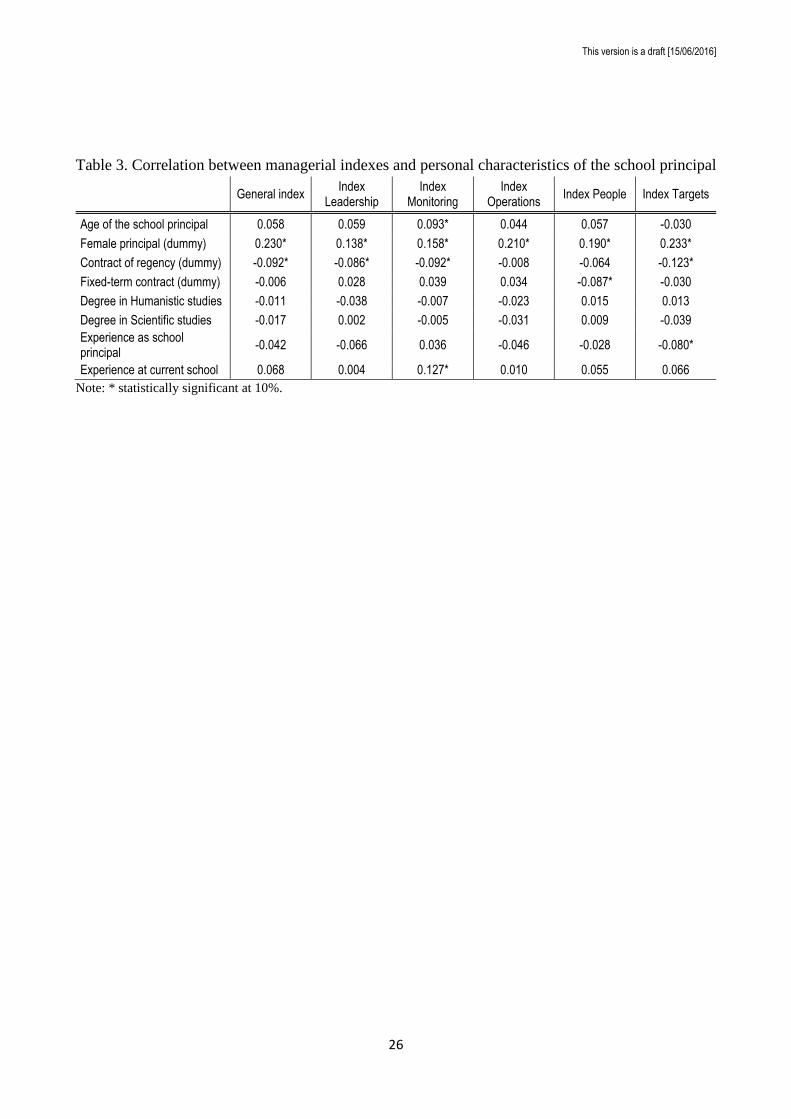
In order to further investigate the relationship between school principal’s characteristics and the use
of managerial practices, Table 3 reports the correlation between these two measures. We use most of
the personal characteristics we are provided with, namely age, gender, type of contract, degree subject
and experience. We do not only consider the correlation with the general managerial index (column
2), but also with the five specific areas (columns 3 to 7), in order to check for the stability of the sign
across managerial areas and also to test whether some particular areas of managerial activities are
more/less associated with principals’ features. In so doing, we find that some characteristics maintain
a positive/negative correlation with all managerial areas. A case in point is the positive correlation
between the indexes and being a female principal, which is the characteristic that also show the
highest magnitude of the correlation and statistical significance. A similar trend is reported for the
age of the school principal, positively related to a more extensive use of managerial practices. Having
This version is a draft [15/06/2016]
14
a contract of regency, through which a principal is in charge of managing more than one schools, has
a negative relationship with the indexes, possibly due to the complexity of being responsible for a
high number of schools that translate into a lower managerial attitude. Finally, we do register a
negative correlation between the number of years as school principal and the use of selected practices,
but the direction of the link reverses when we consider the tenure in the specific school. In this sense,
“learning (management) by doing” is an expertise that seems to happen staying longer in the same
school, not being a principal per se.
[Table 3] around here
4.5 Empirical modelling
In this empirical analysis, we consider an educational production function (EPF) in which the result
obtained by the student at grade 8 is predicted by his/her prior achievement (at grade 6), by a set of
individual characteristics and by a vector of school-level factors, among which managerial practices
play a fundamental role. In detail, we estimate the following regression:
𝑦𝑡(8)𝑖𝑗 = 𝛼0 + 𝛼1𝑦𝑡(6)𝑖𝑗 + 𝛼2𝑋1𝑖𝑗+ 𝛽1𝑋2𝑗
+ 𝜀𝑖𝑗 (1)
where the dependent variable 𝑦𝑡(8)𝑖𝑗 represents the outcome (in reading or mathematics) of the ith
student in the jth school at grade 8 (last year of lower secondary school), 𝑦𝑡(6)𝑖𝑗 refers to the result
obtained by the same ith student at grade 6 (first year of lower secondary school), 𝑋1𝑖𝑗 is a set of
individual-level variables and 𝑋2𝑗 is a set of school-level factors. Standard errors 𝜀𝑖𝑗 are robust and
clustered at school level, allowing for correlation of error terms within clusters. Among school-level
characteristics, represented by the vector 𝑋2𝑗, we employ two groups of characteristics: (i) variables
catching the contextual factors in which the school operates, such as the average socio-economic
background, the proportion of immigrant students or the geographical localization, and (ii)
information from the questionnaire filled by the school principal referring to the managerial practices
implemented in the school. In particular, we exploit information about the use of INVALSI data in
the school and the managerial indexes presented in section 4.3. We then create two alternative models:
a. the first contains student’s characteristics, contextual school’s characteristics and a general
index that summarizes all the managerial practices in one indicator (Model 1);
b. the second presents the same student and school’s characteristics and five specific indexes,
one for each area of management we identified (Model 2).
This version is a draft [15/06/2016]
15
In both models we add questions asking the use of INVALSI data to the set of managerial practices.
Specifically, among the questions referring to the use of INVALSI data, we choose the one reporting
if results from tests have been discussed internally with the Board of Teachers, and the one referring
to the discussion of results with external stakeholders (others than parents).
5. Results
5.1 Baseline results
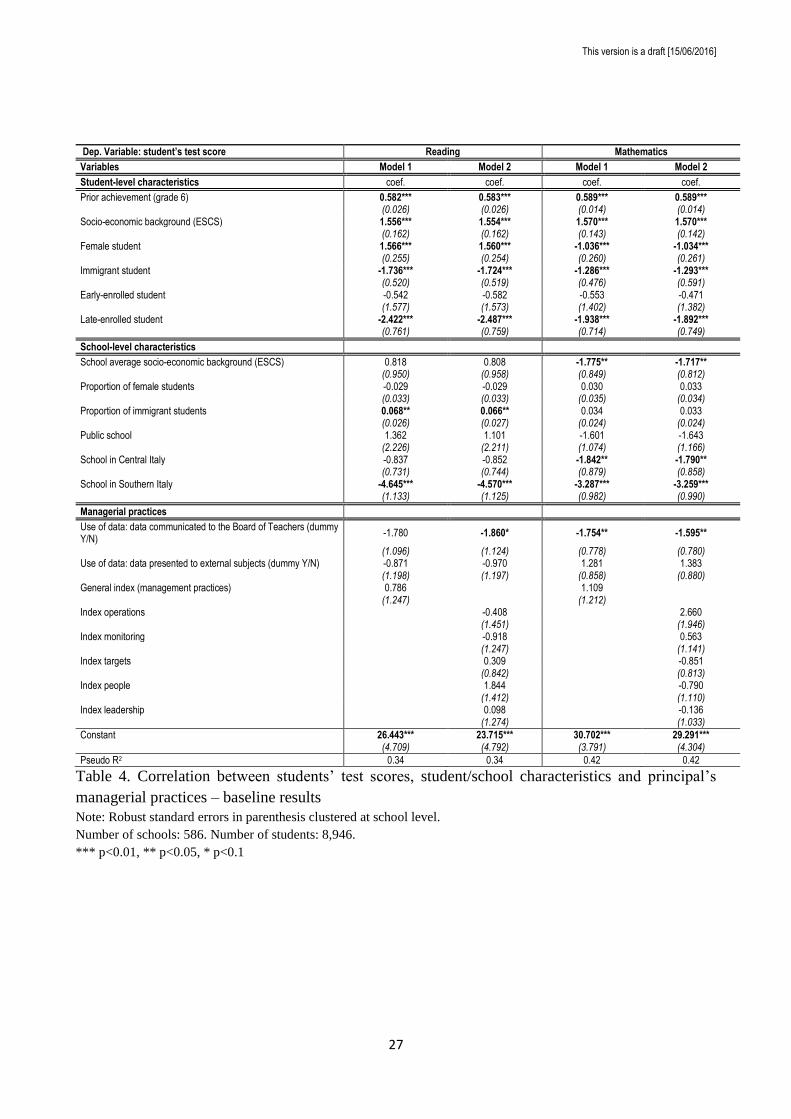
Baseline results from the estimation of equation (1) are presented in Table 4. The first and third
columns contain values from Model 1, which presents the effect of the general index of management
practices for reading and mathematics respectively; the second and fourth columns present values
from model 2, containing the estimates for the effects of the specific indexes of managerial areas. In
both models, variables are categorized at student-level, contextual school-level and managerial
school-level and standard errors are clustered at school-level. The overall variance of students’ test
scores that is explained by the model is higher for mathematics (42%) than for reading (34%).
Individual-level variables show a high degree of statistical significance and coherence with existent
studies about the Italian educational system (e.g. Azzolini et al., 2012, Brunello & Checchi, 2005).
The higher magnitude that the effect of the socio-economic background have when compared to prior
achievement is noteworthy: in determining student’s achievement at grade 8, it weights three times
more than the result that the student obtained at grade 6 (this finding is in line with results obtained
by Agasisti & Falzetti, 2013). Among other factors, being a female student is associated with better
results in reading and with lower results in mathematics. Being an immigrant student is associated
with lower scores in both subjects, but the magnitude of the coefficient is higher in reading than in
mathematics, demonstrating the high difficulty of immigrant students to close the language gap. A
similar result is registered for the variable concerning late-enrolled students, those who entered the
educational system late with respect to the standard age or repeated one or more years of school. This
is often related to the immigrant status, as demonstrated by our sample where 30% of immigrant
students are also late-enrolled. On the contrary, the coefficient reporting the relationship between
achievement and the early-enrolled status (a student who enrolled one year before the standard cohort
age) is not statistically significant, albeit negative.
Among school-level characteristics, we highlight a negative relationship between the students’ scores
in mathematics and the average socio-economic background in the school. On the contrary, this
relationship is positive but not significant when considering the reading score, suggesting that peer-
effect can help students more in reading than in other subjects. Moreover, despite the negative impact
that being an immigrant student has on achievement, the proportion of immigrant students at school
This version is a draft [15/06/2016]
16
is positively related to the score in the reading test, while it is still positive but not significant for
mathematics. Such correlation can reveal a positive effect of a more diverse student population, once
that ESCS is counted for. Attending a public or private school is not associated with statistically
different test scores. Coherently with previous researches, schools in the South obtain (on average)
lower test scores than those in the North, with a magnitude two or three times higher than any other
variable (Sulis & Porcu, 2015; Agasisti & Vittadini, 2012).
Looking at principal-related practices, we firstly consider the use that school principals make of
INVALSI data. Interestingly, we discover that schools where results are discussed more intensively
with teachers have lower scores. Our interpretation is that principals of schools obtaining lower scores
are more inclined to internal discussion than those obtaining good results, with the aim of finding
strategies and actions to improve results (in this sense, it is a “false positive” relationship). On the
contrary, the presentation of school results to external stakeholders do not show any statistical
relevance, suggesting that the discussion about test scores could be more incisive when it takes place
internally. If this is the case, INVALSI data could be interpreted as a beneficial instrument for internal
reflection about the school and its improvement. Observing the general index of managerial practices
(MGT), we notice it has a positive correlation with students’ score, even though without statistical
significance. On the other hand, looking at model 2 that presents coefficients for every specific index,
we observe that indexes’ correlations with the score points towards opposite directions for reading
and mathematics: indexes concerning operations and monitoring of school activities have a negative
correlation with the reading score, but a positive one with mathematics; indexes related to targets
setting, people management and leadership attitudes affect negatively the mathematics score and
positively the reading result. The general aspect about indexes is related to the low level of statistical
significance we observe, so that it looks like the managerial practices we are measuring and the
specific way we do this, do not show any strong relationship with students’ score, and the construct
of the “general management” practices should be better interpreted as unitary.
[Table 4] around here
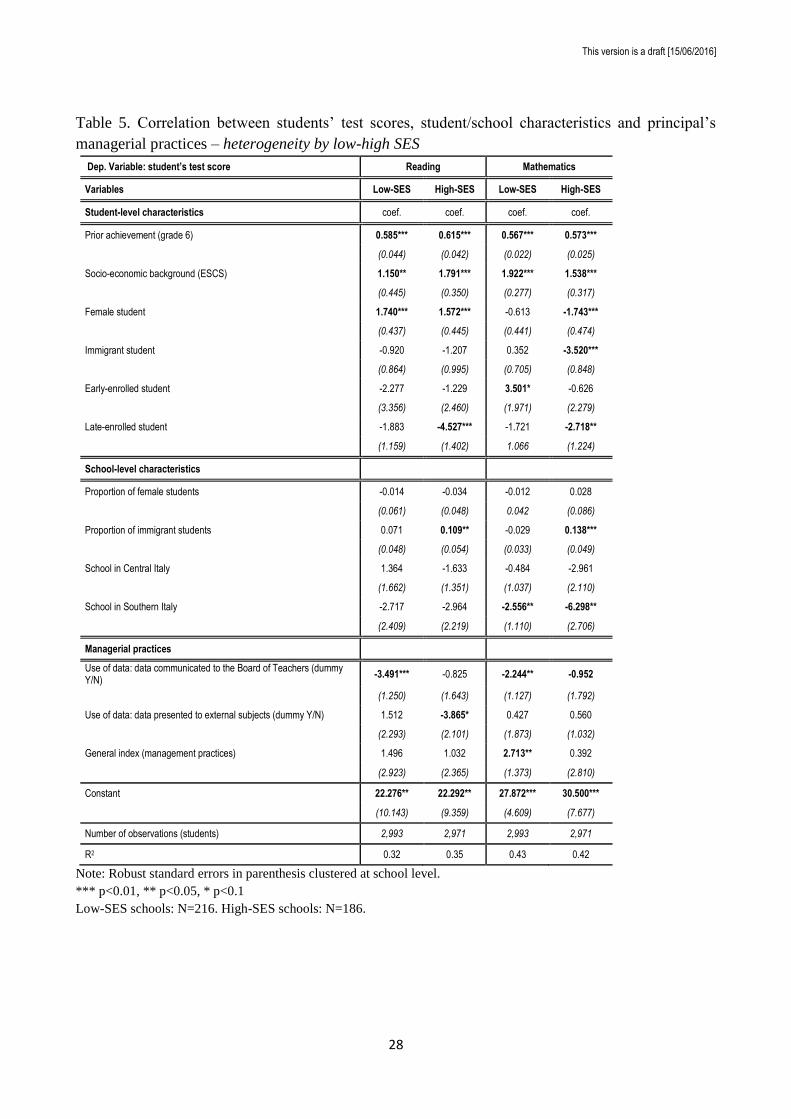
5.2 Heterogeneity of managerial practices’ influence
Moving from baseline results, we aim to investigate the existence of some mediating variables which,
acting both as antecedents and mediators, influence the relationship between student achievement and
managerial practices. In particular, we focus on (i) the role of school conditions, represented by the
average socio-economic status of students, and partially on the role of (ii) contextual condition, in
terms of the geographical localization. The main objective for exploring how the practices vary,
This version is a draft [15/06/2016]
17
according to different mediating variables, deals with the analysis of the contextual heterogeneity of
managerial practices’ effects.
In order to account for the SES, we analyze the distribution of the school average ESCS index and
define low-SES (disadvantaged) schools those in the first tertile of the distribution and high-SES
schools those in the third tertile. Results from the comparison between low and high-SES schools is
reported in Table 5 from which, indeed, we observe coefficients comparable with the baseline model
when considering student-level characteristics. On the contrary, we observe interesting differences
when looking at school characteristics and managerial practices. The positive effect of the proportion
of immigrant students in high-income schools could be due to the different racial composition of
immigrant students attending more affluent schools. When considering the variables that measure the
internal/external discussion of results from standardized test scores, we find again (as in the baseline
model) a negative relationship between scores and the level of internal discussion, particularly
stressed in low-SES schools. This finding corroborates our interpretation that schools where results
are more discussed are those with some critic situation (e.g. low SES and low scores). Finally, the
positive correlation between the managerial index (MGT) and test scores is higher in magnitude for
low-SES schools, and statistically significant when considering the test scores in mathematics. This
is consistent with the idea that school leadership plays a major role where it is needed most, namely
in “troubled” schools (Leithwood et al., 2004). Observing a greater variation of school principal
quality in low-income schools, the previous study by Branch et al. (2012) highlight the beneficial
impact that high quality principals have on this category of schools. In the Italian context, Di Liberto
et al. (2015) test the existence of heterogeneous effects of managerial practices finding a larger impact
for the disadvantaged group of students, which is interpreted as a possible substitution effect between
parental investments and school principal managerial practices. The second hypothesis we test (data
available from the authors) is the existence of geographical heterogeneity in school managerial
practices, given that previous literature highlighted profound differences in students’ achievement
across Italian Regions (Bratti et al., 2007). Precisely, the Table illustrates the model’s results
replicated for students living in Northern, Central and Southern Italy, presenting profound differences
at geographical level.
[Table 5 around here]
6. Managerial implications, policy suggestions and concluding remarks
This paper investigates managerial practices implemented by Italian school principals in order to
understand their relationship with students’ results in standardized tests assessed by INVALSI. Our
This version is a draft [15/06/2016]
18
dataset contains a set of individual-level characteristics and contextual school-factors, enriched by a
questionnaire filled by school principals. Moving from the questionnaire, we focus our attention on
principal’s individual characteristics and on those questions investigating the level of managerial
practices adopted in the school. About this, we select 25 questions and classify them into an existing
framework developed by the World Management Survey (WMS) and adapted to the education field
by Bloom et al. (2015) and Di Liberto et al. (2015). Following their framework, we create a general
managerial index (MGT) and five specific indexes for each area of management: operations,
monitoring, targets setting, people management and leadership.
School principals report a frequent use of managerial practices, as demonstrated by an average value
of the general index of 3.09 up to 4. In order to better understand the relationship between managerial
indexes and students’ scores, we estimate an Educational Production Function (EPF) in which
students’ results at grade 8 (last year of lower secondary school) are explained by a set of individual
characteristics, school factors and managerial indexes. We actually find that attending a school in
Central and especially in Southern Italy has a relevant and negative impact on the score. Individual
characteristics also play an important role in explaining student’s result, consistently with the
international literature on the determinants of students’ achievement. Among managerial practices,
we observe that schools where test results are internally discussed with teachers tend to have lower
scores, suggesting that schools with a higher proportion of low achiever students use internal
discussion as a possible tool for implementing improving plans. The use of managerial practices by
the school principal has a positive correlation with student’s test score, although it is statistically
significant only in low-SES schools, especially in mathematics. This could suggest the fundamental
role played by the school principal in “troubled” or disadvantaged contexts. Though, we need to stress
the fact that this relationship between managerial index (MGT) and test scores is not causal but only
correlational.
Through this study, we aim at understanding how these brand new data on managerial practices in
the Italian context can be adapted to a research design that explores the relationship between
principals' characteristics and activities and students’ results. Given the consistency between our
results at individual level and the existent literature on this topic, we argue that the low level of
statistical significance of the managerial index can be related to the structure of the questionnaire,
which fails to catch the key factors of managerial practices that do have an impact on students’
achievement. Moreover, we do not have any information about the mediating role of teachers and
classrooms in this process, but we can just try to evaluate the direct impact that managerial practices
have on students’ performance. It could also be the case that standardized test scores are not a good
measure of the quality of managerial practices implemented by the school principal (Leithwood &
This version is a draft [15/06/2016]
19
Levin, 2005). According to Hallinger (2011), the common use of standardized tests to measure the
quality of the principal has twisted the meaning of the question: “Do principal make a difference?”.
Anyway, in this context we do not have information sufficient to better investigate this potential
aspect.
Observing results by Bloom et al. (2015) and Di Liberto et al. (2015), it appears that the classification
of the items from the INVALSI questionnaire into an existent framework is not leading to consistent
results when we attempt to measure the same aspects (e. g. people management) through a different
set of questions. Actually, the two major threats we identify in this analysis are related to (i) the
method of assessment and (ii) the structure of the questionnaire itself. With reference to the first issue,
we have to deal with the internal threats of self-assessment instruments. Podsakoff et al. (2003)
present a review of the literature in which they identify several source of biases in behavioral research.
Among them, “social desirability”, related to the tendency to respond to items because of their social
acceptability, could be a probable source of bias in our context. Di Liberto et al. (2015) make a
comparison between results from the WMS questionnaire and OECD PISA 2009 survey that
investigates school principals’ managerial practices. The structure of the OECD survey is very close
to that of the questionnaire used by INVALSI, so it is interesting to observe that they find a negative
relationship between the managerial index and the mathematics test score (in contrast with what they
obtain from the WMS questionnaire). In order to justify this result, they state that probably less
capable school principals are more self-indulgent than others. Moreover, they highlight the fact that
one of the structural differences between the two questionnaires (apart from the method of data
collection) is related to the aspects assessed. In particular, “the frequency with which certain activities
are performed has little to tell about the quality of the managerial practices” (p. 31).
Aiming to stressing the difference between the WMS and the INVALSI questionnaire, we include in
this conclusion a comparison between the two instruments, and a description of some aspects of
management that the INVALSI questionnaire, focused mainly on instructional leadership, does not
test. Apart from the fact that the WMS’ items are open while INVALSI provides multiple-choice
queries, we notice a tendency, in the latter, to formulate the sentences with a positive more than with
a neutral meaning. In this sense, the answers to the questionnaire are probably skewed, making a
highly positive answer more probable. As an example, Table 6 compares some questions posed by
INVALSI and those by the WMS for each area of management. In the section concerning people
management, we compare two questions about the role of the school principal in informing teachers
about professional development opportunities (D11h – Q21A): on the one hand, INVALSI asks for
the frequency with which the principal informs teachers, on the other hand, WMS asks how teachers
know that professional development is a top priority for the school. About operations, INVALSI
This version is a draft [15/06/2016]
20
queries the importance attributed by the school principal to ensuring that educational strategies
approved by the Ministry are implemented by teachers, while the WMS asks how the school principal
ensures that teachers apply new teaching and learning best practices. This is one of the comparisons
that mostly highlights the different interpretation of the managerial role played by the school
principal. In addition, Table 7 presents the aspects that are not covered by the INVALSI
questionnaire, providing a question from the WMS questionnaire as an example for each topic. For
instance, though INVALSI mainly focuses on instructional leadership, there are no items related to
the personalization of the instructional practices or the standardization of the instructional planning
process. Moreover, the “monitoring” area is just related to the supervision of instructional activities,
but there is no mention to performance monitoring, a fundamental aspect of management. In such a
perspective, we show how there would be a wide margin for improvement in the formulation of single
items and for covering a wider range of managerial practices implemented by school principals.
Moving from the possible revision of the questionnaire and in line with the empowerment that the
role of the school principal is experiencing in Italy, we propose that questions about managerial
practices should evaluate all-round managerial practices. An effort in this direction would allow to
benefit of the huge potential amount of data collected through an administrative process, following a
framework that is emerging for its ability to catch the main aspects of managerial practices. More
work will be needed together with practitioners (i.e. school principals) and INVALSI analysts to
define pathways for implementing the questionnaire for school principals.
[Table 6 and 7] around here
This version is a draft [15/06/2016]
21
References
Agasisti, T., & Falzetti, P. (2013). Between-classes sorting within schools and test scores: an
empirical analysis of the Italian junior secondary schools. Working paper, 20/2013. INVALSI.
Agasisti, T., & Vittadini, G. (2012). Regional economic disparities as determinants of students’
achievement in Italy. Research in Applied Economics, 4 (1): 33-54.
Azzolini, D., Schnell, P., & Palmer, J. R. (2012). Educational Achievement Gaps between Immigrant
and Native Students in Two “New Immigration Countries”: Italy and Spain in Comparison. The
ANNALS of the American Academy of Political and Social Science, 643(1), 46-77.
Bloom, N., Lemos, R., Sadun, R., & Van Reenen, J. (2015). Does management matter in schools?
The Economic Journal, 125 (584): 647-674.
Branch, G., F., Hanushek, E., A., & Rivkin S., G. (2012). Estimating the effect of leaders on public
sector productivity: the case of school principals. NBER Working Paper No. 17803. Cambridge,
MA: National Bureau of Economic Research.
Bratti, M., Checchi, D., & Filippin, A. (2007). Geographical Differences in Italian Students'
Mathematical Competencies: Evidence from PISA 2003. Giornale degli Economisti e Annali di
Economia, 66(3), 299-333.
Brunello, G., & Checchi, D. (2005). School quality and family background in Italy. Economics of
Education Review, 24 (5), 563-577.
Bush, T., & Glover, D. (2002). School leadership: Concepts and evidence. Nottingham: National
College for School Leadership.
Coelli, M., & Green, D., A. (2012). Leadership effects: school principals and student outcomes.
Economics of Education Review, 31 (1), 92-109.
Dhuey, E., & Smith, J. (2014). How school principals influence student learning. IZA discussion
paper, No. 7949.
Di Liberto, A., Schivardi, F., & Sulis, G. (2015). Managerial practices and student performance.
Economic Policy, 30 (84), 683-728.
van Ewijk, R., & Sleegers, P. (2010). The effect of peer socioeconomic status on student achievement:
A meta-analysis. Educational Research Review, 5(2), 134-150.
Grissom, J., A., Kalogrides, D., & Loeb, S. (2015). Using student test scores to measure principal
performance. Educational evaluation and policy analysis, 20 (10), 1-26.
Hallinger, P. (2011). A review of three decades of doctoral studies using the principal instructional
management rating scale: a lens on methodological progress in Educational leadership.
Educational Administration Quarterly, 47(2), 271-306.
Hallinger, P., Bickman, L., & Davis, K. (1996). School context, principal leadership and student
reading achievement. The Elementary School Journal, 96(5), 527-549.
Hallinger, P., & Heck, R. (1996). The Principal's Role in School Effectiveness: An Assessment of
Methodological Progress, 1980-1995. In K. Leithwood et al. (eds.) The International Handbook
of Research on Educational Leadership and Administration, 723-784. New York: Kluwer Press.
This version is a draft [15/06/2016]
22
Hanushek, E., A., & Rivkin, S., G. (2010). Generalizations about using value-added measures of
teacher quality. The American Economic Review, 100 (2), 267-271.
Hanushek, E., A. & Woessmann, L. (2011). The Economics of International Differences in
Educational Achievement. In E. A. Hanushek, S. Machin, L. Woessmann (eds) Handbooks in
Economics, Vol. 3, 89-200. The Netherlands: North-Holland.
Leithwood, K., & Jantzi, D. (1999). Transformational school leadership effects: A replication. School
Effectiveness and School Improvement, 10, 451-479.
Leithwood, K., Louis, K., S., Anderson, G., & Wahlstrom, K. (2004). How leadership influences
student learning: A review of research for the learning from Leadership project. New York: The
Wallace Foundation.
Leithwood, K., & Levin, B. (2005). Assessing school leader and Leadership Programme effects on
pupil learning: Conceptual and methodological challenges. Research Report RR662. London:
Department for Education and Skills.
Masci, C., De Witte, K., & Agasisti, T. (2015). The influence of school (district) size and school
managerial practices on students’ performances. Mimeo.
Podsakoff, P., M., MacKenzie, S., B., & Lee, J., Y. (2003). Common method biases in behavioral
research: a critical review of the literature and recommended remedies. Journal of Applied
Psychology, 88(5), 879-903.
Quinn, D., M. (2002). The impact of principal leadership behaviors on instructional practice and
student engagement. Journal of Educational Administration, 40 (5), 447-467.
Rasbash, J., Leckie, G., Pillinger, R., & Jenkins, J. (2010). Children's educational progress:
partitioning family, school and area effects. Journal of the Royal Statistical Society: Series A,
173(3), 657-682.
Rivkin, S., G., Hanushek, E., A., & Kain, J., F. (2005). Teachers, schools and academic achievement.
Econometrica, 73(2), 417-458.
Robinson,V., M., J., Lloyd, C., A., & Rowe, K., J. (2008) The impact of leadership on student
outcomes: an anlysis of the differential effect of leadership types. Educational administration
quarterly, 44 (5), 635-674.
Sulis, I., & Porcu, M. (2015). Assessing divergences in Mathematics and Reading achievement in
Italian primary schools: a proposal of adjusted indicators of school effectiveness. Social indicators
research, 122 (2), 607-634.
Todd, P., E., & Wolpin, K., I. (2007). The production of cognitive achievement in children: home,
school and racial test score gaps. The Journal of Human Capital, 1(1), 91-136.
Vignoles, A., Levacic, R., Walker, J., Machin, S., & Reynolds, D. (2000). The relationship between
resource allocation and pupil attainment: a review. Centre for the Economics of Education.
London: School of Economics and Political Science.
Waters, T., Marzano, R., J., & McNulty, B. (2003). Balanced leadership: what 30 years of research
tells us about the effect of leadership on student achievement. Aurora, CO: Mid-continent
Research for Education and Learning.
This version is a draft [15/06/2016]
23
Figure 1. Theoretical framework: factors influencing students’ academic results
Students’ results - Achievement
- Non cognitive
skills
Context - Community
- Geographic location*
Background - Socio-economic
status (family)*
- Personal
characteristics
- Effort
School - Teaching
experience (quality)
- School
management
(principal’s
characteristics* +
managerial
practices)
- School climate
Peers - Peers’
characteristics at
school
- Positive
relationships
Note: Underlined factors are those directly considered in this research; the star identifies the aspects defined as
antecedent variables also in Hallinger (2011).
This version is a draft [15/06/2016]
24
Table 1. Managerial practices: an overview
Questions # of answers
Never Sometimes Often Always
D11a. I make sure that teachers’ professional development activities are in line with the school’s educational objectives.
1% 10% 42% 46%
D11b. I make sure that teachers work in conformity with the school’s educational objectives.
0% 3% 40% 57%
D11c. I observe educational activities in the classrooms. 3% 28% 45% 24%
D11d. I use students’ scores to revise educational objectives. 2% 19% 48% 31%
D11e. I provide teachers with suggestions for improving their teaching effectiveness. 2% 32% 47% 20%
D11f. I supervise students’ works. 12% 52% 30% 6%
D11g. When a teacher has a problem in the classroom, I take the initiative to discuss with him/her about it.
0% 6% 36% 58%
D11h. I inform teachers on opportunities of disciplinary and educational update. 0% 3% 29% 68%
D11i. I make sure that teaching activities in the classrooms are in accordance with our educational objectives.
1% 18% 46% 35%
D11j. I take into account test scores when I make decisions on the school curriculum. 3% 17% 47% 33%
D11k. I make sure that responsibilities on the coordination of the school curriculum are clearly defined.
1% 10% 45% 44%
D11l. When a teacher raises a problem in the classroom, we face it together. 0% 3% 34% 62%
D11m. I deal with bothering behaviors in the classes. 0% 6% 36% 58%
D11n. I substitute teachers unexpectedly absent. 37% 30% 18% 15%
I completely
disagree I disagree I agree
I completely agree
D12a. In my job, it is important to make sure that educational strategies, approved by the Ministry, are explained to new teachers and applied by more experienced teachers.
0% 7% 71% 22%
D12b. The use of students' test scores in order to evaluate the teacher's performance reduces the value of his/her professional judgment.
7% 45% 42% 6%
D12c. Giving teachers a high degree of freedom in choosing the educational techniques can reduce teaching effectiveness.
10% 63% 25% 2%
D12d. In my job, It is important to make sure that teachers’ skills are improving continuously.
0% 1% 57% 42%
D12e. In my job, It is important to make sure that teachers feel responsible for the achievement of school objectives.
0% 1% 44% 56%
D12f. In my job, It is important to be convincing when presenting new projects to parents.
2% 14% 58% 26%
D12g. I can influence decisions on this school that are made by upper-level administrative positions.
8% 43% 43% 5%
D12h. It is important for the school to verify that rules are respected by everybody. 0% 0% 38% 62%
D12i. It is important for the school to avoid mistakes in administrative procedures. 0% 0% 26% 74%
D12j. In my job, It is important to solve timetable problems and/or lesson scheduling problems.
0% 3% 43% 54%
D12k. It is important that I contribute to maintain a peaceful atmosphere in the school. 3% 30% 51% 16%
D12l. I have no possibility to know whether teachers are well performing their teaching tasks or not.
37% 58% 4% 1%
D12m. In this school, we work by objectives and/or on the basis of the formative offer plan.
0% 2% 64% 34%
D12n. I define the objectives to be reached by the school personnel. 4% 25% 57% 15%
D12o. I promote an atmosphere of projectuality aimed at reaching specific objectives. 0% 0% 56% 43%
This version is a draft [15/06/2016]
25
Table 2. Managerial indexes: mean values
Index Mean Std. Dev. Min. Max. Northern Central Southern
General Index 3.09 0.33 1.88 3.84 3.02 3.12 3.17
Operations 3.29 0.34 2.29 4 3.24 3.31 3.36
Monitoring 3.08 0.48 1.5 4 2.97 3.11 3.20
Targets 3.28 0.52 1.75 4 3.18 3.31 3.39
People 3.40 0.39 2 4 3.34 3.45 3.46
Leadership 3.05 0.41 1.6 4 2.99 3.07 3.11
Note: Min=1, Max=4
Figure 2. Managerial indexes’ distributions, overall sample of schools/principals
Note: Min=1, Max=4
This version is a draft [15/06/2016]
26
Table 3. Correlation between managerial indexes and personal characteristics of the school principal
General index Index
Leadership Index
Monitoring Index
Operations Index People Index Targets
Age of the school principal 0.058 0.059 0.093* 0.044 0.057 -0.030
Female principal (dummy) 0.230* 0.138* 0.158* 0.210* 0.190* 0.233*
Contract of regency (dummy) -0.092* -0.086* -0.092* -0.008 -0.064 -0.123*
Fixed-term contract (dummy) -0.006 0.028 0.039 0.034 -0.087* -0.030
Degree in Humanistic studies -0.011 -0.038 -0.007 -0.023 0.015 0.013
Degree in Scientific studies -0.017 0.002 -0.005 -0.031 0.009 -0.039
Experience as school principal
-0.042 -0.066 0.036 -0.046 -0.028 -0.080*
Experience at current school 0.068 0.004 0.127* 0.010 0.055 0.066
Note: * statistically significant at 10%.
This version is a draft [15/06/2016]
27
Table 4. Correlation between students’ test scores, student/school characteristics and principal’s
managerial practices – baseline results
Note: Robust standard errors in parenthesis clustered at school level.
Number of schools: 586. Number of students: 8,946.
*** p<0.01, ** p<0.05, * p<0.1
Dep. Variable: student’s test score Reading Mathematics
Variables Model 1 Model 2 Model 1 Model 2
Student-level characteristics coef. coef. coef. coef.
Prior achievement (grade 6) 0.582*** 0.583*** 0.589*** 0.589***
(0.026) (0.026) (0.014) (0.014) Socio-economic background (ESCS) 1.556*** 1.554*** 1.570*** 1.570***
(0.162) (0.162) (0.143) (0.142) Female student 1.566*** 1.560*** -1.036*** -1.034*** (0.255) (0.254) (0.260) (0.261) Immigrant student -1.736*** -1.724*** -1.286*** -1.293***
(0.520) (0.519) (0.476) (0.591) Early-enrolled student -0.542 -0.582 -0.553 -0.471 (1.577) (1.573) (1.402) (1.382) Late-enrolled student -2.422*** -2.487*** -1.938*** -1.892*** (0.761) (0.759) (0.714) (0.749)
School-level characteristics
School average socio-economic background (ESCS) 0.818 0.808 -1.775** -1.717** (0.950) (0.958) (0.849) (0.812) Proportion of female students -0.029 -0.029 0.030 0.033 (0.033) (0.033) (0.035) (0.034) Proportion of immigrant students 0.068** 0.066** 0.034 0.033 (0.026) (0.027) (0.024) (0.024) Public school 1.362 1.101 -1.601 -1.643 (2.226) (2.211) (1.074) (1.166) School in Central Italy -0.837 -0.852 -1.842** -1.790** (0.731) (0.744) (0.879) (0.858) School in Southern Italy -4.645*** -4.570*** -3.287*** -3.259*** (1.133) (1.125) (0.982) (0.990)
Managerial practices
Use of data: data communicated to the Board of Teachers (dummy Y/N)
-1.780 -1.860* -1.754** -1.595**
(1.096) (1.124) (0.778) (0.780) Use of data: data presented to external subjects (dummy Y/N) -0.871 -0.970 1.281 1.383 (1.198) (1.197) (0.858) (0.880) General index (management practices) 0.786 1.109 (1.247) (1.212) Index operations -0.408 2.660 (1.451) (1.946) Index monitoring -0.918 0.563 (1.247) (1.141) Index targets 0.309 -0.851 (0.842) (0.813) Index people 1.844 -0.790 (1.412) (1.110) Index leadership 0.098 -0.136 (1.274) (1.033)
Constant 26.443*** 23.715*** 30.702*** 29.291*** (4.709) (4.792) (3.791) (4.304)
Pseudo R2 0.34 0.34 0.42 0.42
This version is a draft [15/06/2016]
28
Table 5. Correlation between students’ test scores, student/school characteristics and principal’s
managerial practices – heterogeneity by low-high SES
Dep. Variable: student’s test score Reading Mathematics
Variables Low-SES High-SES Low-SES High-SES
Student-level characteristics coef. coef. coef. coef.
Prior achievement (grade 6) 0.585*** 0.615*** 0.567*** 0.573***
(0.044) (0.042) (0.022) (0.025)
Socio-economic background (ESCS) 1.150** 1.791*** 1.922*** 1.538***
(0.445) (0.350) (0.277) (0.317)
Female student 1.740*** 1.572*** -0.613 -1.743***
(0.437) (0.445) (0.441) (0.474)
Immigrant student -0.920 -1.207 0.352 -3.520***
(0.864) (0.995) (0.705) (0.848)
Early-enrolled student -2.277 -1.229 3.501* -0.626
(3.356) (2.460) (1.971) (2.279)
Late-enrolled student -1.883 -4.527*** -1.721 -2.718**
(1.159) (1.402) 1.066 (1.224)
School-level characteristics
Proportion of female students -0.014 -0.034 -0.012 0.028
(0.061) (0.048) 0.042 (0.086)
Proportion of immigrant students 0.071 0.109** -0.029 0.138***
(0.048) (0.054) (0.033) (0.049)
School in Central Italy 1.364 -1.633 -0.484 -2.961
(1.662) (1.351) (1.037) (2.110)
School in Southern Italy -2.717 -2.964 -2.556** -6.298**
(2.409) (2.219) (1.110) (2.706)
Managerial practices
Use of data: data communicated to the Board of Teachers (dummy Y/N)
-3.491*** -0.825 -2.244** -0.952
(1.250) (1.643) (1.127) (1.792)
Use of data: data presented to external subjects (dummy Y/N) 1.512 -3.865* 0.427 0.560
(2.293) (2.101) (1.873) (1.032)
General index (management practices) 1.496 1.032 2.713** 0.392
(2.923) (2.365) (1.373) (2.810)
Constant 22.276** 22.292** 27.872*** 30.500***
(10.143) (9.359) (4.609) (7.677)
Number of observations (students) 2,993 2,971 2,993 2,971
R2 0.32 0.35 0.43 0.42
Note: Robust standard errors in parenthesis clustered at school level.
*** p<0.01, ** p<0.05, * p<0.1
Low-SES schools: N=216. High-SES schools: N=186.
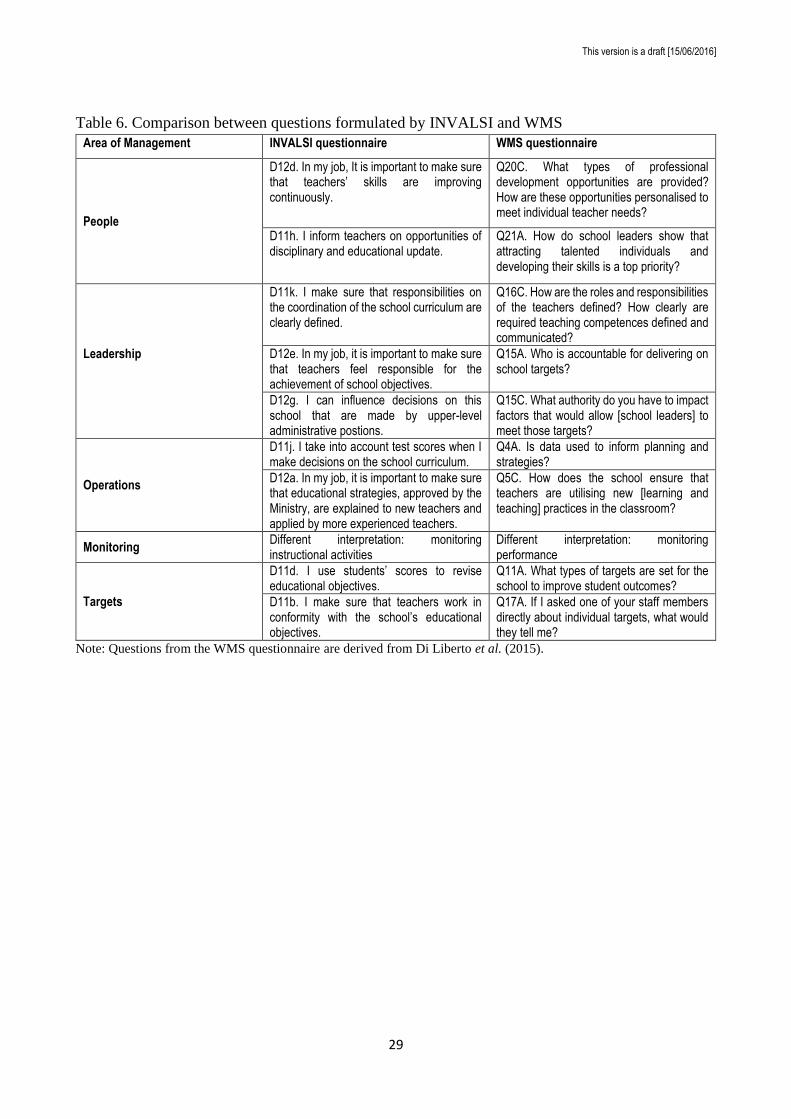
This version is a draft [15/06/2016]
29
Table 6. Comparison between questions formulated by INVALSI and WMS
Area of Management INVALSI questionnaire WMS questionnaire
People
D12d. In my job, It is important to make sure that teachers’ skills are improving continuously.
Q20C. What types of professional development opportunities are provided? How are these opportunities personalised to meet individual teacher needs?
D11h. I inform teachers on opportunities of disciplinary and educational update.
Q21A. How do school leaders show that attracting talented individuals and developing their skills is a top priority?
Leadership
D11k. I make sure that responsibilities on the coordination of the school curriculum are clearly defined.
Q16C. How are the roles and responsibilities of the teachers defined? How clearly are required teaching competences defined and communicated?
D12e. In my job, it is important to make sure that teachers feel responsible for the achievement of school objectives.
Q15A. Who is accountable for delivering on school targets?
D12g. I can influence decisions on this school that are made by upper-level administrative postions.
Q15C. What authority do you have to impact factors that would allow [school leaders] to meet those targets?
Operations
D11j. I take into account test scores when I make decisions on the school curriculum.
Q4A. Is data used to inform planning and strategies?
D12a. In my job, it is important to make sure that educational strategies, approved by the Ministry, are explained to new teachers and applied by more experienced teachers.
Q5C. How does the school ensure that teachers are utilising new [learning and teaching] practices in the classroom?
Monitoring Different interpretation: monitoring instructional activities
Different interpretation: monitoring performance
Targets
D11d. I use students’ scores to revise educational objectives.
Q11A. What types of targets are set for the school to improve student outcomes?
D11b. I make sure that teachers work in conformity with the school’s educational objectives.
Q17A. If I asked one of your staff members directly about individual targets, what would they tell me?
Note: Questions from the WMS questionnaire are derived from Di Liberto et al. (2015).

This version is a draft [15/06/2016]
30
Table 7. Aspects from the WMS questionnaire not tested in the INVALSI questionnaire
Area of Management Missing aspects
People
- Rewarding and promoting high performers o How do you identify and develop your star performers?
- Retaining talent o If you had a top performing teacher who wanted to leave, what
would the school do? - Creating a distinctive employee value proposition
o What makes it distinctive to teach at your school as opposed to other similar schools?
Leadership - Creating a leadership vision
o What is the school vision for the next five years?
Operations
- Personalizing instructional methods o How much does the school attempt to identify individual
student needs? - Standardising instructional processes
o How structured or standardized are the instructional planning processes across the school?
Monitoring
- Continuous improvement o Who within the school gets involved in changing or improving
process? - Performance tracking
o What kind of main indicators do you use to track school performance?
Targets
- Time horizon of targets o Are the long-term and short-term goals set independently?
- Targets clarity and comparability o How do people know about their own perfrmance compared to
other peoples performance?
Note: Questions from the WMS questionnaire derived from Di Liberto et al. (2015).