Embed Size (px)
Citation preview

Managing Correctional Capacity
Managing
Correctional Capacity
Office of Performance Evaluations
Idaho Legislature
Evaluation report
January 2020
Promoting confidence and accountability in state government
2
Office of Performance Evaluations
Established in 1994, the legislative Office of Performance
Evaluations (OPE) operates under the authority of Idaho Code
§§ 67-457–464. Its mission is to promote confidence and
accountability in state government through independent
assessment of state programs and policies. The OPE work is
guided by professional standards of evaluation and auditing.
Joint Legislative Oversight Committee
2020
The eight-member, equally bipartisan Joint Legislative Oversight
Committee (JLOC) selects evaluation topics; OPE staff conduct
the evaluations. Reports are released in a public meeting of the
committee. The findings, conclusions, and recommendations in
OPE reports are not intended to reflect the views of the Oversight
Committee or its individual members.
Senators
Representatives
Mark Harris
Caroline Nilsson Troy Paul Amador Elaine Smith Ilana Rubel
Senators
Representatives
Dan Johnson Michelle Stennett Cherie Buckner-Webb
Senator Mark
Harris (R) and
Representative
Ilana Rubel (D)
cochair the
committee.

Managing Correctional Capacity
3
From the director January 27,2020
Members
Joint Legislative Oversight Committee
Idaho Legislature
Over the past decade, the state’s approach to managing
correctional issues has been designed for relatively short-term
budget planning. As a result, the Department of Correction is less
equipped to address facility planning and changes in inmate
population than it was a decade ago.
Moving forward, both Governor Little and Director Tewalt are
planning to address correctional challenges facing the state in a
more comprehensive way. I believe this report could help them
and the Legislature with addressing immediate problems and
setting a road map to guide long-term policies and investments.
Our recommendation to develop a system-wide master plan is a
necessary step to manage Idaho’s correctional capacity. The plan
should include the following:
Producing and regularly updating a long-term inmate
population forecast
Building a system-wide staffing model
Prioritizing facility maintenance and replacement needs
based on operational efficiency and effectiveness
I would like to express my sincere thanks to Director Tewalt and
his staff for providing valuable assistance needed for us to
conduct this evaluation.
954 W. Jefferson Street Suite 202 Boise, Idaho 83702 Ph. 208.332.1470 legislature.idaho.gov/ope/
Formal
responses from
the Governor and
the Department
of Correction are
in the back of the
report.
Sincerely,
Rakesh Mohan, Director Office of Performance Evaluations

4
Executive summary ................................................................ 5
1. Introduction ...................................................................... 12
2. Staffing .............................................................................. 17
3. Growth .............................................................................. 24
4. Crowded, aging, outdated facilities .................................. 30
5. Qualitative differences among facilities ........................... 41
6. Cost comparison of facilities ............................................. 49
7. Moving forward ................................................................ 58
Appendices
A. Request for evaluation ...................................................... 61
B. Evaluation scope ............................................................... 63
C. Methodology ..................................................................... 64
D. Cost calculation details ..................................................... 66
Responses to the evaluation ................................................... 70
Page
Contents
Lance McCleve, Susie
Bergeron, and Casey
Petti conducted this
evaluation. Margaret
Campbell copyedited and
desktop published the
report.
Bob Thomas of Robert C.
Thomas and Associates
provided technical
assistance.
Jim Brock of Kinion
Marsh and Co. conducted
a quality control review.
Cover page photo
courtesy of Chad Page,
Chief, Division of Prisons.
Managing Correctional Capacity
5
Why we were asked to do this evaluation
In 2010 our office conducted an evaluation on the operational
efficiency of Idaho’s prison system. In that evaluation, we found
several deficiencies in the operational practices of the
Department of Correction.
We learned that management of the employee roster was
conducted in an inconsistent manner, relying on either outdated
tools or without any system-wide guidance. In addition, poor
facility design and increased maintenance costs from aging
facilities contributed to the rising cost of housing inmates. We
recommended that the department develop a comprehensive
staffing model and phase out the older and inefficient housing
units at prisons.
Our follow-up in 2012 found that most of the issues identified in
the initial evaluation were still ongoing.
The prison system has experienced notable changes since our
2010 evaluation and 2012 follow-up. Rapid inmate population
growth since 2016 has led to inmate housing capacity shortages,
resulting in inmates being sent out of state to privately operated
prisons in Texas since 2018. Additionally, county jails have been
increasingly relied on to accommodate inmate population
growth.
Legislative interest for this evaluation was driven in part by a
desire to know what changes and improvements have been made
to improve operational efficiency since 2010. Additionally,
requesters wanted to know what other changes the prison system
has undergone since 2010, and how and when the department
can resume housing all Idaho inmates in-state.
Executive summary
6
The RELIEF
FACTOR is a
mathematical
tool used to
determine the
number of staff
needed to fill
posts.
What we found
Roster management has improved since our last
evaluation, though the department is still lacking a
staffing model.
Changes in the relief factor tool used for facilities have
contributed to better roster management. At the time of our
previous report, the department was using an outdated, single
relief factor for all prisons. The department now calculates a
relief factor for each facility and updates it annually to ensure it
meets the needs of facilities.
Our last report found that budget holdbacks and furloughs
routinely caused the department to leave correctional officer
posts unstaffed. The department did not use a set of prescribed
rules to determine which posts should always be staffed for safe,
secure operations.
Correctional officer posts critical to safety are now classified as
either mandatory (posts that must be always staffed) or essential
(posts that should be staffed though can be unstaffed in rare
circumstances). This distinction allows the department to ensure
that mandatory posts are always filled and essential posts are
filled whenever possible.
The department still lacks a system-wide staffing model for
correctional officers. While the new relief factor and post
classifications help the department with staff management, they
do not inform the department on the actual staffing and resource
needs of prisons.
Recommendation
The department should work with professional correction
organizations to conduct a robust staffing analysis and create a
system-wide staffing model. A staffing model would identify
staffing deficiencies and help inform related budgeting decisions.
The department
still lacks a
unified staffing
model for
correctional
officers.

Managing Correctional Capacity
7
The department does not use a long-term forecast to
anticipate and plan for growth.
Since December 2016, inmate population has grown by nearly 18
percent, far outpacing the growth of Idaho’s population over the
same time period. Inmate population is now above what the
department can reasonably house within the state and has led to
increased inmate placement in county jails and emergency
contracting with an out-of-state prison (Eagle Pass, Texas).
Projecting future growth is necessary for policymakers to address
housing capacity shortages. The department forecasts growth
over a two-year projection period, which allows short-term
budgetary planning but is insufficient for long-term decisions. In
addition to a two-year forecast, a 5- to 10-year forecast would
give the department and policymakers needed information to
better plan for the long-term housing needs of inmates.
Recommendation
The department should develop and routinely produce a long-
term forecast for inmate population. This forecast should be
shared with criminal justice partners and policymakers to assist
in policymaking and identifying how policy or regulation changes
may affect future prison populations.
Challenges facing the facilities are worse today
than in 2010.
To accommodate some inmate population growth, the
department has increased the number of inmates housed in
department-operated prisons by 203 since 2010, only a 3 percent
increase. Most of the increase came by adding bunks to existing
housing units. But this incremental solution was not sustainable
over a long period.
At the time of our last evaluation, subject-matter experts
expressed concerns that several housing units were overcrowded
based on industry best practice standards. The decision to add
bunks to these housing units have taken the units further away
from those standards.
8
The outdated design of the older facilities limits the ability of
security staff to continuously observe inmates. Failure to
continuously observe inmates can lead to safety and security
risks for both staff and inmates. In total, 2,835 bunks in housing
units are not conducive to continuous observation.
The maintenance status of facilities is worse today than it was at
the time of our last evaluation. In 2010 we found a maintenance
backlog equivalent to $40.5 million in 2019 dollars. As of October
2019, deferred maintenance has increased by 45 percent to $58.6
million. Because facilities lack a recent condition assessment, the
new deferred maintenance does not include smaller maintenance
needs at facilities, and the true deferred maintenance amount is
certainly higher.
Recommendation
The department should work with facility management
organizations to conduct a facility condition assessment of the
prison system. The facility condition assessment would inform
the department of the true maintenance status of the prisons, as
well as identify facilities with disproportionately high
maintenance needs. The assessment can be used to inform
capital budgeting decisions, which would allow the department to
save money long term by undertaking preventative maintenance
when appropriate.
Inmates have better opportunities and services in
department-operated prisons when compared with
alternative placements.
Services at department-operated prisons exceed those in county
jails or out-of-state placement. Cognitive behavioral programs,
access to educational programs, and work opportunities all are
present within department prisons, while access is either limited
or nonexistent in the alternative placements.
The distance between Eagle Pass and Idaho limits the
opportunity for inmates to receive family visitations. County jails
are not designed to house inmates for long periods. Jails conform
to regulations aimed at short-term housing. Inmates receive
minimal medical care at most county jails and must be
transferred into a department prison to receive care.
Differences in inmate experiences and services that depend on
placement type may affect inmate wellbeing and recidivism risks.

Managing Correctional Capacity
9
Inmate
placement in
county jails is
more expensive
than placement
within any
department
prison.
The state could realize cost savings through new
prison construction.
The costs of housing inmates at county jails and the out-of-state
prison are different from the costs of housing inmates in
department-operated prisons. As shown in exhibit 1, when
accounting for housing, medical care, transportation, and
contract oversight, the cost of an inmate placement at Eagle Pass
is $82.33 per day. This number is about even with the most
inefficient medium security prison in Idaho, which costs $82.34
per inmate per day, but is higher than the newer, more efficient
department prisons.
In contrast, inmate placement in county jails is more expensive
than placement within any department prison. An inmate at a
county jail costs the department $95.45 per day when allocating
costs of department provided services. This number is not what
the state pays to the counties, which averages $71.15 per inmate
per day, but the cost when factoring in medical care,
programming, and education an inmate will receive from the
department.
$95 $82 $78
County jails Eagle Pass New prison
Exhibit 1
Estimated cost per inmate day at a new prison is less
than county jails and Eagle Pass.
Source: Analysis of data from the Department of Correction and Carter, Goble, and
Lee, A System Master Plan for the Idaho Department of Correction, February 2008.
10
The failure of the
state to
adequately plan
since our 2010
evaluation is a
contributing
cause of many
problems it faces
today.
The high cost of inmate placement at Eagle Pass and county jails
makes construction of a new prison a less expensive alternative
long term. We estimate a new medium security prison would cost
about $77.41 per inmate per day if it is operated at the same
efficiency as the department’s most efficient medium security
prison. This cost per day includes construction and financing
costs spread over 50 years of the useful life of the prison.
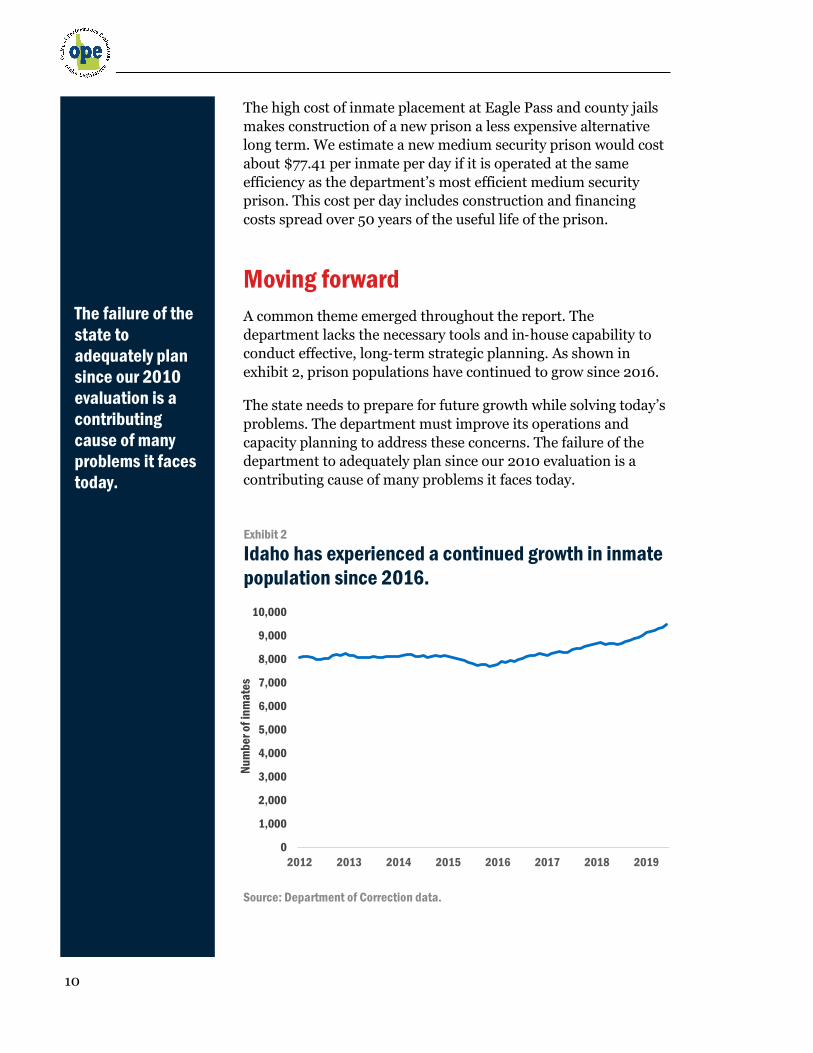
Moving forward
A common theme emerged throughout the report. The
department lacks the necessary tools and in-house capability to
conduct effective, long-term strategic planning. As shown in
exhibit 2, prison populations have continued to grow since 2016.
The state needs to prepare for future growth while solving today’s
problems. The department must improve its operations and
capacity planning to address these concerns. The failure of the
department to adequately plan since our 2010 evaluation is a
contributing cause of many problems it faces today.
Exhibit 2
Idaho has experienced a continued growth in inmate
population since 2016.
Nu
mb
er
of
inm
ate
s
Source: Department of Correction data.
0
1,000
2,000
3,000
4,000
5,000
6,000
7,000
8,000
9,000
10,000
2012 2013 2014 2015 2016 2017 2018 2019
Managing Correctional Capacity
11
The lack of capital planning and a long-term population forecast
led to the department implementing small, incremental changes
to increase housing capacity. After inmate populations increased
beyond what could be reasonably housed in the prisons, the
department had to look elsewhere for placement.
The immediate need for inmate placement in 2018 led the
department to enter a contract to send inmates out of state. The
emergency nature of the contract lacked necessary provisions to
cover all costs of housing inmates, such as off-site medical care.
This lack of provisions increased the price of housing inmates at
the out-of-state contract prison. Moving forward, the department
should take advantage of these lessons.
Recommendation
The department should develop a system-wide master plan that
draws upon our recommendations. The master plan can guide
the department on how to address immediate problems and set a
long-term road map for the department to follow. The system
master plan should be updated regularly as information changes.
Additionally, the system master plan would help the department
demonstrate to policymakers the need and purpose of budgetary
requests, such as an increase in full-time employees or capital
projects.
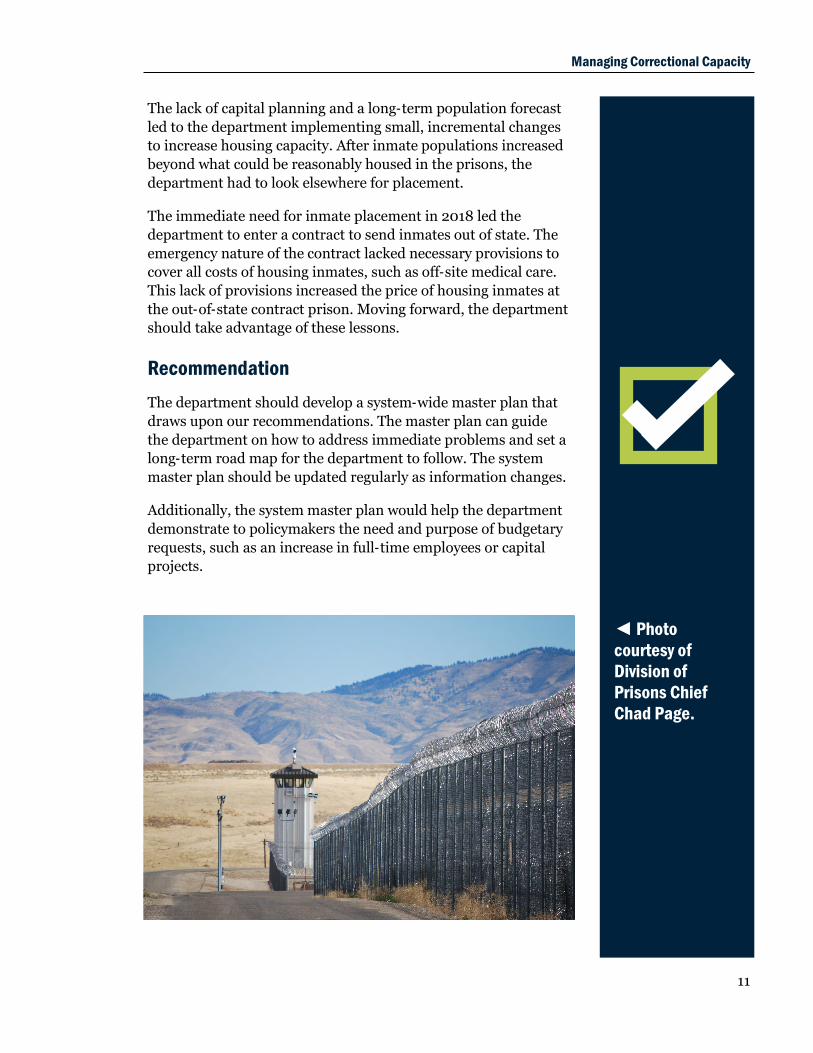
◄ Photo
courtesy of
Division of
Prisons Chief
Chad Page.
12
Background and legislative interest
In 2009 the Joint Legislative Oversight Committee assigned us to
evaluate staffing practices and facility conditions of Idaho’s nine
prisons. We released the report, Operational Efficiencies of
Idaho’s Prison System, in 2010. Our results found that many of
Idaho’s prisons were operating both inefficiently and
ineffectively. The lack of a staffing model led to inconsistency in
staffing standards throughout the prison system. Poor facility
design and aging facilities contributed to the rising costs of
housing inmates. We recommended that the Department of
Correction develop and implement a system-wide staffing model
and phase out poorly performing facilities and housing units.
In 2012 the Oversight Committee asked us to follow up on the
department’s efforts to address findings and implement
recommendations. We found that issues identified in our
evaluation were still ongoing, though the department had taken
steps to identify needs in correctional officer staffing.
During the 2019 legislative session, the Oversight Committee
directed our office to conduct a new evaluation of the prison
system. Legislative interest for a new evaluation was driven in
part to understand the department’s progress on improving
operational efficiency. Additionally, requesters wanted to know
the effects of recent changes necessitated by prison population
growth (the request for evaluation is in appendix A).
Since 2010 the prison population has surpassed in-state prison
capacity, leading to inmates being housed in county jails or sent
out of state during much of this period. While it was well
understood that inmates are no longer all housed in Idaho, the
financial costs and effects of sending inmates out of state were
unclear. Requesters wanted to know what would need to be done
to house all inmates in Idaho again.
Introduction
Managing Correctional Capacity
13
Evaluation approach
To address the questions raised in the request, we split the
evaluation into four primary components: (1) changes in
operational efficiency since our last evaluation, (2) projecting
needed inmate housing capacity, (3) steps taken to address
capacity issues, and (4) the comparative costs of housing inmates
in different settings (see appendix B for our evaluation scope).
Our 2010 evaluation relied on visits to all nine Idaho prisons and
reviewing previously published third-party studies about the
prison system to determine operational efficiency. Our approach
for this evaluation differed from the prior evaluation because of a
lack of recent studies on the prison system. We visited three of
the nine prisons and interviewed wardens at the remaining
facilities. In place of data from third-party studies, we relied on
first-hand interviews and data from the department for
information on staffing and facility conditions.
Additionally, we interviewed and corresponded with department
staff to gather information on inmate programing, contract
oversight, facility maintenance, population forecasting, and costs
of housing inmates (our methodology is in appendix C).
During the process of evaluating the costs of out-of-state inmate
placement, we incorporated into our analysis inmate placement
in county jails. County jails are often used to house inmates when
department facilities are at capacity. The true costs of placing
inmates in county jails are not well understood. By including
county inmate placements in the analysis, we gained a clear
picture of the true costs of prison system capacity shortages.
14
Department information and prison
facilities
In December 2019 the department employed around 1,950
people. Employees include correctional officers, probation and
parole officers, rehabilitation specialists, teachers, support staff,
and administrators. Over half of all department staff,
approximately 1,000, work in security at department-operated
prisons and community reentry centers.
Nearly 26,000 individuals in Idaho are under departmental
control, either in incarceration or on probation or parole under
departmental supervision.
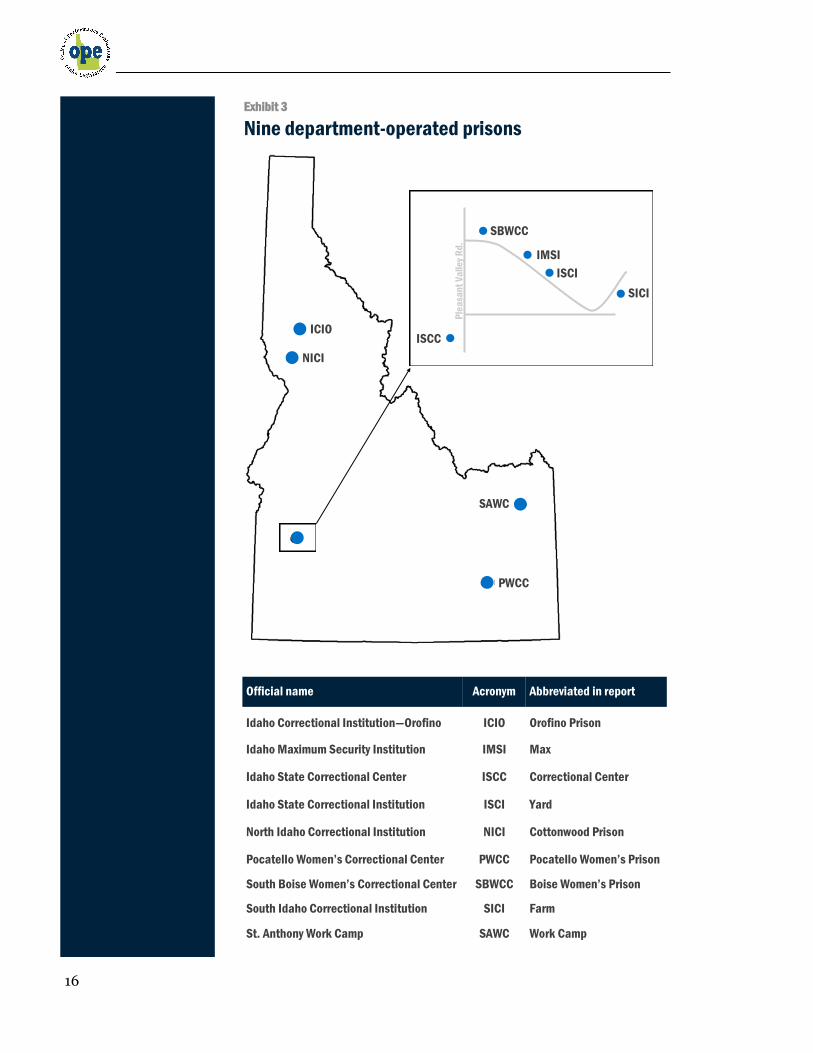
Idaho’s prison system comprises nine prisons throughout the
state. As shown in exhibit 3, five prisons are located south of
Boise, two in northern Idaho, and two in eastern Idaho.
In addition to the nine prisons, the department runs four
community reentry centers across the state. A tenth prison in
Idaho, the Correctional Alternative Placement Program (CAPP),
is privately operated by the Management Training Corporation.
Definitions
Bed: A physical space where a person can sleep.
Not all beds are available for assignment to
inmates.
Bunk: A bed that has been identified for a specific purpose and to
which an inmate may be assigned. There are several bunk types,
such as general population, medical, and disciplinary.
Total capacity: The total number of bunks in a prison regardless of
type.
Operational capacity: The number of bunks in a prison that can be
filled at any one time. Operational capacity accounts for the
temporary nature of some bunk types that cannot be permanently
occupied, such as medical and disciplinary bunks.

Managing Correctional Capacity
15
For this evaluation, “prison system” refers only to the nine
department-operated prisons. When included in our analysis, we
refer to community reentry centers and CAPP by name.
The operating capacity of Idaho’s nine department-operated
prisons is 6,779 inmates, with operating capacity for 5,733 males
and 1,046 females. Six prisons house exclusively males, two
house exclusively females, and one houses both males and
females.
Total capacity of the nine department-operated prisons is 6,974
inmates, 195 more than operational capacity. Operational
capacity is lower because of the need for immediate availability of
certain bunk types, such as short-term restricted housing and
medical bunks. The department strives to keep the number of
inmates in each prison below total capacity to accommodate the
acute needs of inmates.
In early October 2019, Idaho prisons were at 102.1 percent of
operational capacity. The seven facilities housing male inmates
were at 102.5 percent and the three facilities housing female
inmates were at 98.7 percent.
16
Exhibit 3
Nine department-operated prisons
Ple
asa
nt
Va
lle
y R
d.
ISCC
SBWCC
IMSI
ISCI
SICI
ICIO
NICI
SAWC
PWCC
Official name Acronym Abbreviated in report
Idaho Correctional Institution—Orofino ICIO Orofino Prison
Idaho Maximum Security Institution IMSI Max
Idaho State Correctional Center ISCC Correctional Center
Idaho State Correctional Institution ISCI Yard
North Idaho Correctional Institution NICI Cottonwood Prison
Pocatello Women’s Correctional Center PWCC Pocatello Women’s Prison
South Boise Women’s Correctional Center SBWCC Boise Women’s Prison
South Idaho Correctional Institution SICI Farm
St. Anthony Work Camp SAWC Work Camp
Managing Correctional Capacity
17
Security staffing is a key cost driver for Idaho prisons. Making
staffing decisions based on a consistent and rational assessment
of need can help ensure the effective use of state dollars. Our
2010 evaluation found that administrators at the department
were dedicated, creative, and flexible in their efforts to operate
prisons in a way that limited costs. Nevertheless, during the
Great Recession, this flexibility was stretched to its limits. The
department’s problems were exacerbated by not having a
standardized staffing model.1 This model could have been used as
a baseline for determining, prioritizing, and addressing gaps in
staffing needs.
We identified four specific problems in our 2010 evaluation:
Command staff responsible for operations often did not have
a clear rationale for the level of posts required to adequately
meet all needs. Responsibilities of staff were well outlined but
not the number of staff needed to fulfill those responsibilities.
The shift relief factor, used to estimate the number of full-
time equivalents (FTEs) needed to fill posts, was out of date
and not facility specific.
In effect, prisons were staffed based on the number of staff
available, not on the number of staff needed nor operating
best practices. In many instances, prison facilities and
individual housing units had more posts to fill than staff
available. The lack of staff created gaps in security and
insufficient coverage.
Inadequate staffing levels along with poor facility design
prevented the department from following best practices for
direct supervision and continuous observation of inmates.
Staffing shortages were further exacerbated by furloughs and
prohibitions on the use of overtime.
Staffing
1. The department contracted with a consultant to develop a staffing
model a decade earlier. We could not determine whether the model had
been implemented. By 2009 the model was outdated and not in use.
18
The department’s roster management
system is well designed and managed.
Roster management is used to allocate and schedule staff so
identified posts are staffed when needed. We found that the
department’s roster management system is well designed and
managed. In addition, the department is looking at ways to
further streamline the system with software enhancements.
As part of the roster management system, the department
calculates staffing needs using a common tool called the shift
relief factor. The shift relief factor is based on averages of leave
and other absences. However, the use of averages is an inherent
weakness of the factor. Achieving accuracy by using averages
requires a planned consistency of taking leave. It does not
account for randomly occurring absences. The department
addresses this weakness by assigning overtime as needed and
encouraging a flexible approach to the relief pool.
The department
has addressed
our 2010
concerns about
the shift relief
factor.
Shift relief factor
In the 2010 report we expressed concern about
the adequacy of the shift relief factor because it
was out of date and not facility specific.
As we noted in our 2010 report, department had determined the
shift relief factor by dividing the number of days a security post
must be staffed by the average number of days that staff were
expected to be on duty. It considered factors such as sick days,
vacations, and other types of leave and training. However, the
department had based the shift relief factor on data that was out of
date, and it had applied the factor system-wide instead of basing it
on facility-specific data.
In our review of the shift relief factor this year, we found that the
department has addressed our 2010 concerns. The department
now calculates a factor for each facility and updates it annually.
Managing Correctional Capacity
19
Despite improvements to staffing of
mandatory and essential posts, some
essential posts still intermittently go
unstaffed.
Roster management is an important component of managing
staff resources. It begins with the number of identified posts. It is
not, however, a tool for determining how many posts are needed
based on best practices, overcoming facility design deficits, or
meeting national standards. A staffing model is necessary to
determine needed posts.
During the Great Recession, the department was not able to
consistently fill security posts because of budget holdbacks,
mandatory furloughs, and restrictions on overtime use.
We reported in 2010 that the department did not use a set of
prescribed rules to identify which security posts were mandatory.
Mandatory posts are those that must always be staffed. Essential
posts can temporarily be left unstaffed, usually under rare and
exceptional circumstances outside the department’s control. The
department now defines mandatory and essential posts, per
guidance from the National Institute of Justice. The department
also uses and closely monitors staff overtime.2
Defining security posts as mandatory and essential is not as
much a best practice as it is a basic practice. Ideally, mandatory
and essential posts would always be staffed to consistently ensure
safe and secure operations. However, according to our
interviews, some essential posts intermittently go unstaffed.
Sometimes, in lieu of letting an essential or mandatory post go
unstaffed, a facility will draw supervisory or other staff away from
their duties to cover the posts.
Warden opinions about the adequacy of staff are mixed. Some
wardens feel that they have the number of posts needed, some
have difficulties filling all posts, and some feel constrained by
facility design and the need to reassign staff from their normal
Warden opinions
about the
adequacy of staff
are mixed.
2. We worked with Correction financial staff to review costs of working
staff overtime versus hiring additional full-time staff. We found the cost
per hour of the two alternatives to be similar. Overtime wages are paid
at the rate of time and one-half. The cost per hour of hiring additional
full-time staff includes fixed benefits, training, and leave.
20
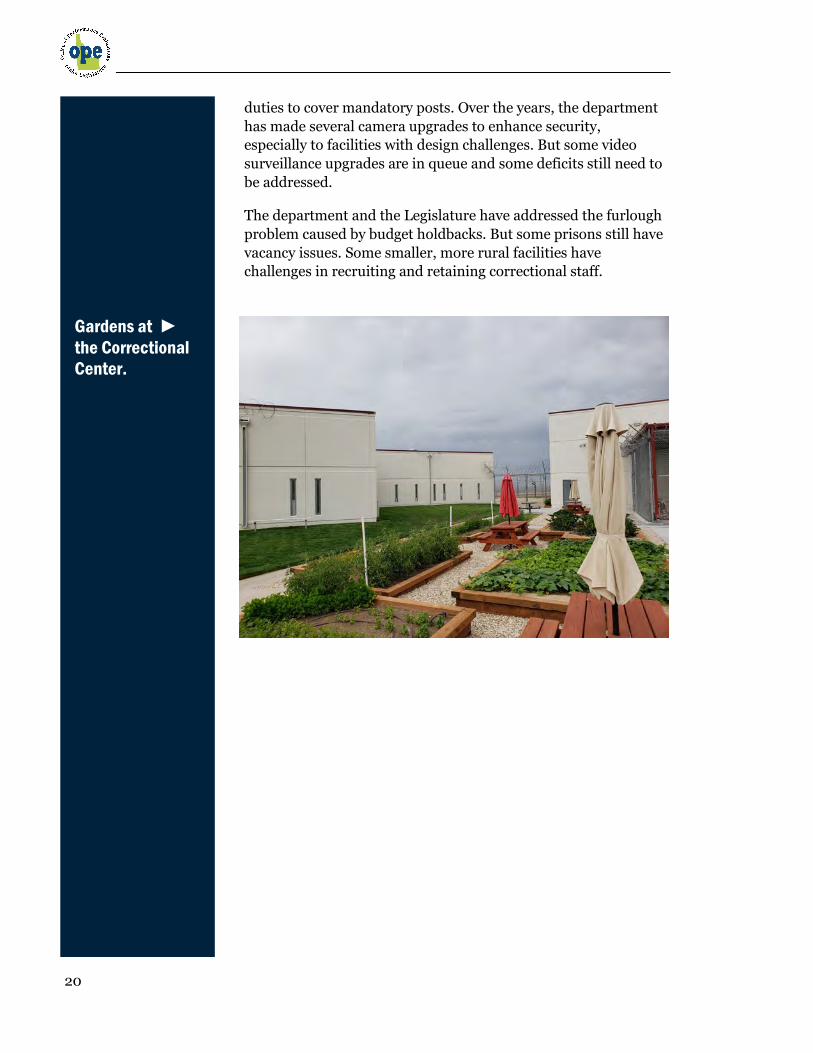
Gardens at ►
the Correctional
Center.
duties to cover mandatory posts. Over the years, the department
has made several camera upgrades to enhance security,
especially to facilities with design challenges. But some video
surveillance upgrades are in queue and some deficits still need to
be addressed.
The department and the Legislature have addressed the furlough
problem caused by budget holdbacks. But some prisons still have
vacancy issues. Some smaller, more rural facilities have
challenges in recruiting and retaining correctional staff.

Managing Correctional Capacity
21
The presence and
interaction of
command staff
with line staff is
an excellent
practice.
The department still lacks an operational
master plan that incorporates a staffing
model.
Department administration has made improvements and
continues to be creative and flexible in fulfilling its mission.3 We
were impressed by the way headquarters and facility command
staff practice being visible and interacting with line staff at prison
facilities. The presence and interaction of command staff with
line staff is an excellent practice. It gives headquarters additional
knowledge to triage the needs of various prison facilities.
One thing that has not changed over the past decade is the need
for an operational master plan that incorporates the development
of a staffing model.
Many questions about whether staffing levels are adequate can be
answered through a staffing model. A staffing model can be the
basis for consistent and efficient staffing of prisons. Based on
facility design and necessary security activities at each prison, a
staffing model gives the department a framework for
systematically determining the number of necessary posts. Using
a standardized staffing model to systematically link facility
design, staff duties, and necessary posts can help reduce the
potential risks associated with insufficient staff coverage.
Without a staffing model, the department may have difficulty
communicating and garnering legislative support for staffing
needs because it lacks a systematic way to measure staffing levels
and identify shortcomings. Standardizing how the department
makes staffing decisions can be beneficial to both the department
and the Legislature:
Staffing needs can be assessed consistently based on
explicit criteria.
Resources can be distributed fairly among prisons.
Staffing practices can be well supported and legally
defensible.
3. https://www.idoc.idaho.gov/content/about_us/
mission_vision_and_values

22
A lesson learned
from our 2010
evaluation is
that we may not
know what the
economy holds in
store, but we
should be
prepared for any
eventuality.
Performance measures can be used to identify and
address deficiencies in operations, such as specific times
and locations where continuous observation is not being
provided.
Planning for new capacity or for replacing existing
capacity can start with an assessment of how housing
units or a facility should be staffed, which is necessary for
identifying the long-term operational costs that
accompany capital costs.
A lesson learned from our 2010 evaluation is that we may not
know what the economy holds in store, but we should be
prepared for any eventuality. When the effects of the Great
Recession spilled over into severe financial difficulties for the
state, the department found itself challenged with how best to
respond to budget cuts and provide the Legislature and other
stakeholders with information and sound criteria for making
difficult decisions.
Recommendation
The department should work with professional correction
organizations to identify an outside, independent consultant who
can conduct a staffing analysis and produce a staffing model.
Organizations such as the American Correctional Association, the
National Institute of Corrections, and the Correctional Leaders
Association could assist. The main concerns raised in our 2010
report were related to security staffing. We believe that
developing a robust security staffing model should be the highest
priority.
We do not want to be prescriptive in how the department
identifies the most appropriate organizations. Of higher
importance are two criteria for the analysis:
Conducted by highly experienced professionals who can work
closely with the department’s subject-matter experts while
maintaining independence
Receive buy in from key stakeholders, such as the Legislature
and the Board of Correction, on the purpose and process of
commissioning the analysis

Managing Correctional Capacity
23
Elements of the analysis could include:
Determining mandatory and essential posts based on
criteria that considers (1) overall facility layout and
electronic security enhancements, (2) security features
that limit the kinds of offenders to be housed, and (3)
number and classification of offenders to be housed
Identifying standards and best practices for observing and
supervising offenders
Performing a gap analysis of current staffing versus
recommended staffing
Developing a plan for addressing any deficits
◄ Photo
courtesy of
Division of
Prisons Chief
Chad Page.
24
In 2010 we cautioned that although growth had slowed, increases
in the forecasted inmate population would require the
Department of Correction and policymakers to answer complex
questions about how to control for associated costs. Given growth
in the inmate population since 2016, Idaho is now at a point
where the department and policymakers must answer those
questions.
Growth
Managing Correctional Capacity
25
The department is at a critical juncture in
planning for how it will house inmates.
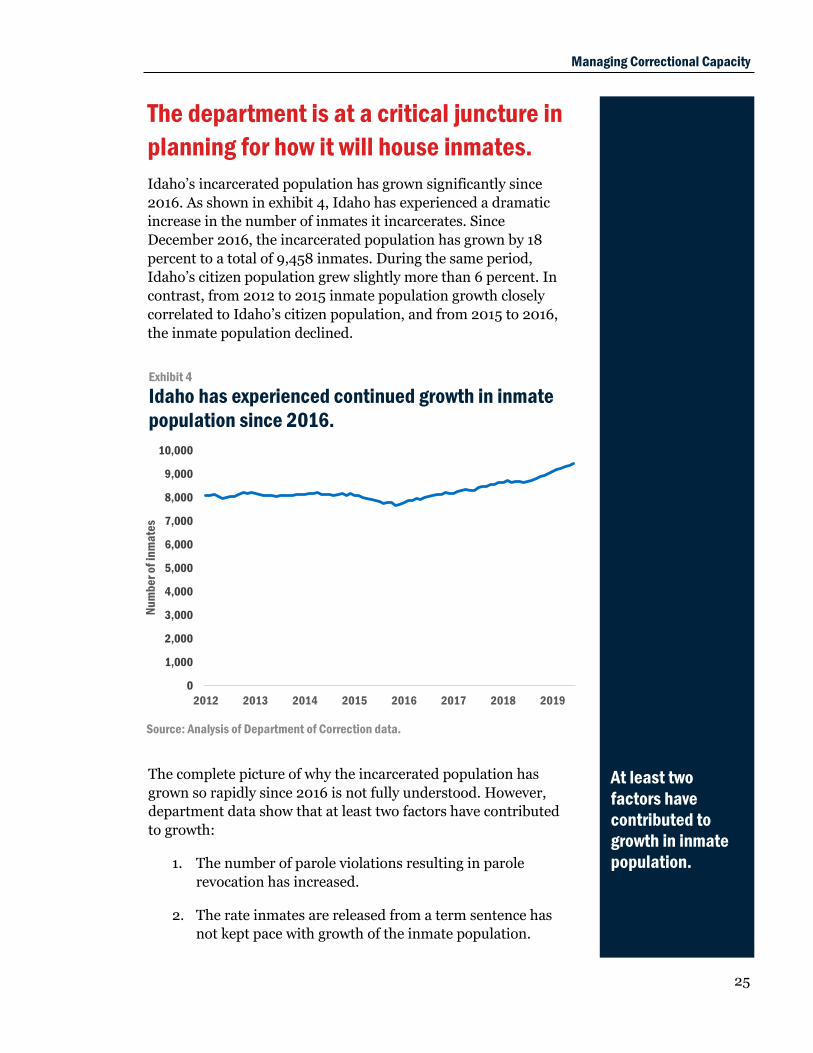
Idaho’s incarcerated population has grown significantly since
2016. As shown in exhibit 4, Idaho has experienced a dramatic
increase in the number of inmates it incarcerates. Since
December 2016, the incarcerated population has grown by 18
percent to a total of 9,458 inmates. During the same period,
Idaho’s citizen population grew slightly more than 6 percent. In
contrast, from 2012 to 2015 inmate population growth closely
correlated to Idaho’s citizen population, and from 2015 to 2016,
the inmate population declined.
At least two
factors have
contributed to
growth in inmate
population.
Exhibit 4
Idaho has experienced continued growth in inmate
population since 2016.
The complete picture of why the incarcerated population has
grown so rapidly since 2016 is not fully understood. However,
department data show that at least two factors have contributed
to growth:
1. The number of parole violations resulting in parole
revocation has increased.
2. The rate inmates are released from a term sentence has
not kept pace with growth of the inmate population.
Nu
mb
er
of
inm
ate
s
0
1,000
2,000
3,000
4,000
5,000
6,000
7,000
8,000
9,000
10,000
2012 2013 2014 2015 2016 2017 2018 2019
Source: Analysis of Department of Correction data.
26
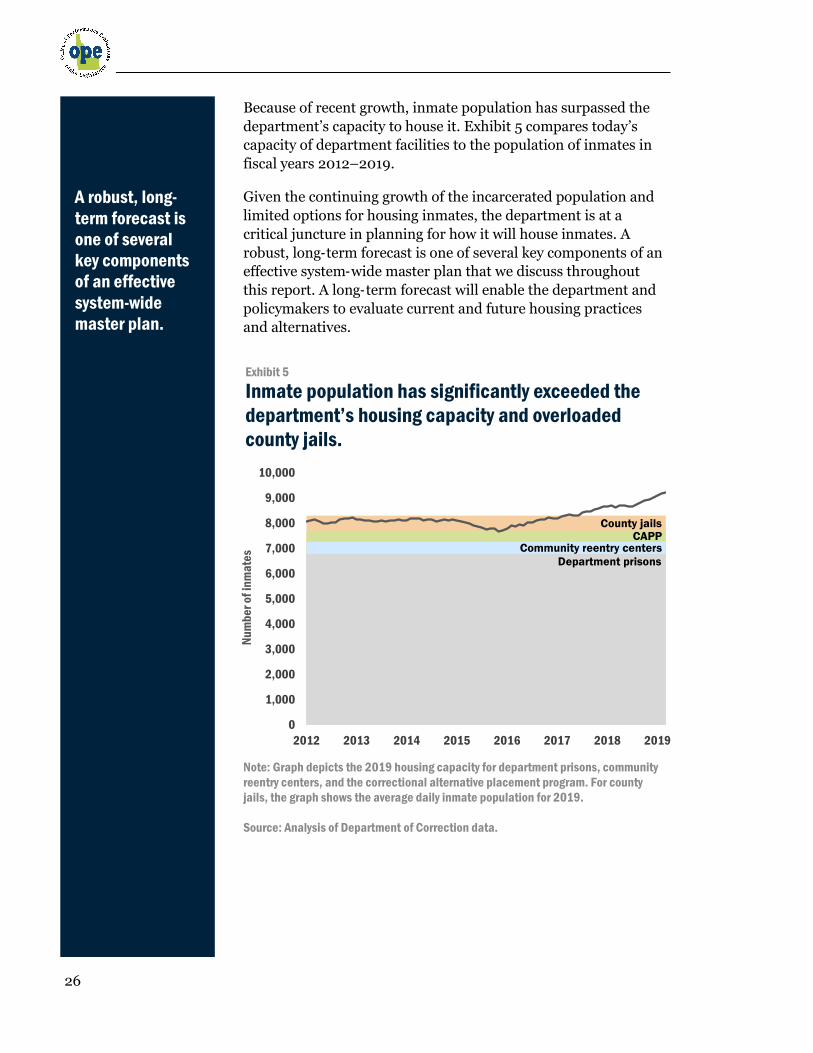
Because of recent growth, inmate population has surpassed the
department’s capacity to house it. Exhibit 5 compares today’s
capacity of department facilities to the population of inmates in
fiscal years 2012–2019.
Given the continuing growth of the incarcerated population and
limited options for housing inmates, the department is at a
critical juncture in planning for how it will house inmates. A
robust, long-term forecast is one of several key components of an
effective system-wide master plan that we discuss throughout
this report. A long-term forecast will enable the department and
policymakers to evaluate current and future housing practices
and alternatives.
Note: Graph depicts the 2019 housing capacity for department prisons, community
reentry centers, and the correctional alternative placement program. For county
jails, the graph shows the average daily inmate population for 2019.
Source: Analysis of Department of Correction data.
Nu
mb
er
of
inm
ate
s
0
1,000
2,000
3,000
4,000
5,000
6,000
7,000
8,000
9,000
10,000
2012 2013 2014 2015 2016 2017 2018 2019
County jails CAPP
Community reentry centers
Department prisons
Exhibit 5
Inmate population has significantly exceeded the
department’s housing capacity and overloaded
county jails.
A robust, long-
term forecast is
one of several
key components
of an effective
system-wide
master plan.

Managing Correctional Capacity
27
The department does not use a long-term
forecast to anticipate and plan for
growth.
The department forecasts population over a two-year projection
period. It does not produce a long-term forecast. Exhibit 6 shows
the department’s most recent forecast for the incarcerated
population.
The department’s approach is designed for relatively short-term
budget planning. However, in the short term, the prison system
cannot easily adjust to accommodate the changing demand for
beds. An increased demand for beds resulting from a change in
policy or practices, such as sentencing, probation, or parole, can
quickly surpass prison capacity and require a long-term solution.
In addition to short- and medium-term detailed forecasts, other
states generally produce long-term (5–10 years) forecasts that
they update periodically. They use long-term forecasting to
identify, prepare for, or respond to rapid growth.
Nu
mb
er
of
inm
ate
s
Source: Analysis of Department of Correction data.
0
2,000
4,000
6,000
8,000
10,000
2012 2021
Exhibit 6
The department projects the inmate population
could reach 10,300 by next year.
The
department’s
approach is
designed for
relatively short-
term budget
planning.
28
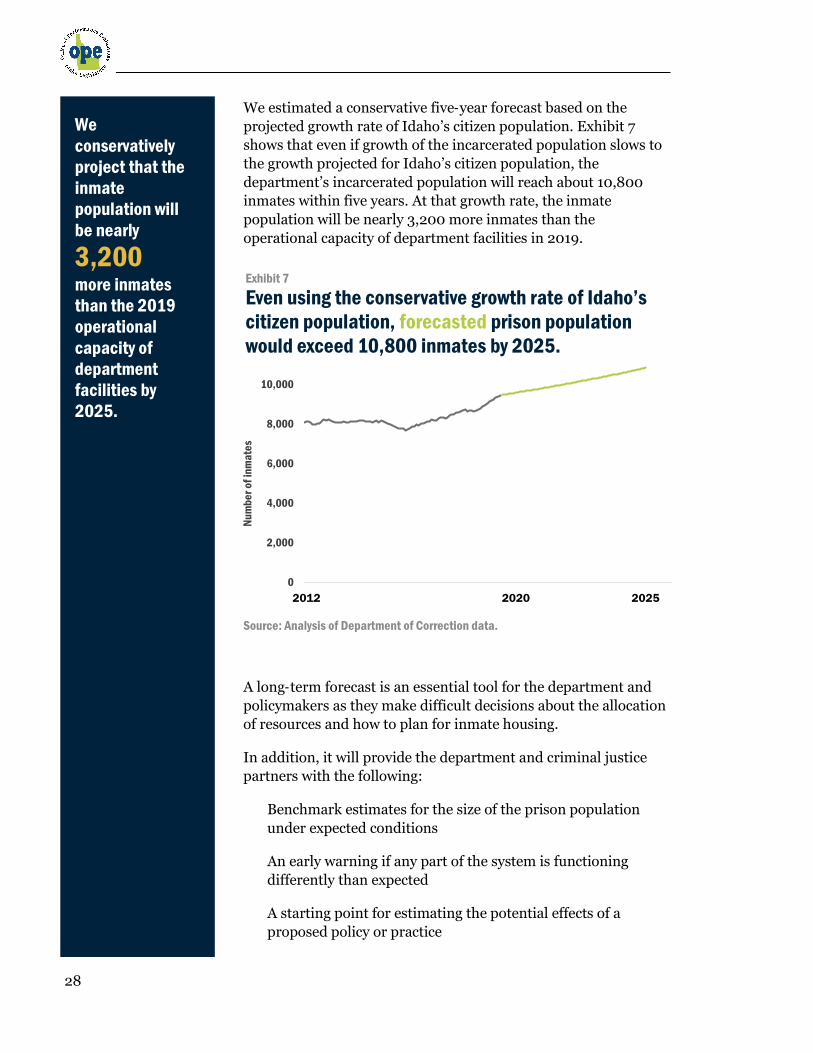
We estimated a conservative five-year forecast based on the
projected growth rate of Idaho’s citizen population. Exhibit 7
shows that even if growth of the incarcerated population slows to
the growth projected for Idaho’s citizen population, the
department’s incarcerated population will reach about 10,800
inmates within five years. At that growth rate, the inmate
population will be nearly 3,200 more inmates than the
operational capacity of department facilities in 2019. N
um
be
r o
f in
ma
tes
A long-term forecast is an essential tool for the department and
policymakers as they make difficult decisions about the allocation
of resources and how to plan for inmate housing.
In addition, it will provide the department and criminal justice
partners with the following:
Benchmark estimates for the size of the prison population
under expected conditions
An early warning if any part of the system is functioning
differently than expected
A starting point for estimating the potential effects of a
proposed policy or practice
Source: Analysis of Department of Correction data.
0
2,000
4,000
6,000
8,000
10,000
2012 2020 2012 2020 2025
Exhibit 7
Even using the conservative growth rate of Idaho’s
citizen population, forecasted prison population
would exceed 10,800 inmates by 2025.
We
conservatively
project that the
inmate
population will
be nearly
3,200 more inmates
than the 2019
operational
capacity of
department
facilities by
2025.

Managing Correctional Capacity
29
Some deviations from the forecast population will be in part due
to the inherent imperfections in forecasting. Even so, deviations
should be analyzed to identify underlying causal factors. Causal
factors should be addressed by policy or programmatic changes.
Deviations from the forecast can signal the need for the
department to adjust its strategy for housing inmates or to
identify policy changes necessary to manage anticipated growth.
Recommendation
The department should develop a standardized approach for
routinely (annually or semiannually) producing a long-term
forecast for the population under correctional supervision. The
forecast should have enough detail to translate projected growth
into bed needs by type, such as close custody, medium custody,
community custody, or retained jurisdiction (riders). The
forecast should be regularly shared with criminal justice partners
and policymakers. When shared regularly, the forecast can serve
as an agreed upon benchmark for policy and program
formulation, evaluation, and capital investment decisions.
If, in its judgment, the department lacks internal resources to
develop such a forecast, we recommend it seek assistance from
organizations with experience and expertise in establishing
forecast models for long-term correctional populations.
30
Several pressing issues were facing department facilities at the
time of our 2010 evaluation:
Inmate population was expected to surpass system-wide
housing capacity. The department had planned to build
capacity through a new 300-bed mental health facility and a
400-bed privately operated retained jurisdiction (riders)
facility.
Many of the inmate housing units were not compliant with
industry best practice standards on living space and
amenities.
Several facilities were found to be an old, outdated design,
decreasing their operational efficiency and ability to
adequately monitor inmates.
Deferred maintenance costs were on the rise, increasing the
total cost of operation.
We recommended that the department look at replacing
inefficiently operated or poorly designed facilities. We also
recommended that the department continually update its long-
term planning to monitor and address capacity needs.
Since our last evaluation, the department’s plans for building
capacity have only been partially realized. In 2010 the
Correctional Alternative Placement Program (CAPP) opened. The
prison, managed privately by Management Training Corporation,
houses 438 retained jurisdiction (riders) inmates. The proposed
300-bed mental health facility was never built, despite being
approved by the Legislature in 2008.
Crowded, aging,
outdated facilities
Managing Correctional Capacity
31
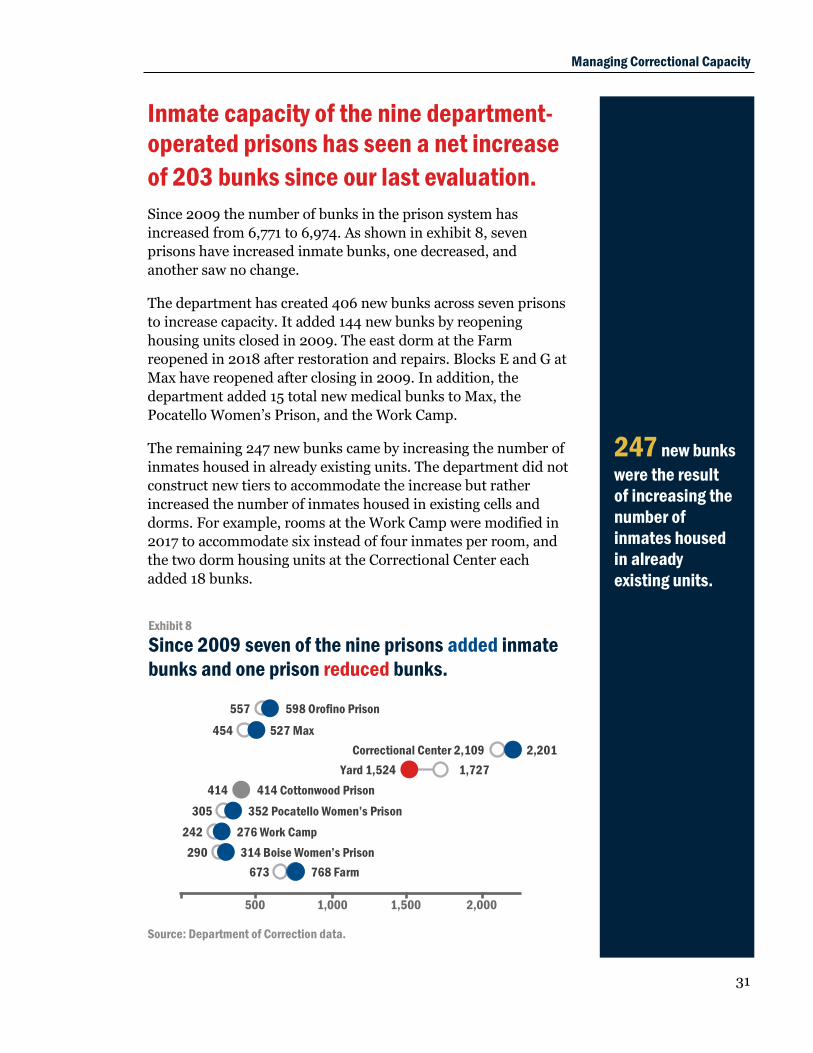
Inmate capacity of the nine department-
operated prisons has seen a net increase
of 203 bunks since our last evaluation.
Since 2009 the number of bunks in the prison system has
increased from 6,771 to 6,974. As shown in exhibit 8, seven
prisons have increased inmate bunks, one decreased, and
another saw no change.
The department has created 406 new bunks across seven prisons
to increase capacity. It added 144 new bunks by reopening
housing units closed in 2009. The east dorm at the Farm
reopened in 2018 after restoration and repairs. Blocks E and G at
Max have reopened after closing in 2009. In addition, the
department added 15 total new medical bunks to Max, the
Pocatello Women’s Prison, and the Work Camp.
The remaining 247 new bunks came by increasing the number of
inmates housed in already existing units. The department did not
construct new tiers to accommodate the increase but rather
increased the number of inmates housed in existing cells and
dorms. For example, rooms at the Work Camp were modified in
2017 to accommodate six instead of four inmates per room, and
the two dorm housing units at the Correctional Center each
added 18 bunks.
247 new bunks
were the result
of increasing the
number of
inmates housed
in already
existing units.
Exhibit 8
Since 2009 seven of the nine prisons added inmate
bunks and one prison reduced bunks.
500 1,000 2,000 1,500
557
454
414
673
305
242
290
Yard 1,524
Correctional Center 2,109
598 Orofino Prison
527 Max
414 Cottonwood Prison
352 Pocatello Women’s Prison
276 Work Camp
314 Boise Women’s Prison
768 Farm
1,727
2,201
Source: Department of Correction data.
32
In 2019 the Legislature approved a physical expansion to the
Work Camp that will add 100 new bunks. The project is expected
to be completed in 2021 and is not included in our new bunk
count.
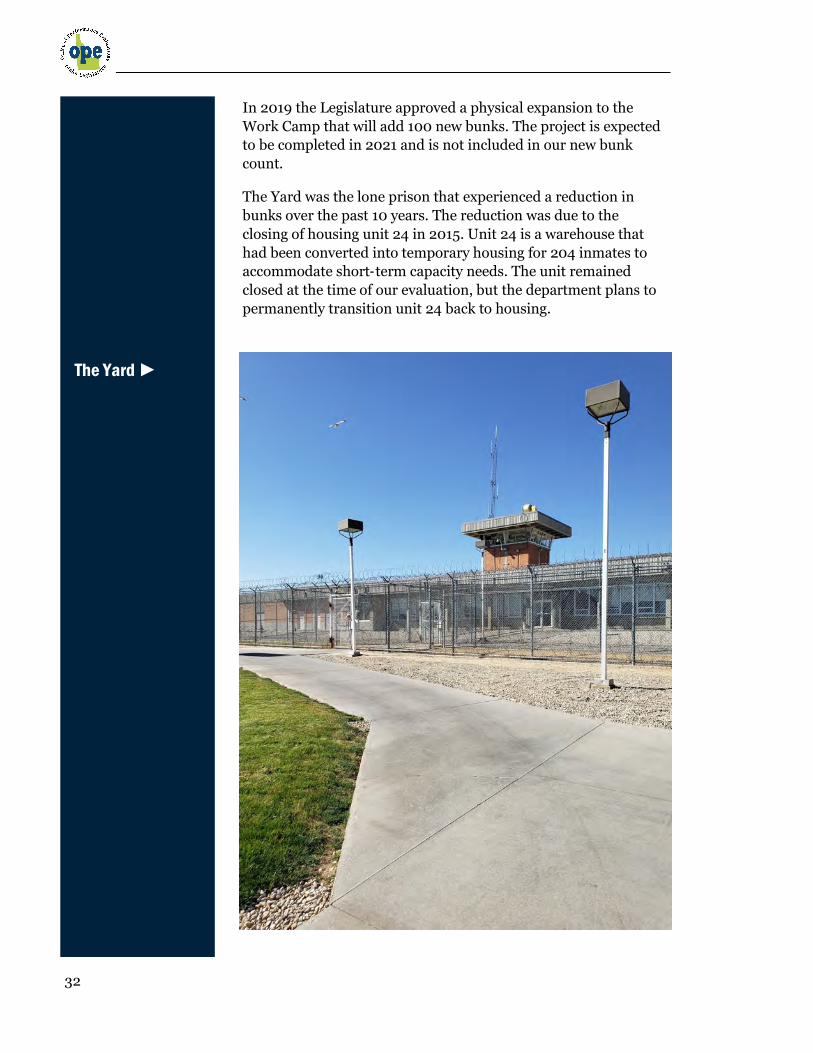
The Yard was the lone prison that experienced a reduction in
bunks over the past 10 years. The reduction was due to the
closing of housing unit 24 in 2015. Unit 24 is a warehouse that
had been converted into temporary housing for 204 inmates to
accommodate short-term capacity needs. The unit remained
closed at the time of our evaluation, but the department plans to
permanently transition unit 24 back to housing.
The Yard ►
Managing Correctional Capacity
33
The department continued to add bunks
to already overcrowded facilities.
Some units in department-operated prisons do not meet
standards for crowding. In 2008 Carter, Goble, and Lee reported
that 26 of the 51 housing units in Idaho’s prisons did not meet the
American Correctional Association (ACA) standards for inmate
housing (Carter, Goble, and Lee, A System Master Plan for the
Idaho Department of Correction, February 2008).
Twenty-four of the 26 housing units failed to allow enough
unencumbered living space per inmate, one housing unit double-
bunked close-custody inmates, and one unit did not offer enough
dayroom space. Carter, Goble, and Lee recommended a system-
wide reduction in operating capacity by 850–900 bunks to meet
ACA standards.
Since 2008, 24 of the 26 units have either stayed the same or
increased in the number of inmates housed. This increase puts
the units farther away from meeting ACA standards.
Moreover, additional housing units now likely exceed ACA
guidelines. Three housing units, two at Max and one at the
Correctional Center, double-bunked close-custody inmates. Four
housing units at the Orofino Prison added inmate bunks without
new programming space. Housing capacity at the Pocatello
Women’s Prison has increased to 352, far surpassing the Carter,
Goble, and Lee recommendation of a 288-bed maximum
capacity. However, a review of these housing units by a subject-
matter expert is necessary to definitively determine whether
housing units exceed ACA standards.
Overcrowding in prisons can lead to several problems. First,
inmate-to-staff ratios increase, causing potential challenges to
regulate and ensure safety of staff and inmates. Next, services,
such as programing and medical care, must be provided, taxing
prisons’ ability to meet inmate needs. Last, facility amenities
undergo more use and stress, speeding up their degradation and
replacement cycles.
26 of the 51
housing units in
Idaho’s prisons
did not meet the
American
Correctional
Association
standards for
inmate housing
in 2008.
24 of the 26
housing units
have either
stayed the same
or increased in
the number of
inmates housed.
34
Despite progress on some facility issues,
continuous observation remains a
challenge.
The department has made progress on addressing many of the
facility issues that were present at the time of our 2010 report.
For example, the department has started the abating process for
asbestos in older buildings. New roofs and HVAC systems have
been installed. The perimeter fence at the Work Camp was fitted
with slats to lessen interaction between inmates and the general
public. The Orofino Prison has a new maintenance shed,
increasing the maintenance capabilities of the facility and
removing the chance of inmates obtaining dangerous equipment
and tools.
Other documented issues still need to be addressed. Old and
outdated buildings that were recommended to be phased out,
such as McKelway Hall and Givens Hall at the Orofino Prison,
remain in use. Buildings that have been deemed to be fire
hazards have not been fire suppressed. Court restrictions on the
capacity of some housing units at the Yard and Max remain in
place.
One persistent challenge has been providing continuous
observation of inmates. In our 2010 report we found that there
were 24 housing units that did not allow for continuous
observation of inmates due to poor and outdated facility design.
Continuous observation lessens the chance of negative or violent
interaction among inmates and helps correctional officers
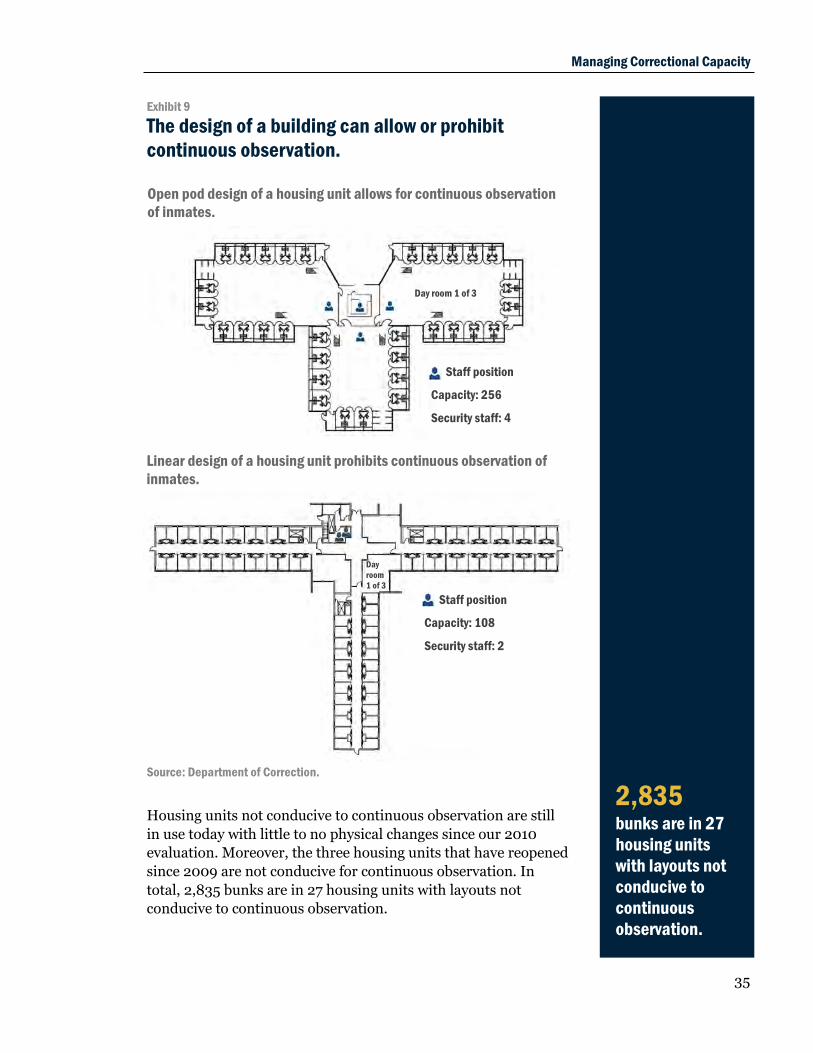
monitor the distribution of contraband. Exhibit 9 illustrates two
medium custody housing units, one designed for continuous
observation and one that is not.
Observation can either be direct, when the correctional officer
observes inmates while in the same space as the inmates, or
indirect, when the correctional officer observes inmates from
another location, such as a central command post or with
cameras.
Direct observation removes barriers and increases interaction
between staff and inmates, allowing correctional officers to
quickly identify problems and correct negative behaviors. Both
the National Institute of Corrections and the American
Correctional Association recommend that direct observation be
used when possible.
Both the
National
Institute of
Corrections and
the American
Correctional
Association
recommend that
direct
observation be
used when
possible.
Managing Correctional Capacity
35
Exhibit 9
The design of a building can allow or prohibit
continuous observation.
Open pod design of a housing unit allows for continuous observation
of inmates.
Staff position
Capacity: 108
Security staff: 2
Staff position
Capacity: 256
Security staff: 4
Day room 1 of 3
Linear design of a housing unit prohibits continuous observation of
inmates.
Day
room
1 of 3
Housing units not conducive to continuous observation are still
in use today with little to no physical changes since our 2010
evaluation. Moreover, the three housing units that have reopened
since 2009 are not conducive for continuous observation. In
total, 2,835 bunks are in 27 housing units with layouts not
conducive to continuous observation.
2,835 bunks are in 27
housing units
with layouts not
conducive to
continuous
observation.
Source: Department of Correction.

36
Housing units where continuous observation is difficult are
primarily older units or buildings not originally designed to be a
prison. For example, two buildings at the Orofino Prison were
originally meant to house mental health patients.
The department can achieve continuous observation in poorly
designed housing units by increasing correctional officers
stationed there. Increasing staffing levels can decrease the
economic efficiency of keeping such units in operation. Without a
system-wide staffing model and analysis, we were unable to
determine the exact staffing inefficiencies of the units.
The department has taken steps to increase observation of
inmates by expanding and updating camera systems. However,
relying primarily on cameras to observe inmates can create
several problems, such as inmates exploiting gaps in camera
coverage and screen fatigue among correctional officers.
Housing unit ►
at the
Correctional
Center.
The department
has taken steps
to increase
observation of
inmates by
expanding and
updating camera
systems.
Managing Correctional Capacity
37
Facility deferred maintenance has grown
since our last evaluation.
In our 2010 report we showed a maintenance backlog of
$35 million across eight facilities amounting to $40.5 million
when adjusted to 2019 dollars. Since that report, the
maintenance backlog has increased.
As of October 2019 the department had $58.6 million in
outstanding maintenance backlog across all nine facilities. This
amount includes ongoing maintenance and enhancement
projects as well as future projects that have been identified as
necessary.
Maintenance backlog is equal to about 10 percent of the total
replacement value for the nine facilities.4 Idaho’s maintenance
backlog is worse than recommended by facility best practice
standards, which recommends a maintenance backlog of less
than 5 percent of facility replacement value. Older facilities, such
as the Yard and the Cottonwood Prison, have a higher amount of
maintenance backlog in relation to their replacement value.
Unlike the 2010 maintenance backlog amount, which was all
inclusive, the new maintenance backlog of $58.6 million only
includes large projects expected to cost more than $100,000. The
total amount of maintenance backlog is almost certainly higher.
A professional facility management organization would need to
conduct a facility condition assessment to get a more accurate
picture of the true maintenance backlog amount.
In 2019 dollars, the department has spent $37.7 million on
facility maintenance over the past 10 years. Much of the
maintenance expenditure has been concentrated on older
facilities. The Yard, which has the largest outstanding
maintenance backlog, received the most in maintenance funding.
The Orofino Prison, the Cottonwood Prison, and the Farm had
the most maintenance expenditure in relation to their
replacement value.
4. The department determines facility replacement value for insurance
coverage. Value reflects the present worth of the facility. It does not
reflect the cost of building a new facility.
In 10 years, the
maintenance
backlog has
grown from
$40.5 million to
at least
$58.6
million in 2019 dollars.
Maintenance
backlog is about
10%
of the total
replacement
value of
facilities. Best
practice
standards
recommends a
maintenance
backlog of less
than
5%.
38
The department has spent a disproportionate amount on
maintenance relative to the replacement value for the
Cottonwood Prison. The prison has received $6.9 million in
maintenance funding over the past 10 years, while the facility’s
replacement value is $17.4 million. Another $6.1 million in large
maintenance projects is still outstanding at the Cottonwood
Prison.
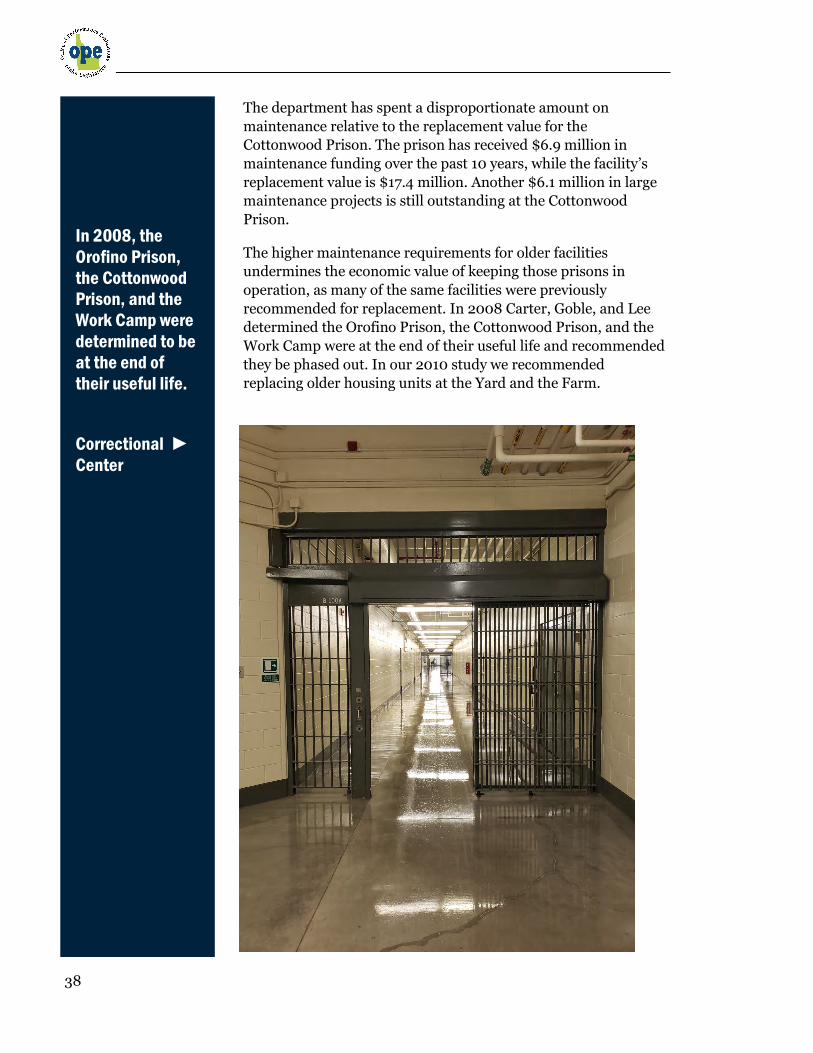
The higher maintenance requirements for older facilities
undermines the economic value of keeping those prisons in
operation, as many of the same facilities were previously
recommended for replacement. In 2008 Carter, Goble, and Lee
determined the Orofino Prison, the Cottonwood Prison, and the
Work Camp were at the end of their useful life and recommended
they be phased out. In our 2010 study we recommended
replacing older housing units at the Yard and the Farm.
Correctional ►
Center
In 2008, the
Orofino Prison,
the Cottonwood
Prison, and the
Work Camp were
determined to be
at the end of
their useful life.
Managing Correctional Capacity
39
The department is less equipped to
address facility planning than it was in
2010.
Concerns and needed areas of improvements for facilities were
well understood by the department during our last evaluation.
From 1999 to 2008, the department commissioned three
independent studies detailing the status of state prisons.
A 1999 staffing model and roster management report by
Christopher Murray discussed challenges facing staffing and
facility designs. The department did not use the model from
the report but used the report’s analysis to guide staffing and
facility improvements.
In 2006, VFA, Inc. conducted a facility condition assessment
on the maintenance status of prisons. Additionally, VFA
provided software that monitored the repair and
maintenance cycles for the major building systems at the
prisons. The department used this software to inform needed
maintenance projects until the included five-year license
expired in 2011.
In 2008 Carter, Goble, and Lee created a system master plan
of Idaho’s prisons, providing the department with a long-
term plan to deal with aging facilities and future concerns
about capacity. The master plan identified prevailing facility
deficiencies and necessary improvements.
The three documents, in conjunction with our 2010 evaluation
and 2012 follow-up, established the groundwork for a long-term
road map to improve the prison system. However, these reports
are no longer up to date. Without new analysis to update the
status of the prison system, the department has used alternative
methods to make facility planning decisions.
An example of alternative methods can be seen in how the
department tracks and addresses maintenance at the facilities.
The department relies on facility staff to monitor and report
maintenance needs. For routine maintenance projects, staff
submit electronic requests which are then carried out by
maintenance personnel at the facility. Larger maintenance
projects are annually submitted to the department’s central
office. The central department prioritizes all projects and submits
requests to the Division of Public Works.
Without new
analysis to
update the
status of the
prison system,
the department
has used
alternative
methods to make
facility planning
decisions.

40
This system for tracking maintenance does not give the
department a clear picture of the true maintenance needs. In
contrast, the VFA software displayed current and future
maintenance requirements, allowing the department to
adequately plan for upcoming maintenance projects. Without a
way to actively track maintenance, immediate needs may be
overlooked while future needs are not well understood until they
arise.
The department has implemented ad-hoc, incremental changes
to address increases in inmate population. This process made
sense in the short term, as marginal costs of reopening older
housing units and placing new bunks in existing units were less
expensive than building a new prison. However, without a long-
term plan in place to address capacity needs, the department has
not adequately prepared the prison system for continued
increases in prison population, eventually forcing the placement
of inmates into county jails and out-of-state prisons.
Recommendation
The department should work with professional facility
management organizations to conduct a facility condition
assessment of the prison system. A facility condition assessment
is a vital tool for long-term facility planning and decision making.
The facility condition assessment would inform the department
of the physical condition of every building within the system.
Additionally, it would identify replacement cycles for all major
systems and upcoming maintenance requirements. The
department can use this information to shape and reinforce
capital budgeting decisions.
The facility condition assessment should provide the department
with software to track and monitor the maintenance status of
facilities. As with the VFA software, this new software should
have the ability to be updated as maintenance projects are
completed, allowing the department to stay informed on the
conditions of the facilities.
Using the facility condition assessment, the department can
realize cost savings. It can identify buildings with
disproportionately high maintenance costs and appropriately
direct the investment of preventative maintenance.
The department
has
implemented
ad-hoc,
incremental
changes to
address
increases in
inmate
population.
Managing Correctional Capacity
41
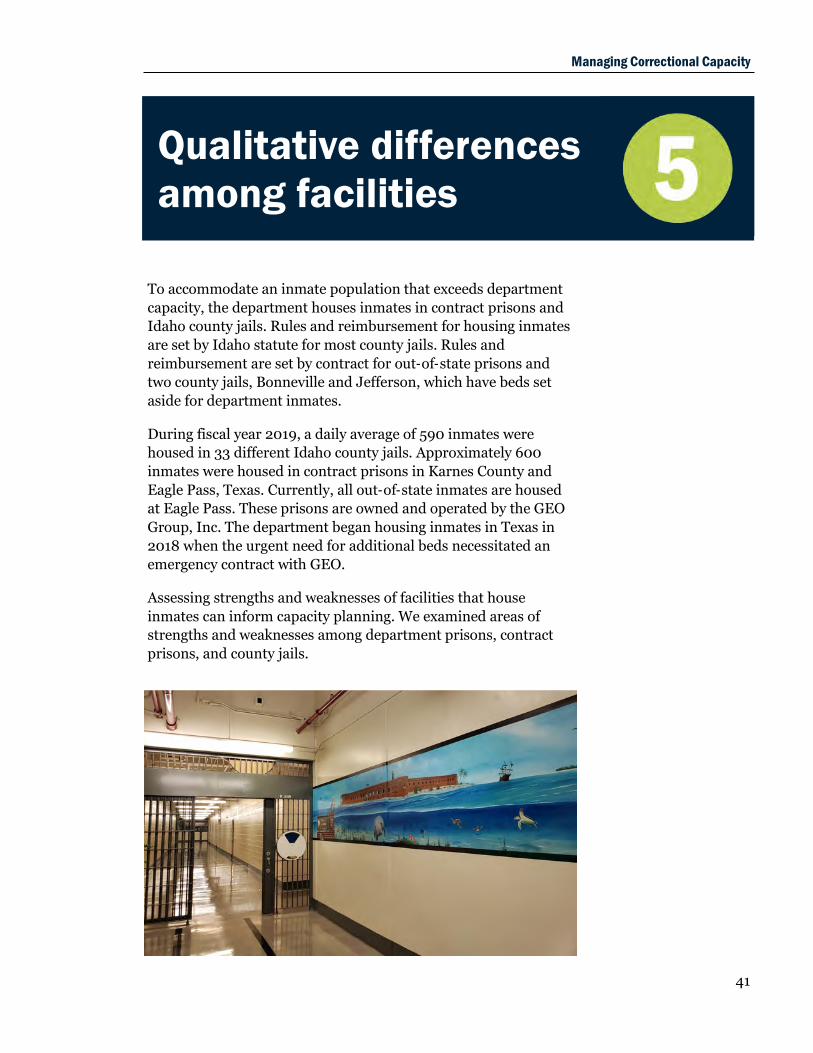
To accommodate an inmate population that exceeds department
capacity, the department houses inmates in contract prisons and
Idaho county jails. Rules and reimbursement for housing inmates
are set by Idaho statute for most county jails. Rules and
reimbursement are set by contract for out-of-state prisons and
two county jails, Bonneville and Jefferson, which have beds set
aside for department inmates.
During fiscal year 2019, a daily average of 590 inmates were
housed in 33 different Idaho county jails. Approximately 600
inmates were housed in contract prisons in Karnes County and
Eagle Pass, Texas. Currently, all out-of-state inmates are housed
at Eagle Pass. These prisons are owned and operated by the GEO
Group, Inc. The department began housing inmates in Texas in
2018 when the urgent need for additional beds necessitated an
emergency contract with GEO.
Assessing strengths and weaknesses of facilities that house
inmates can inform capacity planning. We examined areas of
strengths and weaknesses among department prisons, contract
prisons, and county jails.
Qualitative differences
among facilities
42
The department relinquishes some level
of control by housing inmates at county
jails and contract prisons.
The department exercises some control over operations at county
jails and contract prisons by actively monitoring contracts for
compliance. Additionally, the contract with GEO requires
adherence to correctional industry standards. We are unclear
whether the contractors have met this requirement.
Contract monitoring
Jails are designed for housing inmates for periods of one year or
less, and jail standards reflect that purpose. County jails are
checked annually by the Idaho Sheriffs’ Association for
compliance with their jail standards, but the department
monitors jails too. The deputy warden in charge of the contract
prison oversight unit or another staff member visits each county
jail that houses department inmates at least once per year to
evaluate inmate living conditions and security.
Relationships with contract prisons are typically governed by
long-term contracts. In 2018 the urgent need for additional beds
led the department to enter an emergency contract with GEO.
The emergency contract was far less comprehensive than a long-
term contract for housing inmates, which decreased department
control.
Department staff members, including the deputy warden in
charge of the contract prison oversight unit, serve as contract
monitors for the Eagle Pass contract. Consistent with department
philosophy of boots on the ground management, contract
monitors visit Eagle Pass every week and complete weekly,
monthly, and annual checklists to assess compliance with
contract provisions of inmate safety, security, and health. When
contract monitors discover problems, GEO must submit an
action plan within 10 days. GEO must correct the problem within
30 days of department approval of the action plan or face
sanctions. The most serious sanction, assessment of liquidated
damages, has never been used against GEO.
Experience with privately managed prisons shapes today’s
monitoring procedures. From 2000 to 2014, the department
housed inmates in the privately managed Idaho Correctional
The emergency
contract was far
less
comprehensive
than a long-term
contract for
housing inmates
in Texas and
resulted in
decreased
department
control.
Contract
monitors visit
Eagle Pass every
week and
complete
weekly, monthly,
and annual
checklists to
assess
compliance.

Managing Correctional Capacity
43
Center located south of Boise (now department operated and
renamed Idaho State Correctional Center). The contractor
understaffed the prison in violation of its contract, leading to
serious, well-publicized problems with inmate violence. The
contractor also falsified staffing records. At the time, the
department lacked contract monitoring procedures sufficient to
quickly detect the falsifications.
After lessons learned from private management of the
Correctional Center, contract monitors watch staffing levels
closely. Their monitoring checklists are more specific. They also
check staffing levels with electronic thumbprint records, video
surveillance, and unannounced weekend and nighttime visits.
Impact of lowered control
No level of contract monitoring will give the department control
over operations in Eagle Pass like it has in department-operated
prisons. In the event of group disturbances, the department must
rely on local law enforcement agencies in Texas to respond to
Eagle Pass inmates, though department staff may be consulted.
In addition, administrators in Boise have limited ability to direct
or control medical, educational, and programmatic activities in
Eagle Pass.
Lack of department control over operations in Eagle Pass is
manifested in several ways:
The emergency contract left the department at risk for health
care expenses. Health care utilization managers in Boise
acted in the interest of inmate health and authorized off-site
medical care for nearly all requests. Off-site care resulted in
medical costs of $6 per inmate day, comprising 7 percent of
total costs.
Cognitive behavioral programming has been interrupted
because of insufficiently trained instructors and shortfalls in
implementing programs as program designers intended.
Department educational staff was not involved in educational
programs at Eagle Pass. Southwest Texas Junior College was
providing GED education, but high student absenteeism led
the college to withdraw from its contract in June 2019.
No level of
contract
monitoring will
give the
department
control over
operations in
Eagle Pass like
the department
has in its prisons.
44
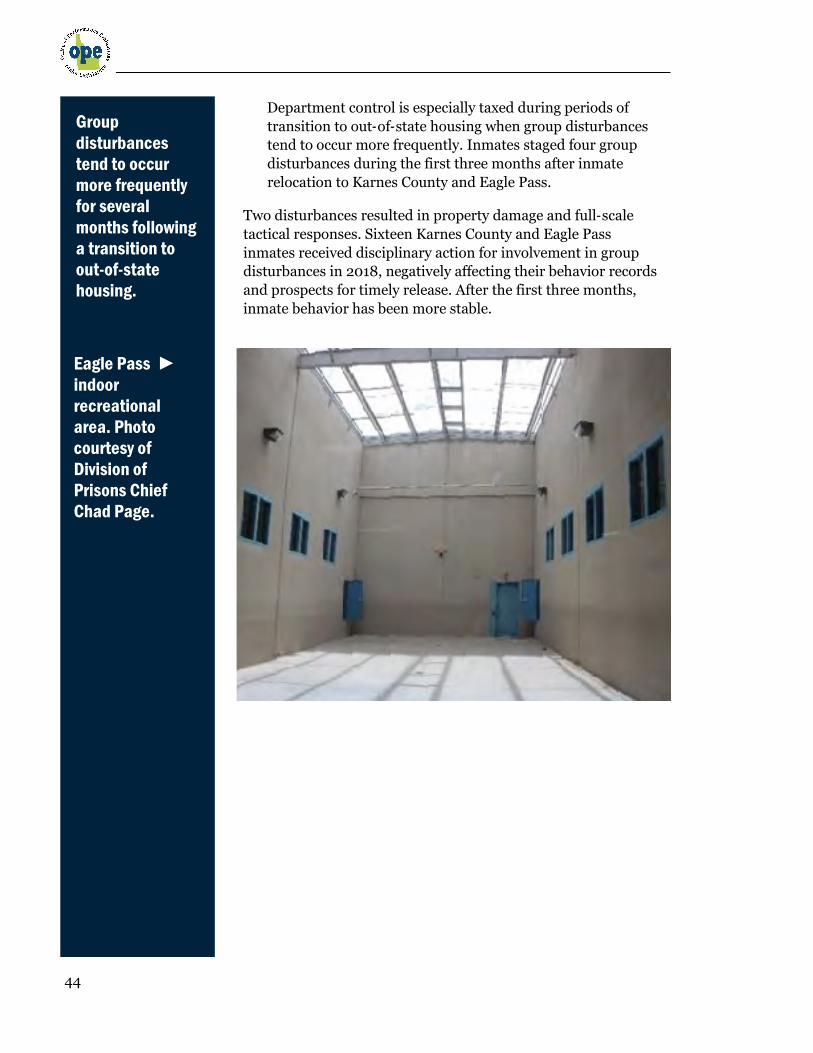
Department control is especially taxed during periods of
transition to out-of-state housing when group disturbances
tend to occur more frequently. Inmates staged four group
disturbances during the first three months after inmate
relocation to Karnes County and Eagle Pass.
Two disturbances resulted in property damage and full-scale
tactical responses. Sixteen Karnes County and Eagle Pass
inmates received disciplinary action for involvement in group
disturbances in 2018, negatively affecting their behavior records
and prospects for timely release. After the first three months,
inmate behavior has been more stable.
Group
disturbances
tend to occur
more frequently
for several
months following
a transition to
out-of-state
housing.
Eagle Pass ►
indoor
recreational
area. Photo
courtesy of
Division of
Prisons Chief
Chad Page.
Managing Correctional Capacity
45
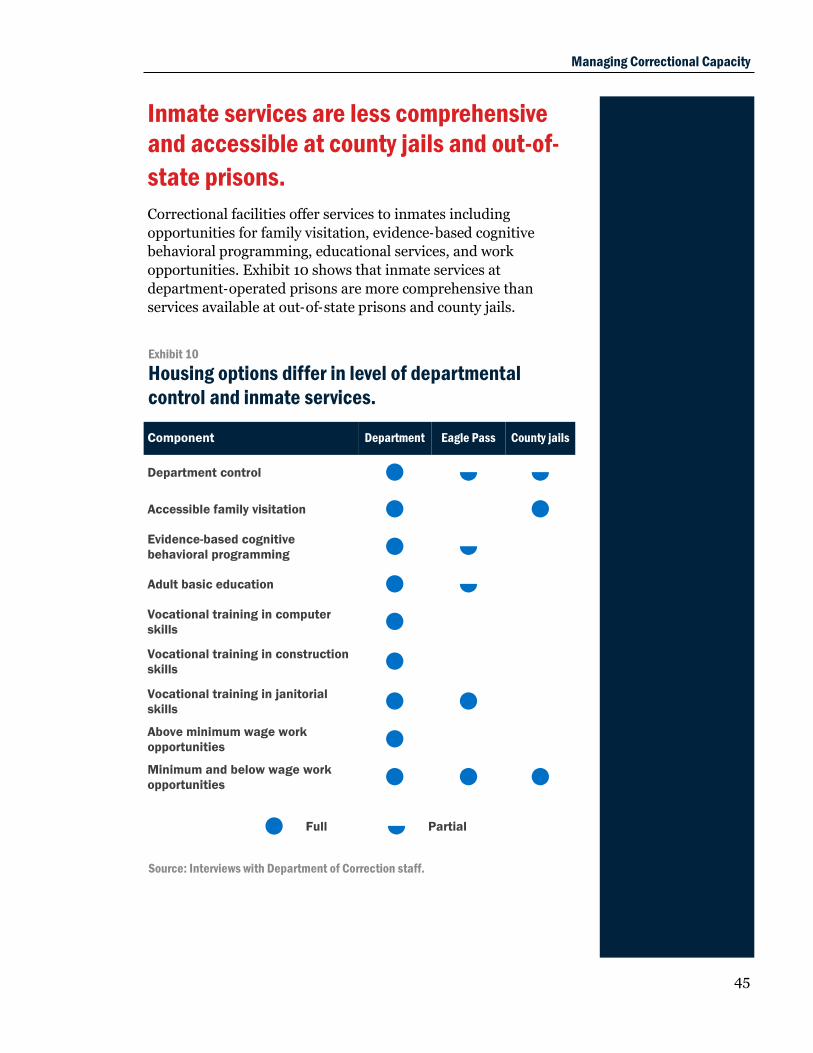
Inmate services are less comprehensive
and accessible at county jails and out-of-
state prisons.
Correctional facilities offer services to inmates including
opportunities for family visitation, evidence-based cognitive
behavioral programming, educational services, and work
opportunities. Exhibit 10 shows that inmate services at
department-operated prisons are more comprehensive than
services available at out-of-state prisons and county jails.
Exhibit 10
Housing options differ in level of departmental
control and inmate services.
Source: Interviews with Department of Correction staff.
Component Department Eagle Pass County jails
Department control
Accessible family visitation Evidence-based cognitive
behavioral programming
Adult basic education
Vocational training in computer
skills
Vocational training in construction
skills
Vocational training in janitorial
skills
Above minimum wage work
opportunities Minimum and below wage work
opportunities
Full Partial
46
Family visitation
Opportunities for visits from family and friends are limited for
inmates who are out of state. The remote location of Eagle Pass
can pose substantial difficulties for inmate family members
wishing to visit.
A 2017 meta-analysis, The Use and Impact of Correctional
Programming for Inmates on Pre- and Post-Release Outcomes,
written by Grant Duwe and sponsored by the National Institute
of Justice, concluded that prison visitation is probably the largest
source of prosocial support for inmates.
Prison visitation is effective in countering association with
antisocial peers, one of four major risk factors for criminal
behavior. It has been linked to reduced misconduct and reduced
recidivism. Inmates who are visited more frequently and by more
individual visitors are less likely to recidivate. Moving inmates
out of state lowers opportunities for family visitation, a major
contributor to inmate well-being and lowered recidivism risk.
Cognitive behavioral programs
The department offers five core evidence-based programs to
improve mental health and reduce the likelihood to recidivate:
Cognitive Behavioral Interventions for Substance Abuse
Cognitive Behavioral Interventions for Sex Offenders
Thinking for a Change
Aggression Replacement Training
Clinical Sex Offending Treatment
The department instituted these programs in 2015 after the
Council of State Governments recommended that existing
programs be replaced with evidence-based programs as part of
Justice Reinvestment Initiative (JRI) reforms.
Department staff members assess program fidelity to evidence-
based practices biannually using two checklists developed by the
University of Cincinnati. In 2019 average checklist scores were in
the “highly effective” and “very high adherence to evidence-based
practices” ranges. Despite high program fidelity, recidivism
outcomes have not improved since the institution of JRI reforms.
The department does not contractually require cognitive
behavioral programming at Eagle Pass and county jails. However,
The remote
location of Eagle
Pass poses
substantial
difficulties for
inmate family
members
wishing to visit.
Despite high
program fidelity,
recidivism
outcomes have
not improved
since the
institution of JRI
reforms.
Prison visitation
is effective in
countering
association with
antisocial peers.
Managing Correctional Capacity
47
GEO offered all core cognitive behavioral programs at Eagle Pass
except for Clinical Sex Offending Treatment. The department is
working to resolve problems with program fidelity and gaps in
class availability.
County jails are not required by Idaho Sheriffs’ Association Jail
Standards to offer cognitive behavioral programming to their
inmates. Some of the larger county jails have programmatic
offerings for their own inmates that they may choose to offer to
department inmates. These programs are not equivalent to
department programs and do not apply toward inmate parole
and release requirements.
Cognitive behavioral therapy programs address dysfunctional
thought patterns that lead to criminal behaviors. Cognitive
behavioral programming is effective in curbing prison
misconduct and has been shown to reduce recidivism by 20–30
percent according to Duwe’s meta-analysis.
Educational services
The Robert Janss School, located within department-operated
prisons, is an accredited school. It offers adult basic literacy
(attainment of 6th grade level in reading and math), vocational
reading and math (attainment of 8th grade level), high school
diploma or GED program, and career or technical education in
many areas, such as construction skills and computer literacy.
In fiscal year 2019, 90 department inmates earned certificates of
completion in adult basic literacy and 331 earned a high school
diploma or GED. Department inmates earned 1,201 career or
technical certificates including 247 Microsoft Office Specialist
certificates and 321 construction related certificates.
In contrast, inmates housed at Eagle Pass have not earned any
GED or high school diplomas though some may have made
progress toward a GED. Eagle Pass does not have GED
instructors. Inmates wanting to pursue GED certification must
assist one another using provided GED preparation materials.
Vocational certificates are limited to environmental services (i.e.,
janitorial work), and 80 Eagle Pass inmates earned certificates in
kitchen sanitation in fiscal year 2019.
Eagle Pass does
not have GED
instructors.
Inmates wanting
to pursue GED
certification
must assist one
another using
provided GED
preparation
materials.
Cognitive
behavioral
therapy
programs
address
dysfunctional
thought patterns
that lead to
criminal
behaviors.
County jails are
not required by
Idaho Sheriffs’
Association Jail
Standards to
offer cognitive
behavioral
programming to
their inmates.

48
Most county jails
do not offer
substantive
educational
programming.
Employment at
minimum wage
and higher
enables inmates
to make
restitution
payments to
their victims and
child support
payments to
their families.
Jail standards of the Idaho Sheriffs’ Association require county
jails to offer adult basic education through high school
equivalency. Educational opportunities vary by county, and most
county jails do not offer substantive educational programming.
Prison inmates are undereducated compared with the general
public. According to Duwe’s meta-analysis and another meta-
analysis sponsored by the US Department of Justice, offering
educational services to inmates improves postrelease
employment outcomes.
Work opportunities
With good behavior, inmates at department-operated prisons are
eligible to work. Opportunities vary by facility and include low
paying facility work (e.g., kitchen and janitorial jobs), minimum
wage paying work (e.g., public industry enhancement jobs), and
competitive paying community work release jobs.
Work opportunities for inmates housed out of state are limited to
below minimum wage facility jobs. Work opportunities for
inmates housed in county jails vary by jail. Jobs are limited to
janitorial work.
Employment at minimum wage and higher enables inmates to
make restitution payments to their victims and child support
payments to their families. According to Duwe’s meta-analysis,
employment among prison inmates has also been shown to
reduce prison misconduct and improve postrelease employment
outcomes.
Bonneville ►
County Work
Release Center.
Photo courtesy of
Division of
Prisons Chief
Chad Page.

Managing Correctional Capacity
49
Department budgets are impacted by costs of housing inmates at
county jails, Eagle Pass, and department-operated prisons. To
enable fair cost comparisons among facility types, we evenly
allocated costs of inmate services across facilities and compared
cost per inmate day at each facility type.
The department does not consider housing inmates in county
jails and contract prisons a permanent solution to meeting
increasing capacity needs. In the absence of policy or practice
changes that could substantially reduce the incarcerated
population, the department must increase its capacity to house
rapidly rising numbers of inmates. Outside of reopening unit 24
at the Yard, we are not aware of any potential options to expand
capacity within existing prisons.
The department will likely need to look to new facility
construction to increase capacity. New facilities may differ in
important ways from existing prisons. They can support
innovative, cost-effective approaches to corrections. To inform
capacity planning, we estimated cost per inmate day at new
medium and minimum security prisons using operating costs
from department efficiency benchmarks. Actual operating costs
at new, cost-effective facilities may be lower. The facilities we
used as benchmarks for comparison may not be the most cost-
effective facilities and operations for addressing future capacity
needs.
Cost comparison
of facilities
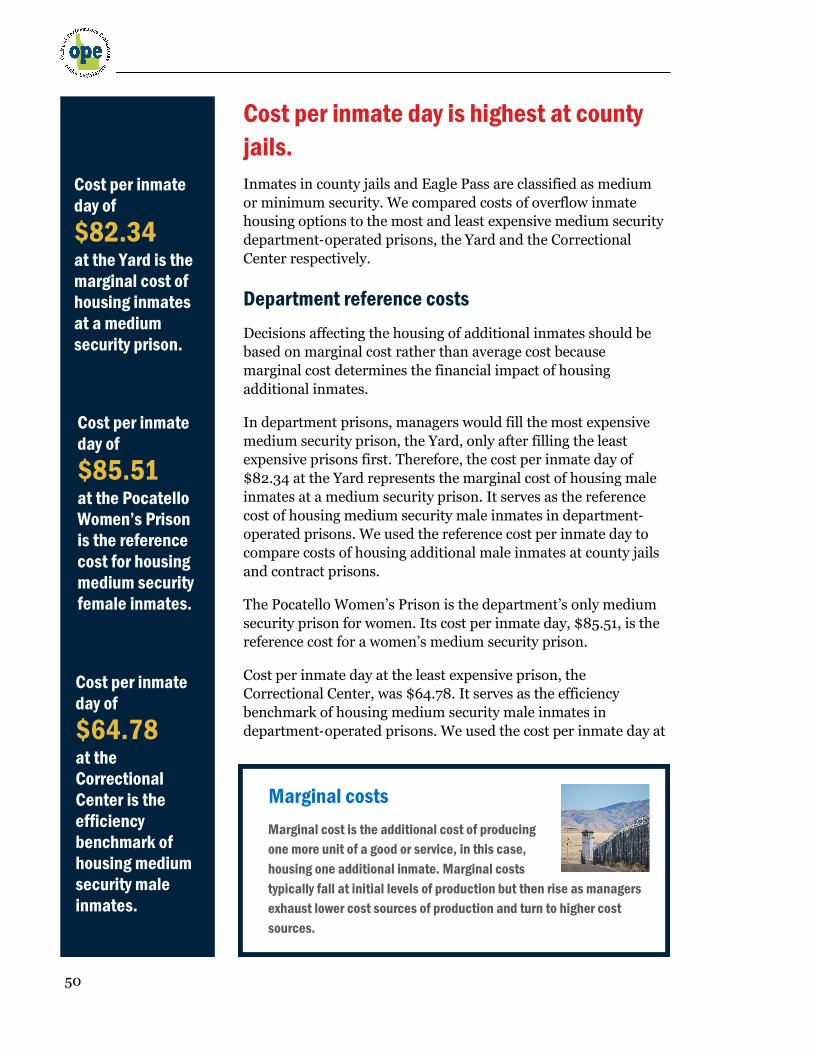
50
Cost per inmate day is highest at county
jails.
Inmates in county jails and Eagle Pass are classified as medium
or minimum security. We compared costs of overflow inmate
housing options to the most and least expensive medium security
department-operated prisons, the Yard and the Correctional
Center respectively.
Department reference costs
Decisions affecting the housing of additional inmates should be
based on marginal cost rather than average cost because
marginal cost determines the financial impact of housing
additional inmates.
In department prisons, managers would fill the most expensive
medium security prison, the Yard, only after filling the least
expensive prisons first. Therefore, the cost per inmate day of
$82.34 at the Yard represents the marginal cost of housing male
inmates at a medium security prison. It serves as the reference
cost of housing medium security male inmates in department-
operated prisons. We used the reference cost per inmate day to
compare costs of housing additional male inmates at county jails
and contract prisons.
The Pocatello Women’s Prison is the department’s only medium
security prison for women. Its cost per inmate day, $85.51, is the
reference cost for a women’s medium security prison.
Cost per inmate day at the least expensive prison, the
Correctional Center, was $64.78. It serves as the efficiency
benchmark of housing medium security male inmates in
department-operated prisons. We used the cost per inmate day at
Marginal costs
Marginal cost is the additional cost of producing
one more unit of a good or service, in this case,
housing one additional inmate. Marginal costs
typically fall at initial levels of production but then rise as managers
exhaust lower cost sources of production and turn to higher cost
sources.
Cost per inmate
day of
$64.78 at the
Correctional
Center is the
efficiency
benchmark of
housing medium
security male
inmates.
Cost per inmate
day of
$82.34 at the Yard is the
marginal cost of
housing inmates
at a medium
security prison.
Cost per inmate
day of
$85.51 at the Pocatello
Women’s Prison
is the reference
cost for housing
medium security
female inmates.
Managing Correctional Capacity
51
the efficiency benchmark prison, the Correctional Center, to
calculate potential savings from building new, efficient prisons.
County jail costs
Idaho Code § 20-237A sets reimbursement for housing
department inmates in county jails at $55 per inmate day for the
first seven days and $75 per inmate day thereafter. Most days (85
percent) are billed at the higher rate and average housing cost is
$71.15 per inmate day. Total cost per inmate day also includes
costs for off-site medical care, and contract administration and
oversight.
These costs do not provide a complete picture, however. For a
complete picture, we also looked at services offered to inmates at
department-operated prisons and at county jails.
We found that services such as medical care, cognitive behavioral
programming, and education offered to inmates at county jails
are not equivalent to offerings in department-operated prisons.
For example, the Yard houses a mental health unit, a receiving
and diagnostic unit, and extensive basic and vocational education
programs. A jail in a rural Idaho county may offer few services
beyond food, shelter, and security.
The department must transfer inmates housed in county jails to
department prisons to receive required cognitive behavioral
programming before their release. It also regularly transfers
inmates in need of medical care to its prisons for treatment.
To accurately represent costs of housing department inmates in
county jails, we reallocated costs of medical services, cognitive
behavioral programs, and education to spread the costs of
department services evenly across county jail and department
prison populations. Medical care was the largest source of
reallocated costs (see appendix D for our allocation methods).
When we reallocated costs for medical care, programming, and
education, the cost per inmate day in a county jail was $95.45.
This reallocation represents a 16 percent increase over the
reference cost of housing inmates in department-operated
prisons, making county jails the most expensive option for
housing department inmates.
At $95.45 per inmate day,
county jails are
the most
expensive option
for housing
department
inmates.

52
The high cost of housing inmates in county jails reflects the gap
in services between county jails and department-operated
prisons. Medical care comprises 23 percent of department
expenses. Omitting costs of department provided medical care
from costs of housing inmates in county jails significantly
underestimates actual costs.5
Department inmates are housed in county jails for two reasons:
(1) capacity shortages at department-operated prisons and (2)
normal processes of the justice and corrections systems.
Approximately 75 percent of department inmates housed in
county jails are placed there because of capacity shortages. If the
department had been able to house 75 percent of county jail
inmates at the efficiency benchmark Correctional Center’s cost
per inmate day of $64.78, it would have saved approximately
$5 million in fiscal year 2019.
5. Level of on-site medical care varies considerably among county jails.
Because of this variation, we did not include the cost of on-site medical
care provided by county jails in our analysis. Including this cost would
not change our conclusion that county jails are the most expensive
housing option, though it would decrease the gap in costs between
county jails and other facility types.
Approximately
75%
of department
inmates housed
in county jails
are placed there
because of
capacity
shortages.

Managing Correctional Capacity
53
Marginal costs per inmate day of
department-operated prisons and Eagle
Pass are similar.
We calculated the cost per inmate day at Eagle Pass by totaling
expenses for housing, off-site medical care, transportation, and
contract administration and oversight. Eagle Pass provides on-
site medical care, programming, and education, so we did not
allocate these department costs to Eagle Pass.
Cost per inmate day at Eagle Pass is estimated to be $82.33,
which is similar to the reference cost of housing inmates at the
Yard. This amount does not factor in significant human costs
associated with locating inmates out of state.
Cost comparisons between department-operated prisons and
Eagle Pass would be very different if all department-operated
prisons were as new and efficient as the efficiency benchmark
prison, the Correctional Center. Cost per inmate day at Eagle
Pass was 27 percent higher than the efficiency benchmark, the
Correctional Center. If the 600 inmates housed at Eagle Pass
could have been housed at an efficient department-operated
prison, the department would have saved approximately $3.8
million in fiscal year 2019.
Cost per inmate
day at Eagle
Pass is
estimated to be
$82.33.
Cost per inmate
day at Eagle Pass
was
27% higher
than the
efficiency
benchmark, the
Correctional
Center.
◄ Correctional
Center
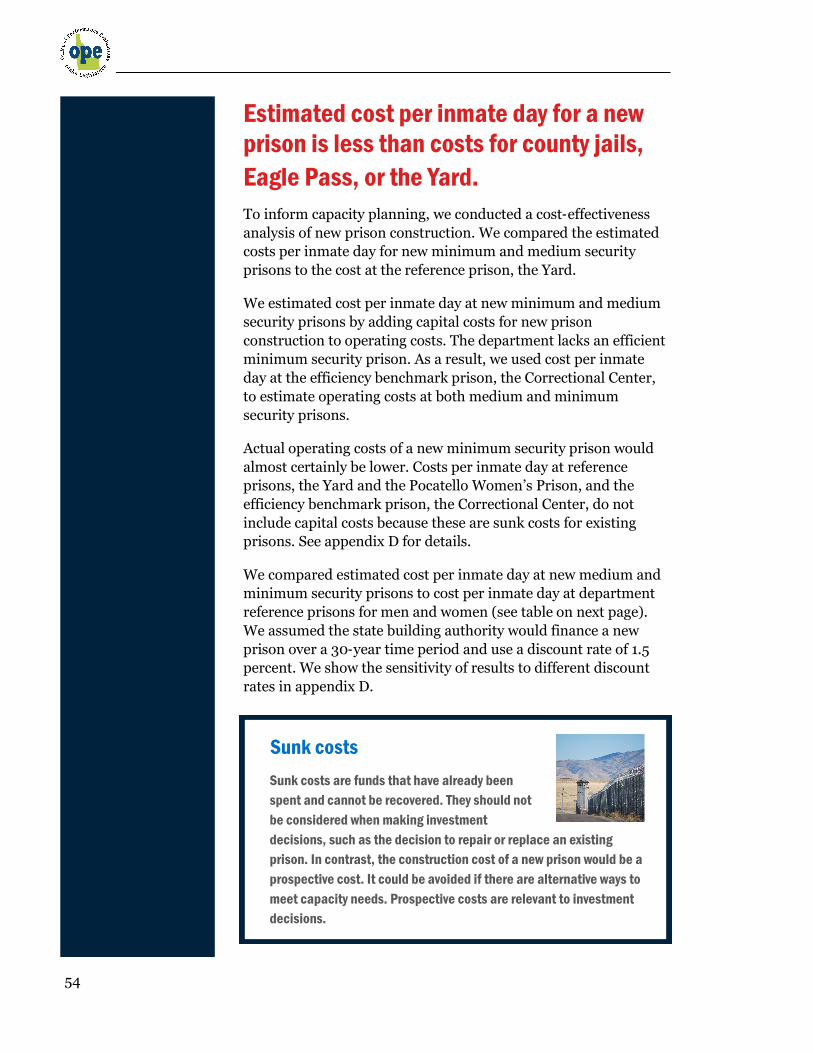
54
Estimated cost per inmate day for a new
prison is less than costs for county jails,
Eagle Pass, or the Yard.
To inform capacity planning, we conducted a cost-effectiveness
analysis of new prison construction. We compared the estimated
costs per inmate day for new minimum and medium security
prisons to the cost at the reference prison, the Yard.
We estimated cost per inmate day at new minimum and medium
security prisons by adding capital costs for new prison
construction to operating costs. The department lacks an efficient
minimum security prison. As a result, we used cost per inmate
day at the efficiency benchmark prison, the Correctional Center,
to estimate operating costs at both medium and minimum
security prisons.
Actual operating costs of a new minimum security prison would
almost certainly be lower. Costs per inmate day at reference
prisons, the Yard and the Pocatello Women’s Prison, and the
efficiency benchmark prison, the Correctional Center, do not
include capital costs because these are sunk costs for existing
prisons. See appendix D for details.
We compared estimated cost per inmate day at new medium and
minimum security prisons to cost per inmate day at department
reference prisons for men and women (see table on next page).
We assumed the state building authority would finance a new
prison over a 30-year time period and use a discount rate of 1.5
percent. We show the sensitivity of results to different discount
rates in appendix D.
Sunk costs
Sunk costs are funds that have already been
spent and cannot be recovered. They should not
be considered when making investment
decisions, such as the decision to repair or replace an existing
prison. In contrast, the construction cost of a new prison would be a
prospective cost. It could be avoided if there are alternative ways to
meet capacity needs. Prospective costs are relevant to investment
decisions.
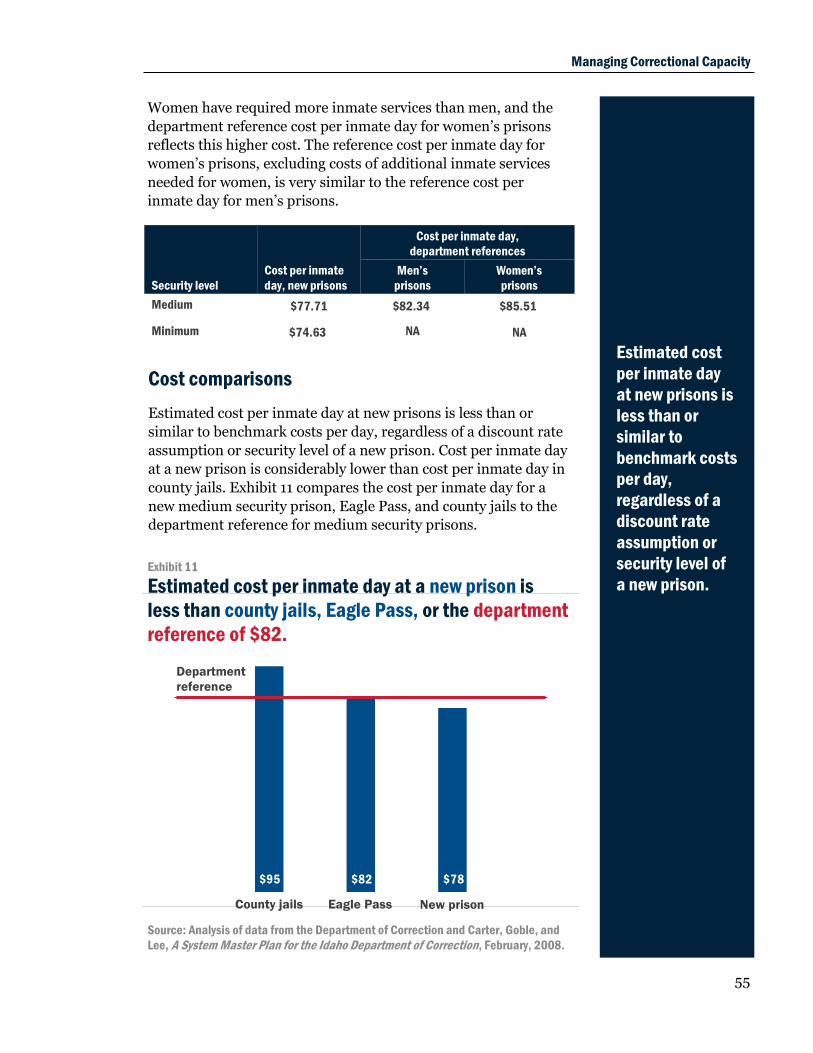
Managing Correctional Capacity
55
$95 $82 $78
Exhibit 11
Estimated cost per inmate day at a new prison is
less than county jails, Eagle Pass, or the department
reference of $82.
County jails Eagle Pass New prison
Department
reference
Women have required more inmate services than men, and the
department reference cost per inmate day for women’s prisons
reflects this higher cost. The reference cost per inmate day for
women’s prisons, excluding costs of additional inmate services
needed for women, is very similar to the reference cost per
inmate day for men’s prisons.
Security level
Cost per inmate
day, new prisons
Cost per inmate day,
department references
Men’s
prisons
Women’s
prisons
Medium $77.71 $82.34 $85.51
Minimum $74.63 NA NA
Cost comparisons
Estimated cost per inmate day at new prisons is less than or
similar to benchmark costs per day, regardless of a discount rate
assumption or security level of a new prison. Cost per inmate day
at a new prison is considerably lower than cost per inmate day in
county jails. Exhibit 11 compares the cost per inmate day for a
new medium security prison, Eagle Pass, and county jails to the
department reference for medium security prisons.
Estimated cost
per inmate day
at new prisons is
less than or
similar to
benchmark costs
per day,
regardless of a
discount rate
assumption or
security level of
a new prison.
Source: Analysis of data from the Department of Correction and Carter, Goble, and
Lee, A System Master Plan for the Idaho Department of Correction, February, 2008.
56
The Yard was built beginning in 1972, and some units are nearing
the end of their expected lives. The Yard has a significant risk of
higher than expected maintenance costs. The cost difference
between the department reference for medium security prisons,
the Yard, and a new prison may be greater than we have
indicated if maintenance costs at the Yard increase in the future.
The reference and efficiency benchmark costs we use in this
analysis are based on cost information and are not meant to
suggest that the reference and benchmark facilities are the same
kind of facilities with the same kinds of operations that the
department would put into place in the future. The department
could possibly improve or enhance operations and have different
or better design while offering a viable alternative to today’s
inmate housing options. Also, this analysis focuses on
opportunities to address capacity needs for secure incarceration.
Community options and diversion programs may obviate the
need for a portion of secure capacity.
We spread prison construction costs over a useful life of 50 years;
however, bond funding is typically for a shorter length of time.
Because new prison construction costs may be paid over a shorter
time than the prison’s expected useful life, cash outflow during
years of bond repayment may be higher than cost per inmate day
estimates.
This cost-effectiveness analysis suggests potential cost savings
from new prison construction but does not replace capital
budgeting methods employing more detailed cost estimates. Our
analysis results show that highest savings could be achieved by
expanding capacity for women and minimum security inmates.
New facilities or improved operations could offer
innovative alternatives for housing inmates,
provide needed treatment and support to
inmates, and enable successful transition to
community life. The potential to improve inmate
outcomes while lowering costs indicates that the cost-
effectiveness of department operations may be improved from
today’s levels.
Highest savings
could be
achieved by
expanding
capacity for
women and
minimum
security inmates.
Managing Correctional Capacity
57
New medium security prison for women
Cost per inmate day at the department’s only medium security
prison for women, the Pocatello Women’s Prison, is high because
of inefficient design and related staffing costs. Replacing this
prison is projected to be cost saving. Additional cost savings
could be realized by relocating the medium security women’s
prison to the Treasure Valley, which is centrally located within
the state and the major population center.
The location of the Pocatello Women’s Prison contributes to
transportation costs. The primary receiving and diagnostic unit
and the medical clinic for women are located within the Pocatello
Women’s Prison, and many inmates must be transported from
the state’s population center in the Treasure Valley to Pocatello to
receive services. Though weekly east-west runs are scheduled
anyway, smaller buses and fewer staff members would likely be
involved in transportation runs if the medium security prison,
the receiving and diagnostic unit, and the medical clinic for
women were in the Treasure Valley.
There is also a human cost to having the main women’s prison
located in Pocatello. Many female inmates are separated from
their minor children who live far from Pocatello. Locating a new
women’s prison in the Treasure Valley would likely place more
female inmates closer to their children and alleviate the human
costs of separating incarcerated women from their children.
New minimum security prison for men
We project that expanding minimum security capacity for men is
cost saving. The department does not have an efficient minimum
security prison for men, and approximately 1,000 department
inmates classified as minimum security are housed in medium
security facilities at unnecessarily high cost. Housing inmates at a
higher than necessary security level may also increase recidivism
according to several studies, including a 2007 study of federal
inmates by Chen and Shapiro and a 2009 randomized controlled
trial of California inmates by Gaes and Camp.
Impact of cost on facility replacement decisions
Our analysis shows that even when we include construction costs,
estimated costs per inmate day of new medium and minimum
security prisons are similar to or lower than today’s department
cost structures. New prison construction is an economically
viable alternative for policymakers seeking to address capacity
shortages and will likely be necessary in the long term.
New prison
construction is
an economically
viable
alternative for
policymakers
seeking to
address capacity
shortages and
will likely be
necessary in the
long term.
Approximately
1,000 department
inmates
classified as
minimum
security are
housed in
medium security
facilities at
unnecessarily
high cost.
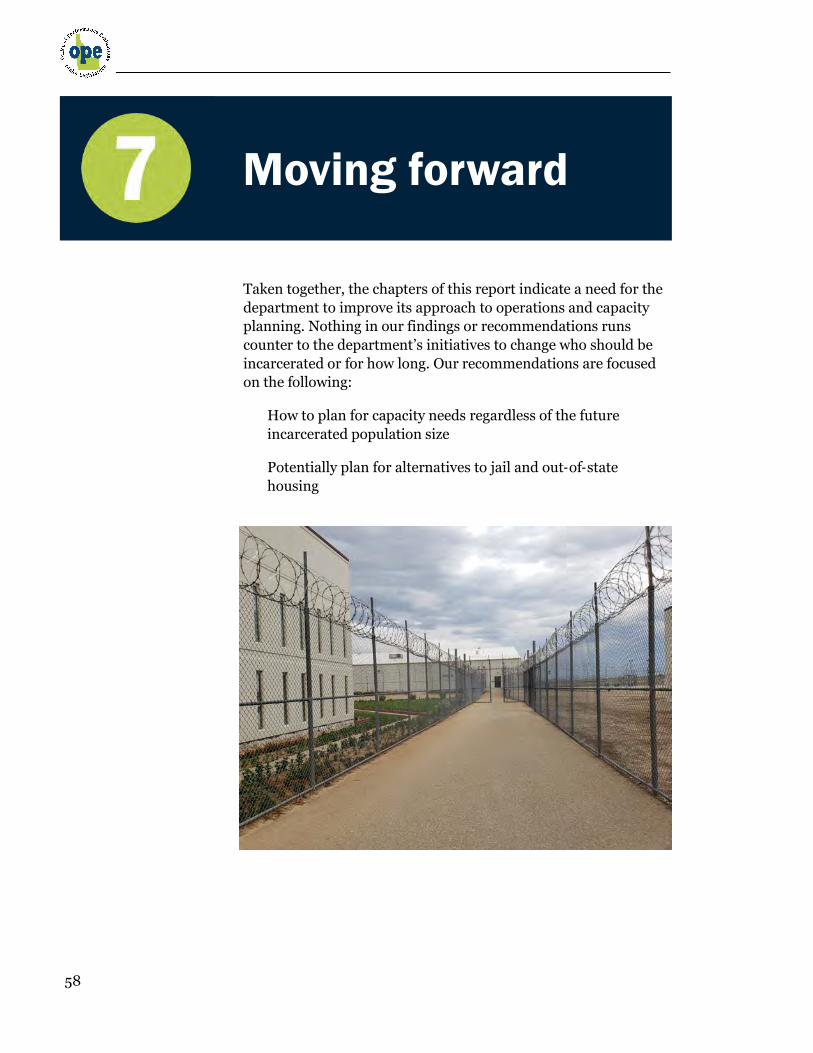
58
Taken together, the chapters of this report indicate a need for the
department to improve its approach to operations and capacity
planning. Nothing in our findings or recommendations runs
counter to the department’s initiatives to change who should be
incarcerated or for how long. Our recommendations are focused
on the following:
How to plan for capacity needs regardless of the future
incarcerated population size
Potentially plan for alternatives to jail and out-of-state
housing
Moving forward
Managing Correctional Capacity
59
The department needs to improve its
operations and capacity planning.
Over the past decade, the incarcerated population has grown
substantially, facility maintenance needs have grown as they
continue to age, and the department’s options for housing
inmates has remained limited. As a result, the department is at a
critical juncture in planning for how it will cost-effectively
operate its facilities and house the rapidly increasing number of
inmates.
One thing unchanged over the past decade is the need for the
department to develop and use an operational master plan that
incorporates a staffing model. Many questions about whether
staffing levels are adequate can be answered through a staffing
model. A staffing model can be the basis of a plan for consistent
and efficient staffing of prison facilities. Based on facility design
and necessary security activities at each prison, a staffing model
can provide a framework for systematically determining the
number of necessary posts.
The lack of a master plan has contributed to the absence of a
cohesive, long-term facilities plan for the department, leaving the
department without a way to actively track maintenance. As a
result, immediate needs may be overlooked, and future needs are
not well understood until they arise.
The effects of operating without a master plan can be seen in how
the department has managed capacity shortages over the past ten
years.
Without a plan to address capacity needs, the department has
implemented ad-hoc, incremental changes to deal with increases
in inmate population. This process made sense in the short term,
as marginal costs of reopening older housing units and placing
new bunks in existing units was less expensive than building a
new prison.
However, the department did not adequately prepare the system
for continued increases in prison population. It eventually forced
the placement of inmates in county jails and out-of-state prisons
after the population rose above what in-house capacity could be
reasonably extended to.
The department
needs to have an
operational
master plan that
incorporates a
staffing model.
Immediate
needs may be
overlooked, and
future needs are
not well
understood
without a master
plan.
The department
has
implemented
ad-hoc,
incremental
changes to deal
with increases in
inmate
population.

60
Our cost-effectiveness analysis indicates that new facility
construction could lead to cost savings. It does not, however,
replace capital budgeting methods that employ more detailed
cost estimates.
By taking a proactive approach to capacity planning, the
department could find alternatives that avoid placing inmates in
county jails or contract prisons. The department would be better
able to avoid costly emergency contracts with more robust
capacity planning. In addition to financial benefits, the
department could also reduce the human and qualitative cost of
county and out-of-state placements.
Recommendation
The department should develop and maintain a system-wide
master plan. The plan should draw upon our recommendations
throughout this report and the knowledge that jail and out-of-
state placements pose cost, programming, and other qualitative
disadvantages. The master plan should include the following:
A system-wide staffing model
Clarification of historical growth drivers and evaluation of the
effectiveness of past responses to those drivers
A robust, long-term forecast of the population under
correctional control that includes 5–10 year projections in
addition to the current two-year horizon
A facility condition assessments and likely future
maintenance costs of aging facilities
Recommendations for physical improvements to facilities or
their major systems
In-depth cost effectiveness analysis of current and
prospective housing options
Managing Correctional Capacity
61
Request for
evaluation
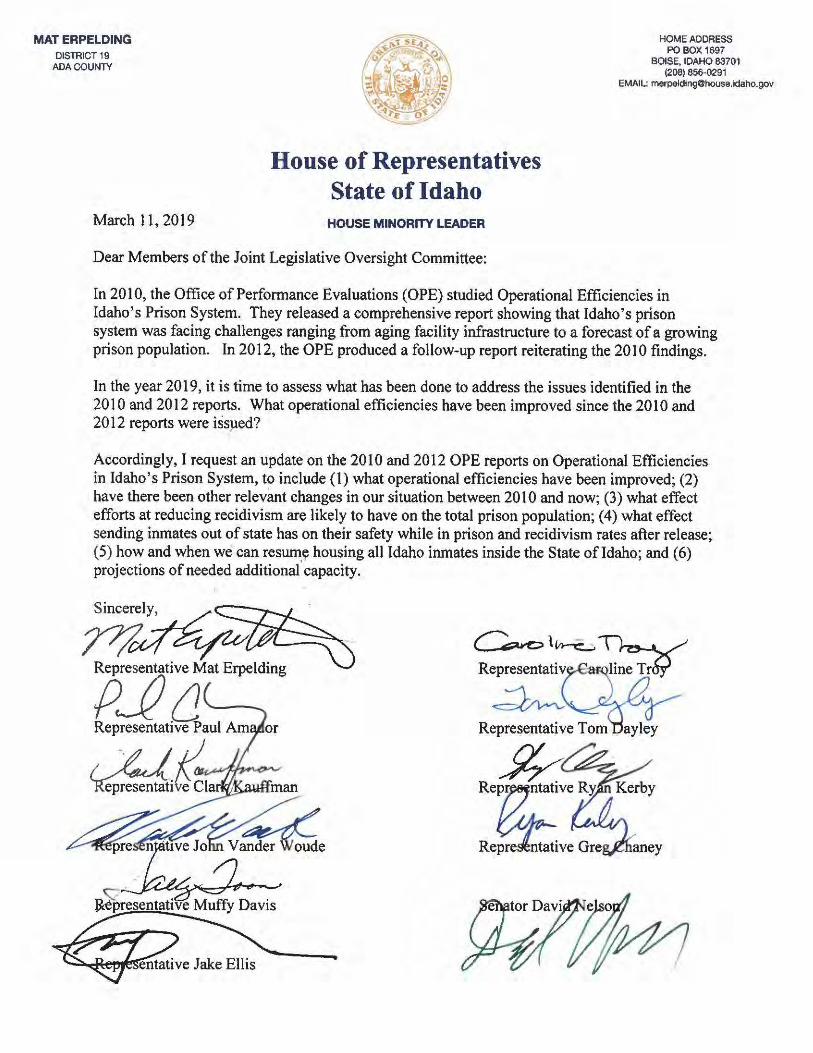
62

Managing Correctional Capacity
63
At a minimum, we will evaluate the progress the department has
made since our 2012 follow-up. We will specifically look at the
following:
How has the department addressed our recommendations to
improve operational practices such as the use of a statewide
standardized staffing model and the effective use of a shift
relief factor tool?
How has the department addressed our recommendation to
begin planning for the replacement of inefficient prisons or
housing units?
To the degree that time and information permit, we will also help
answer three additional questions asked by policymakers:
How is the department planning to accommodate the
projected growth within its incarcerated and supervised
populations and move toward returning Idaho prisoners from
out-of-state and county placements?
What is known about drivers of recidivism, options for
reducing recidivism, and the effect that recidivism reduction
efforts are likely to have on the prison population growth?
What is the department doing to understand and reduce
recidivism?
Evaluation scope

64
A decade after the Joint Legislative Oversight Committee first
asked us to evaluate operations and capacity planning in Idaho’s
prisons, the department still has ongoing challenges. We
designed this evaluation to assess what has been done since our
2010 evaluation and what else can be done to address the long-
standing issues of capacity and operations.
Interviews and site visits
We conducted more than 30 interviews with department
management and staff at the central office and all nine of Idaho’s
prisons.
To further understand the design and operations of Idaho’s
prisons, we visited three prisons within the south Boise prison
complex. We visited the two largest prisons, the Correctional
Center and the Yard, and the only maximum-security prison in
the system, Max. We toured the facilities with wardens, the chief
of prisons, and other prison administrative staff. On our visits we
discussed operations of the prison, such as staffing and
programming, challenges facing the facility, and upcoming
construction or changes in operation.
Literature review
Numerous state and national organizations have studies, reports,
and recommendations about prison operations. We reviewed this
literature to assess how Idaho’s prison system is operating when
compared with best practice standards. Topics that we reviewed
include:
Correctional officer staffing practices
Inmate housing standards
Methodology

Managing Correctional Capacity
65
Facility condition assessment and servicing practices
Impact of correctional programming on inmates
Effects of prison visitation and educational opportunities
on inmate recidivism
Forecasting of prison populations
Document review
We reviewed documents from the department to understand
present operations. These documents include educational
attainment reports, contracts for out-of-state and county inmate
placement, and program effectiveness reports.
Additional documents reviewed include facility maps, recent
capital project proposals, annual reports of the Justice
Reinvestment Initiative, department policies and procedures,
and relevant statutes.
We used documents from our 2010 evaluation to assess changes
in operational practices. Documents from 2010 include third-
party reports on the prison system and interviews held with
wardens and administrators of the prison system.
Data analysis
We analyzed data provided by the department that included
financial, population, and facilities data. Financial data included
cost per inmate day for all nine prisons, such as programming,
education, and medical expenditures, and maintenance project
expenditures.
Additional data from the department included inmate population
counts, population forecasts, inmate housing capacity, facility
gross square footage numbers, staffing post plans, and the shift
relief factor.
For out-of-state placements, the department gave us financial
data for the costs of contract administration, contract oversight,
off-site medical costs, and transportation. For county
placements, we received data from the department on medical
costs, the number of inmates housed within county jails, and
invoices for payments to county jails.
66
Cost per inmate per day calculations
Costs per inmate day for various prisons are reported by
department accounting staff and reflect operating costs of
housing, security, food, medical care, and inmate services. We
also collected data from department managers on costs of
medical care, transportation, and contract administration and
oversight for contract facilities.
We made the following changes to numbers reported by
accounting staff:
1. Adjusted costs to reflect charges incurred in Idaho
financial fiscal year 2019 rather than charges paid in fiscal
year 2019.
2. Reallocated contract administration and oversight costs
to reflect actual costs for out-of-state prisons and county
jails.
3. Added medical costs of contract amendment no. 14 to
total medical costs.
4. Totaled medical costs of department prisons and
community reentry centers and off-site medical expenses
of county jail inmates. Reallocated evenly across the
population housed in all department facilities and county
jails.
5. Totaled counseling costs and reallocated across
department prisons. We did not allocate these costs to
county jails because counseling services are available to
county jail inmates.
6. Totaled costs of cognitive behavioral programming and
education and allocated across populations housed in
department prisons and county jails.
Cost calculation
details
Managing Correctional Capacity
67
7. Calculated costs per inmate day for contract prisons by
totaling per diem housing charges and costs of off-site
medical care, transportation between Idaho and Texas,
and contract administration and oversight. Contract
prisons provide on-site medical care, department-
approved cognitive behavioral programming, and adult
basic education so related department costs were not
allocated to the out-of-state prisons.
8. Made small changes in the number of inmates housed in
county jails and out-of-state prisons to correct errors in
department documents.
9. Accounted for maintenance backlogs at department-
operated prisons by adding annualized equivalent costs of
maintenance backlogs at department prisons to prison
operating costs. We calculated annualized equivalent
costs by discounting costs over a 10-year time frame.
Results were not sensitive to changes in the discount rate.
Justification for allocation of expenses to
county jails
Services offered at county jails and department prisons are not
the same. Allocating costs of services across department prisons
and county jails enables fair comparisons. The largest source of
reallocated costs was medical care.
The department contracts with Corizon Health, Inc. to provide
health care for inmates housed in department-operated prisons
and community reentry centers. The capitated contract requires a
per diem paid to Corizon for each inmate housed in a department
Capitated contract
A capitated contract is a health care plan that
charges a flat fee for each patient it covers
regardless of which treatments a patient
receives or how many visits the patient makes to health care
providers or clinics. The healthcare plan typically assumes risk for
unanticipated medical costs with a capitated contract.

68
facility. Unlike many capitated contracts, the contract allows
Corizon to retroactively adjust for unexpected high costs.
Corizon may seek contract amendments resulting in extra
reimbursement or a higher per diem when medical expenses are
higher than anticipated. Contract amendments resulting in extra
reimbursement to Corizon are common. For example,
amendment no. 14 resulted in extra reimbursement of
$1,989,270 to Corizon for services provided from January 1,
2018, to June 30, 2019.
Medical care is limited in most county jails. Inmates in need of
routine medical care receive it at community health clinics.
Inmates with serious health conditions are transferred to
department-operated prisons for medical care. These transfers
happen regularly. The department does not keep records on
medical transfers, but utilization managers estimate an average
of three inmates per week are transferred from jails to
department-operated prisons to receive medical care.
The opportunity for immediate transfer of sick inmates to
department-operated prisons means that, in effect, the Corizon
contract covers the population housed in county jails for the cost
of serious illness. These costs are reflected in per diem charges
and contractual amendments. Allocating Corizon costs to county
jails as well as prisons reflects this reality and yields more
accurate cost comparisons.
Cost per inmate day at new prisons
We used the same method as our 2010 evaluation to calculate the
cost of new prison construction per bed. The process included the
following steps:
1. Accessed the cost of construction per gross square foot
and the square footage per bed needed to adhere to ACA
facility standards from Carter, Goble, and Lee’s Idaho
System Master Plan.
2. Adjusted for construction inflation from 2008 to 2019.
3. Added a 30 percent contingency for additional costs of the
project, such as architecture and engineering fees.
4. Added a financing factor of 4.8 percent to cover the total
cost of financing the project.
Inmates with
serious health
conditions are
transferred to
department-
operated prisons
for medical care.
These transfers
happen
regularly.
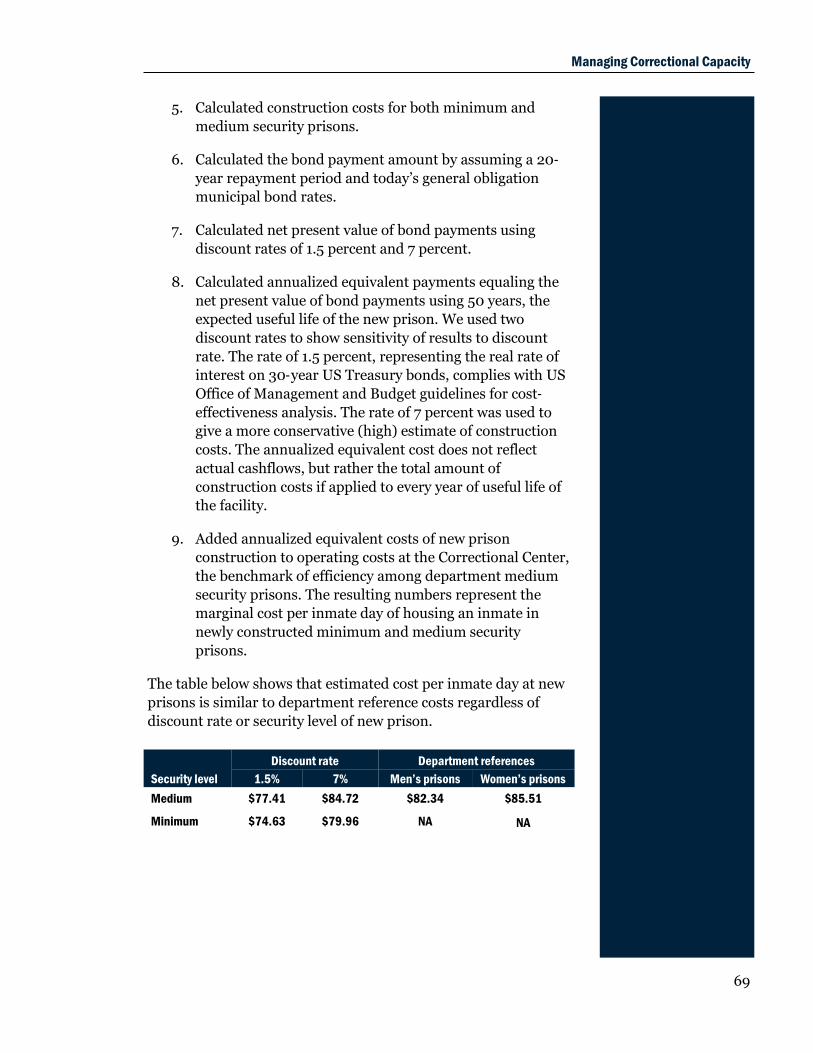
Managing Correctional Capacity
69
Security level
Discount rate Department references
1.5% 7% Men’s prisons Women’s prisons
Medium $77.41 $84.72 $82.34 $85.51
Minimum $74.63 $79.96 NA NA
5. Calculated construction costs for both minimum and
medium security prisons.
6. Calculated the bond payment amount by assuming a 20-
year repayment period and today’s general obligation
municipal bond rates.
7. Calculated net present value of bond payments using
discount rates of 1.5 percent and 7 percent.
8. Calculated annualized equivalent payments equaling the
net present value of bond payments using 50 years, the
expected useful life of the new prison. We used two
discount rates to show sensitivity of results to discount
rate. The rate of 1.5 percent, representing the real rate of
interest on 30-year US Treasury bonds, complies with US
Office of Management and Budget guidelines for cost-
effectiveness analysis. The rate of 7 percent was used to
give a more conservative (high) estimate of construction
costs. The annualized equivalent cost does not reflect
actual cashflows, but rather the total amount of
construction costs if applied to every year of useful life of
the facility.
9. Added annualized equivalent costs of new prison
construction to operating costs at the Correctional Center,
the benchmark of efficiency among department medium
security prisons. The resulting numbers represent the
marginal cost per inmate day of housing an inmate in
newly constructed minimum and medium security
prisons.
The table below shows that estimated cost per inmate day at new
prisons is similar to department reference costs regardless of
discount rate or security level of new prison.

70
Information [from this report] will be a tool for other
lawmakers and me to make the most informed decisions
possible about Idaho’s correctional capacity.
—Brad Little, Governor
IDOC is in the process of developing a new strategic plan
to better guide the department’s efforts and new
performance measurements more reflective of that
strategic direction and are better indicative of the health
of our system. The timing of this report is particularly
relevant and will help inform that work.
—Josh Tewalt, Director
Department of Correction
Responses to the
evaluation

Managing Correctional Capacity
71 71

72 72
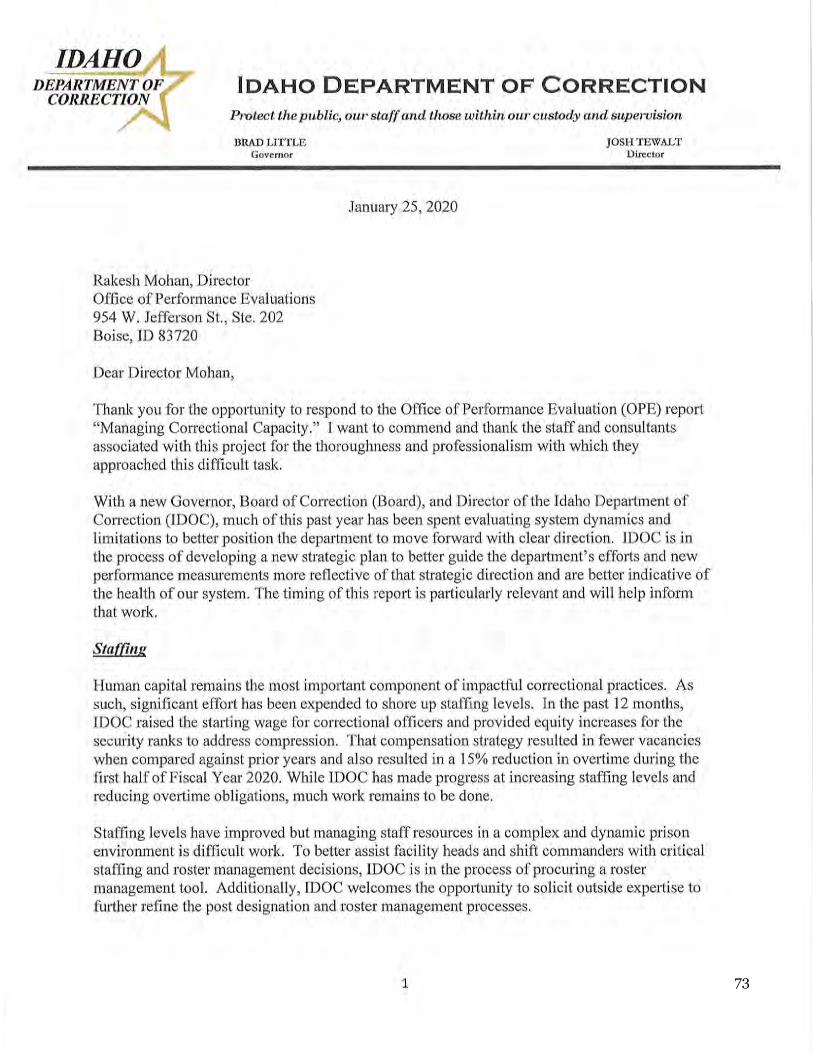
Managing Correctional Capacity
73 73
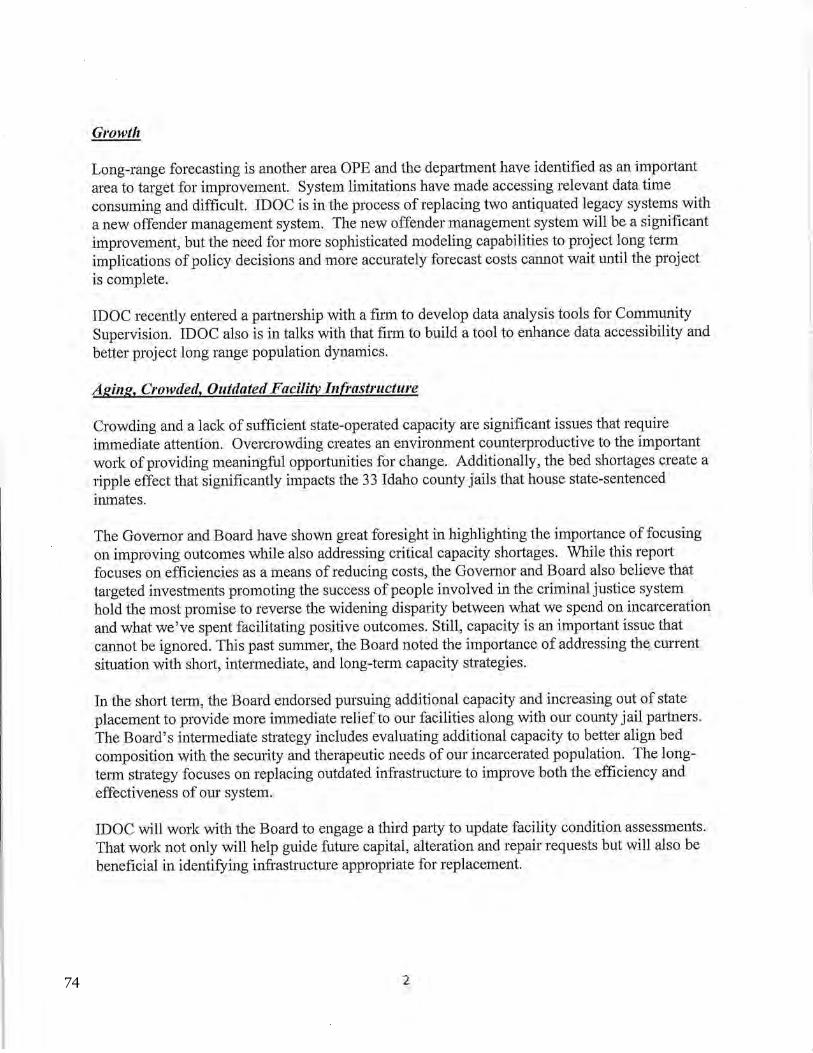
74 74
Managing Correctional Capacity
75 75
76