Embed Size (px)
Citation preview

timeDate Class timeSeries Class Summary
Managing chronological objects with timeDate
and timeSeries
Yohan Chalabi and Diethelm Wuertz
ITP ETH, ZurichRmetrics Association, Zurich
Finance Online, Zurich
R/Rmetrics WorkshopMeielisalpJune 2009

timeDate Class timeSeries Class Summary
Outline
1 timeDate ClasstimeDate DefinitionFinancial Center and Holiday Management
2 timeSeries ClasstimeSeres DefinitionPlotting timeSeries ObjectsSubsetting timeSeries ObjectsManipulating a timeSeries@recordIDs Concept
3 Summary

timeDate Class timeSeries Class Summary
Outline
1 timeDate ClasstimeDate DefinitionFinancial Center and Holiday Management
2 timeSeries ClasstimeSeres DefinitionPlotting timeSeries ObjectsSubsetting timeSeries ObjectsManipulating a timeSeries@recordIDs Concept
3 Summary

timeDate Class timeSeries Class Summary
Time and R
There are different date and time classes in R. The most common are
Date : It supports dates without times.
chron : It is a contributed package which provides dates and times.But there are not time zones or notion of daylight saving time(DST).
POSIXt : with its two subclasses POSIXct and POSIXlt. Theseclasses support time zone and DST. But time zone and DSTcalculations are passed to the operating system (OS) and may notwork if the OS has bugs or is not up-to-date!

timeDate Class timeSeries Class Summary
timeDate
timeDate class is for
mixing data collected in different time zones
calendar manipulations for business days, weekends, public andecclesiastical holidays.
and is almost compatible with the same class in S-Plus.

timeDate Class timeSeries Class Summary
timeDate class
The timeDate class represents calendar dates and times as
> library(timeDate)
> showClass("timeDate")
Class "timeDate" [package "timeDate"]
Slots:
Name: Data format FinCenter
Class: POSIXct character character
where @Data are the timestamps in POSIXct, @format is the formattypically applied to @Data and @FinCenter is the financial center.

timeDate Class timeSeries Class Summary
timeDate class
The timeDate class can be summarised as the combination of
POSIXct timestamps objects always in the GMT time zone
in the human readable ISO-8601 format standard which expressesdates as "%Y-%m-%d" and dates/times as "%Y-%m-%d %H:%M:%S"
with a financial center used for the time zone and daylight savingrules (DST).

timeDate Class timeSeries Class Summary
Create a timeDate object
There are different ways to generate a timeDate object.
timeDate()
timeSequence()
timeCalendar()

timeDate Class timeSeries Class Summary
Create a timeDate object, Cont’d
> Dates <- c("2007-01-01","2009-07-01")
> Times <- c( "23:12:55", "10:34:02")
> charvec <- paste(Dates, Times)
> timeDate(charvec, zone = "Zurich", FinCenter = "Tokyo")
Tokyo
[1] [2007-01-02 07:12:55] [2009-07-01 17:34:02]
> timeSequence(from = "2009-01-01", to = "2009-01-05", by = "day")
GMT
[1] [2009-01-01] [2009-01-02] [2009-01-03] [2009-01-04]
[5] [2009-01-05]
> timeCalendar(2009, m=1, d=1:4, h=16, zone = "Tokyo", FinCenter = "Zurich")
Zurich
[1] [2009-01-01 08:00:00] [2009-01-02 08:00:00]
[3] [2009-01-03 08:00:00] [2009-01-04 08:00:00]

timeDate Class timeSeries Class Summary
Operations
Many operations can be performed on timeDate objects.
Math Operations
Lagging
Rounding and Truncating
Subsetting
Logical Test
Coercions and Transformation
Concatentation and Reorderings

timeDate Class timeSeries Class Summary
FinCenter
“Financial Centers” allows mixing data collected in different time zones orhandling historical data recorded in the same time zone but with differentDST rules.
The local financial center can be defined with the global variablemyFinCenter and refers, by default, to the Greenwich Mean Time (GMT).
Note: By setting the financial center to a continent/city which liesoutside of the time zone used by your computer does not change anytime settings or environment variables used by your computer.
timeDate Class timeSeries Class Summary
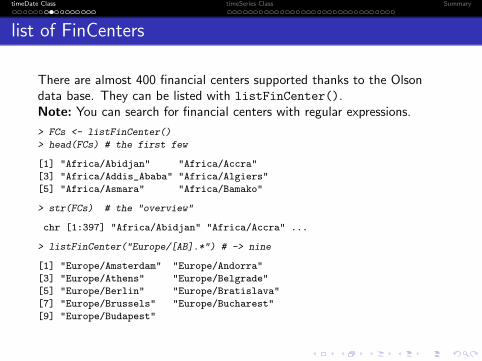
list of FinCenters
There are almost 400 financial centers supported thanks to the Olsondata base. They can be listed with listFinCenter().Note: You can search for financial centers with regular expressions.
> FCs <- listFinCenter()
> head(FCs) # the first few
[1] "Africa/Abidjan" "Africa/Accra"
[3] "Africa/Addis_Ababa" "Africa/Algiers"
[5] "Africa/Asmara" "Africa/Bamako"
> str(FCs) # the "overview"
chr [1:397] "Africa/Abidjan" "Africa/Accra" ...
> listFinCenter("Europe/[AB].*") # -> nine
[1] "Europe/Amsterdam" "Europe/Andorra"
[3] "Europe/Athens" "Europe/Belgrade"
[5] "Europe/Berlin" "Europe/Bratislava"
[7] "Europe/Brussels" "Europe/Bucharest"
[9] "Europe/Budapest"

timeDate Class timeSeries Class Summary
DST rules
Each financial center has an associated function which returns its daylightsaving time rule (DST). Theses functions are named as their financialcenter, e.g. Zurich(), and return a data.frame with 4 columns,
> head(Zurich(), 8)
Zurich offSet isdst TimeZone numeric
1 1901-12-14 20:45:52 3600 0 CET -2147397248
2 1941-05-05 00:00:00 7200 1 CEST -904435200
3 1941-10-06 00:00:00 3600 0 CET -891129600
4 1942-05-04 00:00:00 7200 1 CEST -872985600
5 1942-10-05 00:00:00 3600 0 CET -859680000
6 1981-03-29 01:00:00 7200 1 CEST 354675600
7 1981-09-27 01:00:00 3600 0 CET 370400400
8 1982-03-28 01:00:00 7200 1 CEST 386125200

timeDate Class timeSeries Class Summary
Concatenation
Note: The c() method for timeDate objects takes care of the differentfinancial centers of the object to be concatenated.
> ZH <- timeDate("2009-01-01 16:00:00", zone = "GMT", FinCenter = "Zurich")
> NY <- timeDate("2009-01-01 18:00:00", zone = "GMT", FinCenter = "NewYork")
> c(ZH, NY)
Zurich
[1] [2009-01-01 17:00:00] [2009-01-01 19:00:00]
> c(NY, ZH)
NewYork
[1] [2009-01-01 13:00:00] [2009-01-01 11:00:00]

timeDate Class timeSeries Class Summary
Holidays
There are different functions to compute:
the last day in a given month and year,
the n-days before or after a given date,
the n-th occurrences of the n-days for a specified year/month,
or the last n-days for a specified year/month.

timeDate Class timeSeries Class Summary
Holidays
This gives
timeFirstDayInMonth()
timeLastDayInMonth()
timeFirstDayInQuarter()
timeLastDayInQuarter()
timeNthNdayInMonth()
timeLastNdayInMonth()
timeNdayOnOrAfter()

timeDate Class timeSeries Class Summary
Holidays
> tH <- listHolidays()
> # number of holiday days available in timeDate
> length(tH)
[1] 115
> # the first 10
> head(tH, 10)
[1] "Advent1st" "Advent2nd"
[3] "Advent3rd" "Advent4th"
[5] "AllSaints" "AllSouls"
[7] "Annunciation" "Ascension"
[9] "AshWednesday" "AssumptionOfMary"
> # The date of Easter for the next 3 years:
> Easter(2009:(2009+3))
GMT
[1] [2009-04-12] [2010-04-04] [2011-04-24] [2012-04-08]

timeDate Class timeSeries Class Summary
Calendar
The following three functions can be used as model to build new holidaycalendars.
holidayZURICH() : the Zurich holiday calendar,
holidayNYSE() : the NYSE stock exchange holiday calendar
and holidayTSX() : the TSX holiday calendar.

timeDate Class timeSeries Class Summary
Logical Test
Weekdays, weekends, business days and holidays can be tested with thefunctions:
isWeekday()
isWeekend()
isBizday()
isHoliday()

timeDate Class timeSeries Class Summary
Logical Test
> tS <- timeSequence(Easter(2009, -3), Easter(2009, +3))
> print(tW <- tS[isWeekday(tS)])
GMT
[1] [2009-04-09] [2009-04-10] [2009-04-13] [2009-04-14]
[5] [2009-04-15]
> dayOfWeek(tW)
2009-04-09 2009-04-10 2009-04-13 2009-04-14 2009-04-15
"Thu" "Fri" "Mon" "Tue" "Wed"
> print(tB <- tS[isBizday(tS, holidayZURICH())])
GMT
[1] [2009-04-09] [2009-04-14] [2009-04-15]
> dayOfWeek(tB)
2009-04-09 2009-04-14 2009-04-15
"Thu" "Tue" "Wed"

timeDate Class timeSeries Class Summary
Outline
1 timeDate ClasstimeDate DefinitionFinancial Center and Holiday Management
2 timeSeries ClasstimeSeres DefinitionPlotting timeSeries ObjectsSubsetting timeSeries ObjectsManipulating a timeSeries@recordIDs Concept
3 Summary

timeDate Class timeSeries Class Summary
timeSeries class
The timeSeries class represents time series as
> library(timeSeries)
> showClass("timeSeries")
Class "timeSeries" [package "timeSeries"]
Slots:
Name: .Data units positions
Class: matrix character numeric
Name: format FinCenter recordIDs
Class: character character data.frame
Name: title documentation
Class: character character
Extends:
Class "structure", from data part
Class "vector", by class "structure", distance 2, with explicit coerce
Note: timeSeries extends the virtual class structure

timeDate Class timeSeries Class Summary
timeSeries class
where
@.Data : time series data in numeric matrix form
@positions : date/time stamps as a character vector
@format : format of the character vector in @positions
@FinCenter : the financial center of the data
@units : the column names of the data matrix
@recordsIDs : record identification for additional information as adata.frame
@title and @documentation : descriptive character strings

timeDate Class timeSeries Class Summary
timeSeries class
> data <- matrix(round(rnorm(6), 3), ncol = 2)
> td <- timeCalendar()[1:3]
> ts <- timeSeries(data, td)
> ts
GMT
TS.1 TS.2
2009-01-01 -0.326 0.420
2009-02-01 0.877 0.416
2009-03-01 0.948 -0.274

timeDate Class timeSeries Class Summary
timeSeries class
TS.1 TS.2
[1,] -0.326 0.420
[2,] 0.877 0.416
[3,] 0.948 -0.274

timeDate Class timeSeries Class Summary
timeSeries class
> ts@positions
[1] 1230768000 1233446400 1235865600
> ts@units
[1] "TS.1" "TS.2"
> ts@format
[1] "%Y-%m-%d"
> ts@FinCenter
[1] "GMT"
> ts@title
[1] "Time Series Object"
> ts@documentation
[1] "Tue Jun 30 11:48:08 2009"

timeDate Class timeSeries Class Summary
Creation of timeSeries Objects
The generic function timeSeries() has different methods to generatetimeSeries objects.
> showMethods("timeSeries")
Function: timeSeries (package timeSeries)
data="ANY", charvec="ANY"
data="ANY", charvec="missing"
data="matrix", charvec="ANY"
data="matrix", charvec="missing"
data="matrix", charvec="numeric"
data="matrix", charvec="timeDate"
data="missing", charvec="ANY"
data="missing", charvec="missing"
timeDate Class timeSeries Class Summary
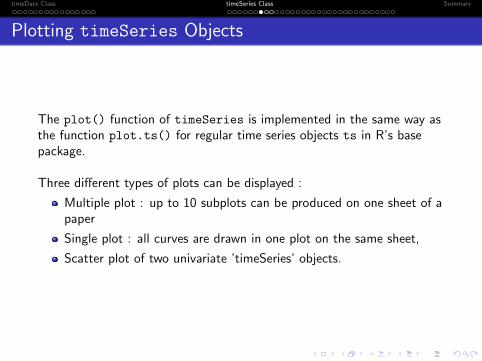
Plotting timeSeries Objects
The plot() function of timeSeries is implemented in the same way asthe function plot.ts() for regular time series objects ts in R’s basepackage.
Three different types of plots can be displayed :
Multiple plot : up to 10 subplots can be produced on one sheet of apaper
Single plot : all curves are drawn in one plot on the same sheet,
Scatter plot of two univariate ’timeSeries’ objects.

timeDate Class timeSeries Class Summary
Multiple Plots
> library(fEcofin)
> LPP <- as.timeSeries(data(SWXLP))[,4:6]
> plot(LPP, main = "LPP")
9511
012
5
LP25
9011
013
0
LP40
7090
110
2000−01−03 2001−06−22 2002−12−10 2004−05−30 2005−11−17 2007−05−08
LP60
Time
LPP

timeDate Class timeSeries Class Summary
Single Plots
> plot(LPP, plot.type = "single", col = 2:5, ylab = "Price")
2000−01−03 2001−06−22 2002−12−10 2004−05−30 2005−11−17 2007−05−08
7080
9010
011
012
013
0

timeDate Class timeSeries Class Summary
Subsetting
One can subset a timeSeires object byCountsDate/Time Vectors (timeDate)Logical testsOther common subsetting rules.
> showMethods("[", classes = "timeSeries")
Function: [ (package base)
x="timeSeries", i="ANY", j="index_timeSeries"
x="timeSeries", i="character", j="character"
x="timeSeries", i="character", j="index_timeSeries"
x="timeSeries", i="character", j="missing"
x="timeSeries", i="index_timeSeries", j="character"
x="timeSeries", i="index_timeSeries", j="index_timeSeries"
x="timeSeries", i="index_timeSeries", j="missing"
x="timeSeries", i="matrix", j="missing"
x="timeSeries", i="missing", j="character"
x="timeSeries", i="missing", j="index_timeSeries"
x="timeSeries", i="missing", j="integer"
(inherited from: x="timeSeries", i="missing", j="index_timeSeries")
x="timeSeries", i="missing", j="missing"
x="timeSeries", i="timeDate", j="character"
x="timeSeries", i="timeDate", j="index_timeSeries"
x="timeSeries", i="timeDate", j="missing"
x="timeSeries", i="timeSeries", j="index_timeSeries"
x="timeSeries", i="timeSeries", j="missing"

timeDate Class timeSeries Class Summary
Column Statistics
This functions return a numeric vector of the same length as the numberof columns of the timeSeries.
’colStats’ calculates column statistics,
’colSums’ calculates column sums,
’colMeans’ calculates column means,
’colSds’ calculates column standard deviations,
’colVars’ calculates column variances,
’colSkewness’ calculates column skewness,
’colKurtosis’ calculates column kurtosis,
’colMaxs’ calculates maximum values in each column,
’colMins’ calculates minimum values in each column,
’colProds’ computes product of all values in each column,
’colQuantiles’ computes quantiles of each column.

timeDate Class timeSeries Class Summary
Column Statistics
> colMeans(LPP)
LP25 LP40 LP60
108.353 102.887 95.412
> colQuantiles(LPP)
LP25 LP40 LP60
97.708 88.278 76.036
> colStats(LPP, FUN = "median")
LP25 LP40 LP60
103.86 100.35 93.82

timeDate Class timeSeries Class Summary
Cumulated Column Statistics
Functions to compute cumulated column statistics are
colCumsums returns column cumulated sums
colCummaxs returns column cumulated maximums
colCummins returns column cumulated minimums
colCumprods returns column cumulated products
colCumreturns returns column cumulated returns

timeDate Class timeSeries Class Summary
Manipulating a timeSeries
Additional timeSeries operations include functions for
Sorting and reverting
Aggregation
Lagging
Rolling windows
Binding and merging
Adding new methods
@recordIDs Concept

timeDate Class timeSeries Class Summary
Sorting and Ordering
The time stamps of timeSeries objects can be sampled, sorted, andreverted.> ts <- dummySeries()
> ts
GMT
TS.1 TS.2
2009-01-01 0.634370 0.508988
2009-02-01 0.206838 0.569707
2009-03-01 0.617899 0.138199
2009-04-01 0.954138 0.532224
2009-05-01 0.094575 0.248911
2009-06-01 0.970725 0.366148
2009-07-01 0.397929 0.022207
2009-08-01 0.066369 0.230418
2009-09-01 0.426999 0.921124
2009-10-01 0.512974 0.918697
2009-11-01 0.403992 0.613478
2009-12-01 0.111533 0.209306

timeDate Class timeSeries Class Summary
Sorting and Ordering
> sa <- sample(ts)
> sa
GMT
TS.1 TS.2
2009-07-01 0.397929 0.022207
2009-05-01 0.094575 0.248911
2009-03-01 0.617899 0.138199
2009-09-01 0.426999 0.921124
2009-10-01 0.512974 0.918697
2009-01-01 0.634370 0.508988
2009-06-01 0.970725 0.366148
2009-12-01 0.111533 0.209306
2009-02-01 0.206838 0.569707
2009-08-01 0.066369 0.230418
2009-11-01 0.403992 0.613478
2009-04-01 0.954138 0.532224

timeDate Class timeSeries Class Summary
Sorting and Ordering
> so <- sort(sa)
> so
GMT
TS.1 TS.2
2009-01-01 0.634370 0.508988
2009-02-01 0.206838 0.569707
2009-03-01 0.617899 0.138199
2009-04-01 0.954138 0.532224
2009-05-01 0.094575 0.248911
2009-06-01 0.970725 0.366148
2009-07-01 0.397929 0.022207
2009-08-01 0.066369 0.230418
2009-09-01 0.426999 0.921124
2009-10-01 0.512974 0.918697
2009-11-01 0.403992 0.613478
2009-12-01 0.111533 0.209306

timeDate Class timeSeries Class Summary
Sorting and Ordering
> re <- rev(so)
> re
GMT
TS.1 TS.2
2009-12-01 0.111533 0.209306
2009-11-01 0.403992 0.613478
2009-10-01 0.512974 0.918697
2009-09-01 0.426999 0.921124
2009-08-01 0.066369 0.230418
2009-07-01 0.397929 0.022207
2009-06-01 0.970725 0.366148
2009-05-01 0.094575 0.248911
2009-04-01 0.954138 0.532224
2009-03-01 0.617899 0.138199
2009-02-01 0.206838 0.569707
2009-01-01 0.634370 0.508988

timeDate Class timeSeries Class Summary
Aggregation
> (by <- timeSequence(from = "2003-01-01", to = "2005-01-01", by = "quarter"))
GMT
[1] [2003-01-01] [2003-04-01] [2003-07-01] [2003-10-01]
[5] [2004-01-01] [2004-04-01] [2004-07-01] [2004-10-01]
[9] [2005-01-01]
> aggregate(LPP, by, mean)
GMT
LP25 LP40 LP60
2003-01-01 100.37 97.073 92.658
2003-04-01 97.46 86.600 73.363
2003-07-01 100.43 90.155 77.372
2003-10-01 103.42 94.390 82.812
2004-01-01 104.86 96.218 84.984
2004-04-01 108.08 99.842 88.920
2004-07-01 107.71 99.763 89.154
2004-10-01 107.71 99.238 88.076
2005-01-01 109.85 101.101 89.602

timeDate Class timeSeries Class Summary
Rolling Windows
Rolling windows can be performed with applySeries().
> by <- periods(time(LPP), period = "24m", by = "6m")
> applySeries(LPP, from = by$from, to = by$to, FUN = "colMeans")
GMT
LP25 LP40 LP60
2001-12-31 100.911 99.438 97.310
2002-06-30 101.209 98.476 94.639
2002-12-31 100.252 95.199 88.487
2003-06-30 99.437 92.248 83.037
2003-12-31 100.420 92.120 81.543
2004-06-30 102.222 93.126 81.524
2004-12-31 104.943 95.920 84.295
2005-06-30 108.678 100.223 89.070
2005-12-31 112.648 104.784 94.170
2006-06-30 116.179 109.216 99.525
2006-12-31 120.190 114.424 105.964

timeDate Class timeSeries Class Summary
Merging and Binding
There are four functions to bind time series together. These are, withincreasing complexity, c(), cbind(), rbind() and merge().
> (ts1 <- timeSeries(matrix(rnorm(4), ncol = 2), c("2009-01-01", "2009-03-01")))
GMT
TS.1 TS.2
2009-01-01 0.065859 -0.84444
2009-03-01 -1.434893 0.11602
> (ts2 <- timeSeries(matrix(rnorm(4), ncol = 2), c("2009-02-01", "2009-04-01")))
GMT
TS.1 TS.2
2009-02-01 1.31517 -0.97362
2009-04-01 0.99981 -0.97810

timeDate Class timeSeries Class Summary
c()
> c(ts1, ts2)
[1] 0.065859 -1.434893 -0.844442 0.116023 1.315173
[6] 0.999811 -0.973622 -0.978103

timeDate Class timeSeries Class Summary
cbind()
> cbind(ts1, ts2)
GMT
TS.1.1 TS.2.1 TS.1.2 TS.2.2
2009-01-01 0.065859 -0.84444 NA NA
2009-02-01 NA NA 1.31517 -0.97362
2009-03-01 -1.434893 0.11602 NA NA
2009-04-01 NA NA 0.99981 -0.97810
timeDate Class timeSeries Class Summary
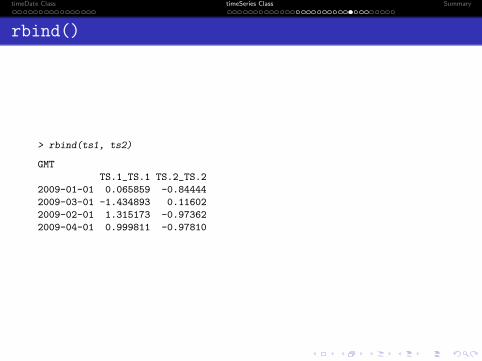
rbind()
> rbind(ts1, ts2)
GMT
TS.1_TS.1 TS.2_TS.2
2009-01-01 0.065859 -0.84444
2009-03-01 -1.434893 0.11602
2009-02-01 1.315173 -0.97362
2009-04-01 0.999811 -0.97810

timeDate Class timeSeries Class Summary
merge()
> merge(ts1, ts2)
GMT
TS.1 TS.2
2009-01-01 0.065859 -0.84444
2009-02-01 1.315173 -0.97362
2009-03-01 -1.434893 0.11602
2009-04-01 0.999811 -0.97810

timeDate Class timeSeries Class Summary
Adding new methods
Since timeSeries is an S4 class, we can use the functionsetMethod() to create new methods for a generic function whichhas can not handle by default the class.
In this example, we write a method for the lowess() function fromthe stats package.
> setMethod("lowess", "timeSeries",
function(x, y = NULL, f = 2/3, iter = 3)
{
stopifnot(isUnivariate(x))
series(x) <- stats::lowess(x = x, y, f, iter)$y
x
})
[1] "lowess"

timeDate Class timeSeries Class Summary
Adding new methods
> LP60 <- LPP[,"LP60"]
> LP60low <- lowess(LP60, f = 0.08)
> plot(LP60)
> lines(LP60low, col = "brown", lwd = 2)
2000−01−03 2001−06−22 2002−12−10 2004−05−30 2005−11−17 2007−05−08
7080
9010
011
012
0

timeDate Class timeSeries Class Summary
@recordIDs Concept
The slot @recordIDs is meant for additional information that wewant to keep for each time entries but which is not part of data part.
As starting from timeSeries version ’2100.84’ we have added amethod for the operator ’$’ to access the @recordIDs as well asthe data part.
by default show() will print the data part with the @recordIDs.Note the ’*’ in the column names of @recordIDs in the output.
@recordIDs can be used to give a data.frame behavior to yourtime series.
> ts$id <- "id"
> head(ts)
GMT
TS.1 TS.2 id*
2009-01-01 0.634370 0.508988 id
2009-02-01 0.206838 0.569707 id
2009-03-01 0.617899 0.138199 id
2009-04-01 0.954138 0.532224 id
2009-05-01 0.094575 0.248911 id
2009-06-01 0.970725 0.366148 id
> cov(ts)
TS.1 TS.2
TS.1 0.094909 0.017982
TS.2 0.017982 0.084142

timeDate Class timeSeries Class Summary
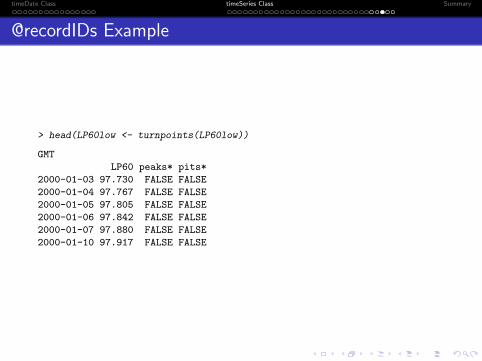
@recordIDs Example
A good example is to include turnpoints of the smoothed index tothe time series.
We can use the turnpoints() function from the R packagepastecs1.
The function determines the number and the positions of extrema,i.e. the turning points, either peaks or pits, in a regular time series.
> library(pastecs)
> setMethod("turnpoints", "timeSeries", function(x)
{
stopifnot(isUnivariate(x))
tp <- turnpoints(as.ts(x))
x$peaks <- tp$peaks #-> need timeSeries >= 2100.84
x$pits <- tp$pits
x
})
[1] "turnpoints"
1Ibanez, Grosjean & Etienne, 2009
timeDate Class timeSeries Class Summary
@recordIDs Example
> head(LP60low <- turnpoints(LP60low))
GMT
LP60 peaks* pits*
2000-01-03 97.730 FALSE FALSE
2000-01-04 97.767 FALSE FALSE
2000-01-05 97.805 FALSE FALSE
2000-01-06 97.842 FALSE FALSE
2000-01-07 97.880 FALSE FALSE
2000-01-10 97.917 FALSE FALSE
timeDate Class timeSeries Class Summary
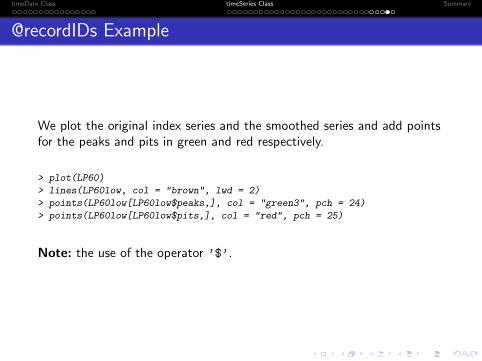
@recordIDs Example
We plot the original index series and the smoothed series and add pointsfor the peaks and pits in green and red respectively.
> plot(LP60)
> lines(LP60low, col = "brown", lwd = 2)
> points(LP60low[LP60low$peaks,], col = "green3", pch = 24)
> points(LP60low[LP60low$pits,], col = "red", pch = 25)
Note: the use of the operator ’$’.

timeDate Class timeSeries Class Summary
@recordIDs Example
2000−01−03 2001−06−22 2002−12−10 2004−05−30 2005−11−17 2007−05−08
7080
9010
011
012
0

timeDate Class timeSeries Class Summary
Outline
1 timeDate ClasstimeDate DefinitionFinancial Center and Holiday Management
2 timeSeries ClasstimeSeres DefinitionPlotting timeSeries ObjectsSubsetting timeSeries ObjectsManipulating a timeSeries@recordIDs Concept
3 Summary
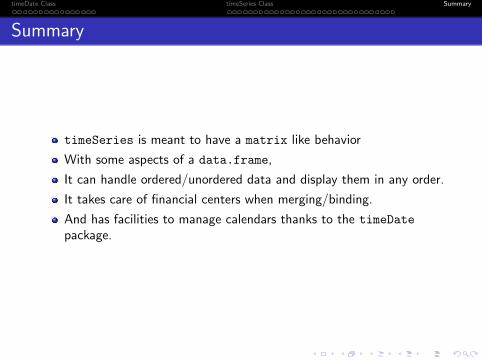
timeDate Class timeSeries Class Summary
Summary
timeSeries is meant to have a matrix like behavior
With some aspects of a data.frame,
It can handle ordered/unordered data and display them in any order.
It takes care of financial centers when merging/binding.
And has facilities to manage calendars thanks to the timeDatepackage.

timeDate Class timeSeries Class Summary
References I
D. Wuertz, Y. Chalabi, W. Chen, A. Ellis,Portfolio Optimization with R/Rmetrics.Finance Online, 2009.
D. Wuertz, Y. Chalabi, A. Ellis,FAQ - Time Series Objects for R in Finance

timeDate Class timeSeries Class Summary
> toLatex(sessionInfo())
R version 2.10.0 Under development (unstable) (2009-06-23r48824), i686-pc-linux-gnu
Locale: LC_CTYPE=en_US.UTF-8, LC_NUMERI ...
Base packages: base, datasets, graphics, grDevices, methods, stats,utils
Other packages: boot 1.2-37, fEcofin 2100.77, pastecs 1.3-8,timeDate 2100.86, timeSeries 2100.84
Loaded via a namespace (and not attached): tools 2.10.0

timeDate Class timeSeries Class Summary
Managing chronological objects with timeDate
and timeSeries
Yohan Chalabi and Diethelm Wuertz
ITP ETH, ZurichRmetrics Association, Zurich
Finance Online, Zurich
R/Rmetrics WorkshopMeielisalpJune 2009