Embed Size (px)
Citation preview

Course 6: The Management of Capital
Prepared by: Matt H. Evans, CPA, CMA, CFM
This course provides an overview of concepts related to the management of capital. This course is recommended for 2 hours of Continuing Professional Education. In order to receive credit, you will need to pass a multiple-choice exam which is administered by installing the exe file version of this short course. The exe file can be downloaded over the internet, www.exinfm.com/training
Excellence in Financial Management
Basic Concepts and Theories
Introduction
The long-term investments we make today will determine the value of our business tomorrow. In order to make long-term investments in new product lines, new equipment and other assets, managers must know the cost of obtaining funds to acquire these assets. The cost associated with different sources of funds is called the cost of capital. Cost of Capital represents the rate a business must pay for each source of funds - debt, preferred stock, common stock, and retained earnings.
Since we want to maintain existing market values, cost of capital is the minimum acceptable rate of return for long-term investments. If the business earns more than its cost of capital, the market value of the business will increase. Likewise, if returns on long-term investments are below the cost of capital, market values will decline. This leads us to a very fundamental objective within financial management - maximizing values for the owners of the business. Therefore, how we manage capital is extremely important to fulfilling the basic objective of increased shareholder value.
The Economics of Capital
An understanding of economics and capital can also help us understand how we should manage capital within an organization. For example, the total amount of capital available is determined by the total amount of investment. The overall economy has a total capital equal to the sum of all capital goods (assets). Since these goods lose value over time, some level of reinvestment is needed to maintain the asset base at its current size. Additional investments will cause the capital stock of an economy to grow, similar to the assets of a business.
The amount invested in the economy is determined by the after tax rate of return on capital. The actual level of investment depends on the willingness of people to invest in assets. People invest based on the returns they expect to receive. The returns to investors must be adjusted for inflation, taxes, depreciation, and risk related to the investment. It is the after tax real rate of return that drives investment.
Overall, the after tax rate will remain constant over time due to changes in investment spending. For example, if the rate of return on capital were to increase, there will be an increase in investment spending. As the capital stock expands from increased investing, the rate of return on capital will drop back down. Conversely, when the rate of return on capital is
Chapter
1

low, there will be a decrease in investment. As capital shrinks, the rate of return on capital rises. Consequently, investment spending will keep rates of return on capital at stable levels.
Taxation of capital will increase the cost of capital. In order to supply capital, investors must receive a minimum after tax real rate of return. The users of capital not only pay investors a nominal rate of return, but they also incur the cost of economic depreciation (lost values of capital assets) and related taxes on capital. These total costs represent the cost of capital.
Basic Considerations in Managing Capital
Now that we understand the importance of capital, let's focus on how we manage capital within an organization. The overall objective is to find an "optimal" capital structure - the right mix of capital sources (debt and equity) that minimizes the overall cost of capital and maximizes values to the shareholders (owners of the business). When we raise capital, we have two choices - issue debt or issue stock. Debt is represented by bonds which are long-term instruments sold to investors. Stock is the ownership interest of the business and depending upon the rules of incorporation, stockholders will have certain rights. Therefore, we start our understanding of capital management by looking at the advantages and disadvantages of the two sources of capital:
Some advantages to using stock are:
No fixed payments are required to investors; dividends are paid only as earnings are available.
No maturity date on the security, the invested capital does not have to be repaid.
Improves the credit worthiness of the company.
Some disadvantages to using stock are:
Dilutes the earnings per share to shareholders.
Issuance costs are higher than debt.
Issuing more stock can increase the overall cost of capital.
Dividend payments to shareholders are not tax deductible.
Some advantages to using debt are:
Interest payments are tax deductible.
Does not dilute earnings per share or control within the company.
Cost is fixed; interest and principal do not change.
Expected returns to investors are usually lower than stock.
Some disadvantages to using debt are:
2
Fixed charges must be paid regardless of available earnings or cash flow.
Adds more risk to the business.
Has a maturity date and the capital invested must be repaid to investors.
In addition to understanding the pros and cons of financial securities, we also need to recognize that several conditions will impact how we raise capital. These conditions include:
Economic Conditions: The demand and supply of capital in the marketplace can impact how capital is raised. For example, expectations of inflation will influence the cost that is paid for capital. Higher rates of inflation erode the values of investments and thus, investors will demand higher rates of return.
Market Conditions: The demand for higher rates of return will increase the cost of capital. For example, if we raise capital with a security that is not highly marketable, investors will require higher rates of return for the increased risk.
Operating Conditions: The level of fixed costs used to operate the business needs to be considered. For example, higher fixed costs can result in wider variations to operating income from numerous factors - increased competition, slower economic growth, etc. This is referred to as business risk.
Financial Conditions: The existing levels of outstanding debt will impact how capital will be raised. Higher levels of debt (including preferred stock) can result in wider variations to earnings due to higher fixed obligations that must be paid (interest to debt holders and fixed dividends to preferred stock holders). This is referred to as financial risk.
Not only do we need to look at various conditions, but we need to consider how financing will impact capital structure. Capital structure appears on the right side of the Balance Sheet as liabilities and equity; i.e. the long-term sources of funds to finance assets. Assets appear on the left side of the Balance Sheet. Capital structure is the permanent financing of the business through the use debt and stock. The total of all liabilities and equity is referred to as Financial Structure. Therefore, Capital Structure = Financial Structure - Current Liabilities.
Finding the right capital structure encompasses numerous considerations - growth rates in sales, risk attitudes of management, liquidity of assets, control position of the company, etc. Finding the right capital structure also involves finding the right amount of financial leverage. Financial leverage is the financing of assets with fixed obligations - debt and preferred stock. The use of financial leverage increases return on equity up to a certain level of operating income. As you use more financial leverage (debt and preferred stock), higher levels of operating income are needed to cover the additional fixed obligations (interest on debt and fixed dividends on preferred stock).
Generally, the use of financial leverage will improve financial performance whenever returns are higher than the costs of obtaining funds. In a perfect world, management would favor more leverage whenever return on capital exceeds the after tax costs of debt. However, higher returns also result in higher risk to the business (risk return tradeoff). Therefore, the use of financial leverage is a balancing act between higher returns for shareholders vs. higher risk to shareholders.
3
Financial leverage can be measured with ratios such as debt to total assets. Financial leverage is also expressed as the Degree of Financial Leverage or DFL. DFL is the percentage change in earnings given a change in operating income (Earnings Before Interest & Taxes or EBIT). The higher the DFL, the riskier the business. We can use the following formula to calculate DFL:
DFL = EBIT / EBIT - I - (P / (1-TR)) where I is Interest and P is Preferred Dividends and TR is the tax rate.
Example 1 - Calculate Degree of Financial Leverage (DFL)
Mason Corporation has sales of $ 400,000 with total operating costs consisting of $ 330,000 in variable costs and $ 30,000 in fixed costs. Annual interest is $ 6,000 and preferred dividends are $ 2,000 per year. The tax rate is 20%.
Sales $ 400,000Less Variable Costs (330,000)Less Fixed Costs ( 30,000)EBIT $ 40,000
DFL = $ 40,000 / $ 40,000 - $ 6,000 - ($ 2,000 / .80) = 1.27
In addition to financial leverage, there is operating leverage. Operating leverage is the use of fixed costs in production over variable costs. For example, replacing production workers (variable cost) with robots (fixed cost) would be an example of increased operating leverage. As operating leverage increases, more sales are needed to cover the increased fixed costs. Since variable costs have been reduced, profits will increase more given an increase in sales after the breakeven point has been reached. High levels of fixed costs increase business risk. Like financial leverage, we can measure the Degree of Operating Leverage (DOL) as the percentage change in operating income given a change in sales. The following formula can be used to calculate DOL:
DOL = CM / CM - FC where CM is Contribution Margin and FC is Fixed Cost.
Example 2 - Calculate Degree of Operating Leverage (DOL)
Referring back to Example 1, we can make the following calculations:
Sales $ 400,000Less Variable Costs (330,000)Contribution Margin $ 40,000
DOL = $ 40,000 / $ 40,000 - $ 30,000 = 4.0
4

Usually firms use one form of leverage over the other to finance investments. For example, manufacturing companies tend to invest heavily in fixed assets and thus operating leverage is used much more than financial leverage. Service type companies have low levels of investment in fixed assets and therefore, financial leverage is widely used to finance the business. Leverage is relative to the type of fixed cost approach that is appropriate for funding the business and leverage by its very definition creates risk. Therefore, the use of leverage will always include a tradeoff between risk and return.
Approaches to Managing Capital
One way to understand how to manage capital is to look at the various approaches that can be used for finding the right capital structure. As we previously indicated, the right capital structure is that mix of debt and stock that maximizes the value of the firm while at the same time maintains a relatively low overall cost of capital. Two very different approaches to capital management are the Net Operating Income Approach and the Net Income Approach.
Net Operating Income Approach: This approach to capital management concludes that it does not matter how you mix the capital structure. The value of the business is not determined by how you arrange the right side of the Balance Sheet. Additionally, the overall cost of capital will not change as you change the mix of capital. Therefore, values are determined by the capitalization of operating income or EBIT (Earnings Before Interest Taxes).
Example 3 - Calculate Market Value of Business under Net Operating Income Approach to Capital Management
Norton Company has $ 400,000 in outstanding debt at 7% interest. Norton's cost of capital is 12% and expected operating income or Earnings Before Interest & Taxes (EBIT) is $ 120,000.
Earnings to Shareholders = $ 120,000 - $ 28,000 (7% interest on debt) = $ 92,000.Total Market Value = $ 120,000 / .12 = $ 1,000,000Market Value of Stock = $ 1,000,000 - $ 400,000 = $ 600,000Cost of Equity = $ 92,000 / $ 600,000 = 15.3%
Net Income Approach: In contrast to the Net Operating Income Approach, the Net Income Approach concludes that the capital structure of an organization has a major influence on the value of the organization. Therefore, the use of leverage will change both the cost of capital and the value of the firm. Net Income is capitalized in arriving at the market value of the firm.
5
Example 4 - Calculate Market Value of Business under Net Income Approach to Capital Management
Referring back to Example 3, we can calculate the following values:Market Value of Stock = $ 92,000 / 15.3% = $ 601,307Total Value = $ 601,307 + $ 400,000 = $ 1,001,307Overall Cost of Capital = $ 120,000 / $ 1,001,307 = 12%
Franco Modigliani and Merton Miller have provided some guidance between the Net Operating Income Approach and the Net Income Approach. Modigliani and Miller concluded that capital structure is not a major factor in the determination of values. Values are determined by the investment and operating decisions that generate cash flows. It is cash flows that give rise to values. This approach to valuation has become a mainstay within financial management. But what about capital structures? Mike Jenson, founder of the Journal of Financial Economics, may have resolved the answer to this question. Jenson noted that whenever a company makes a change in its capital structure, it sends a signal to investors. This signaling effect does in fact result in changes to valuations. For example, when the Chairman of the Federal Reserve speaks about interest rates, a signal is sent to the marketplace and valuations quickly change. Therefore, shifts in capital structure do impact the value of a business.
Jenson also noticed that managers have a tendency to guard capital and minimize the distribution of dividends to shareholders. This follows with the so-called "pecking order" of financing whereby managers prefer internal sources of capital to external sources of capital. The specific pecking order is as follows:
1. Internal sources of capital - retained earnings / cash
2. External sources of capital - debt
3. External sources of capital - convertible securities
4. External sources of capital - preferred stock
5. External sources of capital - common stock
Consequently, capital structures can impact valuations due to the so-called signaling effect. Additionally, the real source of values will reside in cash flows (more specifically free cash flows). Free cash flows are the excess cash that can be withdrawn from a business after paying everything off. And in order to generate free cash flows, management must generate returns in excess of the cost of capital.
6

Calculating the Cost of Capital
In order to evaluate projects of average risk, we must know the overall cost of capital. Cost of Capital is calculated as the weighted average of each component of capital - debt, common stock, preferred stock, and retained earnings. Each component is calculated as follows:
Cost of Debt (Cd): Calculate the after tax cost of debt based on the effective interest rate. The following formula is used to calculate the cost of debt: Cd = I ( 1 - TR) where I is Interest Rate on Debt and TR is the Tax Rate.
Example 5 - Calculate the Cost of Debt
Cantor Corporation borrowed $ 100,000 at 8% interest. The amount of the loan proceeds was $ 96,000 and the tax rate is 35%.
Cost of Debt = ($ 100,000 x .08) / $ 96,000 x ( 1 - .35) = 8.3% x .65 = 5.4%.
Cost of Common Stock (Ccs): Three different methods can be used to calculate the Cost of Common Stock. The three methods are:
1. Dividend Growth - Dividends paid to common shareholders along with the overall expected growth rate is used to calculate a cost for the common stock. The formula for calculating the cost of common stock is: (Dividends in Year 1 / Market Value of Stock) + Overall Growth Rate.
Example 6 - Calculate the Cost of Common Stock based on Dividend Growth
Cantor Corporation expects to pay a $ 6.00 dividend this year to common shareholders. Historically, dividends have grown by 2% each year. Cantor's common stock is currently selling for $ 45.00 per share.
Cost of Common Stock = ($ 6.00 / $ 45.00) + .02 = 15.3%.
2. Capital Asset Pricing Model (CAPM) - The CAPM is the most widely used approach to calculating the cost of common stock. The CAPM uses three components to calculate the cost of common stock - (1) rf is the risk free rate earned by investors (such as U.S. Treasury Bonds; (2) b is the beta coefficient which expresses the risk of the common
Chapter
2
7

stock in relation to the market; and (3) rm is the rate earned in the market (such as the Standard & Poor's 500 Composite Index). The CAPM formula is Ccs = rf + b ( rm - rf ).
Example 7 - Calculate the Cost of Common Stock based on CAPM
Cantor Corporation has common stock with a listed beta of 1.35. The estimated market return is 12% and the risk free rate based on Treasury Bonds is 6.5%.
Ccs = 6.5% + 1.35 ( 12% - 6.5% ) = 13.9%
3. Bond Plus - A simple approach to calculating the cost of common stock is to add a risk premium to the cost of debt. The formula is Ccs = Cd + risk premium. The risk premium is the additional rate that must be paid to common shareholders above what is paid to bond holders.
Example 8 - Calculate the Cost of Common Stock based on Bond Plus
Referring back to Example 5, we calculated a cost of debt of 5.4%. We have estimated a market risk premium on common stock of 4%.
Ccs = 5.4% + 4.0% = 9.4%
Cost of Preferred Stock (Cps) - If your capital structure includes preferred stock, the cost of preferred stock is calculated by the amount of dividends in relation to the market price of the preferred stock. The formula is Cps = Dividends / Market Price of Stock.
Example 9 - Calculate the Cost of Preferred Stock
Assume we have preferred stock selling for $ 80 per share and dividends per share are $ 10. The cost of preferred stock is:
Cps = $ 10 / $ 80 = 12.5%
Cost of Retained Earnings - The cost of retained earnings (internal funds) within a capital structure is similar to the cost of common stock. We can think of the cost of retained earnings in relation to the opportunity cost of how we can use these funds. Generally, the cost of retained earnings is slightly less than the cost of common stock since no issuance costs is incurred.
8

After we have calculated each component cost of capital, we will calculate a weighted average based on the relative market values of each component. The following example will illustrate how weighted average cost of capital is calculated.
Example 10 - Calculate Weighted Average Cost of Capital
Cantor Corporation has the following capital structure
Capital Component Book Value Cost of Capital Long Term Debt (5,000 bonds) $ 5,000,000 5.4%Common Stock (62,500 shares) $ 2,500,000 13.9%Preferred Stock (20,000 shares) $ 500,000 12.5%Retained Earnings $ 750,000 12.0%
Market prices are $ 1,050 for bonds, $ 65.00 for common stock, and $ 35.00 for preferred stock. Total market values are calculated as follows:
Long Term Debt = 5,000 x $ 1,050 $ 5,250,000Common Stock = 62,500 x $ 65.00 $ 4,062,500Preferred Stock = 20,000 x $ 35.00 $ 700,000
Since retained earnings has a market value closely tied to common stock, we will allocate the common stock market value between common stock and retained earnings based on book values.
Common Stock = $ 4,062,500 x ($2,500,000 / $3,250,000) = $ 3,125,000Retained Earnings = $ 4,062,500 x ($750,000 / $3,250,000) = $ 937,500
Weighted Average Cost of Capital is calculated as follows:
Capital Component Market Values Mkt% x C of Cp = Wgh C of Cp Long Term Debt $ 5,250,000 52% 5.4% 2.8%Common Stock $ 3,125,000 31% 13.9% 4.3%Preferred Stock $ 700,000 7% 12.5% .9%Retained Earnings $ 937,500 10% 12.0% 1.2%
Weighted Average Cost of Capital 9.2%
Our overall cost of capital is calculated as a weighted average based on the relative market values of each component of capital. If market values are not available, use %’s derived from the targeted or forecasted capital structure. If worse comes to worse, you can fall back on book values. In any event, the weighted average cost of capital is the overall cost of capital that will be used to evaluate capital investments.
9

Cost of Equity and Risk
The Cost of Equity is the rate of return required by those who invest in equity securities. The expected return can be broken down into two components - Risk Free Rate and Risk Premium. A good benchmark for establishing the Risk Free Rate is the rate paid on 30 year U.S. Treasury Bonds since the risk of default is virtually non-existent. The Risk Premium can be established by understanding two forms of risk - Business Risk and Financial Risk. In the absence of debt, shareholders are confronted with one form of risk, business risk. Business Risk is the risk of changes to operating income from numerous factors that influence business. When we introduce debt, we have to include financial risk. Financial Risk is the risk of changes to earnings from the use of increased debt. More debt results in higher interest payments, which impacts earnings. Consequently, the Risk Premium consists of Business Risk + Financial Risk. The following graph summarizes these relationships:
In the above graph, we have a total risk free rate of 5%. The addition of business risk increases the required rate on stock to 10%. When we introduce debt, this adds financial risk and increases the required return on stock. The final total rate of return on stock with all forms of risk climbs from 12% to 16% over a range of Debt to Equity Ratios. Since the cost of capital represents the rate that must be paid to investors for the use of long-term funds, higher risk to investors will increase the cost of capital.
10

The Financing Decision We have an understanding of what capital is (Chapter 1) and we understand how to calculate the cost of capital (Chapter 2). The remainder of this course will focus on how to arrange financing; i.e. how do we actually raise capital. The financing decision must consider several factors. Some of these factors include:
Flexibility - Today's financing decisions will influence tomorrow's financing decisions. If the business expects to raise capital in the future, it can not maximize its use of debt today. We need to provide a cushion so we can have flexibility with future financing decisions.
Risk - Financing with the use of debt will increase risk. There is a limit to how much debt we can use to finance our business. Too much debt can ultimately lead to bankruptcy.
Income - Financing can influence earnings and thus affect return on equity. If we are concerned about returns to equity shareholders, then our financing decision will need to be adjusted. Income is also influenced by our ability to take advantage of tax deductions for interest on debt.
Control - If we have concerns about control over the organization, then we have to consider how financing will change control. Financing decisions are connected to either ownership (equity) or creditors (debt).
Timing - Financing decisions need to be timed to take advantage of the marketplace. What type of securities should be sold? When should they be sold? What length of maturity should be used for debt financing?
Refinancing Risk
One of the objectives within the financing decision is to match the maturity of liabilities with the life expectancy of assets. This allows liabilities to be self-liquidating. If the maturity of liabilities is less than the life expectancy of assets, then you face refinancing risk since you have to raise new capital to pay off liabilities. If the maturity of liabilities is longer than the life expectancy of assets, then there will be plenty of assets around to pay off debts. However, these surplus assets may not earn enough to increase the market value of the firm.
Chapter
3
11

The mismatching of liabilities with assets can occur if financing is not available. For example, suppose long-term financing is not available. Short-term sources of financing may have to be used. Mismatching can also be intentional. For example, suppose you expect long-term interest rates to fall. You may want to finance assets with short-term maturities since you can refinance in a few years at much lower rates.
Inflation
Another factor to consider in the financing decision is inflation. By using debt financing during periods of high inflation, you will repay the debt with dollars that are worth less. As expectations of inflation increase, the rate of borrowing will increase since creditors must be compensated for a loss in value. Since inflation is a major driving force behind interest rates, the financing decision should be cognizant of inflationary trends.
Floatation Cost
Equity sources of capital will cost more than debt sources of capital. One reason is due to higher risk to investors. Whenever investors incur more risk, they demand higher rates of return; i.e. risk return tradeoff. Additionally, the actual out-of-pocket cost associated with equity financing is higher than debt financing. These costs are referred to as floatation costs. Floatation costs include all costs of issuing the securities, such as banker's fees, legal fees, filing costs, etc.
Marginal Cost of Capital
A basic consideration within the financing decision is how much money do we need to raise? If we assume that all projects have the same average level of risk, then we can establish an optimal capital budget by plotting the Marginal Cost of Capital. The relationship between cost of capital and required financing is referred to as the Marginal Cost of Capital. The Marginal Cost of Capital Rate is the discount rate used for capital budgeting analysis. Marginal Cost of Capital is calculated as follows:
1. Determine the cost and percentage of financing needed for each source of capital - debt, stock, retained earnings.
2. Calculate breaking points where the weighted average cost of capital begins to increase under different financing plans. The break point can be calculated as: Maximum Amount of Lowest Source of Capital / Percent of Financing Provided by this Specific Source of Capital.
3. Calculate the weighted average cost of capital over the range of financing between the break points.
12

4. A graph can be used to show the range of cost of capital in relation to total financing. If a project's internal rate of return is greater than the marginal cost of capital, then the project should be accepted.
Example 11 - Calculate Marginal Cost of Capital
Bishop Corporation has the following investment opportunities:
Project Investment Amount Internal Rate of Return A $ 1,800,000 13 % B $ 1,700,000 14% C $ 900,000 9%
If the projects are accepted, Bishop will finance the three projects with 50% debt and 50% equity. Bishop has $ 1,400,000 of retained earnings available for investments. Sources of capital are as follows:
Debt @ 5.6% After tax costInternal Capital @ 13% (opportunity cost)Issue New Stock @ 20%
Using a 50 / 50 mix and a combination of debt and retained earnings, Bishop can raise up to $ 2,800,000 at the following cost:
Capital Proportion x Cost = Weighted Debt 50 % 5.6% 2.8%Internal 50% 14.0% 7.0%
Total Cost of Capital 9.8%
Using a 50 / 50 mix and a combination of debt and new stock, Bishop can raise $ 2,800,000 and above at the following cost:
Capital Proportion x Cost = Weighted Debt 50 % 5.6% 2.8%New Stock 50% 19.0% 9.5%
Total Cost of Capital 12.3%
Calculate the break point of financing where the weighted average cost of capital increases = Maximum Amount of Lowest Cost Source / % of Financing from this Source or $ 1,400,000 / .50 = $ 2,800,000. Bishop can finance up to $ 2,800,000 at 9.8%.
13

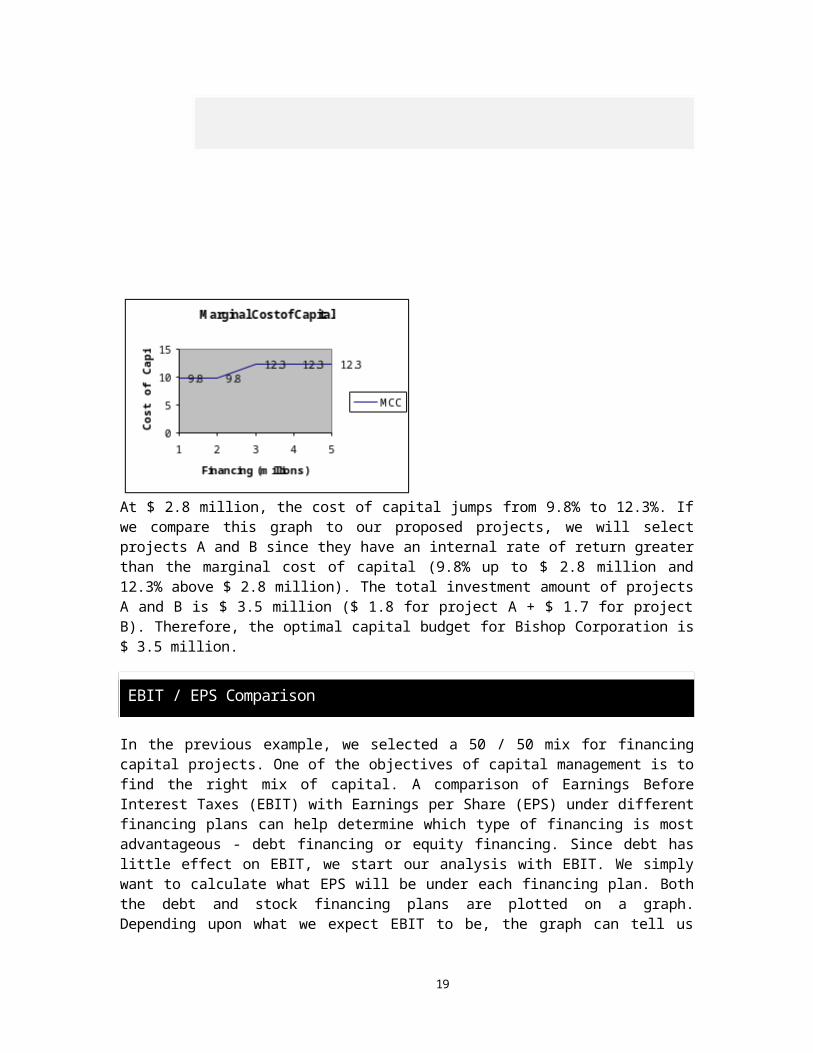
Prepare a graph of the Marginal Cost of Capital and compare to the investment projects. The following graph summarizes the marginal cost of capital for the financing of the three proposed projects.
At $ 2.8 million, the cost of capital jumps from 9.8% to 12.3%. If we compare this graph to our proposed projects, we will select projects A and B since they have an internal rate of return greater than the marginal cost of capital (9.8% up to $ 2.8 million and 12.3% above $ 2.8 million). The total investment amount of projects A and B is $ 3.5 million ($ 1.8 for project A + $ 1.7 for project B). Therefore, the optimal capital budget for Bishop Corporation is $ 3.5 million.
EBIT / EPS Comparison
In the previous example, we selected a 50 / 50 mix for financing capital projects. One of the objectives of capital management is to find the right mix of capital. A comparison of Earnings Before Interest Taxes (EBIT) with Earnings per Share (EPS) under different financing plans can help determine which type of financing is most advantageous - debt financing or equity financing. Since debt has little effect on EBIT, we start our analysis with EBIT. We simply want to calculate what EPS will be under each financing plan. Both the debt and stock financing plans are plotted on a graph. Depending upon what we expect EBIT to be, the graph can tell us which financing plan will give us the highest EPS. The following graph plots EBIT and EPS under debt and stock financing:
14

At a level of $ 2 million EBIT, EPS is the same under either the stock or debt financing plan. If we expect EBIT to be below $ 2 million, then we would favor the stock plan since it yields a higher EPS. If we expect EBIT to be above $ 2 million, then debt would be preferred over stock after considering the increased risk.
Example 12 - EBIT / EPS Comparison
Atco Corporation wants to raise $ 4 million in capital for production facilities. Atco can issue stock (200,000 shares @ $ 20) or issue bonds at 10% interest. Atco's tax rate is 45%. Atco's projected EBIT is $ 6.5 million and it has long-term capital consisting of $ 2 million in bonds @ 8% and 100,000 shares of stock.
Calculate EPS (Earnings per Share) under different financing plans:
100% Stock 100% Bonds 50 / 50 Mix Expected EBIT $ 6,500,000 $ 6,500,000 $ 6,500,000Current Interest on Debt (160,000) (160,000) (160,000)New Interest on Debt - 0 - (400,000) (200,000)Earnings before Tax 6,340,000 5,940,000 6,140,000Less Taxes @ 45% (2,853,000) (2,673,000) (2,763,000)Earnings to Shareholders 3,487,000 3,267,000 3,377,000Shares Outstanding 300,000 100,000 200,000Earnings per Share (EPS) $ 11.62 $ 32.67 $ 16.89
The returns or EPS under a 100% Bond Plan is much higher than other plans. If Atco expects an EBIT of $ 6.5 million, it can easily service higher levels of debt.
In the above example, it is quite clear that Atco can benefit from the use of more debt. However, suppose Atco expects EBIT to fall dramatically over the next few years. Atco should graph the two financing plans under different levels of EBIT. In order to prepare a graph, we need to determine three points:
1. The minimum level of EBIT needed to cover fixed financing charges (debt and preferred stock) under 100% Stock Plan.
15

2. The minimum level of EBIT needed to cover fixed financing charges (debt and preferred stock) under 100% Bond Plan.
3. The Indifference Point where EPS is the same under the 100% Stock Plan and the 100% Bond Plan. The following formula can be used to calculate the Indifference Point:
EPS = ((EBIT - I) (1 - TR) - PD) / number of shares outstanding
EPS: Earnings per Share EBIT: Earnings Before Interest Taxes TR: Tax RatePD: Preferred Dividends
Example 13 - Calculate Graph Points for EBIT / EPS Comparison
If we refer back to Example 12, we can determine that the minimum level of EBIT under the two financing plans is as follows:
100% Stock: Minimum EBIT to service fixed obligations is $ 160,000 ($ 2 million of existing debt x 8% interest rate)
100% Bond: Minimum EBIT to service fixed obligations is $ 560,000 ($160,000 + $ 400,000).
The starting point on the graph for the Stock Plan is an EBIT of $ 160,000 and the starting point on the graph for the Bond Plan is an EBIT of $ 560,000.
We need a third intersection point or indifference point where EPS is the same under the two financing plans (100% Stock and 100% Bonds). We can solve for the EBIT where EPS is the same:
100% Stock 100% Bonds
(EBIT - $160,000) (1 - .45) = (EBIT - $560,000) (1 - .45) 300,000 shares 100,000 shares
.55 EBIT - $ 88,000 = .55 EBIT - $ 308,000 300,000 100,000
(.55 EBIT - $ 88,000) 100,000 = (.55 EBIT - $ 308,000) 300,000
55,000 EBIT - $ 8,800,000 = 165,000 EBIT - $ 92,400,000
110,000 EBIT = $ 83,600,000
16

EBIT = $ 760,000
At an EBIT of $ 760,000, we are indifferent to the two financing plans since EPS is the same. If EBIT were to fall below $ 760,000, we would favor the Stock Plan. If EBIT is expected to be above $ 760,000, we would favor the Bond Plan. The following calculation confirms the indifference point:
100% Stock 100% Bonds Indifference EBIT $ 760,000 $ 760,000Existing Interest (160,000) (160,000)Interest on New Debt - 0 - (400,000)Earnings before Tax 600,000 200,000Less Taxes @ 45% (270,000) ( 90,000)Earnings to Shareholders 330,000 110,000Shares Outstanding 300,000 100,000Earnings Per Share (EPS) $ 1.10 $ 1.10
Now that we have calculated all three points per Example 13, we can summarize our analysis on the following graph:
At an EBIT of $ 760,000, we have an EPS of $ 1.10.
Assessing Risk
Once returns have been analyzed under different financing plans with EBIT / EPS comparisons, it is necessary to assess risk. Coverage ratios are commonly used to assess the risk associated with different financing plans. Coverage ratios show the additional risk associated with higher levels of debt financing. Examples of coverage ratios include:
Debt to Total Assets Ratio = Total Long-term Liabilities / Total Assets
Times Interest Earned Ratio = EBIT / Interest Expense
Times Burden Earned Ratio = EBIT / Interest Expense + (Principal Repayment / (1 - TR))
17

Example 14 - Calculate Coverage Ratio for Atco Corporation
If we refer back to Example 12, we can calculate Times Interest Earned under each financing plan and compare these ratios to industry averages.
100% Stock 100% Bonds $ 6,500,000 / $ 160,000 $ 6,500,000 / $ 560,000 40.6 11.6
There is a significant change in Times Interest Earned between the two financing plans. However, when we compare this ratio to an industry average for Atco Corporation, we find that the overall industry has a Times Interest Earned Ratio of 3.8. Therefore, there is more than adequate coverage for increased debt by Atco.
Targeted Debt Levels
One approach to establishing the right mix of capital is to follow a targeted debt level. Since some level of debt is desirable for maintaining higher returns, many managers will establish a target debt level for their capital structures (such as 40% of capital should be debt). Therefore, financing decisions should sometimes take into account a targeted set of coverage ratios. One of the principal concerns with using more debt is the ability to cover the additional fixed charges. As we just discussed in the previous segment, coverage ratios are used to monitor debt levels.
Another concern with the use of more debt is financial flexibility. As we increase debt, we risk the possibility of closing off this source of financing in the future. If we expect more and more financing in the future, then we need to make sure we have the flexibility to tap into debt financing over the long-term.
The Overall Process
The basic process for making financing decisions often boils down to three steps:
1. Measuring the returns under different financing plans. A comparison of EBIT / EPS under different financing plans can help. You also need to understand how much earnings will grow in the future. If you expect EBIT to decline in the future, then you will favor stock over debt. If you expect strong growth in earnings, then you have the ability to service higher debt loads and thus you will lean towards debt over equity.
2. Assessing the risk of each plan. The objective is to grow the business with some use of leverage and avoid excessive loads of equity. Coverage ratios (as previously discussed) are widely used to monitor risk. Under ideal circumstances, you want to grow the business according to a desired growth rate (G). A desired growth rate can be calculated as follows: G = P x R x A x T where P is Profit Margin, R is Retention Ratio, A is Asset Turnover, and T is Financial Leverage.
18

If the actual growth rate exceeds the desired growth rate, then you need to make sure you don't borrow too heavily since you need to maintain borrowing capacity. Higher debt loads for fast growing companies can hold back values. If there is low growth, financing with debt may be preferred since steady cash flows are available to service debt financing. Slow growing companies need to aggressively pursue
investment opportunities for increased growth.
3. Recognizing the need for financial flexibility. Selecting a financing plan that allows for future flexibility can be critical to future success. You must be able to make competitive investments in the future to maintain or improve market share.
The Financial Marketplace Once a company has decided how much capital to raise and the best mix of capital, it must go to the marketplace to raise the capital. The Financial Marketplace is where investors and companies trying to raise capital come together. Capital markets trade long-term sources of funds, such as stocks and bonds. Capital markets can be broken down into primary markets and secondary markets. Primary markets are those markets where new issues of securities are sold. Secondary markets are where outstanding securities are traded (such as the New York Stock Exchange).
The trading of stocks and bonds will usually involve the use of financial intermediaries, such as banks, pension funds, mutual funds, finance companies, etc. Therefore, the actual source of capital comes from financial intermediaries that purchase the securities. One of the most important financial intermediaries is the Investment Banker.
Investment Bankers
Investment Bankers provide critical services for raising capital. They help sell new securities by establishing the price of the security. Investment Bankers determine how the securities will be sold and they distribute the securities to investors. Investment Bankers also investigate the company prior to issuance of securities and certify the issue. This function is necessary in the United States since the sale of securities must be registered with the Securities and Exchange Commission (SEC).
The process for selling securities is called underwriting. Underwriting involves the purchase of securities by the Investment Banker and the resale of securities to investors. The difference between the two prices (purchase vs. sale) is called the spread. The spread represents compensation to the Investment Banker for services rendered.
Chapter
4
19
The Investment Banker wants to set a low price for the sale of securities so that he can sell all of the securities. On the other hand, the company trying to raise capital wants a high price to raise as much capital as possible. Therefore, establishing the right price for securities can be very difficult. For seasoned issues of securities, the offering price can be linked to the price of existing securities. For example, the price for a common stock issue can be set at a certain percentage below the closing market price on the last day of the SEC Registration Period.
Initial Public Offerings (IPO's)
Private and closely held companies become publicly traded companies by "going public." The process for going public is called an Initial Public Offering or IPO. An IPO is a major transformation for a company whereby the company raises capital by issuing stock for the first time. Going public also establishes a market price for the company. However, going public has several disadvantages:
1. IPO's require registration with the SEC.
2. The Company is now subject to increased scrutiny and review by investors and other outside interest.
3. The IPO process can be very difficult on those who are directly involved in making it happen.
4. New owners (shareholders) can be demanding, putting pressure on management for higher earnings and growth.
5. Stock prices may not accurately reflect the value of the company.
In order to go public, a company must apply for membership with an exchange where its stock will be traded. There are requirements for stock exchange membership, such as complete disclosure of financial information. Additionally, the company must register with the SEC since the sale of stock will take place in interstate commerce. The purpose of a registration statement is to inform investors on the merits of the new stock offering. Registration statements include the following:
Description of company assets
Complete set of audited financial statements
Statement concerning how capital will be used
Description of any provisions contained in the securities
The Registration Process has three distinct periods:
1. Pre-Filing Period : Preliminary negotiations and conferences between the issuer of securities and the Investment Banker will take place during the Pre-Filing Period. During this period, basic issues such as how much capital can be raised and what type of securities should be issued are addressed. During the Pre-Filing Period, offers to buy or sell securities are prohibited.
20

2. Waiting Period : This period starts when the Registration Statement is filed with the SEC. The 20-day waiting period gives the SEC a chance to review the Registration Statement. If the Registration Statement is incomplete, the SEC will issue comments on how to correct the Registration Statement. Any amendments to the Registration Statement result in a new 20-day waiting period.
During the waiting period, the Investment Banker will publish a tombstone ad that describes the pending issue of securities. The tombstone ad must include:
Name of Issuer
Amount of securities being offered
Approximate date of offering
Price of securities if known
Additionally, investors can obtain a prospectus that contains information similar to what is contained in the Registration Statement. The outside cover of the prospectus will be stamped in red ink - "Preliminary Prospectus." Investors sometimes call this prospectus a "red herring." Similar to the pre-filing period, offers to sell or buy the securities are prohibited. However, oral offers can be accepted during the 20-day waiting period.
3. Post Effective Period : Once approved by the SEC, the Registration Statement becomes effective and the securities can be sold to investors. A final prospectus must be made available to investors. Prior to issuing the securities, the Master Registration Statement is updated by filing a short form with the SEC.
The final price for the securities is set at the closing day when the SEC clears the issue. Investment Bankers pay the issuer of securities by the fourth day after securities have been issued and investors are required to pay the Investment Banker by the tenth day. The process of raising capital is now complete.
Private Placements
The issuance of equity and debt securities will sometimes take place directly between the issuer and the investor. This is type of direct issue is referred to as a private placement. Usually a select group of investors is involved and most private placements are for the issuance of debt instruments, not stock. Additionally, direct business loans with a term more than 15 years are classified as private placements.
Private placements are not subject to formal registration with the SEC and thus, they are less expensive to issue. However, since securities are not sold in an established capital market, the placement of securities will often involve restrictive covenants imposed by the investors. Since there is a lack of market for the securities, investors will demand a higher rate of return.
Although private placements are exempt from SEC registration, certain rules (Regulation D) are imposed on private placements:
No advertising of the securities is allowed
21

The issuing company must exercise care to ensure that investors are buying for their own accounts and not engaged in underwriting services.
The SEC must be notified within 15 days of the first offering.
Course Summary The cost associated with capital is rarely reflected on the Income Statement. Accordingly, many financial managers mistakenly think there is no cost of capital. Therefore, one of the first steps in managing capital is to calculate the cost of capital. The cost of capital is calculated as the weighted average of each capital component - long-term debt, common stock, preferred stock, and retained earnings.
The cost of capital serves as the benchmark for making investment decisions. If a project can earn a rate of return higher than the cost of capital, then the market value of the firm will increase.
Not only do we need to understand the cost of capital, but we need to find the right mix of capital components. To find the right mix, we need to consider several factors. Three important factors to consider are:
1. What are the returns (EPS) under each of the financing plans? We can compare EPS at different levels of EBIT and select the best plan to maximize returns.
2. What is the risk of each financing plan? We can use coverage ratios to assess risk.
3. Finally, we need to make sure that the financing plan does not limit our financing options in the future. We need to have flexibility year after year when it comes to financing.
Once we have determined the right mix of capital, we must raise the capital by having investors purchase the securities. The capital markets bring investors and companies trying to raise capital together. Investment Bankers often serve as the middleman in underwriting the issue of securities.
22

Final Exam Select the best answer for each question. Exams are graded and administered by installing the exe file version of this course. The exe file version of this course can be downloaded over the internet at www.exinfm.com/training.
1. The cost a business must pay for the use of long-term funds is called the:
a. Indifference Point
b. Cost of Capital
c. Prime Lending Rate
d. Risk Free Rate of Return
2. One of the advantages of issuing debt over equity is that debt:
a. Has no maturity date.
b. Reduces risk.
c. Requires no fixed payments.
d. Has a tax deduction for interest payments.
3. When a company uses increased fixed costs for production, this is an example of what type of leverage?
a. Operating Leverage
b. Financial Leverage
c. Variable Cost Leverage
d. Money Market Leverage
4. According to the pecking order, which of the following sources of capital would managers use first?
a. Bonds (Debt)
b. Common Stock
23

c. Preferred Stock
d. Retained Earnings
5. Delphi Corporation has common stock with a listed beta coefficient of 1.40. U.S. Treasury Bonds are paying 6.2% and the overall market rate according to Standard and Poor's is 13.5%. Using the Capital Asset Pricing Model (CAPM), the cost of common stock is:
a. 10.22%
b. 13.50%
c. 16.44%
d. 18.33%
6. Gemini Corporation has summarized its capital structure as follows:
Component Cost of Capital Market Value
Long-term Bonds 5.8% after tax $ 150,000Common Stock 12.5% $ 450,000
Based on the above information, Gemini's weighted average cost of capital is:
a. 10.83%
b. 11.50%
c. 16.70%
d. 12.50%
7. Fleming Corporation has plans to raise $ 2 million in capital by issuing 50,000 shares of $ 20.00 common stock and by issuing $ 1 million in bonds @ 12% interest. Fleming's tax rate is 40%. Fleming expects EBIT (Earnings Before Interest Taxes) of $ 4.5 million and its current capital structure consists only of common stock - 250,000 shares outstanding. What will EPS (Earnings per Share) be after the financing plan?
a. $ 6.67
b. $ 7.97
c. $ 8.76
d. $ 9.00
24

8. A common method for assessing risk associated with financing plans is to calculate:
a. Beta Coefficient
b. Marginal Cost of Capital
c. Breakeven EPS
d. Coverage Ratios
9. When a privately held company decides to "go public", it must go through a process known as:
a. Initial Public Offering
b. Debt for Equity Swap
c. Stock Buyback Program
d. Option Selling
10. When a company raises capital by selling directly to investors without a formal registration with the SEC (Securities & Exchange Commission), this is called a:
a. Selected Capital Agreement
b. Private Placement
c. Short-term Financing Arrangement
d. Seasoned Filing of Securities
25