Embed Size (px)
Citation preview
Industrial Marketing Management xxx (2014) xxx–xxx
IMM-07048; No of Pages 11
Contents lists available at ScienceDirect
Industrial Marketing Management
Managing B2B customer churn, retention and profitability
Ali Tamaddoni Jahromi a,1, Stanislav Stakhovych a,2, Michael Ewing b,⁎a Department of Marketing, Monash University, PO Box 197, Caulfield East, VIC 3145, Australiab Faculty of Business and Law, Deakin University, 221 Burwood Highway, Burwood, VIC 3125, Australia
⁎ Corresponding author. Tel.: +61 3 9244 6548.E-mail addresses: [email protected] (A. Tam
[email protected] (S. Stakhovych), pvc-b1 Tel.: +61 3 990 34232.2 Tel.: +61 3 990 31455.
http://dx.doi.org/10.1016/j.indmarman.2014.06.0160019-8501/© 2014 Elsevier Inc. All rights reserved.
Please cite this article as: Tamaddoni Jahromment (2014), http://dx.doi.org/10.1016/j.ind
a b s t r a c t
a r t i c l e i n f oArticle history:Received 18 May 2013Received in revised form 1 November 2013Accepted 21 January 2014Available online xxxx
Keywords:B2B customer churnData miningNon-contractual settingRetention campaignProfit
It is now widely accepted that firms should direct more effort into retaining existing customers than to attractingnew ones. To achieve this, customers likely to defect need to be identified so that they can be approached withtailored incentives or other bespoke retention offers. Such strategies call for predictivemodels capable of identifyingcustomers with higher probabilities of defecting in the relatively near future. A review of the extant literature oncustomer churn models reveals that although several predictive models have been developed to model churninB2C contexts, the B2B context in general, andnon-contractual settings in particular, have received less attentionin this regard. Therefore, to address these gaps, this study proposes a data-mining approach to model non-contractual customer churn in B2B contexts. Several modeling techniques are compared in terms of their abilityto predict true churners. The best performing data-mining technique (boosting) is then applied to develop aprofit maximizing retention campaign. Results confirm that the model driven approach to churn predictionand developing retention strategies outperforms commonly used managerial heuristics.
© 2014 Elsevier Inc. All rights reserved.
1. Introduction
Customer churn remains a particularly salient concept in contempo-rary marketing and should not be ignored by B2B companies. Nowadays,due to improved access to information, customers aremore transient andit is easier and less costly for them to switch between competitors(Wiersema, 2013). Firms recognize this and are interested in identifyingpotential churners in order to attempt to prevent defection by targetingsuch customerswith incentives. Previous studies in B2B contexts have in-vestigated churn from the point of view of resource allocation or custom-er profitability prediction (Rust, Kumar, & Venkatesan, 2011; Venkatesan& Kumar, 2004). However, the application of data mining techniques topredict churn and to develop efficient retention campaigns in B2B con-texts does not appear to have receivedmuch attention in either literatureor practice. Therefore, the current study aims to (1) introduce dataminingtechniques to model customer churn in a B2B setting and (2) develop aprofit maximizing retention campaign based on customer heterogeneity.
Kamakura et al. (2005, p. 286) define churn as “the tendency forcustomers to defect or cease business with a company”. Losing a cus-tomer can reduce sales revenues and increase acquisition costs(Athanassopoulos, 2000; Risselada, Verhoef, & Bijmolt, 2010). Sincenet return on investments (ROI) for retention strategies are generally
addoni Jahromi),[email protected] (M. Ewing).
i, A., et al., Managing B2B cusmarman.2014.06.016
higher than for acquisition, it is now widely accepted that companiesshould concentrate their marketing resources on customer retentionwhich translates into increased revenue for the company because loyalcustomers continue transacting for relatively longer durations, whileignoring offers from competitors (Lam, Shankar, Erramilli, & Murthy,2004). The importance of retention for suppliers becomes even clearerin the B2B contextwhere customersmake larger andmore frequent pur-chases with far higher transactional values (Rauyruen & Miller, 2007).Moreover, business customers are fewer in numbers and more valuablewhichmakes losing even one highly undesirable (Stevens, 2005). Add tothat today's austere global economic outlook and increased web-basedcomparison shopping, and the importance of effective retention strate-gies becomes even more salient for B2B organizations (Waxer, 2011).
In tackling the ongoing challenge of customer churn, somefirms favoruntargeted approaches which rely on mass advertising and superiorproduct (Burez & Van den Poel, 2007). For instance, a company that isdealing with high rates of churn might send incentives to all customers.Although such a ‘shot-gun’ strategy is easy to implement, it risks wastingresources by sending incentives to customers already intent on stayingwith the company regardless. Recent innovations in IT have led toincreased availability of transactional customer data which companieshave started utilizing in more targeted marketing approaches (Burez &Van den Poel, 2007). Adopting more targeted strategies enables firmsto use customers' transactional data in conducting customer-base analy-ses and predicting customers' future behavior (Fader & Hardie, 2009).Over the past decade, the ability to collect and process large amounts ofdata and disseminate relevant knowledge has been considered to be anecessary core competency for successful companies (Cooper, Watson,
tomer churn, retention and profitability, Industrial Marketing Manage-
2 A. Tamaddoni Jahromi et al. / Industrial Marketing Management xxx (2014) xxx–xxx
Wixom, & Goodhue, 2000; Sher & Lee, 2004). In response, astute compa-nies have turned to analyticalmethods to better exploit thedata collectedfrom customers in their strategic and operational decision making pro-cess (Earl, 2001; Orriols-Puig, Martínez-López, Casillas, & Lee, 2013). Inthis regard, in an attempt to prevent customer churn, organizations areincreasingly utilizing customers' transactional data to develop predictivemodels to identify customers who are more likely to defect. The identi-fied churners are then targetedwith tailored incentives to be encouragedto stay (Neslin, Gupta, Kamakura, Junxiang, & Mason, 2006).
Several studies have addressed the application of data mining tech-niques in identifying potential churners in B2C contexts — particularlyin contractual settings (Burez & Van den Poel, 2007; Coussement & Vanden Poel, 2008a; Neslin et al., 2006). However, the analysis of extantliterature revealed less attention on modeling customer churn in B2Bcontexts. This paucity stems from the fact that ‘big data’ has not (yet)been touted in B2B contexts with the same enthusiasm as it has in B2C(Wiersema, 2013). Moreover, the issue of customer switching or defec-tion in B2B contexts has been mostly studied from a resource allocationperspective, or in the context of predicting future customer profitability(Rust et al., 2011; Venkatesan & Kumar, 2004). The major focus of suchstudies has been on identifying and nurturing profitable customers rath-er than on pinpointing customerswho aremore likely to churn, or on thepotential profitability of targeted retention campaigns derived from suchpredictive models.
Therefore, the current study contributes to the extant literature in twoimportant ways. First, it introduces data mining modeling approaches forchurn prediction to B2B contexts and evaluates their predictive power.Second, it proposes a profit maximizing retention campaign based onthe output of data mining churn prediction.
In the first stage of our analysis, customers' transactional data from acompany operating in a B2B context is utilized to construct a predictivemodel. To this end, Classification and Regression Tree (CART), as a singlelearner data mining technique (Breiman, Friedman, Olshen, & Stone,1984), and boosting technique, as an ensemble learner (Breiman, 1996),have been employed to construct predictive models. Once constructed,all models have been benchmarked against logistic regression, as a popu-lar binary classifier in choice modeling and customer churn literature(Ainslie & Pitt, 1992; Lemmens & Croux, 2006). Thereafter, the perfor-mance of the models is evaluated using an ‘area under ROC (receiveroperating characteristic) curve’ and cumulative lift measures, to identifythe best performing churn prediction model.
The second stage of analysis uses individual churn probabilities foreach customer produced by the best performing technique in the firststage, to develop a profit maximizing retention campaign for the compa-ny in question.
The remainder of the paper is structured as follows. Section 2 high-lights the importance of targeted retention approaches and reviews theextant literature on churnmodeling and churnmanagement profitability.The study methodology is presented in Section 3 followed by an empiri-cal application in Section 4 to demonstrate how this retention approachworks in practice. Finally, the conclusions and managerial recommenda-tions are presented in Section 5.
2. Background
2.1. Retention approaches in customer relationship management
Though CRM is a frequently used term in contemporary marketing, ithas its roots in the IT realm, only entering the scholarlymarketing lexiconin the late 90s (Srivastava, Shervani, & Fahey, 1999; Wübben, 2008).While a variety of definitions exist for CRM (Kotler & Keller, 2006;Richards & Jones, 2008), and consensus has yet to be reached, themajor-ity of definitions have ‘acquisition’ and ‘retention’ at their common core(D'Haen & Van den Poel, 2013; Jackson, 2005). An extensive body of lit-erature now exists in both B2B and B2C contexts that emphasizes several
Please cite this article as: Tamaddoni Jahromi, A., et al., Managing B2B cusment (2014), http://dx.doi.org/10.1016/j.indmarman.2014.06.016
benefits of retention over acquisition approaches (Ganesh, Arnold, &Reynolds, 2000; Lam et al., 2004; Rauyruen & Miller, 2007).
The inherent advantages of retention over acquisition strategies haveresulted in many companies concentrating their efforts on the former(Bhattacharya, 1998; Colgate & Danaher, 2000). It has been establishedthat a small change in retention rates can result in significant changesin contribution (Van den Poel & Larivière, 2004).
Specifically, in B2B contexts, customer retention is consideredcentral to developing business relationships (Eriksson & Vaghult,2000; Grönroos, 1990; Kalwani & Narayandas, 1995). Due to the largeamounts of money that B2B customers typically spend, retention can beextremely financially rewarding for firms (Boles, Barksdale, & Johnson,1997; Rauyruen & Miller, 2007).
Considering the importance of retention, it is becoming awidespreadbelief across most industries that retaining existing customers anddecreasing churn are both essential (Tsai & Lu, 2009). A primary wayto retain customers is to offer retention incentives to reduce churn(Shaffer & Zhang, 2002). However, due to the costs associated withsuch retention strategies, coupled with the fact that not all customersare at risk of defecting, it is advisable not to focus churn management ef-forts across the entire customer base (Hadden, Tiwari, Roy, & Ruta, 2007).Rather, firms are encouraged to developmodels to predict which cus-tomers aremore likely to defect (Keaveney & Parthasarathy, 2001; Neslinet al., 2006). Once identified, these likely defectors should be targetedwith appropriate incentives to convince them to stay (Hadden et al.,2007).
In this regard, churn management strategies are typically two-pronged: identifying would-be churners and then targeting themwith retention incentives. While classic churn management strategiesfocus on targeting customers with the highest probability of defection(e.g. top 10%) (Lemmens & Croux, 2006), a more recent approach advo-cates selecting target customers based on the profit potential of each andto select the size of the target group to maximize the overall return onthe retention campaign (Lemmens & Gupta, 2013; Verbeke, Dejaeger,Martens, Hur, & Baesens, 2012).
In this regard, the current study is inspired by Neslin et al. (2006) andcomprises two distinct stages: predicting customer churn and maximiz-ing retention campaign profitability.
2.2. Modeling customer churn
Over the past few decades the availability of various marketing-related data such as scanner data and internet data alongwith organiza-tions' demand for new analytical methods, has spurned an increasinginterest in Artificial Intelligence (AI)-based marketing problem solving(Orriols-Puig et al., 2013). Of all the roles that AI-based systems canplay in marketing, predictive modeling and more specifically, churnmodeling is one of the most promising (Wierenga, 2010).
Customer churn prediction is the process of calculating the prob-ability of future churning behavior for each customer in the database,using a predictive model, based on past information/prior behavior(Coussement & De Bock, 2013). Thus, with the aim of developing aneffective customer retention program, the utilized models should be asaccurate as possible (Coussement & Van den Poel, 2008b), otherwisethese systems would be very wasteful when spending incentive moneyon customers who will not churn (Tsai & Lu, 2009). In this regard, datamining techniques, with their roots in AI, have been widely favored tomodel churn (Risselada et al., 2010; Wierenga, 2010). The tendency toemploy data mining techniques in customer churn prediction stemsfrom the fact that churn is a rare event in a dataset andmaking an ac-curate forecast calls for techniques that emphasize predictive ability(Kamakura et al., 2005).
Literature on churnmodeling confirms the simplicity and transparen-cy of decision trees as popular single algorithm data mining techniques(Coussement & De Bock, 2013) for predictive modeling (Duda, Hart, &Stork, 2001). This algorithm has been utilized either as a part of hybrid
tomer churn, retention and profitability, Industrial Marketing Manage-
3A. Tamaddoni Jahromi et al. / Industrial Marketing Management xxx (2014) xxx–xxx
approach in combinationwith other techniques (Jamal & Zhang, 2009) oras an individual, independent technique to predict customer churn(Hung, Yen, & Wang, 2006; Wei & Chiu, 2002). Furthermore, marketingscholars have recently introduced ensemble learners (Coussement & DeBock, 2013; Lemmens & Croux, 2006) such as Bagging and Boosting tech-niques to the customer churn prediction tool kit.
Nevertheless, studies reveal that, in general, research directions call-ing for applications of strategic intelligence (i.e. business intelligence,competitive intelligence, and knowledge management) in industrialmarketing have received insufficient attention from both academicsand practitioners (Martínez-López & Casillas, 2013; Wiersema, 2013).Accordingly, Martínez-López and Casillas (2013) argue that the applica-tion of intelligent systems in handling industrialmarketing problems hasbeen limited which has also been reflected in the paucity of academicstudies in the strategic intelligence realm. In other words, this researchtheme has been underdeveloped in business and management journals.Digging deeper to uncover the underlying reasons for this gap,Wiersema(2013) points out that as opposed to the B2C field, the availability of B2B‘big data’ is more limited. Thus, mining large datasets to extract knowl-edge about customers is not as common as in the B2C field. Furthermore,in cases where the data is available, the practices to exploit this data andtransform it into information are still underdeveloped in B2B companies.
Similarly, by delving more deeply into the existing literature onchurn modeling, one also notes that among all studies concentratingon predicting churn across different sectors such as telecommunications(Lemmens & Croux, 2006; Neslin et al., 2006), online retail (Yu, Guo,Guo, & Huang, 2011), finance (Risselada et al., 2010; Van den Poel &Larivière, 2004), and retail (Buckinx & Van den Poel, 2005), themajorityare within B2C contexts and the application of data mining techniquesin B2B churn prediction is still an underdeveloped area. This indicatesthe opportunity that exists to introduce different techniques and ap-proaches of data mining modeling to churn prediction area in B2B con-texts. The magnitude of the opportunity becomes even clearer whenthe nature of B2B contexts, with large purchases and transactions, istaken into account (Rauyruen & Miller, 2007).
2.3. Maximizing retention campaign profitability
A traditional churn management strategy typically involves rankingcustomers based on their estimated propensity to churn and sendingout incentives to the subset of customerswith the highest churn ranking(Lemmens & Gupta, 2013). The rationale behind this approach is thattargeting the customers with higher propensity to defect and persuad-ing them to stay with the company can increase firm's profitability.However, customers with the highest propensity to churn are not nec-essarily always the ones who can deliver the highest profit. In fact, asLemmens and Gupta (2013) note, on the basis of Neslin et al. (2006)conceptual framework, at the customer level, the profit of targeting acustomer by a retention incentive is influenced by several factorsincluding, a customer's probability of churn, their probability of acceptingan incentive offer, the cost of the incentive to the company, and the valueof the customer.
According to Neslin et al. (2006) the profit of a churn managementcampaign at an aggregated level can be calculated by Eq. (1):
Π ¼ Nα βγ CLV−c−δð Þ þ β 1−γð Þ −cð Þ þ 1−βð Þ −c−δð Þ½ �−A ð1Þ
where,N is the total number of customers,α is the subset of the custom-er base which is targeted for the retention campaign, β is the fraction ofpotential churners within the targeted customers, δ is the cost of theincentive for the company, γ is the portion of would-be churners whodecide to stay because of receiving the incentive, c is the cost of contactinga customer to offer the incentive, CLV is the lifetime value of an averagecustomer, and A is the fixed cost of running the retention campaign.
Basically, when a company embarks on a retention campaign byimplementing a churn predictionmodel, it correctly identifies a fraction
Please cite this article as: Tamaddoni Jahromi, A., et al., Managing B2B cusment (2014), http://dx.doi.org/10.1016/j.indmarman.2014.06.016
of potential churners and sends retention promotions to them. Fromthose real ‘would-be churners’ who receive the offer, a fraction of γwould accept it and stay loyal. Accordingly, the first term within thebrackets in Eq. (1) represents the contribution of the retention campaignwhen potential churners are retained by incentives. The second termwithin the brackets reflects the money that the company loses due tocontacting the fraction of would-be churners who do not accept theoffer and ultimately defect. The last term within the brackets representsthe loss of money when the company sends the retention incentive to acustomer who would stay with the company anyway and the customerredeems the offer.
The framework proposed by Neslin et al. (2006) provides a metric tocalculate the profit of a retention campaign at the aggregated level, whenthe company identifies the churner using a prediction model, ranks cus-tomers based on their propensity to churn and targets a subset of likelychurners with incentives. However, one pitfall of this approach is that itdoes not maximize the profitability of the retention campaign. Thus,Verbeke et al. (2012) proposed an approach to profit maximization byevaluating the optimum target size. However, neither of these ap-proaches account for heterogeneity in lifetime value of customers aswell as the heterogeneity in probability of being targeted by incentiveswhich comes from individual's propensity to churn. However, Lemmensand Gupta (2013) have addressed both of these limitations by replacingβwith probability of being a would-be churner (extracted from a binaryclassifier) and by replacing lifetime value of an average customer withindividual customer lifetime values. These changes allow the analyst toassess the individual contribution of each customer to the total profit ofa targeted retention campaign. Instead of ranking customers based ontheir probability to churn, they can be ranked based on their individualprofitability, allowing the firm to determine the optimum campaign tar-get size to maximize profitability.
However, although the improved framework might work well in B2Ccontexts, it has to be modified to suit B2B markets. One of the modifica-tions needed concerns the assumption of fixed incentives δ. While suchassumptionsmight workwell in B2C contexts (i.e. whereby all customersreceive coupons of the same value), this does not necessarily hold in B2Bcontexts. As Mogelefsky (2000) note, B2B incentives, in order to beimpactful, need to be personalized and customized. Moreover, it is morecommon in B2B relationships to offer percentage volumediscounts ratherthan fixed discounts (Harrison-Walker & Neeley, 2004).
3. Methodology
3.1. Defining ‘customer churn’ in non-contractual settings
Defining customer churn in non-contractual settings is complex. Inthe absence of a contract(s) between the focal company and its customersto be renewed or terminated, it is difficult to estimate the exact time ofdefection or churn. Because of the inherent difficulty of specifying churnin non-contractual settings, most of the extant churn literature has fo-cused on contractual settings. Analysts interested in non-contractual set-tings need to take into account exactly what is meant by “churn”. In suchsettings, since it is probable that a customer returns after a period of inac-tivity (i.e. ‘always-a-share’ scenario) non-contractual churnhas a differentmeaning (Rust, Lemon, & Zeithaml, 2004; Venkatesan & Kumar, 2004).
Thus, in the first stage of the current study, instead of attemptingto predict churn as a ‘permanent phenomenon’, we have focused onpredicting inactivity in the next time period. The length of time periodsof interest can be defined arbitrarily as long as they followwhat is practi-cal and important for business decisions. Therefore, we choose half a yearas a unit ofmeasurement and define churn as being inactive in the secondhalf of the year (prediction period) while being active in the first half ofthe year (calibration period). This definition is in line with Buckinx andVan den Poel (2005) and is based on the frequency of purchases.
There are numerous other ways to define churn, but they all havedifferent drawbacks in the context of this paper. For instance, Miguéis,
tomer churn, retention and profitability, Industrial Marketing Manage-
4 A. Tamaddoni Jahromi et al. / Industrial Marketing Management xxx (2014) xxx–xxx
Van den Poel, Camanho, and Falcão e Cunha (2012) defined churn basedon changes in customers spending from one period to another. Weemploy a ‘change in monetary’ variable as a predictor of a churn ratherthan the definition of the churn itself. Also there are several statisticalapproaches to calculate the probability for a customer to be ‘alive’ at apoint in time (Kumar & Reinartz, 2012; Schmittlein & Morrison, 1985;Schmittlein, Morrison, & Colombo, 1987) but they have twoweaknessesin the current application: first, we require the probability of being inac-tive for the whole time period and not at a point in time; and, second, inorder to define the indicator of churn, the subjective cutoff point isrequired to convert the probability to a binary variable.
3.2. Classification techniques
3.2.1. Simple decision treeSeveral classifiers including decision trees, support vector machines
(SVM), Bayesian classifiers and artificial neural networks (ANN) havebeen identified by machine learning modelers (Han, Kamber, & Pei,2011; Tan, Steinbach, & Kumar, 2006). Among all existing classificationtechniques, decision trees are the most popular in business since theirunderlying logic is typically more understandable to managers (Wei &Chiu, 2002; Xie, Li, Ngai, & Ying, 2009). One of the main reasons behindthepopularity of decision trees is their transparency and interpretability(Olafsson, Li, & Wu, 2008).
A decision tree is a tree-shaped structure that represents sets of deci-sions and is able to generate rules for the classification of a data set (Lee&Siau, 2001). This technique is suitable for describing sequences of inter-related decisions or predicting future data trends (Chen, Hsu, & Chou,2003; Kim, Song, Kim, & Kim, 2005) and is capable of classifying specificentities into specific classes based on feature of entities (Buckinx,Moons,Van Den Poel, & Wets, 2004; Chen et al., 2003). Decision trees are oneof the top three most popular techniques of data mining in CRM (Xieet al., 2009), and have been included in our comparative study of churnprediction.
3.2.2. Decision tree with cost-sensitive learningInmodeling customer churn, class imbalance is a common challenge
for model developers. In such cases, it is usually the rare class that is ofprimary interest (Burez & Van den Poel, 2009). In most churn data sets,the number of non-churners is greater than the churners. Thus, despitethe fact that misclassifying the real churners might not have a greatimpact onmodel's accuracy, it can cause a costly loss for the companies.
Therefore, cost-sensitive learning methods have been utilized by aca-demics to solve the problemof class imbalance in churn prediction (Burez& Van den Poel, 2009; Weiss, 2004). Basically, cost-sensitive learningmethods consider the fact that the correct classification of churners hasmore value than correct classification of non-churners and this is donefor a binary classification problem via assigning more cost to false nega-tives than the false positives (Burez & Van den Poel, 2009).
Thus, in order to handle the problem of class imbalance, in additionto simple decision trees, we compare the performance of cost-sensitivelearning as well.
3.2.3. Boosting as an ensemble learner methodThe idea of aggregating classifiers was initially proposed by Breiman
(1996) who believed that the combination of several base classifiers canincrease the overall accuracy of the aggregated model. In this regard, aclass of ensemble learners such as random forests, bagging, and boostinghave been introduced within the data mining stream of churn modeling(Breiman, 1996).
Among exiting ensemble learners, the boosting technique is populardue to its outstanding churn prediction capabilities (Burez & Van denPoel, 2009; Lemmens & Croux, 2006). Basically, the boosting techniquemanipulates the weight of misclassified instances by attributing moreimportance to them overmultiple training iterations to help the classifi-er in the classification of instanceswhich are difficult to classify correctly
Please cite this article as: Tamaddoni Jahromi, A., et al., Managing B2B cusment (2014), http://dx.doi.org/10.1016/j.indmarman.2014.06.016
(De Bock & Van den Poel, 2011). Several versions of boosting exist, suchas logitboost (Friedman, Hastie, & Tibshirani, 2000), adaptive boosting(Freund & Schapire, 1996), and brownboost (Freund, 2001). In thisstudy we use adaptive boosting as it is one of the most well-knownand capable boosting techniques (De Bock & Van den Poel, 2011; Hanet al., 2011). For details of adaptive boosting algorithm please refer toAppendix A.
3.2.4. Logistic regressionIn cases such as churn prediction,where the dependent variable is bi-
nary (e.g. churner as ‘1’ vs. non-churner as ‘0’), the ordinary linear regres-sion is not applicable as it allows the dependent variable to fall outsidethe range of 0–1. Thus, as a special case of general linearmodels – logisticregression – is favored.
Ease of use and robustness of results (Buckinx& Van den Poel, 2005)havemade logistic regression a popular binary classifier amongmarket-ing academics as well as the first choice for customer churn modeling(Lemmens & Croux, 2006; Neslin et al., 2006). Therefore, in this study,logistic regression is used as a benchmark technique to compare againstthe performance ofmore sophisticatedmodels.We are interested to seewhether the added complexity of more sophisticated techniques paysoff for predicting churn when simpler methods such as logistic regres-sion can be utilized instead.
3.3. Assessment criteria
To evaluate the predictive performance of constructed models, twocriteria have been employed: area under the receiver operating charac-teristic curve (AUC) and cumulative lift curve.
The simplest form of data produced by a classificationmodel is a con-fusion matrix (Han et al., 2011) of counts of correctly classified andmisclassified cases fromeach class. Consider the case of churn prediction.A binary classifier predicts the status of a customer as churner or non-churner. Such classifier might classify a real churner as ‘churner’ (truepositive), a real churner as ‘non-churner’ (false negative), a real non-churner as ‘non-churner’ (true negative), and a real non-churner as‘churner’ (false positive) as illustrated in Table 1.
Using the confusionmatrix, one can extract FP rate (FP/N) and TP rate(TP/P). By plotting the FP and TP pairs for different decision thresholds,receiver operating characteristic (ROC) curve can be achieved (Bradley,1997). In other words, a ROC curve plots the true positive rates vs. falsepositive rates, for a binary classifier system as its discrimination thresh-old is varied. However, as the ROC curve gives the models performancewith two measures there might be cases where increasing the true pos-itive rate causes an increase in false positive rate. In such cases the com-parison of two models would become a challenging task. In order totackle this problem, in this study, the performance of themodels is com-pared based on the area under their ROC curve (AUC) (Bradley, 1997;Huang, Kechadi, & Buckley, 2012). While a random classifier possessesan AUC of 0.5, an ideal classifier has an AUC equal to 1. On this basis, allclassifiers in practice have an AUC greater than 0.5 and smaller than 1.Area under ROC curve is computed as follows (Burez & Van den Poel,2009):
AUC ¼ ∫1
0
TPPdFPN
¼ 1P � N ∫N
0TPdFP: ð2Þ
As a second evaluation criterion, the cumulative lift chart (Jamal &Bucklin, 2006; Risselada et al., 2010), the most popular prediction criteri-on in predictive modeling (Neslin et al., 2006), is employed. The focus ofthis measure is on customers with the highest probability to be ‘positive’(i.e. churner in the case of churnmodeling) and it is defined as the ratio of‘positives’ in a segment, divided by the ratio of ‘positives’ in thewhole testset (Berry & Linoff, 2004). For example, by using no model it is expectedthat by targeting n% of customer base with incentives n% of real churnerswould be targeted. However, by using a classificationmodel with top nth
tomer churn, retention and profitability, Industrial Marketing Manage-
5A. Tamaddoni Jahromi et al. / Industrial Marketing Management xxx (2014) xxx–xxx
percentile lift of c, it is expected that c × n % of all real churners wouldreceive the incentive, when the top n% of customer are targeted. Inother words, in order that amodel performs better than the random clas-sifier, its top-decile lift c should be greater than 1. Hence, high top-decilelift is an indicator of promising performance of the classifier (Lemmens &Croux, 2006).
3.4. Developing a profit maximizing retention campaign
Contrary to traditional retention approaches where customers areranked on their likelihood to churn and the first nth percentile ofcustomers is targeted, we propose a method that 1) maximizes the totalprofit of a retention campaign, and 2) determines the optimum targetsize. We follow Lemmens and Gupta (2013) and assume that individualprofitability of targeting the customer i (πi) can be computed. The overallprofit of a retention campaign across all targeted customers is:
Π ¼Xi∈target
N
πi ð3Þ
The individual profit of targeting customer i depends on several pa-rameters and can be written as follows, extending the work of Neslinet al. (2006) and Lemmens and Gupta (2013):
πi ¼ pi γi V iP−δið Þ½ � þ 1−pið Þ −φiδi½ � ð4Þ
where πi is the profit of targeting customer iwith a retention incentive,i.e. the extra revenue that company can generate by preventing custom-er i frombecoming inactive in next period; pi is theprobability of being awould-be churner for customer i, extracted from the classificationmodel; γi represents the probability of accepting an incentive offer byawould-be churner and staying active for the duration of the predictionperiod; δi is an incentive offered to customer i; φi represents the proba-bility of accepting a retention incentive by a customer who would notbecome inactive in prediction period; and ViP is an expected revenuefor customer i in prediction period if customer is retained.
We assume that the retained customer will spend in the next (pre-diction) period the same amount of money as in previous (calibration)period but adjusted by the overall churn rate r:
ViP ¼ ViC � 1−rð Þ ð5Þ
where r is the population churn rate and ViC is the revenue that custom-er i generates during the calibration period. We adopt a conservativeposition in defining the future spending ViP assuming that the retainedcustomerswill stay active for only one period (i.e. prediction period). Byhaving this assumption πi gives us the minimum profit that retainingcustomer i can generate for the company. If the customer stays activefor longer than one period, the generated profit πi would be evenhigher.
As for retention incentive δi, we adopt a pricing incentive in the formof a discount. As Harrison-Walker and Neeley (2004) note, in B2B con-texts, pricing incentive is a primary tool to increase customer retention.Therefore, the cost of retaining different customers will be different andwill depend on their future spending in prediction periodViP and discountparameter λi:
δi ¼ λiV iP : ð6Þ
It's important to note that πi can have positive and negative values.Positive value means that the benefit of bringing back the would-be-churner to the customer base is larger than the loss obtained (discountgiven). These customers aremore likely to have high probability to churnpi and/or large previous spending ViC. Negative values of πimean that the
Please cite this article as: Tamaddoni Jahromi, A., et al., Managing B2B cusment (2014), http://dx.doi.org/10.1016/j.indmarman.2014.06.016
loss is higher than the gain. Such customers are likely to have lower churnprobabilities and/or lower spending patterns.
Once πi for all customers is calculated, customers are ranked basedon their individual expected targeting profit. Doing so, the cumulativeprofit for each percentile from top to bottom of the customer base canbe calculated, using Eq. (3); and the optimum target size and the max-imum profit of a retention campaign can be determined.
4. Empirical analysis
4.1. Data
The data used in this study constitutes the transactional records of11,021 business customers of a major Australian online Fast MovingConsumer Goods (FMCG) retailer. Compared to consumers of the orga-nization, business customers can be characterized by higher spending ineach transaction and having more regular purchasing behavior.
The process of placing a B2B order is fairly simple. All a firm needs todo is to register on the focal company's website. Once registered, orderscan be placed by adding the required items to the shopping cart andpaying the due amount electronically. Apart from the commitmentsthat placing each individual order brings for each of the parties (i.e. pay-ing the price of the order and delivering the order), no long term agree-ments or contracts exist between the focal company and its businesscustomers. This means a business customer can stop being a ‘customer’at any timewithout notifying the focal company (i.e. making this a truenon-contractual setting).
The products involved in transactions can be considered as routineproducts (Kotler & Keller, 2006, p. 219). Such products generally havelow value and cost to the customers which somehow justifies why com-panies in this database have tended to have rather a transactional andnon-contractual relationship with the focal company.
To date, several approaches have been introduced by academics interms of splitting the timeline of the study for prediction purposes.What the majority of the approaches have in common are a calibrationperiod where the model is trained and a prediction period where thetrained model is used to make predictions about individual behavior.However, in terms of treating and locating these two periods on thedata timeline to make the predictions, academics have yet to reach con-sensus. For instance, Pancras (2009) splits the prediction time periodinto two sub-periods with equal lengths. Predictions are made for eachsub-period and then the twopredictions are aggregated to obtain the pre-diction for the whole prediction period. Berry and Linoff (2004) adopt adifferent approachwhere the prediction period is assumed to be one inte-grated period but is defined with a time gap from the calibration period.On the other hand, several studies exist where the prediction period hasbeen considered as one integrated period, which comes immediatelyafter the calibration period (Buckinx & Van den Poel, 2005; Coussement& De Bock, 2013).
For analytical purposes in the current study the latter approach hasbeen adopted due to its popularity among modelers. To this end, trans-actional records of business customers for the period September 1, 2011through September 1, 2012 (i.e. one year) have been utilized. This timewindow has been split into two periods with equal lengths:
• From September 1, 2011 to March 2, 2012 (183 days): CalibrationPeriod
• From March 3, 2012 to September 1, 2012 (183 days): PredictionPeriod.
A business customer is considered to be included in the study only if ithas made its first purchase in the first 12 weeks of the calibration period.
4.2. Stage 1: constructing churn prediction models
At the first stage of our analysis we construct several churn predic-tionmodels and compare themon their ability to identify true churners.
tomer churn, retention and profitability, Industrial Marketing Manage-
)
(b)
Table 1Confusion matrix for a binary classifier.
Actual Predicted
0 1
0 True negative (TN) False positive (FP) Number of real non-churner (TN + FP = N)1 False negative (FN) True positive (TP) Number of real churners (FN + TP = P)
6 A. Tamaddoni Jahromi et al. / Industrial Marketing Management xxx (2014) xxx–xxx
4.2.1. Variables operationalization
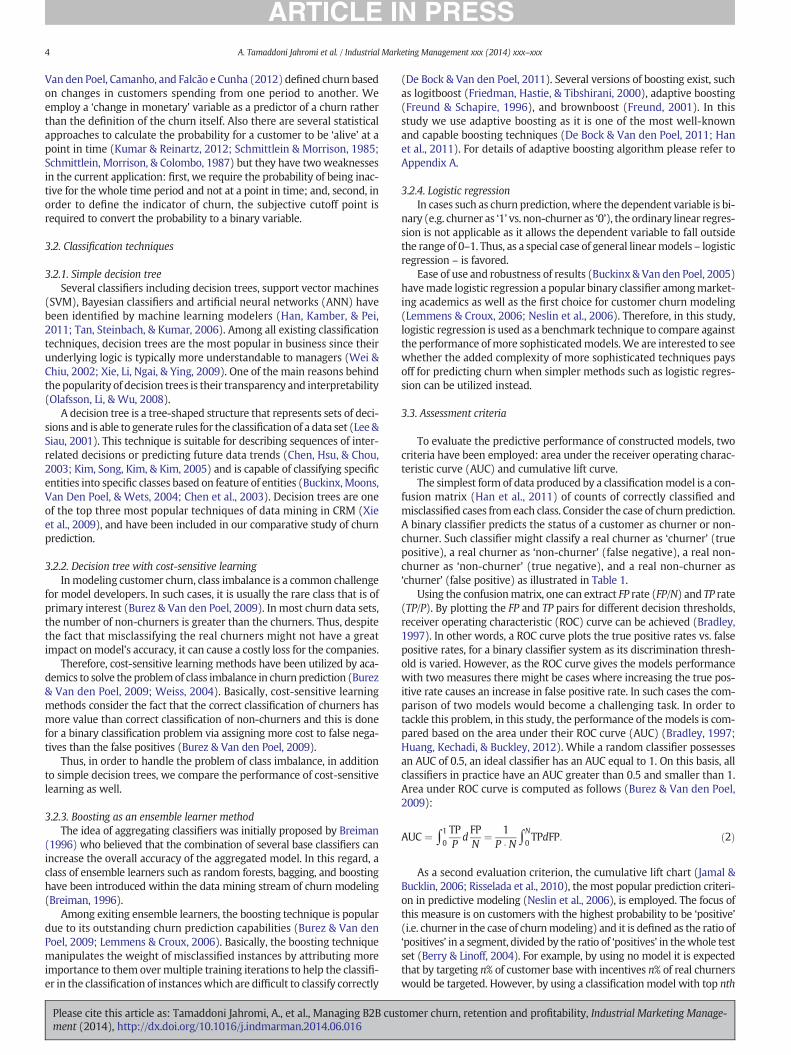
4.2.1.1. Predictor variables. The rawdata available for the analysis consistsof transactional information at the individual (B2B) customer level. Inthis study, in order to keep themodels in their simplest form, we soughtto employ as few predictors as possible, but seek to maximize predictivepower. Thismore focused andpragmatic approachwill enable academicsand practitioners to apply ourmethod to other cases with themost basicpredictors available in any databases. On this basis, recency and frequen-cy of purchases, as well as the magnitude of changes in total spending ofcustomers during the calibration period, have been chosen as predictorvariables to construct the models. Recency, frequency, and monetaryvariables have been proven to play an undeniable role in predictingcustomer churn (Buckinx & Van den Poel, 2005; Coussement & DeBock, 2013). As (Wu & Chen, 2000) noted, the more recent a customer'spurchase is, the more likely that the customer is active. In addition,according to Reinartz and Kumar (2000) frequency of purchases madeby a customer can be ameasure of defection likelihood in future. Previousstudies also suggest that the monetary value of past purchases of a givencustomer can be an indicator to predict the future behavior (Schmittlein&Peterson, 1994).
For the current study, recency, frequency, and monetary variableshave been extracted as follows:
1 — x: number of transactions observed during the calibration period;
2 — tx: time of the last transaction in observation period (0 ≤ tx ≤ T);3— T: known as observation period which varies across the customers;
it is the time between the first purchase and end of calibrationperiod;
4 — Δm: relative change in total spending of a customer in the secondhalf of the observation period (m2) when compared with the firsthalf of the observation period (m1), i.e. Δm = (m2 − m1)/m1.
Fig. 1 illustrates the predictor variables of this study on the datatimeline, for two customers with different behaviors.
4.2.1.2. Target variable. The target variable in the current study is ‘churn’which is defined based on business customers' transactional history inboth calibration and prediction periods. Therefore, a customer is defined
T
01-Sep-2011 01-Sep-201202-Mar-2012
0X XX
(Customer A)
XX
T
01-Sep-2011 01-Sep-201202-Mar-2012
0
Calibration period Prediction period
X XX
(Customer B)
Observation
midpoint
Observation
midpoint
Fig. 1.Modeling timeline for two customers with different observation lengths.
Please cite this article as: Tamaddoni Jahromi, A., et al., Managing B2B cusment (2014), http://dx.doi.org/10.1016/j.indmarman.2014.06.016
as a ‘churner’ (coded as 1) when the company has been active in thecalibration period (i.e. has at least one transaction in the calibrationperiod) but has no activity (i.e. purchase) in prediction period. On theother hand, a non-churner (coded as 0) is defined as a customer whohas been active in the calibration period and has made at least onepurchase in the prediction period.
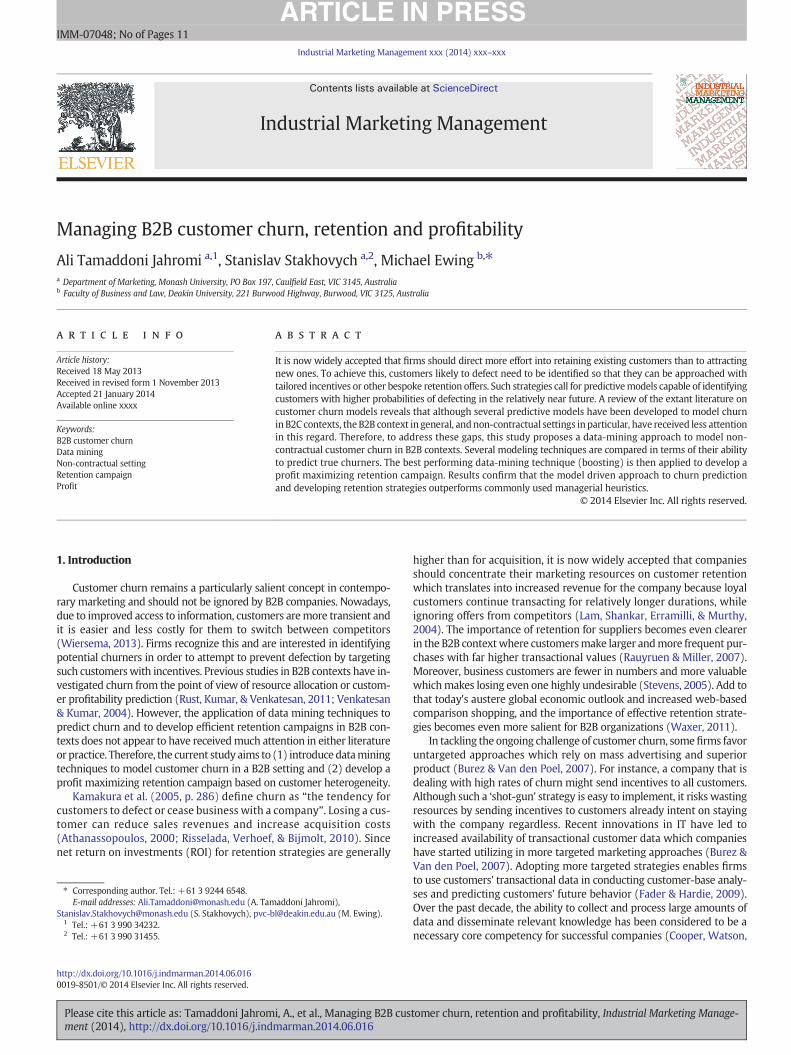
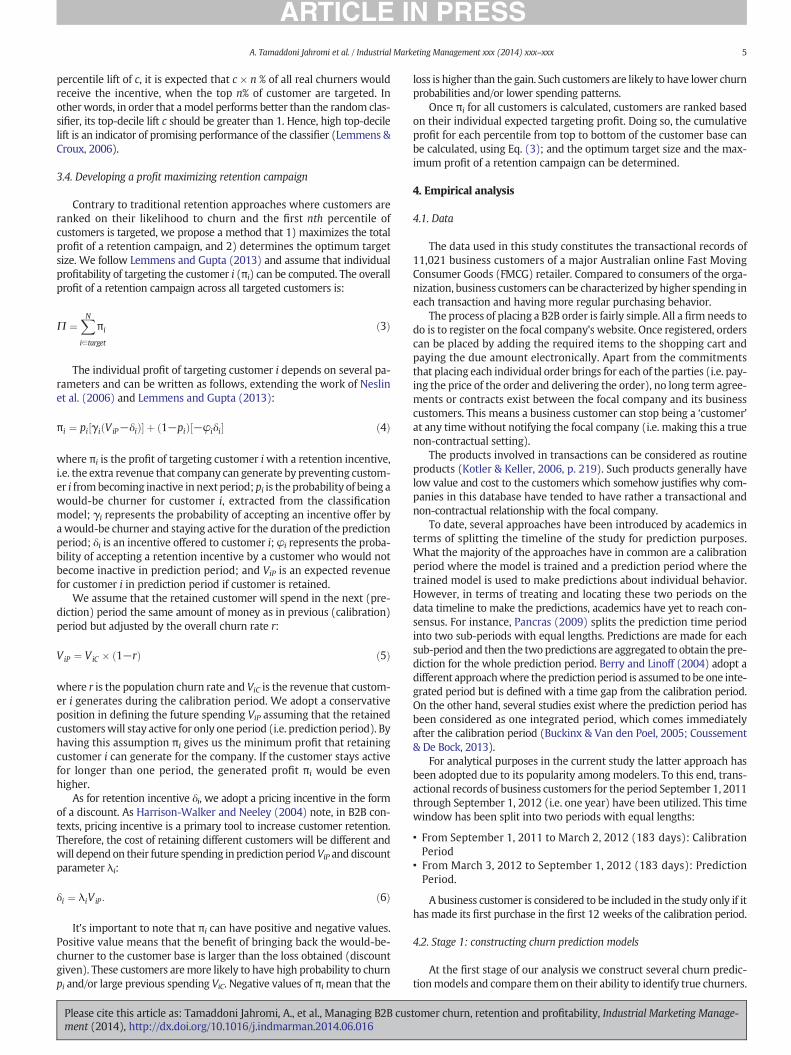
4.2.2. Model constructionWith the aim of constructing the classificationmodels, the customer
base is divided into a training set and a test set (70%/30%), such that7714 customers are allocated to the training set and the remaining3307 to the test set. Also, for the purpose of constructing the cost-sensitive model, the ratio of 1:3 (FP:FN) is employed.
Firstly, customers in the training set were used to construct thetrainingmodel. Predictors and the target variable (churn) were extract-ed for all customers in the training set according to the time windowpresented in Fig. 1. By incorporating all of these variables into simple de-cision tree, cost-sensitive decision tree, logistic regression, and boostingtechnique, all four models were trained. Once the models were trained,their performance was assessed using the test set, such that the predic-tors and the actual churn status of the remaining 30% of customers inthe dataset were extracted. At this point, and with the aim of testingthemodels' performance, the extracted predictor variables of customersin the test set should be incorporated in the models which have beenconstructed in the training phase. Using these predictors, the trainedmodels would predict customer status (i.e. whether a customer is achurner or not) for customers in the test set. By comparing the customerstatus, predicted by models, with customers' actual status, extractedfrom prediction period, models' performance can be evaluated (seeFig. 2).
4.2.3. Results of models' comparisonAll constructed churn prediction models, including simple and cost-
sensitive decision tree, boosting model, and logistic regression are ap-plied on the test set. Tables 2 to 5 illustrate the confusion matrix of
01-Sep-2011 01-Sep-201202-Mar-2012
Calibration
period
Prediction
period
Tra
in se
t (70
% )
Tes
t set
(30%
01-Sep-2011 01-Sep-201202-Mar-2012
Calibration
periodPrediction
period
(a)
Fig. 2. (a) RFM variables from calibration period and ‘churn’ variable from prediction periodare incorporated in themodel to build the trainingmodel. (b)Model constructed on train setis utilized to predict the ‘churn’ variable in prediction period using the RFM variables fromcalibration period.
tomer churn, retention and profitability, Industrial Marketing Manage-
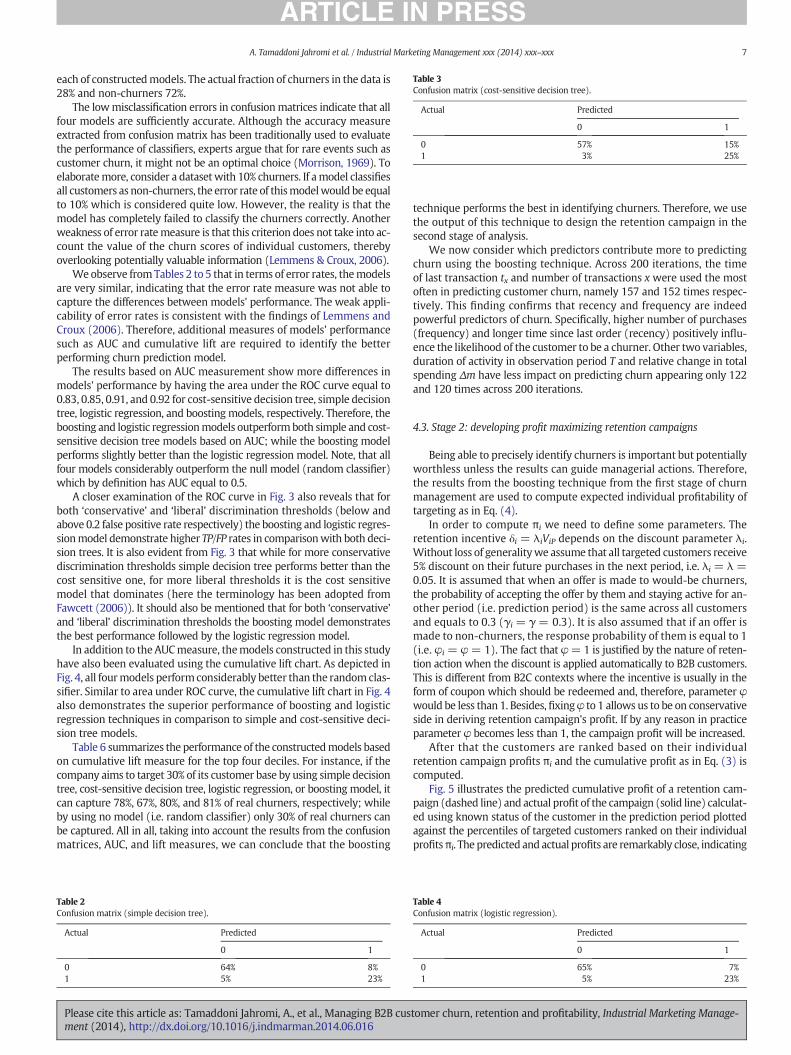
Table 3Confusion matrix (cost-sensitive decision tree).
Actual Predicted
0 1
0 57% 15%1 3% 25%
7A. Tamaddoni Jahromi et al. / Industrial Marketing Management xxx (2014) xxx–xxx
each of constructedmodels. The actual fraction of churners in the data is28% and non-churners 72%.
The lowmisclassification errors in confusionmatrices indicate that allfour models are sufficiently accurate. Although the accuracy measureextracted from confusion matrix has been traditionally used to evaluatethe performance of classifiers, experts argue that for rare events such ascustomer churn, it might not be an optimal choice (Morrison, 1969). Toelaboratemore, consider a datasetwith 10% churners. If amodel classifiesall customers as non-churners, the error rate of thismodelwould be equalto 10% which is considered quite low. However, the reality is that themodel has completely failed to classify the churners correctly. Anotherweakness of error ratemeasure is that this criterion does not take into ac-count the value of the churn scores of individual customers, therebyoverlooking potentially valuable information (Lemmens & Croux, 2006).
We observe fromTables 2 to 5 that in terms of error rates, themodelsare very similar, indicating that the error rate measure was not able tocapture the differences between models' performance. The weak appli-cability of error rates is consistent with the findings of Lemmens andCroux (2006). Therefore, additional measures of models' performancesuch as AUC and cumulative lift are required to identify the betterperforming churn prediction model.
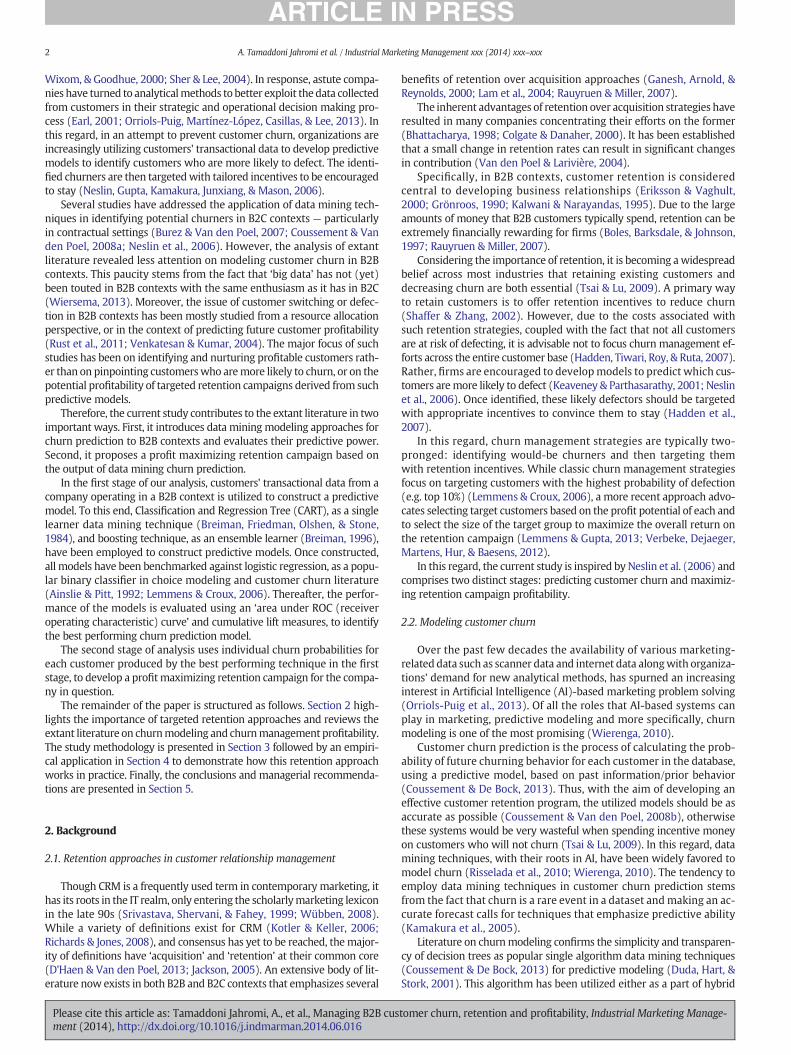
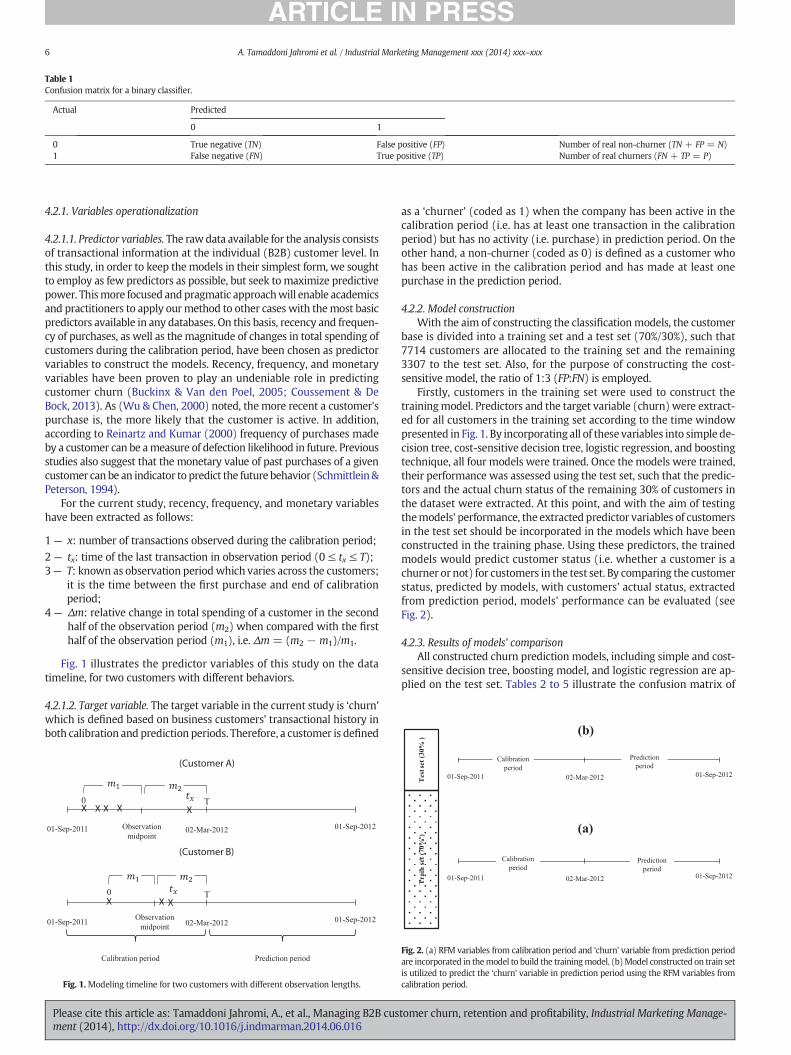
The results based on AUC measurement show more differences inmodels' performance by having the area under the ROC curve equal to0.83, 0.85, 0.91, and 0.92 for cost-sensitive decision tree, simple decisiontree, logistic regression, and boosting models, respectively. Therefore, theboosting and logistic regressionmodels outperformboth simple and cost-sensitive decision tree models based on AUC; while the boosting modelperforms slightly better than the logistic regression model. Note, that allfour models considerably outperform the null model (random classifier)which by definition has AUC equal to 0.5.
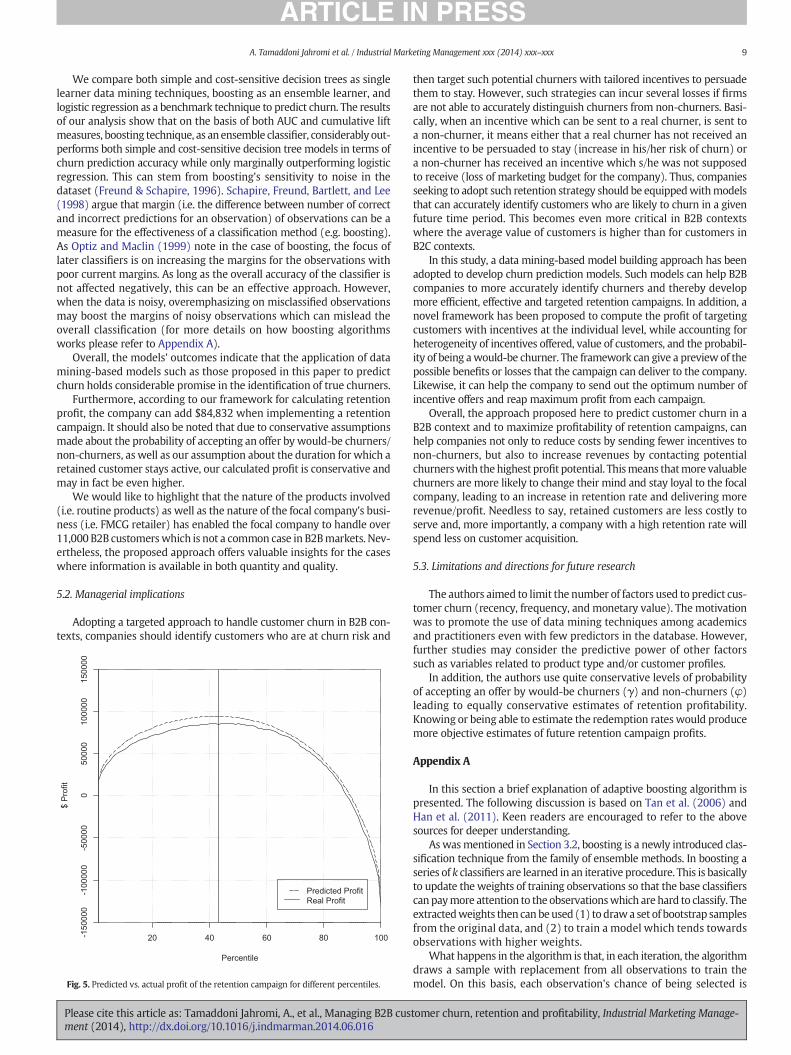
A closer examination of the ROC curve in Fig. 3 also reveals that forboth ‘conservative’ and ‘liberal’ discrimination thresholds (below andabove 0.2 false positive rate respectively) the boosting and logistic regres-sionmodel demonstrate higher TP/FP rates in comparisonwith both deci-sion trees. It is also evident from Fig. 3 that while for more conservativediscrimination thresholds simple decision tree performs better than thecost sensitive one, for more liberal thresholds it is the cost sensitivemodel that dominates (here the terminology has been adopted fromFawcett (2006)). It should also be mentioned that for both ‘conservative’and ‘liberal’ discrimination thresholds the boosting model demonstratesthe best performance followed by the logistic regression model.
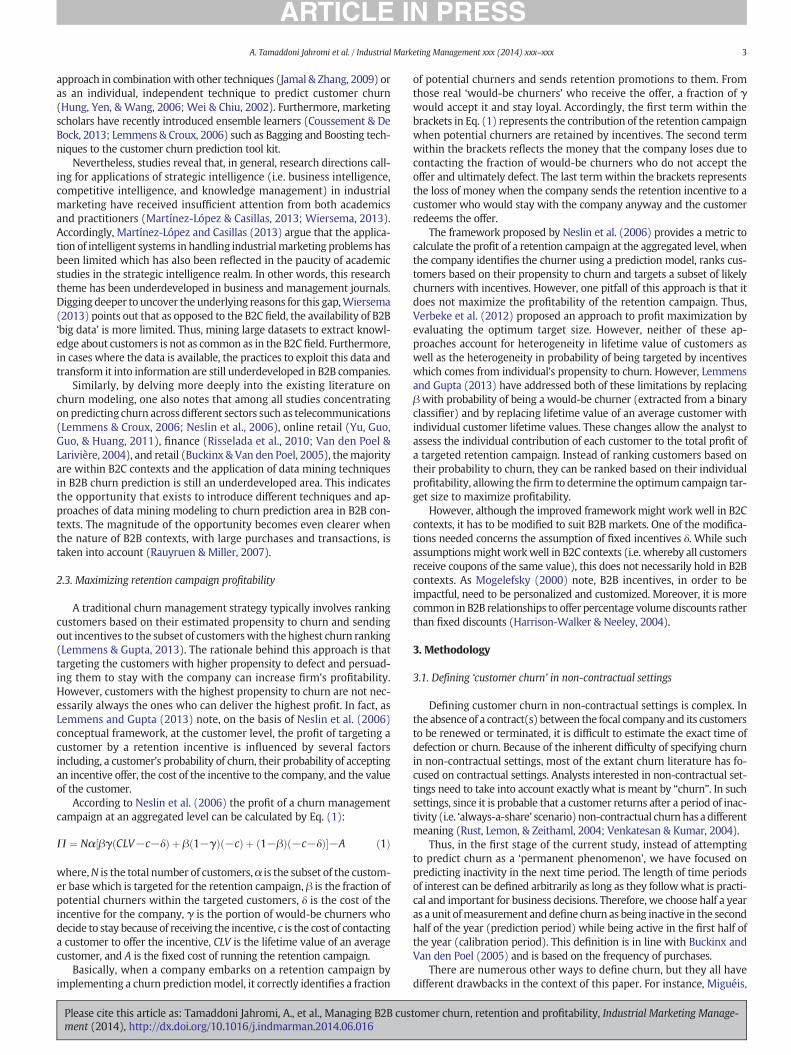
In addition to the AUCmeasure, themodels constructed in this studyhave also been evaluated using the cumulative lift chart. As depicted inFig. 4, all fourmodels performconsiderably better than the randomclas-sifier. Similar to area under ROC curve, the cumulative lift chart in Fig. 4also demonstrates the superior performance of boosting and logisticregression techniques in comparison to simple and cost-sensitive deci-sion tree models.
Table 6 summarizes the performance of the constructedmodels basedon cumulative lift measure for the top four deciles. For instance, if thecompany aims to target 30% of its customer base by using simple decisiontree, cost-sensitive decision tree, logistic regression, or boosting model, itcan capture 78%, 67%, 80%, and 81% of real churners, respectively; whileby using no model (i.e. random classifier) only 30% of real churners canbe captured. All in all, taking into account the results from the confusionmatrices, AUC, and lift measures, we can conclude that the boosting
Table 2Confusion matrix (simple decision tree).
Actual Predicted
0 1
0 64% 8%1 5% 23%
Please cite this article as: Tamaddoni Jahromi, A., et al., Managing B2B cusment (2014), http://dx.doi.org/10.1016/j.indmarman.2014.06.016
technique performs the best in identifying churners. Therefore, we usethe output of this technique to design the retention campaign in thesecond stage of analysis.
We now consider which predictors contribute more to predictingchurn using the boosting technique. Across 200 iterations, the timeof last transaction tx and number of transactions x were used the mostoften in predicting customer churn, namely 157 and 152 times respec-tively. This finding confirms that recency and frequency are indeedpowerful predictors of churn. Specifically, higher number of purchases(frequency) and longer time since last order (recency) positively influ-ence the likelihood of the customer to be a churner. Other two variables,duration of activity in observation period T and relative change in totalspending Δm have less impact on predicting churn appearing only 122and 120 times across 200 iterations.
4.3. Stage 2: developing profit maximizing retention campaigns
Being able to precisely identify churners is important but potentiallyworthless unless the results can guide managerial actions. Therefore,the results from the boosting technique from the first stage of churnmanagement are used to compute expected individual profitability oftargeting as in Eq. (4).
In order to compute πi we need to define some parameters. Theretention incentive δi = λiViP depends on the discount parameter λi.Without loss of generalitywe assume that all targeted customers receive5% discount on their future purchases in the next period, i.e. λi = λ =0.05. It is assumed that when an offer is made to would-be churners,the probability of accepting the offer by them and staying active for an-other period (i.e. prediction period) is the same across all customersand equals to 0.3 (γi = γ = 0.3). It is also assumed that if an offer ismade to non-churners, the response probability of them is equal to 1(i.e. φi = φ = 1). The fact that φ=1 is justified by the nature of reten-tion action when the discount is applied automatically to B2B customers.This is different from B2C contexts where the incentive is usually in theform of coupon which should be redeemed and, therefore, parameter φwould be less than 1. Besides,fixingφ to 1 allows us to be on conservativeside in deriving retention campaign's profit. If by any reason in practiceparameter φ becomes less than 1, the campaign profit will be increased.
After that the customers are ranked based on their individualretention campaign profits πi and the cumulative profit as in Eq. (3) iscomputed.
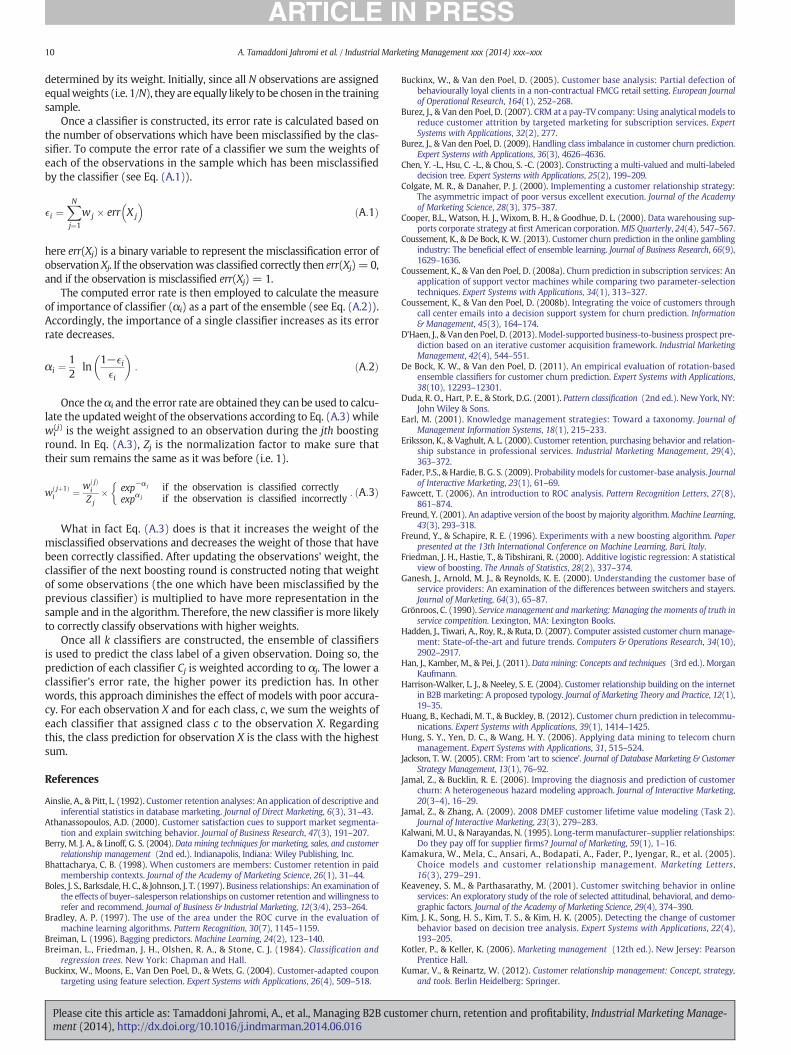
Fig. 5 illustrates the predicted cumulative profit of a retention cam-paign (dashed line) and actual profit of the campaign (solid line) calculat-ed using known status of the customer in the prediction period plottedagainst the percentiles of targeted customers ranked on their individualprofitsπi. The predicted and actual profits are remarkably close, indicating
Table 4Confusion matrix (logistic regression).
Actual Predicted
0 1
0 65% 7%1 5% 23%
tomer churn, retention and profitability, Industrial Marketing Manage-
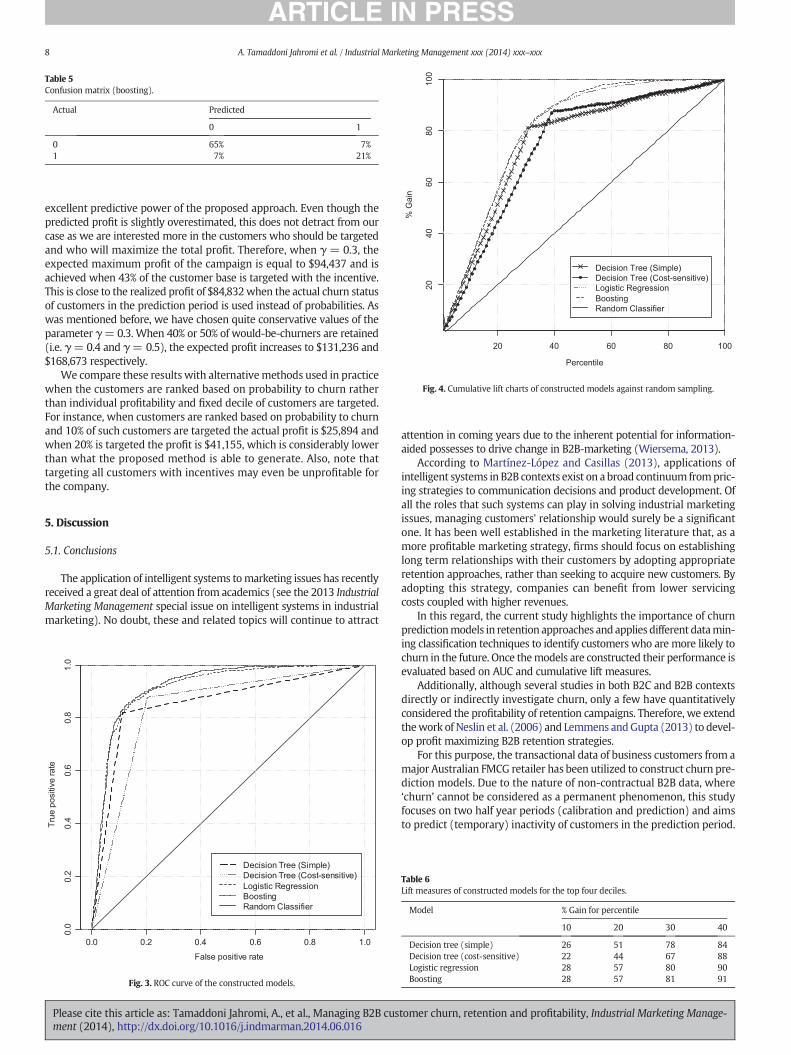
Table 5Confusion matrix (boosting).
Actual Predicted
0 1
0 65% 7%1 7% 21%
20 40 60 80 100
2040
6080
100
Percentile
% G
ain
Decision Tree (Simple)Decision Tree (Cost-sensitive)Logistic RegressionBoostingRandom Classifier
Fig. 4. Cumulative lift charts of constructed models against random sampling.
8 A. Tamaddoni Jahromi et al. / Industrial Marketing Management xxx (2014) xxx–xxx
excellent predictive power of the proposed approach. Even though thepredicted profit is slightly overestimated, this does not detract from ourcase as we are interested more in the customers who should be targetedand who will maximize the total profit. Therefore, when γ = 0.3, theexpected maximum profit of the campaign is equal to $94,437 and isachieved when 43% of the customer base is targeted with the incentive.This is close to the realized profit of $84,832when the actual churn statusof customers in the prediction period is used instead of probabilities. Aswas mentioned before, we have chosen quite conservative values of theparameter γ=0.3. When 40% or 50% of would-be-churners are retained(i.e. γ=0.4 and γ= 0.5), the expected profit increases to $131,236 and$168,673 respectively.
We compare these results with alternativemethods used in practicewhen the customers are ranked based on probability to churn ratherthan individual profitability and fixed decile of customers are targeted.For instance, when customers are ranked based on probability to churnand 10% of such customers are targeted the actual profit is $25,894 andwhen 20% is targeted the profit is $41,155, which is considerably lowerthan what the proposed method is able to generate. Also, note thattargeting all customers with incentives may even be unprofitable forthe company.
5. Discussion
5.1. Conclusions
The application of intelligent systems tomarketing issues has recentlyreceived a great deal of attention from academics (see the 2013 IndustrialMarketing Management special issue on intelligent systems in industrialmarketing). No doubt, these and related topics will continue to attract
False positive rate
Tru
e p
ositiv
e r
ate
0.0 0.2 0.4 0.6 0.8 1.0
0.0
0.2
0.4
0.6
0.8
1.0
Decision Tree (Simple)
Decision Tree (Cost-sensitive)
Logistic Regression
Boosting
Random Classifier
Fig. 3. ROC curve of the constructed models.
Please cite this article as: Tamaddoni Jahromi, A., et al., Managing B2B cusment (2014), http://dx.doi.org/10.1016/j.indmarman.2014.06.016
attention in coming years due to the inherent potential for information-aided possesses to drive change in B2B-marketing (Wiersema, 2013).
According to Martínez-López and Casillas (2013), applications ofintelligent systems in B2B contexts exist on a broad continuum frompric-ing strategies to communication decisions and product development. Ofall the roles that such systems can play in solving industrial marketingissues, managing customers' relationship would surely be a significantone. It has been well established in the marketing literature that, as amore profitable marketing strategy, firms should focus on establishinglong term relationships with their customers by adopting appropriateretention approaches, rather than seeking to acquire new customers. Byadopting this strategy, companies can benefit from lower servicingcosts coupled with higher revenues.
In this regard, the current study highlights the importance of churnpredictionmodels in retention approaches andapplies different datamin-ing classification techniques to identify customers who are more likely tochurn in the future. Once themodels are constructed their performance isevaluated based on AUC and cumulative lift measures.
Additionally, although several studies in both B2C and B2B contextsdirectly or indirectly investigate churn, only a few have quantitativelyconsidered the profitability of retention campaigns. Therefore, we extendthework of Neslin et al. (2006) and Lemmens andGupta (2013) to devel-op profit maximizing B2B retention strategies.
For this purpose, the transactional data of business customers from amajor Australian FMCG retailer has been utilized to construct churn pre-diction models. Due to the nature of non-contractual B2B data, where‘churn’ cannot be considered as a permanent phenomenon, this studyfocuses on two half year periods (calibration and prediction) and aimsto predict (temporary) inactivity of customers in the prediction period.
Table 6Lift measures of constructed models for the top four deciles.
Model % Gain for percentile
10 20 30 40
Decision tree (simple) 26 51 78 84Decision tree (cost-sensitive) 22 44 67 88Logistic regression 28 57 80 90Boosting 28 57 81 91
tomer churn, retention and profitability, Industrial Marketing Manage-
9A. Tamaddoni Jahromi et al. / Industrial Marketing Management xxx (2014) xxx–xxx
We compare both simple and cost-sensitive decision trees as singlelearner data mining techniques, boosting as an ensemble learner, andlogistic regression as a benchmark technique to predict churn. The resultsof our analysis show that on the basis of both AUC and cumulative liftmeasures, boosting technique, as anensemble classifier, considerably out-performs both simple and cost-sensitive decision tree models in terms ofchurn prediction accuracy while only marginally outperforming logisticregression. This can stem from boosting's sensitivity to noise in thedataset (Freund & Schapire, 1996). Schapire, Freund, Bartlett, and Lee(1998) argue that margin (i.e. the difference between number of correctand incorrect predictions for an observation) of observations can be ameasure for the effectiveness of a classification method (e.g. boosting).As Optiz and Maclin (1999) note in the case of boosting, the focus oflater classifiers is on increasing the margins for the observations withpoor current margins. As long as the overall accuracy of the classifier isnot affected negatively, this can be an effective approach. However,when the data is noisy, overemphasizing on misclassified observationsmay boost the margins of noisy observations which can mislead theoverall classification (for more details on how boosting algorithmsworks please refer to Appendix A).
Overall, the models' outcomes indicate that the application of datamining-based models such as those proposed in this paper to predictchurn holds considerable promise in the identification of true churners.
Furthermore, according to our framework for calculating retentionprofit, the company can add $84,832 when implementing a retentioncampaign. It should also be noted that due to conservative assumptionsmade about the probability of accepting an offer by would-be churners/non-churners, as well as our assumption about the duration for which aretained customer stays active, our calculated profit is conservative andmay in fact be even higher.
We would like to highlight that the nature of the products involved(i.e. routine products) as well as the nature of the focal company's busi-ness (i.e. FMCG retailer) has enabled the focal company to handle over11,000 B2B customerswhich is not a common case in B2Bmarkets. Nev-ertheless, the proposed approach offers valuable insights for the caseswhere information is available in both quantity and quality.
5.2. Managerial implications
Adopting a targeted approach to handle customer churn in B2B con-texts, companies should identify customers who are at churn risk and
20 40 60 80 100-150
000
-100
000
-500
000
5000
010
0000
1500
00
Percentile
$ P
rofit
Predicted ProfitReal Profit
Fig. 5. Predicted vs. actual profit of the retention campaign for different percentiles.
Please cite this article as: Tamaddoni Jahromi, A., et al., Managing B2B cusment (2014), http://dx.doi.org/10.1016/j.indmarman.2014.06.016
then target such potential churners with tailored incentives to persuadethem to stay. However, such strategies can incur several losses if firmsare not able to accurately distinguish churners from non-churners. Basi-cally, when an incentive which can be sent to a real churner, is sent toa non-churner, it means either that a real churner has not received anincentive to be persuaded to stay (increase in his/her risk of churn) ora non-churner has received an incentive which s/he was not supposedto receive (loss of marketing budget for the company). Thus, companiesseeking to adopt such retention strategy should be equippedwithmodelsthat can accurately identify customers who are likely to churn in a givenfuture time period. This becomes even more critical in B2B contextswhere the average value of customers is higher than for customers inB2C contexts.
In this study, a data mining-based model building approach has beenadopted to develop churn prediction models. Such models can help B2Bcompanies to more accurately identify churners and thereby developmore efficient, effective and targeted retention campaigns. In addition, anovel framework has been proposed to compute the profit of targetingcustomers with incentives at the individual level, while accounting forheterogeneity of incentives offered, value of customers, and the probabil-ity of being awould-be churner. The framework can give a preview of thepossible benefits or losses that the campaign can deliver to the company.Likewise, it can help the company to send out the optimum number ofincentive offers and reap maximum profit from each campaign.
Overall, the approach proposed here to predict customer churn in aB2B context and to maximize profitability of retention campaigns, canhelp companies not only to reduce costs by sending fewer incentives tonon-churners, but also to increase revenues by contacting potentialchurnerswith the highest profit potential. Thismeans thatmore valuablechurners are more likely to change their mind and stay loyal to the focalcompany, leading to an increase in retention rate and delivering morerevenue/profit. Needless to say, retained customers are less costly toserve and, more importantly, a company with a high retention rate willspend less on customer acquisition.
5.3. Limitations and directions for future research
The authors aimed to limit the number of factors used to predict cus-tomer churn (recency, frequency, andmonetary value). Themotivationwas to promote the use of data mining techniques among academicsand practitioners even with few predictors in the database. However,further studies may consider the predictive power of other factorssuch as variables related to product type and/or customer profiles.
In addition, the authors use quite conservative levels of probabilityof accepting an offer by would-be churners (γ) and non-churners (φ)leading to equally conservative estimates of retention profitability.Knowing or being able to estimate the redemption rateswould producemore objective estimates of future retention campaign profits.
Appendix A
In this section a brief explanation of adaptive boosting algorithm ispresented. The following discussion is based on Tan et al. (2006) andHan et al. (2011). Keen readers are encouraged to refer to the abovesources for deeper understanding.
As wasmentioned in Section 3.2, boosting is a newly introduced clas-sification technique from the family of ensemble methods. In boosting aseries of k classifiers are learned in an iterative procedure. This is basicallyto update the weights of training observations so that the base classifierscan paymore attention to the observationswhich are hard to classify. Theextractedweights then can beused (1) to drawa set of bootstrap samplesfrom the original data, and (2) to train a model which tends towardsobservations with higher weights.
What happens in the algorithm is that, in each iteration, the algorithmdraws a sample with replacement from all observations to train themodel. On this basis, each observation's chance of being selected is
tomer churn, retention and profitability, Industrial Marketing Manage-
10 A. Tamaddoni Jahromi et al. / Industrial Marketing Management xxx (2014) xxx–xxx
determined by its weight. Initially, since all N observations are assignedequalweights (i.e. 1/N), they are equally likely to be chosen in the trainingsample.
Once a classifier is constructed, its error rate is calculated based onthe number of observations which have been misclassified by the clas-sifier. To compute the error rate of a classifier we sum the weights ofeach of the observations in the sample which has been misclassifiedby the classifier (see Eq. (A.1)).
ϵi ¼XNj¼1
wj � err X j
� �ðA:1Þ
here err(Xj) is a binary variable to represent the misclassification error ofobservation Xj. If the observationwas classified correctly then err(Xj)=0,and if the observation is misclassified err(Xj) = 1.
The computed error rate is then employed to calculate the measureof importance of classifier (αi) as a part of the ensemble (see Eq. (A.2)).Accordingly, the importance of a single classifier increases as its errorrate decreases.
αi ¼12
ln1−ϵiϵi
� �: ðA:2Þ
Once the αi and the error rate are obtained they can be used to calcu-late the updated weight of the observations according to Eq. (A.3) whilewi
(j) is the weight assigned to an observation during the jth boostinground. In Eq. (A.3), Zj is the normalization factor to make sure thattheir sum remains the same as it was before (i.e. 1).
w jþ1ð Þi ¼ w jð Þ
i
Z j� exp−α j
expα j
if the observation is classified correctlyif the observation is classified incorrectly
:
�ðA:3Þ
What in fact Eq. (A.3) does is that it increases the weight of themisclassified observations and decreases the weight of those that havebeen correctly classified. After updating the observations' weight, theclassifier of the next boosting round is constructed noting that weightof some observations (the one which have been misclassified by theprevious classifier) is multiplied to have more representation in thesample and in the algorithm. Therefore, the new classifier is more likelyto correctly classify observations with higher weights.
Once all k classifiers are constructed, the ensemble of classifiersis used to predict the class label of a given observation. Doing so, theprediction of each classifier Cj is weighted according to αj. The lower aclassifier's error rate, the higher power its prediction has. In otherwords, this approach diminishes the effect of models with poor accura-cy. For each observation X and for each class, c, we sum the weights ofeach classifier that assigned class c to the observation X. Regardingthis, the class prediction for observation X is the class with the highestsum.
References
Ainslie, A., & Pitt, L. (1992). Customer retention analyses: An application of descriptive andinferential statistics in database marketing. Journal of Direct Marketing, 6(3), 31–43.
Athanassopoulos, A.D. (2000). Customer satisfaction cues to support market segmenta-tion and explain switching behavior. Journal of Business Research, 47(3), 191–207.
Berry, M. J. A., & Linoff, G. S. (2004). Data mining techniques for marketing, sales, and customerrelationship management (2nd ed.). Indianapolis, Indiana: Wiley Publishing, Inc.
Bhattacharya, C. B. (1998). When customers are members: Customer retention in paidmembership contexts. Journal of the Academy of Marketing Science, 26(1), 31–44.
Boles, J. S., Barksdale, H. C., & Johnson, J. T. (1997). Business relationships: An examination ofthe effects of buyer–salesperson relationships on customer retention andwillingness torefer and recommend. Journal of Business & Industrial Marketing, 12(3/4), 253–264.
Bradley, A. P. (1997). The use of the area under the ROC curve in the evaluation ofmachine learning algorithms. Pattern Recognition, 30(7), 1145–1159.
Breiman, L. (1996). Bagging predictors. Machine Learning, 24(2), 123–140.Breiman, L., Friedman, J. H., Olshen, R. A., & Stone, C. J. (1984). Classification and
regression trees. New York: Chapman and Hall.Buckinx, W., Moons, E., Van Den Poel, D., & Wets, G. (2004). Customer-adapted coupon
targeting using feature selection. Expert Systems with Applications, 26(4), 509–518.
Please cite this article as: Tamaddoni Jahromi, A., et al., Managing B2B cusment (2014), http://dx.doi.org/10.1016/j.indmarman.2014.06.016
Buckinx, W., & Van den Poel, D. (2005). Customer base analysis: Partial defection ofbehaviourally loyal clients in a non-contractual FMCG retail setting. European Journalof Operational Research, 164(1), 252–268.
Burez, J., & Van den Poel, D. (2007). CRM at a pay-TV company: Using analytical models toreduce customer attrition by targeted marketing for subscription services. ExpertSystems with Applications, 32(2), 277.
Burez, J., & Van den Poel, D. (2009). Handling class imbalance in customer churn prediction.Expert Systems with Applications, 36(3), 4626–4636.
Chen, Y. -L., Hsu, C. -L., & Chou, S. -C. (2003). Constructing a multi-valued and multi-labeleddecision tree. Expert Systems with Applications, 25(2), 199–209.
Colgate, M. R., & Danaher, P. J. (2000). Implementing a customer relationship strategy:The asymmetric impact of poor versus excellent execution. Journal of the Academyof Marketing Science, 28(3), 375–387.
Cooper, B.L., Watson, H. J., Wixom, B. H., & Goodhue, D. L. (2000). Data warehousing sup-ports corporate strategy at first American corporation.MIS Quarterly, 24(4), 547–567.
Coussement, K., & De Bock, K. W. (2013). Customer churn prediction in the online gamblingindustry: The beneficial effect of ensemble learning. Journal of Business Research, 66(9),1629–1636.
Coussement, K., & Van den Poel, D. (2008a). Churn prediction in subscription services: Anapplication of support vector machines while comparing two parameter-selectiontechniques. Expert Systems with Applications, 34(1), 313–327.
Coussement, K., & Van den Poel, D. (2008b). Integrating the voice of customers throughcall center emails into a decision support system for churn prediction. Information& Management, 45(3), 164–174.
D'Haen, J., & Van den Poel, D. (2013).Model-supported business-to-business prospect pre-diction based on an iterative customer acquisition framework. Industrial MarketingManagement, 42(4), 544–551.
De Bock, K. W., & Van den Poel, D. (2011). An empirical evaluation of rotation-basedensemble classifiers for customer churn prediction. Expert Systems with Applications,38(10), 12293–12301.
Duda, R. O., Hart, P. E., & Stork, D.G. (2001). Pattern classification (2nd ed.). New York, NY:John Wiley & Sons.
Earl, M. (2001). Knowledge management strategies: Toward a taxonomy. Journal ofManagement Information Systems, 18(1), 215–233.
Eriksson, K., & Vaghult, A. L. (2000). Customer retention, purchasing behavior and relation-ship substance in professional services. Industrial Marketing Management, 29(4),363–372.
Fader, P.S., & Hardie, B. G. S. (2009). Probabilitymodels for customer-base analysis. Journalof Interactive Marketing, 23(1), 61–69.
Fawcett, T. (2006). An introduction to ROC analysis. Pattern Recognition Letters, 27(8),861–874.
Freund, Y. (2001). An adaptive version of the boost bymajority algorithm.Machine Learning,43(3), 293–318.
Freund, Y., & Schapire, R. E. (1996). Experiments with a new boosting algorithm. Paperpresented at the 13th International Conference on Machine Learning, Bari, Italy.
Friedman, J. H., Hastie, T., & Tibshirani, R. (2000). Additive logistic regression: A statisticalview of boosting. The Annals of Statistics, 28(2), 337–374.
Ganesh, J., Arnold, M. J., & Reynolds, K. E. (2000). Understanding the customer base ofservice providers: An examination of the differences between switchers and stayers.Journal of Marketing, 64(3), 65–87.
Grönroos, C. (1990). Service management and marketing: Managing the moments of truth inservice competition. Lexington, MA: Lexington Books.
Hadden, J., Tiwari, A., Roy, R., & Ruta, D. (2007). Computer assisted customer churn manage-ment: State-of-the-art and future trends. Computers & Operations Research, 34(10),2902–2917.
Han, J., Kamber, M., & Pei, J. (2011). Data mining: Concepts and techniques (3rd ed.). MorganKaufmann.
Harrison-Walker, L. J., & Neeley, S. E. (2004). Customer relationship building on the internetin B2B marketing: A proposed typology. Journal of Marketing Theory and Practice, 12(1),19–35.
Huang, B., Kechadi, M. T., & Buckley, B. (2012). Customer churn prediction in telecommu-nications. Expert Systems with Applications, 39(1), 1414–1425.
Hung, S. Y., Yen, D. C., & Wang, H. Y. (2006). Applying data mining to telecom churnmanagement. Expert Systems with Applications, 31, 515–524.
Jackson, T. W. (2005). CRM: From ‘art to science’. Journal of Database Marketing & CustomerStrategy Management, 13(1), 76–92.
Jamal, Z., & Bucklin, R. E. (2006). Improving the diagnosis and prediction of customerchurn: A heterogeneous hazard modeling approach. Journal of Interactive Marketing,20(3–4), 16–29.
Jamal, Z., & Zhang, A. (2009). 2008 DMEF customer lifetime value modeling (Task 2).Journal of Interactive Marketing, 23(3), 279–283.
Kalwani, M. U., & Narayandas, N. (1995). Long-termmanufacturer–supplier relationships:Do they pay off for supplier firms? Journal of Marketing, 59(1), 1–16.
Kamakura, W., Mela, C., Ansari, A., Bodapati, A., Fader, P., Iyengar, R., et al. (2005).Choice models and customer relationship management. Marketing Letters,16(3), 279–291.
Keaveney, S. M., & Parthasarathy, M. (2001). Customer switching behavior in onlineservices: An exploratory study of the role of selected attitudinal, behavioral, and demo-graphic factors. Journal of the Academy of Marketing Science, 29(4), 374–390.
Kim, J. K., Song, H. S., Kim, T. S., & Kim, H. K. (2005). Detecting the change of customerbehavior based on decision tree analysis. Expert Systems with Applications, 22(4),193–205.
Kotler, P., & Keller, K. (2006). Marketing management (12th ed.). New Jersey: PearsonPrentice Hall.
Kumar, V., & Reinartz, W. (2012). Customer relationship management: Concept, strategy,and tools. Berlin Heidelberg: Springer.
tomer churn, retention and profitability, Industrial Marketing Manage-
11A. Tamaddoni Jahromi et al. / Industrial Marketing Management xxx (2014) xxx–xxx
Lam, S. Y., Shankar, V., Erramilli, M. K., & Murthy, B. (2004). Customer value, satisfaction,loyalty, and switching costs: An illustration from a business-to-business servicecontext. Journal of the Academy of Marketing Science, 32(3), 293–311.
Lee, S. J., & Siau, K. (2001). A review of data mining techniques. Industrial Management andData Systems, 101(1), 41–46.
Lemmens, A., & Croux, C. (2006). Bagging and boosting classification trees to predictchurn. Journal of Marketing Research, 43(2), 276–286.
Lemmens, A., & Gupta, S. (2013). Managing churn to maximize profits. Working Paper(doi: http://www.hbs.edu/faculty/Publication%20Files/14-020_3553a2f4-8c7b-44e6-9711-f75dd56f624e.pdf).
Martínez-López, F. J., & Casillas, J. (2013). Artificial intelligence-based systems applied inindustrial marketing: An historical overview, current and future insights. IndustrialMarketing Management, 42, 489–495.
Miguéis, V. L., Van den Poel, D., Camanho, A. S., & Falcão e Cunha, J. (2012). Modelingpartial customer churn: On the value of first product-category purchase sequences.Expert Systems with Applications, 39(12), 11250–11256.
Mogelefsky, D. (2000). Smooth operators. Incentive, 174(5), 104.Morrison, D.G. (1969). On the interpretation of discriminant analysis. Journal of Marketing
Research, 6(2), 156–163.Neslin, S. A., Gupta, S., Kamakura, W., Junxiang, L., & Mason, C. H. (2006). Defection detec-
tion: Measuring and understanding the predictive accuracy of customer churn models.Journal of Marketing Research, 43(2), 204–211.
Olafsson, S., Li, X., &Wu, S. (2008). Operations research and data mining. European Journalof Operational Research, 187(3), 1429–1448.
Optiz, D., & Maclin, R. (1999). Popular ensemble methods: An empirical study. Journal ofArtificial Intelligence Research, 11, 169–198.
Orriols-Puig, A., Martínez-López, F. J., Casillas, J., & Lee, N. (2013). Unsupervised KDDto creatively support managers' decision making with fuzzy association rules: A dis-tribution channel application. Industrial Marketing Management, 42(4), 532–543.
Pancras, J. (2009). A method to predict aggregate customer equity using activenessthresholds — 2008 DMEF customer lifetime value modeling competition (Task 1).Journal of Interactive Marketing, 23(3), 276–278.
Rauyruen, P., & Miller, K. E. (2007). Relationship quality as a predictor of B2B customerloyalty. Journal of Business Research, 60(1), 21–31.
Reinartz,W. J., & Kumar, V. (2000). On the profitability of long-life customers in a noncon-tractual setting: An empirical investigation and implications for marketing. Journal ofMarketing, 64(4), 17–35.
Richards, K. A., & Jones, E. (2008). Customer relationship management: Finding valuedrivers. Industrial Marketing Management, 37, 120–130.
Risselada, H., Verhoef, P. C., & Bijmolt, T. H. A. (2010). Staying power of churn predictionmodels. Journal of Interactive Marketing, 24(3), 198–208.
Rust, R. T., Kumar, V., & Venkatesan, R. (2011). Will the frog change into a prince? Predictingfuture customer profitability. International Journal of Research in Marketing, 28(4),281–294.
Rust, R. T., Lemon, K. N., & Zeithaml, V. A. (2004). Return on marketing: Using customerequity to focus marketing strategy. Journal of Marketing, 68(1), 109–127.
Schapire, R. E., Freund, Y., Bartlett, P., & Lee, W. S. (1998). Boosting the margin: A newexplanation for the effectiveness of voting methods. The Annals of Statistics, 26(5),1651–1686.
Schmittlein, D. C., & Morrison, D.G. (1985). Is the customer still active? The AmericanStatistician, 39(4), 291–295.
Schmittlein, D. C., Morrison, D.G., & Colombo, R. (1987). Counting your customers: Whoare they and what will they do next? Management Science, 33(1), 1–24.
Schmittlein, D. C., & Peterson, R. A. (1994). Customer base analysis: An industrial purchaseprocess application. Marketing Science, 13(1), 41–67.
Shaffer, G., & Zhang, Z. J. (2002). Competitive one-to-one promotions. ManagementScience, 48(9), 1143–1160.
Sher, P. J., & Lee, V. C. (2004). Information technology as a facilitator for enhancing dy-namic capabilities through knowledge management. Information & Management,41(8), 933–945.
Please cite this article as: Tamaddoni Jahromi, A., et al., Managing B2B cusment (2014), http://dx.doi.org/10.1016/j.indmarman.2014.06.016
Srivastava, R. K., Shervani, T. A., & Fahey, L. (1999). Marketing, business processes, andshareholder value: An organizationally embedded view of marketing activities andthe discipline of marketing. Journal of Marketing, 63, 168–179 (Special Issue).
Stevens, R. P. (2005). B-to-B customer retention: Seven strategies for keeping your customers.Tan, P. -N., Steinbach, M., & Kumar, V. (2006). Introduction to data mining. Boston, MA:
Pearson Education Inc.Tsai, C. -F., & Lu, Y. -H. (2009). Customer churn prediction by hybrid neural networks.
Expert Systems with Applications, 36(10), 12547–12553.Van den Poel, D., & Larivière, B. (2004). Customer attrition analysis for financial services
using proportional hazard models. European Journal of Operational Research, 157(1),196–217.
Venkatesan, R., & Kumar, V. (2004). A customer lifetime value framework for customerselection and resource allocation strategy. Journal of Marketing, 68(4), 106–125.
Verbeke, W., Dejaeger, K., Martens, D., Hur, J., & Baesens, B. (2012). New insights intochurn prediction in the telecommunication sector: A profit driven data miningapproach. European Journal of Operational Research, 218(1), 211–229.
Waxer, C. (2011). Loyalty and the B2B customer. Loyalty360 — The Loyalty Marketer'sAssociation.
Wei, C. -P., & Chiu, I. -T. (2002). Turning telecommunications call details to churn predic-tion: A data mining approach. Expert Systems with Applications, 23(2), 103–112.
Weiss, G. M. (2004). Mining with rarity: A unifying framework. Sigkdd Explorations,6(1), 7–19.
Wierenga, B. (2010). Marketing and artificial intelligence: Great opportunities, reluctantpartners. In J. Casillas, & F. Martínez-López (Eds.), Marketing intelligent systems usingsoft computing, Vol. 258. (pp. 1–8). Berlin Heidelberg: Springer.
Wiersema, F. (2013). The B2B Agenda: The current state of B2B marketing and a lookahead. Industrial Marketing Management, 42(4), 470–488.
Wu, C., & Chen, H. -L. (2000). Counting your customers: Compounding customer's in-store decisions, interpurchase time and repurchasing behavior. European Journal ofOperational Research, 127(1), 109–119.
Wübben, M. (2008). Analytical CRM: Developing and maintaining profitable customerrelationships in non-contractual settings. Springer.
Xie, Y., Li, X., Ngai, E., & Ying, W. (2009). Customer churn prediction using improvedbalanced random forests. Expert Systems with Applications, 36(3), 5445–5449.
Yu, X., Guo, S., Guo, J., & Huang, X. (2011). An extended support vector machine forecast-ing framework for customer churn in e-commerce. Expert Systems with Applications,38(3), 1425–1430.
Ali Tamaddoni Jahromi is a PhD candidate in marketing modeling in the Department ofMarketing atMonashUniversity, Australia. Tamaddoni Jahromi's areas of research interestinclude analytical CRM, churn management, stochastic buyer behavior models, and datamining. His current research focuses onmaximizing accuracy and profitability of customerchurn models.
Stanislav Stakhovych is a Lecturer (Assistant Professor) in the Department of Marketingat Monash University. His research interests are in the area of retailing, customer baseanalysis, spatial modeling, and Bayesian methods. His work has been published in Papersin Regional Science and Multivariate Behavioral Research.
Mike Ewing is Alfred Deakin Professor and Dean of Business and Law at Deakin University.His research interests include marketing communications, marketing strategy and servicesmarketing/CRM. Mike has published more than 115 journal articles, including in the Journalof the Academy of Marketing Science, Information Systems Research, the International Journal ofResearch in Marketing and Social Science & Medicine.
tomer churn, retention and profitability, Industrial Marketing Manage-