Embed Size (px)
Citation preview

Managing and Measuring Marketing Spending for Growth and Returns
The Highlights and Insights Report - August 2021

August 2021
© Christine Moorman2
This 27th Edition of The CMO Survey finds that marketing leaders are taking on more responsibilities as their companies rise to meet the
ongoing challenge of COVID-19 and associated digital and go-to-market opportunities. Digital marketing spending reached 58% of marketing
budgets, reflecting 15.8% growth over the last year. With this increase, marketing leaders have been asked to lead their companies’ digital
marketing transformations in 73% of companies, take on a larger share of responsibility in strategic marketing activities across the company,
and assist in the preparation for board meetings and earning calls at levels higher than expected.
Survey questions probe actions marketing leaders take when making the case for marketing spending and when using marketing to pursue
growth opportunities. The level of pressure from the CEO, CFO, and Board to prove the impact of marketing is reported as well as how
consistently over two dozen metrics are used to demonstrate marketing returns.
Drawing on the power of The CMO Survey’s longitudinal view, this edition also examines marketing spending and performance over time and
specific growth strategies used. Insights related to marketing spending and strategies related to Diversity, Equity, and Inclusion are
documented as well as marketing leaders’ views on how the work-from-home versus work-from-office debate will affect their marketing
employee ranks.
I hope these observations, insights, and benchmarks will be useful to you and your company. Special thanks to all the marketing leaders who
gave their time and good will to make these findings possible.
Christine Moorman
T. Austin Finch, Sr. Professor of Business Administration
Fuqua School of Business, Duke University
Founder and Director, The CMO Survey®

© Christine Moorman
August 2021
3
About The CMO Survey
To collect and disseminate the opinions of top
marketers in order to predict the future of
markets, track marketing excellence, and
improve the value of marketing in firms and
society.
The CMO Survey is an objective source of
marketing information and a non-commercial
service dedicated to the field of marketing.
This 27th Edition of The CMO Survey includes
questions about how companies manage
marketing for growth, returns from marketing
actions, and digital marketing transformation,
including relevant metrics.
Founded in August 2008, The CMO Survey is
administered twice a year. Questions repeat to
observe trends over time and new questions
are added to tap into marketing trends.
Sponsors include Deloitte LLP, Duke
University’s Fuqua School of Business, and
the American Marketing Association.
Sponsors support The CMO Survey with
intellectual and financial resources.
Survey data and participant lists are held in
confidence and are not provided to Survey
sponsors or any other parties.
M I S S I O N 2 7 t h E D I T I O N S P O N S O R S
®

© Christine Moorman
August 2021
4
Survey Methodology and Reports
• 2791 top marketers at for-profit U.S. companies
• 282 responded for a 10.1% response rate
• 94.1% of respondents VP-level or above
• Email contact with four follow-up reminders
• Survey in field from August 4-25, 2021
• The Topline Report offers an aggregate
view of Survey results
• The Highlights and Insights Report
contains key Survey metrics, trends, and
insights
• The Firm and Industry Breakout Report
displays Survey results by sector, size, and
Internet sales
Interpretive guide:
• M = Average
• SD = Standard deviation
• B2B = Business-to-Business firms
• B2C = Business-to-Consumer firms
S A M P L EA D M I N I ST R AT I O NS U R V E Y R E P O R TS
© Christine Moorman
August 2021
5
38.1%
31.7%
20.6%
9.6%
B2B Product B2B Services
B2C Product B2C Services
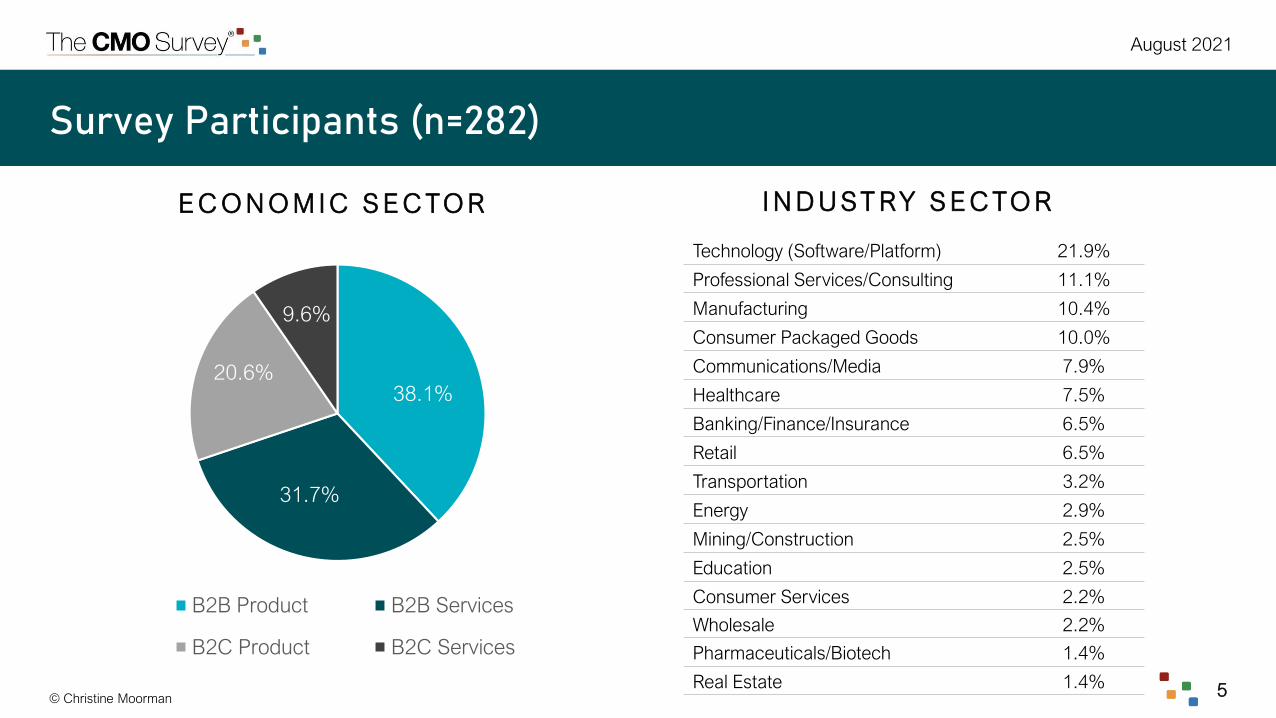
Survey Participants (n=282)
E C O N O M I C S E C TO R I N D U ST RY S E C TO R
Technology (Software/Platform) 21.9%
Professional Services/Consulting 11.1%
Manufacturing 10.4%
Consumer Packaged Goods 10.0%
Communications/Media 7.9%
Healthcare 7.5%
Banking/Finance/Insurance 6.5%
Retail 6.5%
Transportation 3.2%
Energy 2.9%
Mining/Construction 2.5%
Education 2.5%
Consumer Services 2.2%
Wholesale 2.2%
Pharmaceuticals/Biotech 1.4%
Real Estate 1.4%

© Christine Moorman
August 2021
6
39.4%
32.7%
27.9%
0%
1-10%
>10%
14.2%
6.7%
5.7%
9.9%
11.7%
23.0%
10.3%
18.4%
More than 10,000
5,000-9,999
2,500-4,999
1,000-2,499
500-999
100-499
50-100
Fewer than 50
Survey Participants (n=282)
N U M B E R O F E M P LOY E E S S A L E S R E V E N U E
2.2%
5.8%
2.9%
9.0%
7.6%
6.1%
21.7%
14.8%
9.0%
20.9%
More than $50+ billion
$10 - 49 billion
$5.1 - 9.9 billion
$2.6 - 5 billion
$1 - 2.5 billion
$500 - 999 million
$100 - 499 million
$26 - 99 million
$10 - 25 million
Less than $10 million
% I N T E R N E T S A L E S

© Christine Moorman
August 2021
7
27th Edition Topics
Macroeconomic Forecasts-------------------------------------------------------- 8
The Digital Marketing Transformation ------------------------------------------ 11
Managing Marketing Spending and Returns --------------------------------- 21
Marketing Metrics and Performance ------------------------------------------- 36
Managing Growth ------------------------------------------------------------------ 43
Social Media and Mobile Marketing -------------------------------------------- 53
Customer Behavior ---------------------------------------------------------------- 62
Marketing Leadership ------------------------------------------------------------- 64
Marketing and Diversity, Equity & Inclusion ---------------------------------- 68
© Christine Moorman 8
August 2021
Macroeconomic Forecasts
M A C R O E C O N O M I C S T R A N S F O R M A T I O N S P E N D I N G / R E T U R N S M E T R I C S / P E R F O R M A N C E G R O W T H S O C I A L / M O B I L E C U S T O M E R L E A D E R S H I P D E & I
Marketers’ optimism for the U.S. economy rebounded beyond mid-pandemic levels and started to stabilize around pre-pandemic values.
Optimism hit 69.6 (out of 100), up from the 66.3 value reported in February 2021 and up dramatically from 50.9 at the height of COVID in
June 2020.
Optimism regarding the U.S. economy’s next quarter (Q3 2021) compared to last quarter (Q2 2021) also showed a stark increase from June
2020 (7.8%), but a significant decrease from February 2021 (55.3%), with only 32.7% of marketers stating they were “more optimistic.”
Consistent with this finding, only 37.2% of marketers reported being “less optimistic” compared to record-setting high of 85.3% in June 2020
and low of 22.0% in February 2021. This decline in optimism regarding next quarter aligns with the rise of the COVID-19 Delta variant and re-
application of pandemic protocols.
To no surprise, the industry sectors driving this increase in optimism since 2020 were Pharma/Biotech (50.0%), Retail/Wholesale (44.4%), and
Transportation (44.4%), because reopening the economy will continue to improve their businesses. Additionally, the largest companies, both
in terms of sales (47.4%) and employees (41.7%), as well as firms with >10% Internet sales (38.0%) showed the greatest optimism given their
expectation that customers will continue to rely on trusted/familiar brands and digital interfaces across many sectors, post-pandemic.

© Christine Moorman9
August 2021
66.1 66.469.9 69.7
64.4 63.7 63.265.8
68.966.8
57.0
59.862.7
50.9
66.369.6
20
30
40
50
60
70
80
90
100
Feb-
14
Aug-
14
Feb-
15
Aug-
15
Feb-
16
Aug-
16
Feb-
17
Aug-
17
Feb-
18
Aug-
18
Feb-
19
Aug-
19
Feb-
20
Jun-
20
Feb-
21
Aug-
21
Economic Sector
B2B Product: 71.1
B2B Services: 68.5
B2C Product: 66.6
B2C Services: 74.7
How optimistic are you about the overall U.S. economy on a 0-100 scale with 0 being least optimistic and 100 most optimistic?
Insights
Optimism regarding the US economy is
rebounding across all sector breakouts.
Transportation (74.0), Retail Wholesale
(73.3), and Manufacturing (73.2) are
most optimistic, while Mining
Construction (63.6), Communications
Media (64.2), and Education (64.8) are
the least optimistic. Optimism is highest
for the largest companies, both in terms
of sales and number of employees.
Marketers’ optimism for U.S. economy grows, nearing historic high

© Christine Moorman10
August 2021
42.5%
34.7%
51.2%
37.4%
20.1%24.0%
37.4%
7.8%
55.3%
32.7%
26.6%
44.2%
37.1%
32.6% 23.7%
30.3%32.6%
6.9%
22.6%30.1%
30.9%
21.1% 11.8%
30.0%
56.2%
45.7%
30.0%
85.3%
22.0%
37.2%
0%
25%
50%
75%
100%
Feb-
17
Aug-
17
Feb-
18
Aug-
18
Feb-
19
Aug-
19
Feb-
20
Jun-
20
Feb-
21
Aug-
21
More Optimistic No Change Less Optimistic
Are you more or less optimistic about the overall U.S. economy compared to last quarter?
Optimism about the economy compared to last quarter weakens, uncertainty created by COVID resurgence is likely culprit
Less-
Aug-21
More-
Aug-21
B2B Product 27.7% 31.7%
B2B Services 36.5% 36.5%
B2C Product 50.9% 28.1%
B2C Services 48.0% 32.0%
Economic Sector
Insights
The largest companies, both in terms of
sales ($10B+) and number of
employees (10K+), are the most ‘more
optimistic’ (47.4% and 41.7%,
respectively) about the U.S. economy
compared to last quarter, as well as
companies with >10% Internet sales
(38.0%).
© Christine Moorman 11
August 2021
The Digital Marketing Transformation
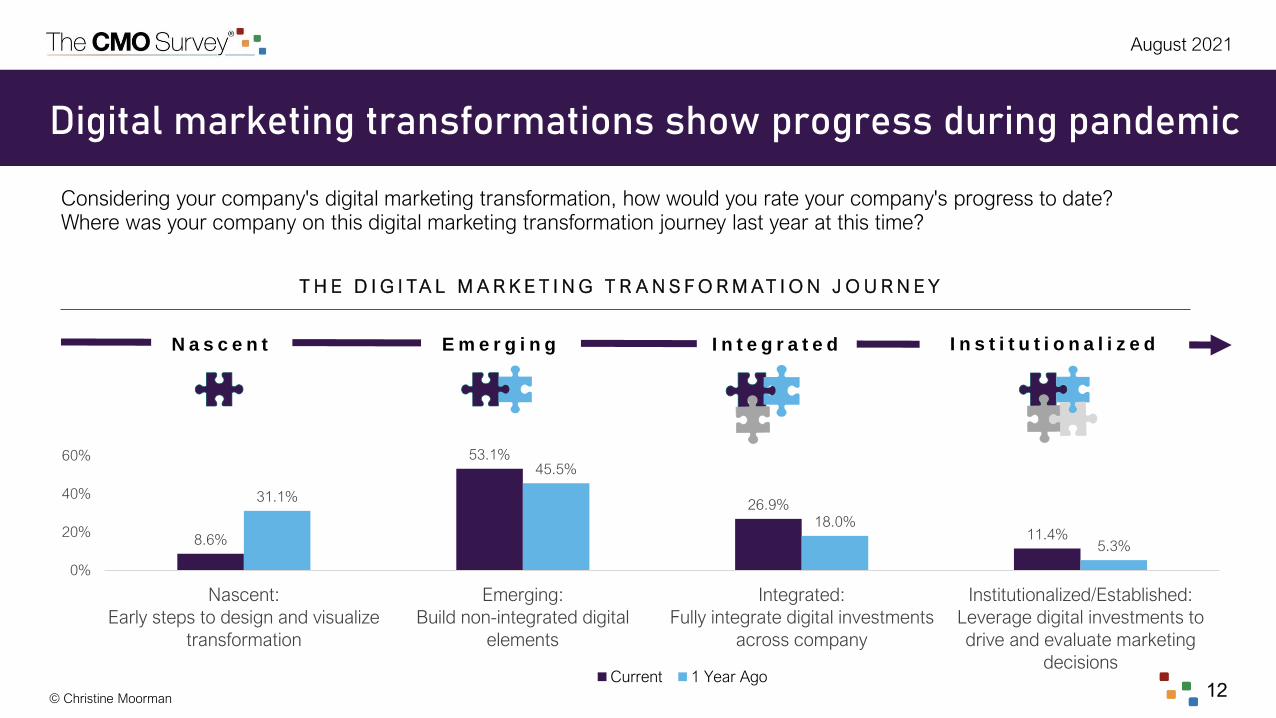
Digital marketing transformations have continued alongside the global pandemic. A majority of companies report moving past a nascent phase
(31.1% in this phase a year ago to only 8.6% today) and into emerging (53.1%), integrated (26.9%), or institutionalized (11.4%) phases.
Progress was less dependent on size and more dependent on percentage of sales on the Internet, with companies with >10% Internet sales
being almost 2.5 times more likely to have an established digital marketing transformation than companies with <10% Internet sales.
Marketers lead the digital transformations at 73.0% of companies. Marketing leadership is dependent on company size with marketers playing
a larger role at smaller companies, aligning with the idea that marketers at smaller companies are expected to wear more hats.
Marketers report investing in digital marketing with the goal of driving business outcomes (e.g., increased revenue, sales, volume, profit)
versus improving customer experiences or targeting/achieving efficiencies. Investment in all digital marketing activities increased since
February 2021, with 77.4% of firms now investing in website optimization and 69.0% in digital media and search. These investments signal a
further push towards Internet sales and digital marketing channels. Investment in online experimentation and A/B testing stayed relatively low
(46.0%). Improving the company’s app was the weakest area of digital investment (18.4%).
Companies currently use artificial intelligence or machine learning only 11.8% of the time. However, this is predicted to triple to 37.7% over the
next three years.
M A C R O E C O N O M I C S T R A N S F O R M A T I O N S P E N D I N G / R E T U R N S M E T R I C S / P E R F O R M A N C E G R O W T H S O C I A L / M O B I L E C U S T O M E R L E A D E R S H I P D E & I
© Christine Moorman
August 2021
12
Digital marketing transformations show progress during pandemic
Considering your company's digital marketing transformation, how would you rate your company's progress to date?Where was your company on this digital marketing transformation journey last year at this time?
T H E D I G I TA L M A R K E T I N G T R A N S F O R M AT I O N J O U R N E Y
N a s c e n t E m e r g i n g I n t e g r a t e d I n s t i t u t i o n a l i z e d
8.6%
53.1%
26.9%
11.4%
31.1%
45.5%
18.0%
5.3%
0%
20%
40%
60%
Nascent:
Early steps to design and visualize
transformation
Emerging:
Build non-integrated digital
elements
Integrated:
Fully integrate digital investments
across company
Institutionalized/Established:
Leverage digital investments to
drive and evaluate marketing
decisionsCurrent 1 Year Ago

© Christine Moorman
August 2021
13
How companies and industries vary on their digital journeys
Considering your company's digital marketing transformation, how would you rate your company's progress to date?
T H E D I G I TA L M A R K E T I N G T R A N S F O R M AT I O N J O U R N E Y
N a s c e n t E m e r g i n g I n t e g r a t e d I n s t i t u t i o n a l i z e d
Earliest in Journey Furthest in Journey
Economic Sector B2B Product B2C Product
Industry Sector Transportation, Education Retail/Wholesale
Internet Sales 0% Internet Sales >10% Internet Sales
Company Revenue $10B+ $100-999M
Company Employees 50-99 2,500-4,999

© Christine Moorman
August 2021
14
Marketing leaders drive digital transformation in the vast majority of companies
What percent of your company's digital marketing transformation is led by a senior marketing leader versus leaders in other functions in your company?
Insights
Firm size influenced senior marketing
leader ownership in the transformation
journey. Firms with $500-999M in
revenue showed a high of 86.3%
leadership, while the largest firms at
$10B+ showed a low of 54.6%
leadership.
Dig i ta l market ing
t ransformat ions led by
sen ior market ing leaders
Economic Sector
B2B Product: 72.0%
B2B Services: 73.9%
B2C Product: 70.9%
B2C Services: 78.0%73%

© Christine Moorman
August 2021
15
26.9%
19.8%39.2%
14.1%
Driving business outcomes and marketing communications are top priorities for digital marketing efforts
Below are some examples of how digital marketing can help a company. Which of these matters most to your company? Please indicate the relative importance of each by allocating 100 points across the benefits.
Improving internal efficiencies by utilizing new technology solution
Directly driving business outcomes (e.g., increased revenue, sales, volume, profit)
Shaping marketing communication initiatives (e.g.,
targeting communications)
Helping deliver interactive customer experiences (e.g.,
omni-channel, consistent and engaging experience,
seamless app experience & performance)

© Christine Moorman
August 2021
16
2.9%
1.7%
5.0%
9.6%
15.4% 15.0%
23.3%
16.7%
7.1%
3.3%
0%
5%
10%
15%
20%
25%
Digital marketing expertise rated above industry average in majority of companies
Insights
.
Thinking about your company’s digital marketing knowledge and skills, rate your company’s current expertise on the following scale. (1=significantly below industry average, 10=significantly above industry average)
M e a n = 6 . 2
1 2 3 4 5 6 7 8 9 10
Companies with >10% Internet sales
(7.4) led the way with the highest mean
for skill levels while companies with 0%
Internet sales (5.9) were drastically
lower. Industry leaders included
Communications/Media (7.2),
Transportation (6.8), and
Tech/Software Platform (6.6). Real
Estate (3.5), Pharma/Biotech (3.7), and
Energy (5.4) report the lowest means
for expertise.
Economic Sector
B2B Product: 5.8
B2B Services: 6.4
B2C Product: 6.5
B2C Services: 6.8

© Christine Moorman
August 2021
17
Digital marketing investment remains top priority; experimentation, privacy, automation, and apps are weaker focusWhat investments did your company make to improve the performance of your digital marketing activities over the last year?
A d d i t i o n a l i n d u s t r y
b r e a k o u t s o n n e x t s l i d e
Optimization of company website
77.4%
Digital media and search
69.0%
Data analytics
65.7%
Direct digital marketing
63.6%
Marketing technology systems or platforms
61.1%
Online experimentation and/or A/B testing
46.0%
Managing privacy issues
29.3%
Machine learning and automation
25.9%
Improving our app
18.4%

© Christine Moorman
August 2021
18
Top investors in digital marketing activities in the last year
What investments did your company make to improve the performance of your digital marketing activities over the last year?
Digital Investments Top Investor by Economic Sector Top Investor by Industry Sector
Optimization of company website B2C Services (82.6%) Pharma/Biotech (100.0%)
Digital media and search B2C Services (87.0%) Consumer Services (100.0%)
Data analytics B2C Product (84.6%) Consumer Services (100.0%)
Direct digital marketing (e.g., email) B2C Services (78.3%) Retail/Wholesale (86.7%)
Marketing technology systems or platforms B2B Product (67.0%) Consumer Services (100.0%)
Online experimentation and/or A/B testing B2C Product (67.3%) Consumer Packaged Goods (80.0%)
Managing privacy issues B2C Services (39.1%) Pharma/Biotech (66.7%)
Machine learning and automation B2C Product (32.7%) Tech/Software Platform (47.1%)
Improving our app B2C Services (34.8%) Consumer Services (75.0%)

© Christine Moorman
August 2021
19
Artificial intelligence and machine learning use still fledgling, but major investment into optimization and automation planned
11.8%
37.7%
0%
10%
20%
30%
40%
Currently Next three years
To what extent is your company using artificial intelligence or machine learning in optimizing and automating marketing efforts?(0% of the time-100% of the time)
Projected 220%
growth
© Christine Moorman
August 2021
20
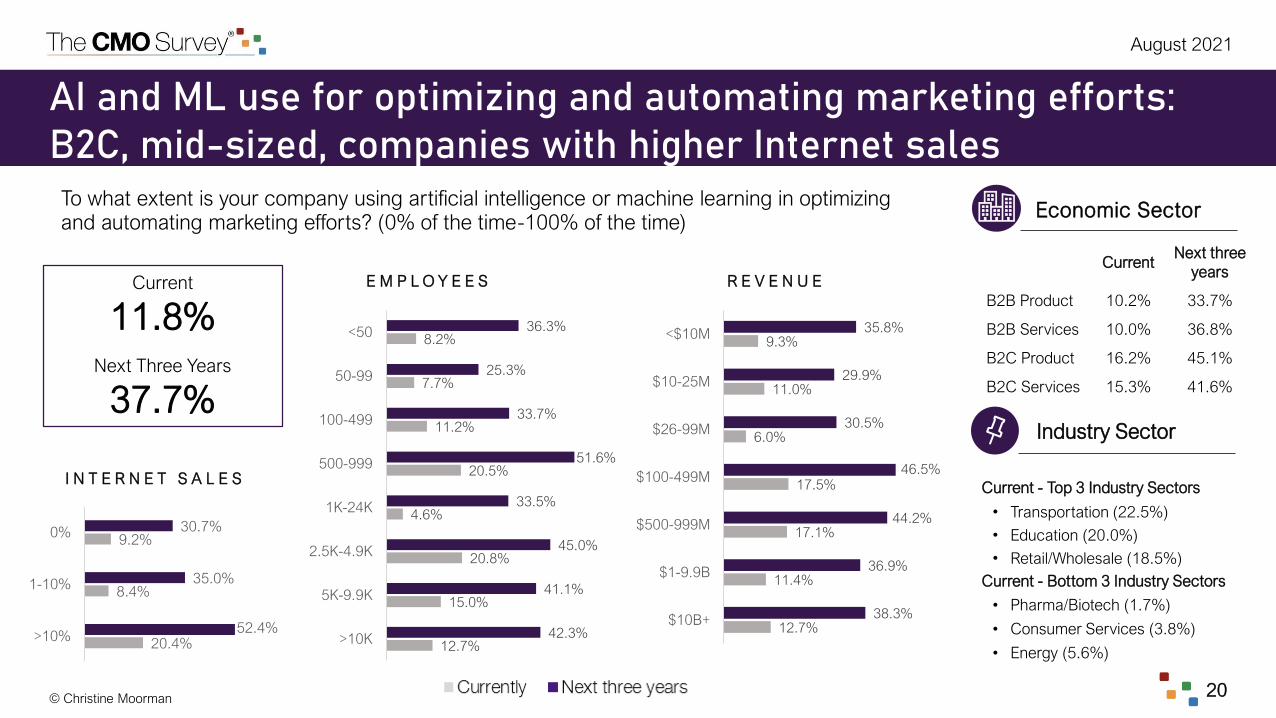
AI and ML use for optimizing and automating marketing efforts: B2C, mid-sized, companies with higher Internet sales
Industry Sector
I N T E R N E T S A L E S
E M P L O Y E E S R E V E N U ECurrent
11.8%Next Three Years
37.7%
To what extent is your company using artificial intelligence or machine learning in optimizing and automating marketing efforts? (0% of the time-100% of the time)
CurrentNext three
years
B2B Product 10.2% 33.7%
B2B Services 10.0% 36.8%
B2C Product 16.2% 45.1%
B2C Services 15.3% 41.6%
Economic Sector
Current - Top 3 Industry Sectors
• Transportation (22.5%)
• Education (20.0%)
• Retail/Wholesale (18.5%)
Current - Bottom 3 Industry Sectors
• Pharma/Biotech (1.7%)
• Consumer Services (3.8%)
• Energy (5.6%)12.7%
15.0%
20.8%
4.6%
20.5%
11.2%
7.7%
8.2%
42.3%
41.1%
45.0%
33.5%
51.6%
33.7%
25.3%
36.3%
>10K
5K-9.9K
2.5K-4.9K
1K-24K
500-999
100-499
50-99
<50
20.4%
8.4%
9.2%
52.4%
35.0%
30.7%
>10%
1-10%
0%
12.7%
11.4%
17.1%
17.5%
6.0%
11.0%
9.3%
38.3%
36.9%
44.2%
46.5%
30.5%
29.9%
35.8%
$10B+
$1-9.9B
$500-999M
$100-499M
$26-99M
$10-25M
<$10M

© Christine Moorman 21
August 2021
Managing Marketing Spending & Returns
Overall marketing spending increased by 5.2% over the last year and is expected to grow next year by 13.4%. Digital marketing spending
increased by 15.8% over the last year and is expected to grow, but at a slightly weaker rate at 14.7%. Consistent with these growth rates, 58% of
marketing budgets are now spent on digital marketing activities. Other areas of marketing budgets are predicted to grow at a slower pace; new
product innovation (10.3%), brand building (9.1%), and customer relationship management (7.2%). Spend on customer experience is showing a
rebound to 14.4% compared to only 11.9% in February 2021. Traditional advertising spending increased for the first time in a decade with
expected growth at 1.4% for the next year. Marketing expenses as a percent of company revenue decline for the first time since 2017, but climbed
as a percent of company budget. Given marketing budgets grew by 5.2% in the last year, evidence suggests that revenue climbed more in the
same time frame, driving down marketing expenses as a percent of company revenues.
Pressure to prove the impact of marketing efforts is increasing, with 58.7% of marketing leaders reporting increased pressure from CEOs and
45.1% from CFOs. The majority of marketers report they are able to show the short-term impact of marketing spend using quantitative tools, while
the majority of marketers report that showing the long-term impact remains more of a qualitative assessment.
Marketing budget setting processes vary by company; however, setting budgets based on the previous year’s expense is the most common
approach (41.1% of companies) while building a budget from scratch based on new needs and objectives is the least common (27.9% of
companies). Marketers report taking the following actions when making the case for marketing spending— they align it with business
priorities/strategies, set return expectations, and explain their hypotheses about impact. At the same time, they work to reduce non-marketing
leaders’ focus on short-term returns and the view that marketing is a cost, not an investment.
M A C R O E C O N O M I C S T R A N S F O R M A T I O N S P E N D I N G / R E T U R N S M E T R I C S / P E R F O R M A N C E G R O W T H S O C I A L / M O B I L E C U S T O M E R L E A D E R S H I P D E & I

August 2021
© Christine Moorman 22
Setting marketing budgets based on previous year’s expenses is most common approach
Check the category that best describes how your company's marketing budget is set:
16.7%
30.0%
18.6%
19.2%
44.4%
25.0%
32.2%
21.9%
11.1%
15.0%
10.2%
6.8%
27.8%
30.0%
39.0%
52.1%
0% 10% 20% 30% 40% 50% 60% 70% 80% 90% 100%
B2C Services
B2C Product
B2B Services
B2B Product
E C O N O M I C S E C T O R
21.1% Budgets are set as a
percentage of
projected revenue
27.9% Budgets are built from
scratch every year
based on new needs
and objectives
10.0% Budget is revisited and, if
needed, reset every month
or quarter depending on
what is needed to meet our
objectives
41.1% Budgets are set on a yearly
basis based on previous
year’s expenses and
adjusted during the year if
needed

August 2021
© Christine Moorman 23
Marketing leaders make the case for marketing spending by proving alignment, setting return expectations, and explaining impact
When making a case for marketing spending, how often do the following behaviors occur among senior marketing leaders in your organization? (1=All the time, 5=None of the time)
Making the case for
marketing spending
Marketing builds a business case based on
how marketing spending is aligned with
business priorities and strategies (1.9)
Marketing sets reasonable expectations
about how marketing spending will influence
returns (2.1)
Marketing explains its hypotheses about the
impact of marketing spending (2.2)
M o s t c o m m o n b e h a v i o r s L e s s c o m m o n b e h a v i o r s
Marketing builds a business case for
marketing spending based on financial
returns (2.4)
Marketing is able to show the impact of
marketing spending on intermediate KPIs
(e.g., customer or brand outcomes) on the
way to financial returns (2.5)
Marketing runs experiments to make the
case for the impact of marketing spending
(2.8)

August 2021
© Christine Moorman 24
Buffeting focus on short-term returns, working with CFO and C-suite are critical behaviors when managing marketing budgetsHow likely are the following activities to occur in managing marketing budgets in your organization?
Managing
marketing
budgets
W h a t m a r k e t e r s s h o u l d c h a l l e n g e W h a t m a r k e t e r s s h o u l d f a c i l i t a t e
Non-marketing leaders focus on the short-
run effects of marketing spending
Non-marketing leaders are not patient for
the long-run effects of marketing spending
Non-marketing leaders perceive marketing
as a cost, not as an investment
Marketing meets one-on-one with other
C-suite members to explain marketing's
impact on the bottom line
The CFO works as a business partner with
marketing leaders to build a business case
for marketing spending
August 2021
© Christine Moorman 25
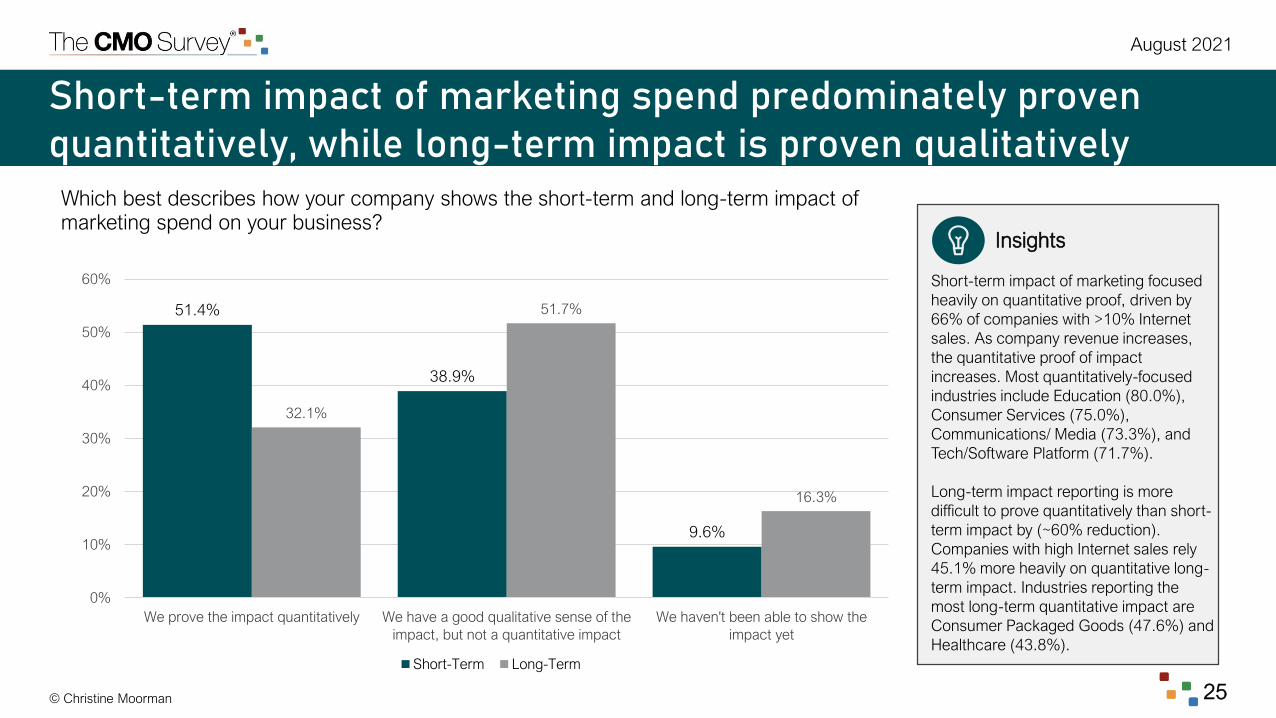
Short-term impact of marketing spend predominately proven quantitatively, while long-term impact is proven qualitatively
Which best describes how your company shows the short-term and long-term impact of marketing spend on your business?
51.4%
38.9%
9.6%
32.1%
51.7%
16.3%
0%
10%
20%
30%
40%
50%
60%
We prove the impact quantitatively We have a good qualitative sense of the
impact, but not a quantitative impact
We haven't been able to show the
impact yet
Short-Term Long-Term
Insights
Short-term impact of marketing focused
heavily on quantitative proof, driven by
66% of companies with >10% Internet
sales. As company revenue increases,
the quantitative proof of impact
increases. Most quantitatively-focused
industries include Education (80.0%),
Consumer Services (75.0%),
Communications/ Media (73.3%), and
Tech/Software Platform (71.7%).
Long-term impact reporting is more
difficult to prove quantitatively than short-
term impact by (~60% reduction).
Companies with high Internet sales rely
45.1% more heavily on quantitative long-
term impact. Industries reporting the
most long-term quantitative impact are
Consumer Packaged Goods (47.6%) and
Healthcare (43.8%).

August 2021
© Christine Moorman 26
% Yes CEO CFO Board
B2B Product 53.1% 42.5% 32.1%
B2B Services 68.3% 47.6% 46.9%
B2C Product 57.1% 52.4% 45.0%
B2C Services 55.0% 31.6% 26.3%
Marketers feel increased pressure to prove the value of marketing, especially to CEOs
Rate whether marketing feels increasing pressure to prove the value of marketing:
58.7%
CEO
45.1%
CFO
38.8%
Board

August 2021
© Christine Moorman 27
Marketing spending growth returning to historical levels; projected growth far exceeds trends in last decadeBy what percent has your overall marketing spending changed in the prior 12 months? Relative to the prior 12 months, note your company’s percentage change in marketing spending during the next 12 months?
6.1%
4.3%5.1%
0.0%
6.0%6.7%
7.5%
6.3%
0.9%
-3.9%
5.2%
13.4%
-5%
0%
5%
10%
15%
Aug-
12
Aug-
13
Aug-
14
Aug-
15
Aug-
16
Aug-
17
Aug-
18
Aug-
19
Jun-
20
Feb-
21
Aug-
21
Next 12
Months
August 2021
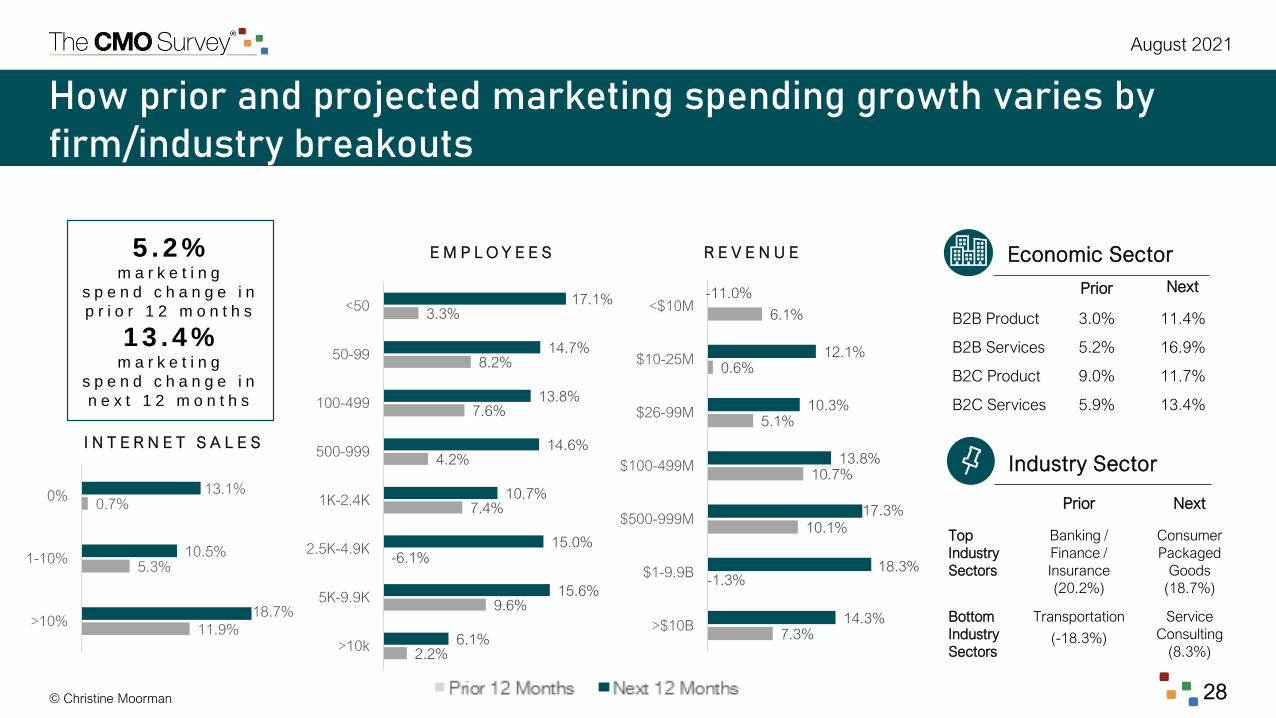
© Christine Moorman 28
2.2%
9.6%
7.4%
4.2%
7.6%
8.2%
3.3%
6.1%
15.6%
15.0%
10.7%
14.6%
13.8%
14.7%
17.1%
>10k
5K-9.9K
2.5K-4.9K
1K-2.4K
500-999
100-499
50-99
<50
7.3%
10.1%
10.7%
5.1%
0.6%
6.1%
14.3%
18.3%
17.3%
13.8%
10.3%
12.1%
>$10B
$1-9.9B
$500-999M
$100-499M
$26-99M
$10-25M
<$10M
How prior and projected marketing spending growth varies by firm/industry breakouts
I N T E R N E T S A L E S
5 . 2 %m a r k e t i n g
s p e n d c h a n g e i n
p r i o r 1 2 m o n t h s
1 3 . 4 %m a r k e t i n g
s p e n d c h a n g e i n
n e x t 1 2 m o n t h s
E M P L O Y E E S R E V E N U E Economic Sector
Industry Sector
-6.1%
-11.0% Prior Next
B2B Product 3.0% 11.4%
B2B Services 5.2% 16.9%
B2C Product 9.0% 11.7%
B2C Services 5.9% 13.4%
Prior Next
Top
Industry
Sectors
Banking /
Finance /
Insurance
(20.2%)
Consumer
Packaged
Goods
(18.7%)
Bottom
Industry
Sectors
Transportation
(-18.3%)
Service
Consulting
(8.3%)
-1.3%
11.9%
5.3%
0.7%
18.7%
10.5%
13.1%
>10%
1-10%
0%

August 2021
© Christine Moorman 29
6.1%
15.4%
11.1%
15.2%
17.4%
13.3%
14.6%
15.6%
17.4%
14.7%
22.5%
18.5%
6.1%
5.6%
>$10B
$1-9.9B
$500-999M
$100-499M
$26-99M
$10-25M
<$10M
11.1%
15.6%
10.6%
13.3%
13.2%
15.9%
15.6%
18.0%
14.1%
23.8%
14.2%
16.7%
18.9%
19.3%
18.7%
4.3%
>10k
5K-9.9K
2.5K-4.9K
1K-2.4K
500-999
100-499
50-99
<50
20.7%
12.6%
12.6%
18.4%
14.2%
14.0%
>10%
1-10%
0%
How prior and projected digital marketing spending growth varies by firm/industry breakouts
I N T E R N E T S A L E S
By what percent has your digital marketing spending changed in the prior 12 months? Relative to the prior 12 months, note your company’s percentage change in digital marketing spending during the next 12 months?
P r i o r 1 2 m o n t h s
15.8%N e x t 1 2 m o n t h s
14.7%
E M P L O Y E E S R E V E N U E
Biggest Spenders (next year)
• Consumer Packaged Goods (28.0%)
• Consumer Services (23.9%)
• Banking/Finance/Insurance (22.6%)
Smallest Spenders (next year)
• Retail/Wholesale (5.6%)
• Transportation (7.9%)
• Education (8.6%)
Economic Sector
Industry Sector
Prior Year Next Year
B2B Product 17.9% 12.6%
B2B Service 14.2% 16.0%
B2C Product 13.7% 14.9%
B2C Service 17.6% 18.8%

August 2021
© Christine Moorman 30
Marketing budgets as a percent of overall budget lift while percent of revenues drop, showing higher company revenue growthMarketing expenses account for what percent of your company’s overall budget?
Marketing expenses account for what percent of your company’s revenues?
Insights
Marketing expenses as a percent of
revenues decline since 2017, while percent
of company budget climbed. Given overall
marketing budgets grew by 5.2% in the last
year, evidence suggests that firm revenue
climbed more in the same timeframe,
driving down marketing expenses as a
percent of company revenues. Marketing
expenses are a larger share of budget and
revenues as Internet sales increase.
% Budget % Revenue
B2B Product 9.6% 6.7%
B2B Services 9.0% 7.5%
B2C Product 19.5% 13.7%
B2C Services 17.7% 8.4%
Economic Sector
10.0%
11.4%
9.4%
10.9%11.4% 11.3% 11.4%
10.8%
12.0%12.6%
11.7%12.1%
10.0%11.0%
7.8%8.3%
6.6%
7.5%6.9%
7.3%
9.8%
11.4%
13.2%
8.6%
0%
2%
4%
6%
8%
10%
12%
14%
Aug-
11
Aug-
12
Aug-
13
Aug-
14
Aug-
15
Aug-
16
Aug-
17
Aug-
18
Aug-
19
Jun-
20
Feb-
21
Aug-
21
Overall Budget Revenues

August 2021
© Christine Moorman 31
F i r m a n d i n d u s t r y
b r e a k o u t s o n n e x t s l i d e
Several marketing spending categories expected to rise significantly in the next year
Relative to the prior 12 months, note your company’s percentage change in spending during the next 12 months in each area.
7.9%8.0%
7.4%6.9%
9.5%
8.9%
5.7%7.2%
4.3%
5.4%
6.3%6.8%
7.3% 7.9%
2.1%
9.5%
9.1%
7.8% 8.6%
6.3%6.6%
10.3%
4.5%
4.0%
6.1% 6.1%5.6%
0%
2%
4%
6%
8%
10%
12%
Aug-
14
Aug-
15
Aug-
16
Aug-
17
Aug-
18
Aug-
19
Jun-
20
Feb-
21
Aug-
21
Customer Relationship Management Brand Building New Product Introductions New Service Introductions
* If point is missing, question was not asked in that survey. Trend lines inferred between available data points

August 2021
© Christine Moorman 32
How companies and sectors vary on projected marketing spending
Relative to the prior 12 months, note your company’s percentage change in spending during the next 12 months in each area.
Largest spending increases in Consumer
Packaged Goods (18.6%), Transportation
(15.7%), and Energy (15.5%).
Customer relationship
management(+7.2% overall average)
New service
introductions(+5.6% overall average)
Learn about your
Industry here
Brand
building(+9.1% overall average)
New product
introductions(+10.3% overall average)
Largest spending increases in Healthcare
(15.0%), Retail/Wholesale (14.0%), and
Education (13.4%).
Largest spending increases in Energy (11.3%),
Communications/Media (10.4%), and
Consumer Services (9.5%).
Largest spending increases in
Mining/Construction (17.5%), Healthcare
(16.8%), and Consumer Services (13.7%).

August 2021
© Christine Moorman 33
Traditional advertising spend projections show positive growth for first time in a decadeRelative to the prior 12 months, note your company’s percentage change in traditional advertising spending during the next 12 months.
1.3%
-0.8%
-1.9%-2.7%
-2.1%
-0.1%
-3.6%
-1.1%-2.1%
-3.2%
-1.3%
0.6%
-2.0%
-1.7%-1.2%
-1.8% -2.0%
-0.40%
-5.3%
-0.2%
1.4%
-10%
-8%
-6%
-4%
-2%
0%
2%
4%
6%
8%
10%
Aug-
11
Feb-
12
Aug-
12
Feb-
13
Aug-
13
Feb-
14
Aug-
14
Feb-
15
Aug-
15
Feb-
16
Aug-
16
Feb-
17
Aug-
17
Feb-
18
Aug-
18
Feb-
19
Aug-
19
Feb-
20
Jun-
20
Feb-
21
Aug-
21
Traditional advertising spending
Economic Sector
B2B Product: 1.3%
B2B Services: 1.8%
B2C Product: -.7%
B2C Services: 4.49%
August 2021
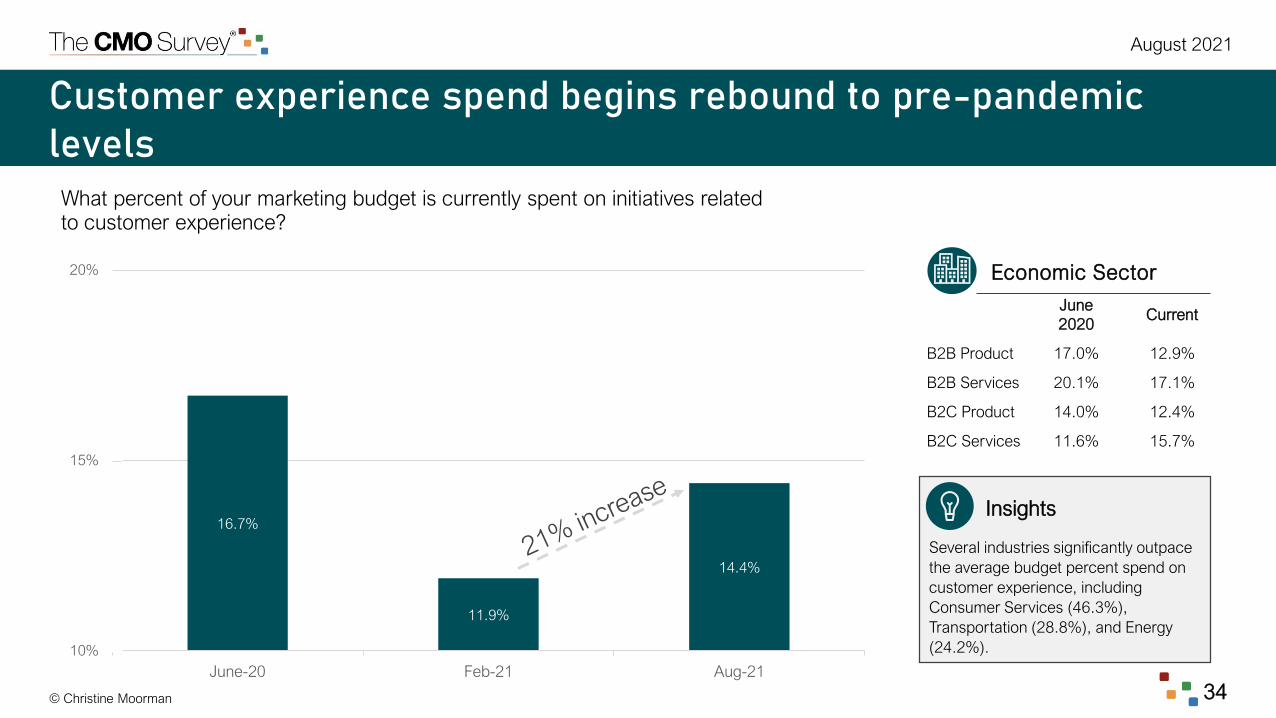
© Christine Moorman 34
Customer experience spend begins rebound to pre-pandemic levels
What percent of your marketing budget is currently spent on initiatives related to customer experience?
Insights
Several industries significantly outpace
the average budget percent spend on
customer experience, including
Consumer Services (46.3%),
Transportation (28.8%), and Energy
(24.2%).
16.7%
11.9%
14.4%
10%
15%
20%
June-20 Feb-21 Aug-21
June
2020Current
B2B Product 17.0% 12.9%
B2B Services 20.1% 17.1%
B2C Product 14.0% 12.4%
B2C Services 11.6% 15.7%
Economic Sector

August 2021
© Christine Moorman 35
Overhead costs associated with marketing (69.0%)
Mobile marketing (59.8%)
Marketing training (52.2%)
Customer experience (47.8%)
Sales support tools (35.9%)
Sales employees (9.2%)
What’s in your marketing budget?
Marketing expenses in your company include (percent selecting category as part of marketing budget):
Direct expenses of marketing activities (95.7%)
Social media marketing (92.9%)
Brand-related expenses (81.0%)
Marketing employees (80.4%)
Marketing analytics (73.4%)
Marketing research (71.7%)

© Christine Moorman 36
August 2021
Marketing Metrics and Performance
While several marketing performance metrics have proven to be important when evaluating the impact of marketing actions, marketing
leaders report that sales impact and customer engagement make up almost 50% of the evaluation. Consistent with this finding, sales
revenue and digital performance are the marketing outcomes most consistently tracked. Metrics such as brand equity value and customer
lifetime value, on the other hand, are rarely tracked.
In June 2020, marketers reported a 17.8% loss in sales revenue compared to the previous 12 months, likely due the onset and progression
of the COVID-19 pandemic. Approximately one year into the pandemic, in February 2021, marketers reported a revenue gain of 0.3% over
the previous year—essentially flat for the year. When asked the same question in August 2021, however, companies reported massive
revenue gains (11.1% on average), showing significant recovery. A similar trend emerged for profit, with marketers reporting a 14.7% loss
as of June 2020, a 2.6% gain in February 2021, and a 10.4% gain as of August 2021. Although most companies have not been able to fully
recover from the negative financial effects of the COVID-19 pandemic, these growth rates suggest they are certainly moving in the right
direction.
M A C R O E C O N O M I C S T R A N S F O R M A T I O N S P E N D I N G / R E T U R N S M E T R I C S / P E R F O R M A N C E G R O W T H S O C I A L / M O B I L E C U S T O M E R L E A D E R S H I P D E & I

August 2021
© Christine Moorman 37
Distribute 100 points to reflect the degree to which these metrics are used in your company to evaluate the impact of
marketing actions.
9.6%
12.4%
6.3%
24.8%22.9%
10.0%
13.9%
Engagement related metrics (e.g., clicks, likes, email signup,
customer ratings & reviews)
Brand equity metrics
Customer retention or lifetime value metrics
Satisfaction and referral metrics (e.g., NPS)
Impact on sales or sales lift
ROI
Other sales metrics (e.g., penetration, frequency, lead conversion, lead churn, market share)
Sales and customer engagement drive almost 50% of metric importance to marketers

August 2021
© Christine Moorman 38
How consistently do you measure the following components of marketing?
M O S T U P D A T E D M E T R I C S L E A S T U P D A T E D M E T R I C S
35.3%
30.7%
29.5%
28.4%
22.2%
29.8%
17.5%
30.0%
29.4%
28.2%
20.9%
9.4%
21.7%
15.6%
24.1%
10.7%
15.1%
12.4%
16.1%
17.1%
27.4%
10.4%
8.3%
Brand equity value
Distribution, product
availability
Brand personality,
associations, affinity
Speed to market,
agility
Customer lifetime
value (CLV), customer
profitability
78.7%
54.8%
46.8%
43.5%
42.1%
14.0%
35.2%
21.8%
36.1%
23.4%
13.4%
14.5%
12.5%
12.1%
Sales, revenues
Digital/web/mobile
performance
Lead generation
Content engagement
Lead conversion
Sales and revenue measured regularly, while brand and customer metrics on an ad hoc basis

August 2021
© Christine Moorman 39
How consistently do you measure the following components of marketing?
Marketing Expenses Almost neverAd hoc / when
needed
Annually or semi-
annually
Quarterly or
monthly
Always /
consistently
Sales, revenues 1.4% 2.7% 3.2% 14.0% 78.7%
Digital/web/mobile performance 3.2% 3.2% 3.7% 35.2% 54.8%
Lead generation 12.5% 13.4% 5.6% 21.8% 46.8%
Content engagement 1.9% 10.2% 8.3% 36.1% 43.5%
Lead conversion 12.1% 14.5% 7.9% 23.4% 42.1%
Customer experience/engagement 6.4% 18.8% 20.6% 23.4% 30.7%
Campaign costs, efficiency, e.g., production, content reuse 8.2% 15.1% 10.5% 37.0% 29.2%
Campaign effectiveness (e.g., GRPs, reach, frequency) 9.7% 15.2% 12.9% 34.6% 27.6%
Distribution, product availability 30.7% 17.5% 9.4% 15.1% 27.4%
Campaign ROI 7.0% 21.4% 14.0% 31.2% 26.5%
Net Promoter Score (NPS), willingness to recommend 16.5% 18.8% 21.1% 23.4% 20.2%
Customer churn, retention rate, loyalty 8.4% 22.3% 22.3% 27.0% 20.0%
Sales expense-to-revenue ratio (E/R) 16.3% 20.5% 15.8% 30.7% 16.7%
How often are marketing metrics used? (1/2)

August 2021
© Christine Moorman 40
Marketing Expenses Almost neverAd hoc / when
needed
Annually or semi-
annually
Quarterly or
monthly
Always /
consistently
Overall marketing budgets 4.6% 6.0% 37.8% 35.9% 15.7%
Cost of customer acquisition 15.6% 28.0% 17.4% 23.4% 15.6%
Market share, account share 14.7% 23.5% 26.3% 22.6% 12.9%
Brand awareness 19.7% 26.1% 24.3% 17.9% 11.9%
Agency/partner/vendor costs 14.7% 20.3% 28.6% 24.9% 11.5%
Speed to market, agility 28.4% 29.4% 15.6% 16.1% 10.4%
Customer lifetime value (CLV), customer profitability 22.2% 28.2% 24.1% 17.1% 8.3%
Marketing infrastructure investments (data, tools, technology) 8.4% 19.2% 37.4% 27.1% 7.9%
Customer/market insight usage 16.1% 33.2% 24.0% 19.8% 6.9%
Brand personality, associations, affinity 29.5% 30.0% 21.7% 12.4% 6.5%
Customer/market insight quality-breadth and depth 15.6% 34.0% 24.5% 20.8% 5.2%
Brand differentiation, customer willingness to pay premium 21.9% 33.3% 25.6% 14.6% 4.6%
Brand equity value 35.3% 29.8% 20.9% 10.7% 3.3%
How often are marketing metrics used? (2/2)
How consistently do you measure the following components of marketing?

August 2021
© Christine Moorman 41
Economic Sector: Aug-21
Revenues and profits soar relative to 2020
Sales
RevenueProfit
Strongest
Performer
Retail /
Wholesale
(21.2%)
Retail /
Wholesale
(30.0%)
Weakest
Performer
Transporta-
tion
(-19.1%)
Transporta-
tion
(-11.9%)
-17.8%
0.2%
11.1%
-20%
-15%
-10%
-5%
0%
5%
10%
15%
Sales revenues
-14.7%
2.5%
10.4%
-20%
-15%
-10%
-5%
0%
5%
10%
15%
Profits
S A L E S R E V E N U E P R O F I T S
Compared to 2020, rate your company's performance during the prior 12 months:
Industry Sector: Aug-21
Sales
RevenueProfit
B2B Product 10.3% 8.5%
B2B Services 13.0% 12.2%
B2C Product 13.4% 13.2%
B2C Services 3.3% 11.3%

August 2021
© Christine Moorman 42
Customer retention up over 55%, while acquisitions make small gains
C U S T O M E R A C Q U I S I T I O N C U S T O M E R R E T E N T I O N *
Compared to 2020, rate your company's performance during the prior 12 months:
-9.2%
6.3% 6.7%
-10%
-5%
0%
5%
10%
Customer acquisition
6.1%
9.5%
0%
5%
10%Customer
Acquisition
Customer
Retention
B2B Product 7.2% 7.3%
B2B Services 6.7% 9.4%
B2C Product 6.2% 17.1%
B2C Services 6.3% 2.8%
* Question was not asked in June-20
Economic Sector: Aug-21
Customer
Acquisition
Customer
Retention
Strongest
Performer
Mining
(16.5%)
Mining
(30%)
Weakest
Performer
Customer
Services
(-14.3%)
Transporta-
tion (-19.%)
Industry Sector: Aug-21
© Christine Moorman 43
August 2021
Managing Growth
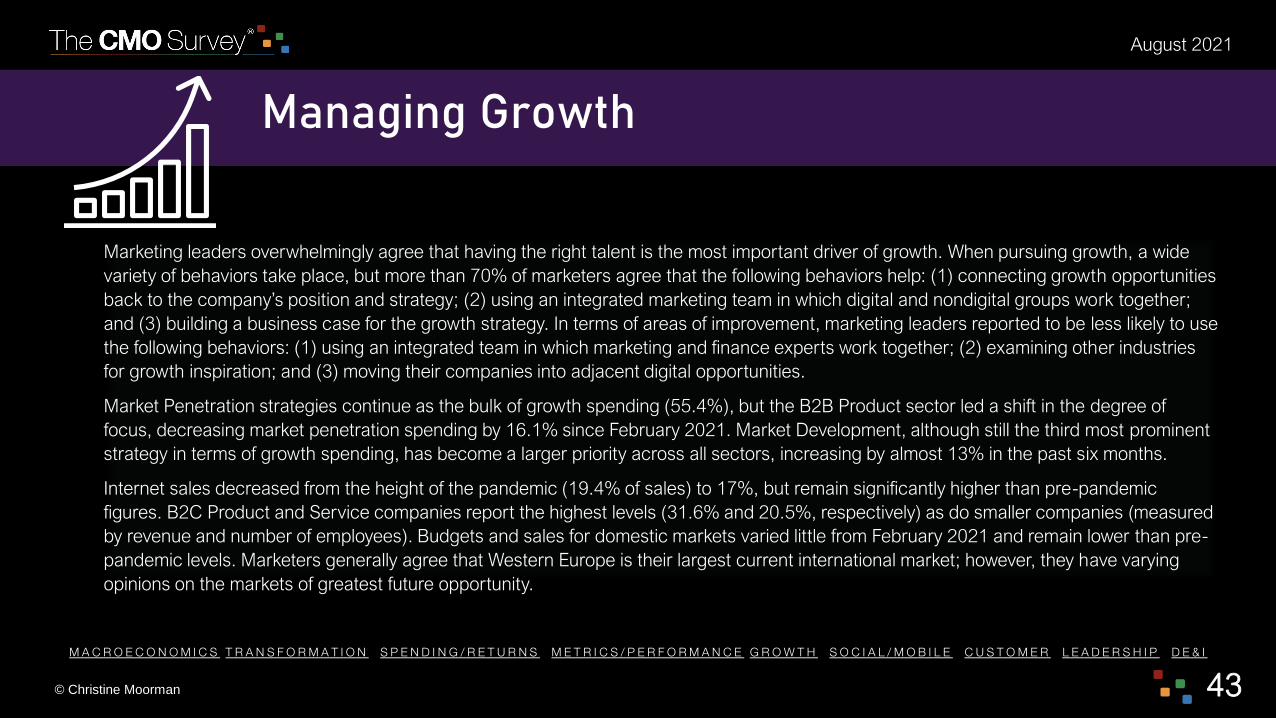
Marketing leaders overwhelmingly agree that having the right talent is the most important driver of growth. When pursuing growth, a wide
variety of behaviors take place, but more than 70% of marketers agree that the following behaviors help: (1) connecting growth opportunities
back to the company’s position and strategy; (2) using an integrated marketing team in which digital and nondigital groups work together;
and (3) building a business case for the growth strategy. In terms of areas of improvement, marketing leaders reported to be less likely to use
the following behaviors: (1) using an integrated team in which marketing and finance experts work together; (2) examining other industries
for growth inspiration; and (3) moving their companies into adjacent digital opportunities.
Market Penetration strategies continue as the bulk of growth spending (55.4%), but the B2B Product sector led a shift in the degree of
focus, decreasing market penetration spending by 16.1% since February 2021. Market Development, although still the third most prominent
strategy in terms of growth spending, has become a larger priority across all sectors, increasing by almost 13% in the past six months.
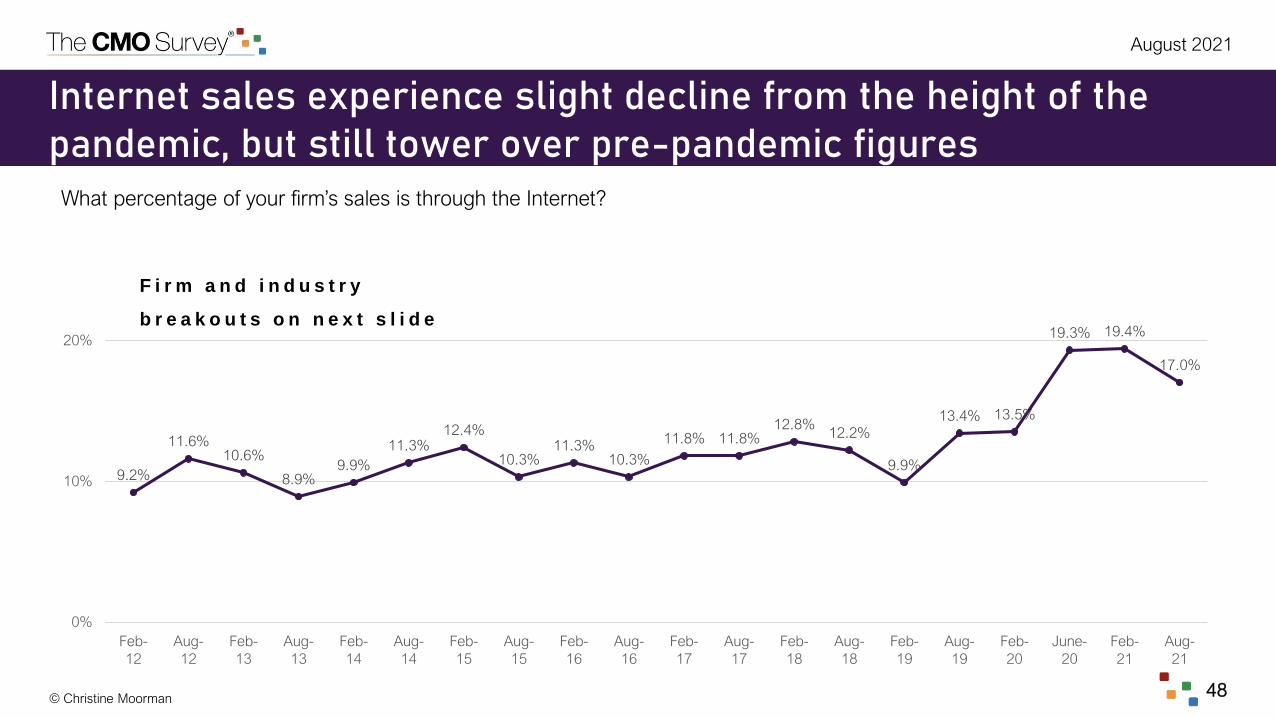
Internet sales decreased from the height of the pandemic (19.4% of sales) to 17%, but remain significantly higher than pre-pandemic
figures. B2C Product and Service companies report the highest levels (31.6% and 20.5%, respectively) as do smaller companies (measured
by revenue and number of employees). Budgets and sales for domestic markets varied little from February 2021 and remain lower than pre-
pandemic levels. Marketers generally agree that Western Europe is their largest current international market; however, they have varying
opinions on the markets of greatest future opportunity.
M A C R O E C O N O M I C S T R A N S F O R M A T I O N S P E N D I N G / R E T U R N S M E T R I C S / P E R F O R M A N C E G R O W T H S O C I A L / M O B I L E C U S T O M E R L E A D E R S H I P D E & I

© Christine Moorman
August 2021
44
Marketers agree that having the right talent is the key driver for organic revenue growth
Right Talent %
B2B Product 44.7%
B2B Services 46.7%
B2C Product 30.0%
B2C Services 36.8%
41.8%
17.3% 17.9%
11.2% 11.7%
30.8% 30.8%
25.6%
8.3%
4.5%
33.8%
22.8%21.4%
13.1%
9.0%
0%
10%
20%
30%
40%
50%
Having the
right talent
Having all
stakeholders aligned
Having the right
operating model
Having the
right data
Having the right
technology
Aug-21 Feb-20 Aug-18
Rank order the following factors in terms of their importance for driving future organic revenue growth within your company? (% reporting first priority)
Economic Sector: Aug-21

© Christine Moorman
August 2021
45
How marketers perform on key behaviors for pursuing growth
80.3% - Marketing articulates how
the growth opportunity connects to
the company position and strategy
76.9% - Using an integrated
marketing team in which digital and
nondigital work together
72.8% - Marketing builds a business
case for the growth strategy
W h e r e m a r k e t e r s e x c e l
When pursuing growth opportunities, how often do the following behaviors occur in your company:
67.9% - Marketing offers a strong
interpretation of customer insights
important to the growth opportunity
67.0% - Marketing is able to connect
the growth strategy to relevant
customer metrics
62.1% - Effectively leveraging
technology to pursue growth
opportunities
61.4% - Using data insights across
channels
W h e r e m a r k e t e r s c a n i m p r o v e
50.3% - Examining other industries for
actions that might inspire company
growth opportunities
44.4% - Identifying how to move the
business from core strengths into
adjacent digital opportunities
35.0% - Using an integrated marketing
team in which marketing and finance
experts work together
W h e r e m a r k e t e r s s t r u g g l e

© Christine Moorman
August 2021
46
Pandemic continues to entrench focus on market penetration;
market development becomes a larger priority across sectorsAllocate 100 points to reflect your company’s spending in each of the four growth strategies during the prior 12 months.
% Change from Feb-21 to Aug-21
Feb-21 Aug-21B2B
Product
B2B
Services
B2C
Product
B2C
Services
Market
Penetration56.8% 55.4% -16.1% +6.3% +9.0% +3.8%
Product/Servic
e Development20.3% 20.9% +29.1% -0.6% -21.4% -26.3%
Market
Development14.3% 16.1% +9.3% +0.1% +28.3% +51.7%
Diversification 8.7% 7.6% +32.5% -33.3% -33.2% -62.2%
Existing
products/
services
New
products/
services
Existing
markets
Market
penetration
Product / service
development
New
markets
Market
development Diversification
© Christine Moorman
August 2021
47
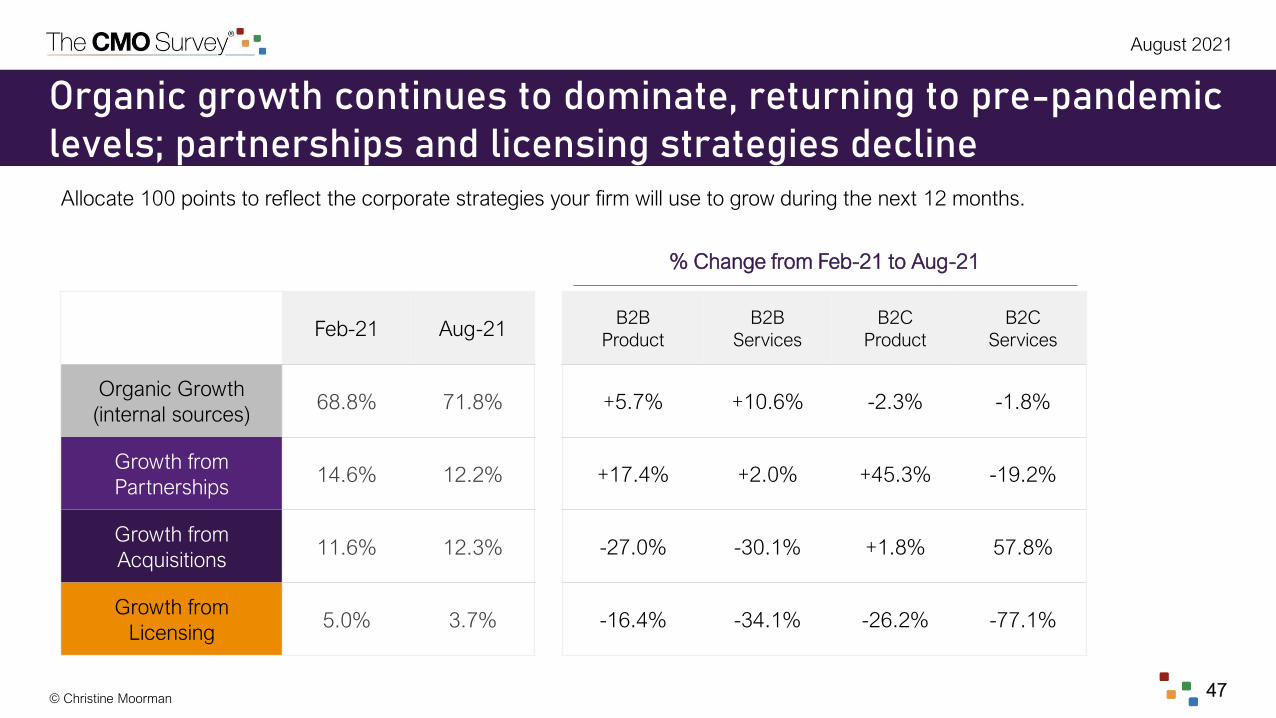
Organic growth continues to dominate, returning to pre-pandemic levels; partnerships and licensing strategies decline
Allocate 100 points to reflect the corporate strategies your firm will use to grow during the next 12 months.
% Change from Feb-21 to Aug-21
Feb-21 Aug-21B2B
Product
B2B
Services
B2C
Product
B2C
Services
Organic Growth
(internal sources)68.8% 71.8% +5.7% +10.6% -2.3% -1.8%
Growth from
Partnerships14.6% 12.2% +17.4% +2.0% +45.3% -19.2%
Growth from
Acquisitions 11.6% 12.3% -27.0% -30.1% +1.8% 57.8%
Growth from
Licensing 5.0% 3.7% -16.4% -34.1% -26.2% -77.1%
© Christine Moorman
August 2021
48
9.2%
11.6%10.6%
8.9%9.9%
11.3%12.4%
10.3%11.3%
10.3%
11.8% 11.8%12.8%
12.2%
9.9%
13.4% 13.5%
19.3% 19.4%
17.0%
0%
10%
20%
Feb-
12
Aug-
12
Feb-
13
Aug-
13
Feb-
14
Aug-
14
Feb-
15
Aug-
15
Feb-
16
Aug-
16
Feb-
17
Aug-
17
Feb-
18
Aug-
18
Feb-
19
Aug-
19
Feb-
20
June-
20
Feb-
21
Aug-
21
Internet sales experience slight decline from the height of the pandemic, but still tower over pre-pandemic figures
What percentage of your firm’s sales is through the Internet?
F i r m a n d i n d u s t r y
b r e a k o u t s o n n e x t s l i d e

© Christine Moorman
August 2021
49
17.0%
10.0%
7.7%
21.0%
19.9%
7.6%
23.7%
>$10B
$1-9.9B
$500-999M
$100-499M
$26-99M
$10-25M
<$10M
13.5%
7.7%
10.9%
12.4%
14.7%
18.6%
18.1%
25.9%
>10K
5K-9.9K
2.5K-4.9K
1K-2.4K
500-999
100-499
50-99
<50
55.3
%
5.1%
0.0%
>10%
1-10%
0%
Firm and industry sector differences in Internet sales
Top 3 Industry Sectors
• Education (35.1%)
• Consumer Packaged Goods (33.1%)
• Retail/Wholesale (24.4%)
Bottom 3 Industry Sectors
• Real Estate (0.0%)
• Pharma/Biotech (2.5%)
• Manufacturing (7.2%)
B2B Product: 11.6%
B2B Services: 13.1%
B2C Product: 31.6%
B2C Services: 20.5%
What percentage of your firm’s sales is through the Internet?
E M P L O Y E E S R E V E N U E
I N T E R N E T S A L E S
17.0%a v e r a g e o f
s a l e s
t h r o u g h I n t e r n e t
Economic Sector
Industry Sector

© Christine Moorman
August 2021
50
80.5%80.9%
81.4%
83.9%
85.8%
84.4%
81.4%
82.5% 82.4%
83.6%
85.0% 84.8%
87.0%87.6% 87.4%
84.8%
85.6%85.0%
75%
80%
85%
90%
Aug-
17
Feb-
18
Aug-
18
Feb-
19
Aug-
19
Feb-
20
Jun-
20
Feb-
21
Aug-
21
Domestic Firm Sales Domestic Marketing Budget
Domestic sales and marketing budgets remain relatively constant, still below 2019 levels
What percentage of your firm’s sales is domestic? What percentage of your marketing budget is spent on domestic markets?
Insights
Domestic sales are relatively stable and still
below 2019 levels. The lower level occurs
equally across all sectors, except for B2C
Product (up to 86.7% from 84.6%). The
Mining/Construction (99.5%),
Retail/Wholesale (95.0%), and
Banking/Finance/Insurance (93.0%)
industries have the highest percentage of
domestic sales. The largest companies,
those with over $10B in revenue (67.1%)
and 10,000+ employees (64.3%), sell far
less domestically than their smaller
counterparts.
Budgets allocated for the domestic market
also remain lower than 2019 levels, driven
by B2B Product whose domestic budgets is
at 79.5%, compared to almost 84% in
August 2019.

© Christine Moorman
August 2021
51
Marketers generally consider Western Europe to be their largest international market, however B2C Products lean into Canada
Western Europe Top 3 Sectors
• Real Estate (100.0%)
• Tech/Software Platform (76.7%)
• Transportation (60.0%)
Canada Top 3 Sectors
• Energy (100.0%)
• Retail/Wholesale (66.7%)
• Consumer Services (50.0%)
B2B Product: Western Europe (63.3%)
B2B Services: Western Europe (42.3%)
B2C Product: Canada (33.3%)
B2C Services: Western Europe (50.0%)
Which international market is currently your largest (in terms of sales)?
2 0 %
8 %
4 %
4 %
3 %
2 %2 %2 %
1 %
2 %
2 %
5 0 %
Economic Sector
Industry Sector

© Christine Moorman
August 2021
52
Opportunities are dispersed, with China and Western Europe being the only two markets receiving more than 10% of votes
B2B Product: Mexico (15.1%)
B2B Services: China (19.4)
B2C Product: Western Europe (25.0%)
B2C Services: Western Europe (16.7%)
Which international market that you are currently not in is your biggest opportunity for the future?
1 6 %
4 %
7 %
9 %6 %
4 %
6 %
3 %9 %
6 %
3 %
2 %
6 %
Western Europe Top 3 Sectors
• Communications (33.3%)
• Consumer Services (33.3%)
• Retail/Wholesale (33.3%)
China Top 3 Sectors
• Mining (100%)
• Consumer Services (40.0%)
• Communications (33.3%)
1 2 %
Economic Sector
Industry Sector
4 %4 %

© Christine Moorman 53
August 2021
Social Media and Mobile Marketing
Both mobile and social media spend have increased over the pandemic, but have dropped below the historic high measured at its height in
June 2020. Marketers agree that mobile and social media spend will continue to increase at an even faster pace in the next five years—
reaching 34% of marketing budgets for mobile and 24% for social in the next five years. B2C Product companies, in particular, indicate that
mobile and social media marketing have become a pillar for their companies’ success. For both mobile and social media marketing, B2C
Product companies reported a performance contribution of 4.8 for both (on a 7-point scale), compared to the survey-wide averages of 3.3 for
mobile and 4.0 for social.
Although smartphone ownership continues to reach new heights, only 25% of companies report using an app. Of those that use apps, the
return on investment varies significantly. The majority of companies (56.2%) report that their app generates <5% of total revenue. B2C
Service companies indicate the highest returns, with 50% of companies report moderate-to-high app revenue generation. Of all industries,
Retail indicates the greatest app performance, with 60% of companies reporting moderate (10%-15% return) to high (15%+ return) revenue
generation. Most companies (50%) believe their apps are a key piece of both their customer acquisition and customer retention strategies.
M A C R O E C O N O M I C S T R A N S F O R M A T I O N S P E N D I N G / R E T U R N S M E T R I C S / P E R F O R M A N C E G R O W T H S O C I A L / M O B I L E C U S T O M E R L E A D E R S H I P D E & I

August 2021
© Christine Moorman 54
3.7%
6.0%7.0%
9.4%11.2%
12.8% 13.5%
23.0%
18.5% 18.4%
23.1%
33.6%
0%
5%
10%
15%
20%
25%
30%
35%
40%
Feb-17 Aug-17 Feb-18 Aug-18 Feb-19 Aug-19 Feb-20 Jun-20 Feb-21 Aug-21 Next 12
Months
In 5
Years
What percent of your marketing budget are you currently spending on mobile activities? And what percent will you spend in the next 12 months? 5 years?
Insights
Industries leading in current mobile
spend are Retail/Wholesale (35.8%) and
Consumer Packaged Goods (31.2%)
while the Real Estate (5.0%) and
Mining/Construction (8.33%) industries
lag in their current spend. Companies
with <$10M sales revenue are currently
leading in spend at 21.4% and predicted
to continue to lead throughout the next
12 months with 31.5% and 5 years with
39.0%.
Mobile spending stayed relatively constant over the past six months, but is expected to increase at a faster pace in the future
Aug-21 Next Year
B2B Product 13.8% 16.9%
B2B Services 12.2% 18.0%
B2C Product 33.2% 38.8%
B2C Services 27.8% 32.5%
Economic Sector

August 2021
© Christine Moorman 55
27.5%
21.1%
10.4%
12.4%
16.3%
8.0%
4.4%
28.7%
15.8%
11.9%
9.9%
15.8%
8.4%9.4%
0%
5%
10%
15%
20%
25%
30%
35%
1 2 3 4 5 6 7
Feb-21 Aug-21
Mobile marketing’s contribution to performance has increased slightly over the past six months
To what degree has the use of mobile marketing contributed to your company’s performance during last year? (1=not at all, 7=very highly)
Insights
B2C Product companies indicate the
highest performance contribution
from mobile marketing.
Retail/Wholesale (5.4) shows high
contribution as does Consumer
Packaged Goods (4.5). Companies
with $10B+ in sales (4.3) also see the
highest gains from digital.
Pharma/Biotech (1.0) and Real Estate
(2.0) benefit the least.
B2B Product: 2.8
B2B Services: 2.8
B2C Product: 4.8
B2C Services: 4.0
M e a n R a t i n g O v e r T i m e
F e b - 2 1 : 3 . 1
A u g - 2 1 : 3 . 3
Economic Sector

August 2021
© Christine Moorman 56
10.6%11.7%
10.5%9.8%
12.0%
13.8%
11.4% 11.9%
13.3%
23.2%
14.9%
15.3%
18.9%
23.5%
0%
5%
10%
15%
20%
25%
30%
Feb-
16
Aug-
16
Feb-
17
Aug-
17
Feb-
18
Aug-
18
Feb-
19
Aug-
19
Feb-
20
June-
20
Feb-
21
Aug-
21
Next 12
Months
In 5
Years
Social media spend increased slightly over the past six months, but is expected to increase at a faster pace in the future
Aug-21 Next 12
Months
B2B Product 10.2% 13.5%
B2B Services 15.8% 20.1%
B2C Product 22.4% 25.0%
B2C Services 21.2% 25.7%
What percent of your marketing budget are you currently spending on social media? And what percent will you spend in the next 12 months? 5 years? Economic Sector
Insights
Industries leading in current social media
spend are Education (22.4%) and
Consumer Packaged Goods (21.6%),
while the Pharma/Biotech (0.0%) and
Real Estate (5.0%) industries lag.
Companies with <$10M sales revenue
are leading at 19.3% and predicted to
continue to lead throughout the next 12
months with 23.4% and 5 years with
28.5%.

August 2021
© Christine Moorman 57
7.8%
13.0%
9.4%
24.5%
20.8%
14.6%
9.9%
5.9%
21.2%
17.2%
13.3%
17.7%16.7%
7.9%
0%
5%
10%
15%
20%
25%
30%
1 2 3 4 5 6 7
Jun-20 Aug-21
Social media spend contributions do not increase; vary greatly across economic sector, industry sector, and company size
To what degree has the use of social media contributed to your company’s performance during last year? (1=not at all, 7=very highly)
Insights
B2C Product companies indicate the
highest performance contribution from
social media spend. Pharma/Biotech
(5.0) and Retail/Wholesale (5.0) show
the highest contribution. Companies
with >10% of sales over the Internet
(4.8) see the highest gains from social
media spend. Banking/Finance (3.2)
and Energy (3.4) benefit the least.
B2B Product: 3.3
B2B Services: 4.3
B2C Product: 4.8
B2C Services: 4.4
M e a n R a t i n g O v e r T i m e
J u n - 2 0 : 4 . 2
A u g - 2 1 : 4 . 0
Economic Sector

August 2021
© Christine Moorman 58
A quarter of all companies use apps, but larger companies and those with higher percentage of sales online are more likely
Does your company use an app?
41.7%
36.6%
33.3%
29.8%
14.3%
11.1%
14.6%
>$10B
$1-9.9B
$500-999M
$100-499M
$26-99M
$10-25M
<$10M
38.5%
29.4%
36.4%
30.0%
30.8%
19.1%
19.0%
12.8%
>10K
5K-9.9K
2.5K-4.9K
1K-2.4K
500-999
100-499
50-99
<50
32.0%
26.8%
17.7%
>10%
1-10%
0%
E M P L O Y E E SR E V E N U E
I N T E R N E T S A L E S
24.6%a v e r a g e o f
c o m p a n i e s u s e
a n a p p

August 2021
© Christine Moorman 59
6.0%
20.0%
16.0%
12.0%
20.0%
10.0%
16.0%
0%
5%
10%
15%
20%
25%
1 2 3 4 5 6 7
App contributions vary by economic sector, making the largest performance contribution for B2C Services
To what degree has your app contributed to your company’s performance during last year? (1=not at all, 7=very highly)
B2B Product: 3.9
B2B Services: 3.9
B2C Product: 4.0
B2C Services: 5.1
M e a n = 4 . 1 Economic Sector

August 2021
© Christine Moorman 60
14.6%
18.8%
10.4%
33.3%
22.9%
0% 5% 10% 15% 20% 25% 30% 35%
High Revenue
(15%+)
Moderate Revenue
(10-15%)
Some Revenue
(5-10%)
Little Revenue
(<5%)
No Revenue
(0%)
High Revenue
Aug-21
B2B Product 14.3%
B2B Services 8.3%
B2C Product 14.3%
B2C Services 25.0%
Apps generally contribute little revenue, but contribute the most to B2C Service companies
Approximately what percent of revenue has your app(s) generated for your business?Economic Sector
Insights
25% of companies with >10% of sales
over the Internet reported that their app
generates High Revenue. Smaller
companies, both in terms of revenue
and number of employees, reported
high revenue generation as well, with
33.3% of companies with <$10M in
sales and 20.0% of companies with <50
employees reporting High Revenue.

August 2021
© Christine Moorman 61
Most companies believe that their apps are a key piece of both their customer acquisition and customer retention strategies
Which of the following best aligns with how your app impacts your customer acquisition or retention strategy?
App aligns
with…
4.2% 50.0% 45.8%
ACQ
Strat Both
RET
Strat
B2B Product 0.0% 53.8% 46.2%
B2B Services 0.0% 58.3% 41.7%
B2C Product 6.7% 46.7% 46.7%
B2C Services 12.5% 37.5% 50.0%
Economic Sector

© Christine Moorman 62
August 2021
Customer Behavior
Marketers report that superior product quality (ranked as the top priority by 32.0% of companies), trusting relationships (18.1% of
companies), and excellent service (13.5% of companies) will be their customers’ top priorities in the next year. Comparing these priorities to
those reported pre-pandemic in February 2020, we see an increased emphasis on product quality, with it increasing in importance by almost
43%. This is especially true within the B2C Product sector, where product quality increased from being identified as the top priority by 17.4%
of companies to 40.4% of companies.
Diving one level deeper, a similar trend emerges when restricting to Consumer Packaged Goods companies, where product quality
increased from being identified as the top priority by 0.0% of CPG companies earlier in the year to 65.4% of CPG companies. In February
2020, 45.5% of Consumer Packaged Goods companies identified superior innovation as their customers’ top priority, a percentage that
dropped to 11.5% as of August 2021. This trend aligns with the fact that consumers leaned into tried-and-true brand name products during
their stress-induced pandemic shopping, pushing companies to shift funding away from innovation and into their core product lines.
Customer experience emerged as the top priority identified by Consumer Services companies, with three-fourths of marketers rating it their
customers’ number one priority.
M A C R O E C O N O M I C S T R A N S F O R M A T I O N S P E N D I N G / R E T U R N S M E T R I C S / P E R F O R M A N C E G R O W T H S O C I A L / M O B I L E C U S T O M E R L E A D E R S H I P D E & I

August 2021
© Christine Moorman 63
Marketers predict an increase in their customers’ emphasis on superior product quality in the next 12 monthsRank your customers' top three priorities over the next 12 months. (% reporting 1st priority)
Superior product
quality
Trusting
relationship
Excellent
service
Low
price
Superior
innovation
Customer
experience
B2B Product 37.9% 14.7% 11.6% 10.5% 18.9% 6.3%
B2B Services 19.3% 27.7% 19.3% 13.3% 9.6% 10.8%
B2C Product 40.4% 12.3% 3.5% 15.8% 12.3% 15.8%
B2C Services 30.4% 13.0% 26.1% 17.4% 0.0% 13.0%
Economic Sector
32.0%
18.1%
13.5% 13.1% 12.7%10.4%
0%
5%
10%
15%
20%
25%
30%
35%
Superior product
quality
Trusting
relationship
Excellent
service
Low
price
Superior
innovation
Customer experience

© Christine Moorman 64
August 2021
Marketing Leadership
The role of marketers has continued to evolve, with marketers taking on more responsibilities. With the pandemic forcing people indoors and
increasing consumers’ reliance on the Internet, Digital Marketing was identified as a primary responsibility for marketers at 94.2% of
companies (100% of B2C Service companies), up from 86.0% in February 2020. This increase pushed Digital Marketing above Brand as the
top responsibility for marketers in 2021. Across the board, marketers appear to be taking on more responsibilities than ever, with significant
increases in responsibility in diverse areas such as Marketing Analytics, Lead Generation, Market Selection, and Competitive Intelligence.
On a 7-point scale where 1=never and 7=all the time), Marketing leaders are asked by their CEOs and/or CFOs to participate in board
meetings (at a rating of 4.9) and in the preparation for earnings calls (at a rating of 3.6). These are encouraging results that indicate marketing
leaders are getting a seat at the table.
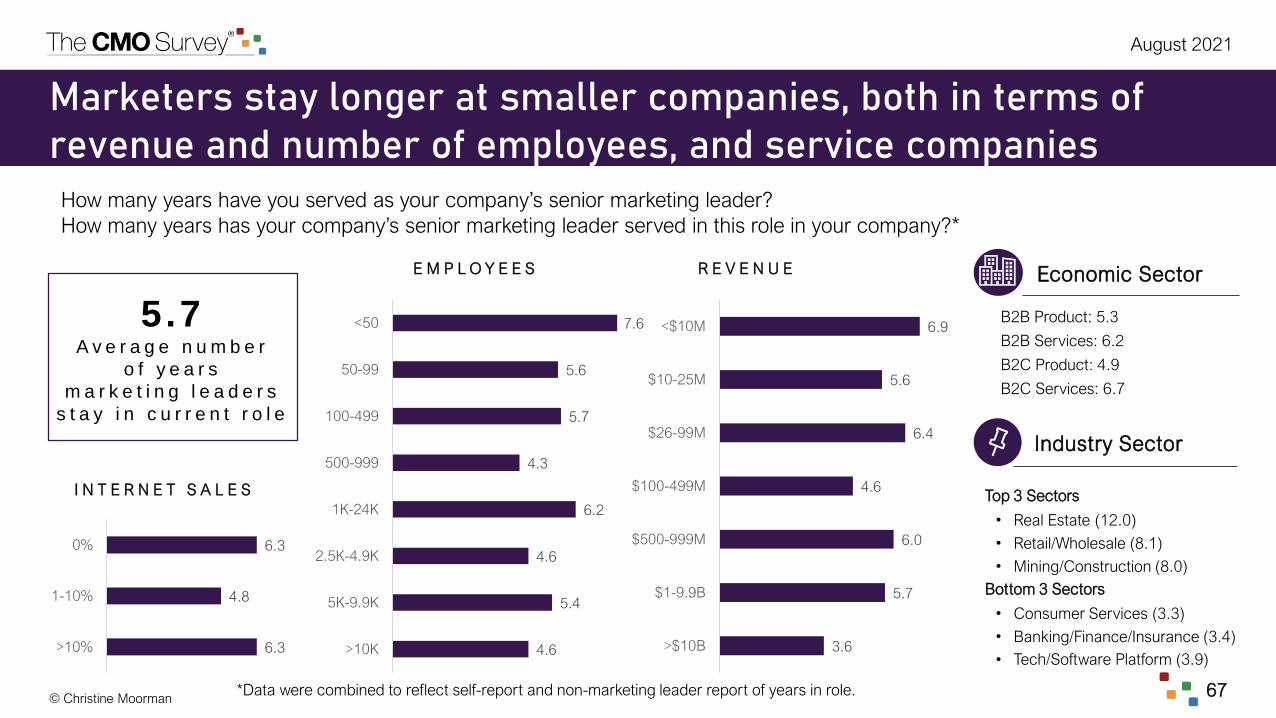
Marketing leaders are staying with their companies for more than five years on average. When restricting to smaller companies, both in terms
of revenue and number of employees, this number increases significantly ~20% with marketers at the smallest companies (<50 employees)
staying 7.6 years. Consumer Services and Banking/Finance/Insurance appear to have the highest turnover, with marketers staying in their
current roles for an average of only slightly more than 3 years.
M A C R O E C O N O M I C S T R A N S F O R M A T I O N S P E N D I N G / R E T U R N S M E T R I C S / P E R F O R M A N C E G R O W T H S O C I A L / M O B I L E C U S T O M E R L E A D E R S H I P D E & I

© Christine Moorman
August 2021
65
What is marketing primarily responsible for in your company?
*Red reflects a decrease and Green reflects an increase of more than a 2% between February 2020 and August 2021.
Marketers take on more responsibilities during pandemic year
Activity Feb-20 Aug-21
Digital marketing 86.0 % 94.2%
Brand 90.0 % 91.3%
Advertising 86.0 % 90.8%
Social media 80.7 % 84.1%
Promotion 65.3 % 77.8%
Marketing analytics 66.7 % 76.3%
Public relations 69.3 % 75.4%
Positioning 64.7 % 71.0%
Lead generation 59.3 % 70.5%
Marketing research 60.7 % 69.6%
Competitive intelligence 47.3 % 58.0%
Insight 53.3 % 51.7%
Activity Feb-20 Aug-21
Customer experience 49.3 % 41.1%
Market entry strategies 31.3 % 40.1%
Revenue growth 32.7 % 39.1%
CRM 40.0 % 33.3%
e-commerce 25.3 % 30.0%
Market selection 18.0 % 28.0%
New products 22.7 % 25.6%
Innovation 22.0 % 25.1%
Pricing 20.7 % 24.6%
Sales 18.7 % 20.8%
Customer service 16.0 % 12.6%
Distribution 12.7 % 7.7%
Stock market performance 1.3% 1.4%

© Christine Moorman
August 2021
66
Senior marketing leaders are likely to be asked by their CEO and/or CFO to participate in company board meetings
How often is the senior marketing leader asked by the CEO or CFO to participate in board meetings or earnings calls? (1=never, 7=all the time)
Average
participation 3 . 64 . 9
Who
participates
more
Companies with:
• >10% Internet sales
• $26-99M revenue
• 1,000-2,499 employees
Companies with:
• >10% Internet sales
• $26-99M revenue
• 100-499 employees
13.4%
9.4%
3.5%
14.4%
5.9%
10.9%
42.6%
36.4%
9.1%
5.3%
10.2%
7.5% 8.0%
23.5%
0%
5%
10%
15%
20%
25%
30%
35%
40%
45%
1 2 3 4 5 6 7
Participate in board meetings Preparation for earning calls
B o a r d m e e t i n g s E a r n i n g c a l l s
% of companies
above average
participation5 9 . 4 % 4 9 . 2 %
Not at all All the time
© Christine Moorman
August 2021
67
Marketers stay longer at smaller companies, both in terms of revenue and number of employees, and service companies
How many years have you served as your company’s senior marketing leader?
How many years has your company’s senior marketing leader served in this role in your company?*
5.7A v e r a g e n u m b e r
o f y e a r s
m a r k e t i n g l e a d e r s
s t a y i n c u r r e n t r o l e
I N T E R N E T S A L E S
E M P L O Y E E S R E V E N U E
B2B Product: 5.3
B2B Services: 6.2
B2C Product: 4.9
B2C Services: 6.7
Economic Sector
Industry Sector
Top 3 Sectors
• Real Estate (12.0)
• Retail/Wholesale (8.1)
• Mining/Construction (8.0)
Bottom 3 Sectors
• Consumer Services (3.3)
• Banking/Finance/Insurance (3.4)
• Tech/Software Platform (3.9)
*Data were combined to reflect self-report and non-marketing leader report of years in role.
6.3
4.8
6.3
>10%
1-10%
0%
4.6
5.4
4.6
6.2
4.3
5.7
5.6
7.6
>10K
5K-9.9K
2.5K-4.9K
1K-24K
500-999
100-499
50-99
<50
3.6
5.7
6.0
4.6
6.4
5.6
6.9
>$10B
$1-9.9B
$500-999M
$100-499M
$26-99M
$10-25M
<$10M

© Christine Moorman 68
August 2021
Marketing and Diversity, Equity, & Inclusion
Companies report an average increase of 10.6% of marketing spend on DE&I in the last year, compared to 8.9% in February 2021. Against
that spending, companies have continued to improve several DE&I aspects of their marketing activities. Relative to a year ago, marketers
report more changes to the DE&I of training, segmentation/targeting, product/service design, and marketing partnerships.
Companies have shown no progress since February 2021 towards the institutionalization of formal DE&I reviews and evaluations of their
marketing decisions (current average rating of 3.5 out of 7, compared to 3.6 in February 2021). Industries that have been the most successful
at taking a more inclusive approach to marketing decision making include Retail/Wholesale (4.7 out of 7), Banking/Finance/Insurance (4.5),
and Consumer Packaged Goods (4.1).
On average, companies are making minimal changes to their marketing strategies to reach a more diverse set of customers. Larger
companies, both in terms of revenues and number of employees, and companies with >10% of sales over the Internet report making the most
changes. Almost a quarter of marketing leaders report that their companies are not changing their marketing strategies at all. Difficulty
envisioning and assessing the value of DE&I-related opportunities were reported as the top barriers to bringing DE&I into the core of
marketing strategy and decision making. Therefore, although the majority of companies consider DE&I to be a priority (67.9%), companies
still have a way to go before DE&I is fully embraced as part their marketing hiring and strategic decision-making processes.
M A C R O E C O N O M I C S T R A N S F O R M A T I O N S P E N D I N G / R E T U R N S M E T R I C S / P E R F O R M A N C E G R O W T H S O C I A L / M O B I L E C U S T O M E R L E A D E R S H I P D E & I

August 2021
© Christine Moorman 69
Relative to a year ago, rate the success your company has had in improving DE&I of its marketing activities.
% Change in Feb-21 % Change in Aug-21
Communications 65.3% 64.9%
Training 53.4% 57.2%
Brand 60.6% 53.6%
Marketing Employees 50.2% 49.5%
Segmentation & Targeting 38.6% 46.9%
Product & Service Design 32.9% 41.1%
Marketing Partnerships 33.3% 37.3%
Companies succeed in improving DE&I of marketing activities, having the most success in communications and training

August 2021
© Christine Moorman 70
Large strides made on DE&I marketing spend in the last year across the board, with big companies making the largest leap
I N T E R N E T S A L E S
E M P L O Y E E S R E V E N U E
By what percent has marketing spending on DE&I changed in the last year?
10.6%a v e r a g e
c o m p a r e d t o 8 . 9 %
i n F e c - 2 0 2 1
26.3%
18.8%
10.1%
8.7%
5.0%
7.5%
7.2%
>$10B
$1-9.9B
$500-999M
$100-499M
$26-99M
$10-25M
<$10MB2B Product: 8.4%
B2B Services: 8.6%
B2C Product: 18.5%
B2C Services: 9.9%
Top Industry Sectors
• Banking/Finance/Insurance (20.0%)
• Consumer Packaged Goods (17.9%)
Bottom Industry Sectors
• Real Estate (0.0%)
• Mining/Construction (1.7%)
• Transportation (1.9%)
Economic Sector
Industry Sector
21.6%
25.4%
12.5%
3.3%
8.1%
9.8%
7.9%
4.7%
>10K
5K-9.9K
2.5K-4.9K
1K-24K
500-999
100-499
50-99
<50
11.8%
11.1%
9.4%
>10%
1-10%
0%

August 2021
© Christine Moorman 71
DE&I is likely to be a priority company wide; marketing priority lags company
Do you expect DE&I to be a priority for your company over the next five years? Do you expect DE&I to be a marketing priority for your company over the next five years?
D E & I A S A P R I O R I T Y F O R C O M P A N I E S D E & I A S A M A R K E T I N G P R I O R T Y
F O R C O M P A N I E S
67.9%
32.1%Yes
No
58.7%
41.3% Yes
No
Company
Priority
Marketing
Priority
B2B Product 60.5% 53.2%
B2B Services 73.3% 60.7%
B2C Product 78.9% 69.2%
B2C Services 61.1% 55.6%
Economic Sector

August 2021
© Christine Moorman 72
Marketers need to encourage their companies to establish processes to review and evaluate the DE&I of their decisions
Rate the degree to which your company has developed an inclusive approach to marketing decision making, meaning you have established steps to review and/or evaluate marketing decisions from a DE&I perspective. (1=not at all, 7=very highly)
Insights
Retail/Wholesale (4.7), Banking/Finance/
Insurance (4.5), and Consumer
Packaged Goods (4.1) report the
strongest DE&I marketing decision
process while Pharma/Biotech (1.0) and
Real Estate (2.0) are the lowest. DE&I
decision making processes are more
established as company revenue and
employees increase.
23.0%
11.0% 10.5%
23.0%
16.8%
10.5%
5.2%
0%
5%
10%
15%
20%
25%
1 2 3 4 5 6 7
M e a n = 3 . 5
B2B Product: 3.0
B2B Services: 3.6
B2C Product: 4.3
B2C Services: 3.9
Economic Sector

August 2021
© Christine Moorman 73
Internet-based, B2C, and larger companies more likely to change marketing strategy to reach more diverse customers
How much is your company changing its marketing strategy to reach a more diverse set of customers? (1=not at all, 7=very much).
B2B Product: 2.7
B2B Services: 3.5
B2C Product: 4.4
B2C Services: 3.9
Economic Sector3.4A v e r a g e r a t i n g o f
c o m p a n i e s
c h a n g i n g
m a r k e t i n g
s t r a t e g y d i v e r s i t y
I N T E R N E T S A L E S
E M P L O Y E E S R E V E N U E
3.9
4.2
4.3
3.8
3.3
3.1
2.8
3.0
>10K
5K-9.9K
2.5K-4.9K
1K-24K
500-999
100-499
50-99
<50
Top Industry Sectors
• Consumer Packaged Goods (4.3)
• Retail/Wholesale (4.1)
Bottom Industry Sectors
• Real Estate (1.0)
• Energy (2.6)
• Manufacturing (2.6)
Industry Sector
4.1
4.0
4.0
3.5
2.8
2.7
3.1
>$10B
$1-9.9B
$500-999M
$100-499M
$26-99M
$10-25M
<$10M
3.9
3.4
3.1
>10%
1-10%
0%

August 2021
© Christine Moorman 74
Difficulty assessing value of and envisioning opportunities for DE&I-related opportunities are biggest DE&I barriers
What are the top three barriers to bringing DE&I into the core of your marketing strategy and decision making?
Top Barriers % Report Barriers
Difficulty assessing the value of DE&I-related opportunities 69.1%
Difficulty envisioning DE&I-related opportunities 68.6%
Lack of good DE&I decision making processes to drive strategy 50.3%
Difficulty designing effective DE&I-sensitive actions 49.1%
Difficulty implementing DE&I changes across the organization 38.3%
Lack of true top management support 22.9%
Economic Sector
Insights
Companies’ ability to envision DE&I-related
opportunities increases with Internet sales
and revenue, with only 18.6% of
companies with >10% Internet sales and
20.0% of companies with $10B+ revenue
reporting this as a top barrier.
Assessing
value
Envisioning
opportunities
B2B Product 67.7% 75.0%
B2B Services 63.0% 70.4%
B2C Product 83.3% 55.5%
B2C Services 64.7% 64.6%

August 2021
© Christine Moorman 75
One third of companies expect to lose employees who want to work-from-home full-time; hiring gains dominateTo what degree are post-pandemic work-from-home opportunities impacting your marketing organization? Rate your agreement with the following related to your marketing employees working from home or office.
I expect to… Hire Lose
People who want to work-from-home 74.0% 32.6%
People who want to work from the office 62.4% 12.3%

Next CMO Survey: February 2022
Participate: Sign up to participate in the next survey
Media: Coverage of The CMO Survey
Blog: Read blog coverage of results
Survey Home: Visit for copies of all CMO Survey reports over time
Feedback: Send comments and ideas to Christine Moorman
Sponsors: Deloitte LLP, Duke University’s Fuqua School of Business, and the American Marketing Association.
Sponsors support The CMO Survey with intellectual and financial resources. Survey data and
participant lists are held in confidence and not shared with survey sponsors or any other parties.