Embed Size (px)
Citation preview

Managerial Gender Earnings Gap in China
Lin Xiu
April, 2009

Section I: Introduction
China has a long tradition of Confucianism, which emphasizes the subordinate roles of females
in the society, as illustrated by the famous saying “lack of talent is a virtue of women” (nuzi
wucai bianshi de). Although such beliefs have been diminishing during the planned economy
(1949-1978) when the Chinese central government implemented a system of national wage
scales based on the socialist egalitarianism principle—wage dispersion due to human capital
characteristics was suppressed, the portion of females in top organization jobs still remains low
and gender earning differential still exists.
Several studies have investigated the gender earnings differential in recent years and shown an
increasing gap between males and females (e.g. Zhang et al., 2008) in the last two decades. It is
also shown that the gap is particularly large at the lower end of the earning distribution; however
the gap widened greatly at the upper end in most recent years (2001-2004),
This paper aims at analyzing gender earnings differentials among top managers in China. Among
a few studies that have investigated the female-male earnings differentials using Chinese data
(e.g. Wang & Cai, 2008; Zhang, et al., 2008; Ng, 2007, Meng, 1998), none of them looked at
how the gender pay differential varies by occupation groups, especially among those high paid.
On the other hand, studies on executive compensation in China (e.g. Firth, Fung and Rui, 2007;
Kato and Long, 2006; Zhu, 2007) largely use the data of listed firms which contains limited
information pertaining to executives’ individual characteristics such as tenure, marital status and
training. This prohibits researchers from investigating the underlying rationale why female
managers are paid lower, e.g. how much of the gender CEO compensation gap relates to CEO’s
individual characteristics.
1

Our motivation to conduct this study is threefold. First, the question of whether and how females
are treated financially differently from their male counterparts in contemporary Chinese
organizations is of great interest to the three parties in the employment relationship: the
government policy makers, organizations, and employees. If pay differentials do exist and are
largely due to workplace discrimination, then policy makers may need to address the
employment equity issue through policies such as affirmative action regulation. On the other
hand, if the gender pay differential is largely due to the lower education or training received by
female managers, then discrimination policies regarding education and manager
development/training would be more relevant than pay equity issue because this will address
why male and females end up with different “human capital”. From the organization’s
perspective, if gender pay differential are largely due to institutional barriers that disadvantage
women, or other discriminatory factors at the workplace, firm performance will suffer because
organizations are not maximizing the likelihood that pay and hiring go to the most productive
managers. From the employees’ side, it would be interesting to know how these highest paid
women are paid after they cross the “glass ceiling”.
Second, the unobserved differences between men and women are minimized as we are focusing
on a specific occupation group where men and women are more likely to share some common
unobserved characteristics such as career ambition. This is crucial for identifying the factors that
lead to gender pay differential since the unexplained part of male female wage differential could
be attributable to labour market discrimination, but could also be due to differences between men
and women that are unobservable, such as relative lack of career commitment or job motivation
(Bertrand and Hallock, 2001).
2

Third, we use data from a survey of executives and firms in 2006 from Liuzhou, Guangxi, China.
An important advantage of using this survey data is that it contains information from both
executives and the firms that they worked for. The inclusion of workplace characteristics into
analysis will help to identify the factors that underlying the managerial gender pay differential.
For example, Drolet (2002) analyzing Canadian Workplace and Employee Survey found that
when workplace and industry measures were included, the “explained” component of gender pay
differential was increased substantially. Also, compared to earlier studies on managerial pay, we
have a relatively larger portion of women in our sample (21.56%), which allows us to make non-
misleading estimation.
This paper will draw on two major literatures: studies on gender pay differential in China, and
CEO compensation studies. Section 2 will briefly discussed the relevant findings from these two
literatures, and our hypotheses based on these findings. Section 3 will introduce the data and
methodology. Analysis results will be presented in Section 4. Policy indications and further
discussion will be discussed in section 5.
Section II: Literature Review on Gender Pay Differentials and CEO Compensation in
China
2.1 Gender Pay Differentials in China
There is a growing literature on gender earnings inequality in China since the middle 1990s. A
wide range of the differentials is found in different studies, from 50% to 90%. Most studies have
shown that the income differential has been enlarged in the past two decades. For example, a
recent study, Zhang et al. (2008) analyzing changes in the gender income gap in urban China
over the period 1988-2004 using urban household survey data, found that female-male earnings
3
gap increased from 15.8% in 1988 to 24.3% in 2004. Similar trend was revealed in Maurer-Fazio,
Rawski and Zhang (1999). With the official data presented in labour year book, they found that
the gender earnings gap increased in urban industry between 1988 and 1994, from 15.5% to
17.5%. Other studies also provided evidence of gender earnings gap using various data sources.
For instance, Khan (1996) noted that women’s income were about 80 percent of men’s overall
during the late 1980s; Maurer-Fazio and Hughes (2002) show that the overall gender wage gap
was 14% in 1991. In terms of the earnings of high paid, earlier research shows that the gap
widened much more at the lower end of the earnings distribution than at the upper end from 1988
to 2004; however, in more recent years, the gender gap of highly paid workers is widening
greatly (Zhang et al., 2008)
Two components—explained portion and unexplained portion—of the overall gender earning
gap have been analyzed in order to identify the sources of gender wage inequality. Hughes and
Maurer-Fazio (2002), for example, use the total monthly income data collected in 1992 Chinese
Labour Market Research Project as dependent variable to compare the gender gap across
different groups, and found an overall urban wage ratio of 86 percent. After controlling for
education, age, job tenure and work experience, 40% remains unexplained. The results also
show that there is larger wage gap for married women than single women, and the unexplained
portion is also larger for married than single women; unexplained wage differentials decrease
with educational attainment; and the gap does not vary much in size across occupational
groupings. Using the same data set, Maurer-Fazio and Hughes (2002) found that the degree of
wage dispersion plays an important role in explaining the larger wage gaps in the joint-venture
and collective sectors relative to the state-owned sector. Qian (1996) applied human capital type
models to two sets of cross sectional data collected from Beijing and Guangdong Province in
4

1993 to analyze China's current urban gender wage differentials. He found that there is a
significant 8% gender wage gap in urban China after controlling for education, experience,
occupation, industry, ownership, and region. He attributed this gender gap to the Chinese
women's continuous labor force participation as well as China's over-four-decade practice of
“Equal Pay for Equal Job” policy. Liu, Meng and Zhang (2000) employed two Chinese data sets
from Tianjin and Jinan and found that overall gender wage differential declines substantially
across ownership sectors from the state to the collective to the private sector. Gustafsson and Li
(2000), utilizing two large scale surveys covering 10 provinces for the years 1988 and 1995,
analyzed the gender wage gap. They argued that from an international perspective, the gender
wage gap in urban China appears to be relatively small. Decompositions based on estimated
regression-models show that somewhat less than half of the average gender wage gap can be
attributed to differences in variables.
In terms of the trend, Bishop, Luo and Wang (2005) using the data of the Chinese Household
Income Project (CHIP) found that while the gender earning gap increased slightly from 19% in
1998 to 20% in 1994, but the relative share of unexplained portion declined from 71 percent to
61 percent during the study period. In other words, the overall gender gap was enlarging, but
more of the gender gap could be explained by the observable factors such as education,
occupation and so on. Similar trend has been found in Shu and Bian (2003), Rozelle et al. (2002)
and Liu et al. (2000). They argued that the privatization and marketization of the economy leads
to larger wage differentials as human capital characteristics are more appropriately rewarded. On
the other hand, opposite findings are shown in Gustafsson and Li (2000) who analyzed the urban
household income survey in 1989 and 1991, and show that the share of wage discrimination in
the total wage gap increased from 1988 to 1996.
5

As for the identified factors that leads to gender pay inequality, Liu et al (2000) found widening
gender wage gap across ownership sectors from state to collective, and then to private; however,
they also observed that the relative share of discrimination in the overall gender wage differential
declines across the ownership sectors. They argued that since private/collective firms exhibit
larger wage discrimination because they have more autonomy than state firms. On the other hand,
competition between and within sectors may reduce discrimination. Maurer-Fazio et al (1999)
found that ownership sector most subject to market forces has the largest wage gap. Maurer-
Fazio and Hughes (2002) found that both the gender wage gap and the portion of unexplained are
largest in the most competitive sector. In terms of geographical areas, Gustafsson and Li (2000)
found larger wage gaps and a higher unexplained residual in eastern provinces.
Married Chinese women experience much larger absolute gender wage gaps their their
unmarried counterparts. The portion of the "unexplained" portion is also higher for married
women than single women. Gender wage gaps are smaller for more educated women although
education for women appears not to pay earnings dividends until college. Unexplained wage
differentials decrease with education attainment (Hughes and Maurer-Fazio, 2002)
Researchers have found smaller wage gaps for more narrowly defined industry and job
categories (Robinson, 1998). Hughes and Maurer-Fazio (2002), on the other hand, did not find
the wage gaps increase when separating the data by occupational groupings. They argued that
occupational segregation by gender is not an important factor in China; rather, industrial
segregation is more important than occupational segregation in explaining the gender gap in
China’s urban labour markets. In terms of occupational segregation, Maurer-Fazio, Rawski and
Zhang (1999) noticed that women’s share in blue-collar, manual work declined, while their share
in all types of white collar work increased.
6

An exception in the literature is Lam and Dreher (2004)’s article, where the authors argued that
much of the observed gender pay differential is due to extra-firm mobility rather than intra-firm
gender discrimination. They using data from 739 U.S. managers and professional and 593 Hong
Kong Chinese managers and professionals to examine the effect of gender on the relationship
between changing employers and compensation attainments, found that large pay differences
favouring men were only observed among those who had followed an external labour market
strategy.
Literature on CEO Compensation in China
Contrast to the large number of CEO compensation studies in Western countries, only a few
studies have been done in this area in the context of China and most of them are in the past
decade. To develop a better understanding of the main determinants of Chinese executive
compensation, we review the research in this area. “Proquest (academic papers)” and “JSTOR”
databases were used for search the multidiscipline peer-reviewed scholarly publications in
English. The period chosen was 1990-2008, as this represents the time when the economic
restructuring began. Four search terms were used: “executive compensation China”, “executive
pay China” “CEO compensation China” “CEO pay China”. After further examination, 10 articles
were identified. One article was published in 1995, and the other nine articles were published
between 2000 and 2008. There were two types of data that were used for analysis, one using the
listed firm data (6 articles) and the other using survey data (4 articles), which mainly focused on
SOEs.
CEO compensation under analysis in these papers usually refers to cash compensation. Share
ownership by executives is very low in China (Xu, 2004). An important reason is that the
7

government decided not allowing listed firms to offer stock options to executives after some
debate because there is no source from which to give shares to the executives and treasury stock
usually is not allowed (Firth, Fung and Rui, 2007). So studies using listed firm data used CEO’s
total cash compensation including base salary, bonuses, and commissions. 1998 is the first year
that listed companies are required to disclose top management compensation, so the studies
employing listed firms data are increasing after 2000.
These studies have shown consistent evidence of pay-for-performance relation: firm performance
has found to be correlated with the compensation of top managers. For example, Buck, Liu and
Skiovoroda (2008) showed that executive pay and firm performance mutually affect each other
through reward and motivation. Firth et al. (2007) find a positive pay-performance relation in
China when performance is measured as return on assets although the relationship is not
significant when performance is measured by stock returns for the period 1998-2000. Kato and
Long (2006) extend the data range to 2002, and obtained a higher and significantly positive
results of pay-for-performance relations. In addition, Groves et al (1995) and Mengistae and Xu
(2004) showed that top management pay in state-owned-enterprises (SOEs) depends on
performance. The consistency of the results across various studies differs from CEO
compensation literature in North American where some empirical research has resulted in mixed
findings on the pay-for-performance relation (e.g. Devers et al., 2007; Conyon and Murphy,
2000; Core et al., 1999)
Various factors have been shown having impact on CEO compensation. For example, Firth et al.
(2007) showed that the compensation level is higher in foreign owned companies and lower in
8

state-owned companies. Firms with joint CEO/Chairman positions are less likely to use
performance-based pay. Ding, Akhtar and Ge (2006) analyzed a firm level data from three major
cities, Shanghai, Nanjing and Guangzhou, and showed that ownership, firm size, firm age,
location and industrial sector, have significant impacts on the variances in the Chinese managers’
compensation.
Section III: Data
This paper used survey data from enterprises and entrepreneurs from Liuzhou, Guangxi, China.
Questionnaires were delivered and reclaimed anonymously by the Federation of Industry and
Commerce of Liuzhou, Guangxi. The entrepreneur questionnaire contains information on
entrepreneurs and their enterprises, including gender, age, political status (CPP member or not),
education, marriage status, source of employment earnings, job tenure, received training. The
enterprise questionnaire contains information on industry, registered capital, corporate life, and
number of employees.
1050 questionnaires were distributed, 1017 returned the questionnaire and 831 provided usable
observations, among which 582 answered both questions on gender and pay.
We employed the regression missing value imputation method to deal with the missing values
present in variable “capital” (36 missing values), “firm history (years)” (23 missing values),
marital status (1 missing value), age (6 missing values), job tenure (12 missing values), and
number of employees (51 missing values). The descriptive statistics before and after imputation
are close. For example, the average job tenure for male is 9.33 years for 450 observations (before
9

manipulation), and 9.34 years for 456 observations (after manipulation). After missing value
imputation, the sample size is 582.
There were 126 females, accounting for 21.65% of the total sample. This relatively larger
percentage of females than earlier studies on CEO or top organization executives (e.g. 2.4% in
Bertrand and Hallock (2001) with US data, 4% in Kato and Long (2006b) with Chinese listed
firm data from the year of 1998-2002) might be due to the fact that most firms in this data source
are small and medium size firms while the above studies employed data from listed firms,
usually larger in size.
As illustrated in table 1, the total compensation was, on average, 34.1% lower for females and
for males. On average, women earned RMB162,400 (2006 Yuen) in total compensation,
compared to RMB246,400 for the average male leaders. The compensation comprised base wage,
bonus, stock options, and profit sharing.
Table1 shows that women in top managerial positions work for smaller firms. Female executives’
firms were 10% smaller when firm size was measured as the registered capital, and 66% smaller
in terms of number of employees. The average number of employees per firm for male and
female executives was 90 and 31, respectively. We computed the fraction of women by deciles
of firm registered capital. Women constituted about 26% of top management employment in the
bottom three deciles and only 16% in the top decile. Earlier studies on executive compensation
shows that CEOs tend to be paid more in larger firms (e.g. Murphy, 1998). It would be
interesting to see how much of the gender gap can be attributed to the under-representation of
women in larger firms.
10

Women in the sample were about 4 years younger than the men, on average (40.0 versus 44.1
years old), and had 2 fewer years of seniority in their company (7.1 versus 9.3 years).
As the respondents were CEOs/Chairs of their company or other top managers, we created a
variable called “president/Chair”, indicating whether the respondent was the very top manager of
the company. 68% of men and 55% of women reported they were CEOs or Chairs.
Due to the small size of the sample, we categorized the industry into two categories—service
industry and non-service industry. 29% of men and 40% of women worked in service industry.
Due to the same reason, the education categories1 were combined and respondents were grouped
into three categories: less than high school, high school, college/university or higher. Women
and men had roughly the same education level. On the other hand, 57% male CEOs and 44%
female CEOs had taken business training. 93% males and 82% females are married. 33% males
and 24% females are CPP members, which is an indicator of how closely they are with the local
government.
Section IV: Results
In this section, we investigate how various characteristics of CEOs and the enterprises that they
worked for might account for the gender pay gap. We first examine how the gender coefficient
changes as more variables are added into the model, compare the OLS estimates for males and
females, and then use Oaxaca decomposition methods to further look into how much of the
gender gap could be explained and how much remains “unexplained”.
• OLS regression with the pooled sample
1 The survey contains information on 8 education categories: less than elementary school, elementary school, junior middle school, high school, two years college, university, graduate (master level), and graduate (PhD level).
11

The dependent variable is the logarithmic form of pay, as shown in data section, comprises base
wage, bonus, stock options, and profit sharing, and others. We had two sets of independent
variables—enterprises characteristics and individual characteristics. Enterprises characteristics
included registered capital, years of history, industry, and executive rank in the firm. Individual
characteristics included age, job tenure, job tenure square, marital status, party membership,
education, business training, and whether profit was counted as part of the pay.
Table 2 shows the results of the pay regressions. The unconditional gender gap is about 32.5%
(column 1). Age and job tenure hardly explain any of the gap (column 2), and neither do marital
status and CPP membership (column 3). Education level variables are statistically significant in
the model, but do not contribute to explaining the gender gap as the gender coefficient does not
decrease when education variables are added into the model (column 4). The gender pay
differential reduces to 26.6% when business training variables was controlled for (column 5). In
total, individual characteristics explained 18.2% of the total pay gap.
Then, we examine the effect of firm characteristics on gender pay gap. When firm size, as
measured by logarithmic form of firm capital, was controlled for, the gender pay differential fell
to 22.0% (column 6). Adding further industry and company history variables does not contribute
to reducing the remaining gender pay gap (column 7). Adding the executives’ rank (column 8)
reduces the gender gap by 2.9 percentage point compared to column 7. Finally, column 9
examines the effect of compensation payment method, whether company profit was part of the
executives’ reward. When it was controlled for, the gender pay gap reduces another 3.9
percentage point. Compared column 9 and column 5, we can see that firm characteristics explain
10.7 percentage points or 32.9% of the total gender pay gap.
12

As firm characteristics might be a mechanism through which the gender pay differential between
male and female executives happens, we regard in the following analysis model 5 as the simple
model, and model 9 as the expanded model.
15.9 percent pay advantage of male executives continues to persist, unexplained by any of the
above factors. The results above indicate that if female executives had the same human capital
characteristics as males, their pay would be 75.6% percent of males’ pay. Further, if they were
managing the same enterprises as males, they would be earning 84.1% percent of what male
executives earn.
• OLS regression with males and females separately
We examine male and female executives’ pay separately with the same variables that were used
in the total sample. The expanded wage regressions are shown in table 3.
Age, after controlling for gender, is negatively associated with both male and female executives’
pay. The effect of age on female pay is not significant, but the magnitude is larger than for
females. The quadratic form of age was included originally, but the values were nearly zero for
both male and female regressions and statistically insignificant on quadratic term, which means
that the effect of age is roughly linear. Also, the inflection points were beyond the age range, so
we decided to remove the quadratic age term.
The return to job tenure is higher for women than for men. The marginal effects of job tenure are
0.048 and 0.078 respectively, which shows that one additional year of job tenure leads to male
pay increases of 4.8% while female pay increase of 7.8% on average. This may indicate the
influence of interrupted work careers of women. The inflection points for men and women are
13

21.3 years versus 16.8 years respectively. Pay increases with job tenure up to these points and
then decrease afterwards.
The coefficient of marital status is insignificant (t=1.59 for male, -0.95 for female). However, it
is interesting to note that married men earned more than single while married women earned less
than single after controlling for other individual characteristics and firm variables. This
difference could be due to the fact that men are more likely to gain family support for their work
after married, while women tend to assume more family responsibilities after married. A striking
difference in coefficients is with respect to the CPP membership variable. Male CPP members
earned less than non-CPP members while female CPP members earned more.
The return to education is higher for women than for men in general. In particular, men who
completed high school enjoy a 32.5% increase in pay as compared with their counterpart whose
education level were less than high school. However, women with high school completed earned
47.1% than those who did not finish high school, the coefficient is not significant. On the other
side, college and university education does not make difference for males’ earnings while have a
significant large effect on females’ earnings. Women with college, university or higher education
enjoyed an 79.5 percent increase in pay than those who did not finish high school. As distinct
from most studies on income return topic, our data set allows us to add business training among
regressors. We found that the return to business training is significant men (25.7%) and
insignificant for women (34.9%).
Firm size has a significant effect on both and females and males’ pay. This indicates that not
only females concentrated in smaller firms, and firm size is important in accounting for the
gender gap between male and female executive, firm size is also important in explaining the in-
14

group variance for female executives. 10% increase in firm registered capital leads to 1.58%
increase in females’ pay. For male executives, firm size is also a significant indicator of pay. In
particular, 10% increase in firm registered capital leads to 2.21% change in pay.
Whether the firms are in service industry does not have a significant effect on executive pay for
both males and females. The firm tenure does not have an effect either. Further, it is interesting
to notice that female executives who held president/chair positions earned 46.3% higher pay than
non-top leader while such difference was not shown for male executives.
To better discern whether profit is counted part of the reported pay, we include profit in the
regression. Those who had profit as part of their received pay earned much more than those did
not. In particular, the difference is 50.0% for males and 72.3% for females.
In summary, these above factors explain 14.4% variance in male’s pay and 29.8% variance in
female’s pay.
• Decomposition
Following Oaxaca (1973) and Newmark (1988), we use three different specifications to analyze
the composition of gender pay differential by splitting the total gender pay differential into two
components: the differential attributable to gender difference in observable characteristics, and
the residual gap which might be due to discrimination or gender differences in unobserved
productive characteristics.
The functions work as following:
lnYM lnYF XM XF βM βM βF XF (1)
15

lnYM lnYF XM XF βF βM βF XM (2)
lnYM lnYF XM XF βP βM βP XM βF βP XF (3)
The first term on the right hand side of equation (1)-(3) represents the explained portion. The
residual or “unexplained” includes differences in the returns to worker and workplace
characteristics, calculated in the second term for equation (1) and (2), and the last two terms for
equation (3). Equation (1) is male base decomposition, using male pay structure as baseline. In
particular, the first term in equation (1) is that portion of the pay differential attributable to
differences in the average productive and other characteristics is multiplied by the estimated
coefficients form the men’s regression. These coefficients are interpreted as the men’s pay
structure. The second term on the right hand side is that portion of the pay differential
attributable to the differences in the male and female regression coefficients, which is the
unexplained residuals, or called “discrimination effect” by some researchers who believe that
discrimination exists (Weichselbaumer & Winter-Ebmer, 2006). In Equation (2), the differences
in the mean characteristics between men and women are valued according to the female return,
which assumes that the female pay structure would prevail in the absence of discrimination.
Equation (3) represents a pooled decomposition model, which regards the non-discriminatory
pay structure that was estimated using the regression coefficients from a pooled male-female pay
regression as baseline.
As shown in table 4, three decomposition methods were employed to decompose the gender pay
gap into a portion explained by the model variables and a portion that remains unexplained by
the model variables. Several findings are worth noting.
16

First, when firm characteristics are excluded (simple model), three decomposition methods
consistently show that gender differences in the coefficients tend to dominate gender differences
in characteristics. For instance, the male base yields an estimate of about 78.8 percent and the
pooled method estimate is 81.8 percent. The female base method yields the largest unexplained
component compared to the male base and pooled method (96.0 percent). As a result, three
methods produce the adjusted gender pay ratio ranging from 69 to 74 percent. This result
indicates that if men and women held the same individual characteristics, whether they were paid
according to male pay structure, female pay structure or the general (pooled) pay structure,
women would be paid about 3/4 of men’s pay.
Second, when firm characteristics are included, two of the three decomposition methods (male
base model and pooled model) produce similar results. In particular, 78 to 82 percent of the
gender pay differential remains unexplained, and the adjusted gender pay ratio is around 75 to 77
percent. In contrast, female base model yields a higher unexplained portion (95 percent) and
lower adjusted differential (72 percent).
Third, it is interesting to note that when female base method is used to decompose the gender pay
gap, the unexplained portion decreased from 96.0 percent to 37.5 percent as firm characteristics
variables are included. This indicates that if female base model is regarded as the non-
discriminatory pay structure, a substantially additional portion (58.5%) of the gender pay
differential could be explained if men were paid through female pay structure after controlling
for the firm characteristics, showing that the women are paid less probably because they are
sorted to firms that have less payment capacity.
17

Next, we focus on the results from the male based-decomposition since it provided the most
useful comparison to the existing literature on the China gender pay differential, and also we
believe that in Chinese labour markets the male pay structure is more likely to be prevailing and
non-discriminatory than the female structure (Hughes and Maurer-Fazio, 2002). We separate our
estimation interpretation into two parts: characteristics effects and coefficient effects.
Earlier studies have shown that Oaxaca decomposition of wage differentials is not invariant to
the choice of reference group when dummy variables are used. In particular, although the sum of
the contributions of the single indicator variables, that is, the total contribution of the categorical
variables is invariant to the choice of reference group, the detailed coefficients effects attributed
to dummy variables are not invariant to the choice of the omitted group (Oaxaca and Ransom,
1999). Changing the reference category not only alters the results for the singly dummy variables
but also changes the sum of the coefficients effect of the categorical variables. Several solutions
have been proposed to deal with this identification problem, such as Nielsen (2000), Gardeazabal
and Ugidos (2005) and Yun (2005). Nielsen’s method is not suitable for this particular analysis
as it cannot distinguish the constant term from dummy variables and become cumbersome if
there are several sets of dummy variables. GU method and Yun’s method bear the same idea that
is to restrict the coefficients for the single categories to sum to zero, that is, to express effects as
deviations from the grand mean. In GU method, the dummy variables are transformed by
implementing restricted least squares estimation before model estimation (Gardeazabal and
Ugidos, 2005). More conveniently, in Yun’s method, standard dummy coding is used for model
estimation, and then one can transform the coefficients vectors so that deviations from the grand
mean are expressed and the coefficient for the base category is added (Yun, 2005). When these
methods are applied to such transformed estimates, the results of the decomposition are
18

unaffected by the choice of the reference category. In the following analysis, we use Yun(2005)
to apply the transformation of dummy variables sets and report the contribution of a categorical
predictor to the unexplained part of the decomposition.
The results are shown in table 5. The first panel of table 5 describes the breakdown of the
proportions explained by each set of explanatory variables. The characteristics of firm account
for more of gender pay differential than the individual characteristics. When both individual and
firm characteristics are included, gender differences in individual characteristics account for 9.5
percent and differences in the firm characteristics account for 33.0 percent of the difference in
the pay men and women receive. This finding suggests that firm characteristics account for a
substantial part of gender pay differential. Further, the concentration of female executives in
smaller firms tends to be the driving force behind the explained component of the gender pay gap.
About 27.6 percent of the gender pay gap is explained by the firm size, as measured by the
registered capital. Other variables that contribute substantially to the gender pay gap are marital
status, which explains about 10.7 percent of the gender pay differentials, and business training,
which accounts for 12.0 percent.
The second panel illustrated the coefficient effects. About half (54.4%) of the total wage
differential is due to unobservable differences between men and women or discrimination. In
particular, workplace characteristics account for 64.9%, group membership accounts for 55.9%,
while the negative sign of “individual characteristics” seems to indicate that men were actually
discriminated on their individual characteristics as a whole. However, further examination shows
that although men were treated unfavorably than women with same job tenure and education,
women did received discrimination on all other individual characteristics. For example, a large
portion (19.8%) of the gender pay differential comes from the different treatment of men and
19

women with the same CPP membership status. The discrimination effects on firm characteristics
are more obvious. The fact that female leaders managing firms of the same size as males
received less pay than male leaders explains 78.3% of the gender pay differential.
20

Table 1: Summary StatisticsTotal Male Female t‐Value
Variable Mean Std. Dev. Mean Std. Dev. Mean Std. Dev.
Pay (Unit: 10,000 Yuan) 22.82 70.11 24.64 76.72 16.24 37.01 1.19Registered Capital (Unit: 10,000 Yuan) 274.33 1018.34 280.53 1015.99 251.89 1030.59 0.28Number of employees/100 0.77 2.46 0.90 2.75 0.31 0.62 2.42Age 43.29 8.68 44.13 8.81 40.26 7.47 4.51Job tenure 8.84 6.66 9.34 6.99 7.01 4.92 3.52President 0.65 0.48 0.68 0.47 0.55 0.50 2.77Service Sector 0.32 0.47 0.29 0.46 0.40 0.49 ‐2.42Educatoin (less than high school)
High School 0.23 0.42 0.23 0.42 0.24 0.43 ‐0.29College, University or higher 0.57 0.50 0.57 0.50 0.57 0.50 ‐0.11
Business Training 0.54 0.50 0.57 0.50 0.44 0.50 2.56Married 0.90 0.30 0.93 0.26 0.82 0.39 3.75CPP Member 0.31 0.46 0.33 0.47 0.24 0.43 1.91Firm Tenure (years since established) 8.32 7.01 8.50 7.37 7.66 5.48 1.19Profit as Part of Compensation 0.14 0.35 0.15 0.36 0.10 0.31 1.43Obs 582 456 126Note:
21

Table 2 Regression of ln(pay) on enterprise characteristics and CEO individual characteristics
(1) (2) (3) (4) (5) (6) (7) (8) (9)VARIABLES lnpay lnpay lnpay lnpay lnpay lnpay lnpay lnpay lnpay
female ‐0.325** ‐0.316** ‐0.311** ‐0.304** ‐0.266** ‐0.220* ‐0.227* ‐0.198 ‐0.159(0.132) (0.133) (0.134) (0.133) (0.132) (0.128) (0.129) (0.129) (0.129)
age ‐0.009 ‐0.009 ‐0.005 ‐0.007 ‐0.012* ‐0.011* ‐0.012* ‐0.011*(0.007) (0.007) (0.007) (0.007) (0.007) (0.007) (0.007) (0.007)
jobtenure 0.102*** 0.101*** 0.105*** 0.104*** 0.107*** 0.110*** 0.105*** 0.096***(0.024) (0.024) (0.024) (0.023) (0.023) (0.024) (0.024) (0.024)
jobtenure2 ‐0.003*** ‐0.003*** ‐0.003*** ‐0.003*** ‐0.003*** ‐0.003*** ‐0.003*** ‐0.003***(0.001) (0.001) (0.001) (0.001) (0.001) (0.001) (0.001) (0.001)
married 0.107 0.087 0.051 0.069 0.068 0.095 0.134(0.188) (0.186) (0.184) (0.179) (0.180) (0.180) (0.178)
party ‐0.083 ‐0.138 ‐0.202* ‐0.219* ‐0.225* ‐0.218* ‐0.219*(0.119) (0.121) (0.121) (0.118) (0.119) (0.118) (0.117)
high school 0.447*** 0.377** 0.318** 0.313** 0.313** 0.338**(0.163) (0.162) (0.158) (0.159) (0.158) (0.157)
two years college 0.444*** 0.293** 0.174 0.168 0.177 0.259*(0.144) (0.147) (0.145) (0.145) (0.145) (0.145)
business training 0.448*** 0.272** 0.271** 0.261** 0.292***(0.113) (0.114) (0.114) (0.114) (0.113)
lncapital 0.197*** 0.201*** 0.204*** 0.208***(0.034) (0.035) (0.035) (0.034)
service 0.096 0.100 0.072(0.113) (0.113) (0.112)
years ‐0.001 ‐0.000 0.000(0.008) (0.008) (0.008)
president 0.218** 0.205*(0.109) (0.108)
profit as part of the p 0.546***(0.151)
Constant 2.003*** 1.852*** 1.785*** 1.275*** 1.257*** 0.802** 0.744** 0.591 0.420(0.061) (0.302) (0.325) (0.363) (0.358) (0.357) (0.364) (0.371) (0.370)
Observations 582 582 582 582 582 582 582 582 582R‐squared 0.010 0.042 0.043 0.061 0.086 0.137 0.138 0.144 0.164Standard errors in parentheses*** p<0.01, ** p<0.05, * p<0.1
22

Table 3 Regression of ln(pay) for males and females seperatelylnpay lnpay
VARIABLES (male) (female)
age ‐0.011 ‐0.012(0.007) (0.016)
jobtenure 0.085*** 0.134**(0.027) (0.067)
jobtenure2 ‐0.002*** ‐0.004(0.001) (0.003)
married 0.366 ‐0.278(0.230) (0.292)
party ‐0.270** 0.043(0.130) (0.290)
high school 0.325* 0.471(0.179) (0.329)
college, university or higher 0.140 0.795**(0.167) (0.307)
business training 0.257** 0.349(0.128) (0.244)
lncapital 0.221*** 0.158**(0.040) (0.070)
service 0.130 ‐0.246(0.131) (0.223)
years ‐0.004 0.007(0.009) (0.023)
president 0.136 0.463**(0.126) (0.223)
profit 0.500*** 0.723**(0.167) (0.363)
Constant 0.391 0.166(0.424) (0.739)
Observations 456 126R‐squared 0.144 0.298Standard errors in parentheses*** p<0.01, ** p<0.05, * p<0.1
23

Table 4 Decomposition gender wage differential
Individual Characteristics Model
Raw Differntial "unexplained" PercentageAdjusted
DifferentialMale Pay Structure as Baseline 0.325 0.256 78.8% 74.4%Female Pay Structure as Baseline 0.325 0.312 96.0% 68.8%Pooled 0.325 0.266 81.8% 73.4%
Expanded Model
Raw Differntial "unexplained" PercentageAdjusted
DifferentialMale Pay Structure as Baseline 0.325 0.166 51.1% 83.4%Female Pay Structure as Baseline 0.325 0.122 37.5% 87.8%Pooled 0.325 0.159 48.9% 84.1%
24
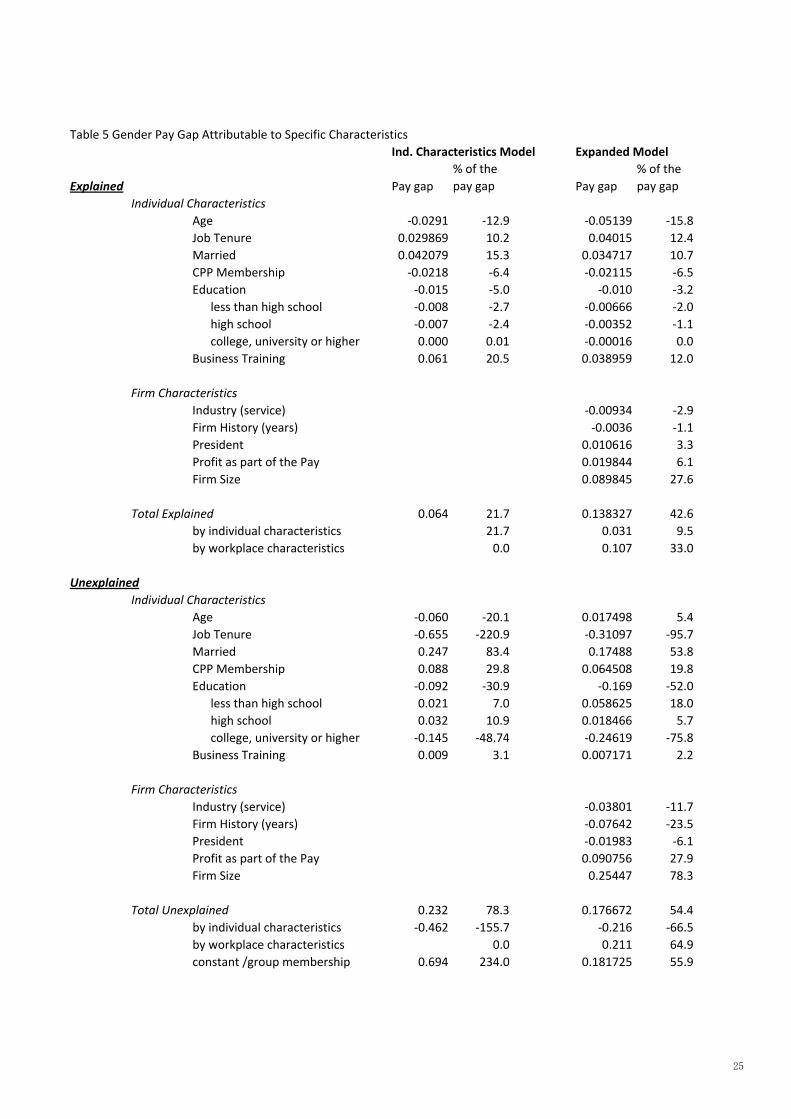
Table 5 Gender Pay Gap Attributable to Specific CharacteristicsInd. Characteristics Model Expanded Model
Explained Pay gap% of the pay gap Pay gap
% of the pay gap
Individual CharacteristicsAge ‐0.0291 ‐12.9 ‐0.05139 ‐15.8Job Tenure 0.029869 10.2 0.04015 12.4Married 0.042079 15.3 0.034717 10.7CPP Membership ‐0.0218 ‐6.4 ‐0.02115 ‐6.5Education ‐0.015 ‐5.0 ‐0.010 ‐3.2
less than high school ‐0.008 ‐2.7 ‐0.00666 ‐2.0high school ‐0.007 ‐2.4 ‐0.00352 ‐1.1college, university or higher 0.000 0.01 ‐0.00016 0.0
Business Training 0.061 20.5 0.038959 12.0
Firm CharacteristicsIndustry (service) ‐0.00934 ‐2.9Firm History (years) ‐0.0036 ‐1.1President 0.010616 3.3Profit as part of the Pay 0.019844 6.1Firm Size 0.089845 27.6
Total Explained 0.064 21.7 0.138327 42.6by individual characteristics 21.7 0.031 9.5by workplace characteristics 0.0 0.107 33.0
UnexplainedIndividual Characteristics
Age ‐0.060 ‐20.1 0.017498 5.4Job Tenure ‐0.655 ‐220.9 ‐0.31097 ‐95.7Married 0.247 83.4 0.17488 53.8CPP Membership 0.088 29.8 0.064508 19.8Education ‐0.092 ‐30.9 ‐0.169 ‐52.0
less than high school 0.021 7.0 0.058625 18.0high school 0.032 10.9 0.018466 5.7college, university or higher ‐0.145 ‐48.74 ‐0.24619 ‐75.8
Business Training 0.009 3.1 0.007171 2.2
Firm CharacteristicsIndustry (service) ‐0.03801 ‐11.7Firm History (years) ‐0.07642 ‐23.5President ‐0.01983 ‐6.1Profit as part of the Pay 0.090756 27.9Firm Size 0.25447 78.3
Total Unexplained 0.232 78.3 0.176672 54.4by individual characteristics ‐0.462 ‐155.7 ‐0.216 ‐66.5by workplace characteristics 0.0 0.211 64.9constant /group membership 0.694 234.0 0.181725 55.9
25
References
Bertrand, M., & Hallock, K. F. (2001). The gender gap in top corporate jobs. Industrial &
Labor Relations Review, 55(1), 3.
Bishop, J. A., Luo, F., & Wang, F. (2005). Economic transition, gender bias, and the
distribution of earnings in china. The Economics of Transition, 13(2), 239-259.
Buck, T., Liu, X., & Skovoroda, R. (2008). Top executive pay and firm performance in
china. Journal of International Business Studies, 39(5), 833.
Conyon, M. J., & Murphy, K. J. (2000). The prince and the pauper? CEO pay in the
unites states and united kingdom. The Economic Journal, 110(467), F640.
Core, J. E., Holthausen, R. W., & Larcker, D. F. (1999). Corporate governance, chief
executive officer compensation, and firm performance. Journal of Financial
Economics, 51(3), 371.
Devers, C. E., JR, A. A. C., Reilly, G. P., & Yoder, M. E. (2007). Executive
compensation: A multidisciplinary review of recent developments. Journal of
Management, 33(6), 1016.
Ding, D. Z., Akhtar, S., & Ge, G. L. (2006). Organizational differences in managerial
compensation and benefits in chinese firms. The International Journal of Human
Resource Management, 17(4), 693.
26

Doris, W. E. I. C. H. S. E. L. B. A. U. M. E. R., & Winter-Ebmer, R. (2006). Rhetoric in
economic research: The case of gender wage differentials. Industrial Relations,
45(3), 416.
Drolet, M. (2002). Can the workplace explain canadian gender pay differentials?
Canadian Public Policy, 28, S41.
Firth, M., Fung, P. M. Y., & Rui, O. M. (2007). How ownership and corporate
governance influence chief executive pay in china's listed firms*. Journal of
Business Research, 60(7), 776.
Gardeazabal, J., and Ugidos, A. (2005). More on identification in detailed wage
decompositions. Review of Economics and Statistics, 86(4), 1034.
Groves, T., Hong, Y., McMillan, J., & Naughton, B. (1995). China's evolving managerial
labor market. The Journal of Political Economy, 103(4), 873.
Gustafsson, B., & Li, S. (2000). Economic transformation and the gender earnings gap in
urban china. Journal of Population Economics, 13(2), 305.
Kato, T., & Long, C. (2006). Executive compensation, firm performance, and corporate
governance in china: Evidence from firms listed in the shanghai and shenzhen stock
exchanges. Economic Development and Cultural Change, 54(4), 945.
27

Khan, A.R. (1996), The impact of recent macroeconomic and sectoral changes on the
poor and women in China. ILO Regional Office for Asia and the Pacific,
http://www.ilo.org/public/english/region/asro/bangkok/paper/pov_all.htm
Lam, S. S. K., & Dreher, G. F. (2004). Gender, extra-firm mobility, and compensation
attainment in the united states and hong kong. Journal of Organizational Behavior,
25(7), 791.
Liu, P., Meng, X., & Zhang, J. (2000). Sectoral gender wage differentials and
discrimination in the transitional chinese economy. Journal of Population
Economics, 13(2), 331.
Maurer-Fazio, M., & Hughes, J. (2002). The effects of market liberalization on the
relative earnings of chinese women. Journal of Comparative Economics, 30(4), 709-
731.
Maurer-Fazio, M., Rawski, T. G., & Zhang, W. (1999). Inequality in the rewards for
holding up half the sky: Gender wage gaps in china's urban labour market, 1988-
1994. The China Journal, (41), 55-88.
Meng, X. (1998). Gender occupational segregation and its impact on the gender wage
differential among rural-urban migrants: A chinese case study. Applied Economics,
30(6), 741.
28

Mengistae, T., & Xu, L. C. (2004). Agency theory and executive compensation: The case
of chinese state-owned enterprises. Journal of Labor Economics, 22(3), 615.
Nielsen, H.S. (2000) Wage discrimination in Zamia: an extension of the Oaxaca-Blinder
decomposition.” Applied Economics Letters, 7(6), 405.
Ng, Y. C. (2007). Gender earnings differentials and regional economic development in
urban china, 1988-97. The Review of Income and Wealth, 53(1), 148.
Oaxaca, R. L., & Ransom, M. R. (1999). Note: Identification in detailed wage
decompositions. The Review of Economics and Statistics, 81(1), 154.
Qian, J. (1996). Gender wage differentials in urban china in the 1990s. (Ph.D., State
University of New York at Binghamton).
Rozelle, S., Dong, X., Zhang, L., & Mason, A. (2002). Gender wage gaps in post-reform
rural china. Pacific Economic Review, 7(1), 157-179.
Shu, X., & Bian, Y. (2003). Market transition and gender gap in earnings in urban china*.
Social Forces, 81(4), 1107.
Wang, M., & Cai, F. (2008). Gender earnings differential in urban china. Review of
Development Economics, 12(2), 442.
Xu, L. (2004). Types of large shareholders, corporate governance, and firm performance.
Working paper, Zhongshan University.
29

Yun, M. (2005). A simple solution to the identification problem in detailed wage
decompositions. Economic Inquiry, 43(4), 766.
Zhang, J., Han, J., Liu, P., & Zhao, Y. (2008). Trends in the gender earnings differential
in urban china, 1988-2004. Industrial & Labor Relations Review, 61(2), 224.
Zhu, J. (2007). The empirical study on the effect factor of top management remuneration
in china. Journal of American Academy of Business, Cambridge, 11(2), 213.
30