Embed Size (px)
Citation preview
Managerial Economics & Business Strategy
Chapter 5The Production Process and Costs
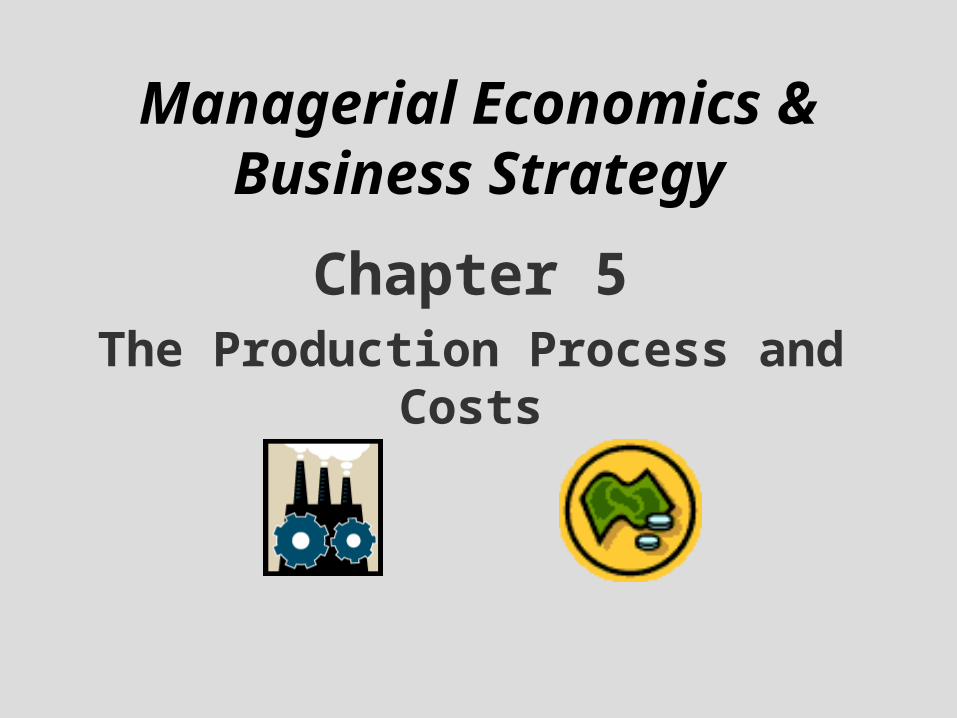
Switching to the Long Run• Now…K and L are both variable• Can plot out optimal choices for K and L
Called firm expansion path Best possible input choices when can vary all inputs

In SR constrained by capacity…
• Why?? Can’t change firm size LR can decrease costs to a greater extent because can change all
factors of production
Short Run vs. Long Run
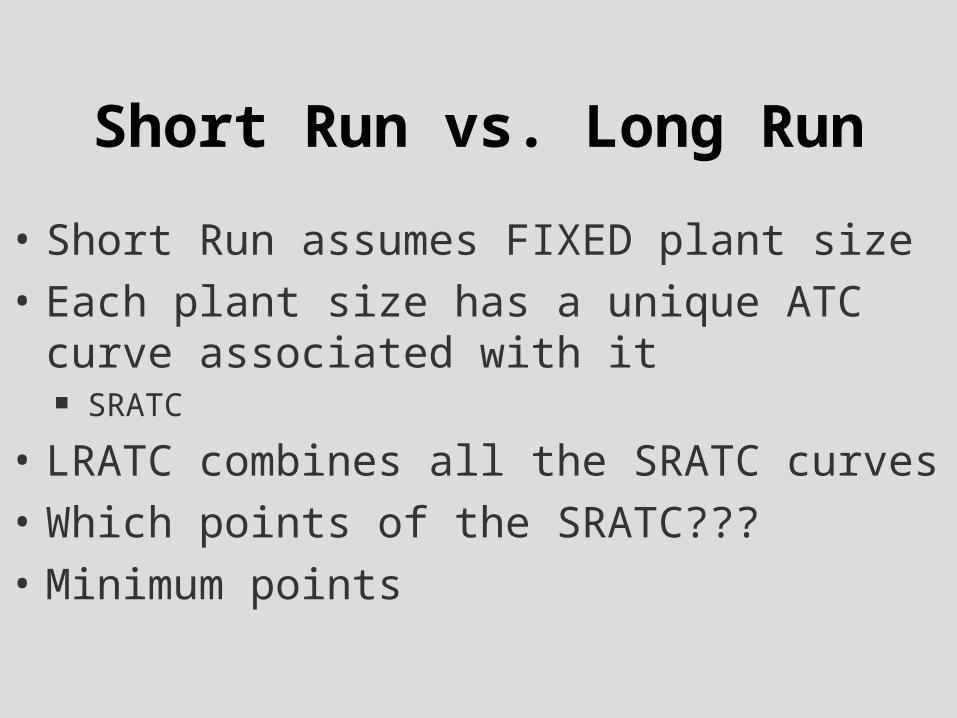
• Short Run assumes FIXED plant size• Each plant size has a unique ATC curve associated
with it SRATC
• LRATC combines all the SRATC curves• Which points of the SRATC???• Minimum points
Why minimum?
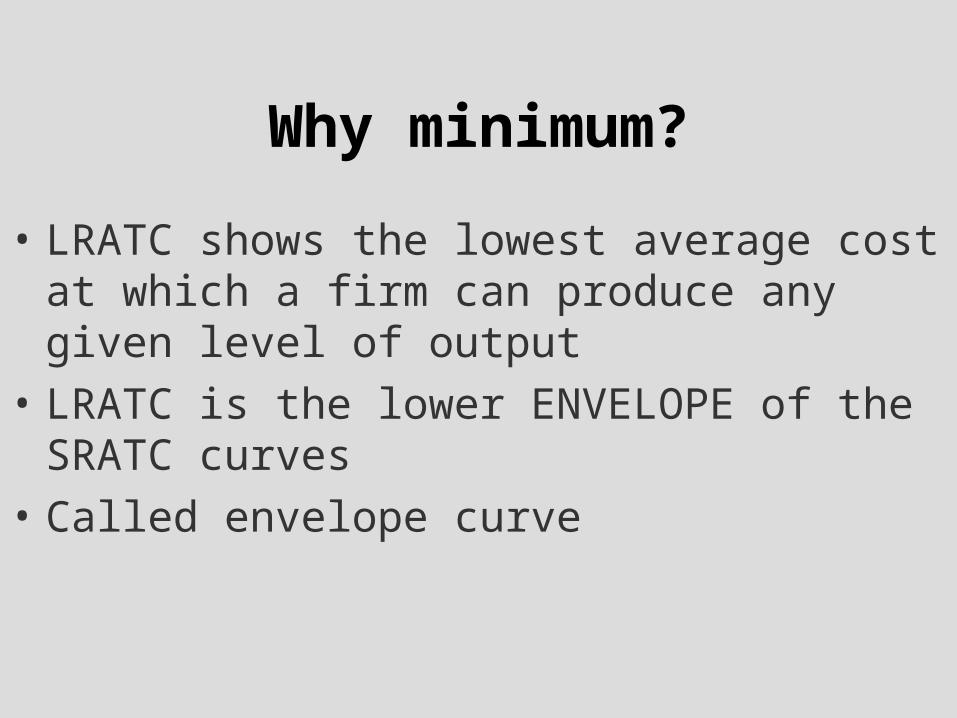
• LRATC shows the lowest average cost at which a firm can produce any given level of output
• LRATC is the lower ENVELOPE of the SRATC curves
• Called envelope curve
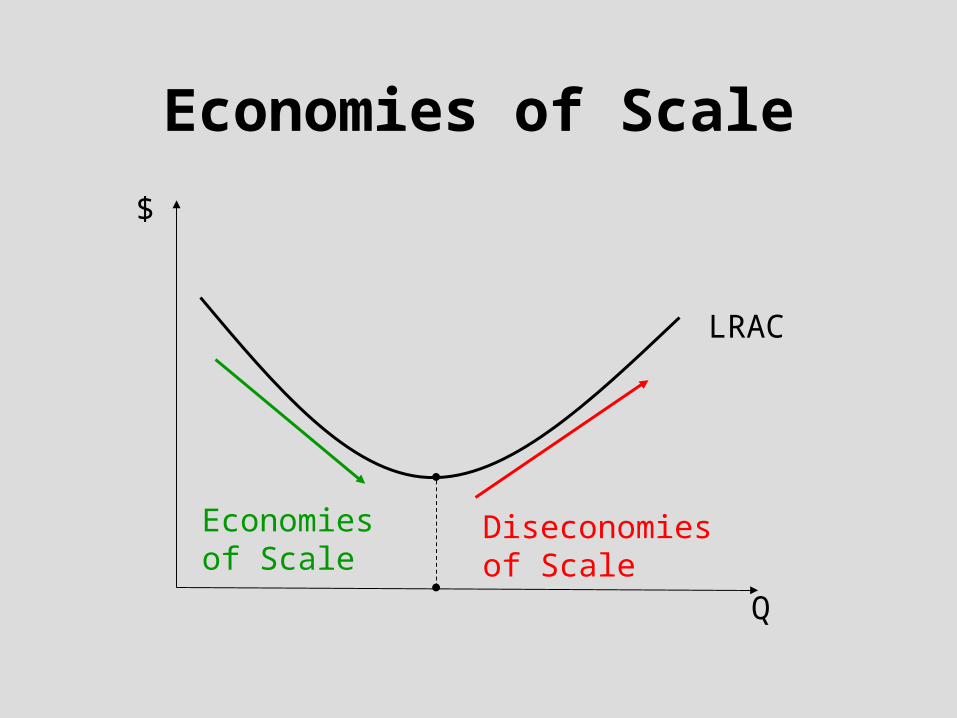
Economies of Scale
LRAC
$
Q
Economiesof Scale
Diseconomiesof Scale
Multi-Product Cost Function
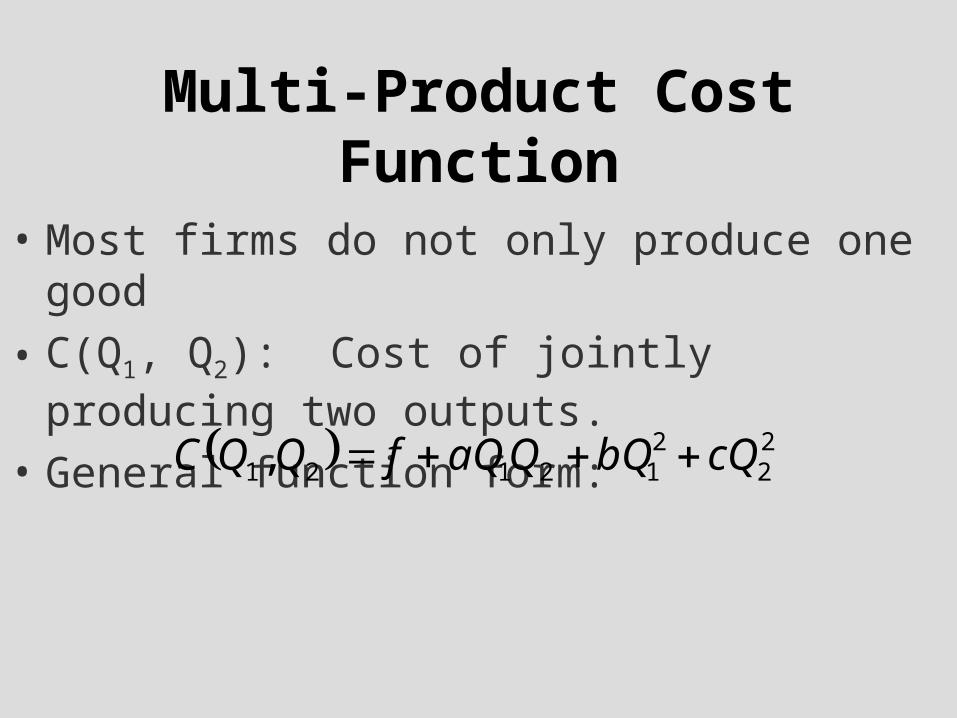
• Most firms do not only produce one good• C(Q1, Q2): Cost of jointly producing two outputs.• General function form:
22
212121, cQbQQaQfQQC
Economies of Scope
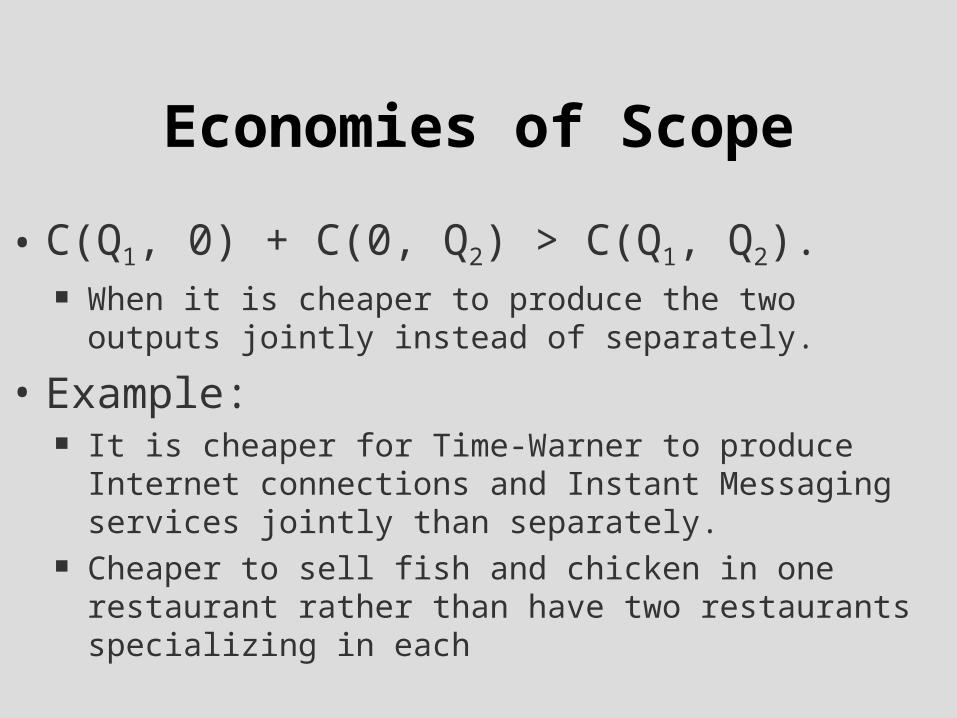
• C(Q1, 0) + C(0, Q2) > C(Q1, Q2). When it is cheaper to produce the two outputs jointly instead of
separately.
• Example: It is cheaper for Time-Warner to produce Internet connections and
Instant Messaging services jointly than separately. Cheaper to sell fish and chicken in one restaurant rather than have
two restaurants specializing in each
Cost Complementarity
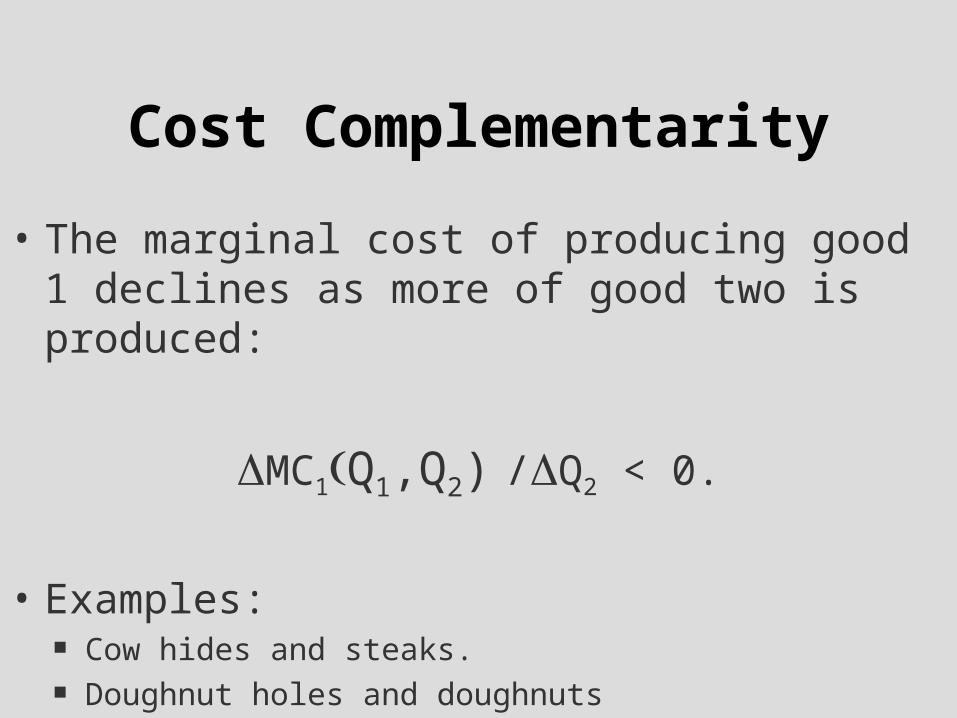
• The marginal cost of producing good 1 declines as more of good two is produced:
MC1Q1,Q2) /Q2 < 0.
• Examples: Cow hides and steaks. Doughnut holes and doughnuts
Quadratic Multi-Product Cost Function
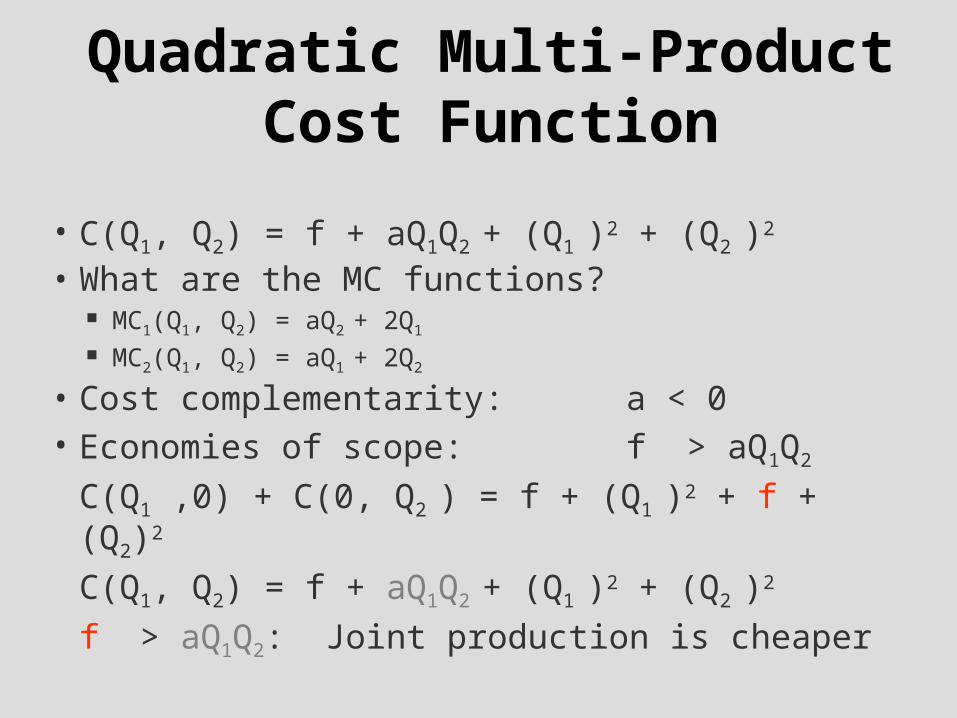
• C(Q1, Q2) = f + aQ1Q2 + (Q1 )2 + (Q2 )2 • What are the MC functions?
MC1(Q1, Q2) = aQ2 + 2Q1 MC2(Q1, Q2) = aQ1 + 2Q2
• Cost complementarity: a < 0• Economies of scope: f > aQ1Q2
C(Q1 ,0) + C(0, Q2 ) = f + (Q1 )2 + f + (Q2)2 C(Q1, Q2) = f + aQ1Q2 + (Q1 )2 + (Q2 )2 f > aQ1Q2: Joint production is cheaper
A Numerical Example:
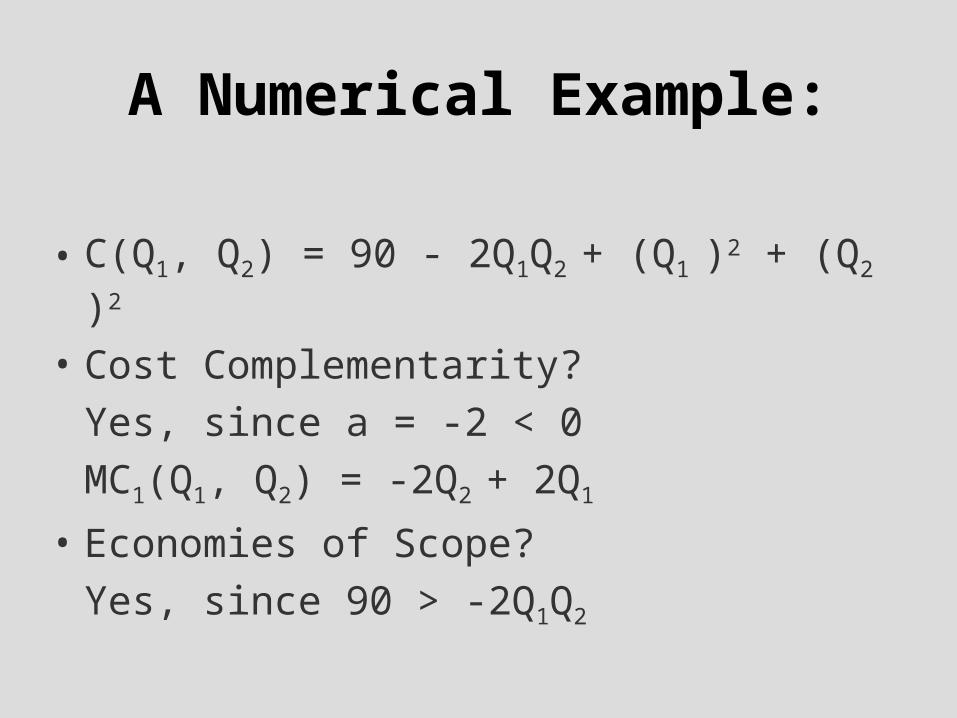
• C(Q1, Q2) = 90 - 2Q1Q2 + (Q1 )2 + (Q2 )2 • Cost Complementarity?
Yes, since a = -2 < 0MC1(Q1, Q2) = -2Q2 + 2Q1
• Economies of Scope?Yes, since 90 > -2Q1Q2

Chapter 5 homework
Numbers: 4, 5, 6, 13 and, 17

Managerial Economics & Business Strategy
Chapter 6The Organization of the Firm
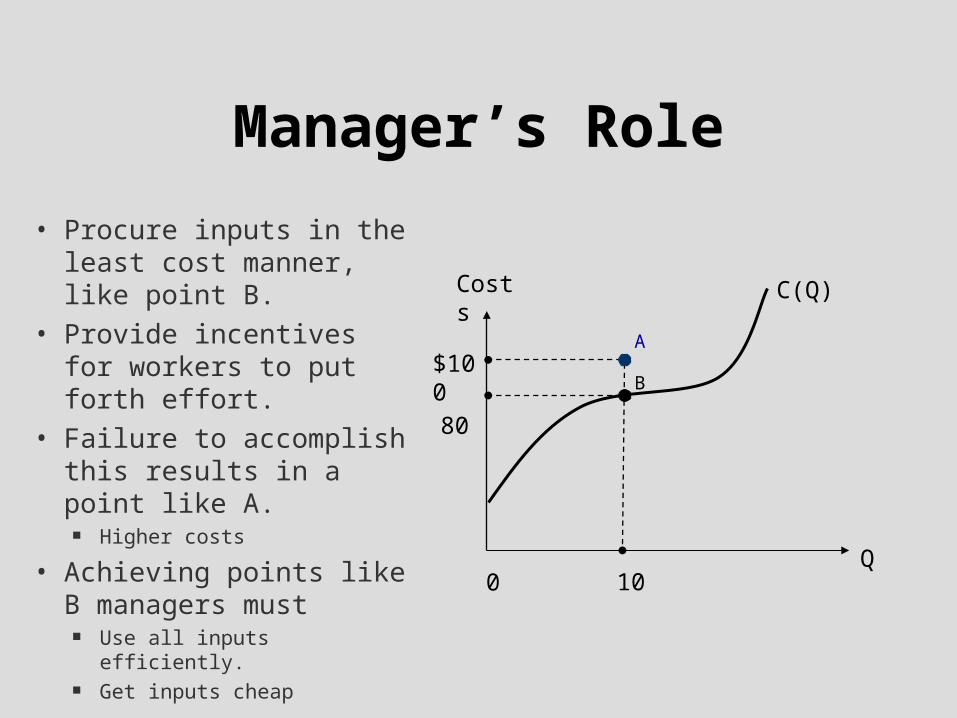
Manager’s Role• Procure inputs in the least
cost manner, like point B.• Provide incentives for
workers to put forth effort.• Failure to accomplish this
results in a point like A. Higher costs
• Achieving points like B managers must
Use all inputs efficiently. Get inputs cheap
$100 80
100Q
Costs
A
B
C(Q)
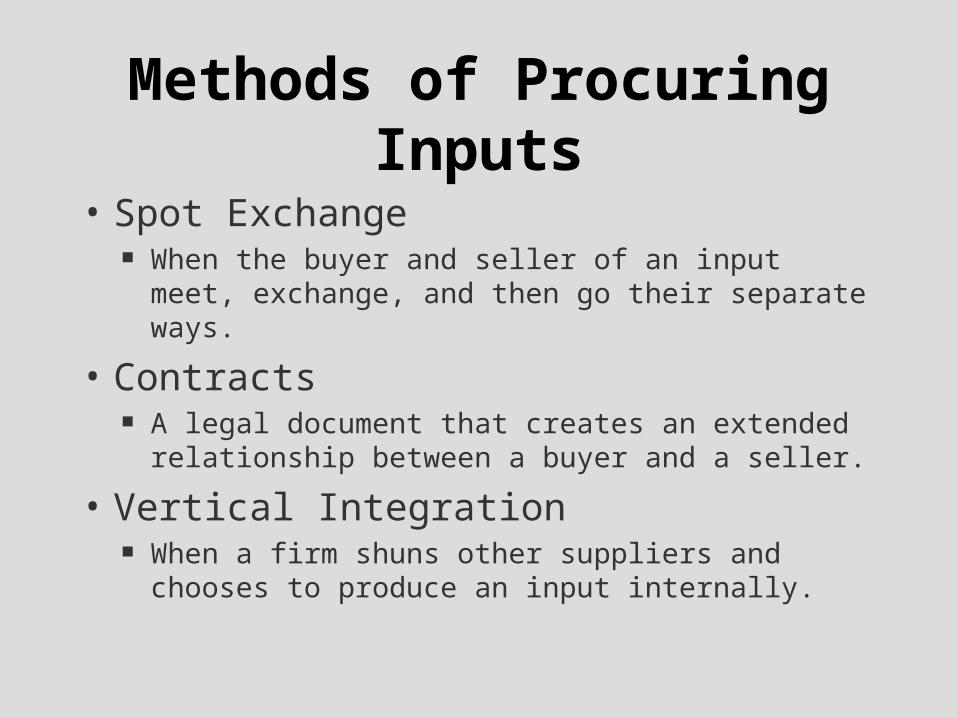
Methods of Procuring Inputs• Spot Exchange
When the buyer and seller of an input meet, exchange, and then go their separate ways.
• Contracts A legal document that creates an extended relationship
between a buyer and a seller.
• Vertical Integration When a firm shuns other suppliers and chooses to
produce an input internally.
![TRIUMPHS Student Projects: Detailed Descriptions ...webpages.ursinus.edu/nscoville/TRIUMPHS_project_descriptions15.pdfCurves) [23]. In an appendix to this work, Cramer tackles the](https://img.pdfslide.us/doc/110x75/606b2ee977e64c6c25736b2a/triumphs-student-projects-detailed-descriptions-curves-23-in-an-appendix.jpg)


![Lecture 24: Code Optimizationcs164/fa20/lectures/lecture24.pdfLecture 24: Code Optimization [AdaptedinpartfromnotesbyR.BodikandG.Necula] Lastmodified: WedNov1818:56:222020 CS164:Lecture#24](https://img.pdfslide.us/doc/110x75/61495b0a080bfa6260148e8c/lecture-24-code-optimization-cs164fa20lectureslecture24pdf-lecture-24-code.jpg)