Embed Size (px)
Citation preview

≈√
O e s t e r r e i c h i s c h e Nat i ona l b a n k
W o r k i n g P a p e r 9 6
Managerial Behavior and Cost/Profit
Efficiency in the Banking Sectors of
Central and Eastern European Countries
Stefania P. S. Rossi, Markus Schwaiger, Gerhard Winkler
Editorial Board of the Working Papers Eduard Hochreiter, Coordinating Editor Ernest Gnan, Guenther Thonabauer Peter Mooslechner Doris Ritzberger-Gruenwald
Statement of Purpose The Working Paper series of the Oesterreichische Nationalbank is designed to disseminate and to provide a platform for discussion of either work of the staff of the OeNB economists or outside contributors on topics which are of special interest to the OeNB. To ensure the high quality of their content, the contributions are subjected to an international refereeing process. The opinions are strictly those of the authors and do in no way commit the OeNB.
Imprint: Responsibility according to Austrian media law: Guenther Thonabauer, Secretariat of the Board of Executive Directors, Oesterreichische Nationalbank Published and printed by Oesterreichische Nationalbank, Wien. The Working Papers are also available on our website: http://www.oenb.at

Editorial
In this paper, the authors analyze cost and profit efficiency level and the managerial behavior of banks in nine Central and Eastern European countries (the Czech Republic, Estonia, Hungary, Latvia, Lithuania Poland, Romania, Slovakia and Slovenia), providing cross-country and time series evidence on the period 1995-2002. A stochastic frontier analysis based on a Fourier flexible form indicates a generally low level of cost efficiency and an even lower level of profit efficiency. However, the authors also find significant differences among countries and some evidence of an increasing tendency over time in profit efficiency and, to an even stronger extent, in cost efficiency. Cost and profit efficiency scores are negatively correlated both on a country wide as well as on a bank by bank basis. Furthermore, instead of just looking at the determinants of cost and profit efficiency (e.g. asset quality, problem loans and risk), they test several hypotheses of managerial behavior using the Granger causality approach based on the inter-temporal relation between bank efficiency, capitalization and problem loans, as proposed by Berger and DeYoung (1997). Even though a static analysis shows a negative correlation between problem loan and efficiency, the authors find no evidence of bad management hypothesis. Results provide evidence for the bad luck hypothesis suggesting the exogeneity of bad loans triggering inefficiency.
March 4, 2005


Managerial behavior and cost/profit efficiency in the banking
sectors of Central and Eastern European countries* March 2005
Stefania P. S. Rossia Markus Schwaigerb Gerhard Winklerc
Abstract
This paper analyzes cost and profit efficiency level and the managerial behavior of banks in nine Central and Eastern European countries (the Czech Republic, Estonia, Hungary, Latvia, Lithuania Poland, Romania, Slovakia and Slovenia), providing cross-country and time series evidence on the period 1995-2002. A stochastic frontier analysis based on a Fourier flexible form indicates a generally low level of cost efficiency and an even lower level of profit efficiency. However, we also find significant differences among countries and some evidence of an increasing tendency over time in profit efficiency and, to an even stronger extent, in cost efficiency. Cost and profit efficiency scores are negatively correlated both on a country wide as well as on a bank by bank basis. Furthermore, instead of just looking at the determinants of cost and profit efficiency (e.g. asset quality, problem loans and risk), we test several hypotheses of managerial behavior using the Granger causality approach based on the inter-temporal relation between bank efficiency, capitalization and problem loans, as proposed by Berger and DeYoung (1997). Even though a static analysis shows a negative correlation between problem loan and efficiency, we find no evidence of bad management hypothesis. Results provide evidence for the bad luck hypothesis suggesting the exogeneity of bad loans triggering inefficiency.
JEL classification: G21; G28; C14; D21. Keywords: Cost and profit efficiency; CEECs; Stochastic frontier analysis; Managerial behavior. ________________________________________________________________________ a Stefania P.S. Rossi is professor of Economics at the Faculty of Economics, University of
Cagliari, Italy, and at the Department of Economics, University of Vienna. b Markus Schwaiger is a member of staff of the Financial Markets Analysis and
Surveillance Division, Oesterreichische Nationalbank (OeNB) and assistant professor at the department of corporate finance, Vienna University of Economics and Business Administration.
c Gerhard Winkler is a member of staff of the Credit Division, Oesterreichische Nationalbank (OeNB).
* The authors would like to thank the Foreign Research Division of the Oesterreichische
Nationalbank and in particular Zoltan Walko for the provision of aggregate data for CEE markets as well as the participants of the Economic Studies Division Workshop 2/2004, held at the Oesterreichische Nationalbank on July 23, 2004, for helpful comments on a previous version of the work. This version of the paper has also benefited from an anonymous referee’s comments. Much of the work was undertaken during Stefania Rossi’s working visit at the Economic Studies Division of the Oesterreichische Nationalbank (OeNb).

1
1 Introduction
This paper aims at investigating the state and evolution of banking efficiency in Central and
Eastern European countries (CEECs) with a focus on countries that have recently acceded or
are in the process of accession to the European Union. The swift changes in the financial
system following the collapse of the centrally planned economic systems, its catching up with
EU levels and the overall transition towards a market economy make the banking systems of
these countries a distinct field of research.
The analysis of banks’ efficiency levels continues to be important from both a
macroeconomic and a microeconomic point of view as is documented by its long tradition in
literature.1 From the micro perspective, the issue of banking efficiency is crucial, especially
for transition economies of Eastern Europe, given increasing competition and strong presence
of foreign banks in these countries, which, render the issue of reducing the underperformance
of the banking sector one of the main priority for the financial sector. From the macro
perspective, the efficiency of the banking sector influences the costs of financial
intermediation and the overall stability of the financial markets. For CEECs improvements in
banking can have a significant impact on the allocation of financial resources since this sector
remains still the most important source of financing private investment of firms, given the
underdevelopment of the financial markets (see Caviglia et al., 2002).
In line with the huge block of literature on banking efficiency in OECD countries, a fairly
large amount of studies deals with banking in transition economies in CEE2. The application
of cost efficiency frontier techniques in the empirical literature for the transition countries of
Eastern Europe has been largely focused on analysis based on a single country, such as Kraft
and Tirtiroglu (1998) on Croatia, Opiela (2000) and Nikiel and Opiela (2002) on Poland, or
Taci and Zampieri (1998) on the Czech Republic, as well as Hasan and Marton (2003) on the
Hungarian experience. A recent bulk of empirical contributes have dealt with cross country-
comparisons for CEECs. In this stream Bonin et al. (2005), Green et al. (2004) and Weill
(2003) analyze the effect of bank privatization on efficiency in selected Eastern European
transition countries (the Czech Republic and Poland). Fries and Taci (2005) and Fries et al.
(2002) also investigate the efficiency/performance of a sample of banks in transition
economies. Zajc (2004) focuses on differences between foreign and domestic banks relying
on the methodology of Claessens et. al (2001). Berglöf and Bolton (2002) as well as Fries and 1 For an overview see e.g. Berger and Mester (1997). 2 See the IMF report (2000); Thimann (2002); ECB (2004). Furthermore, a well-structured overview of recent
developments in CEE banking markets can be found in Balling et al. (2004).
2
Taci (2002) deal with the effect of macroeconomic stabilization and institutional reform on
the banking system. Buch (2000) compares interest rate spreads across three CEE countries
(Hungary, Poland and the Czech Republic). Weill (2004) compares efficiency of banks from
Western countries and Eastern European countries testing different hypothesises to explain
the performance gap between them.
One of the focus of these recent contributes was to explain variation in efficiency across
CEECs banks in terms of their ownership yielding often mixed or inconclusive results: Bonin
et al. (2005) find that privatization by its self is not sufficient to increase bank efficiency on a
sample of banks from eleven transition countries. Fries and Taci (2005) find, for a sample of
banks in fifteen transition economies, that there is no significant evidence that privatization or
major foreign ownership has a direct effect in boosting cost efficiency. Hasan and Marton
(2003) provide evidence that higher bank foreign ownership are associated with higher
efficiency in the Hungarian banking sector; Weill (2003) finds for the Czech Republic and
Poland that foreign owned banks are more efficient than domestic-owned banks. Weill (2004)
suggests that the gap between efficiency level of CEECs banks and Western banks could be
due more to the poor management behavior, than the ownership structure.
The reason why a different ownership form can lead to a different efficiency level of banks
refers mainly to the principal-agent framework: managers in foreign owned or privatized
institutions are supposed to be more constraint by capital market discipline. On the contrary, a
lack of owners’ control makes management more free to pursue its own agenda and few
incentives to be efficient3. However, as pointed out also in Williams (2004), the target of this
bank ownership literature is to prove that financial institutions organized under one ownership
model are more/less efficient than banks organized in a different way. Ownership approach
could therefore provide useful suggestions for policy and bank regulation, it does however not
help in understanding how managerial behavior could affect efficiency. In other words, the
link between ownership and efficiency implicitly assumes a different behavior of management
but does not say how managerial behavior directly affects performance and efficiency of
banks.
The literature on the link between managerial behavior and efficiency is still limited (see
Berger, 1995; Mester, 1996; Berger and De Young, 1997; Berger and Hannan, 1998;
DeYoung et al., 2001; Williams, 2004) and to the best of our knowledge not applied to the
case of CEECs.
3 See Altunbas et al. (2001) for an extensive discussion on the issue.

3
By using data on risk and asset quality of CEECs banks we would provide evidence on this
issue by checking the link between managerial behavior and efficiency of banks.
Therefore, the purpose of our paper is to contribute to the existing literature in two ways:
a) after having extensively analyzed the evolution and the difference in cost and profit scores
across nine CEECs, by using data from 1995 to 2002, we try to verify if the management of
the asset quality and the risk of the bank can explain the cost and profit performance. We base
our investigation on a stochastic frontier model, in which cost and profit function are specified
according the flexible Fourier function (FF) – which has been proved to give a better fit of the
data than the well used Translog function (TL) – and the inefficiency/efficiency term can be
modeled as an explicit function of variables which may influence the firm’s efficiency.
b) Second, on the basis of the indication obtained by the static econometric analysis, we test
whether the management behavior hypothesis could be the cause for the CEECs bank
inefficiency. In order to do so we use the approach proposed by Berger and DeYoung (1997)
based on the Granger causality test, which assumes an inter-temporal relation between
efficiency (cost and/or profit), capitalization and loan loss provisions of the bank. By the
means of these relations, four different kinds of management behaviors could be derived:
the bad management hypothesis (low cost/profit efficiency Granger causes high loan loss
provisions), the skimping hypothesis (high cost/profit efficiency granger causes high loan loss
provisions), the bad luck hypothesis (exogenous shocks in the level of loan loss provisions
Granger cause changes in cost/profit efficiency levels) and the moral hazard hypothesis
(thinly capitalized banks are more prone to risk taking).
The remainder of the paper is organized as follows. Section 2 provides the description of the
data and some stylized facts about the CEECs banking systems. Section 3 describes the
methodologies used in the analysis: in sub-section 3.1. the efficiency analysis approach is
presented; in sub-section 3.2 we describe the specification of cost and profit functions; in 3.3
we present a model for analyzing the determinants of cost and profit (in)efficiency; and in 3.4
we review the econometric model of management behavior. Results are presented in section
4. Conclusions are drawn in section 5.

4
2 Data
Our dataset is composed of single-bank data for CEECs, consisting of annual account data
derived from the financial statements of banks made available through the BankScope
database of Bureau van Dijk and Fitch/Ibca. We use data for the years 1995 to 2002 for the
eight CEECs that joined the EU in the first wave of accession:4 the Czech Republic (CZ),
Hungary (HU), Poland (PL), Slovakia (SK), Slovenia (SI), the three Baltic countries Estonia
(EE), Latvia (LV) and Lithuania (LT) as well as for the Romania (RO) due to join in the
second wave.5 As reliable data on each bank are not available for every year, we obtained an
unbalanced panel dataset consisting of 1170 observations, which refers to a sample of 278
banks belonging to the nine selected CEECs. 6 The distribution of banks across countries is
given in Table 1.
Table 1: Sample size: Banks across Countries Countries CZ EE HU LT LV PL RO SI SK TOTAL
Number of
banks 39 14 33 12 28 72 34 19 27 278
Compared with data from the respective central banks, our sample includes banks that taken
together hold more than 80% of total banking assets in the respective countries and therefore
can be considered highly representative of the CEECs banking sectors.
Before going into more detail on the methodology, it seems worthwhile putting the CEECs’
banking systems as a research field into perspective in terms of its idiosyncrasies.
Overall, the CEE banking market is relatively small. Its total assets (excluding Russia) are
currently well below the total assets encountered in small Western European nations such as
e.g. Austria.7
4 In order to homogenize our sample, we excluded Malta and Cyprus because of their different levels of financial development. 5 We intended to include also Bulgaria and Turkey in our analysis: for lack of data we had to drop the former and for the different recent development in the banking sector, we decided to not include the latter. 6 The raw data required substantial editing to obtain a reliable database for the analysis. In a thorough review process we concentrated on choosing the most appropriate accounting standards (we preferred financial statements using IAS over those using national standards and used consolidated balance sheets whenever they were available), on avoiding double counting of institutions and on converting all the values into a single currency (i.e. USD). Furthermore, we conducted several plausibility checks regarding the completeness and consistency of the individual profit and loss accounts and balance sheets. 7 The Austrian banking sector, as a point of reference, had total assets of EUR 605 billion on an unconsolidated
basis as at the end of 2003 (Source: OeNB).
5
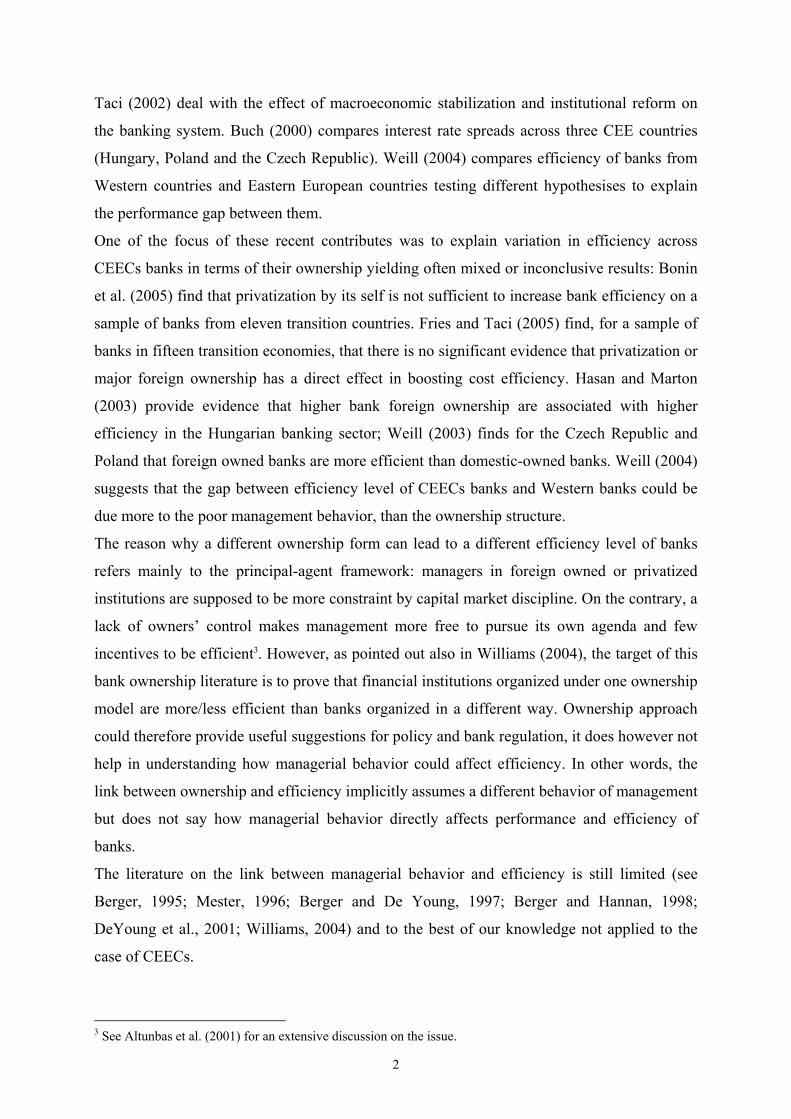
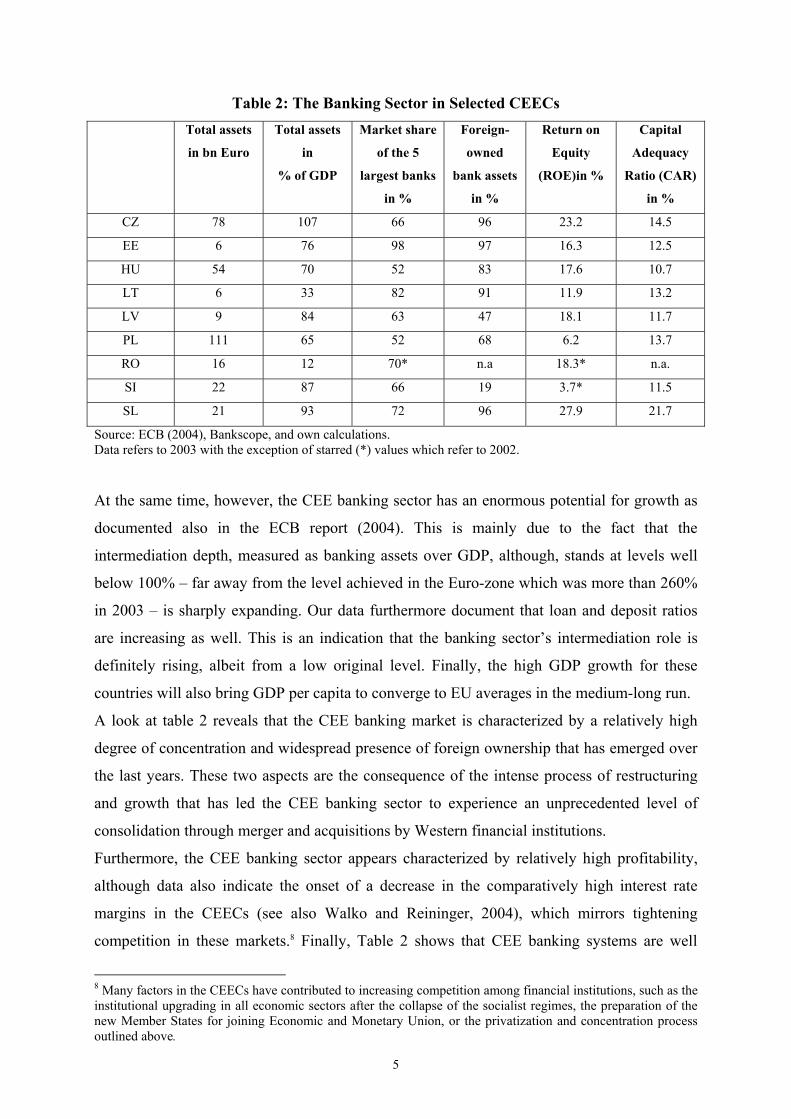
Table 2: The Banking Sector in Selected CEECs
Total assets
in bn Euro
Total assets
in
% of GDP
Market share
of the 5
largest banks
in %
Foreign-
owned
bank assets
in %
Return on
Equity
(ROE)in %
Capital
Adequacy
Ratio (CAR)
in %
CZ 78 107 66 96 23.2 14.5
EE 6 76 98 97 16.3 12.5
HU 54 70 52 83 17.6 10.7
LT 6 33 82 91 11.9 13.2
LV 9 84 63 47 18.1 11.7
PL 111 65 52 68 6.2 13.7
RO 16 12 70* n.a 18.3* n.a.
SI 22 87 66 19 3.7* 11.5
SL 21 93 72 96 27.9 21.7
Source: ECB (2004), Bankscope, and own calculations. Data refers to 2003 with the exception of starred (*) values which refer to 2002. At the same time, however, the CEE banking sector has an enormous potential for growth as
documented also in the ECB report (2004). This is mainly due to the fact that the
intermediation depth, measured as banking assets over GDP, although, stands at levels well
below 100% – far away from the level achieved in the Euro-zone which was more than 260%
in 2003 – is sharply expanding. Our data furthermore document that loan and deposit ratios
are increasing as well. This is an indication that the banking sector’s intermediation role is
definitely rising, albeit from a low original level. Finally, the high GDP growth for these
countries will also bring GDP per capita to converge to EU averages in the medium-long run.
A look at table 2 reveals that the CEE banking market is characterized by a relatively high
degree of concentration and widespread presence of foreign ownership that has emerged over
the last years. These two aspects are the consequence of the intense process of restructuring
and growth that has led the CEE banking sector to experience an unprecedented level of
consolidation through merger and acquisitions by Western financial institutions.
Furthermore, the CEE banking sector appears characterized by relatively high profitability,
although data also indicate the onset of a decrease in the comparatively high interest rate
margins in the CEECs (see also Walko and Reininger, 2004), which mirrors tightening
competition in these markets.8 Finally, Table 2 shows that CEE banking systems are well
8 Many factors in the CEECs have contributed to increasing competition among financial institutions, such as the institutional upgrading in all economic sectors after the collapse of the socialist regimes, the preparation of the new Member States for joining Economic and Monetary Union, or the privatization and concentration process outlined above.

6
endowed with equity, as the Capital Adequacy Ratio (defined as equity capital over risk
weighted assets) shows, which is an indication of the expansion of the banking sector as a
whole, as an equity buffer has to be foreheld in order to finance future expansion.
3 Methodology 3.1 Efficiency Measurement
A production plan is called efficient if it is not possible to produce more with the same input
or to reduce these inputs leaving the output unchanged.9 However, observable real data of
firms often move away from the optimum production plan. This is due to the fact that
production plans and cost/profit levels are not the result of perfectly rational and efficient
decisions: factors such as errors, bad management, lags between the choice of plan and its
implementation, inertia in human behavior and distorted communication may cause what is
called X-inefficiency. In order to get rid of the inefficiency component and isolate the
theoretical frontier, estimation techniques must include some filter device. Two classes of
models have been proposed over time. Whereas deterministic models (Aigner and Chu, 1968;
Afriat, 1972; Richmond, 1974) use the residuals of the production function as a measurement
for inefficiency without controlling random noise, stochastic frontier models (Aigner et al.,
1977; Meeusen and van den Broeck, 1977; Stevenson, 1980; Jondrow et al., 1982; Battese
and Coelli, 1988 and 1992; Coelli et al., 1998; Kumbhakar and Lovell, 2000) disentangle the
error term in two components. The first one, V, corresponds to the random fluctuations
distributed as a normal. The second one, U, accounts for the firm’s inefficiency – e.g. factors
that affect technical or allocative efficiency, which could be controlled by banks – distributed
as a half normal (truncated at zero).
According to the stochastic frontier approach, the total costs/profits (TC and TP) for the s-th
firm at time t assume the following specification:
stststststststst UVPYHPYHH ++=+= ),(),( ε (1)
where H is either TC or TP, Y is a vector of outputs of the firm; P is a vector of input prices; ε
is the stochastic random noise. In the case of profit function (TP) the disturbance term is
specified as Vst – Ust. Following the Battese and Coelli (1988 and 1992) model, the
predictions of individual bank cost/profit efficiency (EFF_H) may then be written as:
9 The duality theory (see e.g. Beattie and Taylor, 1985; and Shephard, 1970) has shown that under given conditions (exogenous prices and optimal behavior of the producer) the property of the production function can be studied indirectly through cost or profit functions.

7
EFF_Hst = E(Hst| Ust, φst)/ E(Hst| Ust=0,φst) (2)
where φst are the regression parameters.
3.2 Cost and Profit Function specifications
In modeling banks’ cost or profit function, one of the most debated questions in literature is
the definition of the inputs and outputs of multi-product financial firms. The discussion
concentrates particularly on the role of deposits, considering that they have both input and
output characteristics. Empirical literature on banking suggests different approaches to this
issue: the most used are the production approach (or value added approach, user cost
approach) and the intermediation approach (or asset approach). The first underlines the role
of financial institutions as providers of services for account holders. This approach argues that
deposits should be considered as an output because they involve the creation of value added
associated with liquidity, safekeeping and payments services provided to depositors. On the
contrary, the intermediation approach considers financial institutions mainly as mediators of
funds between savers and investors. Under this approach the funds raised (deposits) and their
cost should be included as inputs in the analysis, since they constitute the raw material to be
transformed in loans and investible funds.
Berger and Humphrey (1991) and Bauer et al. (1993) proposed a so called modified
production approach, which allows both the input and output characteristics of deposits to be
considered in the cost/profit functions. According to this approach the interest paid on
deposits should be accounted as input, while the volume of deposits should be considered as
output.
In our cost/profit specifications for the CEE banks, we employ the modified production
approach which provide a better fir to our data-set.10 We shape, therefore, the cost and profit
functions using loans, deposits and other earning assets as outputs, and price of labor, price of
capital and price of deposits as inputs. We do not account for the interbank market activities
(this mainly refers to the different sorts of deposits from and with banks), since interbank
market conditions should be approximately the same for all the banks. A detailed description
of the variables is presented in Table 3.
10 Our choice has been supported by an F-test procedure, which allowed us to prefer this specification versus the
production and the intermediation cost and profit specifications.

8
Table 3: Variables Used in the Cost and Profit Functions for CEE banks Variables Name Description
Exogenous variables Output y1 Loans Loans (performing and non-
performing) with customers y2 Deposits Deposits with customers y3 Other earning assets Banks’ investments in various types of
securities (e.g. government securities, bonds, equity investments, CDS, T-bills, equity investment) not including deposits with banks
Input X1 Labor Total assets as a proxy for the number
of employees due to lack of data X2 Capital Adjusted value of fixed assets net of
depreciation
X3 Deposits Customer deposits Input prices W Price of labor Staff expenses/total assets K Price of capital Cost of capital (operative costs
associated with capital expenses / adjusted value of fixed assets net of depreciation)
D Price of deposits Total interest expenses / volume of customer deposits
Endogenous variables TC Total costs Operating expenses
TP Total profits Operating profit minus loan loss provisions
For our cost and profit functions11 we use the Fourier flexible form (FF), which is a semi
nonparametric form that combines the standard translog (TL) specification, nested in it, with
the non-parametric Fourier form, i.e. the trigonometric terms. In other words, the FF presents
the well-known advantages of being a flexible form and of including, as a particular case, the
Cobb-Douglas specification. This theoretical improvement, which is able to represent a broad
range of functions, has been proved to give a better fit of the data than the TL, which,
conversely, does not necessarily approximate the unknown true function of an industry, as
pointed out in literature (see White, 1980; Gallant, 1981; McAllister and McManus, 1993;
Mitchell and Onvural, 1996; Berger and Mester, 1997).
The FF representation gives:
11 A distinction between cost and profit efficiency arises when markets are not perfect. In the case of CEE
countries it certainly is a reasonable assumption to say that given our observation period (1995 to 2002) competitive markets did not occur in the banking industry. Therefore a profit efficiency analysis brings additional insights into the workings of the industry.

9
+⋅⋅+⋅⋅
+⋅⋅+⋅+⋅+=
∑∑∑∑
∑∑∑∑
= == =
= ===
]lnlnlnln
lnlnlnln[ln
3
1
3
1
3
1
3
121
3
1
3
121
3
1
3
10
iksis
kik
khsks
hkh
ijsis
jijks
kkis
iist
pypp
yypyH
δβ
αβαα
Σi ai cos(yi) + Σi bi sin(yi) + Σk ck cos(pk) + Σk dk sin(pk) +
Σij eij [cos(yi) + cos(yj)] + Σij fij [sin(yi) + sin(yj)] +
Σij gij [cos(yi) - cos(yj)] + Σij hij [sin(yi) - sin(yj)] +
Σkl ikl [cos(pk) + cos(pl)] + Σkl lkl [sin(pk) + sin(pl)] +
Σkl mkl [cos(pk) - cos(pl)] + Σkl nkl [sin(pk) - sin(pl)] +
stst UV + (3)
where H is again either total cost TC or total profits TP12, yi is the i-th output and pk is the
price of the k-th input. Vst is the error term accounting for random noise in the data, and Ust
refers to technical inefficiency.
The restrictions in the form of the linear homogeneity conditions and cost exhaustion are
obtained by normalizing total costs/profits, the price of labor and the price of deposits by the
price of capital. The symmetry conditions state that
αij = αji ∀ i, j (i.j= 1,…,n) and
βij = βji ∀ i,j (i,j=1,…,m).
The linear homogeneity restrictions demand that:
;13
1=∑
=kkβ 0
3
1=∑
=kkhβ , for all h; 0
3
1=∑
=kikδ , for all i.
In the FF specification, the trigonometric addends have rescaled coherently with our sample
size.13
The FF cost and profit regressions (3) are estimated using the stochastic frontier approach
with the time-varying panel model (Battese and Coelli, 1992) which allows the inefficiency
term of each bank to vary over time.
The model provides maximum likelihood estimates of the following parameters:
(a) the inefficiency term, which varies over time according to the following behavior
12 As usually done in literature (see e.g. Hasan and Morton, 2003), in the estimate of the profit function, we
incorporate a constant term (which is equal to 1 plus the absolute value of the minimum profit value in the sample) into the total profit variable (TP), which avoids taking the log of a negative number.
13 Special attention must be paid to the choice of the rescaling form for the trigonometric terms in order to coherently fix their argument in the 0-2π range. The truncation point here has been chosen according to the rule of thumb expounded in Mitchell and Onvural (1996) that the number of parameters should be set equal to the number of observations raised to the power of two-thirds in order to obtain consistent and asymptotically normal estimates. However, as suggested in Gallant (1981), the effective number of the coefficients is corrected by reducing the number of the regressors to cope with the possible multicollinearity.

10
Ust = Us(η -(t-T))
where Ust is the inefficiency term of bank s at time T (which is the last period considered) and
η is a parameter to be estimated (when η is bigger then zero the inefficiency term, Ust , is
decreasing over time; when η is smaller then zero Ust is increasing over time; Ust stays steady
if η=0);
(b) the mean, µ, of the truncation at zero of a normal density distribution; µ indicates how far
firms operate from the efficient frontier. Econometrically this means that if µ is significantly
different from zero we reject the hypothesis that the distribution is half normal truncated and
therefore efficiency is not the prevalent behavior of our bank sample.
(c) the parameter γ = σ u2/ σ2; γ is the ratio between the variance associated to the inefficiency
of the bank and total variance: it must varies between 0 and 1.
3.3 Determinants of (in)efficiency: the correlation between asset quality,
risk and efficiency
Empirical literature has found that failing banks and banks with high level of problems loan
tend to be far from the efficiency frontier (see e.g. Berger and DeYoung, 1997, which provide
a good survey on the issue). Moreover, one of the implications of the recent empirical
literature on CEECs is that the poor managerial performance could be a reason to explain the
low efficiency level in these banking systems. With some papers arguing that foreign
ownership influences the way banks are managed and therefore indirectly affects bank
efficiencies (see e.g. Hasan and Marton, 2003; Weill, 2003) and others finding no statistical
evidence to support a positive influence of foreign ownership on efficiency (see e.g. Fries and
Taci, 2005), the way managerial behavior is linked to efficiency remains to be clarified.
Recently, Weill (2004) for instance suggested, without providing any direct empirical
evidence, that this hypothesis more than the bank ownership could explain the gap between
CEECs and Western countries.
As a first step, we therefore look at the static model in which the X-efficiency values obtained
by the estimates of eq. (3) for cost and profit can be expressed as an explicit function of a
vector of variables, which may influence the firm’s efficiency. In our case, we check if the
management of the asset quality and capitalization of bank affect firm efficiency. In order to
control for the effect of foreign ownership of bank, for the size of the bank, for the market
concentration and for the trend we use control variables, specified as below:

11
XEFFst= LLPst +CAPst+ LTAst +Market-sharest+Concentrationst+ Ownershipst+Trendst+ εst
(4)
Where:
s identifies the cross section of banks and t the time component;
XEFF is cost/profit efficiency level.
LLP is a proxy for the problem loan variable. As an indicator for asset quality, we use here,
for lack of data on problem loans, the loan loss provisions of each bank over the total loans.
CAP is the ratio of equity to total assets, and is a measure of bank capitalization.
LTA is the ratio of loan to total assets and can be interpreted as a measure of bank risk.
Market share is a size variable accounting for the market share of each bank, and is calculated
as the ratio between the total assets of each bank over the total assets of the banking industry
in the country.
Concentration is a variable accounting for the concentration of the banking market and has
been calculated as the ratio between the assets of the largest 5 banks in the country and the
total assets of the banking industry in the country.
Ownership is the percent of the foreign owned bank assets.
Trend account for the time.
εst is the error term.
If loan loss provisions are found to be negatively correlated to efficiency levels, it would
however be premature be concluded right away that CEE-banks are faced with a bad
management problem. Problem loans can for instance also increase due to the presence of
exogenous factors. Regional economic recession, rate of criminality, etc., may affect the
quality of customer loans and as a consequence entail higher monitoring costs and extra
expenses. The increase in operating cost will in turn dampen cost and profit efficiency levels.
3.4 Modeling the management behavior
In order to clarify the causality governing the relationship between problem loans,
capitalization and efficiency, we therefore have to investigate on the link between managerial
behavior and bank efficiency. Following Berger and DeYoung (1997) and Williams (2004)
we address the question in a direct way by linking managerial behavior to bank efficiency
levels. Tests for management behavior can be analyzed as an inter-temporal relation across

12
asset quality of the bank, capitalization and bank efficiency, using the Granger causality
approach.
Using this approach for a sample of U.S commercial banks, Berger and DeYoung (1997)
checked four different kinds of management behavior:14
a) bad management hypothesis, which implies that bad managers do not adequately control
for operating expenses and poorly manage loan portfolio, this may cause that the low
efficiency brings greater amount of problem loans;
b) skimping hypothesis, which implies that quality of a banks loan portfolio is a consequence
of the costs connected with the monitoring of lending activities. This will bring a positive
correlation between cost efficiency and problem loans.
c) bad luck hypothesis, which means that unexpected and external factor increase the problem
loans which in turn reduces cost efficiency as monitoring costs are increased as a
consequence.
d) moral hazard hypothesis suggests that managers of weakly capitalized banks are less risk
adverse and engage in risk taking behavior. Therefore, low bank capitalization can cause an
increase in problem loans.
Each of these four hypotheses would of course also entail a different set of regulatory
implications. Whereas the bad luck hypothesis would highlight the need for regulators put an
effort into insulating the banking system towards external shocks, the bad management
hypothesis as well as the skimping hypothesis would indicate that supervisors should focus
their attention towards bank-internal credit-risk management systems. The moral hazard
hypothesis would alternatively suggest a close monitoring of banks with comparatively low
capitalization levels.
The model they proposed is based on the following equations:
LLPst = f1(LLP s lag, XEFF s lag ,CAP s lag , LTA s lag , Yr t )+ ε 1s t (5)
XEFFst = f2 (LLP s lag, XEFF s lag ,CAP s lag , LTA s lag , Yr t)+ ε 2s t (6)
CAPst = f 3 (LLP s lag, XEFF s lag ,CAP s lag , LTA s lag , Yr t)+ ε 3s t (7)
The variables in eqs (5-7) have been defined in eq. (4) above. To account for the bank´ risk
and other factors which may have an affect on the managerial behavior and the efficiency,
Berger and Young (1997) and Williams (2004) use, as control variables, the ratio of loan to
14 The same approach has been used by Williams (2004) using a sample of Western European banks.

13
total assets (LTA) and dummies for each year (Yr) which account for changes in the
environment. The model is built in a way that each dependent variable is estimated using the
lagged value of it and the lagged values of the independent variables. In this way the lagged
values of the right hand side variables with lags up to time t-n Granger cause changes in the
dependent variable at time t.
Equation (5) tests the following hypothesis:
a) bad management hypothesis, according to which we would expect a negative relation
between the problem loans and the lagged X-efficiency.
b) A positive sign for the previous relation would imply the presence of the skimping
behavior.
c) Finally, eq. (5) can also test the moral hazard behavior, when only a sub-sample of the low
capitalized bank is used. In this case a negative sign is expected between the bad loan and the
lagged value of the capitalization variables (CAP).
Equation (6) tests for the bad luck hypothesis: a negative relation is expected between the X-
efficiency and the lagged value of the problem loan.
As in Berger and DeYoung (1997) and Williams (2004) equation (7) is included to complete
the model and get further indications of managerial behavior, but does not check any of the
aforementioned hypotheses.
4 Empirical Findings The presentation of our results is split in two parts, in the same way as our research question
was. To begin with we present cost and profit efficiency estimates for our sample of CEE-
banks in order to investigate whether efficiency levels significantly differ by country and/or
significantly changed over time. In the second section we discuss our findings on the
management behavior.
4.1 Cost and profit estimates
The FF stochastic cost and profit estimates on the overall sample are presented in the
Appendix. As far as the cost function is concerned, all the output and input price coefficients
are strongly significant. The elasticity of production costs to the price of labor (βp1=0.68) is
larger than the elasticity to the capital price, 0.15 (1-βp1-βp2 = 0.17, due to the linear
homogeneity conditions imposed). This means that the banks we investigate can more easily
14
control capital and deposit expenses than labor expenses when prices rise. For our sample this
seems plausible, since at least in the short run, it is/was more difficult to cut labor expenses
than capital costs. Looking at the outputs, all the variables present the expected positive sign.
Concerning the profit function, again all the output and input price coefficients have the
correct sign and the expected magnitude. The positive and significant coefficient for deposits
means that more deposits implies more capital that can be transformed into loans (which raise
profits); in particular, deposits stemming from customers are usually cheaper than capital
borrowed in interbank markets.
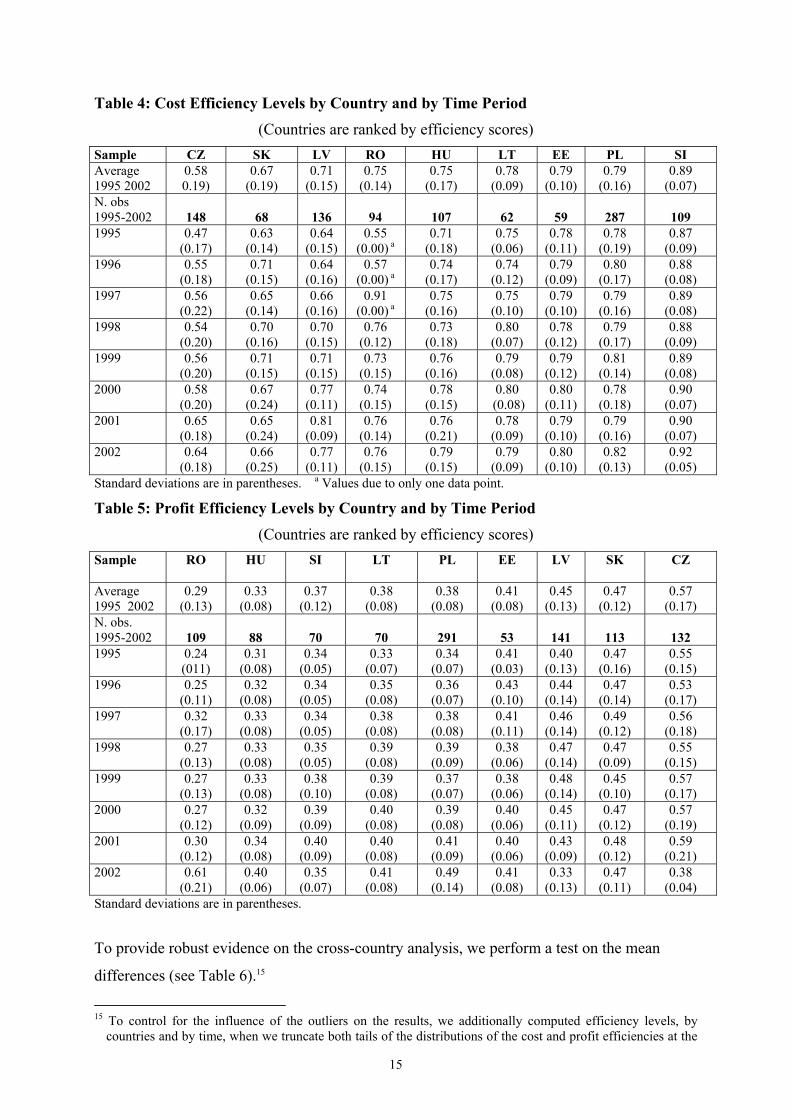
As far as the results for bank (in)efficiency are concerned, decomposing the inefficiency
values obtained from the cost and profit stochastic estimates on the overall panel, yields
information about the level of banking efficiency by country and by time. Tables 4 and 5
provide evidence on the cost and profit efficiency scores aggregated by country and ranked
according the efficiency levels.
15
Table 4: Cost Efficiency Levels by Country and by Time Period (Countries are ranked by efficiency scores)
Sample CZ SK LV RO HU LT EE PL SI Average 1995 2002
0.58 0.19)
0.67 (0.19)
0.71 (0.15)
0.75 (0.14)
0.75 (0.17)
0.78 (0.09)
0.79 (0.10)
0.79 (0.16)
0.89 (0.07)
N. obs 1995-2002 148
68
136
94 107 62 59
287
109
1995 0.47 (0.17)
0.63 (0.14)
0.64 (0.15)
0.55 (0.00) a
0.71 (0.18)
0.75 (0.06)
0.78 (0.11)
0.78 (0.19)
0.87 (0.09)
1996 0.55 (0.18)
0.71 (0.15)
0.64 (0.16)
0.57 (0.00) a
0.74 (0.17)
0.74 (0.12)
0.79 (0.09)
0.80 (0.17)
0.88 (0.08)
1997 0.56 (0.22)
0.65 (0.14)
0.66 (0.16)
0.91 (0.00) a
0.75 (0.16)
0.75 (0.10)
0.79 (0.10)
0.79 (0.16)
0.89 (0.08)
1998 0.54 (0.20)
0.70 (0.16)
0.70 (0.15)
0.76 (0.12)
0.73 (0.18)
0.80 (0.07)
0.78 (0.12)
0.79 (0.17)
0.88 (0.09)
1999 0.56 (0.20)
0.71 (0.15)
0.71 (0.15)
0.73 (0.15)
0.76 (0.16)
0.79 (0.08)
0.79 (0.12)
0.81 (0.14)
0.89 (0.08)
2000 0.58 (0.20)
0.67 (0.24)
0.77 (0.11)
0.74 (0.15)
0.78 (0.15)
0.80 (0.08)
0.80 (0.11)
0.78 (0.18)
0.90 (0.07)
2001 0.65 (0.18)
0.65 (0.24)
0.81 (0.09)
0.76 (0.14)
0.76 (0.21)
0.78 (0.09)
0.79 (0.10)
0.79 (0.16)
0.90 (0.07)
2002 0.64 (0.18)
0.66 (0.25)
0.77 (0.11)
0.76 (0.15)
0.79 (0.15)
0.79 (0.09)
0.80 (0.10)
0.82 (0.13)
0.92 (0.05)
Standard deviations are in parentheses. a Values due to only one data point.
Table 5: Profit Efficiency Levels by Country and by Time Period (Countries are ranked by efficiency scores)
Sample RO HU SI LT PL EE LV SK CZ
Average 1995 2002
0.29 (0.13)
0.33 (0.08)
0.37 (0.12)
0.38 (0.08)
0.38 (0.08)
0.41 (0.08)
0.45 (0.13)
0.47 (0.12)
0.57 (0.17)
N. obs. 1995-2002
109 88
70 70
291 53
141
113 132
1995 0.24 (011)
0.31 (0.08)
0.34 (0.05)
0.33 (0.07)
0.34 (0.07)
0.41 (0.03)
0.40 (0.13)
0.47 (0.16)
0.55 (0.15)
1996 0.25 (0.11)
0.32 (0.08)
0.34 (0.05)
0.35 (0.08)
0.36 (0.07)
0.43 (0.10)
0.44 (0.14)
0.47 (0.14)
0.53 (0.17)
1997 0.32 (0.17)
0.33 (0.08)
0.34 (0.05)
0.38 (0.08)
0.38 (0.08)
0.41 (0.11)
0.46 (0.14)
0.49 (0.12)
0.56 (0.18)
1998 0.27 (0.13)
0.33 (0.08)
0.35 (0.05)
0.39 (0.08)
0.39 (0.09)
0.38 (0.06)
0.47 (0.14)
0.47 (0.09)
0.55 (0.15)
1999 0.27 (0.13)
0.33 (0.08)
0.38 (0.10)
0.39 (0.08)
0.37 (0.07)
0.38 (0.06)
0.48 (0.14)
0.45 (0.10)
0.57 (0.17)
2000 0.27 (0.12)
0.32 (0.09)
0.39 (0.09)
0.40 (0.08)
0.39 (0.08)
0.40 (0.06)
0.45 (0.11)
0.47 (0.12)
0.57 (0.19)
2001 0.30 (0.12)
0.34 (0.08)
0.40 (0.09)
0.40 (0.08)
0.41 (0.09)
0.40 (0.06)
0.43 (0.09)
0.48 (0.12)
0.59 (0.21)
2002 0.61 (0.21)
0.40 (0.06)
0.35 (0.07)
0.41 (0.08)
0.49 (0.14)
0.41 (0.08)
0.33 (0.13)
0.47 (0.11)
0.38 (0.04)
Standard deviations are in parentheses.
To provide robust evidence on the cross-country analysis, we perform a test on the mean
differences (see Table 6).15
15 To control for the influence of the outliers on the results, we additionally computed efficiency levels, by
countries and by time, when we truncate both tails of the distributions of the cost and profit efficiencies at the

16
Table 6 - Differences in mean cost and profit efficiency scores by country CZ EE HU LT LV PL RO SK SI
Cost efficiency
CZ -0.21* (-10.46)
-0.17* (-7.76)
-0.20* (-10.38)
-0.13* (-6.82)
-0.21* (-11.84)
-0.17* (-7.90)
-0.097* (-3.54)
-0.316* (-18.24)
EE 0.036*** (1.76)
0.010 (0.62)
0.074* (4.12)
-0.007 (-0.44)
0.041*** (2.14)
0.11* (4.45)
-0.10* (-7.18)
HU -0.020 (-1.30)
0.038*** (1.88)
-0.04*** (-2.30)
0.005 (0.24)
0.078** (2.83)
-0.14* (-7.95)
LT 0.064* (3.83)
-0.017 (-1.20)
0.030*** (1.67)
0.010* (4.14)
-0.11* (-8.64)
LV -0.08* (-5.20)
-0.033*** (-1.73)
0.039 (1.55)
-0.17* (-12.53)
PL 0.048** (2.77)
0.12* (4.99)
-0.097* (-8.13)
RO 0.073** (2.73)
-0.14* (-8.95)
SK -0.21* (-9.31)
SI Profit efficiency
CZ 0.16* (8.77)
0.23* (13.77)
0.18* (10.45)
0.11* (6.09)
0.18* (11.66)
0.27* (14.33)
0.095* (5.07)
0.20* (12.08)
EE 0.076* (5.72)
0.024*** (1.71)
-0.047* (-3.12)
0.023*** (2.04)
0.11* (7.24)
-0.066* (4.38)
0.039* (3.13)
HU -0.052* (-4.22)
-0.12* (-8.98)
-.005* (-5.55)
0.039** (2.65)
-0.14* (10.37)
-0.037* (-3.48)
LT -0.071* (-4.96)
-0.000 (-0.53)
0.091* (6.03)
-0.09* (6.30)
0.01 (1.31)
LV 0.07* (5.92)
0.16* (10.01)
-0.019 (-1.23)
0.08* (6.69)
PL 0.092* (7.13)
-0.09* (-7.52)
0.015*** (1.89)
RO -018* (-11.18)
-0.076* (-5.53)
SK 0.10 * (8.17)
SI The table reports cross country tabulation between the difference in the mean efficiency levels. In parenthesis we report the value of the t-test computed as : 2
222
1121
2121 )1()1()( σσµµ −+−
+−= NN
NNgNNt
where: 221 −+= NNg defines the degrees of freedom, µi is the mean of the i-th group, iN is the number of
observations in the i-th group and σi2 is the variance of the i-th group.
The null hypothesis is that the mean differences are equal to zero. *values are significant at 1%; ** values are significant at 5%; *** values are significant at 10%.
99% and 95% degrees. The evidence shows that efficiency scores are not significantly affected by the outliers and remain stable over the sub-samples. Results are available upon request.
17
The evidence emerging from the Tables 4, 5 and 6 can be summarized as follows:
(a) the banking systems of CEECs present, as expected, significant levels of cost and profit
inefficiency, indicating that on average banks operate far above (below) from the cost
(profit) efficient frontiers.16
(b) Overall, the profit efficiency scores are well below cost efficiency levels: CEECs banks
seem to deal much better on the cost than on the profit side as their expertise in generating
profits is not as developed as their ability to supply their services in a cost-saving way. As
intermediation depth is still fairly low and demand for financial services of all kinds very
high in CEE countries, one explanation lies in banks’ expansion efforts, which have
absorbed enormous resources but have only partly paid off up to now, leaving profit
efficiencies behind cost efficiencies. Furthermore, given the potential reward of
maintaining/expanding market shares in a rapidly growing market, banks have little
incentive to maximize profits by means of full utilization of their discretionary pricing
power.
(c) Inspecting the average efficiency scores by country, enables comparisons among the
performances achieved by the banking systems examined and reveals that efficiency
levels vary considerably across countries. These variations in cost and profit efficiency
levels are significant in almost all cases.
As far as cost efficiency is concerned (Table 4) values range from 0.58 (the Czech
Republic) to 0.89 (Slovenia). Already at a countrywide perspective, loan loss
provisions/reserves seem to be important in the explanation of efficiency scores: Table 7
shows loan loss reserves over total customer loans for our sample of CEE-countries from
1995 to 2002. Comparing the average cost efficiency scores by country in Table 4 with
these values shows that the two countries that offered the worst performance in terms of
cost efficiency, the Czech Republic and Slovakia had both rather severe problems with the
quality of bank’s loan portfolios. On the contrary, Estonia, for example, which ranks third
in terms of cost efficiency, has had historically very low levels of loan loss provisions.
Section 4.2 will investigate the link between problem loans and efficiency in more detail.
16 This evidence, obviously, is consistent with the positive value of the parameter µ in the FF cost and profit
estimates reported in the Appendix.

18
Table 7: Share of loan loss reserves as % of total customer loans
Source: Bankscope For its part, Slovenia’s good performance despite the dominance of state-owned banks and
the comparatively low market share of foreign-owned institutions may be due to the fact
that the country itself has a relatively high branch density and credit growth has been
weak over the last years (ECB (2004)). This would suggest that the costs for financing
future growth in this market are comparatively low. As for Estonia and Lithuania, part of
the reasoning behind the good cost efficiency performance may also be due to the fact that
these two banking sectors are highly concentrated and largely in foreign hands (ECB,
2004).17
(d) Looking at the profit efficiency ranking, Table 5, the evidence shows that the order of the
ranking across countries is not the same as in the cost efficiency analysis: countries that
present fairly high cost efficiency scores are less performing in terms of profit efficiency,
and vice versa. Slovenian banks, which are ranked as most cost efficient institutions,
turned out to be at low end regarding profit performance. Conversely, the Czech and
Slovakian banks appear to be the most efficient ones as regards their ability to maximize
profits, on the contrary they presented the worse performance in terms of cost efficiency.
In order to test this evidence, we also analyze for the relationship between cost and profit
efficiency at bank level by means of the rank correlation between cost and profit
efficiency using Spearman and Kendall correlation tests. The results of the tests suggest
that the two variables are correlated;18 furthermore the negative sign of the coefficients
implies that profit and cost efficiency are negatively correlated across the banks of our
sample and supports the evidence emerging from a countrywide comparison: banks which
17 Alternatively, a simpler reasoning would suggest that some of the costs of the Estonian or the Lithuanian
banking sector appear in the accounts of the parent enterprises. 18 Both the Spearman's rho (which is equal to -0.4084 significant at 1%) and the Kendall´s score (which is equal
to -136654, significant at 1%) allow us to reject the Ho that cost and profit efficiency are independent.

19
are good in controlling their cost, do not reach efficiency from the profit side equally
well.19
(e) Looking at the evolution of efficiency for the overall sample of banks, we find a positive
and significant increase over time of cost and profit efficiency, equal to 6 and 4 per cent
respectively (see Table 8).20
Table 8. Cost and Profit Efficiency Levels by year Overall
period 1995 1996 1997 1998 1999 2000 2001 2002 Increase
95-02
Mean
test
Cost
efficiency
0.75
(0.17)
0.71
(0.18)
0.73
(0.17)
0.73
(0.17)
0.74
(0.17)
0.74
(0.17)
0.75
(0.18)
0.76
(0.17)
0.77
(0.15)
+ 6%
0.061*
t =2.59
N. of obs. 1070 92 119 133 133 146 161 149 137
Profit
efficiency
0.41
(0.13)
0.38
(0.14)
0.40
(0.13)
0.42
(0.13)
0.41
(0.13)
0.40
(0.14)
0.40
(0.13)
0.41
(0.13)
0.42
(0.14)
+4%
0.038**
t=2.23
Standard deviation in parenthesis. * Significant at 1%; ** Significant at 5%.
This trend is also consistent with results of Weill (2004) for a smaller sample of countries
on the period 1996-2000. At a first glance, the increasing trend in the efficiency seems to
hold also at country level: the evidence provided in tables 4 and 5 shows, in fact, a
positive trend in efficiency, both from cost and profit side, over the eight years period.21
However if we look more closely at the results, we find that only in few cases the increase
in efficiency at country level is statistically significant (see Table 9), suggesting that the
evolution of bank efficiency was not homogenous across the Eastern countries and the
overall increase in cost and profit efficiency is mostly driven by few countries. From the
cost efficiency viewpoint, only the Czech Republic and Latvia present a large and
19 The duality theory would suggest, in fact, that when markets are perfectly competitive and the standard properties (linear homogeneity, cost-exhaustion) of production function hold, cost and profit functions are dual and therefore, by analyzing the cost side, one could also derive information on the profit side. From this it follows that those firms which are good in minimizing their costs, also generate higher profits. Therefore we would expect a positive sign for correlation between cost and profit efficiency if the theory assumptions are satisfied. The negative sign therefore gives an indication that market conditions were not perfectly competitive over the sample period we analyzed. Indeed, these results are not surprising for the CEECs banking sectors, since - although they have benefited with different degrees by the positive effect of the process of privatization, the foreign banking penetration and change in the institutional and legal requirements – they are still characterized by high concentration of banks and fairly scarce market competition (ECB, 2004). Alternatively, the negative correlation could also suggest that banks with relatively high cost “inefficiencies” may be able to supply a better service quality, and are in turn in a position to generate higher profits. 20 A clear indication of this tendency shows the value of η which is positive and significant in the estimate of the stochastic cost and profit functions (see Table in the Appendix). 21 A similar trend has also been found by Weill (2004) in the cost efficiency trend of banks belonging to a more limited number of Eastern countries (the Czech Republic, Hungary, Latvia, Poland, Slovakia and Slovenia) for the period 1996-2000.

20
statistically significant increase in efficiency equals to 17% and 13% respectively.22 The
positive results for the Czech Republic, which started at beginning of the period at the
lowest level on the ranking, could be the result of the large process of privatization and
improvement in governance as also pointed out by Weill (2004). From the profit side the
trend is significant only for Latvia, Lithuania, Poland and Slovakia.
22 This result is consistent with evidence provided by Weill (2004), who found a positive and significant increase in cost efficiency for the Czech Republic and Latvia over the period 1996-2000.

21
Table 9 – Evolution in cost and profit efficiency by country between 1995 and 2002.
1995 2002 2002-1995 2002-1995
Number of banks Mean
Standard Deviation
Number of banks Mean
Standard Deviation
Variation in
percentage Mean test Cost efficiency
CZ 11 0.47 0.17 20 0.64 0.18 +17
0.173* (2.81)
EE 9 0.78 0.11 6 0.8 0.1 +2
0.025 (-0.47)
HU 14 0.71 0.18 13 0.79 0.15 +8.7
0.087 (1.39)
LV 12 0.64 0.15 17 0.77 0.11 +13
0.134 (2.63)*
LT 4 0.75 0.06 9 0.79 0.09 +4.5
0.045 (1.07)
PL 25 0.78 0.19 30 0.82 0.13 +4
0.04 (0.91)
RO a
10 0.76 0.03 22 0.76 0.15 -1 -0.006 (-0.13)
SK 5 0.63 0.14 8 0.66 0.25 +3.5
0.035 (0.32)
SI 11 0.87 0.09 13 0.92 0.05 +4.4
0.04 (1.47)
Profit efficiency
CZ 12 0.55 0.15 14 0.61 0.21 +5
0.054 (0.77)
EE 7 0.41 0.03 5 0.40 0.06 -1
-0.004 (-0.16 )
HU 11 0.31 0.08 9 0.35 0.07 +3.4
0.034 (0.99)
LV 17 0.40 0.13 15 0.48 0.14 +8
0.080*** (1.63)
LT 7 0.33 0.07 9 0.41 0.08 +7.6
0.076** (2.04)
PL 28 0.34 0.07 30 0.41 0.08 +7
0.066* (3.25)
RO a 12 0.27 0.04 23 0.33 0.13 +5.6
0.056 (1.19)
SK 9 0.47 0.16 14 0.47 0.11 0
0.00 (-0.06)
SI 13 0.34 0.05 12 0.38 0.04 +4
0.04** (2.26)
a Results on Romania derive from the observations relative to 1998 and 2002, given the limited number of observation for the years 1995, 1996, 1997.
t-statistics are in parenthesis. * Significant at 1%; ** Significant at 5%; *** Significant at 10%.
The generally low level of efficiency, the significant differences in cost/profit efficiencies
across countries as well as the apparently negative relationship between cost and profit
efficiency scores raise questions of which type of management behavior could be made
responsible for these phenomena observed with banks in the emerging market of Central and
Eastern Europe.
22
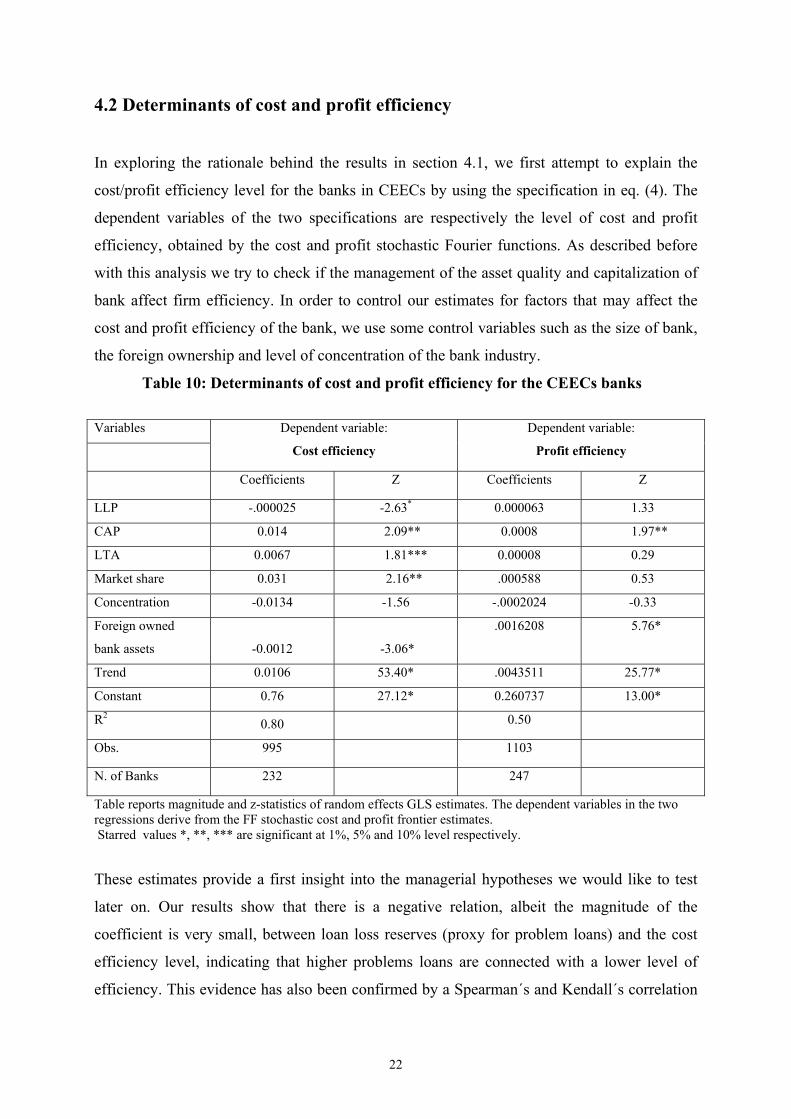
4.2 Determinants of cost and profit efficiency
In exploring the rationale behind the results in section 4.1, we first attempt to explain the
cost/profit efficiency level for the banks in CEECs by using the specification in eq. (4). The
dependent variables of the two specifications are respectively the level of cost and profit
efficiency, obtained by the cost and profit stochastic Fourier functions. As described before
with this analysis we try to check if the management of the asset quality and capitalization of
bank affect firm efficiency. In order to control our estimates for factors that may affect the
cost and profit efficiency of the bank, we use some control variables such as the size of bank,
the foreign ownership and level of concentration of the bank industry.
Table 10: Determinants of cost and profit efficiency for the CEECs banks Variables
Dependent variable:
Cost efficiency
Dependent variable: Profit efficiency
Coefficients Z Coefficients Z
LLP -.000025 -2.63* 0.000063 1.33
CAP 0.014 2.09** 0.0008 1.97**
LTA 0.0067 1.81*** 0.00008 0.29
Market share 0.031 2.16** .000588 0.53
Concentration -0.0134 -1.56 -.0002024 -0.33
Foreign owned
bank assets -0.0012 -3.06* .0016208 5.76*
Trend 0.0106 53.40* .0043511 25.77*
Constant 0.76 27.12* 0.260737 13.00*
R2 0.80 0.50
Obs. 995 1103
N. of Banks 232 247
Table reports magnitude and z-statistics of random effects GLS estimates. The dependent variables in the two regressions derive from the FF stochastic cost and profit frontier estimates. Starred values *, **, *** are significant at 1%, 5% and 10% level respectively.
These estimates provide a first insight into the managerial hypotheses we would like to test
later on. Our results show that there is a negative relation, albeit the magnitude of the
coefficient is very small, between loan loss reserves (proxy for problem loans) and the cost
efficiency level, indicating that higher problems loans are connected with a lower level of
efficiency. This evidence has also been confirmed by a Spearman´s and Kendall´s correlation

23
tests.23 Note that both bad management and bad luck could hide behind these results. We also
find a positive correlation between the ratio of equity to total assets (CAP) and cost efficiency,
which is also consistent with our expectations, suggesting that banks that are well capitalizes
have better space for absorbing losses coming from the loan portfolio. We furthermore find a
positive correlation between cost efficiency and the ratio of loan over total assets (LTA),
which represents a measure of the risk of the bank. Looking at the control variables, we find
that the market share, which is a measure of bank’s size, has a positive effect on cost
efficiency. This means that large banks have a better control on the cost side and more likely
they could better in exploiting scale economies. We furthermore find a negative correlation
between foreign owned bank assets and cost efficiency suggesting that foreign owned assets
do not itself justify higher level of cost efficiency.
Results on the profit side are less informative given the poor estimate results. The only
relevant evidence we find is a positive correlation of foreign ownership and the capitalization
ratio (CAP) with profit efficiency. The relation between foreign ownership and profit
efficiency could be an indication that foreign owned banks given their constraints by capital
market discipline are more focussed on the profit side than on controlling the cost side.
Additionally the effects of the bank internal consolidation process going along with
international mergers and acquisitions will usually be seen earlier on the profit side than on
the cost side.
It is however, noteworthy that our estimates do not imply any causality between X-efficiency
and managerial behaviour. We simply find a correlation between bad loan and cost efficiency,
which support the view that most of the banks in CEECs are saddled with an overhang of non-
performing loans which obviously affect the cost efficiency levels. Therefore, banks that were
the fastest in coming to grips with bad debt were also the best in improving their overall
efficiency scores.
This evidence opens the crucial question of this work: is this negative correlation between
problem loans and efficiency a sign for the bad management or the bad luck hypothesis? In
order to address this issue we check the managerial hypothesis using the Granger causality
test, as proposed by Berger and DeYoung (1997).
4.3 Management behavior results
23 The Spearman's rho (which is equal to -0.0195 significant at 1%) and the Kendall´s score (which is equal to -5882, significant at 1%) allow us to reject the Ho that cost and problem loans are independent; the negative signs of the tests show that the two variables are negatively correlated.

24
In this section we present the results of our tests to verify whether the correlation across cost
efficiency, asset quality and capitalization detected in the previous analysis could be due to
the management behavior. We employ the model proposed by Berger and DeYoung (1997)
and used in Williams (2004), based on the Granger causality approach for testing the different
management hypothesis (eqs 5-7). The three equations of the model were estimated separately
using the Arellano-Bond dynamic panel data model. We chose the specification of three
lagged periods, which has been supported by an F-test. In contrast to what we could have
expected from the ownership literature, the evidence we obtain does not support the presence
of the bad management hypothesis in CEE-banks, since we do not find significant values for
the estimates parameters.
We test again the results using in the estimates, instead of the cost efficiency, the profit
efficiency, without obtaining significantly different evidence. Moreover, we also check the
model on two different sub-samples one containing banks with low foreign owner assets and
the other with high foreign owned assets, to verify whether the bad management hypothesis
could be checked for non-privatized banks and low foreign owned banks: again, results do not
support any behavioral management hypothesis. Whereas the ownership model therefore
influences whether a given bank is more/less efficient than a bank organized in a different
way, we find no evidence that bad management hides behind this phenomenon.
In the same way, we also do not find any evidence for neither the skimping hypothesis nor
moral hazard behavior. The skimping hypothesis would have implied a positive sign between
loan loss provision and X-efficiency in eq. (5). The moral hazard hypothesis has been checked
running eq. (5) on two sub samples of well and thinly capitalized banks to investigate whether
banks with different capitalization react differently to the change in problem loans. In the case
of thinly capitalized banks, we would have expected a negative relation between loan loss
provision and lagged value of the variable accounting for the capitalization of the bank (CAP).
Our results, however, provide support for the bad luck hypothesis given the fact that only eq.
(6) provides significant coefficients which present the expected signs. In Table 11 we present
the results of the dynamic Arellano Bond estimates of eq. (6) 24. We report the three lagged
coefficients of the dependent and independent variables and their respective sum. The fact
that the sum of the lagged coefficients of loan loss provision (LLP) turns to be significant with
the negative sign is an indication for the presence of the bad luck hypothesis: unexpected and
external factors increase loan loss provisions, which reduce cost efficiency.
24 For the sake of brevity we chose to present the estimation output only for the eq. (6) where we find significant results. The remaining estimates of the model are available from the authors upon request.

25
Table 11. Granger causality test in X-efficiency equation (6): bad luck hypothesis
Dep.var.:
Cost Efficiency Coefficient Z Constant 0.000011 6.07* X-EFF t-1 1.936526 206.26* X-EFF t-2 -0.939529 -101.62* X-EFF t-3 Dropped
X-EFF TOT 0.996997 53.50* LLP t-1 -0.000013 -2.12* LLP t-2 -0.000017 -3.47* LLP t-3 -0.000008 -2.73*
LLP TOT -0.000038 -2.72* CAP t-1 -0.000011 -1.19 CAP t-2 0.000002 0.26 CAP t-3 -0.000004 -0.46
CAP TOT -0.000013 -0.56 LTA t-1 0.000018 1.61*** LTA t-2 0.000007 1.10 LTA t-3 0.000008 2.00**
LTA TOT 0.000033 1.54*** Year t-1 0.000002 1.03 Year t-2 0.000004 1.31 Year t-3 0.000006 1.41
N.of obs 365
N. of banks 124
Table reports the Arellano Bond dynamic estimates of eq. (6). Estimates are robust to the autocorrelation test obtained on the robust estimator of the variance-covariance matrix of the parameter estimates. *Significant at 1%; **Significant at 5%; *** Significant at 10%.
Moreover, as shown by the results much of the significance of the estimates is explained by
the lagged values of the dependent variables, suggesting that obviously the level of the
efficiency today are affected by the past level of efficiency. The remaining coefficients
including those for the loan loss provisions take on comparatively small values.
One reason why our evidence on management behavior, as cause for the low performance of
the CEECs, is scarce may be due to the sample size, which of course decreases with number
of lags used in estimate and the other data limitations in the Bankscope database for these
countries. In fact, we also face data restrictions on problem loans, with numerous banks not
reporting this figure. We use instead, as done also by Williams (2004), a proxy for them - the
loan loss provision - which could contain element of endogeneity since they can be controlled

26
by the management. In this respect, further investigation would be necessary to further assess
our evidence.
5 Conclusions This paper attempts to investigate the cost and profit efficiency of banks in the CEECs over
the period from 1995 to 2002 and to test with data on risk and asset quality whether the
managerial behavior can explain the low efficiency level detected.
Not surprisingly, our findings, based on the FF stochastic cost and profit functions, show a
generally low level of cost and profit efficiency for banks in the CEECs. Conversely, the
results also reveal a significant tendency of efficiency (both cost and profit) to increase over
time, although this trend is not equally spread over all countries. We furthermore
encountered large and significant differences across countries and large gaps between cost
and profit efficiency - banks in the former accession countries seem to be more efficient in
controlling costs than in generating profits. Low cost efficiencies banks are even often offset
by high profit efficiencies and vice versa.
We also give an insight into the determinants of X-efficiency levels in CEE-markets. In
explaining cost efficiencies, we attempt to verify if the management of the asset quality and
the risk of the bank can explain the cost and profit performance. The evidence provided by
this static analysis is the negative correlation between cost efficiency and bad loans. When we
look at the managerial behavior hidden behind this negative correlation, we find no evidence
for bad management hypothesis explaining the relationship between efficiency and loan
quality. By using the Granger causality approach as proposed by Berger and DeYoung (1997)
we only find evidence for the bad luck hypothesis, which means that the exogeneity of bad
loans is triggering inefficiency.
The fact that our data support the bad luck hypothesis suggests that high levels of problem
loans, generated by external factors - such as the environmental conditions, the level of
criminality, etc. - cause a decrease in the level of cost efficiency, as an increase in the cost of
monitoring and in the other related expenses (e.g. a more prudent administration of the
performing loans) will go along with higher provisioning. With all the caveat of our empirical
investigation, our results indicate that the low level of efficiency recorded in the CEECs
countries could therefore be partially ascribed to uncontrolled external factors. In terms of
regulatory policy implications, this is a signal that bank inefficiency and failures in these
markets are primarily associated with external shocks beyond the control of management.
Regulatory and supervisory rules should therefore focus on reducing banks’ exposure to these
27
unforeseen events. This could for instance be done by increasing the diversification of loan
portfolios – limits in loan concentration, the promoting of mergers with foreign institution or
an encouragement of banks toward a low risk profile by lowering the ratio between loan and
total assets could be cases in point. Alternatively, higher capitalization rates are another way
to increase banks’ shock absorption capacity. For CEECs improvements in the efficiency of
the banking systems could have a significant impact on the allocation of financial resources
since this sector remains still the most important source of financing private investment of
firms, given the underdevelopment of the financial markets.
References
Afriat, S.N., 1972. Efficiency estimation of production functions. International Economic Review 13, (3), 568-598. Aigner, D.J., Lovell, C.A.K., Schmidt, P., 1977. Formulation and estimation of stochastic frontier production function models. Journal of Econometrics 6, 21-37. Aigner, D.J., Chu, S.F., 1968. On estimating the industry production function. American Economic Review 58, (4), 826-839. Altunbas, Y., Evans, L., Molyneux, P., 2001. Bank ownership and Efficiency. Journal of Money, Credit and Banking 33, (4), 926-954. Balling, M., Lierman, F., Mullineux, A., 2004. Financial Markets in Central and Eastern Europe. Stability and efficiency perspectives. Routledge. Battese, G. E., Coelli, T., 1988. Prediction of firm-level technical efficiencies with a generalized frontier production function and panel data, Journal of Econometrics 38, 387-399. Battese, G. E., Coelli, T., 1992. Frontier Production Functions, Technical Efficiency and Panel Data: With Application to Paddy Farmers in India, Journal of Productivity Analysis 3, 153-169. Battese, G. E., Coelli, T., 1995. A Model for Technical Inefficiency Effects in a Stochastic Frontier Production Function for Panel data, Empirical Economics 20, 325-332.

28
Bauer, P., Berger, A.N., Humphrey, D.B., 1993. Efficiency and productivity growth in US banking, in: Fried, H.O., Lovell, C.A.K., Schmidt, S.S. (Eds.), The measurement of productive efficiency: techniques and applications, Oxford University Press, 386-413. Beattie, B. R., Taylor, C. R., 1985. The Economics of Production, Wiley, New York. Berger, A. N., 1995. The relationship between capital and earnings. Journal of Money, Credit, and Banking 27, 432-456. Berger, A. N., DeYoung, R., 1997. Problem loans and cost efficiency in commercial banks. Journal of Banking and Finance 21, 849-870. Berger, A.N., Hannan, T.H., 1998. The efficiency cost of market power in the banking industry: a test of `quiet life` and related hypothesis. The Review of Economics and Statistics LXXX (3), 454-465. Berger, A.N., Humphrey, D.B., 1991. The dominance of inefficiencies over scale and product mix economies in banking. Journal of Monetary Economics 28, 117-148. Berger, A. N., Mester, L. J., 1997. Inside the black box: what explains differences in the efficiency of financial institutions. Journal of Banking and Finance 21, 895-947. Berglöf, E., Bolton, P., 2002. The Great Divide and Beyond – Financial Architecture in Transition. Journal of Economic Perspective Vol. 16, 77-100. Bonin, J. P., Hasan, I., Wachtel, P., 2005. Bank performance, efficiency and ownership in Transition Countries. Journal of Banking and Finance 29, 31-53. Buch, C., 2000. Is foreign control a Panacea? On Governance and Restructuring of commercial Banks in Transition Economies. Kiel Institute of World Economics, April. Caviglia, G., Krause, G., Thimann, C., 2002. Key features of the Financial Sectors in EU Accession Countries. In Thimann C., Ed., Financial Sectors in EU Accession Countries, European Central Bank, Frankfurt. Claessens, S., Demirguc-Kunt, A., Huizinga, H., 2001. How does foreign entry affect domestic banking markets? Journal of Banking and Finance 25, 891-911. Coelli, T., Rao, D. S. P., Battese, G. E., 1998. An introduction to efficiency and productivity analysis. Kluwer Academic Publishers, Boston. DeYoung, R., Sprong, K., Sullivan, R.J., 2001. Who’s minding the store? Motivating and monitoring hired managers at small closely held commercial banks. Journal of Banking and Finance 25, 1209-1244.

29
European Central Bank, 2004. Report on Banking Structures in the new Member States, mimeo. Fries, S., Taci, A., 2002. Banking reform and development in transition economies, EBRD Working Paper N. 71. Fries, S., Taci, A., 2005. Cost efficiency of banks in transition: evidence from 289 banks in 15 post-communist countries. Journal of Banking and Finance 29, 55-81. Fries, S., Neven, D., Seabright, P., 2002. Bank Performance in Transition Economies, EBRD, June. Gallant, R., 1981. On the bias of flexible functional forms and an essentially unbiased form. Journal of Econometrics 15, 211-245. Green, C., Murinde, V., Nikolov, I., 2004. Are foreign banks in Central and Eastern Europe more efficient than deomestic banks? In: Balling et al 2004, Financial Markets in Central and Eastern Europe. Routledge, 225-250. Hasan, I., Marton, K., 2003. Development and efficiency of the banking sector in a transitional economy: Hungarian experience. Journal of Banking and Finance 27, 2249-2271. International Monetary Found, 2000. International Capital Markets: Development, Prospect and Key issues. IMF, Washington, DC. Jondrow, J., Lovell, C.A.K., Materov, I.S., Schmidt, P., 1982. On the estimation of technical inefficiency in the stochastic frontier production function model. Journal of Econometrics 19, 233-238. Kraft, E., Tirtiroglu, D., 1998. Bank efficiency in Croatia: a stochastic frontier Analysis. Journal of Comparative Economics Vol.26, 282-300. Kumbhakar, S.C., Lovell, C.A.K., 2000. Stochastic Frontier Analysis. Cambridge: Cambridge University Press. La Porta, R., Lopez-De-Silanes, F., Schleifer, A., 2002. Government Ownership of Banks, Journal of Finance Vol. LVII, (1). McAllister, P.H., McManus, D., 1993. Resolving the scale efficiency puzzle in banking. Journal of Banking and Finance 17, 389-405.

30
Meeusen, W., van den Broeck, J., 1977. Efficiency estimation from Cobb-Douglas production functions with composed error. International Economic Review 18, 435-444. Mester, L.J., 1996. A study of banking efficiency taking into account risk-preferences. Journal of Banking and Finance 20, 1025-1045. Mitchell, K., Onvural, N. M., 1996. Economies of scale and scope at large commercial banks: Evidence from the Fourier flexible functional form. Journal of Money, Credit and Banking 28, 178-199. Nikiel, E.M., Opiela, T.P., 2002. Customer Type and Bank efficiency in Poland: Implication for Emerging market Banking. Contemporary Economic Policy 20, 55-71. Opiela, T.P., 2000. Assessing the evaluation of Polish commercial banks. National Bank of Poland, Working Paper N. 18. Richmond, J., 1974. Estimating the efficiency of production. International Economic Review 15, (2), 515-521. Shephard, R. W., 1970. Theory of Cost and Production Functions. Princeton University Press, Princeton. Stevenson, R. F., 1980. Likelihood Functions for Generalized Stochastic Frontier Estimation. Journal of Econometrics 13, 57-66. Taci, A., Zampieri, E., 1998. Efficiency in the Czech banking sector. Charles University CERGE-EI Discussion paper N. 4, Prague. Thimann, C., 2002. Ed., Financial Sectors in EU Accession Countries. European Central Bank, Frankfurt. Walko, Z., Reininger, T., 2004. Credit and deposit interest rate margins in four new EU member states. Financial Stability Report Nr. 8. Oesterreichische Nationalbank. Weill, L., 2003. Banking efficiency in transition economies: the role of foreign ownership. Economics of Transition 11, (3), 569-592. Weill, L., 2004. Is there a lasting gap in Banking efficiency between Eastern and Western European Countries? LARGE, Université Robert Schuman, Institut d´Etudes Politiques, Strasbourg (mimeo). White, A., 1980. Using Least squares to approximate unknown regression functions. International Economic Review 21, 149-170.

31
Williams, J., 2004. Determining management behaviour in European Banking. Journal of Banking and Finance 28, 2427-2460. Zajc, P., 2004. The effect of foreign bank entry on domestic banks in Central and Eastern Europe. In: Balling et al., Financial Markets in Central and Eastern Europe. Routledge, 189-205.

32
A P P E N D I X
Cost and Profit Fourier Functions Estimates – CEE banks Cost function Profit function Variables Ln(TC) Ln(TP) Coefficient t-ratio Coefficient t-ratio Ln y1 (loans) 0.19 3.68* 0.12 2.3** Ln y2 (deposits) 0.36 7.41* 0.10 2.15** Ln y3 (other earning assets) 0.21 6.34* 0.14 4.01* Ln p1 (labor price) 0.68 10.95* 0.55 8.93* Ln p2 (deposits price) 0.15 2.92* 0.20 4.05* Ln y1
2 0.08 4.37* 0.05 2.76* Ln y2
2 0.16 14.54* 0.06 3.58* Ln y3
2 0.01 10.38* 0.02 2.09** Ln p1
2 0.11 4.31* 0.01 0.29 Ln p2
2 0.14 7.03* 0.01 0.42 Ln y1y2 -0.07 -6.58* -0.06 -4.33* Ln y1y3 0.03 2.82* 0.01 0.84 Ln y2y3 -0.06 -6.54* -0.02 -2.54* Ln p1p2 -0.11 -5.45* 0.00 -0.21 Ln y1p1 0.02 1.58 0.01 0.8 Ln y2p1 -0.07 -5.23* -0.04 -2.45* Ln y3p1 0.01 0.71 0.04 3.57* Ln y1p2 -0.03 -2.26** 0.01 0.43 Ln y2p2 0.11 9.09 0.03 2.05** Ln y3p2 -0.03 -2.45* -0.03 -2.58* siny1y2 0.01 1.25 0.00 0.49 siny1y3 0.01 1.26 0.01 0.52 cosy1y3 0.00 -0.12 0.00 -0.44 difsiny1y2 -0.01 -0.97 0.00 -0.12 difcosy1y2 0.01 0.47 -0.01 -0.49 difcosy1y3 -0.02 -1.82*** 0.01 0.64 sinp1p2 -0.08 -1.5 -0.04 -0.84 Cosp1p2 -0.08 -1.46 -0.03 -0.57 difsinp1p2 -0.08 -1.92** 0.02 0.53 difcosp1p2 -0.06 -1.26 0.04 0.94 Constant 2.35 16.24* 10.38 46.36* µ 0.84 3.21* 0.92 5.78* η 0.05 4.58* 0.02 3.54* γ 0.99
(0.000)
0.75 (0.026)
σ 2 142.48 (0.48)
0.19 (0.017)
σu2 142.42
(0.48) 0.14
(0.017) σv
2 0.05 (0.002)
0.05 (0.002)
Obs. 1070 1105 Number of banks 245 241
The Table reports magnitude and t-statistics of the Maximum Likelihood estimates (e.q. 3) based on the Davidon-Fletcher-Powell Quasi-Newton algorithm, using the Battese and Coelli (1992) model estimated with Stata 8.1.

33
In parenthesis we report the standard deviation. The prefix “l” stands for natural logarithm; sum and dif, respectively, represent the sum and difference between trigonometric operators. Total costs, price of labor (p1), and price of deposits (p2) are normalized to the price of capital. Mixed products and squares of inputs and outputs represent the second order terms of the flexible form. µ is the mean of the truncation at zero of a normal density functions; γ = σ u2/ σ2; * Significant at 1% level; ** Significant at 5% level; ***Significant at 10% level.

34

35
Index of Working Papers: August 28, 1990
Pauer Franz
11) Hat Böhm-Bawerk Recht gehabt? Zum Zu-
sammenhang zwischen Handelsbilanzpas-sivum und Budgetdefizit in den USA2)
March 20, 1991
Backé Peter
21)
Ost- und Mitteleuropa auf dem Weg zur Marktwirtschaft - Anpassungskrise 1990
March 14, 1991
Pauer Franz
31)
Die Wirtschaft Österreichs im Vergleich zu den EG-Staaten - eine makroökonomische Analyse für die 80er Jahre
May 28, 1991 Mauler Kurt
41)
The Soviet Banking Reform
July 16, 1991 Pauer Franz
51)
Die Auswirkungen der Finanzmarkt- und Kapitalverkehrsliberalisierung auf die Wirtschaftsentwicklung und Wirtschaftspolitik in Norwegen, Schweden, Finnland und Großbritannien - mögliche Konsequenzen für Österreich3)
August 1, 1991 Backé Peter
61)
Zwei Jahre G-24-Prozess: Bestandsauf-nahme und Perspektiven unter besonderer Berücksichtigung makroökonomischer Unterstützungsleistungen4)
August 8, 1991 Holzmann Robert
71)
Die Finanzoperationen der öffentlichen Haushalte der Reformländer CSFR, Polen und Ungarn: Eine erste quantitative Analyse
January 27, 1992
Pauer Franz
81)
Erfüllung der Konvergenzkriterien durch die EG-Staaten und die EG-Mitgliedswerber Schweden und Österreich5)
October 12, 1992
Hochreiter Eduard (Editor)
91)
Alternative Strategies For Overcoming the Current Output Decline of Economies in Transition
November 10, 1992
Hochreiter Eduard and Winckler Georg
101) Signaling a Hard Currency Strategy: The
Case of Austria
1) vergriffen (out of print) 2) In abgeänderter Form erschienen in Berichte und Studien Nr. 4/1990, S 74 ff 3) In abgeänderter Form erschienen in Berichte und Studien Nr. 4/1991, S 44 ff 4) In abgeänderter Form erschienen in Berichte und Studien Nr. 3/1991, S 39 ff 5) In abgeänderter Form erschienen in Berichte und Studien Nr. 1/1992, S 54 ff

36
March 12, 1993 Hochreiter Eduard (Editor)
11 The Impact of the Opening-up of the East on the Austrian Economy - A First Quantitative Assessment
June 8, 1993 Anulova Guzel 12 The Scope for Regional Autonomy in Russia
July 14, 1993 Mundell Robert 13 EMU and the International Monetary Sy-stem: A Transatlantic Perspective
November 29, 1993
Hochreiter Eduard 14 Austria’s Role as a Bridgehead Between East and West
March 8, 1994 Hochreiter Eduard (Editor)
15 Prospects for Growth in Eastern Europe
June 8, 1994 Mader Richard 16 A Survey of the Austrian Capital Market
September 1, 1994
Andersen Palle and Dittus Peter
17 Trade and Employment: Can We Afford Better Market Access for Eastern Europe?
November 21, 1994
Rautava Jouko 181) Interdependence of Politics and Economic
Development: Financial Stabilization in Russia
January 30, 1995 Hochreiter Eduard (Editor)
19 Austrian Exchange Rate Policy and European Monetary Integration - Selected Issues
October 3, 1995 Groeneveld Hans 20 Monetary Spill-over Effects in the ERM: The Case of Austria, a Former Shadow Member
December 6, 1995
Frydman Roman et al 21 Investing in Insider-dominated Firms: A Study of Voucher Privatization Funds in Russia
March 5, 1996 Wissels Rutger 22 Recovery in Eastern Europe: Pessimism Confounded ?
June 25, 1996 Pauer Franz 23 Will Asymmetric Shocks Pose a Serious Problem in EMU?
September 19, 1997
Koch Elmar B. 24 Exchange Rates and Monetary Policy in Central Europe - a Survey of Some Issues
April 15, 1998 Weber Axel A. 25 Sources of Currency Crises: An Empirical Analysis
37
May 28,1998 Brandner Peter, Diebalek Leopold and Schuberth Helene
26 Structural Budget Deficits and Sustainability of Fiscal Positions in the European Union
June 15, 1998 Canzeroni Matthew, Cumby Robert, Diba Behzad and Eudey Gwen
27 Trends in European Productivity: Implications for Real Exchange Rates, Real Interest Rates and Inflation Differentials
June 20, 1998 MacDonald Ronald 28 What Do We Really Know About Real Exchange Rates?
June 30, 1998 Campa José and Wolf Holger
29 Goods Arbitrage and Real Exchange Rate Stationarity
July 3,1998 Papell David H. 30 The Great Appreciation, the Great Depreciation, and the Purchasing Power Parity Hypothesis
July 20,1998 Chinn Menzie David 31 The Usual Suspects? Productivity and Demand Shocks and Asia-Pacific Real Exchange Rates
July 30,1998 Cecchetti Stephen G., Mark Nelson C., Sonora Robert
32 Price Level Convergence Among United States Cities: Lessons for the European Central Bank
September 30, 1998
Christine Gartner, Gert Wehinger
33 Core Inflation in Selected European Union Countries
November 5, 1998
José Viñals and Juan F. Jimeno
34 The Impact of EMU on European Unemployment
December 11, 1998
Helene Schuberth and Gert Wehinger
35 Room for Manoeuvre of Economic Policy in the EU Countries – Are there Costs of Joining EMU?
December 21, 1998
Dennis C. Mueller and Burkhard Raunig
36 Heterogeneities within Industries and Structure-Performance Models
May 21, 1999 Alois Geyer and Richard Mader
37 Estimation of the Term Structure of Interest Rates – A Parametric Approach
July 29, 1999 José Viñals and Javier Vallés
38 On the Real Effects of Monetary Policy: A Central Banker´s View
December 20, 1999
John R. Freeman, Jude C. Hays and Helmut Stix
39 Democracy and Markets: The Case of Exchange Rates

38
March 01, 2000 Eduard Hochreiter and Tadeusz Kowalski
40 Central Banks in European Emerging Market Economies in the 1990s
March 20, 2000 Katrin Wesche 41 Is there a Credit Channel in Austria? The Impact of Monetary Policy on Firms’ Investment Decisions
June 20, 2000 Jarko Fidrmuc and Jan Fidrmuc
42 Integration, Disintegration and Trade in Europe: Evolution of Trade Relations During the 1990s
March 06, 2001 Marc Flandreau 43 The Bank, the States, and the Market, A Austro-Hungarian Tale for Euroland, 1867-1914
May 01, 2001 Otmar Issing 44 The Euro Area and the Single Monetary Policy
May 18, 2001 Sylvia Kaufmann 45 Is there an asymmetric effect of monetary policy over time? A Bayesian analysis using Austrian data.
May 31, 2001 Paul De Grauwe and Marianna Grimaldi
46 Exchange Rates, Prices and Money. A LongRun Perspective
June 25, 2001 Vítor Gaspar, Gabriel Perez-Quiros and Jorge Sicilia
47 The ECB Monetary Strategy and the Money Market
July 27, 2001 David T. Llewellyn
48 A Regulatory Regime For Financial Stability
August 24, 2001
Helmut Elsinger and Martin Summer
49 Arbitrage Arbitrage and Optimal Portfolio Choice with Financial Constraints
September 1, 2001
Michael D. Goldberg and Roman Frydman
50 Macroeconomic Fundamentals and the DM/$ Exchange Rate: Temporal Instability and the Monetary Model
September 8, 2001
Vittorio Corbo, Oscar Landerretche and Klaus Schmidt-Hebbel
51 Assessing Inflation Targeting after a Decadeof World Experience
September 25, 2001
Kenneth N. Kuttner and Adam S. Posen
52 Beyond Bipolar: A Three-Dimensional Assessment of Monetary Frameworks

39
October 1, 2001 Luca Dedola and Sylvain Leduc
53 Why Is the Business-Cycle Behavior of Fundamentals Alike Across Exchange-Rate Regimes?
October 10, 2001 Tommaso Monacelli 54 New International Monetary Arrangements and the Exchange Rate
December 3, 2001
Peter Brandner, Harald Grech and Helmut Stix
55 The Effectiveness of Central Bank Intervention in the EMS: The Post 1993 Experience
January 2, 2002 Sylvia Kaufmann 56 Asymmetries in Bank Lending Behaviour. Austria During the 1990s
January 7, 2002 Martin Summer 57 Banking Regulation and Systemic Risk
January 28, 2002 Maria Valderrama 58 Credit Channel and Investment Behavior in Austria: A Micro-Econometric Approach
February 18, 2002
Gabriela de Raaij and Burkhard Raunig
59 Evaluating Density Forecasts with an Application to Stock Market Returns
February 25, 2002
Ben R. Craig and Joachim G. Keller
60 The Empirical Performance of Option Based Densities of Foreign Exchange
February 28, 2002
Peter Backé, Jarko Fidrmuc, Thomas Reininger and Franz Schardax
61 Price Dynamics in Central and Eastern European EU Accession Countries
April 8, 2002 Jesús Crespo-Cuaresma, Maria Antoinette Dimitz and Doris Ritzberger-Grünwald
62 Growth, Convergence and EU Membership
May 29, 2002 Markus Knell 63 Wage Formation in Open Economies and the Role of Monetary and Wage-Setting Institutions
June 19, 2002 Sylvester C.W. Eijffinger (comments by: José Luis Malo de Molina and by Franz Seitz)
64 The Federal Design of a Central Bank in a Monetary Union: The Case of the European System of Central Banks

40
July 1, 2002 Sebastian Edwards and I. Igal Magendzo (comments by Luis Adalberto Aquino Cardona and by Hans Genberg)
65 Dollarization and Economic Performance: What Do We Really Know?
July 10, 2002 David Begg (comment by Peter Bofinger)
66 Growth, Integration, and Macroeconomic Policy Design: Some Lessons for Latin America
July 15, 2002 Andrew Berg, Eduardo Borensztein, and Paolo Mauro (comment by Sven Arndt)
67 An Evaluation of Monetary Regime Options for Latin America
July 22, 2002 Eduard Hochreiter, Klaus Schmidt-Hebbel and Georg Winckler (comments by Lars Jonung and George Tavlas)
68 Monetary Union: European Lessons, Latin American Prospects
July 29, 2002 Michael J. Artis (comment by David Archer)
69 Reflections on the Optimal Currency Area (OCA) criteria in the light of EMU
August 5, 2002 Jürgen von Hagen, Susanne Mundschenk (comments by Thorsten Polleit, Gernot Doppelhofer and Roland Vaubel)
70 Fiscal and Monetary Policy Coordination in EMU
August 12, 2002 Dimitri Boreiko (comment by Ryszard Kokoszczyński)
71 EMU and Accession Countries: Fuzzy Cluster Analysis of Membership
August 19, 2002 Ansgar Belke and Daniel Gros (comments by Luís de Campos e Cunha, Nuno Alves and Eduardo Levy-Yeyati)
72 Monetary Integration in the Southern Cone: Mercosur Is Not Like the EU?
August 26, 2002 Friedrich Fritzer, Gabriel Moser and Johann Scharler
73 Forecasting Austrian HICP and its Components using VAR and ARIMA Models

41
September 30, 2002
Sebastian Edwards 74 The Great Exchange Rate Debate after Argentina
October 3, 2002
George Kopits (comments by Zsolt Darvas and Gerhard Illing)
75 Central European EU Accession and Latin American Integration: Mutual Lessons in Macroeconomic Policy Design
October 10, 2002
Eduard Hochreiter, Anton Korinek and Pierre L. Siklos (comments by Jeannine Bailliu and Thorvaldur Gylfason)
76 The Potential Consequences of Alternative Exchange Rate Regimes: A Study of Three Candidate Regions
October 14, 2002 Peter Brandner, Harald Grech
77 Why Did Central Banks Intervene in the EMS? The Post 1993 Experience
October 21, 2002 Alfred Stiglbauer, Florian Stahl, Rudolf Winter-Ebmer, Josef Zweimüller
78 Job Creation and Job Destruction in a Regulated Labor Market: The Case of Austria
October 28, 2002 Elsinger, Alfred Lehar and Martin Summer
79 Risk Assessment for Banking Systems
November 4, 2002
Helmut Stix 80 Does Central Bank Intervention Influence the Probability of a Speculative Attack? Evidence from the EMS
June 30, 2003 Markus Knell, Helmut Stix
81 How Robust are Money Demand Estimations? A Meta-Analytic Approach
July 7, 2003 Helmut Stix 82 How Do Debit Cards Affect Cash Demand? Survey Data Evidence
July 14, 2003 Sylvia Kaufmann 83 The business cycle of European countries. Bayesian clustering of country-individual IP growth series.
July 21, 2003 Jesus Crespo Cuaresma, Ernest Gnan, Doris Ritzberger-Gruenwald
84 Searching for the Natural Rate of Interest: a Euro-Area Perspective
July 28, 2003 Sylvia Frühwirth-Schnatter, Sylvia Kaufmann
85 Investigating asymmetries in the bank lending channel. An analysis using Austrian banks’ balance sheet data

42
September 22, 2003
Burkhard Raunig 86 Testing for Longer Horizon Predictability of Return Volatility with an Application to the German DAX
May 3, 2004
Juergen Eichberger, Martin Summer
87 Bank Capital, Liquidity and Systemic Risk
June 7, 2004 Markus Knell, Helmut Stix
88 Three Decades of Money Demand Studies. Some Differences and Remarkable Similarities
August 27, 2004 Martin Schneider, Martin Spitzer
89 Forecasting Austrian GDP using the generalized dynamic factor model
September 20, 2004
Sylvia Kaufmann, Maria Teresa Valderrama
90 Modeling Credit Aggregates
Oktober 4, 2004 Gabriel Moser, Fabio Rumler, Johann Scharler
91 Forecasting Austrian Inflation
November 3, 2004
Michael D. Bordo, Josef Christl, Harold James, Christian Just
92 Exchange Rate Regimes Past, Present and Future
December 29, 2004
Johann Scharler 93 Understanding the Stock Market's Responseto Monetary Policy Shocks
Decembert 31, 2004
Harald Grech 94 What Do German Short-Term Interest Rates Tell Us About Future Inflation?
February 7, 2005
Markus Knell 95 On the Design of Sustainable and Fair PAYG - Pension Systems When Cohort Sizes Change.
March 4, 2005
Stefania P. S. Rossi, Markus Schwaiger, Gerhard Winkler
96 Managerial Behavior and Cost/Profit Efficiency in the Banking Sectors of Central and Eastern European Countries